empirical application of the ohlson (1995) equity
TRANSCRIPT
UNIVERSITY OF THE WITWATERSRAND
Faculty of Commerce, Law and Management School of Accountancy
An Empirical Examination of the Ohlson (1995)
Valuation Model in South Africa
A research report submitted in partial fulfillment (50%) of
the requirements for the degree of Master of Commerce
Gary Swartz Student Number : 9108665/P
Supervisor Professor Minga Negash
Table of Contents
Declaration.................................................................................................3
Acknowledgements ...................................................................................4
List of Figures and Tables........................................................................5
Abstract......................................................................................................6
Chapter I : Introduction ..........................................................................7
1.1 Background ..........................................................................................................7
1.2 The South African context ...................................................................................9
1.3 Statement of the problem ...................................................................................11
1.3.1 Research questions......................................................................................11
1.4 Rationale of the study ........................................................................................11
1.5 Organization of the study...................................................................................12
Chapter II : Literature Review .............................................................13
2.1 Introduction........................................................................................................13
2.2 Valuation theory.................................................................................................13
2.2.1 Fundamental analysis..................................................................................14
2.2.2 Technical analysis.......................................................................................16
2.3 International Valuation Standards......................................................................20
2.4 Valuation research and value relevance.............................................................22
2.4.1 Value relevance...........................................................................................23
2.5 Valuation research in South Africa....................................................................25
2.6 The Ohlson (1995) model ..................................................................................28
2.7 Empirical history................................................................................................32
2.8 Market efficiency ...............................................................................................36
2.9 Regulatory environment.....................................................................................37
1
2.10 Critical appraisal of the model .........................................................................40
2.11 Summary ..........................................................................................................45
Chapter III : Research Methodology and Data ...................................46
3.1 Introduction........................................................................................................46
3.2 Valuation model.................................................................................................47
3.2.1 Specification of the other information variable ..........................................49
3.3 Research Method ...............................................................................................51
3.3.1 Cross sectional multiple regressions...........................................................51
3.3.2 Panel data ....................................................................................................54
3.4 Limitations of the study .....................................................................................55
3.5 The Hypothesis ..................................................................................................56
3.6 Data selection.....................................................................................................57
3.7 Methodology ......................................................................................................58
3.7.1 Calculation of abnormal earnings ...............................................................58
3.7.2 Calculation of abnormal dividends .............................................................59
3.8 Summary ............................................................................................................60
Chapter IV : Results and Discussion ....................................................61
4.1 Introduction........................................................................................................61
4.2 Overall results ....................................................................................................61
4.2.1 Cross sectional model .................................................................................61
4.2.2 Panel data model .........................................................................................66
4.3 Summary ............................................................................................................70
Chapter V : Summary and Conclusion ................................................72
5.1 Summary ............................................................................................................72
5.2 Results................................................................................................................72
5.3 Conclusion .........................................................................................................73
5.4 Limitations .........................................................................................................73
5.5 Directions for future work .................................................................................74
References................................................................................................75
2

Declaration
I declare that this research report is my own original work and that all sources have
been accurately reported and acknowledged. It is submitted for the degree of Masters
of Commerce to the University of Witwatersrand, Johannesburg. This research has not
been submitted for any degree or examination at this or any other university.
Gary Edward Swartz Date
3

Acknowledgements I would like to express my gratitude to my supervisor, Professor Minga Negash, for
his continuing guidance, wisdom, and support, and to Associate Professor Steven
Firer and Associate Professor Kurt Sartorius, for their ongoing support and advice.
4
List of Figures and Tables Figure 1 – Categories of information........................................................39
Table 1 – Multiple regression output summary........................................62
Table 2 – Multiple regression results summary........................................63
Table 3 – Cross sectional model fit ..........................................................64
Table 4 – Pooled Least Squares regression results...................................66
Table 5 – Augmented Dickey-Fuller Results ...........................................67
Table 6 – Panel data results ......................................................................68
Appendix - Companies included in sample ..............................................85
5
Abstract
The debate on the determinants of firm value remains unresolved in finance research.
This research report contributes to the debate by examining the validity of the Ohlson
(1995) valuation model in South Africa. Using Johannesburg Securities Exchange
data, this research report aims to identify whether the book value of assets, accounting
(accrual) earnings, and abnormal cash dividends explain the behavior of South
African share prices. The Ohlson (1995) model has been successfully tested in a
number of recent studies (Collins, Pincus and Xie, 1999; Garrod and Rees, 1998;
Collins, Maydew and Weiss, 1997; and Kothari and Zimmerman, 1995). This study
attempts to extend this body of work in an emerging market context (South Africa), to
determine whether the results obtained in developed markets also hold in an emerging
market setting, where required rates of return are higher, liquidity is low, and capital
is scarce.
The research uses both cross sectional and panel data for 129 Johannesburg Securities
Exchange listed companies over the 1992-2003 period to investigate the value
relevance of the annual financial statements using the Ohlson (1995) model. Using
cross-sectional data, the study indicates that the Ohlson (1995) model cannot be used
for value prediction purposes, but does indicate that accrual accounting data is value
relevant. However, using a panel data approach resulted in a statistically significant,
robust, positive relationship for accounting earnings, book value of assets, and
abnormal dividends in predicting firm value.
6
Chapter I : Introduction
1.1 Background
The usefulness of annual financial statements in determining a company’s share price,
is increasingly being questioned in the finance literature, and is evidenced in the
increasing gap in book and market values of equity. Both the International Federation
of Accountants (IFAC) conceptual framework and AC 000 (1990), state that the
overriding objective of financial reporting and general purpose financial statements, is
to provide information about the entity’s financial performance and financial position,
that is useful to a wide range of users, for assessing the stewardship of management
and for making economic decisions. One such economic decision is the formation of a
share price. A question therefore is raised as to whether the annual financial
statements are relevant for price formation.
Investors are primarily interested in any information which can assist them in
assessing the value of the firm for the purpose of making informed investment
choices. The objective of value relevance research is to relate annual financial
statement figures to a measure of firm value, and to assess the relation of such
information to the determination of value.
In a paper discussing the limitations of accounting, Flegm (1989) concludes that one
cannot reliably measure the value of a business or predict it’s future success using
annual financial statements. Two examples of major limitations of financial
statements discussed by Flegm (1989) are historic cost accounting and non-
recognition of internally generated goodwill. Furthermore, the paper argues that
financial statements represent a summary of past events, and say very little about
future prospects of the company.
The question regarding the usefulness of annual financial statements in determining
firm value is also evident in the increasing gap in the book to market ratio, described
by Lev and Sougiannis (1999 : 419) as “a phenomena which looms large among
capital market enigmas”, and has yet to be explained in modern literature. A number
7
of studies have attempted to explain the gap, with three dominant routes emerging.
Fama and French (1995) attribute the presence of high book to market ratios for
certain firms to a risk premium, suggesting that higher returns are demanded for the
possibility of financial distress. Lakonishok, Schleifer and Vishny (1994) associate
the gap with mispricing of ‘glamour companies’, while Frankel and Lee (1995)
attribute the difference to error in the market’s expectation of future earnings. Lastly,
Kothari and Shanken (1995) attribute the phenomenon to selection bias in empirical
tests. Lev and Sougiannis (1999) conclude that although these explanations of book to
market provide interesting insights, they do not yield a satisfactory explanation of the
association between book to market and subsequent returns.
The seminal work of Ackerlof (1970) introduces the problem of information
asymmetry, where management has more information than the shareholders, and
shareholders are therefore not able to determine a fair price with the limited
information they have access to. The information asymmetry problem is exacerbated
by the increasing role of difficult to measure, knowledge intensive intangible assets in
the information age, which are not reflected in the annual financial statements as
described by Holland (1998). These issues further question the usefulness of annual
financial statements to users in determining share value.
A number of recent studies have attempted to empirically test whether the elements of
financial statements are value relevant. Collins, Pincus and Xie (1999) discuss three
competing explanations for the role that book value of assets plays in valuing
companies. The first of these is the use of book value as a control for scale differences
(Barth and Kallapur, 1996); secondly, using book value as a proxy for expected
normal earnings (Ohlson, 1995; Penman, 1992), and lastly, as a proxy for an
abandonment option, or liquidation value (Berger, Ofek and Swary, 1996; Burgstahler
and Dichev, 1997). Collins, Pincus and Xie (1999) conclude that their results support
the view that book value serves as a value relevant proxy for expected normal
earnings, and as a proxy for abandonment value, which is the approach that this
research report follows.
The question raised is therefore whether the accounting information in the financial
statements is value relevant. A detailed valuation model which identifies a distinct
8
role for earnings, book value, and dividends in predicting the equity value of firms, is
introduced in the papers of Ohlson (1995) and Feltham and Ohlson (1995, 1996).
These papers devise a cohesive theory of a company’s value, relying on the clean
surplus relation and accounting information obtained from the financial statements.
This research report aims to empirically test this model, with other variables, in an
emerging market environment. The combination of regressors used in the model are
of conceptual interest, as using the clean surplus relation, it brings in both bottom line
items of the financial statements (total profit and total assets) into the valuation. The
model further includes other information in the market, motivated by the idea that
some value-relevant events may affect future expected earnings.
Clean surplus accounting satisfies dividend payment irrelevance, as discussed by
Modigliani and Miller (1958), and Miller and Modigliani (1961), where dividends
displace market value on a Rand for Rand basis; a dividend payment would decrease
equity and book value of assets. Furthermore, dividends paid today negatively
influence future expected earnings, due to less capital being available to generate
further wealth.
The Ohlson (1995) model has been successfully tested in a number of studies, using
different specifications of the base equation, and has been succesfully applied in
markets with different attributes. Whether these conclusions hold in a South African
context is untested at present, and is thus the focus of this research.
1.2 The South African context
As an emerging market, South Africa has a well developed corporate sector, as well
as a sophisticated financial system. The JSE has been in existence since November
1887, while the South African Bond market, and South African Futures market, were
more recently formed in 1989 and 1990 respectively. The JSE is characterized by a
low level of trading liquidity.
Recent studies on the efficiency of the JSE are mixed, Ward (1994) presented a
thorough review of the literature, concluding that the JSE is “operationally efficient”,
indicating that a small group of investors may be able to outperform the market, but
9
most investors will be unable to do so, which is considered to be adequate market
efficiency strength for the purposes of this study.
To date no published study using the Ohlson (1995) valuation model or a similar
model has been completed on the Johannesburg Securities Exchange, however, a
recent research report has attempted to address whether published accounting data is
related to price formation using Johannesburg Securities Exchange data (Woldegabir,
2004). The research report utilizes the Ohlson (1995) valuation model, using
accounting earnings, and book value of assets, to determine whether the variables are
significantly related to share price three months after year end. The work essentially
follows on the works of Collins, Maydew, and Weiss (1997) among others, which
attempts to test whether the association between share price and accounting variables
increases or decreases over time. The study also explores whether any such
associations can be explained by firm specific characteristics, and claims to have
tested the Ohlson (1995) model, however, although the research performed does
validate the use of the Ohlson (1995) variables of accounting earnings and book value
of assets, it does not validate the model itself. To do so would require the specification
of the other information variable, as is performed in this study.
This research report aims to extend the empirical studies undertaken on the value
relevance of financial statement information. It uses multiple regression techniques
and panel data for a sample of Johannesburg Securities Exchange listed companies
during the 1992-2003 period, to investigate whether book value of assets, accounting
earnings, and dividends are value relevant on both a cross sectional and time series
basis. The Ohlson (1995) model forms the base of the valuation equation which
includes net book value of assets, abnormal income and abnormal dividends (as a
proxy for other information) as regressors. The distinguishing features of this study
are firstly, that it uses panel data to combine both cross-sectional and time-series
effects in the model. Most empirical value relevance studies using the Ohlson (1995)
model utilize a cross-sectional model, with a crude time-series analysis performed by
comparing the yearly regression results to each other manually. Although such a
comparison does provide evidence of the overall annual trend, it does not include any
time-series effect on a company by company basis; as such information is lost in
10
aggregation. Second, this study is performed on South African firms listed on the
Johannesburg Securities Exchange, in an emerging market setting.
1.3 Statement of the problem
The value relevance of published accounting information in the form of accounting
earnings and the book value of assets has been a popular research topic in recent years
with a large body of work emerging from the seminal works of Ohlson (1995), and
Feltham and Ohlson (1995, 1996). The model incorporates book value and accounting
earnings to devise a cohesive theory for the determination of a company’s value.
Book values are assessed to be value relevant if a predictive association is detected
with share prices.
The primary reason for value relevance research is to determine how close the
association is between accounting book values and market prices. Based on the
findings, a conclusion will be drawn as to how much investors should rely on
accounting information obtained from the financial statements to determine share
prices for firms.
1.3.1 Research questions
The first research question is to determine whether accounting earnings and book
value explain the increases and decreases in the market value of shares on a cross
sectional basis.
The second research question is to determine whether accounting earnings and book
value explain the increases and decreases in the market value of shares on a combined
cross sectional and time series basis.
1.4 Rationale of the study
The main aim of most companies is the creation of wealth for their shareholders, as
measured by the market price of the company’s shares. The share price reflects the
results from trading operations, the financial position of the firm, and the expected
future opportunities available to the firm. Investors are first and foremost interested in
11
any information which can assist them in assessing the value of the firm, for the
purpose of making informed investment choices.
In order to test the value relevance of the annual financial statement information, the
value of a firm is expressed as a function of accounting earnings, book value of assets,
and other information using the Ohlson (1995) model. The model is modified by
including abnormal dividends, as a specification for the other information variable.
This model has been tested successfully in a number recent studies, for example,
Collins, Pincus and Xie (1999); Garrod and Rees (1998); Collins, Maydew and Weiss
(1997); and Kothari and Zimmerman (1995). Although the results of these studies
provide valuable insight, the model is as yet untested in a South African market, or
using a panel data approach.
1.5 Organization of the study
Chapter two consists of a literature review which discusses the origin of the model to
be used, methodological developments, contextual issues, and subsequent refinements
of the model, as well as an analysis of the previous empirical studies. The chapter also
reviews recent South African valuation studies. The purpose of the literature review is
to provide the basic theoretical and empirical foundation for the study, as well as to
extend the discussion surrounding the value relevance of accounting earnings and
book value to share price.
The research hypothesis is stated in chapter three. The research methodology is then
examined in terms of the contribution made by each of the researchers towards
improving the methodology. The exact definition of the valuation models, and the
statistical models used are also discussed, the data and methodological issues are
introduced, and the study period is defined. Chapter four discusses the results. Finally
chapter five concludes the study with a summary of the findings, discusses
limitations, and identifies areas for further research.
12
Chapter II : Literature Review
2.1 Introduction
The determinants of firm value in value relevance research remains an enigma. The
usefulness of annual financial statements in determining a company’s share price in
particular has been increasingly questioned due to the increasing gap in book value, as
reflected in the annual financial statements, and market prices of equity, obtained
from stock markets. A large body of finance and accounting research has emerged
attempting to test whether book values are related to market values of firms.
The underlying assumption of the value relevance of financial statement information
is that the accounting process generates financial information which reflects the
performance and financial position of the firm, which should be reflected in the share
price, assuming that such information is both useful and relevant to investors
attempting to estimate share prices. The Ohlson (1995) model develops an accounting
based valuation model which incorporates both accrual earnings and book value of
assets.
This chapter explores valuation theory, reviews the conceptual foundation of the
Ohlson (1995) model, and evaluates its applicability to the Johannesburg Securities
Exchange. Previous empirical findings of value relevance studies performed by
different researchers in different capital markets using the same model are also
summarized. The chapter also explores the dynamics of the South African economy,
and the characteristics of the Johannesburg Securities Exchange, as well as the
informational integrity of the annual financial statements in a continually changing
regulatory environment. The chapter concludes with a summary of the key issues
raised.
2.2 Valuation theory
Although there are a large number of valuation models and methods, all rely
significantly on an element of judgment (determination of an asset beta, discount rate,
etc), and are therefore by nature, highly subjective (Piotroski, 2000). The value placed
13
on a company will therefore vary depending on the assumptions made with respect to
such elements. Analysts therefore often utilize a mix of approaches to estimate value,
and valuation techniques may be personalized according to the style and tastes of
individual analysts, such as in Luehrman (1997).
2.2.1 Fundamental analysis
The fundamental valuation techniques discussed in this section include discounted
cash flow, book value of assets, and earnings multipliers (Abarbanell and Bushee,
1997; International Valuation Standards, 2005). The most theoretically acceptable
valuation method is the discounted cash flow method, which involves discounting the
future cash flows (such as dividends, earnings, and terminal values) that the share will
bring to the investor in the foreseeable future back to present value (Abarbanell and
Bushee, 1997). The appropriate discount rate takes into account all the sources of
finance which the company uses, and normally includes a premium for risk. Risk
premiums are calculated using a model such as the capital asset pricing model,
dividend growth model, or using a suitable surrogate (Abarbanell and Bushee, 1997).
Although attractive from a theoretical perspective, the discounted cash flow approach
does have a number of limitations. Examples of such limitations include the difficulty
of obtaining reliable and accurate cash flow forecasts, difficulties associated with
determining a terminal value occurring some time in the future, and with determining
an appropriate discount rate (Correia, Flynn, Uliana, and Wormald, 2003). The
determination of the discount rate involves the quantification of the risk profile of the
business, and is subject to the shortcoming associated with any models used to do so,
such as the capital asset pricing model (Brealey and Myers, 2003). Such limitations
are particularly difficult to overcome in the valuation of minority interests, where
information is difficult and expensive to obtain (Brealey and Myers, 2003).
The second fundamental valuation technique is the book value approach. Use of this
method involves analyzing the assets and liabilities of the firm, obtaining a market
value for each of the assets, and then subtracting the market value of all liabilities
(Brealey and Myers, 2003). The result is the net book value of the firm. This type of
valuation is typically used where a company has underlying assets which are easy to
14
value, such as an investment holding company, unit trust, or where assets are listed on
a stock market, where market values are easily obtainable (Brealey and Myers, 2003).
The book value technique provides a terminal value, rather than an ongoing
operations value as obtained from the income valuation method, or stated otherwise,
this method does not take into account the future earnings potential of the firm. The
technique also requires a market value to be obtained for all assets. For many assets
an active market does not exist to obtain such values. Furthermore, technological
change can often result in new assets not being comparable to old ones for the
determination of asset value.
The presence of significant intangible assets, which are difficult to value, such as
intellectual capital, brand names, and knowledge bases, also detract from the use of
this technique (Abarbanell and Bushee, 1997). Such assets are generally unique,
difficult to identify and define, and the cash flows associated directly with these assets
are difficult to determine (many such assets are internally generated rather than
purchased). IAS 38 (2004) paragraph 51 only allows recognition of such assets where
future economic benefits are identifiable, and can be measured reliably. IAS 38
(2004) also provides detailed guidance on specific intangibles prior to allowing
recognition (business combinations, internally generated goodwill, research and
development, brands, mastheads, publishing titles, and customer lists). In general
therefore, only purchased or quantifiable cash costs are capitalized as assets and
disclosed in the financial statements. The book value technique (on its own) is
therefore useful only in a limited number of applications.
Valuations using listed stock market prices rely on the efficient market hypothesis, a
large volume of transactions (liquidity) within the market, and suggests that the listed
price approximates fair value. Studies on behavioral finance and technical analysis
invalidate the efficient market hypothesis, and care should therefore be taken in
reviewing the assumptions when using the book value approach (Abarbanell and
Bushee, 1997).
The third method is the earnings multiplier approach. This approach requires the
determination of a price earnings or similar multiplier, which is estimated using the
price earnings ratio of similar listed firms, and then adjusting for peculiarities of the
15
firm being valued to compensate for differences in structure and risk profile (Brealey
and Myers, 2003). The multiplier is then applied to sustainable accounting based
earnings to determine the value of the firm (Brealey and Myers, 2003). Although
widely used in practice, the earnings multiplier approach is theoretically weak, as it
relies on two variables which are expected to summarize a complex firm, and is
subject to a large amount of judgment (Piotroski, 2000). The determination of the
multiplier in particular is fraught with danger, as small changes in the multiplier will
have material affects on the estimated value (Piotroski, 2000).
The earnings multiplier approach does not suffer from the same limitations as the
discounted cash flow approach, as the information required to perform the
calculations is relatively easy to obtain, and the calculation thereof is relatively
straightforward. The level of judgment required by the method can however lead to
large fluctuations in the price range as assumptions are challenged, thereby making
the method less attractive (Brealey and Myers, 2003).
The Ohlson (1995) model uses book value of assets, earnings, and a measure of other
information to estimate the value of a firm. In the context of fundamental analysis, the
model uses a combination of the principles of the discounted cash flow approach, and
the book value of assets method. The model achieves this by using book value of
assets as a surrogate for the normal earnings portion of the business, but recognizes
that any additional future earnings, denoted by abnormal earnings, will add additional
value to the firm, and therefore adds this to the book value of assets. The model is
therefore based on fundamental analysis principles, although it does not preclude the
inclusion of technical analysis principles in the specification of the other information
variable, which is discussed next.
2.2.2 Technical analysis
Technical analysis disputes the efficient market hypothesis, and instead suggests that
deviations from the fair price, as determined using methods such as those described
under fundamental analysis, are common and often material (Lo, Mamasky, and
Wang, 2000). Thus, in addition to fundamental economic criteria, market criteria also
have to be taken into account. Valuing a company therefore requires not only an
16
estimation of its fair value, but also the determination of its potential price range,
taking into account market behavior (defined below).
Charting or technical analysis is the use of numerical series generated by market
activity, such as price, volume traded, and open interest, to predict future trends in
that market (Lo, Mamasky, and Wang, 2000). The techniques can be applied to any
market with a comprehensive price history. Technical analysis does not attempt to
analyze the financial data of a company, such as cashflows, dividends, and projection
of future dividends; because of this lack of fundamental analysis, technical analysis is
controversial and described by critics as looking into a crystal ball (Lo, Mamasky, and
Wang, 2000).
The biggest advantage of technical analysis occurs when combined with fundamental
analysis. Technical analysis is essentially attempting to time the market once
fundamental analysis has identified a good or bad firm (depending on whether you are
considering going long or short). While technical analysis is widely used by both
professional and amateur traders as a means of predicting future market moves, it is
generally not used by economists in any academic sense (Lo, Mamasky, and Wang,
2000).
Technical analysis implicitly rejects the efficiency of the market as understood in the
efficient market hypothesis. That is, using technical analysis on a particular market
implicitly assumes that the market is not efficient, as defined by the efficient market
hypothesis (Lo, Mamasky, and Wang, 2000). The efficient markets theories argue that
existing prices reflect all available information, and that future price movements will
follow a path that will approximate a random walk as they adjust to new information
as it emerges (Lo, Mamasky, and Wang, 2000). The theories further assume that all
participants in the stock market have equal and instantaneous access to all information
that might affect securities.
Technical analysts believe that by analyzing securities price histories, they can
anticipate future buying and selling events. The assumption is that there is useful
information hidden within price histories, and that technical analysis is a way of
17
analyzing the past actions of the people participating in a particular market, as
reflected by their actual transactions (Lo, Mamasky, and Wang, 2000).
Lo, Mamasky, and Wang (2000), investigate a systematic approach to technical
pattern recognition using nonparametric kernel regression to evaluate the
effectiveness of technical analysis. The study compares unconditional empirical
distributions of daily share returns to the conditional distributions (conditioned using
technical indicators), and finds that several of the technical indicators do provide
incremental information and may therefore have practical value. The result is
qualified so as not to imply that technical analysis can be used to generate excess
trading profits, but rather raises the probability that technical analysis can add value to
the investment process.
Holthausen and Larcker (1992) describe behavioral finance as an application of
scientific research on human and social cognitive and emotional biases to better
understand economic decisions and how they affect market prices, returns and the
allocation of resources. Behavioral finance is primarily concerned with the rationality,
or lack thereof, of economic agents. Behavioral models typically integrate insights
from psychology with neo-classical economic theory. Behavioral analyses are mostly
concerned with the effects of market decisions, but also those of public choice,
another source of economic decisions with some similar biases.
Kahneman and Tversky (1979) used cognitive psychological techniques to explain a
number of documented anomalies in rational economic decision making. Key
observations made in their study included the lack of symmetry between decisions to
acquire or keep resources, colloquially called the " bird in the bush" paradox, and the
strong loss aversion or regret attached to any decision where some emotionally valued
resources (e.g. a home) might be lost. Genesove and Mayer (2001) attributed the
manifestation of loss aversion in investor behavior as an unwillingness to sell shares
or other equity, if doing so would force the trader to realize a nominal loss.
As behavioral finance implicitly rejects the efficient market hypothesis, it should
come as no surprise that the greatest critics are the proponents of the efficient market
hypothesis, such as Fama and French (1993), who contend that behavioral finance is
18
more a collection of anomalies than a true branch of finance, and that these anomalies
will eventually be priced out of the market, or explained by market microstructure
arguments. Fama and French (1993) however distinguish between individual biases
and social biases; arguing that the former can be averaged out by the market, while
the latter can create feedback loops that drive the market further and further from the
equilibrium price. Freeman and Davidson (1999) provide a specific example of this
criticism when discussing the equity premium puzzle. It is argued that the puzzle
simply arises due to entry barriers (both practical and psychological) which have
traditionally impeded entry by individuals into the stock market, and that returns
between shares and bonds should stabilize as electronic resources open up the stock
market to a greater number of traders.
The Ohlson (1995) model does not attempt to time the market, and therefore does not
incorporate the principles of technical analysis or behavioral finance. However,
technical analysis and behavioral finance could use the Ohlson (1995) model as a base
to determine the fair value of a share, and then use charting principles and share
histories to time the market. When using the Ohlson (1995) model, any technical or
behavioral effect will be evidenced in the error term, and the level of model fit using
the coefficient of determination (R2) if not incorporated in the other information
variable.
Due to the subjective nature of valuation theory, a committee was established by the
International Accounting Standards Board (IASB), and constituted as the International
Valuation Standards Committee. The committee was charged with developing a set of
International Valuation Standards, to be used as a guide in the valuation of assets to
ensure they meet with the requirements of the official pronouncements of the IASB.
The guide aims to assist practitioners in developing consistent and comparable
valuations for use in reported financial information. Furthermore, the guide was
developed in light of the growing signs that the accounting and auditing professions
will require valuations under International Valuation Standards in order to achieve
consistent and rigorous application of the International Accounting Standards, and
comparability across borders.
19
2.3 International Valuation Standards
The International Valuation Standards (2005), as adopted by the South African
Institute of Chartered Accountants (SAICA), provides a guideline for the valuation of
businesses for the purpose of the preparation of financial statements, although the
standard does not preclude the use thereof for the purposes of determining acquisition
or disposition of business interests, mergers, valuation of shareholder ownings, and
the other similar transaction (International Valuation Standards, 2005). The standard
provides three approaches for valuing a firm, recommending that two or more of the
methods are reconciled to conclude on the final determined value.
The first valuation method suggested by the standard is a sales comparison approach,
which requires the comparison of the business to be valued to other similar
businesses, business ownership interests, or securities that have been sold in an open
market. The standard requires the businesses to be in the same industry, and subject
and responsive to the same economic variables (International Valuation Standards,
2005). The second approach suggested by the standard is the income capitalization
approach, which calculates the present value of anticipated income or benefits in view
of their expected growth, timing, and risk profile (International Valuation Standards,
2005). This method converts income into an indication of value either by means of
direct capitalization of a representative income level, or by a discounted cash flow
analysis, or dividend method, in which case receipts are estimated for a sequence of
future periods and discounted to the present using an appropriate discount rate
(International Valuation Standards, 2005). The third method suggested by the
standard is an asset based approach, which examines the balance sheet of businesses.
This approach is only suggested where businesses report both tangible and intangible
assets and all liabilities at market value. The standard cautions the use of this method
when valuing going concern businesses, suggesting that this method be compared
with at least one other method before concluding on a value (International Valuation
Standards, 2005).
All three of the suggested valuation methods therefore fall into the fundamental
valuation category, where the first valuation method represents a straight comparison
between two companies, and includes a comparison using financial ratios such as
20
price earnings multipliers (although the standard does caution the use of this method
and provides a number of approach guidelines), the second would fall under the
discounted cash flow category, and the third under the book value of assets category
(International Valuation Standards, 2005).
The standard also includes a separate section on the use of financial statements. The
standard suggests that an understanding of the relationships that exist in the income
statement and balance sheet be obtained. This should include an analysis of trends to
assess the risk inherent in the business operations, and to determine the prospects for
future performance (International Valuation Standards, 2005). The standard further
suggests comparison with similar businesses, as well as adjustment of the historic
financial statements to estimate economic abilities of, and prospects of the firm
(International Valuation Standards, 2005). The standard suggests that the financial
statements be analyzed in terms of monetary value, percentages, and financial ratio
analysis to aid in understanding the economics of the business, and identify the risks
to which it is exposed (International Valuation Standards, 2005).
The inclusion of an analysis of the financial statement in the valuation standard
recognizes the importance of the financial statements in determining market value,
and is of particular interest to the objective of this study, as it attempts to determine
whether a relationship exists between the accounting book values as published in the
financial statements and the share price.
The standard also suggests that the financial statements be adjusted in certain
circumstances with common adjustments, to closer approximate the economic reality
of the income statement and balance sheet. Adjustment is considered appropriate
where the adjustments would be relevant and significant to the valuation process, and
includes adjustments to obtain revenues and expenses for continuing operations, to
achieve consistency in treatment to allow comparison, to adjust from reported values
to market values, to adjust for non-operating assets and liabilities and related incomes
and expenses, to adjust for non-economic revenue and expenses, elimination of non
recurring events, elimination of non-essential personnel costs, and non-essential
assets, or redundant assets (in certain circumstances only), and adjustments for
different methods of inventory accounting (International Valuation Standards, 2005).
21
Such adjustments are considered to be beyond the scope of this study, but should be
borne in mind in developing future research areas attempting to include all factors in
determining firm value, and in specifying the other information variable further.
Although the standard is of interest from a methodological perspective, it does not
bind analysts or fund managers to the use of the principles and methods therein; it is
instead intended to provide guidance to ensure consistent treatment for disclosure
purposes, of investments in the financial statements (International Valuation
Standards, 2005). The contents of the standard are, however, useful in specifying the
independent variables in the Ohlson (1995) model, particularly with respect to the
other information variable.
2.4 Valuation research and value relevance
Value relevance research examines the association between accounting information,
as disclosed in the financial statements, and market values of shares. This suggests
testing whether financial statement information explains cross-sectional or time series
variation in share prices. For the most part, valuation models that form the basis for
tests in the value relevance literature are developed in terms of the level of firm value
as measured by the share price (Miller and Modigliani, 1961; Ohlson, 1995).
Examining changes in share prices, or returns, is an alternative approach to assessing
value relevance, where the precise specification of the valuation equation depends on
the model adopted, such as Ohlson (1995). Examining changes involves the
elimination of the unit root of the price, and investigating the change in share price,
rather than the total share price. Selection of which approach to use depends on the
nature of the study performed.
Barth, Beaver and Landsman (2001) describe the key distinction between the two
main streams of value relevance studies; being either examining price levels, or
examining price changes, or returns. According to Barth, Beaver and Landsman
(2001), the former attempts to determine what is reflected in firm value, and the latter
in determining what is reflected in changes in value over a specific period of time.
Thus, if the research question involves determining whether the accounting amount is
timely, examining changes in value is the appropriate research design choice, whereas
22
if the research question attempts to determine price levels which do not involve
timelines, then the examination of absolute price is more appropriate. In this research
report, the first method (measuring the level of firm value) is used, although by using
panel data, the time series effects are also analysed, and therefore the effect of
changes in prices are also reflected in the statistical outputs. The model design and
data however reflect firm value.
The distinction between research of share prices and price change approaches is an
important one. Although both approaches address related, but different questions,
failure to recognize these differences could result in drawing incorrect inferences.
Barth, Beaver and Landsman (2001) provide an example of two such similar studies
performed in Australia, using papers by Easton, Eddey, and Harris (1993) and Barth
and Clinch (1998). Both papers address the value relevance of asset revaluations
under Australian Generally Accepted Accounting Principles. Both studies find a
significant association between the level of revaluation reserves and share prices, but
a weak association between the change in the valuation reserves and returns. It is
noted that Australian GAAP permits considerable discretion in the timing of
revaluations. The result is that Easton, Eddey, and Harris (1993) appropriately
conclude that asset revaluations are value relevant but not timely. Barth et al (2001)
conclude that had the asset revaluation studies only estimated returns specifications,
they might have concluded erroneously that asset revaluations are not value relevant.
2.4.1 Value relevance
Barth, Beaver and Landsman (2001) describe value relevance in the context of
valuation research, by discussing how well the chosen variable reflects information
used by equity investors. When using accounting information, it is suggested that the
primary focus of financial statements is equity investment, and that other uses of
financial statement information, such as contracting, do not diminish the importance
of value relevance research.
A more specific definition of value relevance is submitted by Barth et al (2001) as to
whether there is a predictive association between the estimated variables and equity
market values. Although the literature examining such associations extends back over
23
30 years (Miller and Modigliani, 1961), the first study identified by Barth et al (2001)
for the term “value relevance” to describe this association is Amir, Harris, and Venuti
(1993).
Value relevance requires that both the relevance, and the reliability criteria are met
before it can be concluded that there is an empirical association. The variable will
therefore only have a predicted significant relation with share prices if the amount
reflects information relevant to investors in valuing the firm, and is measured reliably
enough to be reflected in share prices. An accounting amount only is relevant to a
financial statement user if it is capable of making a difference to that user’s decisions.
As the Ohlson (1995) model uses book values of assets and earnings obtained from
the financial statements, the accounting standards which govern such financial
statements need to be considered. Barth (2000) discusses the conceptual framework in
this context, noting that the standards state that information does not have to be new
to a financial statement user to be relevant. An important role of an accountant is
therefore to summarize or aggregate information that may be available from other
sources. It is further noted by Barth (2000) that the concepts of value relevance and
decision relevance differ. In particular, accounting information can be value relevant
but not decision relevant if it is superceded by more timely information. Value
relevance tests are joint tests of relevance and reliability. Although finding value
relevance indicates the accounting amount is relevant and reliable, at least to some
degree, it is difficult to attribute the cause of lack of value relevance to one or the
other attribute. Barth (2000) further suggests that neither relevance nor reliability are
dichotomous, and that the conceptual framework does not specify how much
relevance or reliability is sufficient to meet the stated criteria.
In discussing the purpose of value relevance research, Barth (2000) states that
although findings from the value relevance literature often have implications for
issues of interest to non-academic constituents, value relevance studies typically do
not draw normative conclusions, or make specific policy recommendations. In fact,
several studies explicitly provide caveats that policy inferences cannot be drawn. For
example, Barth (1991 : 436) states, “The focus in this research is on relevance and
reliability of the alternative measures for investors’ use. The definitions of relevance
24
and reliability are complex and judgmental, and may not be fully captured in their
operationalization in the research design”. Value relevance studies do not therefore
attempt to estimate the value of a firm, as is the objective with fundamental analysis
research, the focus is rather on whether particular accounting amounts are value
relevant, and therefore useful as a base in determining firm value using fundamental
analysis research.
Although both types of studies use share prices as a valuation benchmark, their
differing objectives result in testing different hypotheses and using different
specifications of the equations. In fundamental analysis studies, estimating equations
include all variables that can help explain current or predict future firm value,
including those not yet reflected in financial statements. For example, fundamental
analysis research is not concerned with whether information relevant to valuing the
firm appears in financial statements or can otherwise be obtained. In value relevance
studies, estimating equations selectively include accounting variables to learn about
the valuation characteristics of particular accounting amounts.
This study uses a valuation model that is based on Ohlson (1995) model, and its
subsequent refinements (Feltham and Ohlson, 1995; Feltham and Ohlson, 1996;
Ohlson, 1998; Ohlson, 2001). The Ohlson (1995) model presents firm value as a
linear function of book value of equity and the present value of expected future
abnormal earnings. With additional assumptions of linear information dynamics, firm
value can be re-expressed as a linear function of equity book value, net income,
dividends, and other information. Ohlson (1995) shows that balance sheet-based and
earnings-based valuation models represent the two extreme cases resulting from
limiting assumptions regarding the persistence of abnormal earnings.
2.5 Valuation research in South Africa
Although a large body of empirical valuation research performed in South Africa on
the Johannesburg Securities Exchange exists, there is no known literature applying the
Ohlson (1995) or similar accounting based value relevance studies. The body of work
discussed below does however provide insight into the environment in which the
Johannesburg Securities Exchange operates, and identifies peculiarities of the market
25
that should be borne in mind before applying such a value relevance model. The
literature also identifies some interesting future research areas which could be further
explored, by combining the Ohlson (1995) model with other studies performed.
Bradfield and Swartz (2001) investigate the persistence of unit trust performance in
South Africa, replicating a study by Meyer (1997). The paper examines the
persistence of fund performance over consecutive years, and finds evidence of fund
performance persistence, which is evidenced by consistently superior performance by
the top performers. The study however notes that the persistence of poor performers is
not proved. Although the study does not address value relevance directly, it does
provide evidence suggesting that fund managers with significant skills, who would be
utilising some form of valuation methodology to pick shares, are able to
systematically outperform their peers, and therefore that valuation models are being
utilised successfully in the market.
Beeson, Sutherland and Ford (2004) evaluate how the assessment of management by
investment analysts and fund managers impacts on their determination of value in
making investment decisions. They concluded that the assessment of managers of a
company plays a critical role in making investment decisions. Their study attempts to
determine the level at which human capital assets and management are incorporated
into investors’ valuation models. The paper emphasizes the need for an accounting
based valuation model to address the financial aspects of the valuation, such as the
model suggested in this research report, which is to be integrated with intellectual
capital measurements, such as the Value Added Intellectual Coefficient (VAICTM)
(Pulic, 1998), or the balanced scorecard developed by Kaplan and Norton (1996).
Negash (2002) focuses on a group of variables to establish a multivariable index for
intangibles. Using Johannesburg Securities Exchange data, the paper examines
whether intangibles are priced by the stock market. It examines five latent variables:
investments in tangibles assets (example: cash, bricks and mortars); investments in
intangibles (knowledge / intellectual capital, brand, patent, etc.); earnings and payout;
liquidity and leverage; and a fifth latent variable for control purposes. The paper
concludes that market (price) to book ratio over two time periods is explained by
changes in buy-sell spreads. The changes in the buy-sell spreads were correlated with
26
the indicators of intangibles. The model investigated in this research report could
include such intellectual capital variables as part of the other information
specification. Such effects will be reflected in the error term, as incorporating the
effects of intellectual capital is considered to be outside the scope of this study.
Valuation studies on the Johannesburg Securities Exchange include Firer, Sandler and
Ward (1992), who conduct an empirical investigation highlighting the extent to which
successful market timing can potentially enhance portfolio performance, while
Bradfield (1998) extended this line by reviewing the application of the Bhattacharya
and Pfleiderer (1983) model which allows the separation and measurement of
selection and timing skills of fund managers in attempting to measure the abilities of
South African fund managers to select and time the market. The study concludes that
there exists no positive share selection or timing ability among South African fund
managers. Although of interest in the specification of the other information variable,
such timing issues are considered to be beyond the scope of this research report.
A branch of research attempting to price risk on the Johannesburg Securities
Exchange using the capital asset pricing model, cluster analysis, and more complex
multi-parameter models such as those derived from the arbitrage pricing theory
includes Bowie and Bradfield (1993), Ward (1994), Page (1989), Biger and Page
(1993), Van Rensburg and Slaney (1997), and Van Rensburg (1998). The papers do
not reach consensus on the exact form of these multi-factor models, but do agree that
multi factor models may be superior in pricing risk. Such studies may provide an
interesting combination when used with the Ohlson (1995) model in determining a
risk adjusted share price. The Ohlson (1995) model includes a measure of risk when
determining the level of abnormal earnings. Normal earnings are determined by
discounting the book value of the companies’ assets, less long term liabilities, by the
weighted average cost of capital (using the price earnings ratio as a surrogate).
Abnormal earnings then represent any shortfall or excess over the reported earnings,
and the normal earnings calculated.
In a paper discussing market segmentation on the Johannesburg Securities Exchange,
Van Rensburg and Slaney (1997) suggest that the market is clearly segregated into
different sub markets, and therefore the use of a multi-market model, where different
27
categories of the market with distinctly different attributes are separated out and
analysed separately, would be more appropriate. The same argument can be applied to
the use of the Ohlson (1995) model.
In analysing the beta of shares on the Johannesburg Securities Exchange, Campbell
(1979) found that individual share Betas’ were more stable when measured against the
respective sector indices than with the market as a whole, and consequently proposed
that a different securities market line existed for each sector, with each sector
therefore being a separate market, thereby supporting the use of industry identifiers
when applying predictive models.
In a study investigating beta estimates, Bradfield (1989) highlights the pervasiveness
of thin trading on the Johannesburg Securities Exchange, while Bowie and Bradfield
(1998) show that betas of individual firms are typically exposed to large estimation
errors. Although this research report does not use beta estimates, it does use the price
earnings ratio as a proxy for weighted average cost of capital, which includes a risk
component. The presence of thin trading on the results of the output using the price
earnings ratio will be borne in mind when interpreting results.
2.6 The Ohlson (1995) model
Ohlson (1995) develops a residual income valuation model using future earnings,
book values and dividends, using the dividend discount model as a starting point.
Feltham and Ohlson (1995, 1996) extend this work, highlighting the effects of biased
accounting for net operating assets. Numerous empirical works have subsequently
been published testing and extending these models in different environments.
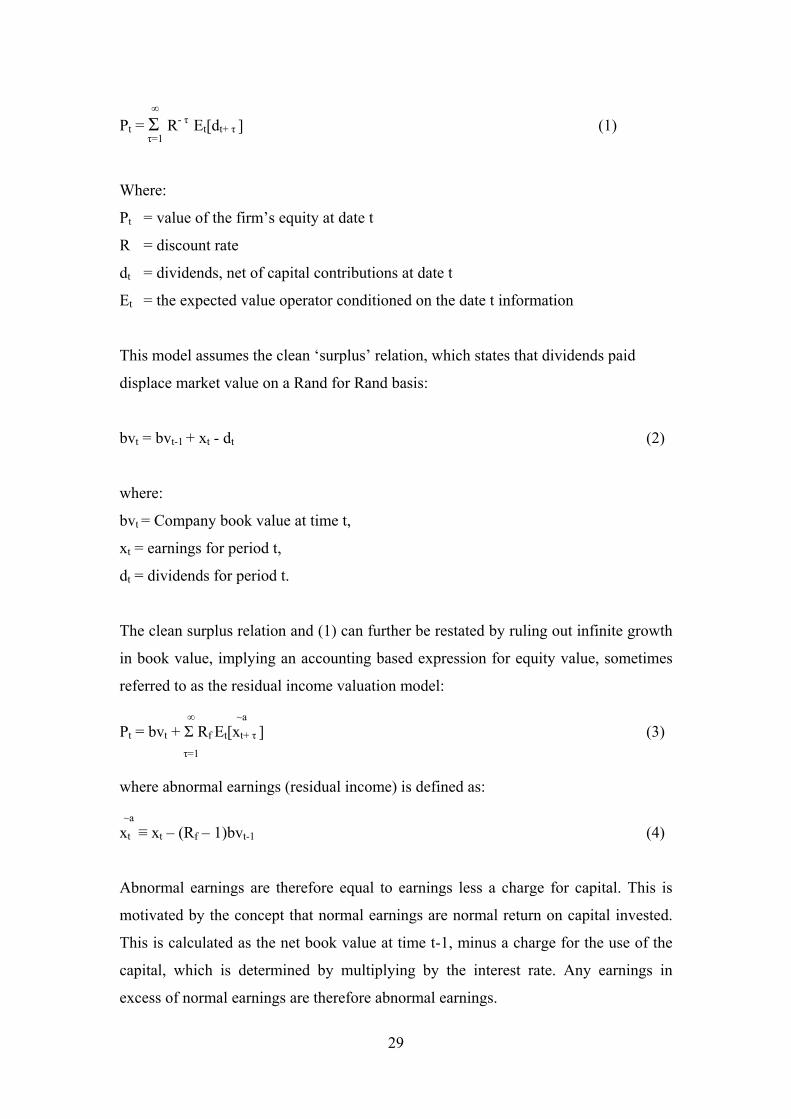
Ohlson (1995) and Feltham and Ohlson (1995, 1996) rely on the dividend discount
model, which states that a firm’s equity value is equal to the present value of expected
dividends discounted at the risk free rate of return:
28
∞
= Σ R- τP E [d ] (1) t t t+ τ τ=1
Where:
P = value of the firm’s equity at date t t
R = discount rate
d = dividends, net of capital contributions at date t t
E = the expected value operator conditioned on the date t information t
This model assumes the clean ‘surplus’ relation, which states that dividends paid
displace market value on a Rand for Rand basis:
bv = bvt t-1 + x - d (2) t t
where:
bvt = Company book value at time t,
x = earnings for period t, t
d = dividends for period t. t
The clean surplus relation and (1) can further be restated by ruling out infinite growth
in book value, implying an accounting based expression for equity value, sometimes
referred to as the residual income valuation model:
∞ ~a P = bv + Σ Rt t f E [x ] (3) t t+ τ
τ=1
where abnormal earnings (residual income) is defined as:
~ax ≡ x – (Rt t f – 1)bv (4) t-1
Abnormal earnings are therefore equal to earnings less a charge for capital. This is
motivated by the concept that normal earnings are normal return on capital invested.
This is calculated as the net book value at time t-1, minus a charge for the use of the
capital, which is determined by multiplying by the interest rate. Any earnings in
excess of normal earnings are therefore abnormal earnings.
29
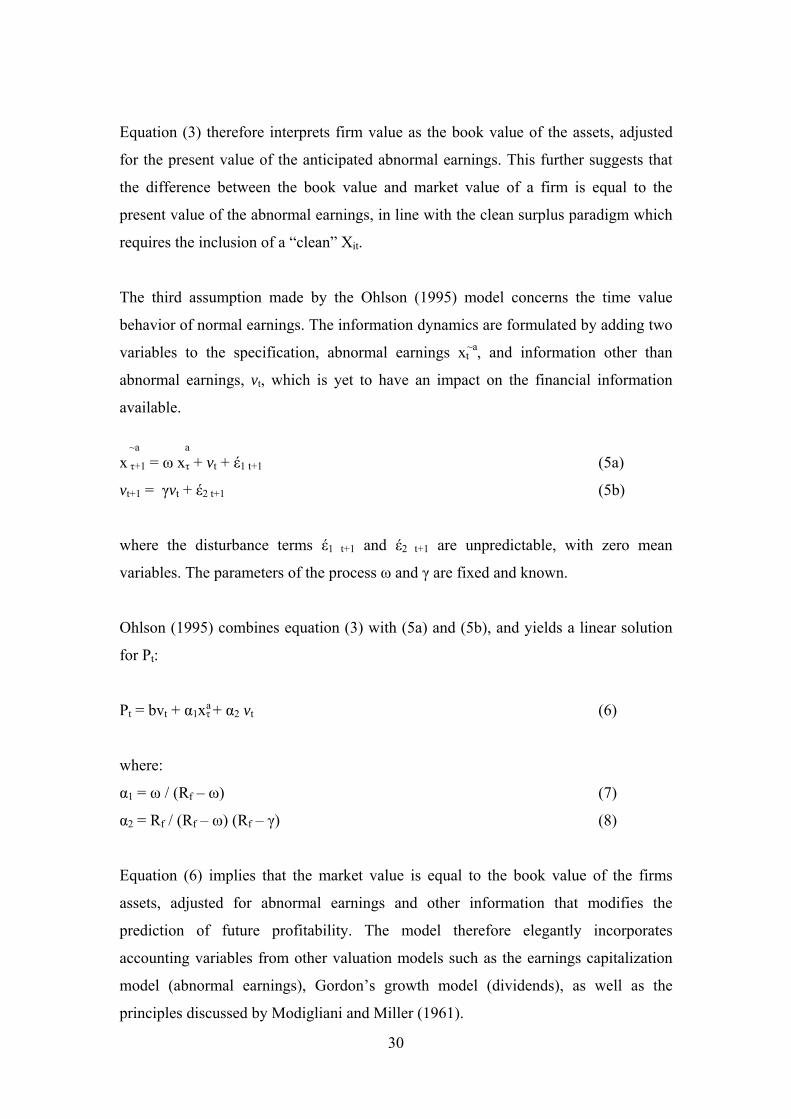
Equation (3) therefore interprets firm value as the book value of the assets, adjusted
for the present value of the anticipated abnormal earnings. This further suggests that
the difference between the book value and market value of a firm is equal to the
present value of the abnormal earnings, in line with the clean surplus paradigm which
requires the inclusion of a “clean” Xit.
The third assumption made by the Ohlson (1995) model concerns the time value
behavior of normal earnings. The information dynamics are formulated by adding two
variables to the specification, abnormal earnings xt , and information other than
abnormal earnings, v
~a
t, which is yet to have an impact on the financial information
available.
~a
x τ+1 = ω xτ + va
+ έt 1 t+1 (5a)
v = γv + έt+1 t 2 t+1 (5b)
where the disturbance terms έ1 t+1 and έ2 t+1 are unpredictable, with zero mean
variables. The parameters of the process ω and γ are fixed and known.
Ohlson (1995) combines equation (3) with (5a) and (5b), and yields a linear solution
for P : t
Pt = bvt + α1xτ a v+ α (6) 2 t
where:
α1 = ω / (R – ω) (7) f
α2 = R / (Rf f – ω) (R – γ) (8) f
Equation (6) implies that the market value is equal to the book value of the firms
assets, adjusted for abnormal earnings and other information that modifies the
prediction of future profitability. The model therefore elegantly incorporates
accounting variables from other valuation models such as the earnings capitalization
model (abnormal earnings), Gordon’s growth model (dividends), as well as the
principles discussed by Modigliani and Miller (1961).
30
The discount rate used in the Ohlson (1995) model thus far has been the risk free rate,
and therefore based on risk neutrality. The model can be modified to introduce risk in
the anticipated dividend sequence. One possible approach suggested is replacing Rf
with some factor ρ, which adjusts Rf for risk by introducing a risk premium. The risk
premium will be determined by the company’s cost of capital or the expected market
return determined from models such as the capital asset pricing model (CAPM),
which implies that ρ = R + β (expected return on market portfolio – Rf f). This
approach has been criticized as being empirically inadequate by Fama and French
(1996), arguing that Beta’s do not explain average return, or size [using market
capitalization]. They further criticize CAPM for being a single factor model, where
Beta is required to be the only element for explaining expected returns. Bowie and
Bradfield (1998) investigated beta stability on the JSE, and found that thinly traded
environments such as the JSE caused distortions in the measure of stability of beta
coefficients. Van Rensburg and Robertson (2003) in a similar study find an
unambiguous empirical contradiction of the CAPM. The literature therefore suggests
that the use of CAPM in a South African context is unlikely to be suitable.
Fama and French (1992) suggest using variables such as price earnings (PE), and
cashflow to price as a surrogate for the discount rate. The use of PE is further
supported by Cheng and McNamara (2000), arguing that the PE ratio captures the risk
and growth of companies. Cheng and McNamara (2000) further suggest the use of the
price to book (PB) ratio as a surrogate for discount rate. The study finds that the PE
method provides stronger evidence than the PB, and further that a combined PE-PB
provides the best definition.
Feltham and Ohlson (1995, 1996) extend the Ohlson (1995) model by introducing the
difference between financing and operating activities, and by introducing aspects
relating to the integrity of conservative accounting information in valuing a company.
Financing activities involve assets and liabilities for which there are relatively perfect
markets, and therefore book value equals market value. Operating assets and liabilities
typically, however, are not readily individually traded in perfect markets, thus to
measure their value, cash flows adjusted for accruals are required. The difference
31
between the book value and the market value of operating assets therefore represents
the value of intangible assets.
The Ohlson (1995) model incorporates Miller and Modigliani’s (1961) basic concept
regarding debt, where the company’s borrowing or lending activities yield zero net
present value as they are financial assets. The company’s equity value, therefore,
equals the value of financial assets plus the value of the operating activities. In
valuing operating earnings, the cash flow concept adjusts operating earnings for
accruals, yielding operating cash flows. The additional adjustments required by
Feltham and Ohlson (1995, 1996), therefore, determine the long term and short run
expected growth in operating assets, which is not included in the accounting
information due to conservative accounting practices.
The Ohlson (1995) model has gained popularity in value relevance research, as using
the clean surplus relation, it brings both bottom line items of the financial statements
(total profit and net total assets) into the valuation. The model therefore provides
credibility to the financial statements as being value relevant.
2.7 Empirical history
Stober (1999) reviews the application of the Ohlson (1995) and Feltham and Ohlson
(1995, 1996) valuation models, and considers the directions that such valuation
models are likely to take in the future. The paper discusses the implications of the
promise of a suitable point of departure for such empirical works. The paper
concludes that the collective models provide a rigorous conceptual foundation for
regressions of equity values using earnings and book values of assets, and, therefore,
provides a point of departure for empirical work. The paper further emphasizes the
need for close attention to specification issues when dealing with the other
information variable v.
Ohlson (1998) further discusses the specification of the other information variable v.
The paper emphasises the crucial role of this variable in predicting the next period’s
abnormal earnings. While v is not directly observable, the paper illustrates how it can
be inferred from expectations of future abnormal earnings. Specification issues are
32
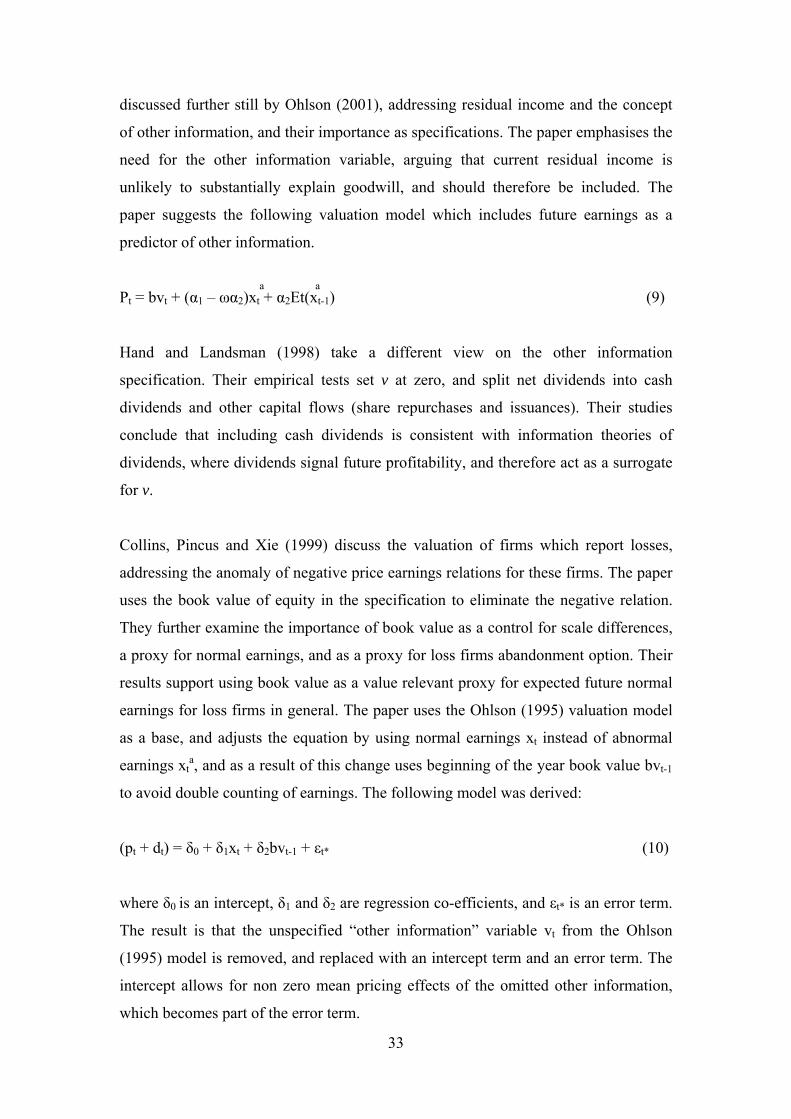
discussed further still by Ohlson (2001), addressing residual income and the concept
of other information, and their importance as specifications. The paper emphasises the
need for the other information variable, arguing that current residual income is
unlikely to substantially explain goodwill, and should therefore be included. The
paper suggests the following valuation model which includes future earnings as a
predictor of other information.
Pt = bvt + (α1 – ωα2)xt + α a
2Et(xt-1) (9) a
Hand and Landsman (1998) take a different view on the other information
specification. Their empirical tests set v at zero, and split net dividends into cash
dividends and other capital flows (share repurchases and issuances). Their studies
conclude that including cash dividends is consistent with information theories of
dividends, where dividends signal future profitability, and therefore act as a surrogate
for v.
Collins, Pincus and Xie (1999) discuss the valuation of firms which report losses,
addressing the anomaly of negative price earnings relations for these firms. The paper
uses the book value of equity in the specification to eliminate the negative relation.
They further examine the importance of book value as a control for scale differences,
a proxy for normal earnings, and as a proxy for loss firms abandonment option. Their
results support using book value as a value relevant proxy for expected future normal
earnings for loss firms in general. The paper uses the Ohlson (1995) valuation model
as a base, and adjusts the equation by using normal earnings xt instead of abnormal
earnings x a, and as a result of this change uses beginning of the year book value bvt t-1
to avoid double counting of earnings. The following model was derived:
(p + d ) = δ + δ x + δt t 0 1 t 2bv + εt-1 t* (10)
where δ is an intercept, δ and δ0 1 2 are regression co-efficients, and εt* is an error term.
The result is that the unspecified “other information” variable vt from the Ohlson
(1995) model is removed, and replaced with an intercept term and an error term. The
intercept allows for non zero mean pricing effects of the omitted other information,
which becomes part of the error term.
33
Garrod and Rees (1998) use the Ohlson (1995) model to determine the value of
international expansion. Their analysis reveals that earnings and net assets are more
highly valued for multinational firms than for domestic firms, and also that there is no
clear difference between the valuation of domestic and multinational earnings and net
assets. The result therefore indicates that the apparent superiority of multinational
firms is not restricted to their multinational operations. The study is restricted to UK
firms during the period 1991-1996. The only anomaly from the results above was that
the US appears to be more highly valued than other areas of operation.
Cheng, Hwang and Merchant (2000) perform a study on the effectiveness of using
Economic Value Added (EVA) for firm valuation. The study focuses specifically on
the Stern Stewart Generally Accepted Accounting Practice’s (GAAP) adjustments to
evaluate how effective these are in improving the accounting information for
valuation purposes. The paper concludes that EVA based measures are superior to
GAAP based measures in predicting firm value for more than 70% of their sample.
The study further examines the value relevance of the alternative measures, and
concludes that on average, that EVA based book value and residual income measures
are less value relevant than those of GAAP, indicating that the first result does not
therefore imply that the EVA approach is more value relevant.
Recent studies using the Ohlson (1995) model have used different forms of the
valuation equation for predictions. Studies by Amir (1996), Amir and Lev (1996) and
Collins, Maydew, and Weiss (1997) use equation (6) in the form:
Pit = α bv1 it + α2xit + eit
where i is a firm subscript for cross sectional estimation. The model therefore ignores
both dividends and other information.
Studies incorporating dividends include Amir (1993) and Louder, Khurana, and
Boatsman (1996) in the form P = b bvu 1 it + b x2 it + b3dit + eit, although in Amir (1993)
the dividends are eliminated by the clean surplus relation in their final empirical
model.
34
Amir and Lev (1996) use Equation (6) in determining the value relevance of financial
and non-financial information for cellular telephone companies. They conclude that,
on a stand alone basis, earnings and book values do not explain share prices, but that
non-financial indicators such as total population in a service area, and market
penetration are highly value relevant. This suggests that application of the model
should be performed on an industry specific basis.
Lev and Sougiannis (1999) attempt to explain the increasing gap in the book to
market ratio by regressing research and development in science-based companies in
an attempt to quantify the future abnormal profits of these companies. They conclude
that there is a significant association between research and development expenditure
and the book to market ratio in these firms, suggesting that the book to market ratio
reflects the non-recognition of internally generated intangibles in the form of
goodwill. Although of interest to the nature of the companies, the study emphasizes
that the result cannot be extrapolated to non-science companies.
Brief and Zarowin (1999) use Ohlson (1995) in a cross sectional study using New
York stock exchange data over a twenty year period from 1978 to 1997. Although the
primary purpose of their research is the comparison of the value relevance of book
value and dividends versus book value and reported earnings, an interesting aside is
that the value relevance of accounting data over time in developed markets declined in
the period analyzed. The study suggests that this may be due to the changing firm
characteristics within the market studied, where the profile of the market has changed
from being industrialized to being a more high tech service oriented economy, and
therefore being more intangible intensive.
In a similar study performed in an emerging market setting using data from China,
Bao and Chow (1999) find an increase in the value relevance of both earnings and
book values. The apparent contradiction with the results of Brief and Zarowin (1999)
is attributed to the fact that emerging markets are subject to rapid capital
development, and therefore that the markets characteristics are different from those of
the developed market’s studied by Brief and Zarowin (1999).
35
Collins, Maydew and Weiss (1997) investigate the systematic changes in the value-
relevance of earnings and book values over time. They find that the combined value-
relevance of earnings and book values has not declined over the past forty years and,
in fact, appears to have increased slightly. This result was criticized by Brown, Lo and
Lys (2000), interpreting their results as being the consequence of an upward bias in
their coefficient of determination (R2).
In an unpublished Master of Commerce research report from the Department of
Accounting of the University of Cape Town, Woldegabir (2004) finds that the value
relevance of accounting data in South Africa has increased across the period 1993-
2002, using data from the Johannesburg Securities Exchange Industrial Sector,
concluding in line with Bao and Chow (1999). Although the research report is based
on the Ohlson (1995) model, it only tests book value of assets and accrual earnings,
and does not include dividends or any other surrogate for the other information
variable.
The literature indicates a number of successful value relevance studies have been
performed in different markets, using different forms of the Ohlson (1995) model.
Although the literature indicates conflicting results as to whether there is an
increasing or decreasing trend in the value relevance of accounting data, none of the
studies disprove that a relationship exists. Although the presence of an increasing or
decreasing trend does not affect the relevance of this study, the relationships detected
will be borne in mind when interpreting the results.
The literature also emphasizes that care should be taken in the specification of the
other information variable vt. This study follows the approach of Hand and Landsman
(1998) and Garrod and Rees (1998), using cash dividends as a surrogate for other
information variable.
2.8 Market efficiency
Previous studies applying the Ohlson (1995) model in developed markets are silent on
market efficiency, and appear to make inferences based on the implicit assumption
36
that the stock market is efficient in the semi-strong form. In an emerging market
setting, concerns regarding the effect of the market not efficiently processing
information are more pronounced. This raises the doubt as to whether the Ohlson
(1995) model can be applied should the market be inefficient. Such concern is well
described by Holthausen and Watts (2000), who identify the above reliance on market
efficiency, asserting that in order to interpret the evidence from value-relevance
studies as communicating anything regarding the relevance and reliability of some
component of a financial statement, it must be that the market is capable of processing
the relevance and reliability of that particular component.
In a paper exploring the measurement of value relevance in an inefficient market
setting, Aboody, Hughes and Liu (2002) derive a procedure for estimating value
relevance using accounting variables. The procedure is applied in both efficient and
inefficient market settings. They find that although their empirical findings suggest
that market inefficiencies do affect the measurement of value relevance, the presence
of arbitrage mitigates the magnitude of these effects. Secondly, they also find that
because share price reflects the accumulation of information since the inception of the
firm, and market inefficiencies are likely to be associated only with “new
information,” the impact of such inefficiencies on price levels will be small when
measured in percentage terms. Evidence from value relevance studies that employ
regression models, such as Holthausen and Watts (2000), and Pfeiffer and Elgers
(1999), control market inefficiency effects by lengthening the time horizon over
which price effects are measured. Pfeiffer and Elgers (1999) in particular implement
such an approach and found accruals have less value relevance than cash flows as
measured by coefficients in return regressions. The 12-year period of this study
achieves the same result through the number of periods examined in the time-series
modelling. Their conclusion suggests that the Ohlson (1995) model can be applied in
an inefficient market without major noise from the inefficiency effect.
2.9 Regulatory environment
Although the literature review provides evidence supporting the use of the Ohlson
(1995) model, the regulatory environment which underpins the key variables used by
37
the model needs to be considered in order to evaluate the integrity of the underlying
data in the context of this study.
The theoretical foundation of value relevance studies consists of a combination of
valuation theory and contextual accounting issues that allow researchers to predict
how accounting disclosures are constructed. Barth (2000) discusses the relation
between financial reporting, standard setting, and valuation research, relating major
financial reporting issues currently facing the profession and academic valuation
research. The paper highlights that financial reporting standards are not only
concerned with valuation issues, they also require financial reporting to address the
needs of other users such as creditors and other external parties. Financial reporting
standards attempt to meet the needs of society as a whole, presumably catering to the
needs of a wide range of users, as opposed to a pure valuation intention.
Barth (2000) further provides the following diagram, extracted from SFAC No. 5,
recognition and measurement of business enterprises, illustrating the various forms of
information available to users.
38
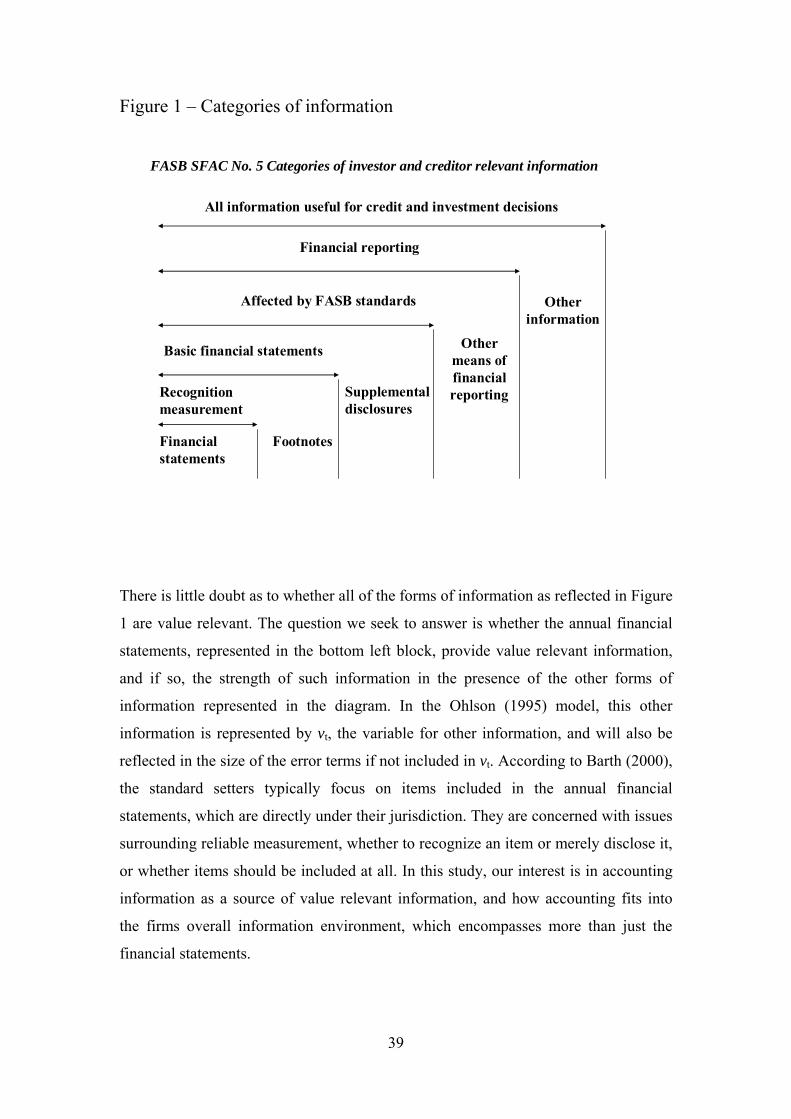
Figure 1 – Categories of information
Financial statements
Recognition measurement
Basic financial statements
Affected by FASB standards
Financial reporting
All information useful for credit and investment decisions
Footnotes
Supplemental disclosures
Other means of financial reporting
Other information
FASB SFAC No. 5 Categories of investor and creditor relevant information
There is little doubt as to whether all of the forms of information as reflected in Figure
1 are value relevant. The question we seek to answer is whether the annual financial
statements, represented in the bottom left block, provide value relevant information,
and if so, the strength of such information in the presence of the other forms of
information represented in the diagram. In the Ohlson (1995) model, this other
information is represented by vt, the variable for other information, and will also be
reflected in the size of the error terms if not included in vt. According to Barth (2000),
the standard setters typically focus on items included in the annual financial
statements, which are directly under their jurisdiction. They are concerned with issues
surrounding reliable measurement, whether to recognize an item or merely disclose it,
or whether items should be included at all. In this study, our interest is in accounting
information as a source of value relevant information, and how accounting fits into
the firms overall information environment, which encompasses more than just the
financial statements.
39
The presence of such other purposes for the annual financial statements is in fact the
source of the hypothesis of this study. The outcome will determine whether the annual
financial statements are useful in valuing companies, or alternatively, whether they
have become too general purpose (servicing the needs of a multitude of users) to be
value relevant. Other forms of reporting include management earnings forecasts,
analysts buy and sell recommendations, press releases, planned acquisitions and court
actions.
Barth (2000) also discusses the current major topics and current issues which are
being dealt with by accounting academics and practitioners. The four issues identified
are fair value accounting, cash flows versus accruals, recognition versus disclosure,
and the effect of harmonization of accounting standards. Although there is little doubt
that these issues are value relevant, this study does not attempt to address the effects
thereof. In fact, should these issues render book values to be non-value relevant, this
will be obvious in the statistical results. Such issues will be borne in mind when
evaluating the results of the statistical testing.
2.10 Critical appraisal of the model
Although the Ohlson (1995) model is widely accepted in value relevance literature, it
has not been immune to criticism. There are two main criticisms of the model, the first
of which involves the abnormal earnings specification, which is calculated using
accounting earnings as a base, and subtracting a charge for normal earnings using the
book value of assets and a discount rate as a surrogate for the weighted average cost
of capital. The first criticism deals with the estimation of this discount rate. The
second criticism involves the specification of the “other information” variable, which
is a source of all information other than the book value of assets and abnormal
earnings, and is therefore difficult to specify.
The first criticism focuses on the need of the model to estimate a discount rate to
determine abnormal earnings. Discount rates are by nature difficult to estimate, and
are also generally not static over a period of time. The criticism, therefore, suggests
that the model relies on a discount rate which may not be appropriate, and also
assumes that the discount rate is static [this problem arises due to the time series
40
portion of the panel data approach]. In this research report the price to earnings ratio
has been used as a surrogate for the discount rate in line with Cheng and McNamara
(2000). In order to test the appropriateness of price to earnings as a surrogate, the
statistical model was tested using the book to market ratio (Cheng and McNamara,
2000), combination price earnings and book to market (Cheng and McNamara, 2000),
and finally using the risk free rate (although the use of a risk free rate is theoretically
inferior as it does not incorporate any measurement of risk). Results from both panel
data and cross sectional data confirmed the inferiority through weaker significance
(measured by the standard t-statistic) in the predictive variable for book to market,
combined price earnings and book to market, and the risk free rate, and therefore
justifies the use of price to earnings. Although the discount rate is stationery for a one
period analysis, the regression was run using a price to earnings ratio as determined
for each year, allowing the price to earnings ratio to vary on an annual basis. Although
this does not compensate for short term shifts in the ratio, it is considered to be
sufficiently robust for the purposes of this study.
The second criticism involves the specification of the “other information” variable,
which represents the idea that the forecasting of future accounting data realizations
depends on information beyond the current accounting data. Hence, other information
represents all other information not included in the book values. Such a variable is by
nature difficult to quantify, and therefore represents a severe limitation of the Ohlson
(1995) model. However, this study attempts to validate the Ohlson model as a base,
and to assess whether book values are in fact value relevant. The specification of the
“other information” variable, although still important, is not essential to the outcome.
A number of criticisms of value relevance research in general, as well as specific
criticism of the Ohlson (1995) model, are raised in the study of Holthausen and Watts
(2000). Barth Beaver and Landsman (2001) was the main response to the paper. Both
criticisms and responses follow.
Holthausen and Watts (2000) suggest that the Ohlson (1995) model is dependent on
the economic concept of permanent earnings, which are not sufficiently defined by
using the book value of assets. Barth Beaver and Landsman (2001) argue that the
model does not depend on the concept of permanent economic earnings, but instead,
41
that the model is expressed in terms of accounting earnings and equity book value.
They conclude that any empirical implementations using the Ohlson model will not
require the specification of a link between accounting amounts and economic
constructs such as permanent earnings, and therefore such concerns are irrelevant to
the model.
Barth et al (2001) further discuss the use of simplifying assumptions in the Ohlson
(1995) model that permit parsimonious representations of a complex real world.
Consistent with this, is a partial equilibrium model that takes the accounting system as
given. Holthausen and Watts (2000) argue that using simplifying assumptions in the
model does not allow the model to derive an optimal solution, and to do that would
require deriving a general equilibrium in a multi-person, regulatory context. The
Ohlson (1995) model assumes a clean surplus, a general equilibrium model would
require modeling dirty surplus (the clean ‘surplus’ relation states that dividends paid
displace market value on a Rand for Rand basis, dirty ‘surplus’ therefore implies that
such a Rand for Rand displacement would not take place, and that in addition to the
value of a dividend, there would be an intangible, informational value of dividends, or
likewise earnings, which would be worth more in market value terms than the Rand
paid). It is not the intention of value relevance research to address such additional
issues; empirical research performed by Hand and Landsman (1998), indicates that
adjusting for dirty surplus, which can be large for some firms, has negligible effects
on estimates or inferences. Barth et al (2001) argue further that although none of the
valuation models included in value relevance research explicitly derives an optimal
accounting system, or even a demand for accounting information, this does not
preclude use of such models to assess the value relevance of accounting amounts.
Barth et al (2001 : 342) use the following analogy to explain further:
“Even though the capital asset pricing model does not include a role for
financial intermediaries, this does not preclude financial intermediaries
from viewing as relevant the risk-return predictions and evidence derived
from that model.”
Holthausen and Watts (2000) further criticize the Ohlson (1995) model as being based
on a valuation model that does not include the possibility of economic rentals. Barth
42
et al (2001) argue that a key feature of the Ohlson model and its extensions (Feltham
and Ohlson, 1996) is that economic rents, i.e., returns in excess of the cost of capital
for a finite number of periods, are captured by the persistence parameter on abnormal
earnings, as well as by the other information specifiation. Although economic rents
can be viewed within the Ohlson framework as being reflected in the persistence of
abnormal earnings, rents also can be reflected in the model by including the present
value of the future cash flows attributable to those rents—incremental to those cash
flows attributable to recognized assets—as a component of equity book value.
Holthausen and Watts (2000) further criticize the Ohlson (1995) model for being
based on a linear, rather than nonlinear, valuation model. Barth et al (2001) argue that
although the Ohlson (1995) model represents firm value as a linear function of equity,
book value, and abnormal earnings, the persistence of abnormal earnings enters into
the model nonlinearly. The result is therefore, for given levels of equity book value
and abnormal earnings, that marginal differences in persistence are not associated
with constant marginal differences in equity value. Barth et al (2001) further discuss
studies that permit valuation coefficients to vary cross-sectionally or across
components of equity book value and abnormal earnings, which are explicit attempts
to control for nonlinearity, and can be viewed as being implicitly based on the
nonlinearity in abnormal earnings in the Ohlson model. Many empirical studies adopt
such methodologies (Barth, Beaver, and Landsman, 1992, 1996, 1998; Burgstahler
and Dichev, 1997; Aboody, Barth, and Kasznik, 1999; Barth, Beaver, Hand, and
Landsman, 2000).
Barth et al (2001) state that the Ohlson model yields a particular form of nonlinearity
in the valuation equation. The model assumes perfect and complete capital markets,
and the use of the discounted cash flow model, resulting in a linear valuation relation,
as there is no well accepted model of equity valuation in imperfect and incomplete
markets. Thus, value relevance research uses perfect and complete market models as a
basis for tests, but often makes modifications to estimating equation specifications to
incorporate potential effects of nonlinearities in the particular setting being examined.
As previously discussed, the JSE is “operationally efficient” (Ward, 1994), indicating
that a small group of investors may be able to outperform the market, but most
investors will be unable to do so, which is considered to be adequate market
43
efficiency strength for the purposes of this study. Furthermore, the use of panel data
allows coefficients to vary cross-sectionally, which relaxes the effect of linearity
factors across the population, and maintains linearity within each partitioning.
Holthausen and Watts (2000) assert that conservative accounting practices by firms
can undermine what can be learned from value relevance research by sanitizing the
results to reflect conservative accounting numbers rather than economic reality.
Conversely, Barth et al (2001) suggest that valuation models used in value relevance
research can accommodate and be used to assess the effects of accounting
conservatism. The Ohlson (1995) model does this by reflecting in the abnormal
earnings term both unrecognized assets and assets with fair values in excess of book
value. In addition, subsequent refinements of the Ohlson model explicitly model the
effects of conservatism (Feltham and Ohlson, 1995; 1996), and therefore provide a
basis for examining the empirical implications of conservative accounting. Barth et al
(2001) identify examples of empirical value relevance studies which directly
incorporate conservatism, and assess its effects on the relation between accounting
amounts and firm value (Barth, Beaver, Hand, and Landsman, 1999; and Beaver and
Ryan, 2000). Moreover, many empirical studies seek to explain why equity market
value exceeds equity book value. These studies can be viewed as examining
conservatism in accounting. Barth et al (2001) further question the assertion that
accounting practices are deliberately conservative, suggesting that such conservatism
may merely be a by-product of applying accounting standards, and not necessarily the
result of an explicit objective that accounting be conservative. An example of this is
the treatment of fair value estimates and intangible assets currently that are not
recognized in financial statements due to concern regarding the reliable measurement
of such amounts.
Finally, Holthausen and Watts (2000) argue that value relevance research requires the
assumption that the market is efficient. Barth et al (2001) argue that value relevance
research need only assume that share prices reflect investors’ consensus beliefs. Value
relevance research does not, therefore, need to assume that equity market values are
“true” or unbiased measures of the unobservable “true value” of equity, or that they
reflect unbiased measures of unobservable “true” economic values of firms’ assets
and liabilities or income generating ability. With this assumption, the resulting
44
inference relates to the extent to which the accounting information under study
reflects the amount implicitly assessed by investors as reflected in equity prices.
Investors’ consensus beliefs are of interest because of the extensive literature,
beginning with Ball and Brown (1968), documenting that share prices impound quite
accurately the valuation implications of publicly available information. With the
further assumption of market efficiency, the resulting inference relates to the extent to
which the accounting information under study reflects the true underlying value.
2.11 Summary
This chapter has presented the relevant literature and evidence illustrating that the
Ohlson’s (1995) valuation model provides a rigorous conceptual foundation for
regressions of equity values using earnings and book values of assets. The literature
reveals that the Ohlson’s (1995) model is continually being revised and re-specified
for specific purposes and environments, and has been empirically tested extensively.
Empirical works generally find significant relationships between share price and both
book value and accounting earnings, although some of the works find a decreasing
trend in the value relevance. Specification issues arising from the other information
variable are, however, highlighted as being key to the successful use of the model, and
will be borne in mind in developing the equation for this study. The next chapter
presents the research hypothesis, framework, and data that underpin the hypothesis for
this study.
45
Chapter III : Research Methodology and Data
3.1 Introduction
The literature review indicates that studies using the Ohlson (1995) and Feltham and
Ohlson (1995, 1996) models have been widely applied in determining the value of
firms in developed countries. There are however limited studies in emerging
economies. Due to the different institutional structures, it is unclear as to whether the
conclusions reached in the developed country studies can be applied to an emerging
economy setting. This can however be tested by performing similar studies in
emerging economies such as South Africa.
This research report therefore follows the approaches of previous studies using the
Ohlson (1995) valuation model, such as Collins, Pincus and Xie (1999), to determine
whether accounting information is relevant to price formation, and subsequently,
whether fundamental analysis is suitable for stock exchange price valuations. The
research report further utilizes a panel data approach to combine cross sectional and
time series relationships.
Before the statistical model is introduced, some salient aspects of the South African
market are of relevance. Besides being a developing economy, South Africa has been
described by Mitchell Williams (2000) as being a virtual microcosm of the world in a
number of ways, including its ethnic diversity, level of economic development,
standard of living, and economic infrastructure. Such diversity provides a broad base
for the development of general conclusions relating to emerging markets.
Furthermore, despite its economic status, the African continent is likely to play an
important role in future global prosperity in the new millennium, with South Africa
likely to form a gateway in this regard. Research of this region is however
underrepresented in the value relevance literature, further studies in this region
therefore need to be undertaken to establish if findings, based on findings from other
global regions, can be broadened to encompass the African continent.
46
The period covered by the study includes a number of prominent reformation events
and characteristics peculiar to the Johannesburg Securities Exchange. South Africa
has gone through considerable social infrastructure changes, including with the
elimination of apartheid during the 1990’s, and the installation of a democratic
government. The result has been financial liberalization (Makina and Negash, 2005),
foreign listing and integration, pyramid structures, subsequent unbundlings to reduce
the extent of the existence of pyramid structures, and the emergence of black
economic empowerment structures. The current business environment in South Africa
has been described as being close to a developing nation, with an abundant supply of
natural resources, and possessing well-developed financial, legal, communications,
energy, and transport sectors; with a stock exchange ranked amongst the 10 largest in
the world (Mitchell Williams, 2000); although gaps in income distribution, crime and
poverty are still issues. Despite the aforementioned, being an emerging market,
liquidity is a major issue, and income in the form of dividends therefore dominates
investment patterns, driven by the signaling theories of dividends. Also, prior studies
have shown that the capital asset pricing model is not a good predictor of price, and
market microstructure studies have indicated that trading costs are higher than
developed economies.
This chapter provides a discussion of the methodological issues relating to the
empirical section of this study, and includes discussion of the valuation models, the
theoretical foundation of the valuation models, hypothesis, and data selection.
3.2 Valuation model
Two valuation models are introduced in this section, the first of which is a cross
sectional model adapted from the Ohlson (1995) model. The second model essentially
takes the first model a step further by introducing time series data, and running a
panel data model to include both the cross sectional and time series relationships.
In the context of the empirical testing of the Ohlson model, abnormal earnings and
book value information are relatively straightforward to obtain, the specification of
the other information variable vt in the South African environment is however more
difficult. As mentioned above, liquidity in the market is a major issue, and therefore
47
the signaling effect of dividends is possibly stronger in South Africa than in more
developed markets. Because of this strong role of dividends, vt can be specified to
variables such as abnormal dividends, merger news, and redundancies.
The difficulty in defining and measuring vt is however increased by other factors
affecting share price which are not captured in the financial statements. Information
that is firm specific may well be partially captured by a variable such as abnormal
dividends, however, industry, macro and global information is more difficult to
quantify, and is not reflected in the financial statements. As the research report
specifically tests the Ohlson (1995) model, in order to determine the usefulness of
financial statement data, these variables will not be quantified. To avoid the
methodological complications, v is specified as abnormal dividends. t
A further valuation difficulty arises in the form of discretionary accruals. The Ohlson
(1995) model does not take into account the fact that the manipulation of discretionary
accruals by management may distort earnings, and therefore affect share price
(Holthausen and Watts, 2000). One approach would be to adjust for such accruals by
disaggregating abnormal earnings (Xt) into normal earnings and discretionary
earnings (X
a
t = Xt + Xt ). This research report however specifically tests the Ohlson
(1995) model, and, therefore, no adjustment will be made. The lack of adjustment for
such accruals will however be noted when interpreting results.
a n d
The model will be used in both a cross sectional multiple regression format, as well as
a panel data format combining both cross sectional and time series data. Regression
analysis is essentially a statistical technique used to study the dependence of one
variable on one or more other variables, to estimate the parameters of the model,
which may then be used to estimate and predict the former variable. In this case the
predictive variable (dependant variable) is share price, and the explanatory variables
are abnormal earnings per share, book value per share, and abnormal dividends per
share.
48
3.2.1 Specification of the other information variable
This study uses dividends as a surrogate in specifying the other information variable
in line with Cheng and McNamara (2000). To avoid double counting with the
abnormal earnings variable, the informational content of dividends has been estimated
by using the annual change in dividends, rather than the absolute dividend amount for
the year, this allows the dividend signaling aspect to be isolated, yielding abnormal
dividends.
The informational content of dividends hypothesis emerged from the work of Lintner
(1956) and Miller and Modigliani (1961). This hypothesis states that firm managers
use dividend announcements to signal their beliefs about the future prospects of the
firm. More specifically, the announcement of an increase in dividends reflects the
belief of managers that the future earnings will be sufficiently high to sustain payment
of the dividend at the increased amount. Conversely, the announcement of a decrease
in dividends is made only when the managers are extremely pessimistic about the
ability of future earnings to sustain such dividends at their current rate. The theoretical
implication of the informational content hypothesis is that the announcement of a
change in dividends conveys price relevant information, in addition to other
information provided by management, regarding the future prospects of the firm. The
validity of the hypothesis depends on the belief that information asymmetry exists,
where the firm management have additional information about the future potential
earnings of the firm which the market does not possess, and communicates this
information by means of a dividend announcement.
Black (1976) reports that several researchers’ regard the informational value of
dividends as unimportant, suggesting instead that there are equally efficient and
cheaper means of signaling such additional information to shareholders. Bhana
(1991), in a paper using data from the Johannesburg Securities Exchange, suggests
that although other methods are available for disseminating additional information,
dividend policy provides a simple, comprehensive signal of management’s
interpretation of the company’s recent performance and its future prospects. Unlike
other announcements, dividends must be backed by cash payments, which the
company either needs to generate, or convince the capital market to supply. Dividends
49
are, therefore, backed by tangible substance in the form of cash. Dividend declarations
are also highly visible compared with other announcements, and due to the annual
nature thereof, provide a fixed periodic signal.
In a study performed on the Johannesburg Securities Exchange listed firms using data
from the period 1970-1988, Bhana (1991) found strong support for the informational
content of dividends hypothesis, where investors revise their expectations, and
therefore share price, in response to announcements of significant dividend changes.
The paper therefore suggested that large changes in dividends on the Johannesburg
Securities Exchange conveyed valuable information to investors over and above that
contained in earnings announcements. The evidence suggests that there is a strong
informational content to dividends on the Johannesburg Securities Exchange, and that
the use of abnormal dividends as a surrogate for the other information variable vt is
therefore appropriate.
50
3.3 Research Method
3.3.1 Cross sectional multiple regressions
In the spirit of Ohlson (1995) and Feltham and Ohlson (1995, 1996), earnings, book
values and dividends have been analyzed. These independent variables have been
tested using South African data. Equation 11, derived from Ohlson (1995), forms the
basis for the empirical results. The equation considers the following variables:
Dividends, measured by using cash dividends per share;
Abnormal earnings, measured by using accounting earnings less a cost of
capital charge representing normal earnings; cost of capital is obtained using
the P/E ratio in line with Cheng and McNamara (2000).
Book value of assets, measured using accounting book values of assets;
Debt, measured using long-term debt instruments.
In order to provide scalability, cash dividends per share have been used to measure
dividends, earnings per share to measure earnings, and book value per share to
measure book value of assets.
Share prices have been used as a measure of firm value. Although these are subject to
other market forces, even if the Johannesburg Securities Exchange is not totally
efficient in incorporating all publicly available information in share prices, at worst
the share price will reflect the consensus beliefs of investors, which is considered to
be sufficient for the purposes of this study.
51
The following valuation model has been used for the yearly cross sectional analysis:
Pt = δ0 + δ1Xt + δ2bvt + vt + εt* (11)
a *
Where:
Pt = value of the firm’s equity at year t + 3 months *
δ0 = an intercept
Xt = abnormal earnings at time t (per share) a
bv = book value of the firms assets at time t (per share) t
v = a proxy for other information t
ε = an error term t*
Abnormal earnings is calculated using normal earnings (bottom line income
statements earnings) less a charge for capital. The weighted average cost of capital is
estimated using the P/E ratio as a base, charged on the net book value of the
company’s assets. Abnormal earnings is defined as:
Xt = Xa
– WACC.TA t
Where:
X = Operating earnings after taxation and finance charges t
WACC = Weighted average cost of capital
TA = Total assets – total debt
Total debt is subtracted from total assets, because the operating earnings are after
finance charges, and therefore to avoid double counting of the cost of debt, this is
removed as a form of finance by subtracting the value from total assets. The use of a
discount rate, WACC, to determine the persistence of abnormal earnings, facilitates
thinking about the relative importance of bv and Xt t in the valuation. Since the
relationship between these factors can vary both by firm and across time for firms, bvt
or Xt may be more value relevant depending on the financial health of the firm. Barth
(1998) points out that book value may become more value relevant than Xt as firms
approach bankruptcy or liquidation, while firms with increasing earnings may have a
52
higher persistence than other firms, resulting in a larger coefficient on Xt, or for
financially weaker firms, bv might be relatively more important for valuation than Xt t.
Such relationships may weaken the significance of the cross sectional model, but will
be compensated for in the panel data model.
The other information variable, vt, can be either other financial statement information,
or any other publicly available information. Other information vt is estimated using
dividends as a proxy following the results of Cheng and McNamara (2000) and
Garrod and Rees (1998). Dividends as a form of information are particularly
important on the Johannesburg Securities Exchange, as in other emerging markets,
where liquidity is important, and markets tend to be dividend driven. The use of
brokers consensus forecasts was considered, but due to a lack of both historical and
complete forecasts, it was concluded that dividends would provide a more robust
result. The results of the regressions support this approach. Changes in dividends are
used to avoid conflict with the abnormal earnings variable. Other information is
defined as:
V = DPS – DPSt t t-1
Collinearity between abnormal earnings and abnormal dividends should not be an
issue, as earnings are accrual earnings, and dividends per share are only movement in
dividends, and therefore only represent the informational effect.
As the model is essentially predictive using historical information, a problem of leads
and lags is present for the dependent variable Pt. The study therefore uses share prices
three months after each company’s year-end to allow for the publication and analysis
of historic financial statements. This period has been chosen in spite of the
assumption of the efficient market hypothesis, and evidence of efficiency of the
Johannesburg Securities Exchange, due to the time lag in preparation, audit, and
publication of the annual financial statements. The Johannesburg Securities Exchange
requires results to be published within three months of year end, and therefore this
period was considered to be appropriate.
53
3.3.2 Panel data
A panel data approach has been used in a second regression model to analyze both the
inter-firm and inter-temporal variations in the data. According to Baltagi and Badi
(2001), panel data holds a number of advantages over using only cross sectional data
or time series data. First, panel data controls unobserved variables much better by
either removing the observations, or by providing more instruments. Second, panel
data allows dynamic models with lagged response variables and regressors. Third,
where cross sectional models show a snapshot at a given time, panel data shows
whether the cross section image is stable over time.
Both time-series and cross sectional studies do not control for heterogeneity and
therefore run the risk of biased results. Panel data is able to control for individual
heterogeneity. To illustrate, consider the resources sector in this study. The sector
typically has a larger investment in capital assets than most other sectors, and
therefore a high book value. Controlling for the resource sector in a cross sectional
study may be done with a dummy variable which has the effect of removing the
observations from the regression. Panel data is able to control for all sector specific
characteristics without omitting the variables. According to Baltagi and Badi (2001),
panel data provides more informative data, more variability, less collinearity among
the variables, more degrees of freedom and more efficiency. Panel data is also able to
study the dynamics of adjustment, and is better able to identify and measure effects
that are not detectable in pure cross section or time series data. The effect is that the
panel data analysis will include industry specific anomalies in the variables, and will
compensate for events which affect all firms in a given year, such as changes in
generally accepted accounting practice, which may affect the predicting variables.
The panel data model tries to go further in the quantitative analysis by following the
aggregate approach, and takes into account not only time and cross-sectional
dimensions of the panels, but also the nesting effects caused by the division of
companies into sectors. The unit of analysis is a company, but companies are grouped
in a natural way into larger divisions – sectors, where the behavior of two intra-sector
companies have more in common than that of two companies in different sectors.
54
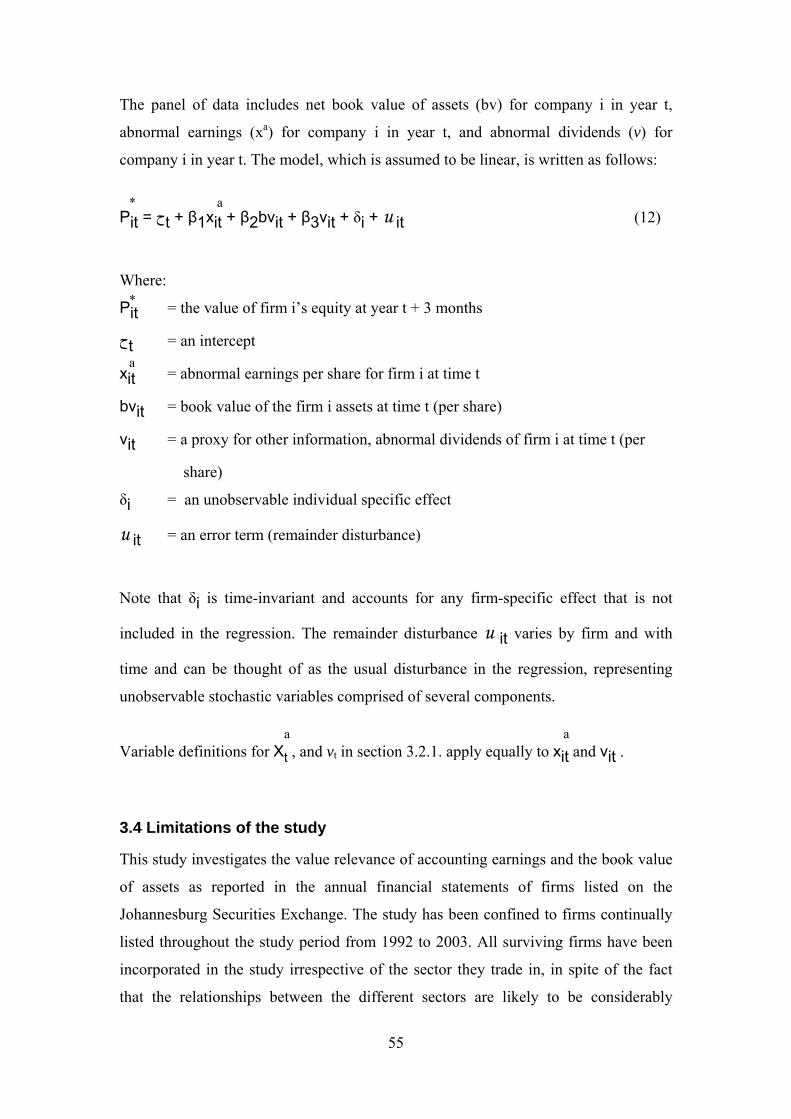
The panel of data includes net book value of assets (bv) for company i in year t,
abnormal earnings (xa) for company i in year t, and abnormal dividends (v) for
company i in year t. The model, which is assumed to be linear, is written as follows:
Pit = حt + β1xit + β2bvit + β3vit + δi + u it (12) * a
Where:
Pit = the value of firm i’s equity at year t + 3 months *
t = an interceptح
xit = abnormal earnings per share for firm i at time t a
bvit = book value of the firm i assets at time t (per share)
vit = a proxy for other information, abnormal dividends of firm i at time t (per
share)
δi = an unobservable individual specific effect
u it = an error term (remainder disturbance)
Note that δi is time-invariant and accounts for any firm-specific effect that is not
included in the regression. The remainder disturbance u it varies by firm and with
time and can be thought of as the usual disturbance in the regression, representing
unobservable stochastic variables comprised of several components.
Variable definitions for Xt , and v a
in section 3.2.1. apply equally to xit and vit . a
t
3.4 Limitations of the study
This study investigates the value relevance of accounting earnings and the book value
of assets as reported in the annual financial statements of firms listed on the
Johannesburg Securities Exchange. The study has been confined to firms continually
listed throughout the study period from 1992 to 2003. All surviving firms have been
incorporated in the study irrespective of the sector they trade in, in spite of the fact
that the relationships between the different sectors are likely to be considerably
55
different. The panel data approach used in this study is able to take such sector
influence into account in generating the panel data output by grouping sectors
together where relationships are detected. As only surviving firms are included,
survivorship bias is a limitation of this study.
This study does not attempt to include the impact of other factors in the market, which
could influence the share price, but which are not included in the three predicting
variables. Such other variables are considered to be outside the scope of this research
report, and will be reflected in the error terms of the respective models, and will be
evidenced in the measures of fit of the models.
3.5 The Hypothesis
The research problem of this study is to determine whether the Ohlson (1995)
valuation model is significant in an emerging market setting, and in particular in
South Africa. The research problem is therefore to determine the explanatory power
of book values, accrual based earnings, and dividends in predicting share price.
The hypothesis for the value relevance of accounting earnings, book value, and
abnormal dividends to share price is:
H0 : The Book Value of assets, earnings, and abnormal dividends are significantly
related to share price.
H1 : The Book Value of assets, earnings, and abnormal dividends are not
significantly related to share price.
Value relevant can be defined as when an accounting amount is associated with some
measure of value, in this study, share price. If the amount significantly increases the
power of the estimating equation to explain the equity value, then it must be relevant,
and measured with at least some reliability. If it is not relevant, there would be no
relation with equity value. If the amount contains significant measurement errors, then
there will be no statistical relation.
56
3.6 Data selection
The data required to test the research problem consists of a population of all
companies share prices, accounting earnings, book values, and dividends per share
(other information) in the period from 1992 to 2003. Data analysis is based on
Equation 11 for the cross sectional analysis, and Equation 12 for the panel data
analysis. The standard t-statistic is used to determine the value relevance of each of
the variables, and the coefficient of determination (r2) is used to measure the model
fit.
Cross sectional financial statement data for all Johannesburg Securities Exchange
listed firms was obtained from a BFA McGregor database, and from publicly
available annual financial statements of the companies (also extracted from the BFA
database). Financial statement data included categories of assets, weighted average
shares, cash dividends, earnings per share, profits attributable to ordinary
shareholders, price earnings and price to book ratios. Month end share prices,
financial year-end, and sector data were also extracted from the database. Year-end
details were used to obtain share prices for three months after year-end to allow lead
for dissemination and adjustment for information to ensure the predictive power of the
model.
The population selection criterion for this study is as follows:
• Assets, weighted average shares, cash dividends, earnings per share, profits
attributable to ordinary shareholders, price earnings and price to book ratios
and month end share prices must be available on the McGregor BFA data
resource.
• Cases with missing data were eliminated.
• Non surviving firms were eliminated from the sample in order to provide data
for a balanced panel.
• In line with Collins, Maydew, and Weiss (1997), to control for extreme
observation, the sample was trimmed for outliers by eliminating the top and
bottom two percent of observations of either abnormal earnings per share,
book value per share, or abnormal dividends per share.
57
The selection process decreased the sample of companies to 129 firms over a period
of 12 years, which provides 1 548 year-end observations. To maintain comparability
across tables and figures, all tests in this study were performed using the final sample
of 129 firms, and 1 548 year end observations.
Panel data uses stacked cross-sectional data with time-series identifiers. The primary
reason for using this data arrangement is its ability to allow lag processing. Annual
dated panels with regular frequency have been used in a regular balanced panel
arrangement. No internal balancing was necessary as only companies surviving
through the entire period were included in the sample.
3.7 Methodology
The basic tests of the Ohlson (1995) model involve performing regressions using the
valuation models noted in the previous chapter, to determine whether the valuation
models reliably predicts the share price. Two regression models will be tested. The
first model uses equation 11 and performs a cross sectional analysis on a yearly basis.
The results for each year are evaluated separately, and then compared to the results of
other years to identify any obvious time series trends. The second model uses a panel
data approach, based on equation 12, combining both cross sectional and time series
data in a single valuation model, thereby evaluating both cross sectional and time
series relationships.
Consideration will be given to methodological issues (model specification, sample
size), data screening issues (including the detection of outliers), model estimation and
model re-specification.
3.7.1 Calculation of abnormal earnings
In order to calculate abnormal earnings, normal earnings were first extracted, using
earnings after interest and taxation. As discussed in Chapter 2, three alternative
surrogates for cost of capital were considered.
58
First, the risk free rate was considered, using monthly treasury bill rates. Use of the
risk free rate is theoretically inferior as it does not incorporate any measurement of
risk. Results from both panel data and cross sectional data confirmed this inferiority
through weaker significance (measured by t-statistic) in the predictive variable.
Second, the book to market ratio was considered in line with Cheng and McNamara
(2000), but was also found to display a weaker predictive significance. Third, price
earnings was considered, also in line with Cheng and McNamara (2000), displaying
the strongest relationship for abnormal earnings in predicting share price three months
after year end, thereby validating its use as the surrogate for cost of capital. A final
test was performed using a combined price earnings and book to market ratio. Results
however displayed an inferior relationship to that of price earnings alone. This study
therefore adopts price earnings as a surrogate for cost of capital in determining
abnormal earnings.
Total earnings extracted from the BFA McGregor datastream is in the form of
earnings after interest and taxation. In order to obtain abnormal earnings, normal
earnings have been subtracted. As interest and taxation have already been subtracted
in the base figure, normal earnings is determined using the cost of capital as discussed
above, multiplied by the asset base. The asset base used in determining normal
earnings is total assets less total liabilities, to avoid double counting on the cost of
interest.
3.7.2 Calculation of abnormal dividends
In order to isolate the informational content of dividends from the earnings influence,
abnormal dividends have been calculated by subtracting the previous year’s dividend
from current year dividend, yielding changes in dividends. Such information is then
used in line with the signaling theory of dividends as a surrogate for other
information.
Dividends include only cash dividends which provide stronger information to
shareholders in line with signaling theory. Any script dividends, or non cash dividend
equivalents were, therefore, excluded. Although useful as a surrogate, abnormal
dividends is not intended to quantify all other information, and such other information
59
which has not been quantified, is considered to be a limitation of this study, but does
not affect the validity or outcome.
3.8 Summary
The first section of this chapter specifies the Ohlson (1995) valuation model as a base
for the multiple regression models used to investigate the determinants of share price,
and outlines the research environment (on the Johannesburg Securities Exchange). In
the second section, the multiple regression and panel data models were introduced,
including the detailed specification of the variables within the models. Thereafter, an
explanation was provided as to how the critical questions in the research report are
analyzed. The research method was discussed in the third section, while the general
assumptions and delimitations are explored in the fourth section. The hypotheses of
the study for book value of assets and accounting (accrual) earnings are developed in
the fifth section based on the discussion in the previous chapter (literature review),
and data and sample selection issues are discussed in section six. Data and
methodological issues of the study are discussed in section 7. The specification and
calculation of the abnormal earnings and abnormal dividend variables are also
discussed. The next chapter discusses the results of the regression models, and is
followed by a summary and conclusion.
60
Chapter IV : Results and Discussion
4.1 Introduction
As noted in the previous chapters, limited research on the determinants of firm value
has been performed in emerging markets, and in particular in South Africa, no works
have been published attempting to estimate firm value using the Ohlson (1995) model,
or a version of the model. This study will assist in developing an understanding of the
determinants of firm value in an emerging market setting, and provide insight into the
differences, if any, in valuing firms in developed and emerging markets. It will
determine whether information included in financial statements is value relevant. The
results of applying the cross sectional and panel data models to the South African
database are set out in this chapter. All calculations were performed using e-views 5.1
for windows.
4.2 Overall results
4.2.1 Cross sectional model
The estimates for the cross sectional coefficients on a yearly basis are gathered in
Table 1, representing separate cross sectional regressions performed on each of the 12
years. An analysis of the t values is summarized in the Table 2 below.
61
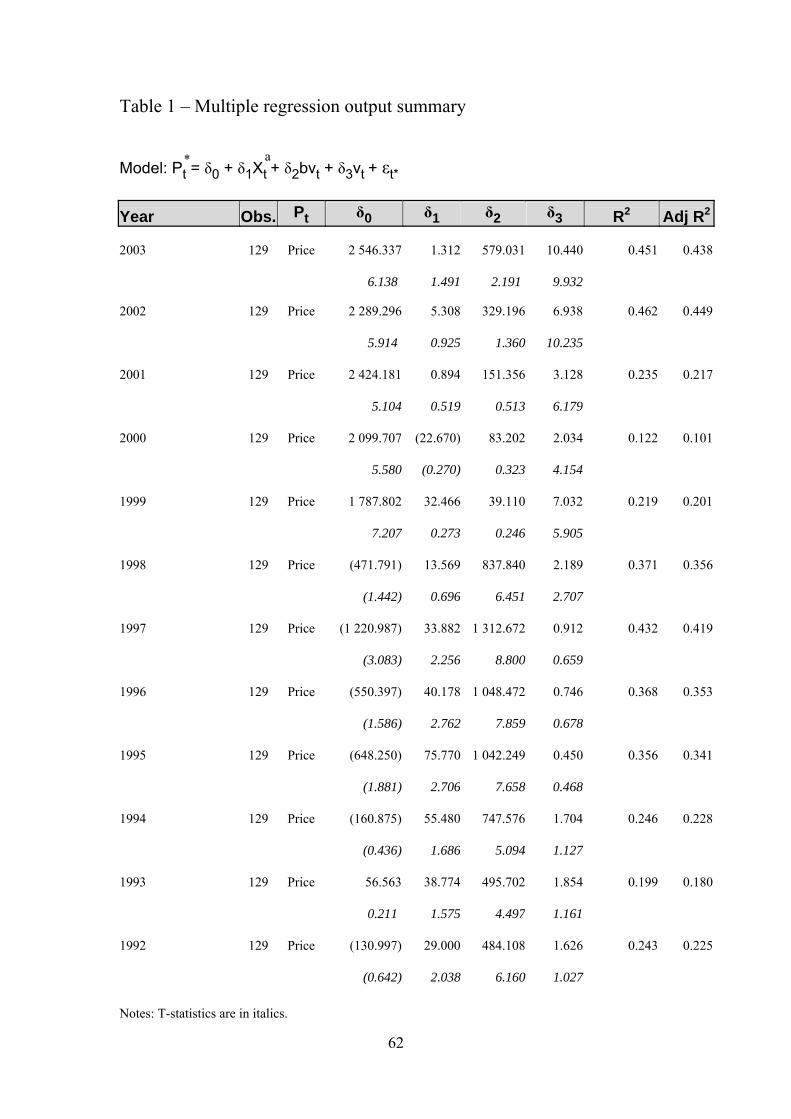
Table 1 – Multiple regression output summary
Model: Pt = δ0 + δ1Xt + δ2bvt + δ3vt + εt*
a *
Year Obs. Pt δ0 δ1 δ2 δ3 R2 Adj R2
2003 129 Price 2 546.337 1.312 579.031 10.440 0.451 0.438
1.491 6.138 2.191 9.932
2002 129 Price 2 289.296 5.308 329.196 6.938 0.462 0.449
0.925 5.914 1.360 10.235
2001 129 Price 2 424.181 0.894 151.356 3.128 0.235 0.217
0.519 5.104 0.513 6.179
2000 129 Price 2 099.707 (22.670) 83.202 2.034 0.122 0.101
(0.270) 5.580 0.323 4.154
1999 129 Price 1 787.802 32.466 39.110 7.032 0.219 0.201
0.273 7.207 0.246 5.905
1998 129 Price (471.791) 13.569 837.840 2.189 0.371 0.356
0.696 (1.442) 6.451 2.707
1997 129 Price (1 220.987) 33.882 1 312.672 0.912 0.432 0.419
(3.083) 2.256 8.800 0.659
1996 129 Price (550.397) 40.178 1 048.472 0.746 0.368 0.353
(1.586) 2.762 7.859 0.678
1995 129 Price (648.250) 75.770 1 042.249 0.450 0.356 0.341
(1.881) 2.706 7.658 0.468
55.480 1994 129 Price (160.875) 747.576 1.704 0.246 0.228
(0.436) 1.686 5.094 1.127
38.774 1993 129 Price 56.563 495.702 1.854 0.199 0.180
0.211 1.575 4.497 1.161
29.000 1992 129 Price (130.997) 484.108 1.626 0.243 0.225
(0.642) 2.038 6.160 1.027 Notes: T-statistics are in italics.
62
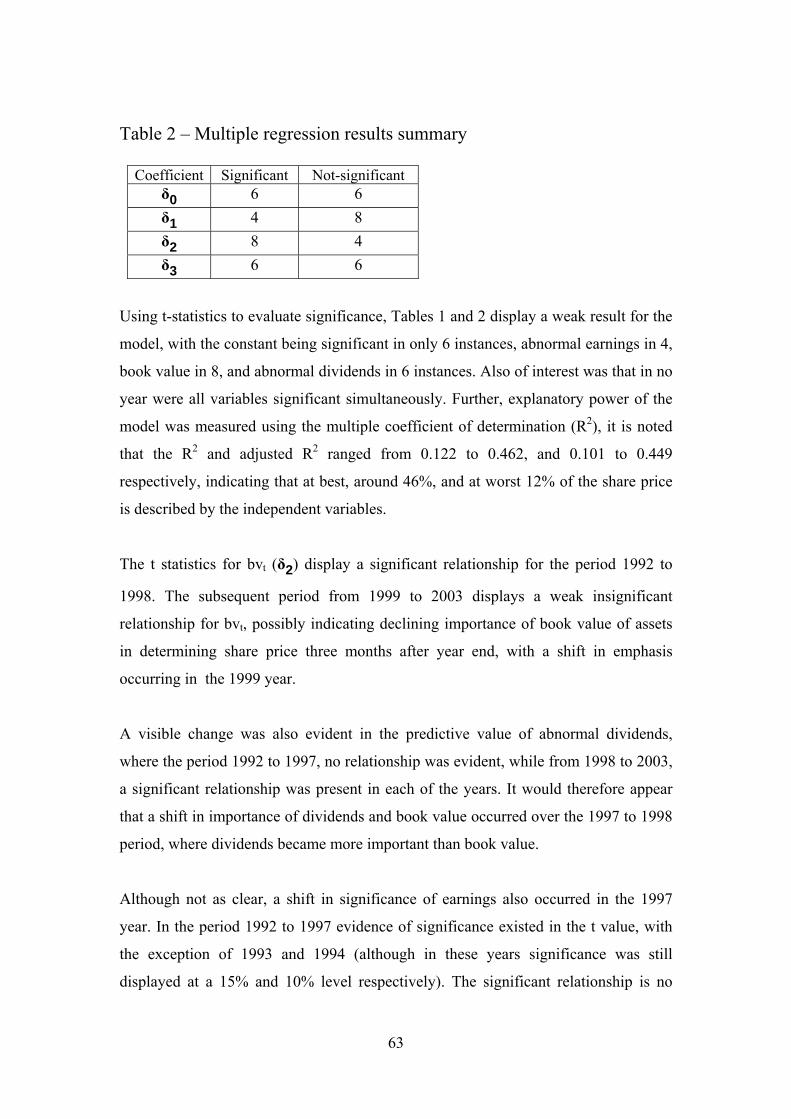
Table 2 – Multiple regression results summary
Coefficient Significant Not-significant δ0 6 6 δ1 4 8 δ2 8 4 δ3 6 6
Using t-statistics to evaluate significance, Tables 1 and 2 display a weak result for the
model, with the constant being significant in only 6 instances, abnormal earnings in 4,
book value in 8, and abnormal dividends in 6 instances. Also of interest was that in no
year were all variables significant simultaneously. Further, explanatory power of the
model was measured using the multiple coefficient of determination (R2), it is noted
that the R2 and adjusted R2 ranged from 0.122 to 0.462, and 0.101 to 0.449
respectively, indicating that at best, around 46%, and at worst 12% of the share price
is described by the independent variables.
The t statistics for bvt (δ2) display a significant relationship for the period 1992 to
1998. The subsequent period from 1999 to 2003 displays a weak insignificant
relationship for bvt, possibly indicating declining importance of book value of assets
in determining share price three months after year end, with a shift in emphasis
occurring in the 1999 year.
A visible change was also evident in the predictive value of abnormal dividends,
where the period 1992 to 1997, no relationship was evident, while from 1998 to 2003,
a significant relationship was present in each of the years. It would therefore appear
that a shift in importance of dividends and book value occurred over the 1997 to 1998
period, where dividends became more important than book value.
Although not as clear, a shift in significance of earnings also occurred in the 1997
year. In the period 1992 to 1997 evidence of significance existed in the t value, with
the exception of 1993 and 1994 (although in these years significance was still
displayed at a 15% and 10% level respectively). The significant relationship is no
63
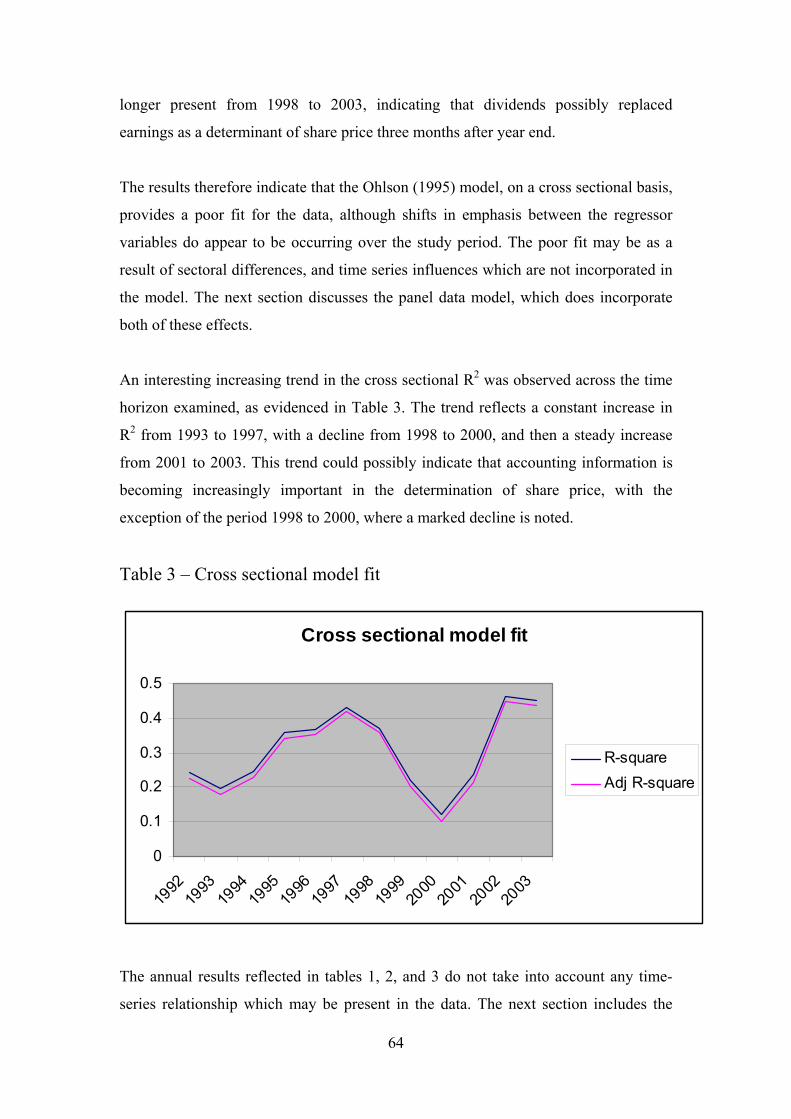
longer present from 1998 to 2003, indicating that dividends possibly replaced
earnings as a determinant of share price three months after year end.
The results therefore indicate that the Ohlson (1995) model, on a cross sectional basis,
provides a poor fit for the data, although shifts in emphasis between the regressor
variables do appear to be occurring over the study period. The poor fit may be as a
result of sectoral differences, and time series influences which are not incorporated in
the model. The next section discusses the panel data model, which does incorporate
both of these effects.
An interesting increasing trend in the cross sectional R2 was observed across the time
horizon examined, as evidenced in Table 3. The trend reflects a constant increase in
R2 from 1993 to 1997, with a decline from 1998 to 2000, and then a steady increase
from 2001 to 2003. This trend could possibly indicate that accounting information is
becoming increasingly important in the determination of share price, with the
exception of the period 1998 to 2000, where a marked decline is noted.
Table 3 – Cross sectional model fit
Cross sectional model fit
0
0.1
0.2
0.3
0.4
0.5
1992
1993
1994
1995
1996
1997
1998
1999
2000
2001
2002
2003
R-squareAdj R-square
The annual results reflected in tables 1, 2, and 3 do not take into account any time-
series relationship which may be present in the data. The next section includes the
64
time-series effects in a panel data model. Before the panel data approach was applied,
the data was adjusted as stated below, and the panel data effect was approximated
using the multiple regression models used above in order to provide credibility to the
panel data result.
This approach should not provide a result as strong as the panel data approach, as
panel data compensates and includes nested effects across the time series and cross
sectional data (Gujarati and Damodar, 2003). The approach therefore uses a multiple
regression model, and brings in the time series effect by using dummy variables to
identify each of the different years. The data was converted to real terms using the
producer price index obtained for Statistic South Africa, and all observations were
then included in the sample, providing a sample size of 1,548 observations.
The results of the multiple regression model are presented in Table 4. The results
reflect that all the regressors have a positive, statistically significant, and robust effect
on the dependent variable, with the exception of the constant, which does not display
a significant relationship as is reflected by the t-statistic of 0.426432. The equation
explains around 23% of the variation in share price over the sample period, indicating
a weak relationship for the model as a whole, although this does not invalidate the
significance of the individual regressors. The results are weaker than the panel data
model results as documented in the next section, as was expected. In addition, all
coefficient estimates are of the expected signs and all of them are significantly
different from zero at reasonable confidence levels.
65
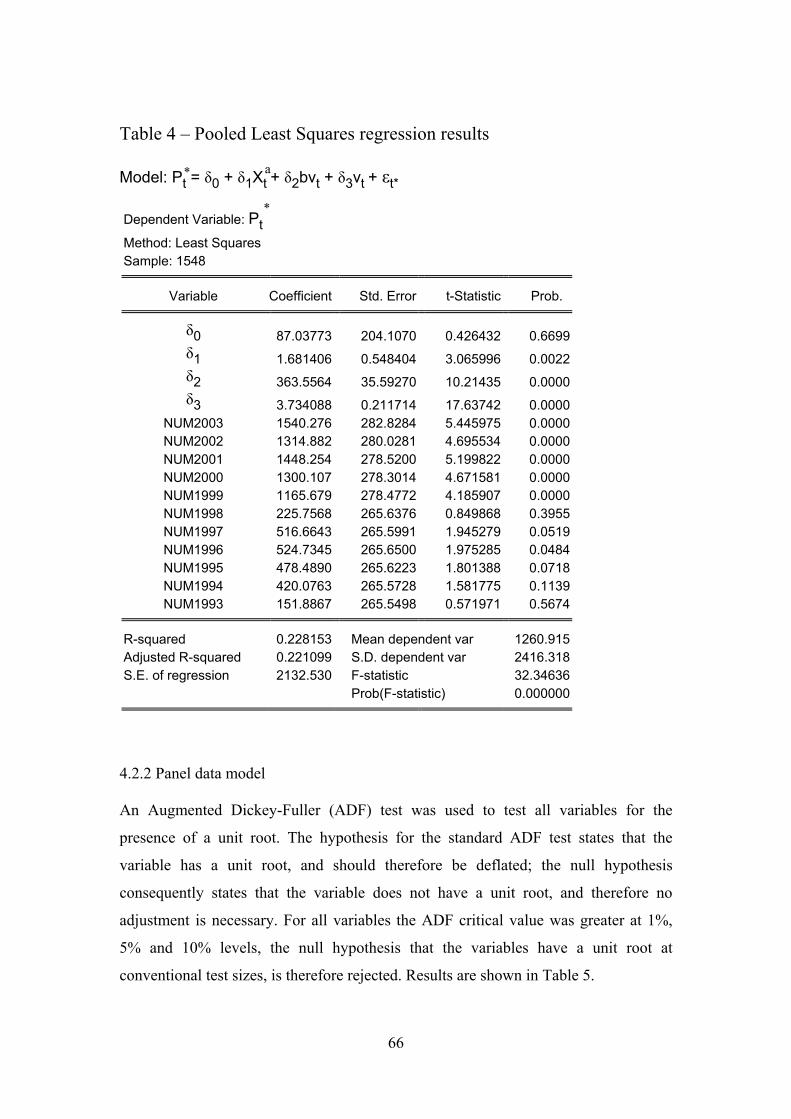
Table 4 – Pooled Least Squares regression results
Model: Pt = δ0 + δ1Xt + δ2bvt + δ3vt + εt*
a *
Dependent Variable: Pt *
Method: Least Squares Sample: 1548
Variable Coefficient Std. Error t-Statistic Prob.
δ0 87.03773 204.1070 0.426432 0.6699 δ1 1.681406 0.548404 3.065996 0.0022 δ2 363.5564 35.59270 10.21435 0.0000 δ3 3.734088 0.211714 17.63742 0.0000
NUM2003 1540.276 282.8284 5.445975 0.0000 NUM2002 1314.882 280.0281 4.695534 0.0000 NUM2001 1448.254 278.5200 5.199822 0.0000 NUM2000 1300.107 278.3014 4.671581 0.0000 NUM1999 1165.679 278.4772 4.185907 0.0000 NUM1998 225.7568 265.6376 0.849868 0.3955 NUM1997 516.6643 265.5991 1.945279 0.0519 NUM1996 524.7345 265.6500 1.975285 0.0484 NUM1995 478.4890 265.6223 1.801388 0.0718 NUM1994 420.0763 265.5728 1.581775 0.1139 NUM1993 151.8867 265.5498 0.571971 0.5674
R-squared 0.228153 Mean dependent var 1260.915 Adjusted R-squared 0.221099 S.D. dependent var 2416.318 S.E. of regression 2132.530 F-statistic 32.34636 Prob(F-statistic) 0.000000
4.2.2 Panel data model
An Augmented Dickey-Fuller (ADF) test was used to test all variables for the
presence of a unit root. The hypothesis for the standard ADF test states that the
variable has a unit root, and should therefore be deflated; the null hypothesis
consequently states that the variable does not have a unit root, and therefore no
adjustment is necessary. For all variables the ADF critical value was greater at 1%,
5% and 10% levels, the null hypothesis that the variables have a unit root at
conventional test sizes, is therefore rejected. Results are shown in Table 5.
66
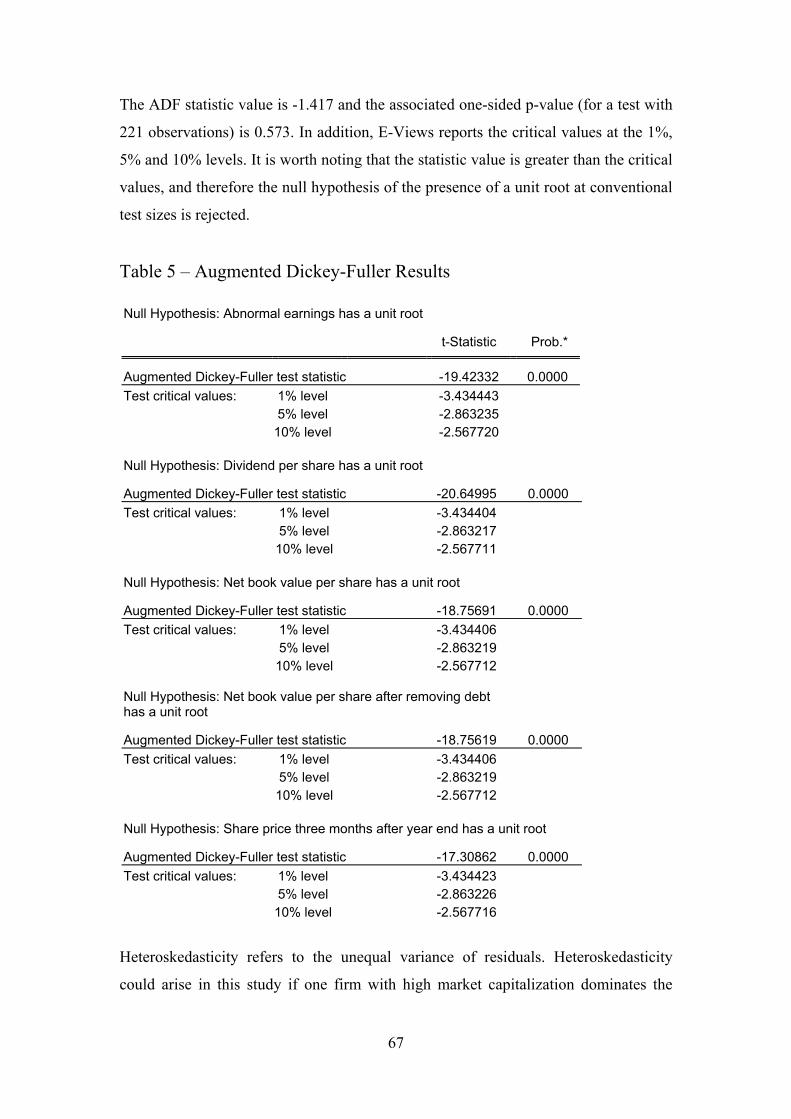
The ADF statistic value is -1.417 and the associated one-sided p-value (for a test with
221 observations) is 0.573. In addition, E-Views reports the critical values at the 1%,
5% and 10% levels. It is worth noting that the statistic value is greater than the critical
values, and therefore the null hypothesis of the presence of a unit root at conventional
test sizes is rejected.
Table 5 – Augmented Dickey-Fuller Results
Null Hypothesis: Abnormal earnings has a unit root
t-Statistic Prob.*
Augmented Dickey-Fuller test statistic -19.42332 0.0000 Test critical values: 1% level -3.434443
5% level -2.863235 10% level -2.567720
Null Hypothesis: Dividend per share has a unit root
Augmented Dickey-Fuller test statistic -20.64995 0.0000 Test critical values: 1% level -3.434404
5% level -2.863217 10% level -2.567711
Null Hypothesis: Net book value per share has a unit root
Augmented Dickey-Fuller test statistic -18.75691 0.0000 Test critical values: 1% level -3.434406
5% level -2.863219 10% level -2.567712
Null Hypothesis: Net book value per share after removing debt has a unit root
Augmented Dickey-Fuller test statistic -18.75619 0.0000 Test critical values: 1% level -3.434406
5% level -2.863219 10% level -2.567712
Null Hypothesis: Share price three months after year end has a unit root
Augmented Dickey-Fuller test statistic -17.30862 0.0000 Test critical values: 1% level -3.434423
5% level -2.863226 10% level -2.567716
Heteroskedasticity refers to the unequal variance of residuals. Heteroskedasticity
could arise in this study if one firm with high market capitalization dominates the
67
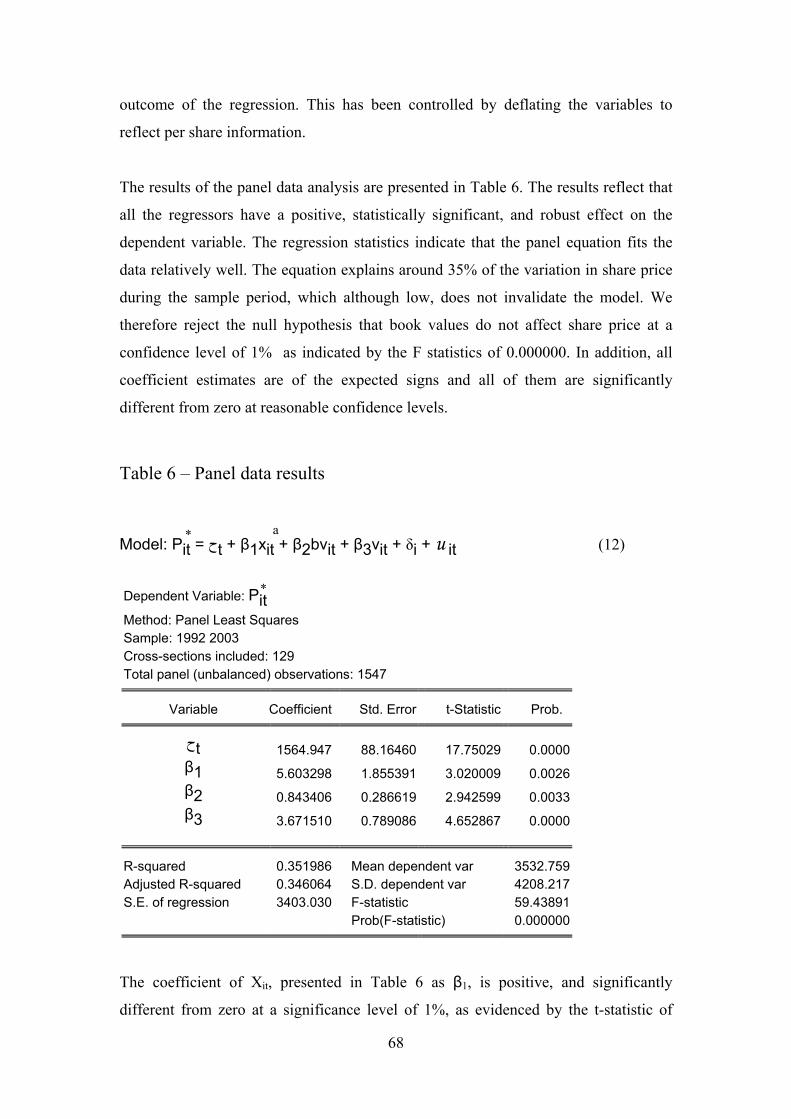
outcome of the regression. This has been controlled by deflating the variables to
reflect per share information.
The results of the panel data analysis are presented in Table 6. The results reflect that
all the regressors have a positive, statistically significant, and robust effect on the
dependent variable. The regression statistics indicate that the panel equation fits the
data relatively well. The equation explains around 35% of the variation in share price
during the sample period, which although low, does not invalidate the model. We
therefore reject the null hypothesis that book values do not affect share price at a
confidence level of 1% as indicated by the F statistics of 0.000000. In addition, all
coefficient estimates are of the expected signs and all of them are significantly
different from zero at reasonable confidence levels.
Table 6 – Panel data results
Model: Pit = حt + β1xit + β2bvit + β3vit + δi + u it (12) a *
Dependent Variable: Pit
*
Method: Panel Least Squares Sample: 1992 2003 Cross-sections included: 129 Total panel (unbalanced) observations: 1547
Variable Coefficient Std. Error t-Statistic Prob.
t 1564.947ح 88.16460 17.75029 0.0000 β1 5.603298 1.855391 3.020009 0.0026 β2 0.843406 0.286619 2.942599 0.0033 β3 3.671510 0.789086 4.652867 0.0000
R-squared 0.351986 Mean dependent var 3532.759 Adjusted R-squared 0.346064 S.D. dependent var 4208.217 S.E. of regression 3403.030 F-statistic 59.43891 Prob(F-statistic) 0.000000
The coefficient of Xit, presented in Table 6 as β1, is positive, and significantly
different from zero at a significance level of 1%, as evidenced by the t-statistic of
68
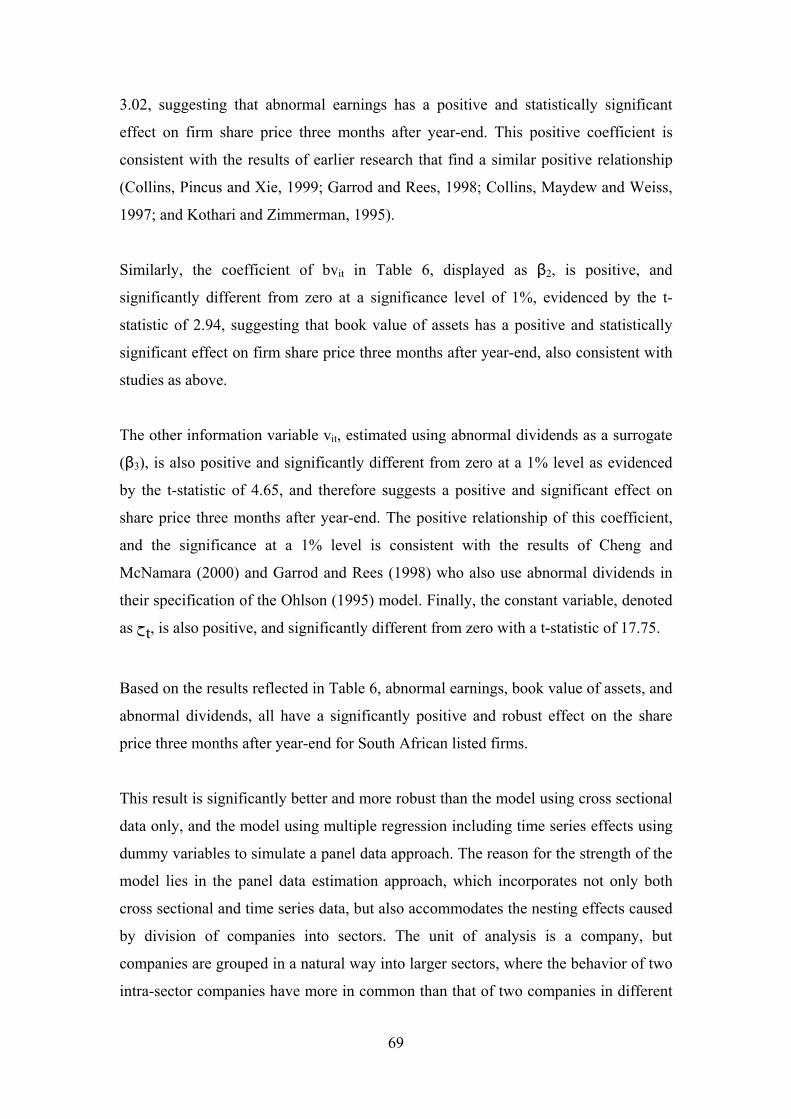
3.02, suggesting that abnormal earnings has a positive and statistically significant
effect on firm share price three months after year-end. This positive coefficient is
consistent with the results of earlier research that find a similar positive relationship
(Collins, Pincus and Xie, 1999; Garrod and Rees, 1998; Collins, Maydew and Weiss,
1997; and Kothari and Zimmerman, 1995).
Similarly, the coefficient of bvit in Table 6, displayed as β2, is positive, and
significantly different from zero at a significance level of 1%, evidenced by the t-
statistic of 2.94, suggesting that book value of assets has a positive and statistically
significant effect on firm share price three months after year-end, also consistent with
studies as above.
The other information variable vit, estimated using abnormal dividends as a surrogate
(β3), is also positive and significantly different from zero at a 1% level as evidenced
by the t-statistic of 4.65, and therefore suggests a positive and significant effect on
share price three months after year-end. The positive relationship of this coefficient,
and the significance at a 1% level is consistent with the results of Cheng and
McNamara (2000) and Garrod and Rees (1998) who also use abnormal dividends in
their specification of the Ohlson (1995) model. Finally, the constant variable, denoted
as حt, is also positive, and significantly different from zero with a t-statistic of 17.75.
Based on the results reflected in Table 6, abnormal earnings, book value of assets, and
abnormal dividends, all have a significantly positive and robust effect on the share
price three months after year-end for South African listed firms.
This result is significantly better and more robust than the model using cross sectional
data only, and the model using multiple regression including time series effects using
dummy variables to simulate a panel data approach. The reason for the strength of the
model lies in the panel data estimation approach, which incorporates not only both
cross sectional and time series data, but also accommodates the nesting effects caused
by division of companies into sectors. The unit of analysis is a company, but
companies are grouped in a natural way into larger sectors, where the behavior of two
intra-sector companies have more in common than that of two companies in different
69
sectors. Panel data also compensates for specific cross sectional biases caused by
unusual events or circumstances in a single year, such as changes in accounting
regulations in a specific year, which would distort a time series analysis.
The results of this study are, therefore, in line with previous studies in developed
markets testing the Ohlson (1995) model such as Collins, Pincus and Xie (1999);
Garrod and Rees (1998); Collins, Maydew and Weiss (1997); and Kothari and
Zimmerman (1995). The results confirm the value relevance of book numbers, and
support the value relevance of financial statements in determining share price.
The study also has research implications, indicating that it is necessary for researchers
using the Ohlson (1995) model to either use a panel data approach, or to be mindful of
the effect of time series relationships in any cross sectional model, although the use of
a cross sectional model is not recommended in an emerging market setting. Secondly,
researchers should be aware of the specification problems when choosing a surrogate
for the other information variable. Although this study finds a strong relationship
when using abnormal dividends, it is clear from the measure of model fit (R2 and
adjusted R2) presented in Table 6, that there are other variables not included in the
model which also affect share prices three months after year-end which need to be
added to the model. Although the R2 of 0.352 and adjusted R2 of 0.346 indicates that
the predictive power of the model is low, the purpose of this study was not to provide
a comprehensive valuation model, instead, it sought to validate or invalidate the
Ohlson (1995) model as a base for a fully specified valuation model, and for the
model being value relevant, which has been achieved.
4.3 Summary
The results from applying the cross sectional model indicated a weak relationship
with all predicting variables across the 12 year period. Looking at each year
individually, in none of the years were all three variables and the constant significant
at a 1% confidence level. The panel data model, however, revealed a robust positive
and significant relationship between all three regressors and the dependent variable.
The panel data model incorporated cross sectional, time series, and nested effects,
resulting in a strong overall relationship over the 12 years.
70
The R2 and adjusted R2 of the panel data model does however reflect that there are
other variables that should be included in the model in order to provide a more robust
predictive model, but the results do confirm that the Ohlson model, using book values,
provides rigorous conceptual foundation for regressions of equity values, and
therefore a point of departure for further valuation studies in South Africa.
Finally, the overall findings on the value relevance of the book value of assets,
accounting earnings, and abnormal dividends, is consistent with international studies
performed in developed markets, such as Collins, Pincus and Xie (1999); Garrod and
Rees (1998); Collins, Maydew and Weiss (1997); and Kothari and Zimmerman
(1995). These studies found significant relationships for book value of assets and
accounting earnings, while Cheng and McNamara (2000) and Garrod and Rees (1998)
similarly found a significant relationship for abnormal dividends. The results obtained
and conclusions reached in developed market settings therefore are mirrored in an
emerging market setting.
The next chapter concludes the research report, discusses the limitations of the study,
and provides suggestions for future research.
71
Chapter V : Summary and Conclusion
5.1 Summary
This empirical study had as its objective the determination of the value relevance of
the book value of assets, accounting earnings, and cash dividends using the Ohlson
(1995) model. There are no previous studies that have been performed on the
Johannesburg Securities Exchange using the Ohlson (1995) or similar value relevance
research. A review of the literature was performed in chapter two, including a
description of the conceptual foundation of the Ohlson (1995) model, subsequent
refinements and developments, as well as criticism and adaptations of the valuation
model. The empirical history of the model in various markets and in different
contextual settings was examined, followed by a review of the regulatory environment
in which book value information is prepared.
In chapter three the research methodology was discussed, including the background of
the valuation model, the research methods applied, and the limitations and
delimitations of the study. The three variables were defined as being abnormal
earnings, calculated by charging normal earnings with a cost of capital estimated
using the price earnings ratio, book value of assets, and abnormal dividends,
determined by taking the difference in dividends from year to year in order to isolate
the information content of the dividend. Chapter three also discusses the data,
determination of the population, and defining of study periods. The study was limited
to surviving JSE listed firms over the period from 1992 to 2003. The size of the
sample for this research report was 129 firms, over a 12 year period, consisting of
1 548 year end observations.
Chapter four sets out the findings, starting with the cross sectional model, followed by
the panel data model.
5.2 Results
This study investigates the value relevance of accounting data in determining share
price using the Ohlson (1995) valuation model. The results indicate that using a cross
72
sectional model that incorporates abnormal earnings, net book value and abnormal
dividends, displays a weak relationship in providing information relevant to the
establishment of market prices. However, when using a panel data approach
incorporating cross sectional, time series and nested effects, there is evidence of
statistically significant, robust, positive relationships for accounting earnings, book
value of assets, and abnormal dividends in predicting firm value. All independent
variables therefore prove information relevant to the establishment of market prices in
an emerging market environment.
The inclusion of a time series analysis may be distorted by fundamental changes in
the structure or operational nature of companies during the period which may lead to
changes in the risk profile and financial relationships as measured in the model. The
incorporation of such changes are considered to be beyond the scope of this study, and
are therefore accepted as being reflected in a decreased measure of fit for the model.
5.3 Conclusion
The overall results support the hypothesis that book value of assets, earnings, and
abnormal dividends are significantly related to share price. Although a significant
relationship exists, the presence of other factors which affect the other information
variable should be acknowledged. The poor fit in both the cross sectional and panel
data models suggests that the model should not be used for predictive purposes. The
Ohlson (1995) model does however provide a robust point of departure for such
further works.
5.4 Limitations
The specification of abnormal dividends as a surrogate for the other information
variable is a considerable limitation of this study. Although the study validates the use
of the Ohlson (1995) model as a base for further valuation relevance research, it
admits that the complete specification of the other information variable is a
considerable task, and is not addressed in this research report.
73
Furthermore, the use of panel data, and resulting inclusion of time series relationships,
raises an additional concern regarding the presence of fundamental changes in the
structure and operational nature of companies that would undoubtedly lead to changes
in the risk profile and financial relationships (as measured in the model). Such
changes are of particular interest considering the significant structural changes which
have occurred in South Africa during the period of the study, including the abolition
of apartheid in the 1990’s, the installation of a democratic government, and financial
and stockmarket liberalization. The result of such structural changes on the
Johannesburg Securities Exchange are manifested in foreign listing and integration,
pyramid structures, and subsequent unbundlings, all of which would change company
structure significantly. Lastly, the limitations of financial reporting, and the quality of
information available in the annual financial statements has been questioned. The
results of this research however add weight to the argument in favour of the
usefulness of GAAP based financial statements as being value relevant.
5.5 Directions for future work
The annual financial statements do not only report earnings and the book value of
equity, they also report many other accounting information, such as various revenues
and expenses, and different assets and liabilities, each of which have different
measurement attributes and thus, different characteristics with respect to any
particular valuation model. Valuation differences can, therefore, arise between cash
flows and accruals, which can be viewed as two earnings components, and their
differential valuation implications are of a fundamental interest to accountants. This
study only focuses on the two summary measures, bv and Xt t. Dissagregation of these
measures following the proof thereof in this study provide a rich area for future
research, mainly in the area of discretionary accruals.
A second area for future research involves the specification of the other information
variable. There is little doubt that the use of abnormal dividends should be
complimented by further variables to incorporate other aspects of business.
74
References
AC 000. (1990). Framework for the preparation and presentation of financial
statements, South African Institute of Chartered Accountants, November.
Abarbanell, J. and Bushee, B. (1997). Fundamental Analysis, Future earnings and
Stock Prices. Journal of Accounting Research (Spring 1997), pp. 1-24.
Aboody, D., Barth, M.E., and Kasznik, R. (1999). Revaluations of Fixed Assets and
Future Firm Performance, Journal of Accounting and Economics 26, pp. 149-
178.
Aboody, D, Hughes, J, and Liu, J. (2002). Measuring Value Relevance in a (Possibly)
Inefficient Market, Journal of Accounting Research, Vol. 40, pp. 965-986.
Ackerlof, G. (1970). The Market for Lemons: Quality, Uncertainty and the Market
Mechanism, The Quarterly Journal of Economics. 84 (3), pp. 488-500.
Amir, E. (1993). The Market Evaluation of Accounting Information: The Case of
Postretirement Benefits Other Than Pensions. The Accounting Review. 68
(October 1993), pp. 703-724.
Amir, E. (1996). The Effect of Accounting Aggregation on the Value-Relevance of
Financial Disclosures: The Case of SFAS No. 106. The Accounting Review,
71 (October 1996), pp. 573-590.
Amir, E., Harris, T.S., and Venuti, E.K. (1993). A Comparison of the Value-
Relevance of U.S. Vs. Non-U.S. GAAP Accounting Measures Using Form 20-
F Reconciliations. Journal of Accounting Research 31 (supplement): 230-264.
Amir, E., and Lev, B. (1996). Value-Relevance of Non-financial information: The
Wireless Communications Industry. Journal of Accounting and Economics, 22
(August-December 1996), pp. 3-30.
Ball, R., and Brown, P. (1968). An empirical evaluation of accounting income
numbers. Journal of Accounting Research, Autumn, pp. 159-178.
75
Baltagi, G., and Badi H. (2001). Econometric analysis of panel data, 2nd ed.
Chichester ; New York : John Wiley.
Bao, B-H., and Chow, L. (1999). The Usefulness of Earnings and Book Value for
Equity Valuation in Emerging Capital Markets: Evidence from Listed
Companies in the People's Republic of China. Journal of International
Financial Management and Accounting, Vol. 10, No. 2, Summer 1999, pp. 85-
104.
Barth, M.E. (1991). Relative Measurement errors among alternative pension assets
and liability measures, The Accounting Review 66, pp. 433-463.
Barth, M. E. (2000). Valuation-based Accounting Research: Implications for
Financial Reporting and Opportunities for Future Research, Accounting and
Finance, Vol. 40, pp. 7-31.
Barth, M.E., Beaver, W.H., Hand, J.M., and Landsman, W.R. (2000). Accrual
Components, Earnings Forecasting, and Equity Values. Working paper,
University of North Carolina and Stanford University. Available online:
http://papers.ssrn.com/sol3/RefUsedIn.cfm?abid=227888.
Barth, M.E., Beaver, W.H., Hand, J.M., and Landsman, W.R. (1999). Accruals, Cash
Flows, and Equity Values, Review of Accounting Studies 3, pp. 205-229.
Barth, M. E., Beaver, W. H., and Landsman, W. R. (1992). The Market Valuation
Implications of Net Periodic Pension Cost Components, Journal of Accounting
and Economics 15, pp. 27-62.
Barth, M. E., Beaver, W. H., and Landsman, W. R. (1996). Value Relevance of Banks
Fair Value Disclosures Under SFAS 107, The Accounting Review 71, pp.
513-537.
Barth, M. E., Beaver, W. H., and Landsman, W. R. (1998). Relative Valuation Roles
of Equity Book Value and Net Income as a Function of Financial Health.
Journal of Accounting and Economics 25, pp. 1-34.
76
Barth, M. E., Beaver, W. H., and Landsman, W. R. (2001). The Relevance of the
Value Relevance Literature for Financial Accounting Standard Setting:
Another View, Journal of Accounting and Economics, Vol. 31, Nos. 1-3,
September 2001, pp. 326-365.
Barth, M.E. and Clinch, G. (1998). Revalued financial, tangible, and intangible assets:
Associations with share prices and non-market-based estimates. Journal of
Accounting Research 36, pp. 199-233.
Barth, M.E., and Kallapur, S. (1996).The Effects of Cross-sectional Scale Differences
on Regression Results in Empirical Accounting Research. Contemporary
Accounting Review, 13, pp. 527-567.
Beaver, W.H., and Ryan, S.G. (2000). Biases and Lags in Book Value and Their
Effects on the Ability of the Book-to-Market Ratio to Predict Book Return on
Equity, Journal of Accounting Research (Spring 2000), pp. 127-148.
Beeson, J.E., Sutherland, M.M., Ford, J.C., (2004). The evaluation of the management
of companies by stockmarket analysts and fund managers. SA Journal of
Accounting Research, Vol 18, No. 1, pp.1-24.
Berger, P.E., Ofek, E., and Swary, I. (1996). Investor Valuation of the Abandonment
Option. Journal of Financial Economics. 42: 257-287.
Bhana, N. (1991). Reaction of the Johannesburg Stock Exchange to major shifts in
dividend policy, South African Journal of Business Management, Voll 22, No.
3, pp. 33-40.
Bhattacharya, S., Pfleiderer P. (1983). A Note on Performance Evaluation, technical
report 714, Stanford University, Graduate School of Business.
Biger, N., Page M.J. (1993). Unit trusts’ performance: does the yardstick matter?,
Journal for Studies in Economics and Econometrics, 17(1), pp. 1-15.
Black, F. (1976). The Dividend Puzzle, Portfolio Management, Vol 2, pp. 5-8.
Bowie, D. C., and Bradfield, D. J. (1993). A review of systematic risk estimation on
the JSE. De Ratione, 7(1), pp.6-22.
77
Bowie, D.C., and Bradfield, D.J. (1998). Some Evidence on the Stability of Beta
coefficients on the JSE. South African Journal of Accounting Research 11 (2),
pp.1-19.
Bowie, D.C., and Bradfield, D.J., (1998). Robust Estimation of Beta Coefficients:
Evidence from a small stock market, Journal of Business Finance &
Accounting, 25 (3) & (4), pp. 439-454.
Bradfield, D.J. (1998). Measuring the selection and timing abilities of South African
fund managers. SA Journal of Accounting, Vol. 12, No. 1, pp. 1-13.
Bradfield, D.J. (1989). A note on the estimation problems caused by thin trading on
the Johannesburg Stock Exchange, De Ratione, Summer, pp. 22-25.
Bradfield, D., and Swartz, J. (2001). Recent evidence on the persistence of fund
performance – A note. SA Journal of Accounting research, No. 2 Vol. 15, pp.
99-109.
Brealey, R., and Meyers, S. (2003). Principles of Corporate Finance, Sixth edition.
McGraw Hill.
Brief, R., and Zarowin, P. (1999). The Value Relevance of Dividends, Book Value
and Earnings. (August 5, 1999). New York University Department of
Accounting Working Paper No. 99-3. Available online:
http://ssrn.com/abstract=173629.
Brown, S., Lo, K., and Lys, T. (2000). Use of R-squared in Accounting Research:
Measuring Changes in Value Relevance in the Last Four Decades, Journal of
Accounting and Economics 28, pp. 83-115.
Bruner, R.F., Conroy, R.M., Estrada, J., Kritzman, M., and Li, W., (2002).
Introduction to ‘Valuation in Emerging Markets’, Emerging Markets Review,
Volume 3, pp. 310-324.
Burgstahler, D., and Dichev, I. (1997). Earnings, Adaptation and Equity Value. The
Accounting Review. 72, pp. 187-215.
78
Cairns, A.J.G., (1999). A multifactor equilibrium model for the term structure and
inflation, Proceedings of the 9th International AFIR Colloquium, Tokyo, 93-
113.
Campbell, D.T. (1979). "Degrees of Freedom" and the Case Study. In T.D. Cook &
C.S. Reichardt, Eds., Qualitative and Quantatative Methods and Evaluation
Research, pp. 49-67.
Cheng, C.S.A., and McNamara, R. (2000). The Valuation Accuracy of the Price-
Earnings and Price-Book Benchmark Valuation Methods. Review of
Quantitative Finance and Accounting 15, pp. 349-370.
Cheng, C. S. A., Hwang, A. L. J., and Merchant, K.A. (2000). Using a Value Relevant
Prediction Approach to Assess Value Relevance of EVA-based Versus
GAAP-based Accounting Information. American Accounting Association
Conference Proceedings.
Collins, D. Pincus, M. and Xie, H. (1999). Equity Valuation and Negative Earnings:
The Role of Book Value of Equity, The Accounting Review, Volume 74 no. 1,
pp.29-61.
Collins, D.W., Maydew, E.L., and Weiss, I.S. (1997). Changes in the value relevance
of earnings and book values over the past 40 years. Journal of Accounting and
Economics, 24 (1): pp 39-67.
Correia, C., Flynn, D., Uliana, E., and Wormald, M. (2003). Financial Management
Fifth Edition. Juta and Co Ltd.
Easton, P.D., Eddey, P.H., and Harris, T.S. (1993). An investigation of revaluations of
tangible long-lived assets. Journal of Accounting Research 31: 1-38.
Fama, E. F., and French,K.R. (1992). The cross-section of expected stock returns,
Journal of Finance 47, 427-465.
Fama, E. and French, K. (1993). Common risk factors in the returns on stocks and
bonds, Journal of Financial Economics, pp. 3-56.
79
Fama, E., and French, K. (1995). Size and Book-to-Market Factors in Earnings and
Returns. Journal of Finance (March), pp. 131-155.
Fama, E. and French, K. (1996). The CAPM is Wanted, Dead or Alive, Journal of
Finance. 51 (5) pp. 1947-1958.
Feltham, G.A., and Ohlson, J.A. (1995). Valuation and Clean Surplus Accounting for
Operating, Financial Activities, Contemporary Accounting Research, 11(2):
pp 689-731.
Feltham, G. A. and Ohlson, J.A. (1996). Uncertainty Resolution and the Theory of
Depreciation Measurement, Journal of Accounting Research 34, pp. 209-234.
Firer, C., Sandler, M., and Ward, M. (1992). Market timing: A worthwhile strategy?
Omega, International Journal of Management Science, 20(3), pp. 313-322.
Flegm E H (1989) The limitations of accounting. Accounting Horizons, September,
pp.90-97
Frankel, R., and Lee, C. (1995). Accounting Valuation, Market Expectation, and The
Book-to-Market effect. University of Michigan, Unpublished.
Freeman, M. C., and Davidson, I. R. (1999). Estimating the equity premium,
European Journal of Finance, Taylor and Francis Journals, vol. 5(3), pp. 236-
246.
Garrod, N., and Rees, W., (1998). International Diversification and Firm Value,
Journal of Business Finance and Accounting, 25 (9), pp. 1255-1281.
Genesove, D, and Mayer, C. (2001). Loss Aversion and Seller Behaviour: Evidence
from the Housing Market, CEPR Discussion Papers 2813, C.E.P.R.
Gilbertson, B., and Goldberg, M. (1981). The market model and the Johannesburg
Stock Exchange. Investment Analysts Journal 17, pp. 40-42.
Gujarati, N. and Damodar, N. (2003). Basic Econometrics, 4th Edition, McGraw Hill.
80
Hand, J. and Landsman, W. (1998). Testing the Ohlson Model: v or not v, that is the
question, working paper, University of North Carolina and Chapel Hill,
Chapel Hill, N.C.
Holland, J. (1998). Private Corporate Disclosure, financial intermediation, and market
efficiency, Journal of Business Finance and Accounting, Volume 25, No’s 1 &
2, Jan-March, April, pp. 29-68.
Holthausen, R. W. and R. L. Watts (2000). The Relevance of Value Relevance
Literature for Financial Accounting Standard Setting. Working Paper,
University of Pennsylvania.
Holthausen, R. W. and D. F. Larcker. (1992). The Prediction of Stock Returns Using
Financial Statement Information. Journal of Accounting & Economics 15(2,3):
373-411.
IAS 38 (2004). International Financial Reporting Standards (IFRSTM) including
International Accounting Standards (IAS) 31 March (2004). International
Accounting Standards Board.
International Valuation Standards, (2005). International Valuation Standards
Committee, Seventh Edition.
Kahneman, D., and Tversky, A. (1979). Prospect Theory: An Analysis of Decision
Under Risk, Econometrica, 47:263-291.
Kaplan, R.S. and Norton, D.P. (1996), The Balanced Scorecard, Boston,
Massachusetts: Harvard Business School Press.
Kothari, S., and Shanken, J. (1995). Book-to-Market, Dividend Yield, and Expected
Market Returns: A Time Series Analysis. University of Rochester.
Kothari, S.P., and Zimmerman, J.L. (1995). Price and Return Models, Journal of
Accounting and Economics. 20: 155-192.
Lakonishok, J., Schleifer, A., and Vishny, R. (1994). Contrarian Investment,
Extrapolation and Risk, Journal of Finance, (December), pp. 1541-1578.
81
Lev, B. and Sougiannis, T. (1999). Penetrating the Book-to-Market Black Box: The
R&D effect, Journal of Business Finance and Accounting, 26: (3&4)
Lintner, J. (1956). Distribution of incomes of corporations among dividends, retained
earnings, and taxes, American Economic Review, Vol 46, pp9-133.
Liu, J., and Ohlson, J.A. (2000). The Feltham-Ohlson (1995) model: Empirical
implications, Journal of Accounting, Auditing and Finance, 15 (3): 321-331.
Lo, A.W., Mamasky, H., and Wang, J. (2000). Foundations of Technical Analysis:
Computational Algorithms, Statistical Inference and Empirical
Implementation, The Journal of Finance, LV (4).
Louder, M.L., Khurana, I.K., and Boatsman, J.R., (1996). Market Valuation of
Regulatory Assets in Public Utility Firms. The Accounting Review, 71 (July
1996), pp. 357-373.
Luehrman, T.A. (1997). What’s it worth? A general manager’s guide to valuation,
Harvard Business Review, 75(3), pp. 132-142.
Makina, D., and Negash, M. (2005). Structural Changes and Dating of Stock Market
Liberalization: Evidence from the JSE Securities Exchange South Africa,
Paper Under Review, Emerging Markets Review, 30 pages. Available online:
http://www.wits.ac.za/accountancy/staff/negashm/research/doc21.doc.
Meyer, M C (1997). The persistence of Unit Trust Performance in the period July
1985 – June 1995. Working paper presented at the South African Finance
Association conference, January 1997.
Miller, M., and Modigliani, F., (1961). Dividend Policy, Growth and the Valuation of
Shares, The Journal of Business, October: pp. 411-433.
Mitchell Williams, S. (2000), “Is a company’s intellectual capital performance and
intellectual capital disclosure practices related?: Evidence from publicly listed
companies from the FTSE 100”, Paper Presentation: World Congress on the
Management of Intellectual Capital and Innovation, McMaster University,
January 2000.
82
Modigliani, F., and Miller, M., (1958). The Cost of Capital, Corporate Finance, and
the Theory of Investment. American Economic Review, pp. 261-297.
Negash, M. (2002). Intangibles, Bid-Ask Spread and the Book to Market Ratio: Some
Evidence from the Johannesburg Stock Exchange, Paper Under Review, The
Journal of International Accounting Research, American Accounting
Association, August 2002, 34 pages.
Ohlson, J. (1995). Earnings, Book Values and Dividends in Equity Valuation,
Contemporary Accounting Research, 11(2): pp 661-687.
Ohlson, J. (1998). Earnings, Book Values, and Dividends in Equity Valuation: An
empirical perspective, working paper, New York University, New York.
Ohlson, J. (2001). Earnings, Book Values, and Dividends in Equity Valuation: An
empirical perspective, Contemporary Accounting Research, Volume 18
number 1: pp 107-120.
Page, M. J. (1989). Model selection for measuring security price performance. South
African Journal of Business Management, 20(2), pp. 78-81.
Penman, S. (1992). Return To Fundamentals. Journal of Accounting, Auditing and
Finance. 7: 465-483.
Pfeiffer, R. J., Jr. and P. T. Elgers. (1999). Controlling for Lagged Stock Price
Responses in Pricing Regressions: An Application to the Pricing of Cash
Flows and Accruals. Journal of Accounting Research 37(1): 239-247.
Piotroski, J.D. (2000). Value Investing: The Use of Historical Financial Statement
Information to Separate Winners from Losers. Journal of Accounting Research
Vol 38, Supplement.
Pulic, A. (1998). Measuring the performance of intellectual potential in knowledge
economy. Available online: http:// www. measuring-
ip.at/Opapers/Pulic/Vaictxt.html. Accessed May 2005.
SFAC No. 5, Recognition and measurement of business enterprises, Financial
Accounting Standards Board (FASB).
83
Stober, T.L. (1999). Empirical Applications of the Ohlson (1995) and Feltham and
Ohlson (1995, 1996) Valuation Models, Managerial Finance, Volume 25, No
12, pp 3-16.
Van Rensburg, P. (1998). Unifying the factor analytic and prespecified variable
approaches to APT factor identification on the Johannesburg Stock Exchange.
SA Journal of Accounting Research 1(12), pp. 15-46.
Van Rensburg, P., and Robertson, M., (2003). Size, Price-to Earnings and Beta on the
JSE Securities Exchange, Investment Analysts Journal, 58, pp. 7-16.
Van Rensburg, P., and Slaney, K.B.E. (1997). Market segmentation on the
Johannesburg Stock Exchange, Journal of Studies in Economics and
Econometrics, 23(3), pp. 1-23.
Ward, M., J. (1994). Risk on the Johannesburg Stock Exchange. De Ratione 8(2), pp.
99-114.
Woldegabir, H, G. (2004). Department of Accounting, University of Cape Town,
Unpublished Masters of Commerce Research Report.
84

Appendix - Companies included in sample
Name Ticker AMALGAMATED BEVERAGE INDUSTRIES LTD ABI ADONIS KNITWEAR HOLDINGS LTD ADO ADCORP HOLDINGS LTD ADR AECI LTD AFE ANGLO AMERICAN PLC AGL AFROX HEALTHCARE LTD AHH ALEX WHITE HOLDINGS LTD ALX ANGLO AMERICAN PLATINUM CORPORATION LTD AMS AFRICAN & OVERSEAS ENTERPRISES LTD AOO ASPEN PHARMACARE HOLDINGS LTD APN AFRICAN RAINBOW MINERALS LTD ARI ABSA GROUP LTD ASA ASSORE LTD ASR ALLIED ELECTRONICS CORPORATION LTD ATN ATLAS PROPERTIES LTD ATS AVI LTD AVI BARLOWORLD LTD BAW BARPLATS INVESTMENTS LTD BPL BRANDCORP HOLDINGS LTD BRC BEARING MAN LTD BRM BASIL READ HOLDINGS LTD BSR BIDVEST GROUP LTD (THE) BVT CANADIAN OVERSEAS PACKAGING INDUSTRIES LTD CAN CAXTON CTP PUBLISHERS AND PRINTERS CAT CROOKES BROTHERS LTD CKS COMBINED MOTOR HOLDINGS LTD CMH CONCOR LTD CNC CONTROL INSTRUMENTS GROUP LTD CNL CONAFEX HOLDINGS SOCIETE ANONYME CNX CORPCAPITAL LTD CPA CAPITAL PROPERTY FUND CPL CAPITAL ALLIANCE HOLDINGS LTD CPT CARGO CARRIERS LTD CRG CERAMIC INDUSTRIES LTD CRM CORWIL INVESTMENTS LTD CRW CASHBUILD LTD CSB CULLINAN HOLDINGS LTD CUL DIMENSION DATA HOLDINGS PLC DDT DELTA ELECTRICAL INDUSTRIES LTD DEL DON GROUP LTD DON DISTELL GROUP LTD DST EDGARS CONSOLIDATED STORES LTD ECO ELLERINE HOLDINGS LTD ELH ELB GROUP LTD ELR EUREKA INDUSTRIAL LTD EUR FOSCHINI LTD FOS FIRSTRAND LTD FSR GOOD HOPE DIAMONDS (KIMBERLEY) LTD GDH GENCOR LTD GMF GRINDROD LTD GND
85

GRINTEK LTD GNK GROUP FIVE LTD GRF ALLAN GRAY PROPERTY TRUST GRY HOSKEN CONSOLIDATED INVESTMENTS LTD HCI HUDACO INDUSTRIES LTD HDC HIGHVELD STEEL & VANADIUM CORPORATION LTD HVL HYPROP INVESTMENTS LTD HYP ISPAT ISCOR LTD IIS ILLOVO SUGAR LTD ILV IMPALA PLATINUM HOLDINGS LTD IMP INDEPENDENT FINANCIAL SERVICES LTD IND INMINS LTD INM IMPERIAL HOLDINGS LTD IPL ITALTILE LTD ITE JOHNNIC COMMUNICATIONS LTD JCM JIGSAW HOLDINGS LTD JGS JASCO ELECTRONICS HOLDINGS LTD JSC KWV BELEGGINGS BPK KWV LABAT AFRICA LTD LAB LA GROUP LTD LAR LONDON FINANCE & INVESTMENT GROUP PLC LNF LONMIN PLC LON MUTUAL & FEDERAL INSURANCE COMPANY LTD MAF MASONITE (AFRICA) LTD MAS MEDI-CLINIC CORPORATION LTD MDC MR PRICE GROUP LTD MPC MORIBO LEISURE LTD MRB MARSHALLS LTD MSS METAIR INVESTMENTS LTD MTA MURRAY AND ROBERTS HOLDINGS LTD MUR NICTUS LTD NCS NEDCOR LTD NED NORTHAM PLATINUM LTD NHM NAMIBIAN SEA PRODUCTS LTD NMS NAMPAK LTD NPK NU-WORLD HOLDINGS LTD NWL OCEANA GROUP LTD OCE OCTODEC INVESTMENTS LTD OCT PALS HOLDINGS LTD PAL PALABORA MINING CO LTD PAM PANGBOURNE PROPERTIES LTD PAP PRETORIA PORTLAND CEMENT COMPANY LTD PPC PUTCO PROPERTIES LTD PPR PASDEC RESOURCES SA LTD PSC PSG GROUP LTD PSG PUTCO LTD PTC RAINBOW CHICKEN LTD RBW REUNERT LTD RLO RELYANT RETAIL LTD RLY REX TRUEFORM CLOTHING COMPANY LTD RTO SABMILLER PLC SAB SA EAGLE INSURANCE COMPANY LTD SAE STANDARD BANK GROUP LTD SBK SABLE HOLDINGS LTD SBL
86
SEARDEL INVESTMENT CORPORATION LTD SER SASFIN HOLDINGS LTD SFN SAGE GROUP LTD SGG SHOPRITE HOLDINGS LTD SHP SANTAM LTD SNT SPANJAARD LTD SPA SUPER GROUP LTD SPG SPESCOM LTD SPS SUN INTERNATIONAL LTD SUI TIGER BRANDS LTD TBS TONGAAT-HULETT GROUP LTD TNT TRANSPACO LTD TPC TRANS HEX GROUP LTD TSX UNITED SERVICE TECHNOLOGIES LTD USV UNITRANS LTD UTR VAALTRUCAR LTD VCR VAALAUTO LTD VLT VENFIN LTD VNF VENTER LEISURE & COMMERCIAL TRAILERS LTD VTL WANKIE COLLIERY COMPANY LTD WAN W B HOLDINGS LTD WBH WILSON BAYLY HOLMES-OVCON LTD WBO WOOLTRU LTD WLO WINHOLD LTD WNH YORK TIMBER ORGANISATION LTD YRK
87