equity and efficiency aspects of rent control: an empirical
TRANSCRIPT

JOURNAL OF URBAN ECONOMICS 26, 54-14 (1989)
Equity and Efficiency Aspects of Rent Control: An Empirical Study of New York City
JOSEPH GYOURKO* AND PETER LINNEMAN*
Finance Department, The Wharton School, University of Pennsylvania, Philadelphia, Pennsylvania 19104-6302
Received February 3,1986; revised December 22,1987
SECTION 1: INTRODUCTION
Modem rent controls arose during World War II to deal with the war-related influx into urban areas. Since then, numerous cities have either considered, adopted, or eliminated rent controls. The policy debate about the desirability of rent controls continues unabated and becomes particu- larly acute when high inflation rates drive up rents rapidly.
Rent controls have both efficiency and distributional consequences. The economics literature has produced theoretical insights about the inefficien- cies created by rent controls.’ This literature is frequently cited by oppo- nents of rent controls who argue that the efficiency costs of rent controls are manifested in a decaying housing stock and altered mobility patterns. Proponents of rent control invariably argue that the distributional impacts of rent controls outweigh efficiency costs. Considering the large number of cities that have investigated or adopted rent controls, relatively little empiri- cal research documents either the efficiency or distributional effects of rent controls. The most notable exceptions are the studies of New York City by De Salvo [3], Olsen [13], and Roistacher [15], and the studies of Los Angeles by Rydell et al. [16], and Fallis and Smith [4]. More recently, Linneman [lo] and Marks [12] have further examined ramifications of rent controls in New York City and Vancouver.
This paper fills some gaps in knowledge about the effects of rent controls. We examine rent controls in New York City in 1968, using the New York City Housing and Vacancy Survey.2 The paper extends the work of Olsen [13], although there are important differences in both the questions ad- dressed and methodology used. This paper examines in detail the distribu- tional consequences of rent controls for New York City residents (both
*Helpful comments were provided by Patric Hendershott, Janet Rothenberg Pack, partici- pants at the Resource and Policy Workshop at the University of Chicago, and members of the Housing Research Centre at the University of Glasgow and au anonymous referee.
‘For a recent overview of the major issues iu the area, see Block and Olsen [2]. ‘We are grateful to Edgar Olsen for providing us with his data tape.
54 0094-1190/89 $3.00 Copyright 0 1989 by Academic Press, Inc. All rights of reproduction in any form reserved.
RENT CONTROL IN NEW YORK CITY 55
renters and owners). We identify the socioeconomic groups which received the largest benefits from rent controls and evaluate the distributional impacts of these benefits. Also reported are results on some inefficiency aspects of rent controls not previously quanti8ed. We measure how rent control benefits reduce residential mobility and the impacts of rent control benefits on homeownership propensities. Finally, we present new evidence on the influence of rent controls on rental prices for housing services in the controlled and uncontrolled sectors.3
The next section briefly describes the history of New York City’s rent controls through 1968. The third section of the paper presents the method- ology used to estimate the benefits derived from rent controls, while in Section 4 we evaluate the targeting efficiency and distributional impacts of rent controls. Section 5 contrasts the distribution of income to the distribu- tion of income plus rent control benefit and finds the latter to have been very slightly more equally distributed. The sixth section evaluates some resource allocation impacts of rent controls. The paper concludes with a brief summary.
SECTION 2: RENT CONTROLS IN NEW YORK CITY
Rent controls began in New York City in November 1943 when rents for all units in the city were frozen at their March 1943 levels as part of the U.S. Emergency Price Act of 1942. The controls were intended to prevent “speculative, unwarranted, and abnormal” rent increases during the war.4 The federal enabling legislation for these controls was altered by the Federal Housing and Rent Act of 1947 which exempted units built after February 1947 from future rent controls. However, New York City contin- ued to control rents on virtually all apartments constructed prior to 1947.5 In 1950 the federal enabling legislation expired and was replaced by a similar statute through the New York Emergency Housing Act of 1950. By the late 1950’s, New York was the only state which still had rent controls. In response to growing political differences between the State and New York City, the Emergency Housing Act of 1962 provided New York City with the power to administer its own rent control legislation through the Rent Control Division of the New York City Department of Housing Preservation and Development. These controls were in effect at the time that the survey we use was conducted. In 1968 controlled units were in structures built prior to February 1947, although some units had been
3The paper does not deal with the overall deadweight loss from rent controls or with other efficiency costs arising from increased depreciation of controlled units, decreased production of housing, and the like.
4Emergency Housing Rent Control Law, N.Y. Session Laws 1950, Chapter 250, Section 3. ‘The 1947 legislation allowed decontrol of “voluntarily” vacated units in buildings for one
or two families.

56 GYOURKO AND LINNEMAN
Price
Demand Schedule
Effective Qucmtlty
FIGURE 1
decontrolled for various reasons. Just over 60% of the rental units in our sample were regulated. Rents for these controlled units were established by the Rent Control Board. Prior to 1970, rents for controlled units were seldom raised and generally reflected a philosophy that uncontrolled rents rose primarily as the result of the greed of landlords.6
SECTION 3: MEASUREMENT METHODOLOGY
We define the ith renter’s annual benefit from rent controls as minus the compensating variation (CV) associated with their annual rental subsidy,
Bi = -CV,. (1)
We measure this benefit as the difference between the uncontrolled rent predicted for the i th renter’s controlled unit and the actual rent paid on that unit. For example, if the montly rent for a controlled apartment was $500 and this unit would have rented over $700 in the uncontrolled sector, the montly rent control subsidy would be $200.
This measure is the true compensating variation if the renter of a controlled apartment can consume the same effective quantity of housing services as would have been consumed had no controlled unit been avail- able. This is shown in Fig. 1. Renters purchase Q* units of housing services whether the price of a unit of those services is PM, the uncontrolled market price, or PC, the controlled price. The rectangle PCPMAB is the rent controlled subsidy just described and that area also is minus CV. If the effective quantity consumed under controls differs from that purchased in
?he rent controls currently in existence in New York City are not those described in this section. See Linneman [lo] for a brief description of changes in New York City’s rent controls since 1968.

RENT CONTROL IN NEW YORK CITY 57
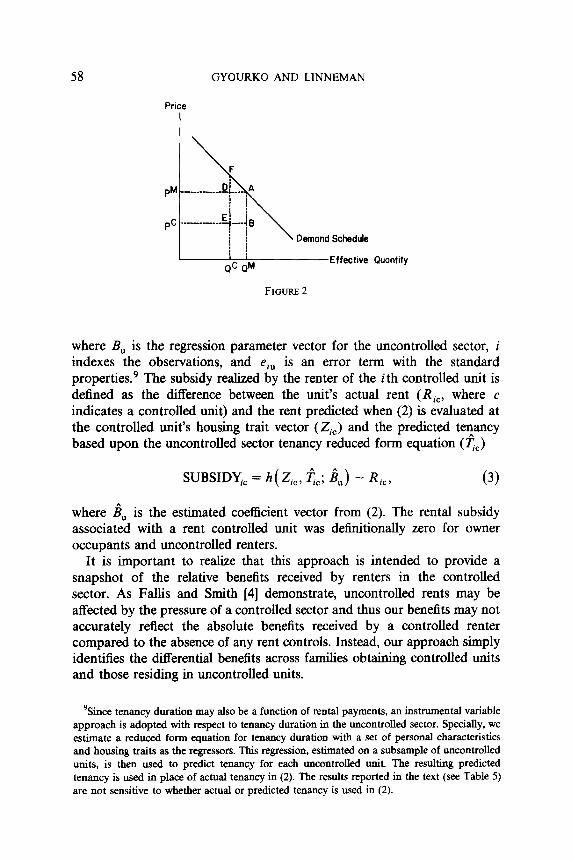
the uncontrolled sector, then PCPMAB may overstate or understate the true CV. Figure 2 illustrates the case where the effective quantity consumed in the controlled sector is lower than what would be consumed in an uncon- trolled unit. PM again is the uncontrolled sector price of a unit of housing services. Q M is the associated quantity consumed. In Fig. 2, obtaining a controlled unit not only forces the individual off his demand curve, he is able to consume only Qc units of housing services at the lower price PC. CV in this case is measured by PCPMDE - DFA. If by obtaining a controlled unit the renter ended up consuming more than QM units of housing services, then the true compensating variation could be less than or greater than PCPMAB depending upon how much greater Qc is than Q”.
There is some evidence that the quality of some types of controlled units is lower than that of similar uncontrolled units (see Gyourko and Linneman [6]). Thus, it may be that the rent control subsidy is (effective) quantity constrained with Qc < QM for some individuals. It is also possible that the program encourages some families to upgrade the quality of housing services consumed. While there is undoubtedly some measurement error associated with the assumptions in Fig. 1, we do not believe that it is a serious problem for this paper as we are more concerned with distributional effects, not the level of the subsidies. We do not believe that the distribution of subsidies across demanders is being systematically biased.7,8
In order to estimate the uncontrolled rent for a controlled apartment, a hedonic rent function for the uncontrolled sector is employed. The general form of this hedonic equation is to estimate rents for uncontrolled units ( Ri,) as a function of housing traits (Z,,) and tenancy duration (q,)
Ri, = ‘( Zi,, T”; B,) + ei,,
‘Further, to calculate the compensating variation in Fig. 2 generally requires that one observe both prices and quantities while we can only see expenditures in our data Olsen [13] estimated CV by assuming that a specific demand function fit all individuals. With his demand function, only certain expenditures data were necessary to estimate the CV in Fig. 2. A potential problem with his approach (of which he was aware) is that the use of average income and price elasticity parameters can seriously bias the results of an analysis like ours which investigates the targeting efficiency of the subsidy program. Other work we have done (Gyourko and Linneman [7]) indicates that the bias can be severe, yet difficult to detect. This potential problem also applies if Hausman’s [8] exact consumer surplus methodology is applied. (A revised version of Hausman’s methodology would be required because his analysis assumes that subsidy recipients are on their demand schedules.)
sAnother factor which probably causes our subsidy measure to overstate the true benefit is the utilization of key money and other schemes used tb transfer the subsidy from tenants to landlords. Since many of these schemes are not legal, we have no data on them. However, there are other influences which would lead our estimate to understate the true subsidy. For example, rental subsidies are untaxed; hence, the in-kind subsidy might be worth more than an equal taxable cash grant.
58 GYOURKO AND LINNEMAN
Demand Schedule
Effective Quantity
FIGURE 2
where B, is the regression parameter vector for the uncontrolled sector, i indexes the observations, and ei, is an error term with the standard properties.’ The subsidy realized by the renter of the ith controlled unit is defined as the difference between the unit’s actual rent (Ric, where c indicates a controlled unit) and the rent predicted when (2) is evaluated at the controlled unit’s housing trait vector (Z,,) and the predicted tetancy based upon the uncontrolled sector tenancy reduced form equation (7JJ
SUBSIDY,, = h( Zi,, cc; g”,> - R;c,
where i!& is the estimated coefficient vector from (2). The rental subsidy associated with a rent controlled unit was definitionally zero for owner occupants and uncontrolled renters.
It is important to realize that this approach is intended to provide a snapshot of the relative benefits received by renters in the controlled sector. As Fallis and Smith [4] demonstrate, uncontrolled rents may be affected by the pressure of a controlled sector and thus our benefits may not accurately reflect the absolute benefits received by a controlled renter compared to the absence of any rent controls. Instead, our approach simply identifies the differential benefits across families obtaining controlled units and those residing in uncontrolled units.
9Since tenancy duration may also be a function of rental payments, an instrumental variable approach is adopted with respect to tenancy duration in the uncontrolled sector. Specially, we estimate a reduced form equation for tenancy duration with a set of personal characteristics and housing traits as the regressors. This regression, estimated on a subsample of uncontrolled units, is then used to predict tenancy for each uncontrolled unit. The resulting predicted tenancy is used in place of actual tenancy in (2). The results reported in the text (see Table 5) are not sensitive to whether actual or predicted tenancy is used in (2).

RENT CONTROL IN NEW YORK CITY
TABLE 1
Sample Means
59
All Controlled Uncontrolled Owner- observations sector renters sector renters occupiers
No. of observations Annual rent (1984 dollars) Income (1984 dollars) 4s Family size Length of tenancy (years) % Black head % Puerto Rican head % Single male head 8 Single female head % Married head % Bronx % Brooklyn % Manhattan % Queens-Richmond % Built 1967-68 % Built 1960-66 RI Built 1947-59 X Built pre-1946 % Steam heat % Central heat % Other heat % Good condition % Deteriorating condition X Dilapidated condition % First floor, with elevator % Second floor, with elevator 4: Third Boor, with elevator % Fourth floor, with elevator % Fifth floor + , with elevator % First floor, no elevator % Second floor, no elevator % Third floor, no elevator % Fourth floor, no elevator % Fifth floor + , no elevator % With bathroom % l-2 Units in bldg. % 3-4 Units in bldg. X 5-9 Units in bldg. % lo-12 Units in bldg. % 13-19 Units in bldg. % 20-49 Units in bldg. % 50-99 Units in bldg. % 100 + Units in bldg. No. of stories No. of bedrooms No. of other rooms
14,668 5144 4429 5095 NA $2585 $5314 NA
$23,866 $16,449 $28,804 $27,061 47.9 48.2 43.4 51.4
2.9 2.7 2.7 3.4 8.7 10.4 4.1 10.9
14.4 19.2 12.4 11.2 6.4 13.7 3.0 2.0 5.7 7.5 7.3 2.4
22.4 32.3 22.1 12.7 71.9 60.2 70.5 84.8 15.4 22.7 12.3 10.9 29.0 34.1 22.8 29.1 20.5 29.4 25.3 7.3 35.1 13.9 39.6 52.7 1.9 0 2.6 3.3
26.5 0 53.2 29.9 11.8 0 22.2 14.7 59.8 100.00 22.0 52.1 92.5 98.3 93.2 86.0 6.0 0.5 5.8 11.6 1.5 1.0 0.6 2.5
86.5 69.3 95.4 96.2 10.9 24.4 3.9 3.4 2.6 6.3 0.7 0.4 3.5 3.9 5.1 1.6 4.4 4.7 6.9 1.8 3.8 3.9 6.2 1.5 4.2 3.9 7.1 1.9
20.4 11.8 37.8 13.9 31.9 15.7 16.1 62.4 17.6 21.1 15.6 15.7 7.4 16.5 4.1 0.9 4.4 11.9 0.6 0.1 2.4 6.5 0.3 0.0
97.9 94.3 99.6 99.7 34.8 4.3 26.5 72.6 7.6 11.9 4.6 5.7 6.1 14.5 2.1 1.1 1.8 4.1 1.0 0.1 3.2 8.0 0.9 0.2
14.1 33.8 5.8 1.2 13.3 17.3 19.7 3.5 19.2 6.1 39.0 15.0 4.3 4.7 5.2 2.9 1.9 1.7 1.5 2.5 2.4 2.1 2.1 2.9

GYOURKO AND LINNEMAN
TABLE 2 Benefit Summary Statistics (1984 Dollars)
Mean benefit SD of mean” SD of estimate” Mean benefit share in family income
All observations
$855.54 1934.59
15.97 9.54%
All rental units (uncontrolled
and controlled)
$1310.87 2266.67
23.17 14.6%
Controlled rental
units only
$2439.54 2609.28
36.38 27.2%
Mean benefit-whites SD of mean SD of estimate Mean benefit share in family income
829.75 1339.31 2793.07 1917.61 2291.99 2625.91
17.79 27.01 44.70 9.24% 14.9% 31.1%
Mean benefit-blacks SD of mean SD of estimate Mean benefit share in family income
881.16 1208.44 1881.70 2024.46 2286.04 2621.51
44.05 58.25 83.36 10.14% 13.9% 21.7%
Mean benefit-Puerto Ricans SD of mean SD of estimate Mean benefit share in family income
1117.85 1254.56 1488.34 1918.66 1990.05 2085.88
62.71 68.91 78.67 11.95% 13.4% 15.9%
“The standard deviation reflects the dispersion of the benefits around the mean while the standard error of the estimate reflects the precision with which the mean benefit is estimated.
The sample we use is drawn from the 1968 New York City Housing and Vacancy Survey. This survey contains 5144 usable observations for rental units in the controlled sector, 4429 usable observations for renters in the uncontrolled sector, and 5095 usable observations for owner-occupants.” The units are located in all boroughs of New York City. Table 1 reports the means for the variables used in this study for all observations, controlled sector renters, uncontrolled sector renters, and owners, respectively. For convenience, all dollar amounts are expressed in 1984 dollars.
SECTION 4: DISTRIBUTIONAL IMPACTS OF RENT CONTROLS
Table 2 displays a summary of the annual rent control benefits measured as in (3). All benefits are expressed in 1984 dollars. The benefit associated with occupying a rent-controlled unit is quite large, with a mean annual
“Our sample is not identical to Olsen’s [13]. One reason is that since our subsequent hedonic price specifications are not identical, different observations were dropped in each study depending upon which variables had missing values.

RENT CONTROL IN NEW YORK CITY 61
subsidy of approximately $2440 or an average of 27.2% of annual income.” While the benefits received by blacks in the controlled sector were not as large as those for whites, blacks do not appear to have been disproportion- ately denied entrance into the controlled sector. Specifically, although blacks were 14.4% of the overall sample, they occupied just over 19% of all controlled units. It is noteworthy that the benefit-to-income ratio was far higher for white families than for either black or Puerto Rican families.
The results displayed in Table 2 also indicate that the benefits had a large dispersion. For example, the standard deviation of the benefit distribution ($2609) for controlled sector renters was approximately the same as the mean of the distribution ($2440). The dispersion of the benefit was larger in absolute terms for whites, but larger relative to the mean for Puerto Ricans and blacks. Finally, the estimates of the benefit are quite precise with the standard error about the mean being on the order of 1.5% of the mean benefit. Stated differently, for the controlled sector, the average benefit is between $2367 and $2511 with approximately 95% confidence.
In order to obtain further insights about the identity of the major beneficiaries of rent controls, the benefit was regressed on a vector of personal characteristics of the occupants (Xi). The resulting correlations are displayed in Table 3. The first two columns reflect only observations in the controlled sector. These results summarize the benefit targeting conditional upon occupying a rent-controlled unit, hereafter referred to as the condi- tional controlled benefit. The low R2 value in the first column indicates that the conditional controlled benefit is poorly targeted with respect to family income with virtually none of the benefit variation among controlled sector renters being explained by income variations. Although not statistically significant, the benefit among controlled sector renters rose with income (though at a diminishing rate) throughout the relevant range of the data. New York City’s rent control may have increased both horizontal and vertical inequality among controlled renters.
The second column adds other socioeconomic variables and borough dummies (Queens-Richmond is omitted) to the benefit regression. These additional variables are included to capture the possibility that rent con- trols may have more diverse targeting objectives than simply family income. Once again the borough dummies reflect unmeasured personal traits as well as differential political influence across the boroughs. The R2 value (0.31) indicates that rent control benefits were moderately well targeted with
“The benefit-to-income ratios reported in Table 3 are not directly comparable to Olsen [13]. We report the mean of this ratio while Olsen reported the ratio of the means. Also, Olsen estimated the compensating variation in a different manner, relying on personal traits rather than housing unit traits to impute an uncontrolled sector rent. He used the coefficients from a rental expenditure equation for uncontrolled sector renters to impute what a controlled sector person would pay in the uncontrolled sector.

62 GYOURKO AND LINNEMAN
TABLE 3 Benefit Regressions
Independent variables
Benefit conditional on obtaining controlled unit
(controlled Sector only) (1) (2)
Benefit conditional on renting
(entire rental sector) (3) (4)
Unconditional benefit
(all observations) (5) (6)
Intercept 2407.43 - 2009.03 2068.01 - 1345.73 (69.44) (326.98) 144.02) (204.44)
Manhattan
Brooklyn
BIOllX
Age
Age’
(Family size)
(Family si#
Income (annual)
(Income)2
Black
Puerto Rican
Single male
Single female
R=: F:
Prob. > F:
io71.99’ (100.81)
- 294.10 (98.70) 370.32
(105.81) 66.31
(12.00) - 0.01
(0.12) 454.04 (82.71)
- 35.38 (9.81)
0.002 0.005 -
i761.10’ (57.89)
193.36 (56.46) 251.86 (64.61) 46.62 (7.98)
- 0.01 (0.08)
374.89 (57.74)
- 28.13 - 11.60 (6.98) (4.79)
0.040 - 0.037 -0.032 - 0.028 (0.004) P-w
-HOE - 08) - 6.76E - (2.79E - 08) (2.45E -
- 308.34 (84.90)
- 593.16 (100.81)
- 219.96 (142.54)
- 3.59 (81.36)
0.0001 0.314 0.220 181.79
.8023 .ooOl
(0.002) (0.002) 08 1.52E - 07 1.08E - 07
‘38) 08) (1.39E - 08) (1.33E - - 127.67
(60.00) -259.19
(79.77) - 168.07
(%.64) - 123.45
(57.32)
(0.001) 1.21E -
(8.18E - 07 09)
(0.001) 7.56E -
(8.10E - - 38.08
(43.34) 26.01
(63.53) - 135.791
(75.28) 2.65
(43.19)
0.042 0.230 0.040 0.186 212.72 221.72 302.62 259.001
.ooOl .OMN .ooOl .oool
1509.81 - 846.37 (31.28) (155.00)
1816.78 (42.46) 265.61 (36.73)
428.02 (45.18) 34.38 (6.W
- 0.08 (0.06)
155.04 (40.77)
N 5144 5144 9573 9573 14,668 14,668
08 09)
Note: Standard errors in parentheses.
respect to this larger set of targeting objectives. The benefits among controlled sector renters were found to be $2072 larger in Manhattan than in Queens-Richmond. On average, benefits in the Bronx and Brooklyn were significantly lower than benefits in Queens-Richmond. Further, the benefits rose at a diminishing rate with the age of the household head throughout the relevant range. The conditional controlled benefit was relatively neutral with respect to the sex of the head and marital status of the family. The single male and single female coefficients are negative but not significant at standard levels. Note that the regressivity of the benefit is unaffected by the inclusion of these other variables. Finally, these benefits rise up to a family of seven and are signScantly less for black and Puerto Rican families than for their white counterparts.
The third and fourth columns of Table 3 display similar benefit regres- sions conditioned only upon being a renter. Hereafter we refer to this concept as the conditional renter benefit. Results for the conditional renter

RENT CONTROL IN NEW YORK CITY 63
benefit can difI’er from those for the conditional controlled benefit to the extent that obtaining a rent controlled tit, and hence a nonzero benefit, was targeted with respect to the socioeconomic characteristics influencing the conditional controlled benefit. Neither R* is very large and that in column four is 27% lower than that for controlled sector renters in column two. This indicates that not only were rent control benefits poorly targeted among controlled sector renters, but also the decision to confer benefits upon controlled sector renters was extremely poorly targeted. This further highlights the fact that the benefits of rent control do not enhance vertical equity.‘*
The conditional renter subsidy was largest in Manhattan, followed in order by the Bronx, Brooklyn, and Queens-Richmond. Black and Puerto Rican renters again fared signincantly worse than whites on average despite the fact that they were disproportionally able to rent controlled units (see Table 1).
The major difference between the targeting of the conditional controlled benefit and the conditional renter benefit is with respect to family income. While the conditional controlled benefit rose monotonically in the relevant data range with income, the conditional renter benefit (when no other variables were held constant) was significantly negatively related to family income throughout the relative data range (up to $131,578). When the other targeting variables were included (column 4), the conditional renter benefit still fell significantly with income throughout the relevant range of the data. These patterns again indicate that the targeting of rent control benefits among renters with respect to income was slightly progressive (the negative income effect) but quite haphazard (R* = 0.042 in column 3). The differen- tial impact of income on the conditional controlled and conditional renter benefits reflect the lower average income of controlled sector renters.
Single renters of each sex fared significantly worse on average than their married counterparts. Also age of the family head and family size were positively related to the conditional renter benefit in the relevant range of the data.
The last two columns of Table 3 summarize how the benefits of rent control were targeted across the entire New York City population-renters
“For example, suppose the targeting among controlled sector renters was totally random with respect to income but that only the very poorest families could obtain rent-controlled units. In this case the R2 for the conditional controlled benefit would be near zero because of the absence of targeting among the chosen beneficiaries. However, the R2 for the conditional renter benefit would be very high due to the targeting precision associated with allocating controlled units. I f the rent-control unit allocation process is more poorly targeted than the benefit targeting among controlled renters, the R2 value for the conditional renter benefit is less than the R* value for the conditional controlled benefit.

64 GYOURKO AND LINNEMAN
and owners combined. We refer to this benefit concept as the unconditional benefit. These results differ from those for the conditional renter benefits (columns 3 and 4) to the extent that the homeownership decision was related to the socioeconomic characteristics which determined the condi- tional renter subsidy.
Due to the fact that high-income families disproportionately choose to own, the unconditional benefit declined with income up to approximately $199,000. However, income alone explained only 4% of the benefit variation across residents. Thus, when viewed in terms of the entire New York population, rent controls were slightly progressive but exhibited very little vertical equity due to extremely poor benefit targeting. Age and family size were positively related to the unconditional subsidy throughout their re- spective relevant data ranges. Single female-headed and married households received similar average benefits in excess of those received by single male households. Blacks and Puerto Ricans did not receive lower unconditional benefits less than their white counterparts. In sum, the rent control benefits were adversely distributed with respect to race, and promoted a small degree of vertical equity. However, horizontal equity was extremely poor.
SECTION 5: RESOURCE DISTRIBUTION IMPACTS
This section examines the effect of rent controls on the distribution of economic resources. l3 Table 4 provides cumulative frequency distributions for two different measures of the economic resources of New York City residents (both renters and owners): (1) family income and (2) family income plus the individual rent control benefit minus the sample mean rent control benefit. Hereafter, we refer to this concept as benefit-adjusted income. The distribution of benefit-adjusted income has by definition the same mean as the distribution of family income. Since our interest in this paper is the influence of rent controls on the relative dispersion of re- sources, this mean preserving resource measure is most appropriately com- pared to family income.14
13This analysis of distributional effects deals only with a single period in time. Net present values of the implicit subsidy are not computed.
14Due to the absence of information on the identity of landlords, we were unable to accurately account for the “loss side” of the subsidies including the lost rental income suffered by landlords. Johnson [9] provides some dated and limited evidence on this issue. Since landlords may tend to be, on average, in relatively higher income brackets than benefit recipients, the distributions shown in Table 5 may understate the full distributional impacts of rent controls.
One interpretation of our distributional comparisons in Table 5 is that (1) landlord losses equal tenant gains (or all landlords are city residents so that only intracity transfers occurred) and (2) landlords were spread uniformly throughout the income distribution. If all landlords were absentee, the appropriate comparison would be between the distribution of family

RENT CONTROL IN NEW YORK CITY 65
TABLE 4
Cumulative Frequency Distribution-All Renters and AB Owners
Family income (1)
Cumulative Cell (W) frequency (I%)
Family income plus actual benefit mimrs mean benefit
(2)
Cumulative Cell (%) frequency (W)
SO-$2,999 2.1 2.1 2.6 2.6 3,000-4,999 4.6 6.7 3.4 6.0 5,000-6,999 5.3 12.0 4.0 10.0 7,000-8,999 4.6 16.6 5.3 15.3 9,000-10,999 5.7 22.3 5.1 20.4
ll,OOO-12,999 3.9 26.2 6.5 26.9 13,000-14,999 7.7 33.9 5.1 32.0 15,000-16,999 6.0 39.9 7.1 39.1 17,000-18,999 7.0 46.9 6.3 45.4 19,000-20,999 4.2 51.0 7.8 53.2 21,000-22,999 7.4 58.4 4.5 57.7 23,000-24,999 5.0 63.4 5.4 63.2 25,000-26,999 8.7 72.1 8.1 71.2 27,000-28,999 2.1 74.2 4.2 75.4 29,000-30,999 3.5 77.7 1.9 77.3 31,000-32,999 3.5 81.2 3.9 81.2 33,000-34,999 2.4 83.6 2.1 83.4 35,000-36,999 1.2 84.8 2.3 85.6 37,000-38,999 1.9 86.7 1.0 86.6 39,000-40,999 3.0 89.7 3.0 89.6
41,000 + 10.3 100.0 10.4 100.0
The mean-preserving cumulative frequency distributions in Table 4 reveal some differences in the distribution of resources resulting from rent controls for those in the lowest income groups. For example, approximately 22.3% of the sample had incomes under $11,000 while only 20.4% had benefit-ad- justed incomes below $11,000. Beyond that income level, comparing the distribution of family income with the distribution of benefit-adjusted income reveals that the cumulative frequencies for any income category rarely differed by more than one percentage point. This result reinforces our earlier conclusion that rent controls are poorly targeted and have only a minor impact on equalizing the distribution of economic resources. In fact, the population proportion in the very lowest income levels (under $3000)
income and the distribution of family income plus individual rent control benefit. Because tenants of all incomes were receiving benefits, those results showed the entire family income plus benefit cumulative frequency distribution to have been shifted up vis-a-vis the family income measure.

66 GYOURKO AND LINNEMAN
grew slightly as the result of rent control benefits as did the proportion with incomes under $13,000.
There was relatively little rent control related reduction in the dispersion of resources. The coefficient of variation for family income was .860. The standard deviation of the benefit-adjusted income distribution was $218 less than that for the family income distribution ($20,314 versus $20,532). Thus, the benefit-adjusted resource measure’s coefficient of variation was .851, only marginally less than for the family income measure.
In sum, our results indicate that the poor targeting of New York’s rent controls left the distribution of economic resources only slightly affected. It means that while many poor families received benefits, so too did many higher income families. In a similar vein, while many low-income families benefitted from rent controls, many other equally poor families received no benefits. All told, this indicates that if the primary social benefits of rent controls are their distributional impacts, they were not successful in New York. To put this failure in context, we estimate that the total aggregate benefits distributed in New York City in 1968 were worth nearly $3 billion (in 1984 dollars), or more than a third of all rents paid in New York City.” Despite these enormous transfers, we are unable to identify any particularly strong distributional impact among New York City residents.
SECTION 6: SOME EFFICIENCY COSTS OF RENT CONTROLS
Several previous studies have attempted to model the efficiency effects of rent controls on housing markets. l6 We do not attempt to measure the overall efficiency costs of rent controls. However, we do provide new evidence on the impact of rent controls on the prices of housing services and study two previously unexamined dimensions of the efficiency costs of rent controls: (1) the effects of expected rent control benefits on the propensity to be a homeowner and (2) the influence of these benefits on residential mobility.
It is instructive to begin this evaluation of resource cost effects by noting that the physical condition of rent-controlled units was substantially less than for uncontrolled units. Table 1 indicates that while less than 1% of uncontrolled units were described as dilapidated, 7% of controlled units were described as dilapidated. Similarly, 24% of controlled units and only 3-4s of uncontrolled units were described as deteriorating. While we do
i51n 1970 there were approximately 2 million renter-occupied housing units in New York City. Of these, approximately 57% or 1.14 million were subject to rent controls. At an average subsidy benefit of $2439, this yields an aggregate benefit of $2.78 billion. The rents paid in New York City were $2698 annually for the 57% of the units which were controlled, and $5314 annually for the remaining 43% of the units. This yields a total rental bill of $7.65 billion. Dividing aggregate benefits by aggregate rental payments yields approximately 36%.
i6The bibliography in Block and Olsen [2] provides an excellent guide to this literature.

RENT CONTROL IN NEW YORK CITY 67
not suggest that all of these differences are necessarily due to rent controls, these differences in housing conditions are sizable.
Relatively little is known about how rent controls affect the shadow prices of the underlying housing traits. In order to examine this issue, hedonic rental equations were estimated for both housing sectors. The first set of columns in Table 5 presents the uncontrolled sector hedonic results while the second set of columns displays the hedonic rental regression for the controlled sector.17As expected, the R2 value (0.54) for the uncontrolled sector was substantially higher than the R* value (0.43) for the controlled sector. This is because with rent controls a given bundle of traits conveys less value-oriented information as controlled rents do not reflect market valuations and are more randomly determined. The shadow prices for most traits were significantly lower (in absolute value) in the controlled sector. Most striking was the effect of rent controls on the value of added space (represented by the number of bedrooms and number of other rooms), particularly in Manhattan. For example, the price of space fell by over 50% in units outside of Manhattan and the sizable Manhattan premium found in the uncontrolled sector was drastically reduced in the controlled sector. Thus, while an uncontrolled Manhattan apartment had a shadow price for a bedroom of $1847 (or $1122 above the shadow price of this trait in other boroughs), for rent-controlled Manhattan apartments the shadow price was only $224! Furthermore, in the controlled sector the shadow price of additional space was either the same or less than in the other boroughs. This flattening of price differentials indicates that rent controls induced substantial price distortions and thus significant resource misallocation effects.
It is also noteworthy that while tenancy duration raised rents in the uncontrolled sector by almost $200 for each year of tenancy, in the controlled sector rents fell by almost $50 for each year of additional tenancy. We suspect that the positive shadow price of length of tenancy in the uncontrolled sector reelects the fact that holding other housing traits constant, those units with longer observed tenancy durations have dispro-
“The regressions used are linear annual rental (in 1984 dollars) equations. Regressions were also run for the natural log case. A Box-Cox comparison of these two cases showed the linear specification to be superior.
In order to control for the fact that length of tenancy may impact rents, tenancy duration is included as a regressor. Since tenancy duration may not be independent of rents in the controlled sector, a two-stage least-squares approach was employed. Specifically, we estimated a reduced form equation for tenancy duration (as a function of personal characteristics) on the sample of uncontrolled renters. This reduced form equation is then used to obtain predicted tenancy duration for both controlled and uncontrolled sector observations. The hedonic price coefficient estimates proved to be robust with respect to whether actual or predicted tenancy duration was used.

GYOURKO AND LINNEMAN
TABLE 5 Hedonic Annual Rent Coefficients
Uncontrolled sector Controlled sector
Independent variables
Results for all Additional boroughs but Manhattan
Manhattan impact
Intercept
1 If Queens or Richmond
1 If Brooklyn
1 If Bronx
No. of bedrooms
No. of other rooms
1 If built 1967-68
1 If built 1960-66
1 If built 1947-56 (built pre-1947 omitted)
1 If steam heat
1 If central heat
1 If no heat (other heat omitted)
1 If good housing
1 If deteriorating housing
- 8355.07 (3488.15) 6599.09
(4130.06) 6307.69
(4130.31) 6406.97
(4130.13) 724.73 (47.51) 393.56 (67.57)
2484.27 (291.78) 1652.06 (128.71) 954.66
(123.75) 306.39
(333.55) 218.59
(381.24) - 1718.18 (2042.14)
573.06 (409.94) 455.31
(dilapidated housing omitted) (434.10) 1 If first floor, with elevator 2214.40
(2048.85) 1 If second Boor, with elevator 2091.73
(2048.45) 1 If third floor, with elevator 2169.59
(2049.51) 1 If fourth floor, with elevator 2237.49
(2048.56) 1 If fifth floor, with elevator 2418.95
(2045.91) 1 If first floor, no elevator 1712.87
(2057.92) 1 If second floor, no elevator 1640.85
(2058.51)
1121.89 (89.75)
1569.79 (125.81)
- 154.25 (465.95)
- 306.79 (263.73)
- 814.39 (273.15)
- 4134.54 (2061.23)
- 2558.37 (2076.18)
0
5202.15 (1020.66) 5207.84
(1086.12) - 1486.88
(2178.46) - 988.32 (2168.52)
- 1365.25 (2171.14) - 964.19 (2168.53)
- 1142.52 (2158.04)
- 1971.56 (2168.72)
- 1944.86 (2173.85)
Results for all boroughs but
Manhattan
Additional Manhattan
impact __-~--
40.84 (430.12) 390.16
(503.99) 200.17
(502.13) 132.07
(505.34) 309.72 (20.40) 233.99 (27.75)
- 85.99 (32.30) 55.79
(43.11)
913.16 - 206.52 (154.66) (311.84) 1009.46 1003.06 (242.77) (491.32) 352.06 433.55
(443.22) (708.51) 451.72 273.98 (61.22) (112.41) 240.31 24.19 (65.72) (114.09) 625.02 - 39.48
(110.26) (179.20) 788.83 376.19
(106.37) (169.79) 939.13 77.96
(109.87) (172.63) 695.56 491.50
(109.39) (177.51) 769.89 877.46 (95.92) (144.29) 173.77 128.26 (85.23) (127.43) 139.61 25.04 (83.86) (118.37)

RENT CONTROL IN NEW YORK CITY 69
TABLE 5- Continued
Uncontrolled sector Controlled sector -
Independent variables
Results for all Additional Results for alI boroughs but Manhattan boroughs but Manhattan impact Manhattan
1 If third floor, no elevator
1 If fourth floor, no elevator (fifth floor + , no elevator omitted)
1 If furnished
1 If bathroom
1 If l-2 units in bldg.
1 If 3-4 units in.bldg.
1 If 5-9 units in bldg.
1 If lo-12 units in bldg.
1 If 13 -19 units in bldg.
1 If 20-49 units in bldg.
1 If 50-99 units in bldg. (100 + units omitted)
No. of stories in bldg.
Tenancy length by occupant
R2:
F:
Prob. > F: df:
1545.07 - 1408.40 (2059.57) (2179.19) 1986.65 - 3596.50
(2147,24) 729.79
(233.99) - 324.54 (580.66) 519.33
(369.50) - 336.26 (373.96)
- 283.22 (399.98)
- 516.26 (557.07)
- 533.83 (536.68)
- 398.79 (187.72)
- 433.31 (104.28)
41.13 (78.39) 197.61 (28.50)
(2274.01) 522.42
(371.02) 5008.48
(2210.15) - 280.79
(902.06) - 4064.72 (2162.31)
- 1095.05 (892.63)
- 360.26 (830.42)
- 388.03 (863.24) 118.84
(431.69) - 233.08 (214.46)
25.68 (216.01)
90.13 72.52 (83.84) (118.79) 150.19 - 89.45
(86.40) 310.55 (95.15) 425.74 (75.79)
- 278.52 (126.15)
- 358.43 (106.56)
- 537.36 (97.78)
- 313.07 (122.05)
- 488.99 (104.25)
- 393.35 (78.70)
- 228.51 (74.84) 28.59
(25.83) - 46.32
(2.37)
(120.11) 400.32
(135.98) 24.62
(107.75) 1251.57 (432.86)
98.72 (262.69) - 57.23 (176.52)
- 744.81 (182.14)
- 799.40 (161.44)
- 895.58 (131.24)
- 810.23 (123.80) 191.06 (52.44)
0.536 0.431 82.58 76.82
.ooo1 .OOOl 4367 5679
Additional Manhattan
impact
Note: Standard errors in parentheses.
portionately high levels of unmeasured housing quality and hence higher rents. Thus, the negative tenancy duration shadow price in the controlled sector reveals that the rent control process gave sufficiently generous subsidies to those who had long expected tenancy durations to more than offset the unmeasured quality component.
A potentially large efficiency effect of rent controls is that the expectation of subsidized rents induces nonoptimal homeownership patterns. In order
70 GYOURKO AND LINNEMAN
TABLE 6 Mean Values of Partial Derivatives on
Homeownership Propensities (Owners and Uncontrolled Sector Renters)
Expected rent control benefits
Annual income
Family size
Age of head
Black head
Male head
Single head
Puerto Rican head
-2hlikelihood Model x2 with 8 df
- o.ooo1o (11.29) - o.ooooo2
(8.47) 0.125
(25.46) 0.017
(28.36) 0.0012
(0.01) -0.037 (1.16)
- 0.137 (4.32)
- 0.174 (4.55)
11167.36 1989.10
Note: Asymptotic t statistics of the logistic regression coefficients are in parentheses.
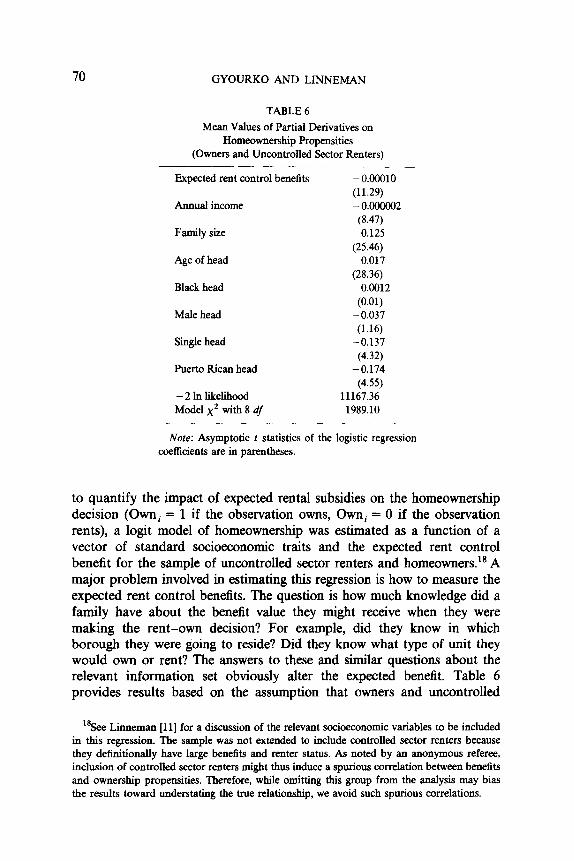
to quantify the impact of expected rental subsidies on the homeownership decision (Own, = 1 if the observation owns, Own, = 0 if the observation rents), a logit model of homeownership was estimated as a function of a vector of standard socioeconomic traits and the expected rent control benefit for the sample of uncontrolled sector renters and homeowners.‘8 A major problem involved in estimating this regression is how to measure the expected rent control benefits. The question is how much knowledge did a family have about the benefit value they might receive when they were making the rent-own decision? For example, did they know in which borough they were going to reside? Did they know what type of unit they would own or rent? The answers to these and similar questions about the relevant information set obviously alter the expected benefit. Table 6 provides results based on the assumption that owners and uncontrolled
%ee Linneman [ll] for a discussion of the relevant socioeconomic variables to be included in this regression. The sample was not extended to include controlled sector renters because they definitionally have large benefits and renter status. As noted by an anonymous referee, inclusion of controlled sector renters might thus induce a spurious correlation between benefits and ownership propensities. Therefore, while omitting this group from the analysis may bias the results toward understating the true relationship, we avoid such spurious correlations.

RENT CONTROL IN NEW YORK CITY 71
sector renters formed their rental benefit expectations based upon what individuals with similar socioeconomic characteristics received when they rented, that is, based upon the conditional renter benefit regression in the fourth column of Table 3.19
The results reported in Table 6 are the partial derivatives of the propen- sity to own evaluated at the mean. All variables except income and race show the expected signs. However, both of these impacts are relatively small and the race effect is not statistically different from zero at conven- tional significance levels.2o
The expected rent control benefits had a signScantly negative influence on the propensity to own. That is, consumers with large expected rent control benefits had lower demands for homeownership. The partial deriva- tives indicate that an additional $1000 in expected annual benefits (ap- proximately the size of the average expected benefit) induced a decline in the average propensity to own of 10%. This sizable distortion caused by rent controls has not been previously quantified.
The final resource misallocation impact we examine is the influence of rent controls on residential mobility. Rent control benefits may induce residents to move from a unit in the owner-occupied or uncontrolled sector earlier than they would have if a subsidized unit became available. On the other hand, once in a controlled sector apartment, rent controls provide an incentive to remain in that unit and lock-in a long-term and (based upon the hedonic regression in Table 5) increasing level of benefits.
We test for the effect of rent control subsidies on mobility by regressing the length of tenancy by the current head of the household on a vector of family socioeconomic characteristics and the expected rent control benefits.
Again, a problem in estimating this regression is that we cannot be certain of the information residents had when forming their benefits expec- tations. We assume that residents already in controlled units expected to receive benefits equal to those which they were receiving, while owners and uncontrolled apartment renters expected benefits equal to their conditional rental benefits (Table 3, column 4).
The first column of Table 7 reports the regression results for the sample of controlled sector renters. As expected, the length of tenancy duration rises signihcantly with the renter’s rent control benefits. That is, controlled sector renters with large benefits are unlikely to move for fear of reducing or even losing (if they moved outside of the controlled sector) these
19As with the analysis of the distributional effects, we consider only the effect of the current subsidy at the given point in time.
“The logit parameters are available upon request. We report the partial derivatives evaluated at a homeowner&p propensity of 0.53 (the mean for this sample) for ease of interpretation.

72 GYOURKO AND LINNEMAN
TABLE 7 Tenancy Duration
Intercept
Age
(Age) *
Family size
(Family ~ize)~
Annual income
(Axmual income)2
Black
Single male
Single female
Puerto Rican
Expected benefit
(Expected benefit)*
R2: F:
Prob. > F: N
Controlled sector renters
Owners Uncontrolled
sector renters
- 2.01
(0.85) -0.004
(0.032) 0.001
(0.0003) -0.21 (0.22)
- 0.01 (0.03) 0.00001
(O.OOOol) -3.28E - 11 (6.53E - 11)
- 1.17 (0.22)
-0.78 (0.38)
- 0.23 (0.22)
- 2.41 (0.26) 0.003
(O.oooo9) - 5.03E - 08 (1.18E - 08)
-__.-- -0.13 (1.75) 0.11
(0.07) 0.003
(0.~) 0.91
(0.32) -0.04 (0.04)
- O.c#l (0.00001) 4.37E - 10
(6.30E - 10) -2.82 (0.35) 0.46
(0.78) 1.91
(0.39) -4.53 (0.78)
- 0.002 (0.0005)
-4.88E - 07 (1.25E - 07)
-~ -0.83 (0.54) 0.16
(0.02) - 0.001 (0.0002) 0.05
(0.16) 0.005
(0.019) - O.OOOOOl (O.OOOOO5) 9.67E - 12
(3.OOE - 11) - 0.67 (0.16)
-0.24 (0.25)
-0.12 (0.16)
-0.57 (0.32) 0.00004
(0.0012) -2.06E - 08 (4.24E - 08)
0.643 0.292 0.102 769.39 176.32 42.74
.OOOl .ooo1 .OOOl 5144 5092 4429
benefits. In contrast, the second column of Table 7 reveals that the tenancy duration of homeowners was negatively related to the expected benefit. Similarly, the results in the third coh,unn of Table 7 indicate that the tenancy duration of uncontrolled renters declines with expected benefits although the effect for that group of renters is not statistically significant.
Taken together these results indicate that the expectation of rent control benefits altered mobility patterns, particuIarly of controlled sector renters. Specifically, rent controls encouraged excessive immobility among con- trolled sector renters while they had a slight tendency to encourage exces-

RENT CONTROL IN NEW YORK CITY 73
sive mobility among families hoping to obtain controlled apartments. This latter result may reflect that families with high benefit expectations make a series of small housing consumption adjustments rather than making more discrete and costly adjustments in the hope that they will ultimately obtain a highly subsidized controlhzd unit.
The finding that controlled sector renters with high benefit levels had longer tenancy durations is another reflection of the fact that the long-lived and strict New York City law provided substantial subsidies to residents of older units. The tenancy duration results in combination with our findings of substantial influences on homeownership propensities and housing trait prices indicate that the small redistributive impacts associated with rent controls were achieved at the expense of substantial efficiency costs. This conclusion is strengthened when one realizes that we have not attempted to calculate all of the efficiency costs of rent controls. Furthermore, we have ignored the administrative costs of rent controls.
SECTION 7: CONCLUSIONS
This paper provides many new insights into the ramifications of rent controls based on the situation which existed in 1968 in New York City. The findings demonstrate that almost none of the variation in benefits across individuals could be explained along socioeconomic lines. Rent controls in New York City had little if any distributional impact due to the ineffective targeting of benefits. Thus, while many poor families were aided by the rent controls, the same was also true for middle and upper income families.
Particularly interesting were the results on how blacks and Puerto Rican families fared relative to whites. Economists have long predicted that racial discrimination could result in markets where nonprice rationing occurred. Blacks and Puerto Ricans in the controlled sector received lower benefits than their white counterparts. However, both groups tended to be overrep- resented in the controlled sector relative to their share in the renter population. Thus, although we found sign&ant differences between the rent control benefits expected by blacks and Puerto Ricans relative to their white counterparts, these difIerences were not as large as the benefit differences found among controlled sector renters.
New evidence on the effects of rent control on the prices of housing services was also provided. For rent-controlled apartments, very large drops in the prices of many housing traits occurred. In general, there was a general “flattening” of trait shadow price differentials found in the uncon- trolled sector.
Finally, estimates on how rent controls distorted optimal ownership and mobility patterns were provided. Increased expected rent control benefits led to a notable drop in the propensity to own and also slightly decreased

74 GYOURKO AND LINNEMAN
mobility of noncontrolled sector. Furthermore, the tenancy duration of controlled sector renters was significantly increased by the expectation of rent control benefits. Taken together, our findings suggest that rent controls have done very little to improve the distribution of resources but they have exerted large efficiency effects.
REFERENCES 1. G. BECKER, “The Economics of Discrimination,” 1st ed., Univ. of Chicago Press, Chicago
(1957). 2. W. BLOCK AND E. OLSEN, Eds., “Rent Control: Myths and Realities,” Simon Fraser
Institute (1981). 3. J. S. DE SALVO, Reforming rent controls in New York City: Analysis of housing
expenditures and market rents, Reg. Sci. Assoc. Papers, 195-227 (1971). 4. G. FALLIS AND L. B. SMITH, Uncontrolled prices in a controlled market: The case of rent
controls, Amer. Econom. Rev., 74(l), 193-200 (1984). 5. M. FRIEDMAN AND G. STIGLER, Roofs or ceilings? The current housing problem, in “Rent
Control: Myths and Realities” (W. Block and E. Olsen, Eds.), Simon Framer Institute (1981).
6. J. GYOURKO AND P. LINNEMAN, “Rent Controls and Rental Housing Quality: A Note on the Effects of New York City’s Old Controls,” Wharton Real Estate Center Working Paper, University of Pennsylvania, J. Urban Econ. (1989a), in press.
7. J. GYOURKO AND P. LINNEMAN, “Measurement Problems in Quantifying the Distribu- tional Effects of Subsidy Programs,” Wharton Real Estate Center Working Paper, University of Pennsylvania, J. Urban Econ., (1989b), in press.
8. J. A. HAUSMAN, Exact consumer surplus and deadweight loss, Amer. Econom. Rev., 71(4), 662-676 (1981).
9. D. G. JOHNSON, Rent control and the distribution of income, Amer. Econom. Rev., 41, 569-582 (1951).
10. P. LINNEMAN, “Income Distribution Effects on Renter of Rent Controls: The Case of New York City,” unpublished manuscript (1984).
11. P. LINNEMAN, An economic analysis of the homeownership decision, J. Urban Econom., 17, 230-246 (1985).
12. D. MARKS, The effects of rent controls on the price of rental housing, Lund Econom., 60, 81-94 (1984).
13. E. 0. OLSEN, An econometric analysis of rent control: An empirical analysis of New York’s experience, J. Politic. Econom., 1081-1110 (1972).
14. A. M. POLINSKY, The demand for housing: A study in specification and grouping, Econometrica, 4!5(2), 447-461 (1977).
15. E. A. ROISSTACHER, “The Distribution of Tenant Benefits Under Rent Control,” Ph.D. dissertation, University of PeMsylvania (1972).
16. P. C. RYDELL et al., “The Impact of Rent Control on the Los Angeles Housing Market,” Rand Corp., Santa Monica, CA (1981).