carbon beta and equity performance an empirical …4...and equity performance an empirical analysis...
TRANSCRIPT

Carbon Beta™ and Equity Performance An Empirical AnalysisMoving from Disclosure to Performance
October 2007

Innovest Strategic Value Advisors Cabon Beta™ Ratings Methodology www.innovestgroup.com 2007
1
Table of Contents
Chapters
1 Purpose of the Study: Moving From Awareness to Action...........................................................................................3
2 Context for the Study: The Financial and Fiduciary Imperatives .................................................................................4
3 The Business Case and Investment Logic .....................................................................................................................5
4 The Variability of Climate Risk….....................................................................................................................................6
5 The Limitations of analysis purely based on disclosure or emissions .......................................................................6
6 Innovest’s Carbon Beta™ Rating Platform....................................................................................................................11
7 Summary of the Study Methodology ............................................................................................................................18
8 Carbon Beta and Investment Performance: The Research Results ..........................................................................19
9 Conclusions ....................................................................................................................................................................26
Appendix 1 .............................................................................................................................................................................27
Appendix 2 .............................................................................................................................................................................29
Appendix 3 .............................................................................................................................................................................33

Innovest Strategic Value Advisors Cabon Beta™ Ratings Methodology www.innovestgroup.com 2007
2
“There will be a large creation and re-distribution of shareholder value in the transition to a low carbon economy—there will be winners and losers at sector level, and within sectors at company level. The winners are more likely to be those businesses that take the time to understand and address this complex area.”
Tom Delay, Chief Executive, The Carbon Trust “Climate Change and Shareholder Value” Report

Innovest Strategic Value Advisors Cabon Beta™ Ratings Methodology www.innovestgroup.com 2007
3
1 Purpose of the Study: Moving From Awareness to Action
While institutional investor awareness of climate risk has increased dramatically (e.g. Carbon Disclosure Project, Investor Network on Climate Risk, Institutional Investors Group on Climate Change, etc.), only a tiny handful have moved beyond rhetoric and shareholder resolutions to take concrete investment action – namely, incorporating climate risk considerations directly and systematically into their actual stock selection and portfolio construction processes. It is at that level –where the “rubber meets the road”—that investors can send the strongest message to companies, produce significantly changed company behavior, and, most importantly, improve their long-term, risk-adjusted returns. Unfortunately, however, we currently estimate that far less than .1% of the CDP signatories’ $40 trillion+ in assets is currently invested in any investment strategy which explicitly and systematically takes climate risk into account.
There have been a number of reasons for this:
» Investment professionals have long believed that company resources devoted to environmental issues are either wasteful or actually injurious to their competitive and financial performance and therefore to both the performance of the companies themselves and investor returns;
» As a direct result, money managers, pension fund consultants, and even pension fund trustees have historically regarded explicitly addressing environmental factors in their investment strategies as incompatible with the proper discharge of their fiduciary responsibilities;
» Until recently, there has been a dearth of robust, credible research evidence and analytical tools linking companies’ environmental performance directly with their financial performance
In order for this situation to change significantly, investors will require at least four things:
» Compelling evidence that integrating climate risk analysis can in fact enhance risk-adjusted financial performance – in short, a robust investment case;
» Compelling evidence that the variance in net climate risk exposure among companies is sufficiently large to warrant investor attention (see chart on page 8 for an example of the significant variability which does exist);
» A comprehensive and sophisticated analytical framework for assessing relative and absolute climate-risk;
» Company-specific information and analysis
The purpose of this study is to try to help satisfy the first three of these essential preconditions for improved institutional investor decision-making and action on climate change, and to provide a concrete example of the fourth.
At present, we believe that far too much attention is focused on two elements of the carbon risk equation which are overly simplistic indicators at best and dangerously misleading at worst: the level of company disclosure, and overall emissions levels. Our own empirical research has confirmed that, while information about each of these variables is potentially useful and important, unless they are supplemented by far more robust and sophisticated analysis, they are woefully inadequate for investors’ purposes. One of the
Innovest Strategic Value Advisors Cabon Beta™ Ratings Methodology www.innovestgroup.com 2007
4
principal motivations for the current study is the desire to elucidate what that more robust framework might look like.
2 Context for the Study: The Financial and Fiduciary Imperatives Few environmental issues pose as real, significant, and widespread a financial threat to investors as climate change. International policy responses aimed at cutting greenhouse gas emissions, together with the direct physical impacts of climate change will require investors and money managers to take a much closer look at how their portfolios might be affected by company ‘carbon’ risks and opportunities.
Since there is now growing and incontrovertible evidence that superior overall environmental performance can in fact improve the risk level, profitability, and stock performance of publicly-traded companies1, and given the emergence of climate change as arguably the pre-eminent environmental issue of our time, fiduciaries can now be seen to be derelict in their duties if they do not consider climate-driven risks and opportunities where they may be material. Investors and other fiduciaries would be well advised to assess their portfolios for carbon risk, for at least four reasons:
» There is increasing evidence showing that superior performance in managing climate risk is a useful proxy for superior, more strategic corporate management, and therefore for superior financial performance and shareholder value-creation;
» The considerable variations in “carbon performance” among same-sector industry competitors are currently not transparent to, nor well understood by, mainstream Wall Street and City analysts. As a result, carbon-driven risks and value potential remain, for the present at least, almost entirely hidden from view;
» In the longer term, the out-performance potential will become even greater as the capital markets become more fully sensitized to the financial and competitive consequences of environmental and climate change considerations;
» There is strong evidence of dramatic increases in the level of institutional investor concern – and intervention – with climate change issues and their investee companies.
This last trend is perhaps best exemplified by the formation of three different groups of concerned institutional investors: the Carbon Disclosure Project, the Investor Network on Climate Risk, and the Institutional Investor Group on Climate Change. The former is a global coalition of over 300 institutional investors, with combined assets of over $40 trillion; the second comprises over 50 U.S. institutional investors. INCR signatories include a number of U.S. State treasurers, as well as several leading labor funds with over $4 trillion in assets. The third organization includes over 35 of the leading institutional investors in Europe. Innovest has provided the research for the global Carbon Disclosure Project for each of the five years of its existence.
1 See Bauer et al (2005) ‘The Eco-Efficiency Premium Puzzle in the U.S. Equity Market,’ Financial Analysts Journal, Volume 61, Issue 2, 2005; K. Gluck and Y. Becker (2005) ‘The Impact of Eco-Efficiency Alphas,’ Journal of Asset Management, Volume 5, 4, 2005.

Innovest Strategic Value Advisors Cabon Beta™ Ratings Methodology www.innovestgroup.com 2007
5
3 The Business Case and Investment Logic
A Market Price for Carbon Is Now a Reality…
Historically, institutional investors—even foundations active in combating climate change on the program side—have been slow to respond to climate risk. All of this, however, is changing rapidly. In many parts of the world, fiduciaries are already legally required to address environmental risks in their investment strategies, precisely because these “non-traditional” risk factors demonstrably can affect companies’ financial performance.
It is now increasingly widely recognized by leading-edge financial analysts and investors that there is a strong, positive, and growing correlation between industrial companies' “sustainability” in general, and climate change in particular, and their competitiveness and financial performance. “Carbon risk” is, today, arguably the most salient of these sustainability factors for investors.

Innovest Strategic Value Advisors Cabon Beta™ Ratings Methodology www.innovestgroup.com 2007
6
CO2 Regulatory Cost of Compliance as Percentage of EBITDA
13.69%12.90%
19.21%
0.43%
2.72%2.00%
37.85%
>50.00%>50.00%
46.25%
2.91%1.26%2.00% 1.48%
0.00%
5.00%
10.00%
15.00%
20.00%
CommodityChemicals
Steel Integrated Oil & Gas Multi-Utilities &Unregulated Power
Metals & Mining Electric Utilities -International
ConstructionMaterials
Cos
t of C
ompl
ianc
e as
EB
ITD
A%
fo
r CC
h, S
teel
, and
IO &
G
0.00%
10.00%
20.00%
30.00%
40.00%
50.00%
Cos
t of C
ompl
ianc
e as
EB
ITD
A%
Max case Min case
Allegheny Tech.
Rautaruukki
CRH
Hanson
Centrica
CMS Energy
Drax
Fortum
Toray
Nova
Statoil ASA
Tosco
Umicore
Kinross Gold Corp.
4 The Variability of Climate Risk…
Risk Exposures and Costs Vary Widely, both Between and Within Sectors…
Investors need to know which companies are which.
5 The Limitations of analysis purely based on disclosure or emissions
In Innovest’s view, investors simply cannot rely on companies’ public disclosures alone as a basis for stock selection and portfolio construction. There are two primary reasons for this:
1. Disclosure information is notoriously unreliable, inconsistently reported across companies and over time, and generally not validated by independent third parties; and,

Innovest Strategic Value Advisors Cabon Beta™ Ratings Methodology www.innovestgroup.com 2007
7
(50)
-
50
100
150
200
250
Jun2004 Sep2004 Dec2004 Mar2005 Jun2005 Sep2005 Dec2005 Mar2006 Jun2006 Sep2006 Dec2006 Mar2007 Jun2007
Difference ISVA Cbeta - CLI
CLI Performers
Innovest Carbon Performers
2. Emissions data alone provides less then 25% of the information a sophisticated investor requires. We believe that much more comprehensive and robust models and analysis are required. (We describe Innovest’s 4-factor Carbon Beta model in the Appendix.)
In order to test these hypotheses, Innovest analyzed and compared the three-year financial performance of global “climate leaders” selected on two very different bases:
» “Disclosure Leaders” from Innovest’s research for the 2007 Carbon Disclosure Project (The Climate Leadership Index or “CLI”); and,
» “Performance Leaders” selected using Innovest’s proprietary, 4-factor Carbon Beta© model (ISVA Cbeta).
As the performance graph below illustrates, using a more sophisticated and robust – “beyond disclosure” – analytical model and information inputs can indeed generate superior share price performance. Over the 3-year test period, the annualized out-performance premium of the Carbon Beta model exceeded 300 basis points (3%).
Differential in total return performance between Innovest Performance Leaders and CDP Climate Leaders
It is notable from the data that the “carbon beta premium” is largest over the two most recent years, when regulatory responses to climate change have been at their most robust.
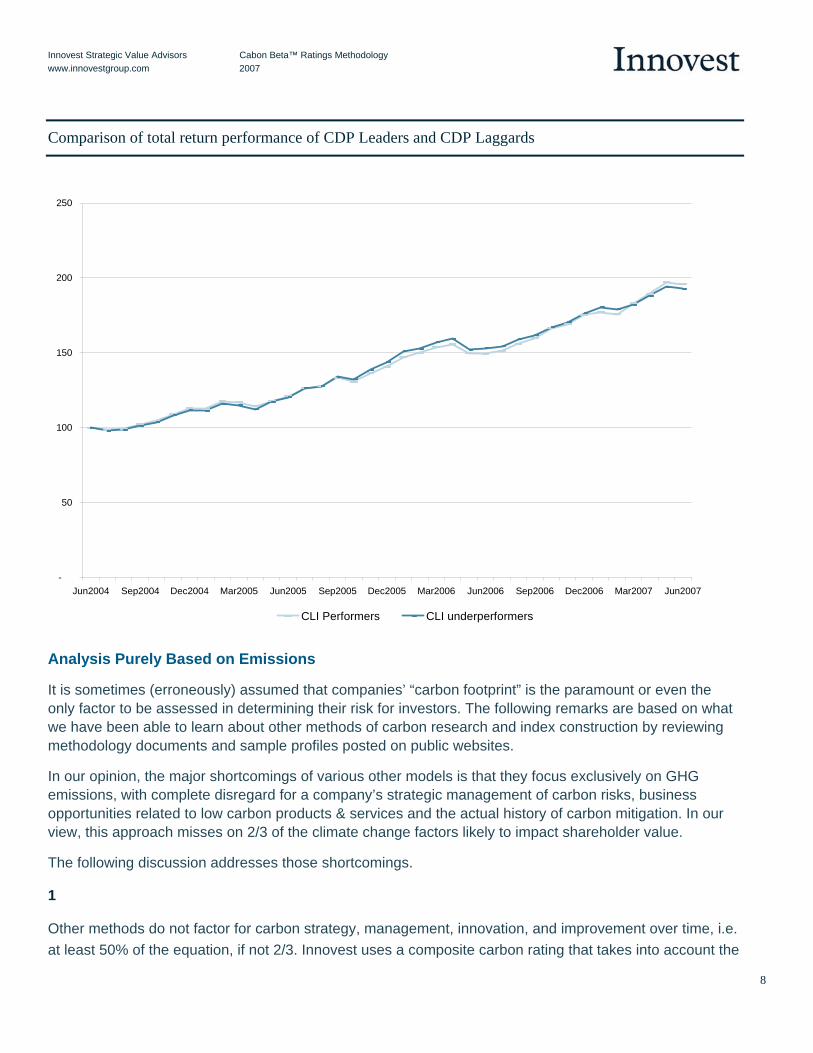
In order to investigate the relationship between disclosure and financial performance in even greater depth, we conducted additional statistical tests. We compared the share price performance of CDP-based “disclosure leaders” to those of “disclosure laggards”.2 The results in the performance graph below should be somewhat unsettling for those placing undue reliance on purely disclosure-based analysis: there was essentially no difference between the financial performance of leaders and laggards. Simply put, it would appear that, whatever its other merits, publicly disclosed information alone is an insufficient basis for achieving superior investment returns.
2 In technical terms, a parameter stability test was conducted to test for any financial performance differences. Regression coefficients were utilized with the two sets of time series. The results are valid at a confidence interval of 99%.
Innovest Strategic Value Advisors Cabon Beta™ Ratings Methodology www.innovestgroup.com 2007
8
Comparison of total return performance of CDP Leaders and CDP Laggards
Analysis Purely Based on Emissions
It is sometimes (erroneously) assumed that companies’ “carbon footprint” is the paramount or even the only factor to be assessed in determining their risk for investors. The following remarks are based on what we have been able to learn about other methods of carbon research and index construction by reviewing methodology documents and sample profiles posted on public websites.
In our opinion, the major shortcomings of various other models is that they focus exclusively on GHG emissions, with complete disregard for a company’s strategic management of carbon risks, business opportunities related to low carbon products & services and the actual history of carbon mitigation. In our view, this approach misses on 2/3 of the climate change factors likely to impact shareholder value.
The following discussion addresses those shortcomings.
1
Other methods do not factor for carbon strategy, management, innovation, and improvement over time, i.e. at least 50% of the equation, if not 2/3. Innovest uses a composite carbon rating that takes into account the
-
50
100
150
200
250
Jun2004 Sep2004 Dec2004 Mar2005 Jun2005 Sep2005 Dec2005 Mar2006 Jun2006 Sep2006 Dec2006 Mar2007 Jun2007
CLI Performers CLI underperformers

Innovest Strategic Value Advisors Cabon Beta™ Ratings Methodology www.innovestgroup.com 2007
9
company’s Carbon Management Strategy; Carbon Risk Exposure; Strategic Carbon Opportunities; Improvement Trend; and, Carbon Footprint.
In other words, solely considering companies based on their carbon intensity regardless of the sector characteristics would imply that some companies are good investments simply because the operate in sectors with a low carbon footprint, such as software for instance. Consequently, emissions’ based ranks do not use the concept “best in class” in their assessments. Instead, use only an absolute measure of the cost of externalities. Innovest measures both the absolute impact (direct, indirect and market related) and the relative risk exposure “best-in-class” and carbon beta coefficient.
Another flaw of these models, is that good companies would be left out in the construction of an index only because their carbon intensity is high. For instance, Exxon is rated BB by Innovest and has a direct carbon intensity of 420 CO2e per $ billion; while Royal Dutch Shell is AAA and with a direct carbon intensity of 424 CO2e per $ billion. With this easy example we can see that a “Carbon Minimized CO2e per Revenue Portfolio is not the same as a “Carbon Optimized Portfolio”. In our view, an emission only focused approach would lead inexorably to missing good picks.
This being said, from Innovest’s proprietary research platform it is possible to build a Carbon Minimized Portfolio or a hybrid.
Another aspect that seems questionable in solely emission’s based methodologies is that they claim to be able to calculate: "first-tier emissions… i.e., those emissions purchased upstream from the company’s direct suppliers. These include purchased electricity, business travel, and freight." Companies themselves have difficulties in monitoring, reporting, and verifying their own direct emissions. A company faces even more difficulties when it has to assess emissions from its own suppliers, and even more to attribute the share of these emissions to its business with that supplier. In our view, it is doubtful a third party researcher can assess these emissions with any confidence.
2
Emissions’ based methods equate Climate risk to direct and indirect levels of carbon intensity, as measured by CO2e emissions/$ revenues. This is a misleading simplification. As we know, the risk is threefold:
a) Direct risk, mainly through carbon caps on GHG emissions;
b) Indirect risk: from increased costs of electricity and supplies; and,
c) Market Related: though change of consumer patterns (e.g. automobiles).
This corresponds to scope 1, 2, and 3 of the Intergovernmental Panel of Climate Change. Other methods address a) and b), but not c).
In addition, it is not completely true to say that the carbon direct risk is proportional to the direct level of GHG emissions. Emissions permits are grandfathered and negotiated with companies. That is, in order to reach an emissions reduction target, permits are allocated for free according to the company’s historical levels. In this sense, a company could have a high level of emissions but it might have been improving over time. Therefore, if emissions are grandfathered, this company might be already under its mandatory emissions level and have a surplus of allowances. Accordingly, it would realize a profit by selling the excess allowances that were grandfathered. The consequence of approach used in of solely emissions’

Innovest Strategic Value Advisors Cabon Beta™ Ratings Methodology www.innovestgroup.com 2007
10
based methods is that good companies that have been improving in the way they manage their carbon risk will be punished just because of their size and sector classification.
Another factor is that the carbon regulatory constraints will vary by country. As a result, companies with high levels of emissions that operate in non-regulated locations have a competitive advantage relative to other peers that are largely based in regulated areas.
To address and quantify the global nature of the GHG global regulatory constrains, Innovest developed the Weighted Average Country Carbon Reduction Target. 3 The WACCRT™ refers to the expected emissions reduction targets according to applicable legislation where a company has relevant assets, domestically and internationally. In this sense, the metric shows a weighted average for the restrictions that a company faces in the countries and regions it operates during the mandated compliance period.
3
As far as other portfolio screening techniques are concerned, most of the carbon footprint differential that is obtained through these methods comes primarily from the different sector allocation of funds rather than actual carbon footprint of companies. For example, using this measure, a fund invested primarily in basic industries will easily be rated at 10 times the footprint of a diversified fund, This also means that they are ranking companies’ structural business involvement (SIC codes), almost completely disregarding companies differential performance based on their actual productivity, innovation and efforts to curb their emissions.
4
Other methods use various systems to guesstimate emissions. Nevertheless, they fail to disclose the rate of real carbon data vs. estimated ones. The Carbon Disclosure Project UK FTSE350 indicates that the carbon data disclosure rate is 27%. This indicates that such an approach is guesstimating 73% of direct emissions and probably close to 100% of so-called "First-tier emissions".
Furthermore, in recent disclosures we have found that the data is only accurate for a small percentage of the companies based on company carbon reporting. The vast majority of the data is then adjusted via some black box methodology. These approaches tend to rank companies’ structural business involvement (as approximated by SIC codes), almost completely disregarding companies differential performance based on their actual productivity, innovation and efforts to curb their emissions.
5
Finally, some studies conclude that there is no relationship between financial performance and carbon intensity by using CO2e/$ as the only explanatory variable of portfolio returns. Financial performance depends on multiple factors beyond emissions per revenue, and this is why they do not find any significant relationship with this only factor.
Moreover, correlation between the variables ‘carbon intensity’ and ‘financial performance’ fluctuates among different sectors and within the same sector. These studies do not neutralize for this effect either.
3 See Carbon Financials on page 15 of this report.

Innovest Strategic Value Advisors Cabon Beta™ Ratings Methodology www.innovestgroup.com 2007
11
6 Innovest’s Carbon Beta™ Rating Platform
In order to assist its institutional clients in assessing the level of net risk exposure to climate change in their portfolios and potential future investments, Innovest has developed a proprietary risk analysis model – the Carbon Beta platform. “Carbon beta” is a term coined by Innovest, borrowing from the traditional finance lexicon. It is quite simply, a “shorthand” measure of a company’s net financial and competitive risk exposure to climate change (and of course, the regulatory, public, and consumer responses to it), relative to its same-sector peers. Net carbon risk is defined as a function of the interaction of four key variables:
» Companies’ overall carbon footprint or potential risk exposure, adjusted to reflect differing regulatory circumstances in different countries and regions.
» Their ability to manage and reduce that risk exposure
» Their ability to recognize and seize climate-driven opportunities on the upside
» Their rate of improvement or regression
Innovest has developed a unique carbon-profiling database that currently covers over 2,200 companies from high-impact sectors around the world, and allows comparisons of management strategy and emissions profiles to be drawn among companies on a consistent, systematic basis using the proprietary Carbon BetaTM platform. Innovest’s proprietary Carbon Beta platform identifies and quantifies carbon risk exposures on both a company-specific and portfolio-wide basis. Company-specific carbon rankings identify companies with a superior carbon management in place and those that are relatively better positioned to benefit from carbon regimes, with the potential to generate additional alpha.
The Carbon Beta™ profile comprehends three primary elements:
» Carbon-intensity of different industry sector exposures
» Individual security selection
» Carbon Financials

Innovest Strategic Value Advisors Cabon Beta™ Ratings Methodology www.innovestgroup.com 2007
12
Industry Sector Exposures
In order to identify industry sectors that are the most exposed to climate change risks and opportunities, Innovest has developed a three pronged approach to rate the specific risks of sectors along their entire value chain: upstream, internal and downstream. A composite Carbon Combined Intensity factor (0-lowest exposure, 5-highest exposure) is derived from the three categories of carbon intensities:
Carbon Direct Intensity
This indicator captures exposure to carbon regulations and constraints (offsets, capping, bubbles, energy taxes, and other regulatory instruments). Emissions relate to manufacturing processes, businesses or production at owned sites or from operations over which the company has financial or operational control.
Carbon Indirect Intensity This indicator captures the sector’s sensitivity to upstream energy costs and potential upsurge as a result of a carbon constrained economy. The Carbon Intensity is directly proportional to a sector’s consumption of electricity and other supplies that have caused a large amount of carbon emissions for their production or extraction, i.e., emissions from the suppliers’ assets. (e.g., aluminum making requires a large amount of electricity, which in turn may produce large emissions of carbon dioxide equivalent (CO2e) if reliant upon fossil fuels).
Carbon Market Sensitivity This indicator captures the sector’s market sensitivity to climate change drivers. High sensitivity sectors include sectors producing goods that engender large GHG emissions during the life use of these goods (e.g. oil & gas products, cars and trucks), those sectors whose invested assets can contribute to high or low carbon emissions (e.g. finance and insurance industries), as well as those sectors having strong carbon related opportunities (e.g. energy generation technology manufacturers).
Carbon Combined Intensity. This index, composed by the 3 indicators above, reflects the relative carbon risk exposure of the sectors along the entire value chain.
Applying that methodology to 60+ industries of the Global Industry Classification Standard (GICS), Innovest has determined the 39 most exposed industries, i.e., those industry sectors that have the highest average carbon exposure in terms of potential impact to net earnings, as well as those sectors offering the greatest differential of exposure. By way of illustration, the table below summarizes the combined carbon intensity scores of three of the 39 highest impact sectors:

Innovest Strategic Value Advisors Cabon Beta™ Ratings Methodology www.innovestgroup.com 2007
13
C a r b o n B e t a
=
P a s t P r e s e n t F u t u r e
R i s k F a c t o r s
C a r b o n M a n a g e m e n t
Q u a l i t y
S t r a t e g i c P r o f i t O p p o r t u n i t i e s
C a r b o n I m p r o v e m e n t V e c t o r
C a r b o n B e t a
=
P a s t P r e s e n t F u t u r e
R i s k F a c t o r s
C a r b o n M a n a g e m e n t
Q u a l i t y
S t r a t e g i c P r o f i t O p p o r t u n i t i e s
C a r b o n I m p r o v e m e n t V e c t o r
C a r b o n B e t a
=
C a r b o n B e t a C a r b o n B e t a
=
P a s t P r e s e n t F u t u r e
R i s k F a c t o r s
C a r b o n M a n a g e m e n t
Q u a l i t y
S t r a t e g i c P r o f i t O p p o r t u n i t i e s
C a r b o n I m p r o v e m e n t V e c t o r
FIGURE 1 Composite Carbon Intensity by Industry
GICS Code Industry
Carbon Direct Intensity
(in-house)
Carbon Indirect Intensity
(upstream)
Carbon Market Sensitivity
(downstream)
Carbon Combined Intensity
551010 Electric Utilities 5.0 5.0 5.0 5.0
151040 Metals & Mining 5.0 5.0 3.0 4.4
40xx10 Insurance, Banks & Diversified Financials 0.0 2.0 5.0 1.7
Company Specific Carbon Analysis
Innovest rates the performance of companies within a given industrial sector on a scale from AAA (best in class) to CCC (worst in class), which is broadly similar to bond ratings. In order to generate these ratings, our analysts evaluate companies relative to their same-sector peers, typically including a range of global companies. This is accomplished through the completion of our analytical matrix via review of a wide variety of information from the company, industry trade groups, government databases, research organizations, international organizations. The factors, measured by nominal scores (0, worst in class; 5, average; and, 10, best in class), included in the rating platform are grouped in four main categories as the figure below illustrates.
FIGURE 2 Proprietary Carbon Rating Platform in Brief
Overview of Risk Factors
» Physical risks caused by the direct impacts of climate change itself (such as asset damage of power plants
and project delays of construction, caused by the increasing number of extreme weather events)
» Regulatory compliance risks resulting from mandatory national and international regimes to achieve greenhouse gas (GHG) emission reduction targets
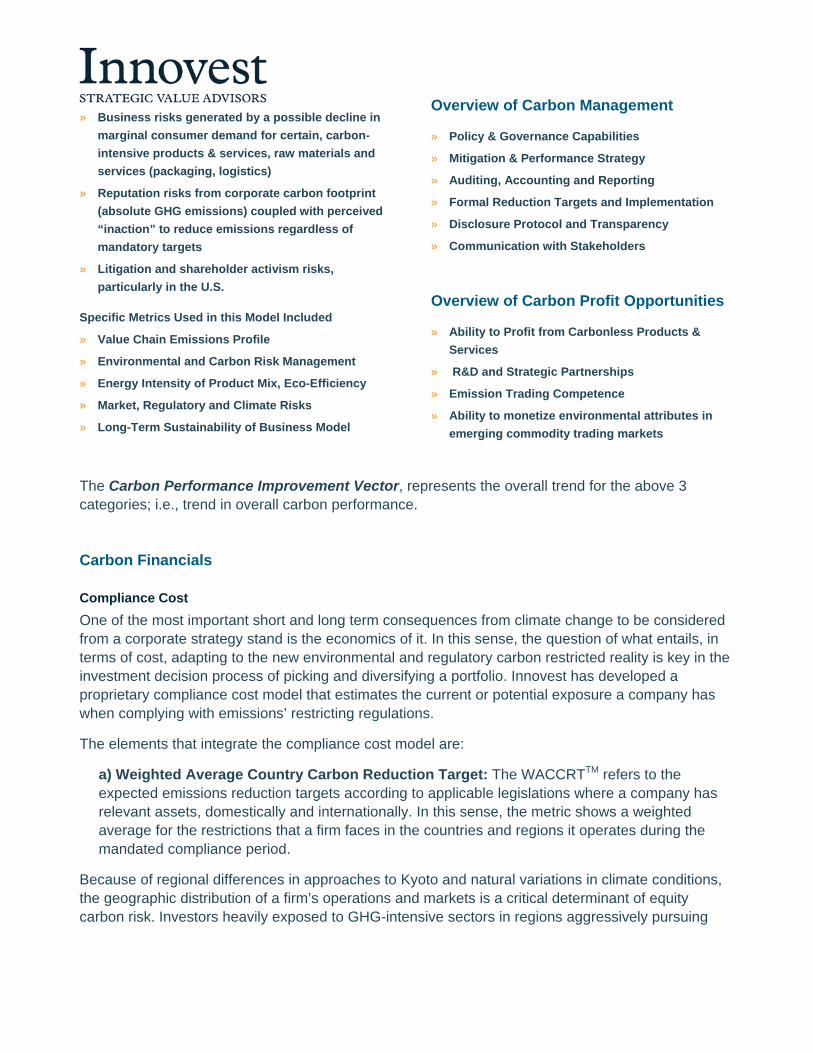
» Business risks generated by a possible decline in marginal consumer demand for certain, carbon-intensive products & services, raw materials and services (packaging, logistics)
» Reputation risks from corporate carbon footprint (absolute GHG emissions) coupled with perceived “inaction” to reduce emissions regardless of mandatory targets
» Litigation and shareholder activism risks, particularly in the U.S.
Specific Metrics Used in this Model Included
» Value Chain Emissions Profile
» Environmental and Carbon Risk Management
» Energy Intensity of Product Mix, Eco-Efficiency
» Market, Regulatory and Climate Risks
» Long-Term Sustainability of Business Model
Overview of Carbon Management
» Policy & Governance Capabilities
» Mitigation & Performance Strategy
» Auditing, Accounting and Reporting
» Formal Reduction Targets and Implementation
» Disclosure Protocol and Transparency
» Communication with Stakeholders
Overview of Carbon Profit Opportunities
» Ability to Profit from Carbonless Products & Services
» R&D and Strategic Partnerships
» Emission Trading Competence
» Ability to monetize environmental attributes in emerging commodity trading markets
The Carbon Performance Improvement Vector, represents the overall trend for the above 3 categories; i.e., trend in overall carbon performance.
Carbon Financials
Compliance Cost One of the most important short and long term consequences from climate change to be considered from a corporate strategy stand is the economics of it. In this sense, the question of what entails, in terms of cost, adapting to the new environmental and regulatory carbon restricted reality is key in the investment decision process of picking and diversifying a portfolio. Innovest has developed a proprietary compliance cost model that estimates the current or potential exposure a company has when complying with emissions’ restricting regulations.
The elements that integrate the compliance cost model are:
a) Weighted Average Country Carbon Reduction Target: The WACCRTTM refers to the expected emissions reduction targets according to applicable legislations where a company has relevant assets, domestically and internationally. In this sense, the metric shows a weighted average for the restrictions that a firm faces in the countries and regions it operates during the mandated compliance period.
Because of regional differences in approaches to Kyoto and natural variations in climate conditions, the geographic distribution of a firm’s operations and markets is a critical determinant of equity carbon risk. Investors heavily exposed to GHG-intensive sectors in regions aggressively pursuing

Carbon Beta™ and Equity Performance: An Empirical Analysis Visit us at www.innovestgroup.com
15
15
USAUnited KingdomJapanFranceSwitzerlandNetherlandsGermanyAustraliaOthers
emissions reductions – the E.U., Japan, parts of the U.S., and several provinces in Canada – will clearly face greater carbon finance risks than those with more carbon-diversified portfolios. On the other hand, the threat of climate-related litigation hangs over U.S. emitters much more than probably any other. Finally, as we saw recently in Canada, where auto manufacturers in the province of Ontario were exempted from emissions reduction requirements, regional politics can have substantial influence over financial exposure at the facility level.
Geographic exposures of a typical global equity portfolio
Source: Innovest
To assist in carbon risk profiling, Innovest has developed the concept of the Weighted Average Country Carbon Reduction Target (WACCRT©), which represents the aggregate extent of emissions reductions over the full range of a firm’s industrial activities.
Note that companies are very likely to have increased emissions since 1990 if pursuing a “business as usual” course, though some may have started mitigation efforts. Thus the actual required reduction would be a much higher percentage than shown above.
b) Industry Discount Rate: The industry discount rate is calculated from the Weighed Average Cost of Capital (WACC) from each specific industry as of January, 2007. For calculating it, we used the weighted average of the cost of equity and after-tax cost of debt, weighted by the market values of equity and debt. For the weights, there were used cumulated market values for the entire sector.
c) Carbon Price: is the estimated carbon price for three different scenarios (expected, maximum and minimum price) per emission allowance (USD per tonne of CO2 equivalent) in the European Union Emissions Trading Scheme (EU ETS) during a specific compliance period. In the case that this period extends beyond 2012, prices are estimated using available data of actual European Union Allowances prices from January 2005 to the present, and futures prices from the present to 2012.4
4 Carbon dioxide equivalent or CO2e represents the emission of CO2 that would cause the same amount of radiative forcing or global warming potential as the diverse sources of greenhouse gases (GHG) emissions actually emitted. The Global warming potential is an index that approximates the warming effect of a unit mass of a GHG over a chosen time

Carbon Beta™ and Equity Performance: An Empirical Analysis Visit us at www.innovestgroup.com
16
16
Analyst reviews carbon-related information of the sector: energy mix and consumption patterns, carbon regulatory constraints, abatement opportunities, MAC curves. Direct and indirect CO2e emissions, as well as market demand sensitivity to carbon factors are analyzed. Carbon intensity factors are derived.
In-Depth Sector Carbon Analysis
From companies’ Annual reports, 10k – 20F forms, Environmental reports, Websites. From government sources under regulated regimes (EU ETS, Japanese carbon regimes, UK emissions registry, Carbon Disclosure Project). NGOs, industry associations, “think-tanks”, other research organizations.
Collection of Company Data
1
Sector analyst fills in carbon data and carbon scores for each of 20+ factors in for each company in a sector. Information gaps are identified. Carbon price sensitivity analysis is performed.
Preliminary Work on Carbon Rating Matrix
Analysts interviews the company (usually energy & environment officer or production director) and discuss the companies carbon strategy (carbon risk mitigation strategy, CDM investments, new technology path, carbon trading practices, etc”0
Company Interview
Based on company interviews, analyst completes the carbon rating model. Carbon governance and management, mitigation strategies, direct, indirect risks as well as market sensitivity are computed. The carbon rating is attributed (AAA to CCC).
Determination of Carbon Betas
Individual ratings are reviewed and a quality check is performed by the head of carbon practice for each sector.
“Reality Check” – Quality Insurance
2
3
5
6
4
d) Annual Cost of Compliance: This figure represents the annual cost for abating emissions during the commitment period to achieve compliance with the relevant regulations faced by a company. In the case of companies operating in countries that are Parties to Kyoto Protocol, the commitment period goes from 2008 to 2012. For countries that currently have or are likely to have different climate change policies than the Kyoto Protocol, specific domestic legislation or possible scenarios are modeled for calculating the annual compliance cost.5 This cost is expressed as a percentage of current EBITDA.
e) Net Present Value of Carbon Abatement Costs to Meet Emissions Reduction Targets: For calculating this value, we estimate the carbon emissions abatement costs during the entire commitment period established in the relevant regulatory regimes under which the company operates.6 This NPV of carbon costs is also expressed in terms of percentage erosion of the firm’s market capitalization.
Summary of Steps in Carbon Beta Rating Methodology
horizon, relative to that of carbon dioxide (the GWP of carbon dioxide is set as 1). For example, the 100-year GWP of a gas expresses the effect on atmospheric warming that it is likely to exert over 100 years relative to that of CO2. More precisely, it is the perturbation to the energy balance of the Earth-atmosphere system (in W m-2) following, for example a change in the concentration of carbon diaxide or a change in the ouput of the Sun; the climate system responds to the radiative forcing so as to re-establish the energy balance. For more see Intergovenmental and Legal Affairs, Climate change Secretariat, United Nations Framework Convention on Climate Change, Handbook, 2006, Germany; and, Intergovernmental Pannel on Climate Change, Fourth Assesment Report, Climate Change 2007: Synthesis Report, 2007, Intergovernmental Pannel on Climate Change, Germany. 5 Compliance costs are calculated as the cost of mitigating emissions above the limit established by a target applied to a baseline level. In the model, it is assumed that permits are being grandfathered up to the baseline level minus the abatement target. Additionally, the permits corresponding to the exceeding emissions above the target imposed to the baseline are being purchased in the market (or, equivalently, auctioned since the effect in carbon prices should be the same). This assumption follows closely the architecture of the EU ETS. 6 For instance, for modelling compliance costs of the US Electric Utilities sector we used the Feinstein-Carper Bill proposed on early 2007 in the 110th Congress for regulating greenhouse gas emissions for the electric sector.
Carbon Beta™ and Equity Performance: An Empirical Analysis Visit us at www.innovestgroup.com
17
17
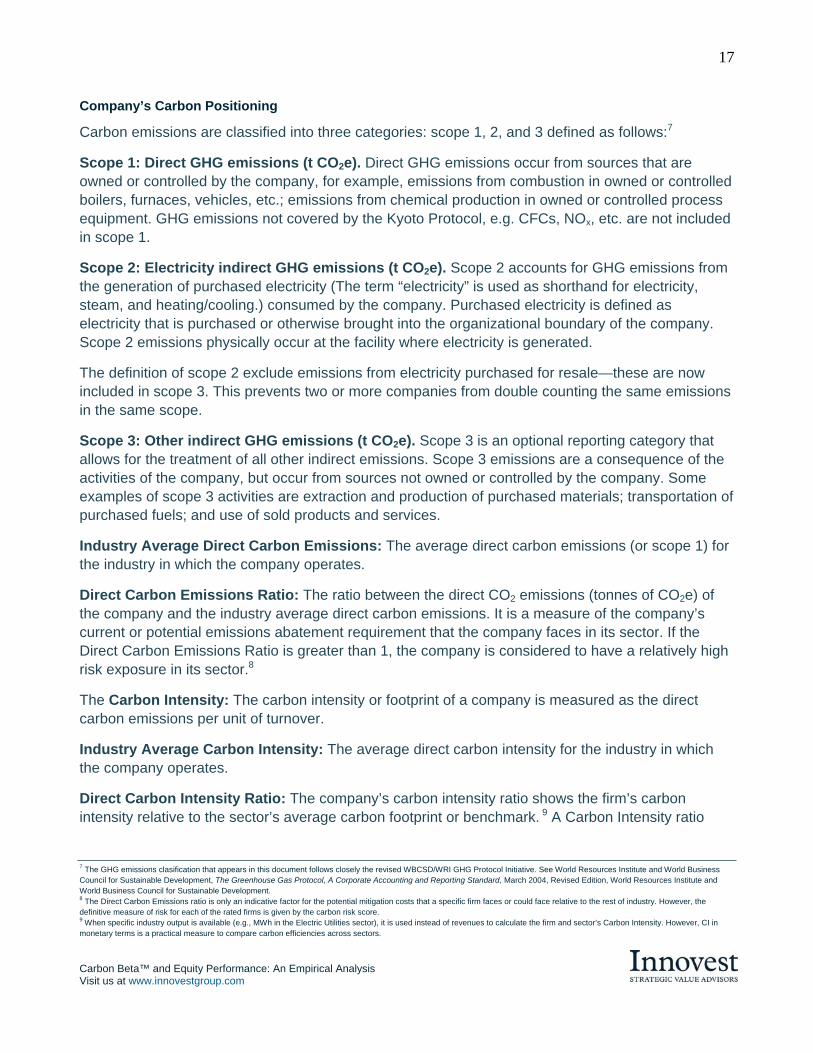
Company’s Carbon Positioning
Carbon emissions are classified into three categories: scope 1, 2, and 3 defined as follows:7
Scope 1: Direct GHG emissions (t CO2e). Direct GHG emissions occur from sources that are owned or controlled by the company, for example, emissions from combustion in owned or controlled boilers, furnaces, vehicles, etc.; emissions from chemical production in owned or controlled process equipment. GHG emissions not covered by the Kyoto Protocol, e.g. CFCs, NOx, etc. are not included in scope 1.
Scope 2: Electricity indirect GHG emissions (t CO2e). Scope 2 accounts for GHG emissions from the generation of purchased electricity (The term “electricity” is used as shorthand for electricity, steam, and heating/cooling.) consumed by the company. Purchased electricity is defined as electricity that is purchased or otherwise brought into the organizational boundary of the company. Scope 2 emissions physically occur at the facility where electricity is generated.
The definition of scope 2 exclude emissions from electricity purchased for resale—these are now included in scope 3. This prevents two or more companies from double counting the same emissions in the same scope.
Scope 3: Other indirect GHG emissions (t CO2e). Scope 3 is an optional reporting category that allows for the treatment of all other indirect emissions. Scope 3 emissions are a consequence of the activities of the company, but occur from sources not owned or controlled by the company. Some examples of scope 3 activities are extraction and production of purchased materials; transportation of purchased fuels; and use of sold products and services.
Industry Average Direct Carbon Emissions: The average direct carbon emissions (or scope 1) for the industry in which the company operates.
Direct Carbon Emissions Ratio: The ratio between the direct CO2 emissions (tonnes of CO2e) of the company and the industry average direct carbon emissions. It is a measure of the company’s current or potential emissions abatement requirement that the company faces in its sector. If the Direct Carbon Emissions Ratio is greater than 1, the company is considered to have a relatively high risk exposure in its sector.8
The Carbon Intensity: The carbon intensity or footprint of a company is measured as the direct carbon emissions per unit of turnover.
Industry Average Carbon Intensity: The average direct carbon intensity for the industry in which the company operates.
Direct Carbon Intensity Ratio: The company’s carbon intensity ratio shows the firm’s carbon intensity relative to the sector’s average carbon footprint or benchmark. 9 A Carbon Intensity ratio
7 The GHG emissions clasification that appears in this document follows closely the revised WBCSD/WRI GHG Protocol Initiative. See World Resources Institute and World Business Council for Sustainable Development, The Greenhouse Gas Protocol, A Corporate Accounting and Reporting Standard, March 2004, Revised Edition, World Resources Institute and World Business Council for Sustainable Development. 8 The Direct Carbon Emissions ratio is only an indicative factor for the potential mitigation costs that a specific firm faces or could face relative to the rest of industry. However, the definitive measure of risk for each of the rated firms is given by the carbon risk score. 9 When specific industry output is available (e.g., MWh in the Electric Utilities sector), it is used instead of revenues to calculate the firm and sector’s Carbon Intensity. However, CI in monetary terms is a practical measure to compare carbon efficiencies across sectors.

Carbon Beta™ and Equity Performance: An Empirical Analysis Visit us at www.innovestgroup.com
18
18
greater than 1 indicates that the company is more carbon intensive than the sector benchmark (i.e., the company emits more CO2 per unit of revenue generated).
7 Summary of the Study Methodology
The project was conducted in two successive phases:
Phase I Using Innovest’s proprietary Carbon Beta© analytics platform, over 1500 major companies were screened initially and over 800 from high-impact sectors were studied in greater detail and ranked relative to their same-sector peers.
Phase II A rigorous financial performance study was then conducted to test empirically the proposition that companies with superior carbon management practices and strategies can financially out-perform their peers. (The proxy used here for “financial performance” was share price performance with dividends reinvested – “total return”.). In order to isolate the possible existence and size of any “carbon risk premium”, the impact of other, more traditional investment factors was eliminated through quantitative techniques.
It should be noted that the analysis used in this study is not a so-called “static back-cast”. That is, the Q2 2007 Carbon Beta© company ratings were not simply back-cast and assumed to have been the same in 2004 and thereafter. Instead, we have used Innovest’s time series database of company ratings for each month and as company ratings were changed over time, those “live” ratings were used in the study. This approach provides a much more robust set of results than a simple, static back-cast.
In all comparisons made between any two portfolios, or between any portfolio and an index benchmark in this report, data was adjusted for sector and regional effects. That is, the weights in each group were adjusted to match the industry sector and geographical distribution of the constituents of the peer group.
Unless otherwise stated, all sector and regional exposures correspond to those of the leaders group of the comparison in question. That is, for comparing global carbon leaders vs. laggards, for instance, the latter group was re-weighted to match the same industry and geographical distribution of the constituents of the former group. In doing this, we have neutralized any effect that could distort the comparative performance of a portfolio due to regional regulations and competitive conditions in a specific market or industrial segment.

Carbon Beta™ and Equity Performance: An Empirical Analysis Visit us at www.innovestgroup.com
19
19
8 Carbon Beta and Investment Performance: The Research Results
CARBON BETA™ PERFORMANCE
Carbon risk’s variance from one industrial sector to another requires different managerial responses and strategies for companies – both to hedge their risk exposure and to take advantage of the different profit opportunities from operations, products and services that climate change can potentially bring. Consequently, for Innovest, companies positioned as top carbon performers have a higher expected return in comparison with the overall market benchmark and, moreover, with same-sector companies judged to be “carbon laggards”. Three year empirical stock market research using Innovest’s Carbon BetaTM model reveals that, in fact, this is the case. As expected, the “carbon beta premium” varies considerably, both by industry sector and by region.
Carbon Beta™ Top Performers vs. Laggards For Innovest, companies positioned as top “carbon performers” not only have a higher expected financial return in comparison with the broad market benchmark, but also vis a vis same-sector competitors judged to be “carbon laggards”. Again, Innovest’s Carbon BetaTM platform shows that this is a consistent trend across different regions and sectors. All results in this section were adjusted to neutralize for sector and regional effects in both portfolios.
Carbon Beta™ and Equity Performance: An Empirical Analysis Visit us at www.innovestgroup.com
20
20
-20%
0%
20%
40%
60%
80%
100%
120%
Jun2004 Sep2004 Dec2004 Mar2005 Jun2005 Sep2005 Dec2005 Mar2006 Jun2006 Sep2006 Dec2006 Mar2007 Jun2007
Tota
l Ret
urn
Difference Above Average Innovest Rating (World) Below Average Innovest Rating (World)
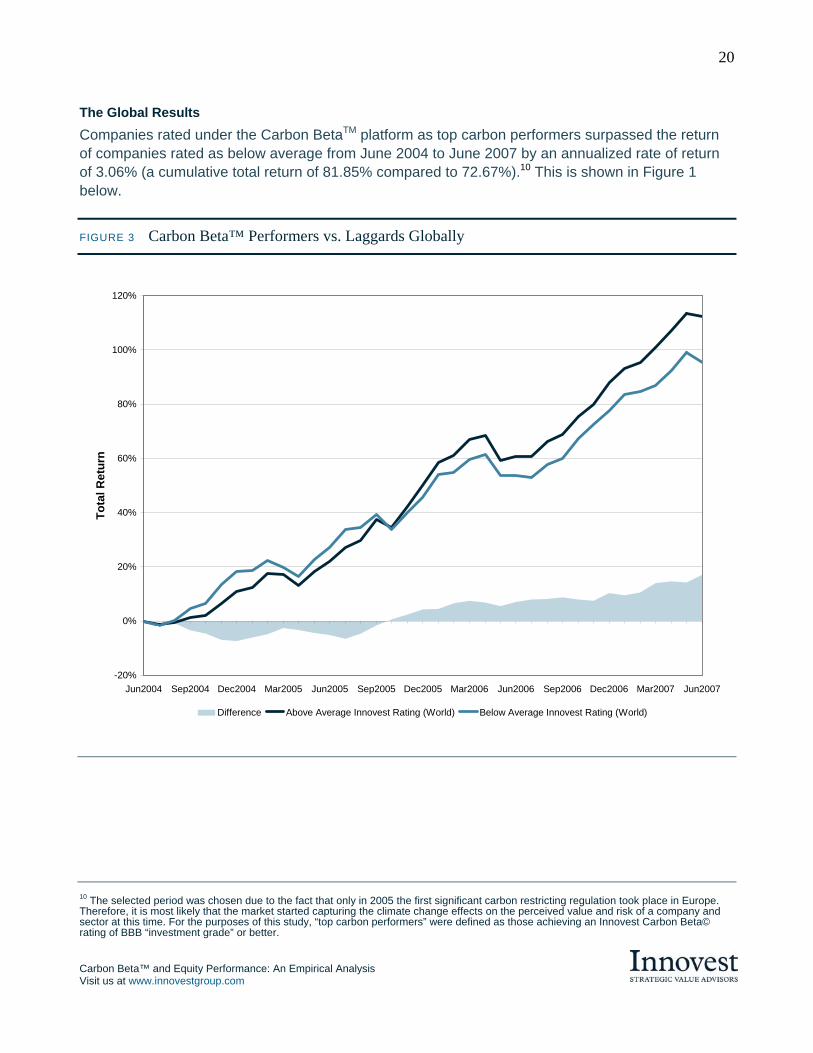
The Global Results Companies rated under the Carbon BetaTM platform as top carbon performers surpassed the return of companies rated as below average from June 2004 to June 2007 by an annualized rate of return of 3.06% (a cumulative total return of 81.85% compared to 72.67%).10 This is shown in Figure 1 below.
FIGURE 3 Carbon Beta™ Performers vs. Laggards Globally
10 The selected period was chosen due to the fact that only in 2005 the first significant carbon restricting regulation took place in Europe. Therefore, it is most likely that the market started capturing the climate change effects on the perceived value and risk of a company and sector at this time. For the purposes of this study, “top carbon performers” were defined as those achieving an Innovest Carbon Beta© rating of BBB “investment grade” or better.
Carbon Beta™ and Equity Performance: An Empirical Analysis Visit us at www.innovestgroup.com
21
21
-20%
0%
20%
40%
60%
80%
100%
Jun2004 Sep2004 Dec2004 Mar2005 Jun2005 Sep2005 Dec2005 Mar2006 Jun2006 Sep2006 Dec2006 Mar2007 Jun2007
Tota
l Ret
urn
Difference Above Average Innovest Rating (N. America Leaders) Below Average Innovest Rating (N. America Leaders)
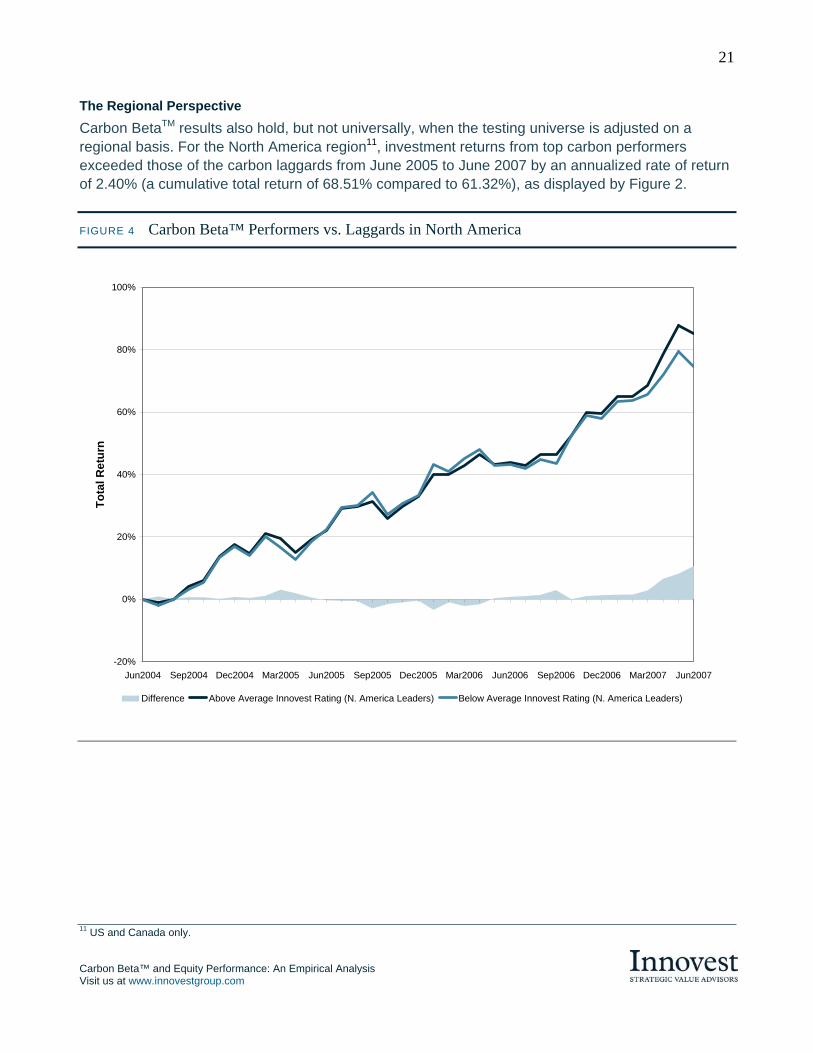
The Regional Perspective Carbon BetaTM results also hold, but not universally, when the testing universe is adjusted on a regional basis. For the North America region11, investment returns from top carbon performers exceeded those of the carbon laggards from June 2005 to June 2007 by an annualized rate of return of 2.40% (a cumulative total return of 68.51% compared to 61.32%), as displayed by Figure 2.
FIGURE 4 Carbon Beta™ Performers vs. Laggards in North America
11 US and Canada only.

Carbon Beta™ and Equity Performance: An Empirical Analysis Visit us at www.innovestgroup.com
22
22
-20%
0%
20%
40%
60%
80%
100%
120%
Jun2004 Sep2004 Dec2004 Mar2005 Jun2005 Sep2005 Dec2005 Mar2006 Jun2006 Sep2006 Dec2006 Mar2007 Jun2007
Tota
l Ret
urn
Difference Above Average Innovest Rating (EUROPE) Below Average Innovest Rating (EUROPE)
For the European case, returns from top carbon performers exceeded those of the carbon laggards for the same period by an annualized rate of return of 6.60% (a cumulative total return of 81.83% compared to 62.03%), as displayed in Figure 3.
FIGURE 5 Carbon Beta™ Performers vs. Laggards in Europe
Carbon Beta™ and Equity Performance: An Empirical Analysis Visit us at www.innovestgroup.com
23
23
-40%
-20%
0%
20%
40%
60%
80%
100%
120%
140%
Jun2004 Sep2004 Dec2004 Mar2005 Jun2005 Sep2005 Dec2005 Mar2006 Jun2006 Sep2006 Dec2006 Mar2007 Jun2007
Tota
l Ret
urn
Difference Above Average Innovest Rating (Asia-Pacific) Below Average Innovest Rating (Asia-Pacific)
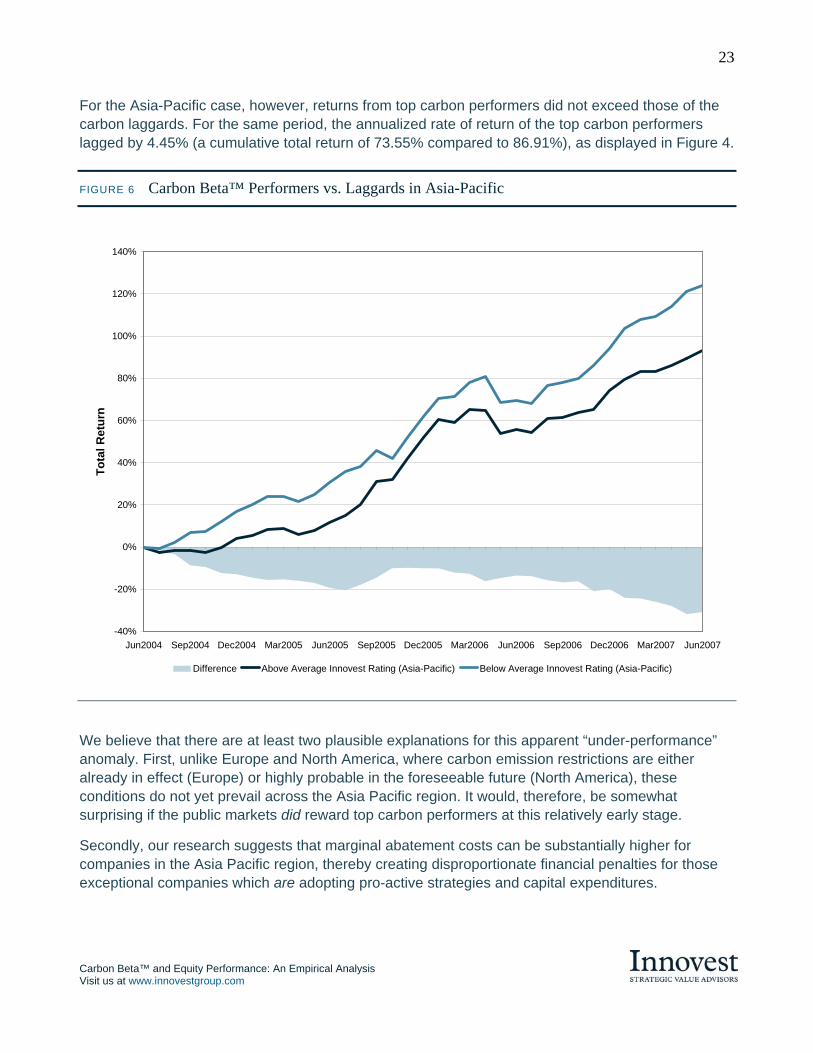
For the Asia-Pacific case, however, returns from top carbon performers did not exceed those of the carbon laggards. For the same period, the annualized rate of return of the top carbon performers lagged by 4.45% (a cumulative total return of 73.55% compared to 86.91%), as displayed in Figure 4.
FIGURE 6 Carbon Beta™ Performers vs. Laggards in Asia-Pacific
We believe that there are at least two plausible explanations for this apparent “under-performance” anomaly. First, unlike Europe and North America, where carbon emission restrictions are either already in effect (Europe) or highly probable in the foreseeable future (North America), these conditions do not yet prevail across the Asia Pacific region. It would, therefore, be somewhat surprising if the public markets did reward top carbon performers at this relatively early stage.
Secondly, our research suggests that marginal abatement costs can be substantially higher for companies in the Asia Pacific region, thereby creating disproportionate financial penalties for those exceptional companies which are adopting pro-active strategies and capital expenditures.

Carbon Beta™ and Equity Performance: An Empirical Analysis Visit us at www.innovestgroup.com
24
24
0%
20%
40%
60%
80%
100%
120%
140%
Jun2004 Sep2004 Dec2004 Mar2005 Jun2005 Sep2005 Dec2005 Mar2006 Jun2006 Sep2006 Dec2006 Mar2007 Jun2007
Tota
l Ret
urn
Difference Above Average Innovest Rating (Utilities) Below Average Innovest Rating (Utilities)
Of the companies with poor ratings (and therefore in the Below Average set) but with good financial performance are a number of Chinese (Hong Kong) and Australian companies in sectors such as Utilities, Construction Machinery & Heavy Trucks, Marine Transport, Industrial Machinery, Road & Rail Transport, Transportation Infrastructure and Real Estate. This reflects the rapid growth of the region and indicates that these companies are focused more on this growth than on issues such as carbon emissions.
Sector-Specific Perspectives The results from the Carbon BetaTM research have also proven to be consistent across a number of different high-impact industries. As expected, the size of the “carbon beta premium” varies significantly across different sectors. In the case of the Utilities Sector12, investment returns from top carbon performers exceeded those of the carbon laggards for the same period by an annualized rate of return of 16.02% (a cumulative total return of 83.94% compared to 35.88%), as displayed in Figure 5.
FIGURE 7 Carbon Beta™ Performers vs. Laggards in the Utilities
12 Subsectors included in this category are Electric Power Companies - N. America, Electric Utilities – International, Gas Utilities, and Multi-Utilities & Unregulated Power.

Carbon Beta™ and Equity Performance: An Empirical Analysis Visit us at www.innovestgroup.com
25
25
-20%
0%
20%
40%
60%
80%
100%
120%
140%
Jun2004 Sep2004 Dec2004 Mar2005 Jun2005 Sep2005 Dec2005 Mar2006 Jun2006 Sep2006 Dec2006 Mar2007 Jun2007
Tota
l Ret
urn
Difference Above Average Innovest Rating (Materials) Below Average Innovest Rating (Materials)
For the Materials sector, investment returns from carbon performers exceeded those of the carbon laggards in the aforementioned period by an annualized rate of return of 5.41% (a cumulative total return of 91.00% compared to 74.77%), as displayed by Figure 6.
FIGURE 8 Carbon Beta™ Performers vs. Laggards in the Materials Sector
It must be acknowledged, however, that there are very real limits to the predictive power of any historical analysis of companies' financial performance, particularly in a dynamic area such as climate change, where the future competitive environment is, while unpredictable, almost certain to be different from the one which produced the historical financial results.
Having said that, however, it is also clear that many institutional investors are beginning to use carbon risk management as a proxy for the overall strategic management capacity of major companies in high-risk sectors. For this reason, while caution is urged in interpreting the above results, we believe that they are instructive.

Carbon Beta™ and Equity Performance: An Empirical Analysis Visit us at www.innovestgroup.com
26
26
9 Conclusions
Despite the obvious limitations of any purely retrospective study in a field as dynamic as carbon finance, we believe that the results of this study do allow us to reach a number of conclusions with a high degree of confidence:
» The competitive and financial consequences of regulatory and public responses to climate change can vary enormously between industry sectors, within sectors, and among different geographic regions.
» Companies’ responses to both the risks and opportunities driven by climate change are becoming increasingly critical to their competitiveness and financial performance.
» While non-verified, company-disclosed information can be helpful to investors, it is not sufficient for those investors to take fully informed decisions, or to create optimal financial results.
» In order to accomplish these latter objectives, investors require in depth, company-specific research which addresses each of the critical dimensions of climate risk, not simply companies’ gross “carbon footprint”. The specific model tested in this study was Innovest’s proprietary Carbon Beta model, which explicitly addresses four dimensions:
» Companies’ overall carbon footprint or potential risk exposure, adjusted to reflect differing regulatory circumstances in different countries and regions.
» Their ability to manage and reduce that risk exposure
» Their ability to recognize and seize climate-driven opportunities on the upside
» Their rate of improvement or regression
» Given the velocity of change in both the public policy environment and companies’ responses to it, the premium attached to up-to-date research and analysis is both considerable and growing over time.

Carbon Beta™ and Equity Performance: An Empirical Analysis Visit us at www.innovestgroup.com
27
27
APPENDIX 1
Summary of Previous Innovest Carbon Finance Research

Carbon Beta™ and Equity Performance: An Empirical Analysis Visit us at www.innovestgroup.com
28
28
Innovest’s Carbon Beta Research: Selected Highlights
» Financial Leadership in Carbon Markets - Executive Recognition 2007, from the UN Environmental Programme Finance Initiative.
» Carbon Disclosure Project, 2006-2007. CDP V: Awarded fifth consecutive global mandate
» JP Morgan, 2006-2007. Innovest and JP Morgan co-created world’s first “climate risk-adjusted” bond index
» World Wildlife Fund (U.K.) 2007. U.K. Power Giants: Generating Climate Change
» Carbon Disclosure Project, 2005-2006. CDP IV: Awarded fourth consecutive global mandate
» World Wildlife Fund, 2005. Analysis of U.K. Power sector
» Australian Greenhouse Office, 2005. Energy & Carbon Management Risk Benchmarking Study of Selected ASX 200 Companies in Australia
» Carbon Disclosure Project, 2004-2005. CDP III
» Carbon Trust, United Kingdom: 2004. Integrating climate risk into investment analysis in multiple sectors
» Natural Resources Canada, Government of Canada, 2004. Integrating climate risk into valuation models in the oil and gas sector
» UBS Investment Bank, 2003-2004. Climate Risk Management Training
» Carbon Disclosure Project, 2003-2004. CDP II
» World Wildlife Fund, 2003. “Power Switch” report on electric utilities sector
» Electricité de France, 2003. EDF Rating and Benchmarking Study
» Carbon Disclosure Project, 2002-2003. CDP I
» UNEP Finance Initiative, 2002. Climate Change and the Financial Services Industry
» CERES, 2002. Value at Risk Report: Climate Change and the Future of Governance
» United Technologies, 2002. Climate Change & United Technologies: Effects on Major Market Segments

Carbon Beta™ and Equity Performance: An Empirical Analysis Visit us at www.innovestgroup.com
29
29
APPENDIX 2
Sample Innovest Carbon Beta™ Company Profile

Carbon Beta™ and Equity Performance: An Empirical Analysis Visit us at www.innovestgroup.com
30
30

Carbon Beta™ and Equity Performance: An Empirical Analysis Visit us at www.innovestgroup.com
31
31

Carbon Beta™ and Equity Performance: An Empirical Analysis Visit us at www.innovestgroup.com
32
32

Carbon Beta™ and Equity Performance: An Empirical Analysis Visit us at www.innovestgroup.com
33
33
APPENDIX 3
Statistical Data

Carbon Beta™ and Equity Performance: An Empirical Analysis Visit us at www.innovestgroup.com
34
34
Global LaggardsGlobal Leaders
7.5
5.0
2.5
0.0
-2.5
-5.0
Dat
a
2.21209 1.96418
Boxplot of Global Leaders, Global Laggards
N. America LaggardsN. America Leaders
7.5
5.0
2.5
0.0
-2.5
-5.0
Dat
a 1.85149 1.65728
Boxplot of N. America Leaders, N. America Laggards
Europe LaggardsEurope Leaders
7.5
5.0
2.5
0.0
-2.5
-5.0
Dat
a
2.21158 1.67657
Boxplot of Europe Leaders, Europe Laggards
A-P LaggardsA-P Leaders
10
5
0
-5
Dat
a 1.98784 2.34893
Boxplot of A-P Leaders, A-P Laggards
Utilities LaggardsUtilities Leaders
10.0
7.5
5.0
2.5
0.0
-2.5
-5.0
Dat
a 2.26859
0.969627
Boxplot of Utilities Leaders, Utilities Laggards
Materials LaggardsMaterials Leaders
10
5
0
-5
Dat
a
2.45935 2.02075
Boxplot of Materials Leaders, Materials Laggards
The following boxplots display the characteristics of the empirical distribution for the returns of the different portfolios that were object of this study.
The diagrams display location, spread, skewness, tail lengths and outliers of the data. The box represents 50% of ordered data stretching between the lower hinge and the upper hinge, which are equivalent to the lower and the upper quartile of the data respectively. That is, the first quartile (Q1); and the third
quartile (Q3), for which 25 and 75 percent of the data values are less than or equal to these values respectively.
The bar in this box indicates the median, which by its position depicts the symmetry or skewness of the data. The expected returns for all data sets are shown in numbers within the boxes. The whiskers include all data to the largest value that is equal to or less than 1.5 (Q3-Q1). This also defines the outliers’ cutoffs. All data points beyond the whiskers are considered to be outliers.

Carbon Beta™ and Equity Performance: An Empirical Analysis Visit us at www.innovestgroup.com
35
35
GLOBAL NORTH AMERICA
Leaders Laggards Leaders Laggards
Mean 2.2121 Mean 1.9642 Mean 1.8515 Mean 1.6573
StDev 2.5859 StDev 2.7455 StDev 2.8651 StDev 3.1975
Variance 6.687 Variance 7.5378 Variance 8.2087 Variance 10.2238
95% Confidence Interval for Mean 95% Confidence Interval for Mean 95% Confidence Interval for Mean 95% Confidence Interval for Mean
1.3499 3.0743 1.0488 2.8796 0.8962 2.8068 0.5912 2.7234
95% Confidence Interval for StDev 95% Confidence Interval for StDev 95% Confidence Interval for StDev 95% Confidence Interval for StDev
2.1029 3.359 2.2327 3.5663 2.3299 3.7216 2.6002 4.1534
Sharpe ratio 4.085232 Sharpe ratio 3.072843 Sharpe ratio 2.607784 Sharpe ratio 1.809859
EUROPE ASIA-PACIFIC
Leaders Laggards Leaders Laggards
Mean 2.2116 Mean 1.6766 Mean 1.9878 Mean 2.3489
StDev 2.5834 StDev 2.4411 StDev 3.0545 StDev 2.79
Variance 6.6739 Variance 5.959 Variance 9.33 Variance 7.7841
95% Confidence Interval for Mean 95% Confidence Interval for Mean 95% Confidence Interval for Mean 95% Confidence Interval for Mean
1.3502 3.0729 0.8627 2.4905 0.9694 3.0063 1.4187 3.2792
95% Confidence Interval for StDev 95% Confidence Interval for StDev 95% Confidence Interval for StDev 95% Confidence Interval for StDev
2.1008 3.3557 1.9851 3.1709 2.484 3.9677 2.2689 3.6241
Sharpe ratio 4.085794 Sharpe ratio 2.224447 Sharpe ratio 2.941092 Sharpe ratio 4.367608
UTILITIES MATERIALS
Leaders Laggards Leaders Laggards
Mean 2.2686 Mean 0.96963 Mean 2.4593 Mean 2.0208
StDev 2.3785 StDev 1.13307 StDev 3.4776 StDev 3.4937
Variance 5.6575 Variance 1.28385 Variance 12.0939 Variance 12.2063
95% Confidence Interval for Mean 95% Confidence Interval for Mean 95% Confidence Interval for Mean 95% Confidence Interval for Mean
1.4755 3.0616 0.59184 1.34741 1.2998 3.6188 0.8559 3.1856
95% Confidence Interval for StDev 95% Confidence Interval for StDev 95% Confidence Interval for StDev 95% Confidence Interval for StDev
1.9343 3.0896 0.92143 1.47182 2.828 4.5173 2.8412 4.5382
Sharpe ratio 4.504937 Sharpe ratio -0.56757 Sharpe ratio 4.078197 Sharpe ratio 2.770324


For Further Information Please Contact:
Dr. Matthew Kiernan (905) 707-0876 x204 [email protected]
Pierre Trevet (415) 332-3506 [email protected]
Mario Lopez-Alcala (212) 421-2000 [email protected]
innovestgroup.com