emal project environmental update - aga-portal · slii has, in preparing this emal project...
TRANSCRIPT
EMAL Project Environmental Update
Emirates Aluminium Company
Final Report
Project: 503406
November 2011

Emirates Aluminium EMAL Project Environmental Update
503406 i November 2011 - Final
Note to the Reader
This document contains the expression of the professional opinion of SNC-Lavalin International Inc. (referred to as “SLII”) as to the matters set out herein, using its professional judgment and reasonable care. It is to be read in the context of the Consultancy Agreement dated June 14, 2010 (referred to as the “Agreement”), between SNC-Lavalin International Inc. (SLII) on the one part (referred to as the Consultant) and Emirates Aluminium Company Limited (EMAL) on the other part (referred to as the Client), and the methodology, procedures and techniques used, assumptions, and the circumstances and constraints under which this mandate was performed. The Basic Design Parameters related to the smelting technologies considered in the Study were provided by the Client who bears the ultimate responsibility for the accuracy of the data provided and for the performance of the related smelting technologies considered hereinafter. The Consultant is in no position to neither verify nor confirm the accuracy of the information provided by the Client about the smelting technologies, and as such bears no responsibility as to the accuracy of the data and the performance of the smelting technologies considered in the Study.
This document is written solely for the purpose stated in the Report, and for the sole and exclusive benefit of the Client, whose remedies are limited to those set out in the Agreement. This document is meant to be read as a whole, and sections or parts thereof should thus not be read or relied upon out of context. SLII has, in preparing this EMAL Project Environmental Update, followed methodology and procedures, and exercised due care consistent with the intended level of accuracy, using its professional judgment and reasonable care. Unless expressly stated otherwise, assumptions, data and information supplied by, or gathered from other sources (including the Client, other consultants, testing laboratories and equipment suppliers, etc.) upon which SLII’s opinion as set out herein is based has not been verified by SLII; SLII makes no representation as to its accuracy and disclaims all liability with respect thereto. SLII disclaims any liability to the Client and to third parties in respect of the publication, reference, quoting, or distribution of this report or any of its contents to and reliance thereon.
Quality Assurance
The Environment Division of SNC LAVALIN is certified ISO-9001, and as a part of this certification, an internal quality review process has been applied to each project task undertaken by us. Each document is carefully reviewed by core members of the consultancy team and signed off at Director level prior to issue to the client. Draft documents are submitted to the client for comment and acceptance prior to final production.

Emirates Aluminium EMAL Project Environmental Update
503406 iii November 2011 - Final
TABLE OF CONTENTS
Page
1 INTRODUCTION ................................................................................................. 1 1.1 Background ...................................................................................................... 1 1.2 Overview of EMAL facilities .............................................................................. 2 1.3 Scope of Work and Methodology ..................................................................... 2 1.4 Report Structure ............................................................................................... 4 1.5 List of Contributors ........................................................................................... 5
2 ENVIRONMENTAL REGULATORY FRAMEWORK.......................................... 6 2.1 Overview .......................................................................................................... 6 2.2 Environmental Permitting Update .................................................................... 6 2.3 Regulation and Supervision Bureau (RSB) ...................................................... 8 2.4 IPPC Guidelines ............................................................................................... 9 2.5 Equator Principles .......................................................................................... 10 2.6 Modifications to Applicable Regulations and Guidelines ............................... 11
2.6.1 Smelter Air Emissions ......................................................................... 11
2.6.2 Power Plant Air Emissions .................................................................. 12
2.6.3 Ambient Air Quality Standards ............................................................ 13
2.6.4 Final Effluent ....................................................................................... 13
2.6.5 Ambient Marine Environment.............................................................. 15
2.6.6 Treated Sewage Effluent .................................................................... 16
2.6.7 Fuel Storage Tanks ............................................................................. 16
2.6.8 Incident Reporting ............................................................................... 18
3 PROJECT DESCRIPTION ................................................................................ 20 3.1 Overview ........................................................................................................ 20 3.2 Design Modifications and Justification ........................................................... 20
3.2.1 Infrastructure ....................................................................................... 22
3.2.2 Power Plant ......................................................................................... 22
3.2.3 Seawater Desalination System ........................................................... 23
3.2.4 Port Facilities and Material Storage & Handling ................................. 24
3.2.5 Reduction ............................................................................................ 26
3.2.6 Carbon ................................................................................................ 26
3.2.7 Casthouse ........................................................................................... 27
3.2.8 Employment ........................................................................................ 27
3.3 Revision of Resource Requirements for Operation Phase ............................ 28
Emirates Aluminium EMAL Project Environmental Update
TABLE OF CONTENTS (cont’d)
Page
503406 iv November 2011 - Final
3.4 Update Project Schedule ............................................................................... 29 3.5 Modifications to Pollution Control Technologies ............................................ 30
3.5.1 Gas Treatment Centers ...................................................................... 30
3.5.2 RTO for Paste Plant ............................................................................ 31
3.5.3 Hot Bath Fumes Treatment ................................................................. 32
3.6 Update Environmental Releases - Operational Phase .................................. 33 3.6.1 Air Emissions Update and Revised Targets ....................................... 33
3.6.2 Greenhouse Gases ............................................................................. 40
3.6.3 Water Management Update ................................................................ 41
3.6.4 Waste Management Update ............................................................... 44
3.7 Construction Phase ........................................................................................ 46 3.7.1 Overview ............................................................................................. 47
3.7.2 Labour Force ....................................................................................... 47
3.7.3 Construction Activities ......................................................................... 48
3.7.4 Temporary Facilities ............................................................................ 50
3.7.5 Temporary Services ............................................................................ 50
3.7.6 Port Facilities and Material Handling .................................................. 52
3.7.7 Construction Camp ............................................................................. 52
3.7.8 Wastewater Management ................................................................... 53
3.7.9 Waste Management ............................................................................ 54
4 DESCRIPTION OF THE ENVIRONMENT ........................................................ 56 4.1 Land Use ........................................................................................................ 56 4.2 Air Quality ....................................................................................................... 56
4.2.1 2007 to 2009 ....................................................................................... 56
4.2.2 2009 to 2011 ....................................................................................... 57
4.3 Soil and Groundwater Quality ........................................................................ 65 4.3.1 2007 Baseline Data ............................................................................. 66
4.3.2 2011 Monitoring Data .......................................................................... 67
4.4 Seawater Quality ............................................................................................ 69 4.5 Marine Environment ....................................................................................... 71 4.6 Ambient Noise ................................................................................................ 73
4.6.1 Site Boundary ..................................................................................... 74
4.6.2 Surrounding Environment ................................................................... 75
4.7 Fauna and Flora ............................................................................................. 76
Emirates Aluminium EMAL Project Environmental Update
TABLE OF CONTENTS (cont’d)
Page
503406 v November 2011 - Final
4.7.1 Fluoride in Vegetation ......................................................................... 76
5 DESCRIPTION AND ASSESSMENT OF ENVIRONMENTAL IMPACTS ....... 78 5.1 Methodology ................................................................................................... 78 5.2 Construction Phase ........................................................................................ 78
5.2.1 Ambient Air Quality ............................................................................. 78
5.2.2 Water and Soil Quality ........................................................................ 83
5.2.3 Fauna and Flora .................................................................................. 87
5.2.4 Noise Environment .............................................................................. 89
5.2.5 Impacts Related to Workforce Accommodation .................................. 92
5.2.6 Summary ............................................................................................. 93
5.3 Operation Phase ............................................................................................ 94 5.3.1 Ambient Air Quality ............................................................................. 94
5.3.2 Impact on Human Health .................................................................... 99
5.3.3 Impact on Fauna and Flora ............................................................... 100
5.3.4 GHG & Climate Change .................................................................... 102
5.3.5 Impact on Marine Environment ......................................................... 102
5.3.6 Impact on Ambient Noise Levels ...................................................... 103
5.3.7 Socio-Economic Impacts .................................................................. 104
5.3.8 Landscape ........................................................................................ 104
5.3.9 Summary ........................................................................................... 105
6 ENVIRONMENTAL AND SOCIAL MANAGEMENT PLANS ......................... 106 6.1 Environmental, Health and Safety (EHS) Policy .......................................... 106 6.2 Construction Environmental Management Plan (CEMP) ............................. 106 6.3 Operation Environmental and Social Management Plan (OESMP) ............. 108 6.4 Environmental Monitoring Programme ......................................................... 108
6.4.1 Ambient Air Quality ........................................................................... 109
6.4.2 Air Emissions .................................................................................... 110
6.4.3 Seawater Intake and Final Effluent ................................................... 113
6.4.4 Sewage Treatment Plant .................................................................. 113
6.4.5 Stormwater ........................................................................................ 113
6.4.6 Groundwater Quality ......................................................................... 115
6.4.7 Forage (Vegetation) .......................................................................... 116
6.4.8 Noise Monitoring ............................................................................... 117
EMAL Project Environmental Update Emirates Aluminium
TABLE OF CONTENTS (cont’d)
Page
November 2011 - Final vi 503406
6.4.9 Marine Environment .......................................................................... 117
6.5 Landscaping Strategy .................................................................................. 117 6.6 Greenhouse Gases Management System (GHGMS) .................................. 118 6.7 Public Consultation Process ........................................................................ 118
6.7.1 Background ....................................................................................... 118
6.7.2 Purpose and Objectives .................................................................... 119
6.7.3 Public Participation Approach ........................................................... 119
6.7.4 Announcement of the opportunity to become involved in the Phase II consultation process ...................................................................... 120
7 REFERENCES ................................................................................................ 125
LIST OF TABLES
Page
Table 1.1 List of Meetings – Statutory Consultation ............................................. 4
Table 1.2 List of SNC-Lavalin Contributors........................................................... 5
Table 1.3 List of EMAL Contributors ..................................................................... 5
Table 2.1 Documentation Filed for EAD Approval – EMAL Project ...................... 7
Table 2.2 Smelter Air Emission Standards / Guidelines ..................................... 11
Table 2.3 Power Plant Air Emission Standards/Guidelines ................................ 12
Table 2.4 Ambient Air Quality Standards ............................................................ 13
Table 2.5 Applicable Limits for Liquid Effluent .................................................... 14
Table 2.6 Recommended Ambient Marine Water Quality Standards for Abu Dhabi Emirate (AWQOs) .................................................................... 15
Table 2.7 Quality of Treated Sewage Effluent: Applicable Criteria ..................... 16
Table 3.1 Main Modifications to the Initial Smelter Plans ................................... 21
Table 3.2 Updated Power Plant Characteristics ................................................. 23
Table 3.3 EMAL Chemical and Fuel Storage Tanks ........................................... 25
Table 3.4 Updated Capacity for Finished Casthouse Products .......................... 27
Table 3.5 EMAL Operation Manpower ................................................................ 28
Table 3.6 IPPC Key Input Ranges – Prebake Potlines ....................................... 28
Table 3.7 Phase 2 Schedule ............................................................................... 29
Table 3.8 SO2 Emissions Measured at Phase 1 GTCs (mg/Nm3) ...................... 30
Emirates Aluminium EMAL Project Environmental Update
503406 vii November 2011 - Final
Table 3.9 SO2 Emissions Measured at Phase 1 FTCs (mg/Nm3) ....................... 30
Table 3.10 Annual SO2 Emissions Scenarios (t/y) – 2.8% S Coke ...................... 31
Table 3.11 Impact of Project Modifications on Environmental Releases .............. 33
Table 3.12 Update EMAL Emission Targets Approved by the EAD ..................... 34
Table 3.13 Annual Atmospheric Emissions – EMAL Aluminium Smelter ............. 38
Table 3.14 Annual Emissions from the Power Plant ............................................. 39
Table 3.15 Annual Emissions Estimated for Transportation of Raw Materials ..... 39
Table 3.16 Update Greenhouse Gas Emission .................................................... 40
Table 3.17 Final Effluent Quality (2010-2011) ...................................................... 43
Table 3.18 Dross Generation at EMAL ................................................................. 44
Table 3.19 Average Sewage Flow Projection ....................................................... 54
Table 3.20 Waste Management – Construction Phases ...................................... 55
Table 4.1 ADWEA Al Samha AAQMS Summary (2007-2009) ........................... 57
Table 4.2 Maximum SO2 Concentrations in Ambient Air (µg/m3) (2009-2011) .................................................................................................. 58
Table 4.3 Average HF in Ambient Air (2010-2011) ............................................. 58
Table 4.4 Maximum NO2 Concentrations in Ambient Air (µg/m3) (2009-2011) .................................................................................................. 61
Table 4.5 Maximum 1-h CO Concentrations in Ambient Air (mg/m3) (2009-2011) .................................................................................................. 61
Table 4.6 Maximum 24-h PM10 Levels in Ambient Air (µg/m3) (2009-2011) ....... 64
Table 4.7 Soil Quality Baseline (2007)................................................................ 66
Table 4.8 Groundwater Quality Baseline (2007) ................................................. 67
Table 4.9 Groundwater Quality Monitoring (2011) .............................................. 68
Table 4.10 Seawater Quality at the Water Intake (2010-2011) ............................ 70
Table 4.11 Ambient Noise Monitoring Results – Site Boundary ........................... 74
Table 4.12 Noise Monitoring Results – Sensitive Receptors ................................ 76
Table 4.13 Fluoride in Vegetation Analysis Results (2011) .................................. 76
Table 5.1 Ambient 24-hour Average PM10 Levels (μg/m3) on EMAL Site during the Construction of Phase 1 .................................................... 79
Table 5.2 Phase 2 Emissions from Non-Road Mobile Sources and Machinery ........................................................................................... 82
Table 5.3 Impact Assessment: Air Quality (Construction Phase) ....................... 82
Table 5-4 Detailed Analysis of Discharged Groundwater (2009) ........................ 85
Table 5.5 Environmental Incidents – Construction Phase 1 ............................... 86
Table 5.6 Impact Assessment: Water and Soil Quality (Construction Phase) .... 87
Table 5.7 EMAL Wildlife Translocation Project: Animals Captured and Translocated ....................................................................................... 89
EMAL Project Environmental Update Emirates Aluminium
November 2011 - Final viii 503406
Table 5.8 Impact Assessment: Fauna & Flora (Construction Phase) ................. 89
Table 5.9 Equivalent Noise Levels (Leq) measured at EMAL site boundary during the Construction of Phase 1 .................................................... 91
Table 5.10 Impact Assessment: Ambient Noise (Construction Phase) ................ 92
Table 5.11 Workforce Camp Inspection Log – 2007 to 2010 (Phase 1) ............... 92
Table 5.12 Social Impact Assessment (Construction Workforce Camps) ............ 93
Table 5.13 Construction Phase Environmental Impact Summary ........................ 94
Table 5.14 Impact Assessment: Air Quality (Operation Phase - Material Handling & Transportation) ................................................................ 95
Table 5.15 Emission Parameters for the Electrolysis Roof Vents for the Proposed Expanded Aluminum Smelter (1,400,000 t Al/yr) ............... 96
Table 5.16 Emission Parameters for the GTC and FTC stacks for the Proposed Expanded Aluminum Smelter (1,400,000 t Al/yr) with GTC SO2 Seawater Scrubbing for Phase 1 only ................................ 97
Table 5.17 Summary of Maximum Predicted Concentration (µg/m³) of SO2 in Ambient Air ......................................................................................... 99
Table 5.18 Impact Assessment: Human Health (Operation Phase) ................... 100
Table 5.19 Impact Assessment: Fauna & Flora (Operation Phase) ................... 101
Table 5.20 Impact Assessment: GHG & Climate Change (Operation Phase) ... 102
Table 5.21 Impact Assessment: Marine Environment (Operation Phase) .......... 103
Table 5.22 Impact Assessment: Ambient Noise (Operation Phase)................... 103
Table 5.23 Impact Assessment: Economic Benefits (Operation Phase) ............ 104
Table 5.24 Impact Assessment: Landscape (Operation Phase) ........................ 105
Table 5.25 Operation Phase Environmental Impact Summary ........................... 105
Table 6.1 EMAL Revised Ambient Air Quality Monitoring Program .................. 110
Table 6.2 EMAL Revised Air Emissions Monitoring Program ........................... 112
Table 6.3 EMAL Revised Monitoring Program for Seawater Intake & Outfall .. 114
Table 6.4 EMAL Revised Stormwater Monitoring Program .............................. 115
Table 6.5 EMAL Revised Groundwater Monitoring Program ............................ 115
Table 6.6 Fluoride in Vegetation Standards ..................................................... 116
Table 6.7 EMAL Proposed Monitoring Program of Fluoride in Fodder ............. 116
Table 6.8 EMAL Proposed Noise Monitoring Program ..................................... 117
Emirates Aluminium EMAL Project Environmental Update
503406 ix November 2011 - Final
LIST OF FIGURES
Page
Figure 3.1 CAI Process Flow ............................................................................... 45
Figure 3.2 Phase 2 Site Layout ............................................................................ 47
Figure 3.3 Workforce – Construction Phase 2 ..................................................... 47
Figure 3.4 Average Daily Potable Water Consumption – Construction Phase 1 . 52
Figure 3.5 Average Daily Sewage Flow – Construction Phase 1 ........................ 53
Figure 4.1 Hourly SO2 Concentration at EMAL AAQMS – 2010 - July 2011 ....... 59
Figure 4.2 Daily (24-h) SO2 Concentration at EMAL AAQMS - 2010 - July 2011 59
Figure 4.3 Hourly HF Concentration at EMAL AAQMS - 2010 - July 2011 ......... 60
Figure 4.4 Daily (24-h) HF Concentration at EMAL AAQMS - 2010 - July 2011 . 60
Figure 4.5 Hourly NO2 Concentration at EMAL AAQMS - 2010 - July 2011 ........ 62
Figure 4.6 Daily (24-h) NO2 Concentration at EMAL AAQMS - 2010 - July 2011 62
Figure 4.7 Hourly CO Concentration at EMAL AAQMS - 2010 - July 2011 ......... 63
Figure 4.8 Daily (24-h) PM10 Concentration at EMAL AAQMS - 2010 - July 201163
Figure 4.9 Noise Monitoring Locations – Site Boundary ...................................... 75
Figure 4.10 Noise and Vegetation Monitoring Locations ....................................... 75
Figure 5.1 Dust Monitoring Locations .................................................................. 79
Figure 5.2 Noise Monitoring Locations ................................................................. 91
EMAL Project Environmental Update Emirates Aluminium
November 2011 - Final x 503406
LIST OF FIGURES IN APPENDIX A
Figure A.1 Desalination: Process Diagram Figure A.2 Anode Plant Fume Treatment: Process Diagram Figure A.3 Water Balance Update Figure A.4: Worst Case Maximum Predicted Hourly Average Concentration of SO2 in
ambient Air Figure A.5: Worst Case Number of Exceedances of the EAD Hourly Standard for SO2
in ambient Air Figure A.6: Average Case Maximum Predicted Hourly Average Concentration of SO2
in ambient Air Figure A.7: Average Case Number of Exceedances of the EAD Hourly Standard for
SO2 in ambient Air Figure A.8: Worst Case Maximum Predicted Daily Average Concentration of SO2 in
ambient Air Figure A.9: Average Case Maximum Predicted Daily Average Concentration of SO2 in
ambient Air Figure A.10: Worst Case Maximum Predicted Long-Term Average Concentration of
SO2 in ambient Air Figure A.11: Average Case Maximum Predicted Long-Term Average Concentration of
SO2 in ambient Air Figure A.12: Worst Case Maximum Predicted Long-Term Average Concentration of HF
in ambient Air Figure A.13: Average Case Maximum Predicted Long-Term Average Concentration of
HF in ambient Air Figure A.14 Ambient Air Quality Monitoring Stations Figure A.15 Marine Assemblage Descriptions – Al Taweelah Area Figure A.16 ADPC Marine Seabed Monitoring Sampling Points
Emirates Aluminium EMAL Project Environmental Update
503406 xi November 2011 - Final
LIST OF ABBREVIATIONS
AAQMS Ambient Air Quality Monitoring Station ADD Abu Dhabi Datum ADDC Abu Dhabi Distribution Company ADPC Abu Dhabi Port Company ADSSC Abu Dhabi Sewerage Services Company ADWEA Abu Dhabi Water & Electricity Authority AE Anode Effect Al Aluminium Al2O3 Alumina API American Petroleum Institute AQS Air Quality Standards BaP Benzo[a]pyrene BAT Best Available Techniques BOD Biochemical Oxygen Demand BREF European Commission’s Reference Document on Best Available Techniques C2F6 Hexafluoroethane CAI Cast Aluminium Industries CEMP Construction Environmental Management Plan CEMS Continuous Emission Monitoring System CF4 Tetrafluoromethane CH4 Methane CO Carbon monoxide CO2 Carbon dioxide COD Chemical Oxygen Demand CWM-AD Center of Waste Management – Abu Dhabi DA Degraded Airshed E&S Environmental and Social EAD Environment Agency - Abu Dhabi EC Electrical Conductivity EHS Environment, Health and Safety EIA Environmental Impact Assessment EIP Evaporation / Infiltration Ponds EMAL Emirates Aluminium EMS Environmental Management Sector (EAD) EPA see US-EPA EPCM Engineering, Procurement and Construction Management EPFIs Equator Principles Financing Institutions ESMA Emirates Authority for Standardisation and Metrology ESRF Environmental Studies Review Form (EAD) EU European Union
EMAL Project Environmental Update Emirates Aluminium
November 2011 - Final xii 503406
FEED Front-End Engineering Design FFP First Flush Pond Fg Fluoride (gaseous fraction) FHM First Hot Metal FNTP Full Notice to Proceed Fp Fluoride (particulate fraction) FRC Free Residual Chlorine Ft Fluoride (total i.e. gaseous & particulate fractions) FTC Fume Treatment Centre (anode baking furnace) GAC Gulf Aluminium Council GCC Gulf Cooperation Council GE General Electric GHG Greenhouse Gases GHGMS Greenhouse Gases Management System GTC Gas Treatment Centre (reduction) GWL Groundwater Level GWP Global Warming Potential HC Hydrocarbons HF Hydrogen Fluoride HRSG Heat Recovery Steam Generator HTM Heat Transfer Medium IFC International Finance Corporation IPPC Integrated Pollution Prevention and Control IUCN International Union for the Conservation of Nature KIZAD Khalifa Industrial Zone of Abu Dhabi (former name: KPIZ) KPI Key Performance Indicator KPIZ Khalifa Port Indstrial Zone LAeq Equivalent continuous A-weighted noise level LHM Last Hot Metal MED Multi-Effect Distillation MPN Most Probable Number N2O Nitrous oxide NADD New Abu Dhabi Datum NaOH Sodium hydroxide NDA Non- Degraded Airshed NILU Norwegian Institue for Air Research NO2 Nitrogen dioxide NOC No Objection Certificate (EAD) NOx Nitrogen oxide NTU Nephelometric Turbidity Unit O3 Ozone OESMP Operation Environmental & Social Management Plan OSPAR Oslo and Paris Commission
Emirates Aluminium EMAL Project Environmental Update
503406 xiii November 2011 - Final
PAH Polycyclic Aromatic Hydrocarbon PB Prebaked anode cell PCV Prescribed Concentration or Values PFC Perfluorocarbon PM10 Particulates of 10 micrometers or less in aerodynamic diameter PM2.5 Particulates of 2.5 micrometers or less in aerodynamic diameter PNTP Partial Notice to Proceed RO Reverse Osmosis RSB Regulation and Supervision Bureau (Abu Dhabi) RTI Research Triangle Institute RTO Regenerative Thermal Oxidiser S Sulphur SLII SNC-Lavalin International Inc. SO2 Sulphur dioxide SOP Standard Operation Procedures SPL Spent Pot Lining SPRO Second Pass Reverse Osmosis STP Sewage Treatment Plant SWRO Sea Water Reverse Osmosis TDS Total Dissolved Solids TSS Total Suspended Solids UAE United Arab Emirates UNFCCC United Nations Framework Convention on Climate Change USD United States Dollar US-EPA United States Environmental Protection Agency UV Ultraviolet VDC Vertical Direct Chill VOC Volatile Organic Compound WHO World Health Organization WS Workshop
EMAL Project Environmental Update Emirates Aluminium
November 2011 - Final xiv 503406
LIST OF UNITS
°C Celsius AE/pot/d Anode effect per pot per day dBA A-weighted decibel g/s Gram per second GJ Giga joule ha Hectare hr Hour kA Kiloampere kg Kilogram kg/h Kilogram per hour km Kilometer km2 Square kilometer kPa Kilopascal kV Kilovolt kW Kilowatt kWh Kilowatt hour L Litre m Meter m3/d Cubic meter per day mg/L Milligram per litre mg/m3 Milligram per cubic meter mg/Nm3 Milligram per normalized cubic meter (referenced at 0°C and 1 atmosphere) ml Millilitre mm Millimetre MPa Megapascal Mt Megatonne MW Megawatt MWth Megawatt thermal Nm3/h Normalized cubic meter per hour (referenced at 0°C and 1 atmosphere) Nm3/min Normalized cubic meter per minute (referenced at 0°C and 1 atmosphere) ppm Part per million t Al/y Tonne of aluminium per year t CO2eq/y Tonne of equivalent carbon dioxide per year t Tonne tpy Tonne per year V Volt y Year ηg/m3 Nanogram per cubic meter μg/m3 Microgram per cubic meter
Emirates Aluminium EMAL Project Environmental Update
503406 1 November 2011 – Final
1 INTRODUCTION
1.1 BACKGROUND
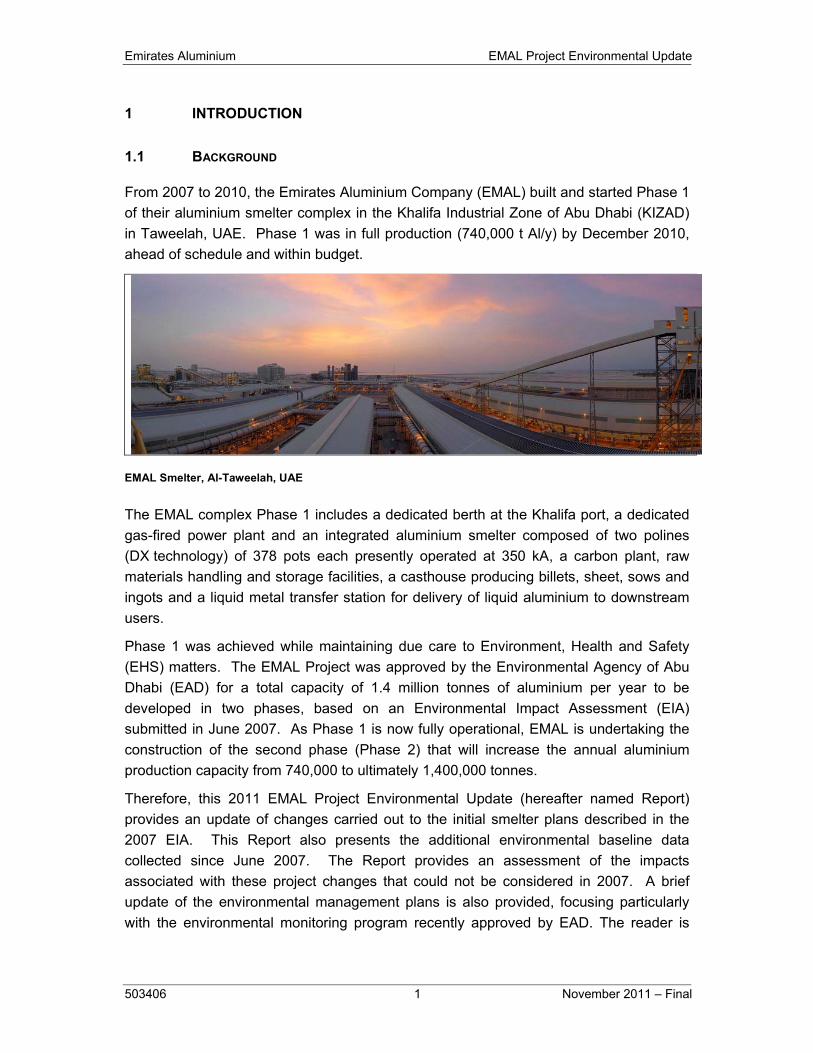
From 2007 to 2010, the Emirates Aluminium Company (EMAL) built and started Phase 1 of their aluminium smelter complex in the Khalifa Industrial Zone of Abu Dhabi (KIZAD) in Taweelah, UAE. Phase 1 was in full production (740,000 t Al/y) by December 2010, ahead of schedule and within budget.
EMAL Smelter, Al-Taweelah, UAE
The EMAL complex Phase 1 includes a dedicated berth at the Khalifa port, a dedicated gas-fired power plant and an integrated aluminium smelter composed of two polines (DX technology) of 378 pots each presently operated at 350 kA, a carbon plant, raw materials handling and storage facilities, a casthouse producing billets, sheet, sows and ingots and a liquid metal transfer station for delivery of liquid aluminium to downstream users.
Phase 1 was achieved while maintaining due care to Environment, Health and Safety (EHS) matters. The EMAL Project was approved by the Environmental Agency of Abu Dhabi (EAD) for a total capacity of 1.4 million tonnes of aluminium per year to be developed in two phases, based on an Environmental Impact Assessment (EIA) submitted in June 2007. As Phase 1 is now fully operational, EMAL is undertaking the construction of the second phase (Phase 2) that will increase the annual aluminium production capacity from 740,000 to ultimately 1,400,000 tonnes.
Therefore, this 2011 EMAL Project Environmental Update (hereafter named Report) provides an update of changes carried out to the initial smelter plans described in the 2007 EIA. This Report also presents the additional environmental baseline data collected since June 2007. The Report provides an assessment of the impacts associated with these project changes that could not be considered in 2007. A brief update of the environmental management plans is also provided, focusing particularly with the environmental monitoring program recently approved by EAD. The reader is
EMAL Project Environmental Update Emirates Aluminium
November 2011 - Final 2 503406
referred to the original 2007 EIA for baseline data available prior to June 2007, and to the project features or impact assessment that remained unchanged since then.
1.2 OVERVIEW OF EMAL FACILITIES
The EMAL smelter Phase 1 consists of a state-of-the-art aluminium production plant, including:
• Two potlines with four (4) potrooms, each having 189 DX pots (total of 756 pots) to be operated at 380 kA, where alumina is reduced to aluminium through an electrolytic process
• A carbon plant, including two baking furnaces, where the DX anodes required for electrolysis are formed, baked, rodded and stored
• A casthouse, where liquid aluminium from the potrooms is cast into ingots, sows, billets and sheet
• A storage area for alumina, coke and pitch. The capacity of alumina and coke silos installed is for the total smelter capacity (1.4 M t Al/y)
• A dedicated power plant (1,750 MW installed) and desalination (6,650 m3/d)
• Ancillary services, warehouses and storage buildings distributed over the plant, and
• A dedicated port facility for receiving raw materials
The following components are planned for Phase 2 that will allow EMAL to eventually reach a capacity of 1.4 Million tonnes of aluminium per year:
• One potline with two potrooms, each having 222 DX+ pots (total of 444 pots) to be operated at 480 kA
• A carbon plant, including one baking furnace, dedicated to the production (forming, baking, rodding and storage) of DX+ anodes
• An extension to the casthouse to produce additional ingots and sheet
• Additional capacity for the power plant (1,090 MW) and the desalination plant (6,650 m3/d)
• Ancillary services, warehouses and storage buildings
1.3 SCOPE OF WORK AND METHODOLOGY
As mentioned earlier, the initial 2007 EIA was prepared for a total capacity of 1.4 M t Al/y. Some changes occurred to the initial plans, in the normal process of project detailed design and optimization phase. In early 2011, EMAL completed a gap analysis of the 2007 EIA to identify project changes or commitments that needed to be updated or clarified with the EAD. The results of the gap analysis were reported initially into the
Emirates Aluminium EMAL Project Environmental Update
503406 3 November 2011 - Final
Technical Modifications. Project changes highlighted in the June 2011 FEED (Front End Engineering Design) are reported in Section 3 and the environmental impact of these changes are assessed in Section 5.
This environmental impact assessment has been prepared according to generally accepted methods in order to identify and evaluate, based on best current knowledge, the environmental impacts of the project. Quantitative techniques were used as a basis to update the assessment of impacts. More specifically, the air dispersion modelling was updated to reassess impacts of hydrogen fluoride and sulphur dioxide on air quality.
The information presented in this study takes also into account environmental data collected by EMAL (e.g. ambient air quality data, quality of final effluent, air emissions, ambient noise data, etc.) and by ADPC/KIZAD (ambient air data, marine environment). When essential information for the evaluation of the environmental impacts is not available, the study then refers to the available documentation from other operating smelters using similar technologies, such as DUBAL for inspection of smelter impacts on surrounding vegetation.
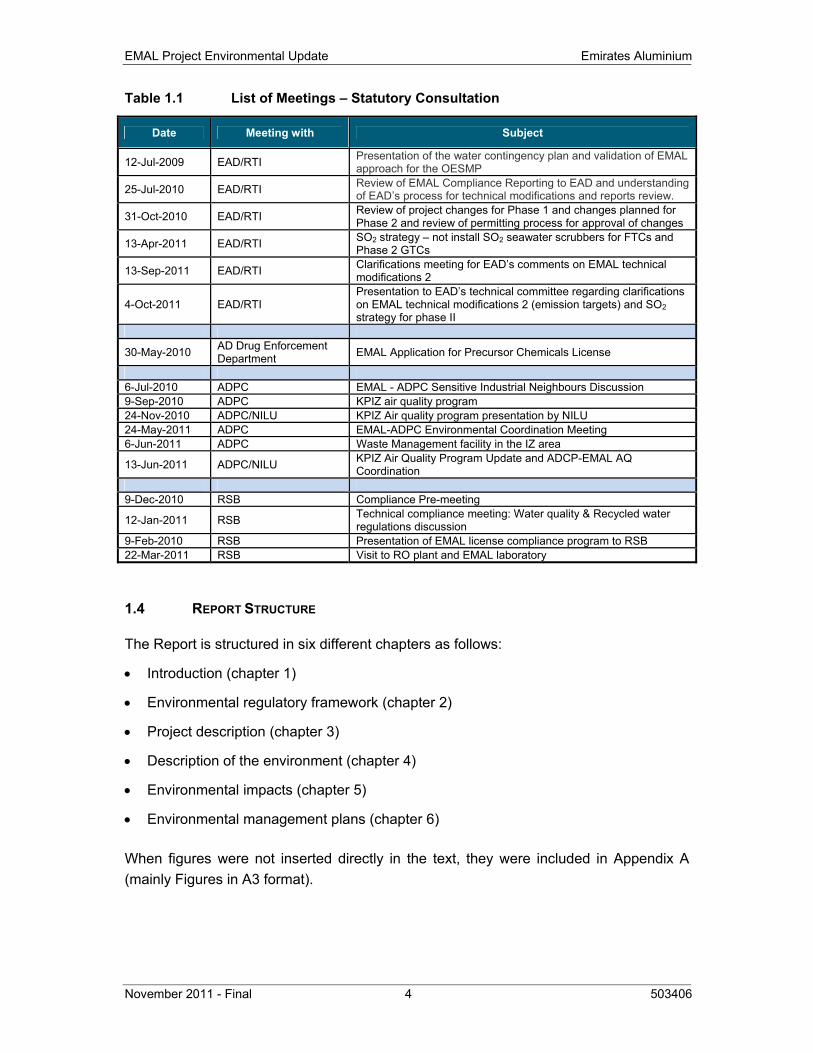
EMAL maintained continuous engagement with statutory stakeholders during the development of the project. Several meetings were held with the EAD and other governmental organizations during which EMAL made presentations on subjects related to the project at full capacity or to subjects which had an influence on the design of Phase 2 (e.g. KPIZ air quality program). Table 1.1 lists the meetings held with the different governmental organisations since the EIA was approved. An appropriate level of engagement will be maintained as it may require.
Regarding EMAL’s public consultation and engagement with its stakeholders (including the local communities), several smelter visits were organized in the last two years with students or the public in general, in which people could address their questions to EMAL’s representatives. The general public gained knowledge of Phase 2 through several articles that appeared recently in the national newspapers. EMAL is organizing a Stakeholders Public Consultation Process Event at a nearby community where stakeholder representatives (including the nearby communities) will be invited to attend. Information will be shared and feedback will be obtained (through various methods) on the existing Phase 1 facilities, plans for Phase 2 and environmental impacts related to the whole project. The stakeholders are invited to comment on the total project and provide direct feedback during the Public Consultation Event or questions via EMAL website. EMAL will make sure that all relevant concerns are promptly addressed.
EMAL Project Environmental Update Emirates Aluminium
November 2011 - Final 4 503406
Table 1.1 List of Meetings – Statutory Consultation
Date Meeting with Subject
12-Jul-2009 EAD/RTI Presentation of the water contingency plan and validation of EMAL approach for the OESMP
25-Jul-2010 EAD/RTI Review of EMAL Compliance Reporting to EAD and understanding of EAD’s process for technical modifications and reports review.
31-Oct-2010 EAD/RTI Review of project changes for Phase 1 and changes planned for Phase 2 and review of permitting process for approval of changes
13-Apr-2011 EAD/RTI SO2 strategy – not install SO2 seawater scrubbers for FTCs and Phase 2 GTCs
13-Sep-2011 EAD/RTI Clarifications meeting for EAD’s comments on EMAL technical modifications 2
4-Oct-2011 EAD/RTI Presentation to EAD’s technical committee regarding clarifications on EMAL technical modifications 2 (emission targets) and SO2 strategy for phase II
30-May-2010 AD Drug Enforcement Department EMAL Application for Precursor Chemicals License
6-Jul-2010 ADPC EMAL - ADPC Sensitive Industrial Neighbours Discussion 9-Sep-2010 ADPC KPIZ air quality program 24-Nov-2010 ADPC/NILU KPIZ Air quality program presentation by NILU 24-May-2011 ADPC EMAL-ADPC Environmental Coordination Meeting 6-Jun-2011 ADPC Waste Management facility in the IZ area
13-Jun-2011 ADPC/NILU KPIZ Air Quality Program Update and ADCP-EMAL AQ Coordination
9-Dec-2010 RSB Compliance Pre-meeting
12-Jan-2011 RSB Technical compliance meeting: Water quality & Recycled water regulations discussion
9-Feb-2010 RSB Presentation of EMAL license compliance program to RSB 22-Mar-2011 RSB Visit to RO plant and EMAL laboratory
1.4 REPORT STRUCTURE
The Report is structured in six different chapters as follows:
• Introduction (chapter 1)
• Environmental regulatory framework (chapter 2)
• Project description (chapter 3)
• Description of the environment (chapter 4)
• Environmental impacts (chapter 5)
• Environmental management plans (chapter 6)
When figures were not inserted directly in the text, they were included in Appendix A (mainly Figures in A3 format).
Emirates Aluminium EMAL Project Environmental Update
503406 5 November 2011 - Final
1.5 LIST OF CONTRIBUTORS
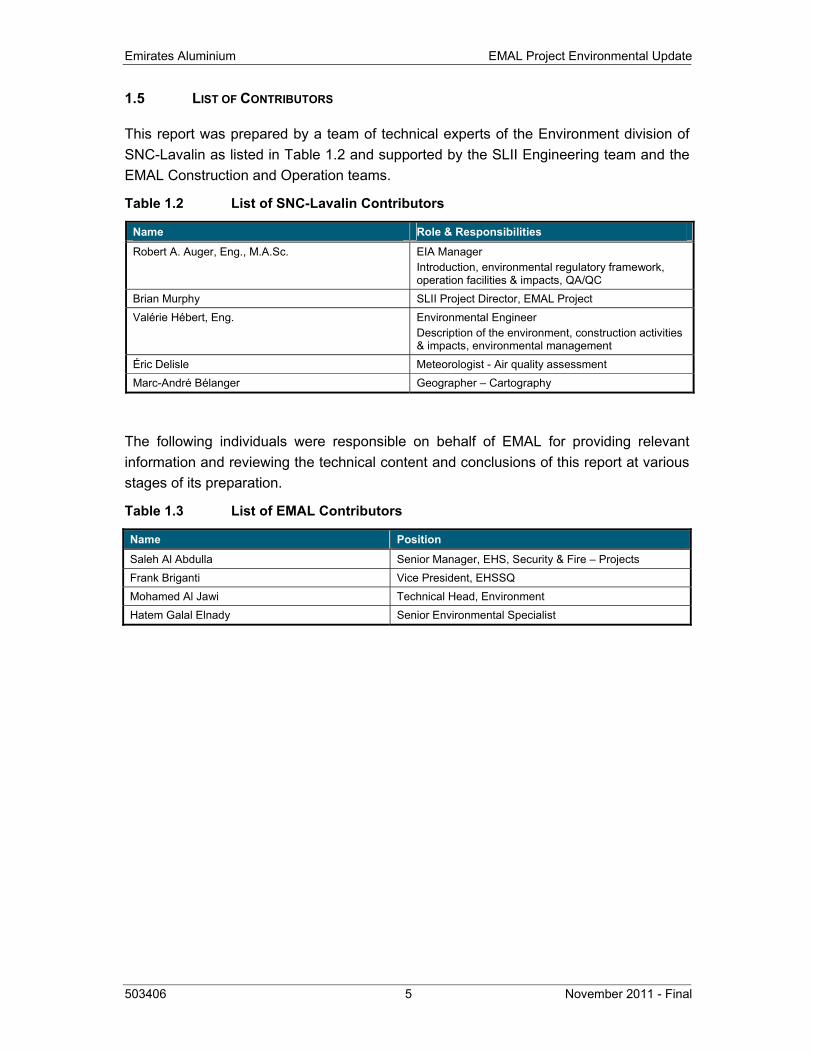
This report was prepared by a team of technical experts of the Environment division of SNC-Lavalin as listed in Table 1.2 and supported by the SLII Engineering team and the EMAL Construction and Operation teams.
Table 1.2 List of SNC-Lavalin Contributors
Name Role & Responsibilities
Robert A. Auger, Eng., M.A.Sc. EIA Manager Introduction, environmental regulatory framework, operation facilities & impacts, QA/QC
Brian Murphy SLII Project Director, EMAL Project Valérie Hébert, Eng. Environmental Engineer
Description of the environment, construction activities & impacts, environmental management
Éric Delisle Meteorologist - Air quality assessment Marc-André Bélanger Geographer – Cartography
The following individuals were responsible on behalf of EMAL for providing relevant information and reviewing the technical content and conclusions of this report at various stages of its preparation.
Table 1.3 List of EMAL Contributors
Name Position
Saleh Al Abdulla Senior Manager, EHS, Security & Fire – Projects Frank Briganti Vice President, EHSSQ Mohamed Al Jawi Technical Head, Environment Hatem Galal Elnady Senior Environmental Specialist
Emirates Aluminium EMAL Project Environmental Update
503406 6 November 2011 - Final
2 ENVIRONMENTAL REGULATORY FRAMEWORK
2.1 OVERVIEW
A comprehensive discussion on the applicable environmental laws, regulations, standards, guidelines and international treaties was presented in chapter 2 of the 2007 EIA. The present chapter aims at providing a summary of the changes to the environmental regulatory framework that occurred since 2007. This section starts with an update on the environmental permitting undertaken by EMAL.
2.2 ENVIRONMENTAL PERMITTING UPDATE
The regulatory authority responsible for environmental permitting, inspection and control in Abu Dhabi is the Environment Agency Abu Dhabi (EAD).
The initial Environmental Impact Assessment (EIA) for the Emirates Aluminium Smelter Project was submitted in June 2007 to the Environmental Agency of Abu Dhai (EAD) and took into account the ultimate smelter capacity (1.4 M t Al/y), at the EAD’s request. The EAD approved the EMAL Smelter Complex Project on 9 July 2007 by issuing a No-Objection Certificate (NOC-0007/07).
In April 2010, the EAD issued an Update of Environmental Permitting Procedures and Guidelines. The Standard Operation Procedures (SOP) explain the permitting process for industrial projects including the submittal of Technical Modifications for approval of project changes. The new procedures also detail the contents required for Construction and Operation environmental management plans (CEMP and OESMP). EMAL followed these new procedures for the submittal of the OESMP, CEMP and Technical Modifications1.
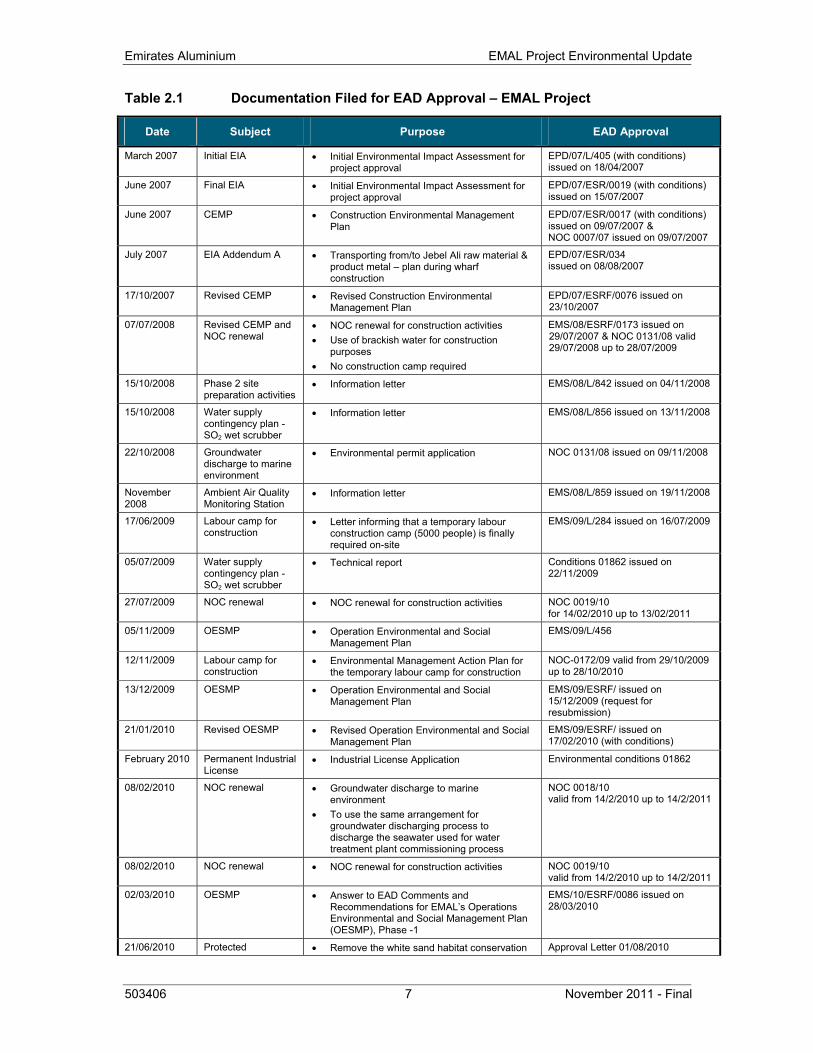
During the detailed engineering and the construction of the smelter, changes were made to the initial plans. It is a normal process to modify and optimize design in the detailed design phase of a project. EMAL obtained EAD approval for all project modifications. Table 2.1 provides a list of the documentation submitted by EMAL and the corresponding EAD approval. EAD requested explicitly to submit project changes in the form of Technical Modifications and not as an updated EIA. This EMAL Project Environmental Update is developed for EMAL internal use and Phase 2 Lenders’ requirements.
1 http://www.ead.ae/en/portal/presentations.aspx
Emirates Aluminium EMAL Project Environmental Update
503406 7 November 2011 - Final
Table 2.1 Documentation Filed for EAD Approval – EMAL Project
Date Subject Purpose EAD Approval
March 2007 Initial EIA • Initial Environmental Impact Assessment for project approval
EPD/07/L/405 (with conditions) issued on 18/04/2007
June 2007 Final EIA • Initial Environmental Impact Assessment for project approval
EPD/07/ESR/0019 (with conditions) issued on 15/07/2007
June 2007 CEMP • Construction Environmental Management Plan
EPD/07/ESR/0017 (with conditions) issued on 09/07/2007 & NOC 0007/07 issued on 09/07/2007
July 2007 EIA Addendum A • Transporting from/to Jebel Ali raw material & product metal – plan during wharf construction
EPD/07/ESR/034 issued on 08/08/2007
17/10/2007 Revised CEMP • Revised Construction Environmental Management Plan
EPD/07/ESRF/0076 issued on 23/10/2007
07/07/2008 Revised CEMP and NOC renewal
• NOC renewal for construction activities • Use of brackish water for construction
purposes • No construction camp required
EMS/08/ESRF/0173 issued on 29/07/2007 & NOC 0131/08 valid 29/07/2008 up to 28/07/2009
15/10/2008 Phase 2 site preparation activities
• Information letter EMS/08/L/842 issued on 04/11/2008
15/10/2008 Water supply contingency plan - SO2 wet scrubber
• Information letter EMS/08/L/856 issued on 13/11/2008
22/10/2008 Groundwater discharge to marine environment
• Environmental permit application NOC 0131/08 issued on 09/11/2008
November 2008
Ambient Air Quality Monitoring Station
• Information letter EMS/08/L/859 issued on 19/11/2008
17/06/2009 Labour camp for construction
• Letter informing that a temporary labour construction camp (5000 people) is finally required on-site
EMS/09/L/284 issued on 16/07/2009
05/07/2009 Water supply contingency plan - SO2 wet scrubber
• Technical report Conditions 01862 issued on 22/11/2009
27/07/2009 NOC renewal • NOC renewal for construction activities NOC 0019/10 for 14/02/2010 up to 13/02/2011
05/11/2009 OESMP • Operation Environmental and Social Management Plan
EMS/09/L/456
12/11/2009 Labour camp for construction
• Environmental Management Action Plan for the temporary labour camp for construction
NOC-0172/09 valid from 29/10/2009 up to 28/10/2010
13/12/2009 OESMP • Operation Environmental and Social Management Plan
EMS/09/ESRF/ issued on 15/12/2009 (request for resubmission)
21/01/2010 Revised OESMP • Revised Operation Environmental and Social Management Plan
EMS/09/ESRF/ issued on 17/02/2010 (with conditions)
February 2010 Permanent Industrial License
• Industrial License Application Environmental conditions 01862
08/02/2010 NOC renewal • Groundwater discharge to marine environment
• To use the same arrangement for groundwater discharging process to discharge the seawater used for water treatment plant commissioning process
NOC 0018/10 valid from 14/2/2010 up to 14/2/2011
08/02/2010 NOC renewal • NOC renewal for construction activities NOC 0019/10 valid from 14/2/2010 up to 14/2/2011
02/03/2010 OESMP • Answer to EAD Comments and Recommendations for EMAL’s Operations Environmental and Social Management Plan (OESMP), Phase -1
EMS/10/ESRF/0086 issued on 28/03/2010
21/06/2010 Protected • Remove the white sand habitat conservation Approval Letter 01/08/2010
EMAL Project Environmental Update Emirates Aluminium
November 2011 - Final 8 503406
Environmental Zone in EMAL
areas from EMAL property
13/07/2010 Water supply contingency plan - SO2 wet scrubber
• Further delays in the commissioning of the seawater intake
EO/EMS/10/L/376
07/11/2010 Water contingency plan
• Delays in the start-up due to unforeseen situations
EO/EMS/10/L/553
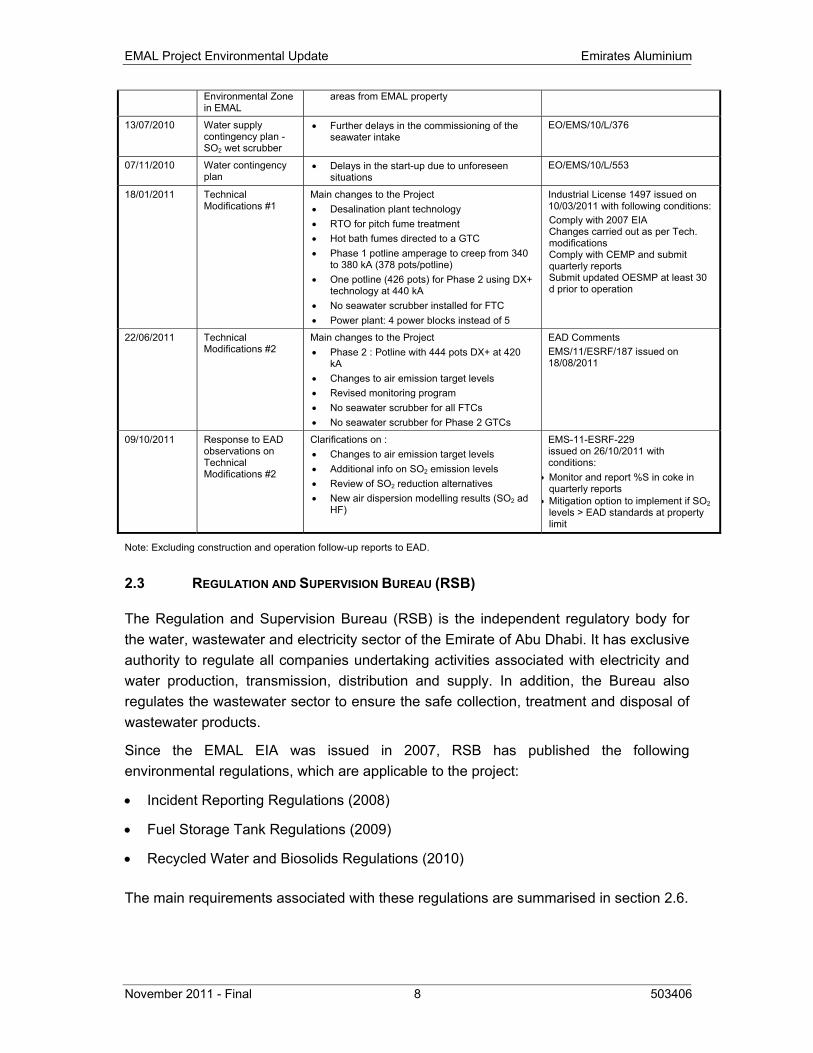
18/01/2011 Technical Modifications #1
Main changes to the Project • Desalination plant technology • RTO for pitch fume treatment • Hot bath fumes directed to a GTC • Phase 1 potline amperage to creep from 340
to 380 kA (378 pots/potline) • One potline (426 pots) for Phase 2 using DX+
technology at 440 kA • No seawater scrubber installed for FTC • Power plant: 4 power blocks instead of 5
Industrial License 1497 issued on 10/03/2011 with following conditions: Comply with 2007 EIA Changes carried out as per Tech. modifications Comply with CEMP and submit quarterly reports Submit updated OESMP at least 30 d prior to operation
22/06/2011 Technical Modifications #2
Main changes to the Project • Phase 2 : Potline with 444 pots DX+ at 420
kA • Changes to air emission target levels • Revised monitoring program • No seawater scrubber for all FTCs • No seawater scrubber for Phase 2 GTCs
EAD Comments EMS/11/ESRF/187 issued on 18/08/2011
09/10/2011 Response to EAD observations on Technical Modifications #2
Clarifications on : • Changes to air emission target levels • Additional info on SO2 emission levels • Review of SO2 reduction alternatives • New air dispersion modelling results (SO2 ad
HF)
EMS-11-ESRF-229 issued on 26/10/2011 with conditions:
• Monitor and report %S in coke in quarterly reports
• Mitigation option to implement if SO2 levels > EAD standards at property limit
Note: Excluding construction and operation follow-up reports to EAD.
2.3 REGULATION AND SUPERVISION BUREAU (RSB)
The Regulation and Supervision Bureau (RSB) is the independent regulatory body for the water, wastewater and electricity sector of the Emirate of Abu Dhabi. It has exclusive authority to regulate all companies undertaking activities associated with electricity and water production, transmission, distribution and supply. In addition, the Bureau also regulates the wastewater sector to ensure the safe collection, treatment and disposal of wastewater products.
Since the EMAL EIA was issued in 2007, RSB has published the following environmental regulations, which are applicable to the project:
• Incident Reporting Regulations (2008)
• Fuel Storage Tank Regulations (2009)
• Recycled Water and Biosolids Regulations (2010)
The main requirements associated with these regulations are summarised in section 2.6.
Emirates Aluminium EMAL Project Environmental Update
503406 9 November 2011 - Final
2.4 IPPC GUIDELINES
The European Union (EU) Integrated Pollution Prevention and Control (IPPC) regulations, as they are applicable in the European Union, are not part of the Abu Dhabi regulatory framework. However, EMAL intends to comply with best international standards (i.e. IPPC) whenever possible.
The IPPC Directive (Directive 2008/1/EC) is a set of common rules for permitting and controlling industrial installations throughout the EU. It is based on the following principles:
1. An integrated approach
2. Best Available Techniques (BAT)
3. Flexibility
4. Public participation
The Best Available Techniques applicable to EMAL are described in the Reference Document (BREF) on BAT in the Non-Ferrous Metals Industries published by the European Commission. The initial BREF for the non-ferrous metals industries was published in 2001, but is currently under review. A draft revision of the BREF was issued in July 2009, after the smelter complex construction was well advanced, and has not been finalized yet.
In summary, the 2009 BREF mentions that the following features are to be considered to minimize environmental impact from aluminium smelters:
• Closed conveyors, pneumatic transfer systems and storage silos to be considered for handling and storage of coke and alumina
• Automatic multiple point feeding of alumina in electrolytic pots
• Computer control of the pots based on active databases and monitoring of cell operating parameters
• Complete hood coverage of the pots connected to a separate gas exhaust and filter system. The use of robust cell covers and adequate extraction rates taking account of fluoride evolution and carbon burn off
• Minimization of the time for changing the anodes and other actions that need pot covers to be removed to achieve better than 99% fume collection on a long-term basis. Anode butt cooling in an enclosure. Use of a programmed system for pot operations and maintenance
• Scrubbing fluoride and HF from the pot fumes using alumina followed by dust removal in a fabric filter system to achieve a minimum of 99.9% removal of total fluoride. The alumina should be reused in the process
EMAL Project Environmental Update Emirates Aluminium
November 2011 - Final 10 503406
• If sulphur removal is practiced using a wet scrubber system, the system should be used with a system to remove fluoride, HF and tars
• When there is a combined anode plant, the use of alumina scrubber and fabric filter system to remove tar fume from the milling, blending and baking stages. Use of the alumina in the electrolytic process. The IPPC also mentions the use of Regenerative Thermal Oxidiser (RTO) or coke filters as a BAT technique for the mixing and forming stages provided that coke from filters is reused within the fabrication of anodes
• Use of established efficient cleaning methods in the rodding shop to recover fluoride from the cleaning process and from the melting of steel components. Use of effective extraction and filtration systems in this area
• Use of low sulphur carbon (<2%) for the anodes or anode paste where possible from a production point of view, taking air quality into account
• Use of rotary gas or flux injection for holding furnaces (casthouse)
Most of these features are incorporated in the smelter design and EMAL procedures. The following features were not implemented in the smelter operations:
• Anode butt cooling in an enclosure is not required (hot butt treatment)
• Phase 2 will not use seawater scrubbers for the GTCs as implemented in Phase 1
• The maximum sulphur content in coke will be 2.8%, resulting in anodes with a content of 2.5%S
• Alumina will be trucked from the main alumina silos to Phase 2 GTC daily silos instead of using an enclosed conveyor system as implemented in Phase 1
2.5 EQUATOR PRINCIPLES
The project’s lenders adhere to the Equator Principles, a voluntary set of standards for determining, assessing and managing social and environmental risk in project financing.
The latest version of the Equator Principles was issued in July 2006. In terms of applicable environmental standards, in addition to relevant host country laws, regulations and permit, it refers to the International Finance Corporation (IFC) Performance Standards and Environmental, Health and Safety (EHS) Guidelines (Principle 3).
The following IFC guidelines are applicable to the project:
• IFC EHS General Guidelines (2007)
• IFC Industry Sector EHS Guidelines
• Base Metal Smelting and Refining (2007)
• Thermal Power Plants (2008)
Emirates Aluminium EMAL Project Environmental Update
503406 11 November 2011 - Final
2.6 MODIFICATIONS TO APPLICABLE REGULATIONS AND GUIDELINES
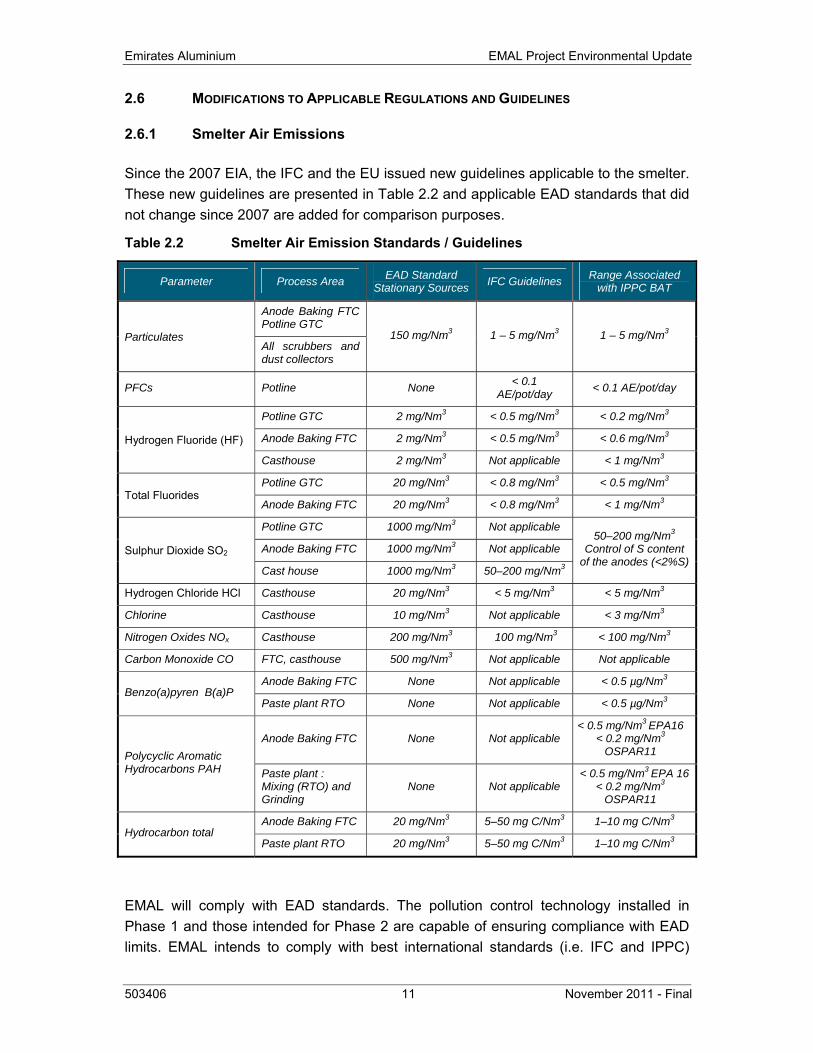
2.6.1 Smelter Air Emissions
Since the 2007 EIA, the IFC and the EU issued new guidelines applicable to the smelter. These new guidelines are presented in Table 2.2 and applicable EAD standards that did not change since 2007 are added for comparison purposes.
Table 2.2 Smelter Air Emission Standards / Guidelines
Parameter Process Area EAD Standard Stationary Sources IFC Guidelines Range Associated
with IPPC BAT
Particulates
Anode Baking FTC Potline GTC
150 mg/Nm3 1 – 5 mg/Nm3 1 – 5 mg/Nm3 All scrubbers and dust collectors
PFCs Potline None < 0.1 AE/pot/day < 0.1 AE/pot/day
Hydrogen Fluoride (HF)
Potline GTC 2 mg/Nm3 < 0.5 mg/Nm3 < 0.2 mg/Nm3
Anode Baking FTC 2 mg/Nm3 < 0.5 mg/Nm3 < 0.6 mg/Nm3
Casthouse 2 mg/Nm3 Not applicable < 1 mg/Nm3
Total Fluorides Potline GTC 20 mg/Nm3 < 0.8 mg/Nm3 < 0.5 mg/Nm3
Anode Baking FTC 20 mg/Nm3 < 0.8 mg/Nm3 < 1 mg/Nm3
Sulphur Dioxide SO2
Potline GTC 1000 mg/Nm3 Not applicable 50–200 mg/Nm3
Control of S content of the anodes (<2%S)
Anode Baking FTC 1000 mg/Nm3 Not applicable
Cast house 1000 mg/Nm3 50–200 mg/Nm3
Hydrogen Chloride HCl Casthouse 20 mg/Nm3 < 5 mg/Nm3 < 5 mg/Nm3
Chlorine Casthouse 10 mg/Nm3 Not applicable < 3 mg/Nm3
Nitrogen Oxides NOx Casthouse 200 mg/Nm3 100 mg/Nm3 < 100 mg/Nm3
Carbon Monoxide CO FTC, casthouse 500 mg/Nm3 Not applicable Not applicable
Benzo(a)pyren B(a)P Anode Baking FTC None Not applicable < 0.5 µg/Nm3
Paste plant RTO None Not applicable < 0.5 µg/Nm3
Polycyclic Aromatic Hydrocarbons PAH
Anode Baking FTC None Not applicable < 0.5 mg/Nm3 EPA16
< 0.2 mg/Nm3
OSPAR11
Paste plant : Mixing (RTO) and Grinding
None Not applicable < 0.5 mg/Nm3 EPA 16
< 0.2 mg/Nm3
OSPAR11
Hydrocarbon total Anode Baking FTC 20 mg/Nm3 5–50 mg C/Nm3 1–10 mg C/Nm3
Paste plant RTO 20 mg/Nm3 5–50 mg C/Nm3 1–10 mg C/Nm3
EMAL will comply with EAD standards. The pollution control technology installed in Phase 1 and those intended for Phase 2 are capable of ensuring compliance with EAD limits. EMAL intends to comply with best international standards (i.e. IFC and IPPC)
EMAL Project Environmental Update Emirates Aluminium
November 2011 - Final 12 503406
whenever possible. Compliance with international standards (mainly IPPC) for some parameters and point sources emission is not guaranteed due to limitations of BAT in hot region climate. Hence modifications to project design criteria are needed. Rationale and discussion of modifications of emissions targets are presented in Section 3.6.1. EAD approved the revised targets in October 2011.
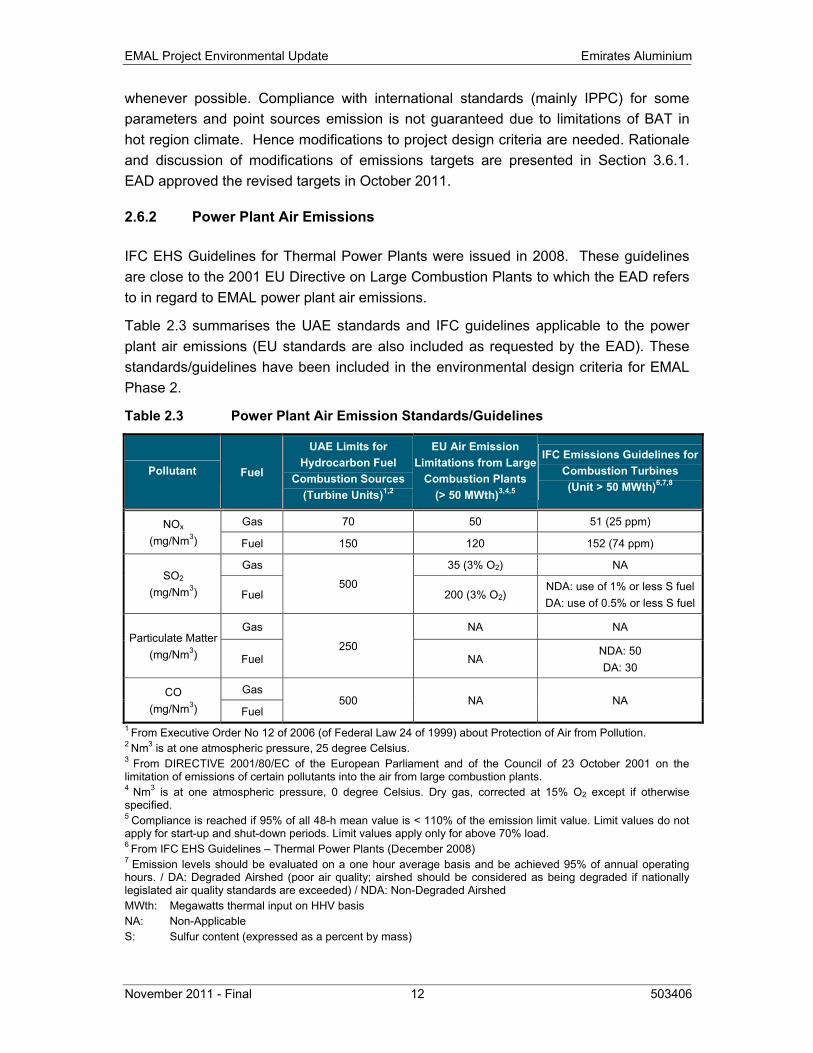
2.6.2 Power Plant Air Emissions
IFC EHS Guidelines for Thermal Power Plants were issued in 2008. These guidelines are close to the 2001 EU Directive on Large Combustion Plants to which the EAD refers to in regard to EMAL power plant air emissions.
Table 2.3 summarises the UAE standards and IFC guidelines applicable to the power plant air emissions (EU standards are also included as requested by the EAD). These standards/guidelines have been included in the environmental design criteria for EMAL Phase 2.
Table 2.3 Power Plant Air Emission Standards/Guidelines
Pollutant Fuel
UAE Limits for Hydrocarbon Fuel
Combustion Sources (Turbine Units)1,2
EU Air Emission Limitations from Large
Combustion Plants (> 50 MWth)3,4,5
IFC Emissions Guidelines for Combustion Turbines (Unit > 50 MWth)6,7,8
NOx
(mg/Nm3)
Gas 70 50 51 (25 ppm)
Fuel 150 120 152 (74 ppm)
SO2
(mg/Nm3)
Gas
500
35 (3% O2) NA
Fuel 200 (3% O2) NDA: use of 1% or less S fuel DA: use of 0.5% or less S fuel
Particulate Matter (mg/Nm3)
Gas
250
NA NA
Fuel NA NDA: 50 DA: 30
CO (mg/Nm3)
Gas 500 NA NA
Fuel 1 From Executive Order No 12 of 2006 (of Federal Law 24 of 1999) about Protection of Air from Pollution. 2 Nm3 is at one atmospheric pressure, 25 degree Celsius. 3 From DIRECTIVE 2001/80/EC of the European Parliament and of the Council of 23 October 2001 on the limitation of emissions of certain pollutants into the air from large combustion plants. 4 Nm3 is at one atmospheric pressure, 0 degree Celsius. Dry gas, corrected at 15% O2 except if otherwise specified. 5 Compliance is reached if 95% of all 48-h mean value is < 110% of the emission limit value. Limit values do not apply for start-up and shut-down periods. Limit values apply only for above 70% load. 6 From IFC EHS Guidelines – Thermal Power Plants (December 2008) 7 Emission levels should be evaluated on a one hour average basis and be achieved 95% of annual operating hours. / DA: Degraded Airshed (poor air quality; airshed should be considered as being degraded if nationally legislated air quality standards are exceeded) / NDA: Non-Degraded Airshed MWth: Megawatts thermal input on HHV basis NA: Non-Applicable S: Sulfur content (expressed as a percent by mass)
Emirates Aluminium EMAL Project Environmental Update
503406 13 November 2011 - Final
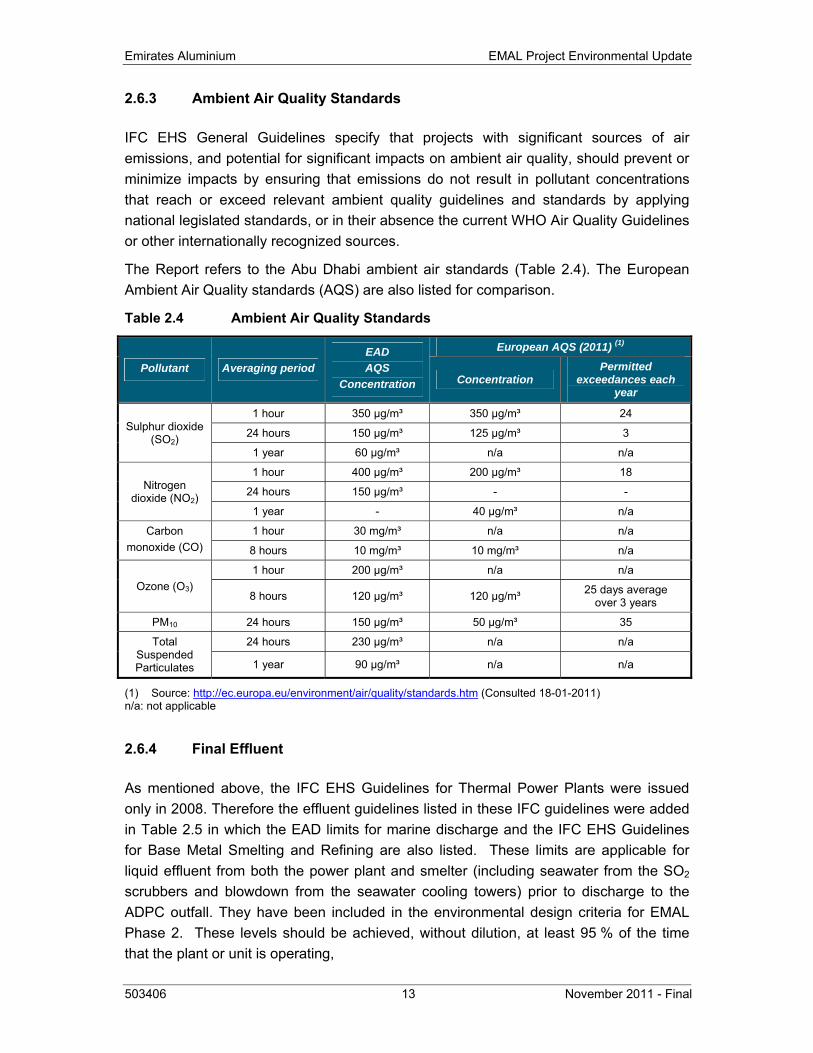
2.6.3 Ambient Air Quality Standards
IFC EHS General Guidelines specify that projects with significant sources of air emissions, and potential for significant impacts on ambient air quality, should prevent or minimize impacts by ensuring that emissions do not result in pollutant concentrations that reach or exceed relevant ambient quality guidelines and standards by applying national legislated standards, or in their absence the current WHO Air Quality Guidelines or other internationally recognized sources.
The Report refers to the Abu Dhabi ambient air standards (Table 2.4). The European Ambient Air Quality standards (AQS) are also listed for comparison.
Table 2.4 Ambient Air Quality Standards
Pollutant Averaging period EAD AQS
Concentration
European AQS (2011) (1)
Concentration Permitted
exceedances each year
Sulphur dioxide (SO2)
1 hour 350 µg/m³ 350 µg/m³ 24
24 hours 150 µg/m³ 125 µg/m³ 3
1 year 60 µg/m³ n/a n/a
Nitrogen dioxide (NO2)
1 hour 400 µg/m³ 200 µg/m³ 18
24 hours 150 µg/m³ - -
1 year - 40 µg/m³ n/a
Carbon monoxide (CO)
1 hour 30 mg/m³ n/a n/a
8 hours 10 mg/m³ 10 mg/m³ n/a
Ozone (O3) 1 hour 200 µg/m³ n/a n/a
8 hours 120 µg/m³ 120 µg/m³ 25 days average over 3 years
PM10 24 hours 150 µg/m³ 50 µg/m³ 35
Total Suspended Particulates
24 hours 230 µg/m³ n/a n/a
1 year 90 µg/m³ n/a n/a
(1) Source: http://ec.europa.eu/environment/air/quality/standards.htm (Consulted 18-01-2011) n/a: not applicable
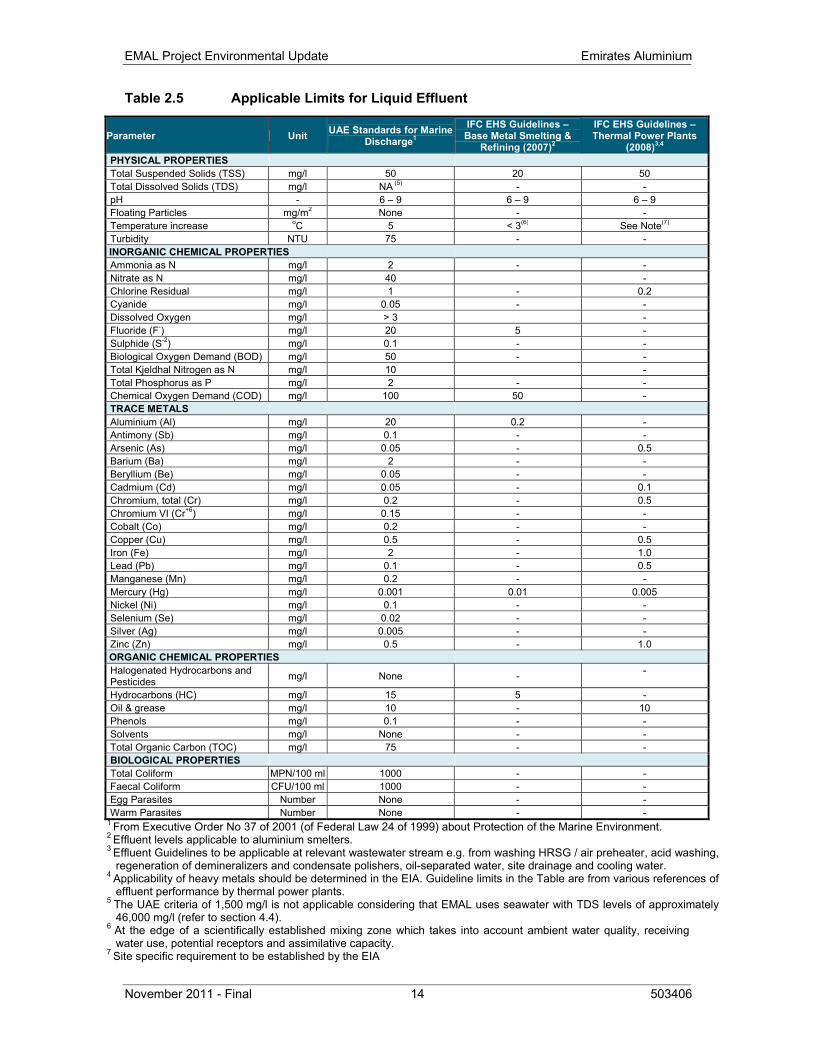
2.6.4 Final Effluent
As mentioned above, the IFC EHS Guidelines for Thermal Power Plants were issued only in 2008. Therefore the effluent guidelines listed in these IFC guidelines were added in Table 2.5 in which the EAD limits for marine discharge and the IFC EHS Guidelines for Base Metal Smelting and Refining are also listed. These limits are applicable for liquid effluent from both the power plant and smelter (including seawater from the SO2 scrubbers and blowdown from the seawater cooling towers) prior to discharge to the ADPC outfall. They have been included in the environmental design criteria for EMAL Phase 2. These levels should be achieved, without dilution, at least 95 % of the time that the plant or unit is operating,
EMAL Project Environmental Update Emirates Aluminium
November 2011 - Final 14 503406
Table 2.5 Applicable Limits for Liquid Effluent
Parameter Unit UAE Standards for Marine Discharge1
IFC EHS Guidelines – Base Metal Smelting &
Refining (2007)2
IFC EHS Guidelines – Thermal Power Plants
(2008)3,4
PHYSICAL PROPERTIES Total Suspended Solids (TSS) mg/l 50 20 50 Total Dissolved Solids (TDS) mg/l NA (5) - - pH - 6 – 9 6 – 9 6 – 9 Floating Particles mg/m2 None - - Temperature increase oC 5 < 3(6) See Note(7) Turbidity NTU 75 - -
INORGANIC CHEMICAL PROPERTIES Ammonia as N mg/l 2 - - Nitrate as N mg/l 40 - Chlorine Residual mg/l 1 - 0.2 Cyanide mg/l 0.05 - - Dissolved Oxygen mg/l > 3 - Fluoride (F-) mg/l 20 5 - Sulphide (S-2) mg/l 0.1 - - Biological Oxygen Demand (BOD) mg/l 50 - - Total Kjeldhal Nitrogen as N mg/l 10 - Total Phosphorus as P mg/l 2 - - Chemical Oxygen Demand (COD) mg/l 100 50 - TRACE METALS Aluminium (Al) mg/l 20 0.2 - Antimony (Sb) mg/l 0.1 - - Arsenic (As) mg/l 0.05 - 0.5 Barium (Ba) mg/l 2 - - Beryllium (Be) mg/l 0.05 - - Cadmium (Cd) mg/l 0.05 - 0.1 Chromium, total (Cr) mg/l 0.2 - 0.5 Chromium VI (Cr+6) mg/l 0.15 - - Cobalt (Co) mg/l 0.2 - - Copper (Cu) mg/l 0.5 - 0.5 Iron (Fe) mg/l 2 - 1.0 Lead (Pb) mg/l 0.1 - 0.5 Manganese (Mn) mg/l 0.2 - - Mercury (Hg) mg/l 0.001 0.01 0.005 Nickel (Ni) mg/l 0.1 - - Selenium (Se) mg/l 0.02 - - Silver (Ag) mg/l 0.005 - - Zinc (Zn) mg/l 0.5 - 1.0
ORGANIC CHEMICAL PROPERTIES Halogenated Hydrocarbons and Pesticides mg/l None - -
Hydrocarbons (HC) mg/l 15 5 - Oil & grease mg/l 10 - 10 Phenols mg/l 0.1 - - Solvents mg/l None - - Total Organic Carbon (TOC) mg/l 75 - - BIOLOGICAL PROPERTIES Total Coliform MPN/100 ml 1000 - - Faecal Coliform CFU/100 ml 1000 - - Egg Parasites Number None - - Warm Parasites Number None - -
1 From Executive Order No 37 of 2001 (of Federal Law 24 of 1999) about Protection of the Marine Environment. 2 Effluent levels applicable to aluminium smelters. 3 Effluent Guidelines to be applicable at relevant wastewater stream e.g. from washing HRSG / air preheater, acid washing,
regeneration of demineralizers and condensate polishers, oil-separated water, site drainage and cooling water. 4 Applicability of heavy metals should be determined in the EIA. Guideline limits in the Table are from various references of
effluent performance by thermal power plants. 5 The UAE criteria of 1,500 mg/l is not applicable considering that EMAL uses seawater with TDS levels of approximately
46,000 mg/l (refer to section 4.4). 6 At the edge of a scientifically established mixing zone which takes into account ambient water quality, receiving
water use, potential receptors and assimilative capacity. 7 Site specific requirement to be established by the EIA
Emirates Aluminium EMAL Project Environmental Update
503406 15 November 2011 - Final
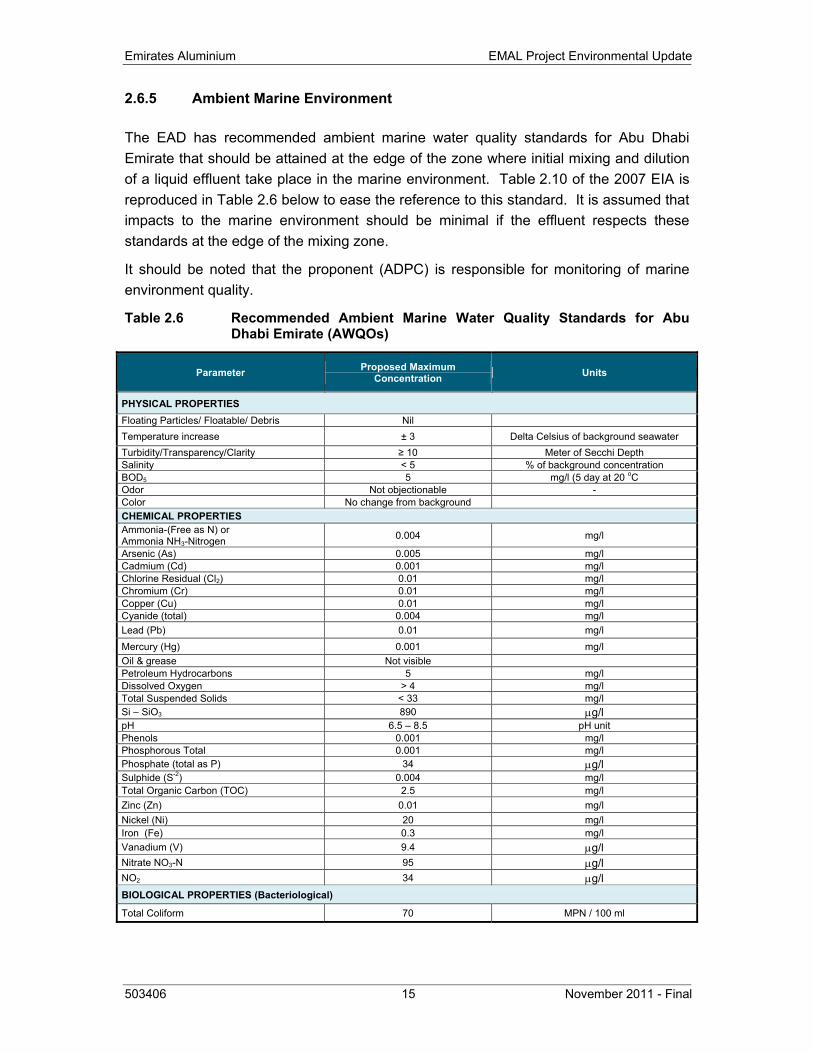
2.6.5 Ambient Marine Environment
The EAD has recommended ambient marine water quality standards for Abu Dhabi Emirate that should be attained at the edge of the zone where initial mixing and dilution of a liquid effluent take place in the marine environment. Table 2.10 of the 2007 EIA is reproduced in Table 2.6 below to ease the reference to this standard. It is assumed that impacts to the marine environment should be minimal if the effluent respects these standards at the edge of the mixing zone.
It should be noted that the proponent (ADPC) is responsible for monitoring of marine environment quality.
Table 2.6 Recommended Ambient Marine Water Quality Standards for Abu Dhabi Emirate (AWQOs)
Parameter Proposed Maximum Concentration Units
PHYSICAL PROPERTIES Floating Particles/ Floatable/ Debris Nil Temperature increase ± 3 Delta Celsius of background seawater Turbidity/Transparency/Clarity ≥ 10 Meter of Secchi Depth Salinity < 5 % of background concentration BOD5 5 mg/l (5 day at 20 oC Odor Not objectionable - Color No change from background CHEMICAL PROPERTIES Ammonia-(Free as N) or Ammonia NH3-Nitrogen 0.004 mg/l
Arsenic (As) 0.005 mg/l Cadmium (Cd) 0.001 mg/l Chlorine Residual (Cl2) 0.01 mg/l Chromium (Cr) 0.01 mg/l Copper (Cu) 0.01 mg/l Cyanide (total) 0.004 mg/l Lead (Pb) 0.01 mg/l Mercury (Hg) 0.001 mg/l Oil & grease Not visible Petroleum Hydrocarbons 5 mg/l Dissolved Oxygen > 4 mg/l Total Suspended Solids < 33 mg/l Si – SiO3 890 μg/l pH 6.5 – 8.5 pH unit Phenols 0.001 mg/l Phosphorous Total 0.001 mg/l Phosphate (total as P) 34 μg/l Sulphide (S-2) 0.004 mg/l Total Organic Carbon (TOC) 2.5 mg/l Zinc (Zn) 0.01 mg/l Nickel (Ni) 20 mg/l Iron (Fe) 0.3 mg/l Vanadium (V) 9.4 μg/l Nitrate NO3-N 95 μg/l NO2 34 μg/l BIOLOGICAL PROPERTIES (Bacteriological)
Total Coliform 70 MPN / 100 ml
EMAL Project Environmental Update Emirates Aluminium
November 2011 - Final 16 503406
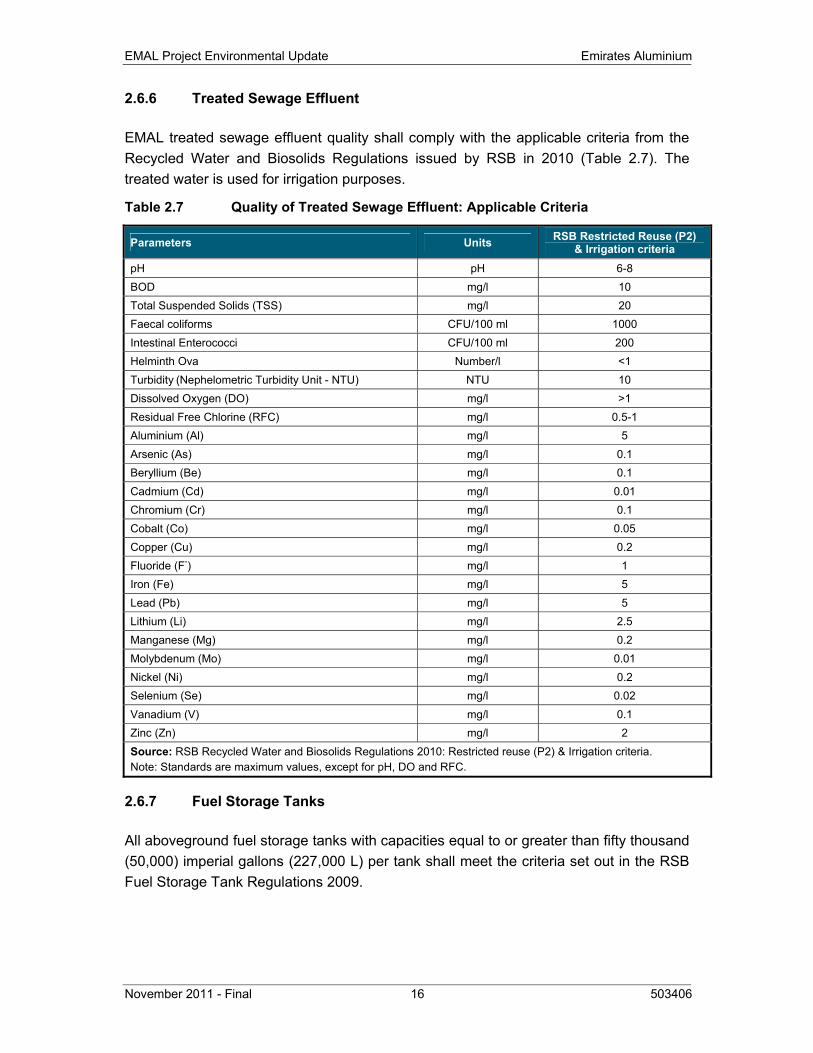
2.6.6 Treated Sewage Effluent
EMAL treated sewage effluent quality shall comply with the applicable criteria from the Recycled Water and Biosolids Regulations issued by RSB in 2010 (Table 2.7). The treated water is used for irrigation purposes.
Table 2.7 Quality of Treated Sewage Effluent: Applicable Criteria
Parameters Units RSB Restricted Reuse (P2) & Irrigation criteria
pH pH 6-8 BOD mg/l 10 Total Suspended Solids (TSS) mg/l 20 Faecal coliforms CFU/100 ml 1000 Intestinal Enterococci CFU/100 ml 200 Helminth Ova Number/l <1 Turbidity (Nephelometric Turbidity Unit - NTU) NTU 10 Dissolved Oxygen (DO) mg/l >1 Residual Free Chlorine (RFC) mg/l 0.5-1 Aluminium (Al) mg/l 5 Arsenic (As) mg/l 0.1 Beryllium (Be) mg/l 0.1 Cadmium (Cd) mg/l 0.01 Chromium (Cr) mg/l 0.1 Cobalt (Co) mg/l 0.05 Copper (Cu) mg/l 0.2 Fluoride (F-) mg/l 1 Iron (Fe) mg/l 5 Lead (Pb) mg/l 5 Lithium (Li) mg/l 2.5 Manganese (Mg) mg/l 0.2 Molybdenum (Mo) mg/l 0.01 Nickel (Ni) mg/l 0.2 Selenium (Se) mg/l 0.02 Vanadium (V) mg/l 0.1 Zinc (Zn) mg/l 2 Source: RSB Recycled Water and Biosolids Regulations 2010: Restricted reuse (P2) & Irrigation criteria. Note: Standards are maximum values, except for pH, DO and RFC.
2.6.7 Fuel Storage Tanks
All aboveground fuel storage tanks with capacities equal to or greater than fifty thousand (50,000) imperial gallons (227,000 L) per tank shall meet the criteria set out in the RSB Fuel Storage Tank Regulations 2009.
Emirates Aluminium EMAL Project Environmental Update
503406 17 November 2011 - Final
These regulations are intended to ensure the prevention and early detection of any fuel release from aboveground fuel storage tanks and to minimize the risk of fuel releases impacting on the environment and on public health. Their requirements are summarized hereafter:
• Fuel storage tanks shall comply with API 650 or similar internationally recognised standard and shall carry a nameplate or placard providing the specifications of the tank including tank identification number, date of installation, capacity, etc.
• Facilities shall provide for early fuel leak detection in storage tanks either through remote instrument alarms like fall-in-level, detection of vapours or other remote instrument intervention.
• Any interstitial spaces (including but not limited to those located in double-walled tanks, double-bottom tanks, and double piping) shall be equipped with interstitial monitoring equipment capable of detecting a release from the primary containment into the interstitial space under all operating conditions.
• The area around a fuel storage tank shall have a secondary containment designed to contain a fuel leak with the following characteristics:
– Able to contain at least 110% of the design capacity of the largest tank in the secondary containment area;
– Constructed with materials which are impermeable to, and compatible with the substances stored, and that will prevent a release into the environment;
– Designed and constructed to contain any fuel released from the fuel storage tank system and prevent fuel from reaching surface water, groundwater, or adjacent land before clean-up;
– Equipped with a manual controlled pump or drain pipe to remove any accumulated water or fluids.
• The base of a steel fuel storage tank shall be protected from corrosion using cathodic protection or a similar internationally recognised method.
• The material used in the construction of the system shall be compatible with the fuel oil to be stored. With regards to corrosion protection, the tank requirements are the following:
– Metallic fuel storage tanks on foundations consisting of material that can allow moisture penetration and corrosion shall be protected from corrosion;
– Where cathodic protection is used it shall be designed by a corrosion expert and comply with API 651 or with similar internationally recognised standards; and
– Exposed surfaces of fuel storage tank systems shall have a protective coating to prevent and control atmospheric corrosion. The coating shall be applied according to the manufacturer’s instructions and approved for use by Abu Dhabi Water and Electricity Authority (ADWEA).
EMAL Project Environmental Update Emirates Aluminium
November 2011 - Final 18 503406
Steel piping shall be protected from external corrosion by:
– piping located above ground and not in contact with the soil;
– cathodic protection; or
– double-walling.
• Fuel storage tanks shall be equipped with a level indicator or other measurement device that accurately indicates the level of fuel in the tank. The level indicator or the measurement device shall be accessible and installed so that it can be conveniently read locally or provide remote control room indication. The level detectors should be interlocked with the filling-line control valve as well as outflow pump.
• Fuel storage tanks shall be equipped with an alarm or another automatic mechanism that automatically shuts the flow into the tank when the tank reaches the safe fill level recommended by the manufacturer. All automatic shutoff equipment shall be equipped with a mechanism that will function in the event of power failure, malfunction or other similar events.
• The alarm referred to above shall consist of a visual or audible device capable of alerting the transfer operator, by sight or by hearing, to prevent an overfill situation.
• All fuel transfer areas, where filling connections are made with vehicles, shall be equipped with a spill containment system, such as spill boxes or containment areas capable of containing and collecting spills and overfills at connection points and preventing a release during the transfer of the substance to and from the tank.
• Fuel Storage Tank Systems shall comply with the UAE national civil defence codes and standards for fire protection.
2.6.8 Incident Reporting
As a Regulation & Supervision Bureau (RSB) license holder, EMAL shall comply with the RSB Incident Reporting Regulations (2008). The Regulations give direction for the classification, reporting, notification and investigation of the following categories of incidents:
• Operational o Electricity – generation, transmission, distribution o Water – desalination, transmission, distribution o Wastewater – collection, treatment, disposal
• Health and Safety o Fatality o Major Injury o Ill-health o Dangerous Occurrences
• Environment.
Emirates Aluminium EMAL Project Environmental Update
503406 19 November 2011 - Final
As per the Regulations, an Environmental Incident is defined as an unplanned event or a chain of events that results in the release of substances into the environment which may:
• negatively affect the physical, chemical or biological quality of eco-systems and natural resources;
• have a negative impact on public health and welfare;
• cause damage to structures of cultural significance or sacred values; or persistent damage to an extensive portion of eco-systems resulting in severe impacts on populations or habitats, long-term impact on natural resources or
• damage structures of cultural significance – where outside assistance is required.
If such an incident occurs, RSB is to be notified as soon as is practicable and within 24hrs (either by telephone, personal meeting, fax or email) and in writing within 3 working days (by email, fax or letter).
EMAL Project Environmental Update Emirates Aluminium
November 2011 - Final 20 503406
3 PROJECT DESCRIPTION
3.1 OVERVIEW
The 2007 EIA was prepared for a smelter of 1.4 Mt to be built in two phases. Therefore, the Report compares the Project (1.4 Mt) of 2007 to the Project (1.4 Mt) as it stands in 2011. Some modifications to the 2007 plans have already occurred in the course of Phase 1 while other modifications to initial plans are planned for Phase 2.
Compared to the initial concept proposed in the original EIA, EMAL undertook and implemented the following main changes in Phase 1 (approved by EAD in March 2011):
• Increase of pot amperage from 350 kA to 380 kA for potlines 1 and 2 (Phase 1)
• RTO instead of coke scrubbers for green anode plant fume treatment technology
• Treatment of hot bath fumes in a potline gas treatment center (GTC) instead of a dedicated gas treatment center in the Carbon Area
• Reverse osmosis rather than multi-effect distillation for seawater desalination
In addition for Phase 2 and the overall project, the following technical modifications related to the project design were approved by the EAD in October 2011 and include:
• Construction of one potline of 444 DX+ pots for Phase 2 designed to be operated up to 480 kA instead of two DX potlines operated at 380 kA. Two GTCs equipped with 3,500-tonne fresh alumina silo will treat the gases emitted from the Phase 2 potline.
• Seawater scrubbers will not be installed for anode baking Fume Treatment Centers
• Seawater scrubbers will not be installed for the Phase 2 GTCs
• Instead of a conveyor to carry alumina from the silo farm to the GTC silos, EMAL will use its fleet of alumina hopper trucks to transport alumina from the silo farm to the Phase 2 GTC silos
• Three baking furnaces to be installed in total instead of four;
• A lower number of power generation units to be installed for the power plant (4 power blocks instead of 5)
3.2 DESIGN MODIFICATIONS AND JUSTIFICATION
As mentioned earlier, the initial 2007 EIA was prepared for a total capacity of 1.4 M t Al/y. Some changes occurred to the initial plans, in the normal process of project detailed design and optimization phase. At the time the original EIA was issued to the EAD in June 2007, some processes, equipment and capacities were defined on a preliminary basis, before the actual equipment was selected. This section reviews the modifications that were carried out to the smelter and port facilities after the EIA was
Emirates Aluminium EMAL Project Environmental Update
503406 21 November 2011 - Final
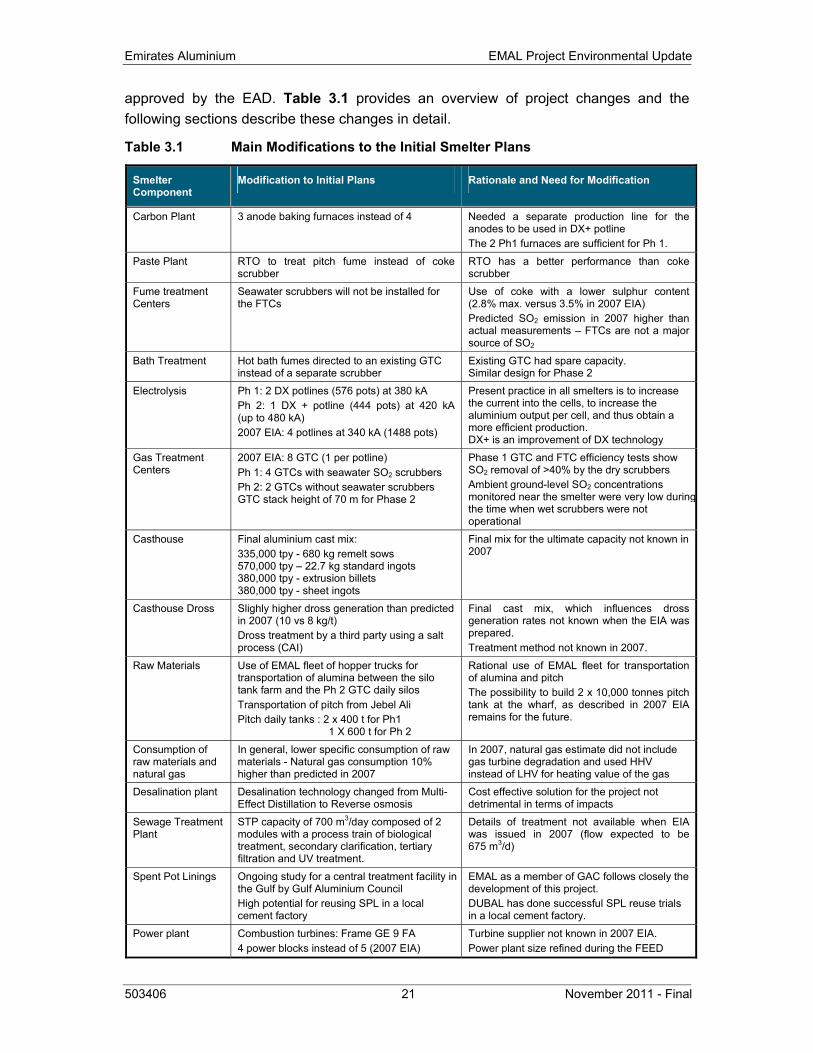
approved by the EAD. Table 3.1 provides an overview of project changes and the following sections describe these changes in detail.
Table 3.1 Main Modifications to the Initial Smelter Plans
Smelter Component
Modification to Initial Plans Rationale and Need for Modification
Carbon Plant 3 anode baking furnaces instead of 4 Needed a separate production line for the anodes to be used in DX+ potline The 2 Ph1 furnaces are sufficient for Ph 1.
Paste Plant RTO to treat pitch fume instead of coke scrubber
RTO has a better performance than coke scrubber
Fume treatment Centers
Seawater scrubbers will not be installed for the FTCs
Use of coke with a lower sulphur content (2.8% max. versus 3.5% in 2007 EIA) Predicted SO2 emission in 2007 higher than actual measurements – FTCs are not a major source of SO2
Bath Treatment Hot bath fumes directed to an existing GTC instead of a separate scrubber
Existing GTC had spare capacity. Similar design for Phase 2
Electrolysis Ph 1: 2 DX potlines (576 pots) at 380 kA Ph 2: 1 DX + potline (444 pots) at 420 kA (up to 480 kA) 2007 EIA: 4 potlines at 340 kA (1488 pots)
Present practice in all smelters is to increase the current into the cells, to increase the aluminium output per cell, and thus obtain a more efficient production. DX+ is an improvement of DX technology
Gas Treatment Centers
2007 EIA: 8 GTC (1 per potline) Ph 1: 4 GTCs with seawater SO2 scrubbers Ph 2: 2 GTCs without seawater scrubbers GTC stack height of 70 m for Phase 2
Phase 1 GTC and FTC efficiency tests show SO2 removal of >40% by the dry scrubbers Ambient ground-level SO2 concentrations monitored near the smelter were very low duringthe time when wet scrubbers were not operational
Casthouse Final aluminium cast mix: 335,000 tpy - 680 kg remelt sows 570,000 tpy – 22.7 kg standard ingots 380,000 tpy - extrusion billets 380,000 tpy - sheet ingots
Final mix for the ultimate capacity not known in 2007
Casthouse Dross Slighly higher dross generation than predicted in 2007 (10 vs 8 kg/t) Dross treatment by a third party using a salt process (CAI)
Final cast mix, which influences dross generation rates not known when the EIA was prepared. Treatment method not known in 2007.
Raw Materials Use of EMAL fleet of hopper trucks for transportation of alumina between the silo tank farm and the Ph 2 GTC daily silos Transportation of pitch from Jebel Ali Pitch daily tanks : 2 x 400 t for Ph1
1 X 600 t for Ph 2
Rational use of EMAL fleet for transportation of alumina and pitch The possibility to build 2 x 10,000 tonnes pitch tank at the wharf, as described in 2007 EIA remains for the future.
Consumption of raw materials and natural gas
In general, lower specific consumption of raw materials - Natural gas consumption 10% higher than predicted in 2007
In 2007, natural gas estimate did not include gas turbine degradation and used HHV instead of LHV for heating value of the gas
Desalination plant Desalination technology changed from Multi-Effect Distillation to Reverse osmosis
Cost effective solution for the project not detrimental in terms of impacts
Sewage Treatment Plant
STP capacity of 700 m3/day composed of 2 modules with a process train of biological treatment, secondary clarification, tertiary filtration and UV treatment.
Details of treatment not available when EIA was issued in 2007 (flow expected to be 675 m3/d)
Spent Pot Linings Ongoing study for a central treatment facility in the Gulf by Gulf Aluminium Council High potential for reusing SPL in a local cement factory
EMAL as a member of GAC follows closely the development of this project. DUBAL has done successful SPL reuse trials in a local cement factory.
Power plant Combustion turbines: Frame GE 9 FA 4 power blocks instead of 5 (2007 EIA)
Turbine supplier not known in 2007 EIA. Power plant size refined during the FEED
EMAL Project Environmental Update Emirates Aluminium
November 2011 - Final 22 503406
3.2.1 Infrastructure
No significant change impacting the EIA has been made to Phase 1 configuration since June 2007. Plant services and utilities including tie-ins to Phase 1 consist of:
• Compressor system and compressed air reticulation network
• Primary fuel gas reducing skid and reticulation network to secondary skids
• Potable water, permeate water, and fire fighting water reticulation networks
• Wastewater reticulation
• Storm water drainage system
• Sewerage system
• Seawater supply and discharge systems from intake
• Distribution grids for medium voltage, low voltage and communication cables
• Non-process buildings
• Road system around Phase 2 facilities, including parking areas
The compressed air network will be composed of 12 operating centrifugal compressors located in two compressor houses, as opposed to 19 smaller units mentioned in 2007 EIA. Considering that each compressor has a peak output of 232 Nm3/min and that the system will be operated with two compressors on standby, the continuous peak capacity of the system will be 2,320 Nm3/min.
The other plant services and utilities are planned in accordance to June 2007 EIA approval and do not require any modifications to the EIA.
3.2.2 Power Plant
The major components of the Power Plant systems include the following:
• Gas Compression Station (if required)
• Power blocks: combustion turbines, heat recovery steam generators, steam turbine, generator
• Intake/outfall seawater pump station for Power Plant and Smelter
• Seawater cooling towers
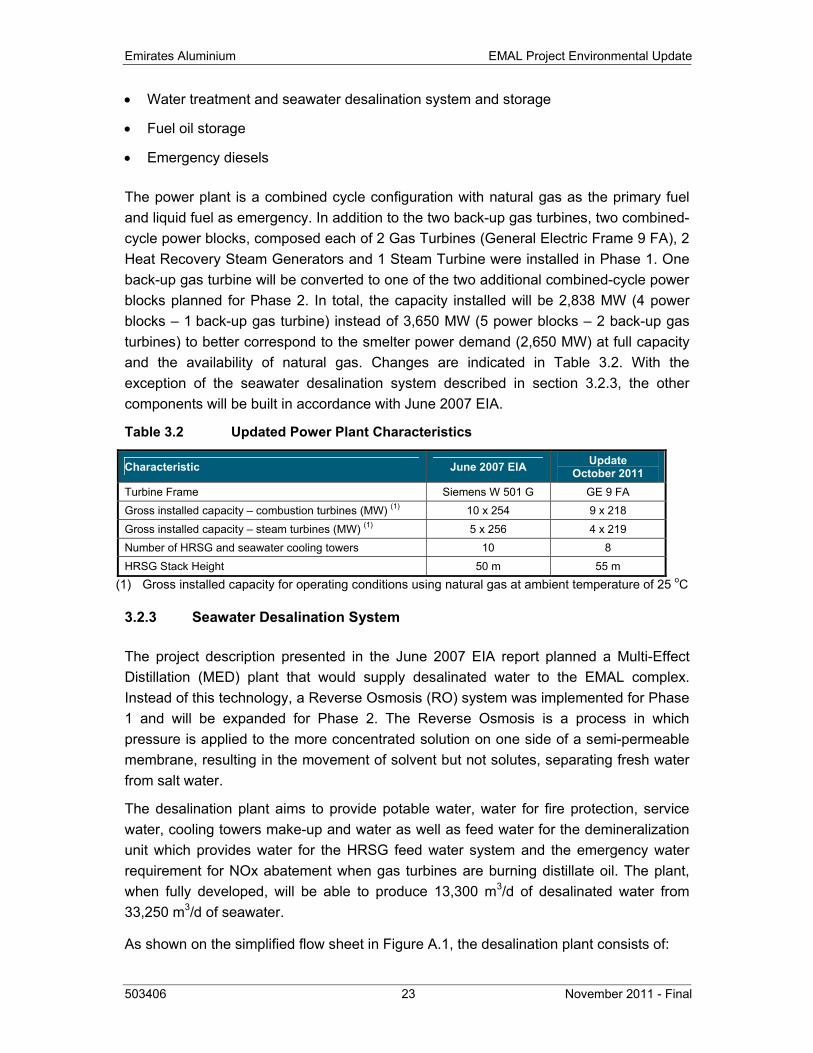
Emirates Aluminium EMAL Project Environmental Update
503406 23 November 2011 - Final
• Water treatment and seawater desalination system and storage
• Fuel oil storage
• Emergency diesels
The power plant is a combined cycle configuration with natural gas as the primary fuel and liquid fuel as emergency. In addition to the two back-up gas turbines, two combined-cycle power blocks, composed each of 2 Gas Turbines (General Electric Frame 9 FA), 2 Heat Recovery Steam Generators and 1 Steam Turbine were installed in Phase 1. One back-up gas turbine will be converted to one of the two additional combined-cycle power blocks planned for Phase 2. In total, the capacity installed will be 2,838 MW (4 power blocks – 1 back-up gas turbine) instead of 3,650 MW (5 power blocks – 2 back-up gas turbines) to better correspond to the smelter power demand (2,650 MW) at full capacity and the availability of natural gas. Changes are indicated in Table 3.2. With the exception of the seawater desalination system described in section 3.2.3, the other components will be built in accordance with June 2007 EIA.
Table 3.2 Updated Power Plant Characteristics
Characteristic June 2007 EIA Update October 2011
Turbine Frame Siemens W 501 G GE 9 FA Gross installed capacity – combustion turbines (MW) (1) 10 x 254 9 x 218 Gross installed capacity – steam turbines (MW) (1) 5 x 256 4 x 219 Number of HRSG and seawater cooling towers 10 8 HRSG Stack Height 50 m 55 m
(1) Gross installed capacity for operating conditions using natural gas at ambient temperature of 25 oC
3.2.3 Seawater Desalination System
The project description presented in the June 2007 EIA report planned a Multi-Effect Distillation (MED) plant that would supply desalinated water to the EMAL complex. Instead of this technology, a Reverse Osmosis (RO) system was implemented for Phase 1 and will be expanded for Phase 2. The Reverse Osmosis is a process in which pressure is applied to the more concentrated solution on one side of a semi-permeable membrane, resulting in the movement of solvent but not solutes, separating fresh water from salt water.
The desalination plant aims to provide potable water, water for fire protection, service water, cooling towers make-up and water as well as feed water for the demineralization unit which provides water for the HRSG feed water system and the emergency water requirement for NOx abatement when gas turbines are burning distillate oil. The plant, when fully developed, will be able to produce 13,300 m3/d of desalinated water from 33,250 m3/d of seawater.
As shown on the simplified flow sheet in Figure A.1, the desalination plant consists of:
EMAL Project Environmental Update Emirates Aluminium
November 2011 - Final 24 503406
• multimedia filters, to reduce the level of suspended matter up to 20 - 25 μm contained in the screened and chlorinated seawater, through top to bottom filtration via sand filters
• cartridge filters (spiral wound type), which then prevent fine particles or sand up to 5 μm from entering the membrane system
• SWRO (sea water reverse osmosis) trains, composed of spiral wound membranes, that produce permeate water
• SPRO (second pass reverse osmosis) trains in order to meet the design parameters for desalinated water and
• chemicals dosing systems, used for the following applications:
– coagulation of flocs in the multimedia filters (ferric chloride)
– inhibition of free chlorine prior to entering the sensitive RO membranes (sodium metabisulfite)
– to avoid scaling of RO membranes (anti-scalant made of polymers and copolymers)
– preventing RO membrane bio-fouling (non-oxidising biocide)
– chlorination of desalinated water for water supply distribution (calcium hypochlorite)
– pH adjustment before SWRO and SPRO trains and re-mineralization of the final permeate distributed to the service and potable water tanks (sodium hydroxide)
– to increase the hardness of the service and potable water (sodium bicarbonate and calcium chloride)
3.2.4 Port Facilities and Material Storage & Handling
No significant change impacting the EIA has been made to Phase 1 configuration since June 2007. In general terms, and as planned in the June 2007 EIA, this area consists of the following main components:
• Ship unloading equipment for alumina and coke; and
• Belt conveyor system from the port to the onshore silo farm
• Material handling equipment at silo farm; and
• Alumina handling system from the silo farm to the GTC silos
Instead of an alumina handling system and a reclaim conveyor to carry alumina from the silo farm to the GTC silos as initially planned in the EIA and implemented for Phase 1, EMAL will make use of its fleet of alumina hopper trucks to transport alumina from the silo farm to the Phase 2 GTC silos. The other components will be implemented as planned in the EIA. The onshore silo farm was totally erected in Phase 1, but did not
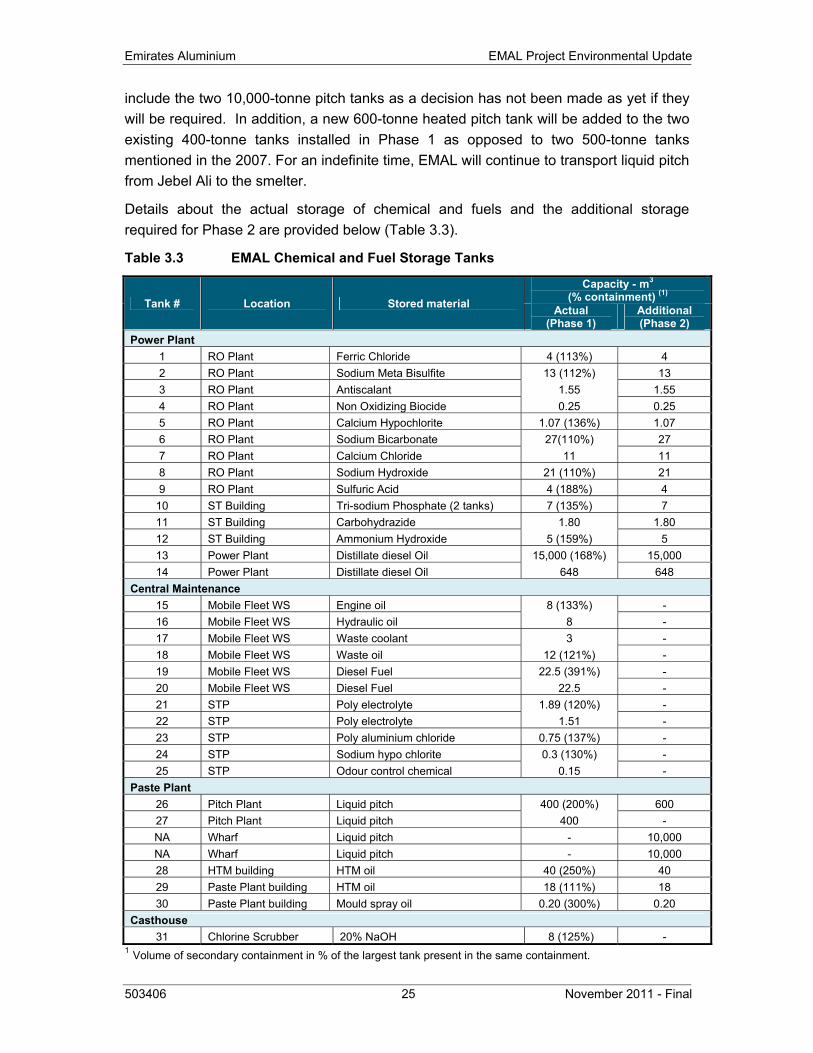
Emirates Aluminium EMAL Project Environmental Update
503406 25 November 2011 - Final
include the two 10,000-tonne pitch tanks as a decision has not been made as yet if they will be required. In addition, a new 600-tonne heated pitch tank will be added to the two existing 400-tonne tanks installed in Phase 1 as opposed to two 500-tonne tanks mentioned in the 2007. For an indefinite time, EMAL will continue to transport liquid pitch from Jebel Ali to the smelter.
Details about the actual storage of chemical and fuels and the additional storage required for Phase 2 are provided below (Table 3.3).
Table 3.3 EMAL Chemical and Fuel Storage Tanks
Tank # Location Stored material
Capacity - m3 (% containment) (1)
Actual (Phase 1)
Additional (Phase 2)
Power Plant 1 RO Plant Ferric Chloride 4 (113%) 4 2 RO Plant Sodium Meta Bisulfite 13 (112%) 13 3 RO Plant Antiscalant 1.55 1.55 4 RO Plant Non Oxidizing Biocide 0.25 0.25 5 RO Plant Calcium Hypochlorite 1.07 (136%) 1.07 6 RO Plant Sodium Bicarbonate 27(110%) 27 7 RO Plant Calcium Chloride 11 11 8 RO Plant Sodium Hydroxide 21 (110%) 21 9 RO Plant Sulfuric Acid 4 (188%) 4
10 ST Building Tri-sodium Phosphate (2 tanks) 7 (135%) 7 11 ST Building Carbohydrazide 1.80 1.80 12 ST Building Ammonium Hydroxide 5 (159%) 5 13 Power Plant Distillate diesel Oil 15,000 (168%) 15,000 14 Power Plant Distillate diesel Oil 648 648
Central Maintenance 15 Mobile Fleet WS Engine oil 8 (133%) - 16 Mobile Fleet WS Hydraulic oil 8 - 17 Mobile Fleet WS Waste coolant 3 - 18 Mobile Fleet WS Waste oil 12 (121%) - 19 Mobile Fleet WS Diesel Fuel 22.5 (391%) - 20 Mobile Fleet WS Diesel Fuel 22.5 - 21 STP Poly electrolyte 1.89 (120%) - 22 STP Poly electrolyte 1.51 - 23 STP Poly aluminium chloride 0.75 (137%) - 24 STP Sodium hypo chlorite 0.3 (130%) - 25 STP Odour control chemical 0.15 -
Paste Plant 26 Pitch Plant Liquid pitch 400 (200%) 600 27 Pitch Plant Liquid pitch 400 - NA Wharf Liquid pitch - 10,000
NA Wharf Liquid pitch - 10,000
28 HTM building HTM oil 40 (250%) 40 29 Paste Plant building HTM oil 18 (111%) 18 30 Paste Plant building Mould spray oil 0.20 (300%) 0.20
Casthouse 31 Chlorine Scrubber 20% NaOH 8 (125%) -
1 Volume of secondary containment in % of the largest tank present in the same containment.
EMAL Project Environmental Update Emirates Aluminium
November 2011 - Final 26 503406
All tanks have a secondary containment sufficient to retain 110% of the tank’s capacity in case of spill. All valves, filling points and vents are located inside the secondary containments. Some of the tanks are located in the same containment, as showed in Table 3.3 where the volume of the containment is provided only for the largest reservoir.
3.2.5 Reduction
The Reduction Area is where the alumina is converted into aluminium through an electrolysis process in pots placed side by side in a potroom. Two potline buildings form a potline. Power generated from the power plant is transformed into direct current and then distributed to the reduction cells via large aluminium busbars. Several configurations were studied for the Phase 2 reduction sector. The basic parameters that defined the capacity of the reduction area were the availability of gas and power. A new potline of 444 DX+ pots at 420 kA (designed to be operated up to 480 kA) connected to 2 GTCs is planned for Phase 2 for a capacity of 550,000 t Al/y.
Combined with the fact that since June 2007, the reduction technology has improved, a revised operation scheme is also proposed for Phase 1. The current will be progressively increased from 350 kA to 380 kA for the potlines 1 and 2, aiming for a total production of approximately 800,000 t Al/y.
Phase 2 will be equipped with two alumina injection dry scrubbers (GTCs). GTC stack height was optimized to 70 m.
3.2.6 Carbon
The carbon sector includes the following main components:
• Carbon recycling shop to reclaim green scrap and anode butts
• Paste plant composed of three mixing lines and two anode cooling tunnels
• Anode handling and storage shop
• Anode baking furnaces
• Hot bath removal, cooling and treatment
• Anode rodding shop
• Carbon services
There will be three open-type furnaces instead of four as planned in the EIA. The new anode baking furnace (ABF) will be dedicated to the production of anodes for the DX+ potline, which are different in size than the anodes produced for the DX potlines.
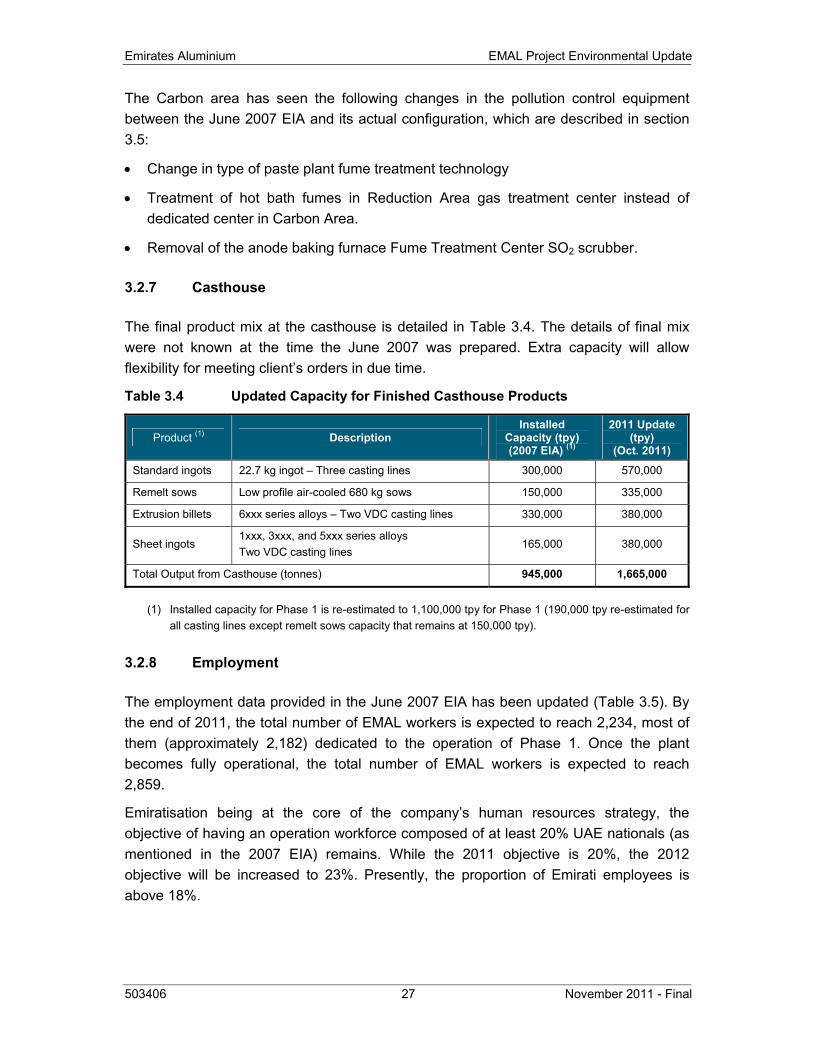
Emirates Aluminium EMAL Project Environmental Update
503406 27 November 2011 - Final
The Carbon area has seen the following changes in the pollution control equipment between the June 2007 EIA and its actual configuration, which are described in section 3.5:
• Change in type of paste plant fume treatment technology
• Treatment of hot bath fumes in Reduction Area gas treatment center instead of dedicated center in Carbon Area.
• Removal of the anode baking furnace Fume Treatment Center SO2 scrubber.
3.2.7 Casthouse
The final product mix at the casthouse is detailed in Table 3.4. The details of final mix were not known at the time the June 2007 was prepared. Extra capacity will allow flexibility for meeting client’s orders in due time.
Table 3.4 Updated Capacity for Finished Casthouse Products
Product (1) Description Installed
Capacity (tpy) (2007 EIA) (1)
2011 Update (tpy)
(Oct. 2011)
Standard ingots 22.7 kg ingot – Three casting lines 300,000 570,000
Remelt sows Low profile air-cooled 680 kg sows 150,000 335,000
Extrusion billets 6xxx series alloys – Two VDC casting lines 330,000 380,000
Sheet ingots 1xxx, 3xxx, and 5xxx series alloys Two VDC casting lines
165,000 380,000
Total Output from Casthouse (tonnes) 945,000 1,665,000
(1) Installed capacity for Phase 1 is re-estimated to 1,100,000 tpy for Phase 1 (190,000 tpy re-estimated for all casting lines except remelt sows capacity that remains at 150,000 tpy).
3.2.8 Employment
The employment data provided in the June 2007 EIA has been updated (Table 3.5). By the end of 2011, the total number of EMAL workers is expected to reach 2,234, most of them (approximately 2,182) dedicated to the operation of Phase 1. Once the plant becomes fully operational, the total number of EMAL workers is expected to reach 2,859.
Emiratisation being at the core of the company’s human resources strategy, the objective of having an operation workforce composed of at least 20% UAE nationals (as mentioned in the 2007 EIA) remains. While the 2011 objective is 20%, the 2012 objective will be increased to 23%. Presently, the proportion of Emirati employees is above 18%.
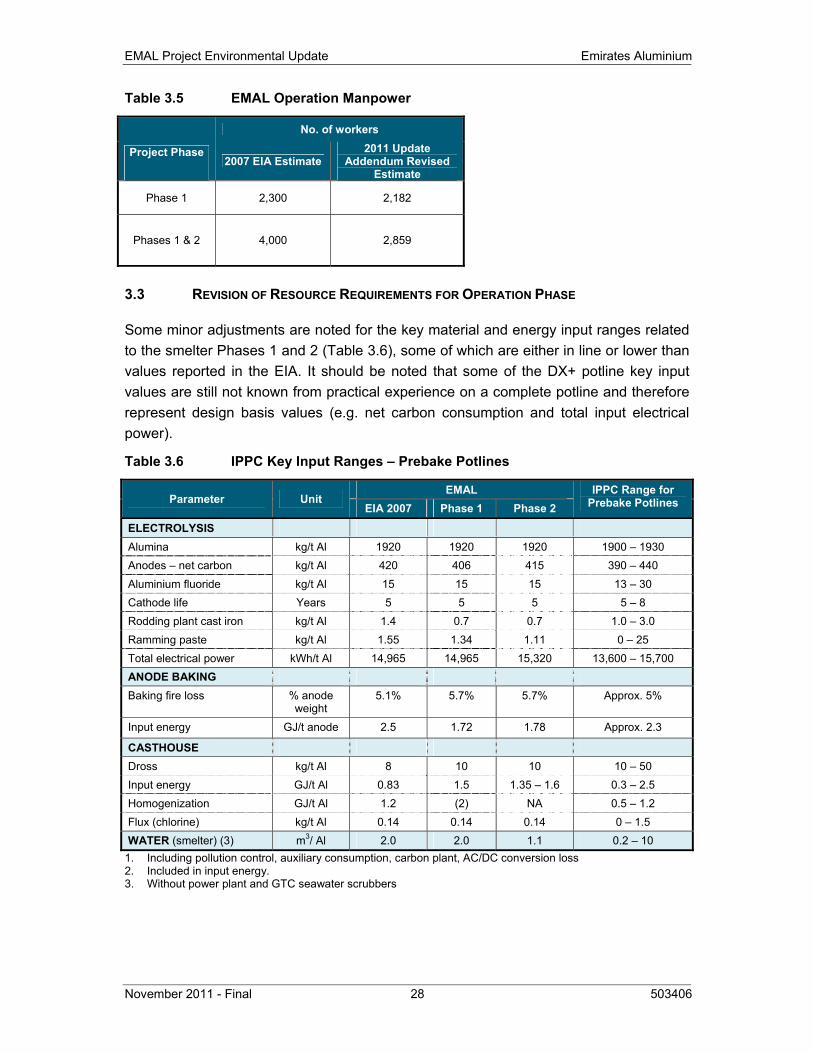
EMAL Project Environmental Update Emirates Aluminium
November 2011 - Final 28 503406
Table 3.5 EMAL Operation Manpower
Project Phase
No. of workers
2007 EIA Estimate 2011 Update
Addendum Revised Estimate
Phase 1 2,300 2,182
Phases 1 & 2 4,000 2,859
3.3 REVISION OF RESOURCE REQUIREMENTS FOR OPERATION PHASE
Some minor adjustments are noted for the key material and energy input ranges related to the smelter Phases 1 and 2 (Table 3.6), some of which are either in line or lower than values reported in the EIA. It should be noted that some of the DX+ potline key input values are still not known from practical experience on a complete potline and therefore represent design basis values (e.g. net carbon consumption and total input electrical power).
Table 3.6 IPPC Key Input Ranges – Prebake Potlines
Parameter Unit EMAL IPPC Range for
Prebake Potlines EIA 2007 Phase 1 Phase 2
ELECTROLYSIS Alumina kg/t Al 1920 1920 1920 1900 – 1930 Anodes – net carbon kg/t Al 420 406 415 390 – 440 Aluminium fluoride kg/t Al 15 15 15 13 – 30 Cathode life Years 5 5 5 5 – 8 Rodding plant cast iron kg/t Al 1.4 0.7 0.7 1.0 – 3.0 Ramming paste kg/t Al 1.55 1.34 1.11 0 – 25 Total electrical power kWh/t Al 14,965 14,965 15,320 13,600 – 15,700 ANODE BAKING Baking fire loss % anode
weight 5.1% 5.7% 5.7% Approx. 5%
Input energy GJ/t anode 2.5 1.72 1.78 Approx. 2.3
CASTHOUSE Dross kg/t Al 8 10 10 10 – 50 Input energy GJ/t Al 0.83 1.5 1.35 – 1.6 0.3 – 2.5 Homogenization GJ/t Al 1.2 (2) NA 0.5 – 1.2 Flux (chlorine) kg/t Al 0.14 0.14 0.14 0 – 1.5 WATER (smelter) (3) m3/ Al 2.0 2.0 1.1 0.2 – 10
1. Including pollution control, auxiliary consumption, carbon plant, AC/DC conversion loss 2. Included in input energy. 3. Without power plant and GTC seawater scrubbers
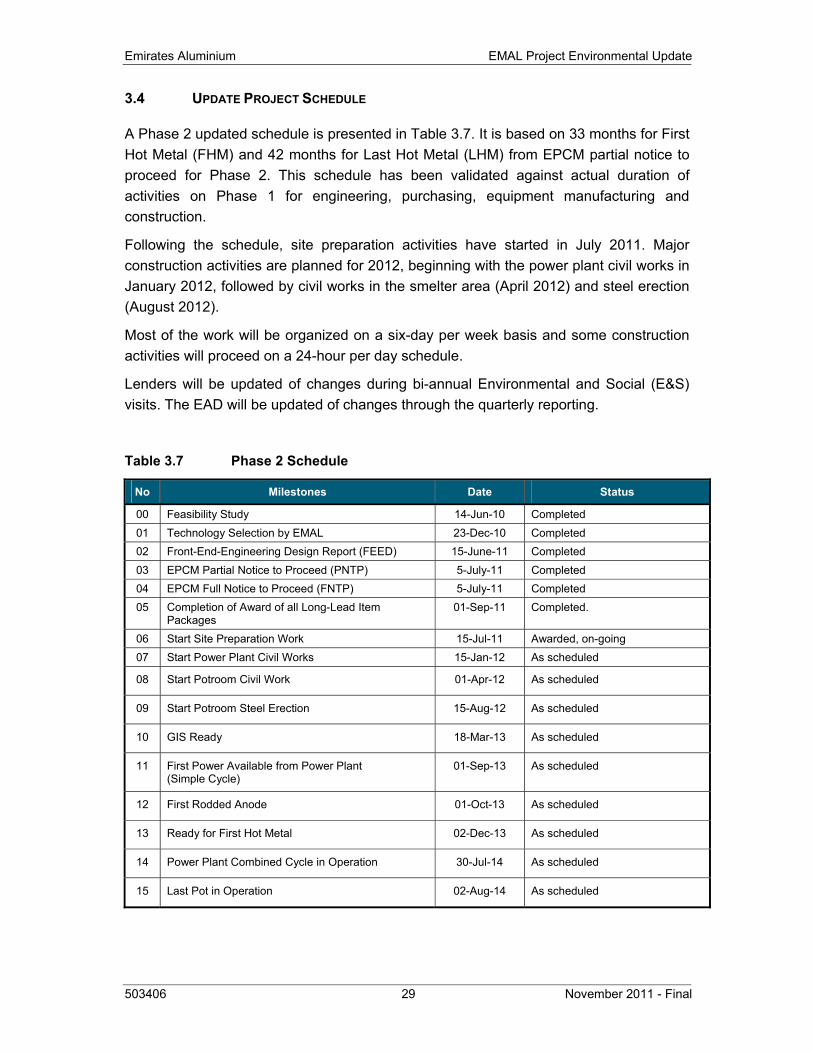
Emirates Aluminium EMAL Project Environmental Update
503406 29 November 2011 - Final
3.4 UPDATE PROJECT SCHEDULE
A Phase 2 updated schedule is presented in Table 3.7. It is based on 33 months for First Hot Metal (FHM) and 42 months for Last Hot Metal (LHM) from EPCM partial notice to proceed for Phase 2. This schedule has been validated against actual duration of activities on Phase 1 for engineering, purchasing, equipment manufacturing and construction.
Following the schedule, site preparation activities have started in July 2011. Major construction activities are planned for 2012, beginning with the power plant civil works in January 2012, followed by civil works in the smelter area (April 2012) and steel erection (August 2012).
Most of the work will be organized on a six-day per week basis and some construction activities will proceed on a 24-hour per day schedule.
Lenders will be updated of changes during bi-annual Environmental and Social (E&S) visits. The EAD will be updated of changes through the quarterly reporting.
Table 3.7 Phase 2 Schedule
No Milestones Date Status
00 Feasibility Study 14-Jun-10 Completed 01 Technology Selection by EMAL 23-Dec-10 Completed 02 Front-End-Engineering Design Report (FEED) 15-June-11 Completed 03 EPCM Partial Notice to Proceed (PNTP) 5-July-11 Completed 04 EPCM Full Notice to Proceed (FNTP) 5-July-11 Completed 05 Completion of Award of all Long-Lead Item
Packages 01-Sep-11 Completed.
06 Start Site Preparation Work 15-Jul-11 Awarded, on-going 07 Start Power Plant Civil Works 15-Jan-12 As scheduled
08 Start Potroom Civil Work 01-Apr-12 As scheduled
09 Start Potroom Steel Erection 15-Aug-12 As scheduled
10 GIS Ready 18-Mar-13 As scheduled
11 First Power Available from Power Plant (Simple Cycle)
01-Sep-13 As scheduled
12 First Rodded Anode 01-Oct-13 As scheduled
13 Ready for First Hot Metal 02-Dec-13 As scheduled
14 Power Plant Combined Cycle in Operation 30-Jul-14 As scheduled
15 Last Pot in Operation 02-Aug-14 As scheduled
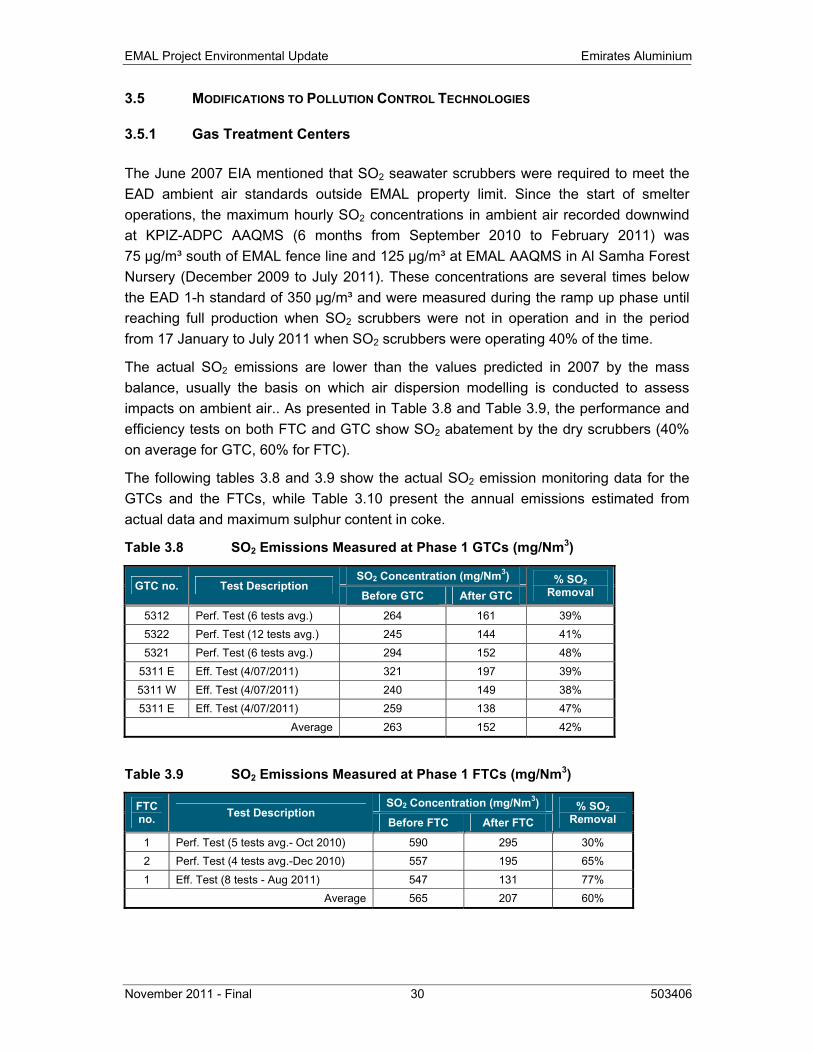
EMAL Project Environmental Update Emirates Aluminium
November 2011 - Final 30 503406
3.5 MODIFICATIONS TO POLLUTION CONTROL TECHNOLOGIES
3.5.1 Gas Treatment Centers
The June 2007 EIA mentioned that SO2 seawater scrubbers were required to meet the EAD ambient air standards outside EMAL property limit. Since the start of smelter operations, the maximum hourly SO2 concentrations in ambient air recorded downwind at KPIZ-ADPC AAQMS (6 months from September 2010 to February 2011) was 75 µg/m³ south of EMAL fence line and 125 µg/m³ at EMAL AAQMS in Al Samha Forest Nursery (December 2009 to July 2011). These concentrations are several times below the EAD 1-h standard of 350 µg/m³ and were measured during the ramp up phase until reaching full production when SO2 scrubbers were not in operation and in the period from 17 January to July 2011 when SO2 scrubbers were operating 40% of the time.
The actual SO2 emissions are lower than the values predicted in 2007 by the mass balance, usually the basis on which air dispersion modelling is conducted to assess impacts on ambient air.. As presented in Table 3.8 and Table 3.9, the performance and efficiency tests on both FTC and GTC show SO2 abatement by the dry scrubbers (40% on average for GTC, 60% for FTC).
The following tables 3.8 and 3.9 show the actual SO2 emission monitoring data for the GTCs and the FTCs, while Table 3.10 present the annual emissions estimated from actual data and maximum sulphur content in coke.
Table 3.8 SO2 Emissions Measured at Phase 1 GTCs (mg/Nm3)
GTC no. Test Description SO2 Concentration (mg/Nm3) % SO2
Removal Before GTC After GTC
5312 Perf. Test (6 tests avg.) 264 161 39% 5322 Perf. Test (12 tests avg.) 245 144 41% 5321 Perf. Test (6 tests avg.) 294 152 48%
5311 E Eff. Test (4/07/2011) 321 197 39% 5311 W Eff. Test (4/07/2011) 240 149 38% 5311 E Eff. Test (4/07/2011) 259 138 47%
Average 263 152 42%
Table 3.9 SO2 Emissions Measured at Phase 1 FTCs (mg/Nm3)
FTC no. Test Description
SO2 Concentration (mg/Nm3) % SO2 Removal Before FTC After FTC
1 Perf. Test (5 tests avg.- Oct 2010) 590 295 30% 2 Perf. Test (4 tests avg.-Dec 2010) 557 195 65% 1 Eff. Test (8 tests - Aug 2011) 547 131 77%
Average 565 207 60%
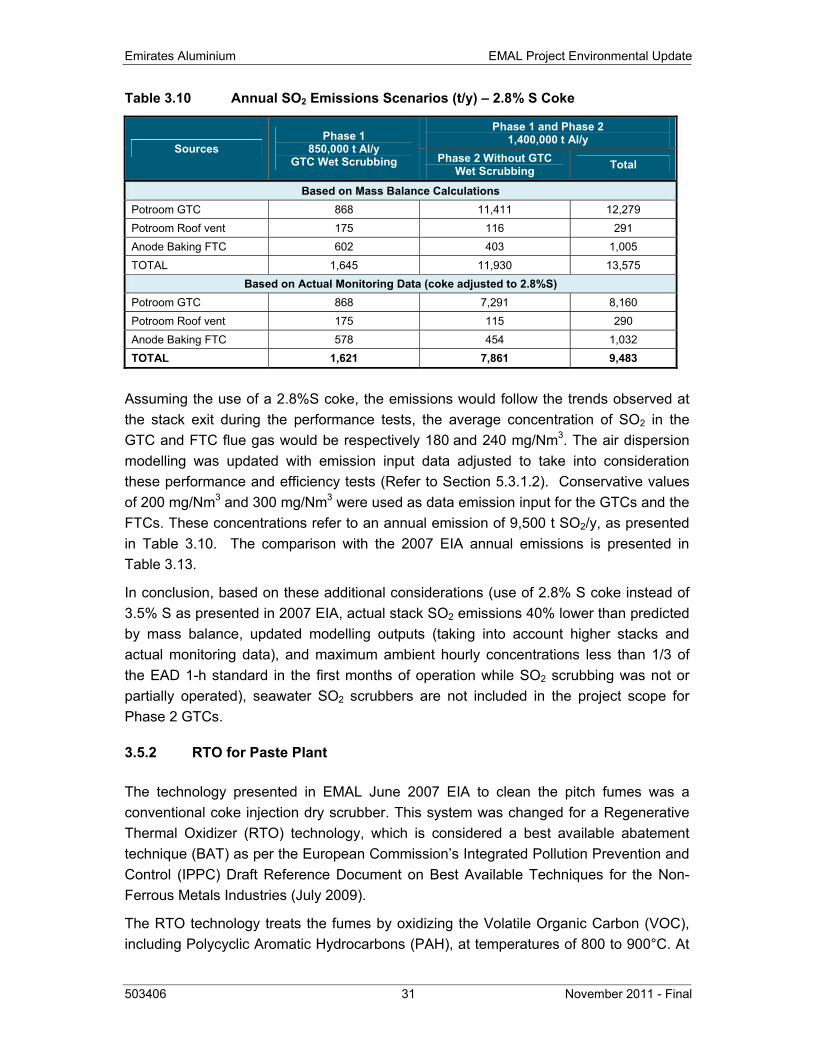
Emirates Aluminium EMAL Project Environmental Update
503406 31 November 2011 - Final
Table 3.10 Annual SO2 Emissions Scenarios (t/y) – 2.8% S Coke
Sources Phase 1
850,000 t Al/y GTC Wet Scrubbing
Phase 1 and Phase 2 1,400,000 t Al/y
Phase 2 Without GTC Wet Scrubbing Total
Based on Mass Balance Calculations Potroom GTC 868 11,411 12,279 Potroom Roof vent 175 116 291 Anode Baking FTC 602 403 1,005 TOTAL 1,645 11,930 13,575
Based on Actual Monitoring Data (coke adjusted to 2.8%S) Potroom GTC 868 7,291 8,160 Potroom Roof vent 175 115 290 Anode Baking FTC 578 454 1,032 TOTAL 1,621 7,861 9,483
Assuming the use of a 2.8%S coke, the emissions would follow the trends observed at the stack exit during the performance tests, the average concentration of SO2 in the GTC and FTC flue gas would be respectively 180 and 240 mg/Nm3. The air dispersion modelling was updated with emission input data adjusted to take into consideration these performance and efficiency tests (Refer to Section 5.3.1.2). Conservative values of 200 mg/Nm3 and 300 mg/Nm3 were used as data emission input for the GTCs and the FTCs. These concentrations refer to an annual emission of 9,500 t SO2/y, as presented in Table 3.10. The comparison with the 2007 EIA annual emissions is presented in Table 3.13.
In conclusion, based on these additional considerations (use of 2.8% S coke instead of 3.5% S as presented in 2007 EIA, actual stack SO2 emissions 40% lower than predicted by mass balance, updated modelling outputs (taking into account higher stacks and actual monitoring data), and maximum ambient hourly concentrations less than 1/3 of the EAD 1-h standard in the first months of operation while SO2 scrubbing was not or partially operated), seawater SO2 scrubbers are not included in the project scope for Phase 2 GTCs.
3.5.2 RTO for Paste Plant
The technology presented in EMAL June 2007 EIA to clean the pitch fumes was a conventional coke injection dry scrubber. This system was changed for a Regenerative Thermal Oxidizer (RTO) technology, which is considered a best available abatement technique (BAT) as per the European Commission’s Integrated Pollution Prevention and Control (IPPC) Draft Reference Document on Best Available Techniques for the Non-Ferrous Metals Industries (July 2009).
The RTO technology treats the fumes by oxidizing the Volatile Organic Carbon (VOC), including Polycyclic Aromatic Hydrocarbons (PAH), at temperatures of 800 to 900°C. At
EMAL Project Environmental Update Emirates Aluminium
November 2011 - Final 32 503406
these temperatures, VOC reacts with oxygen (O2) to produce carbon dioxide (CO2) and water (H2O) which are released to the atmosphere. The RTO process also recovers sensible heat from combustion gases by means of ceramic beds. Consequently, it is more energy-efficient than a conventional burner.
Figure A.2 illustrates the RTO operation. The raw gas passes through an inlet bed (or heat exchanger) made of ceramics and is heated up (almost to oxidation temperature) by the energy stored in the ceramics. The pollutants are being destroyed in the adjacent combustion chamber by oxidation. The hot clean gas is led from the oxidation chamber into a second bed, heating up the ceramics of this bed. The clean gas cools down and leaves the system via the clean gas duct, exhaust fan and then stack. After a period of time, the flow direction of the gas is changed and the heated outlet bed then becomes the inlet bed and will heat up the raw gas.
For Phase 1, there are two paste production lines. Each line has a pitch fume treatment system which collects pitch fumes from process areas (i.e. mixing, paste cooling, anode forming, vacuum system and pitch storage tanks) and direct them to a 3-bed RTO. Thus, there are two 3-bed RTOs (i.e. one for each paste production line). While the gas flows through beds 1 and 2 as described above, the third bed is being flushed in order to remove the remaining raw gas residues into the combustion chamber.
For Phase 2, EMAL plans to install a RTO system similar to Phase 1. Alternatively, a RTO would be installed to treat high concentration fumes (paste cooler, other equipment handling hot fuming paste and pitch handling system), in combination with a conventional coke dry scrubber to treat the low concentration fumes from operations such as anode forming, material crushing, etc., for the attainment of the best overall performances and minimization of natural gas consumption.
3.5.3 Hot Bath Fumes Treatment
Hot bath processing and anode butt cooling are significant sources of hydrogen fluoride that justify a treatment through an alumina dry scrubber. However, a detailed engineering review concluded that there was some spare capacity at the Phase 1 potline GTC scrubbers to collect gases from other sources. This solution can be implemented at a lower cost than a dedicated GTC. For Phase 2, the same principle will be applied and the fumes for the new hot bath processing and anode butt cooling will be collected to a GTC of the new potline.
For Phase 1, the GTC extra capacity did not allow for the complete collection of fumes emitted at the hot bath. Therefore, a dust collector was installed to collect fumes and dust from the anode pallet load/unload station. Expected performance for PM emission is 5 mg PM/Nm3. However, HF will not be captured. This operation is estimated to take a period of less than a minute for each pallet, during which HF emissions will be emitted to the dust collector. A small increase of less than 0.5 tonnes HF/year (< 0.1 % of total plant HF emissions) is estimated for this emission.
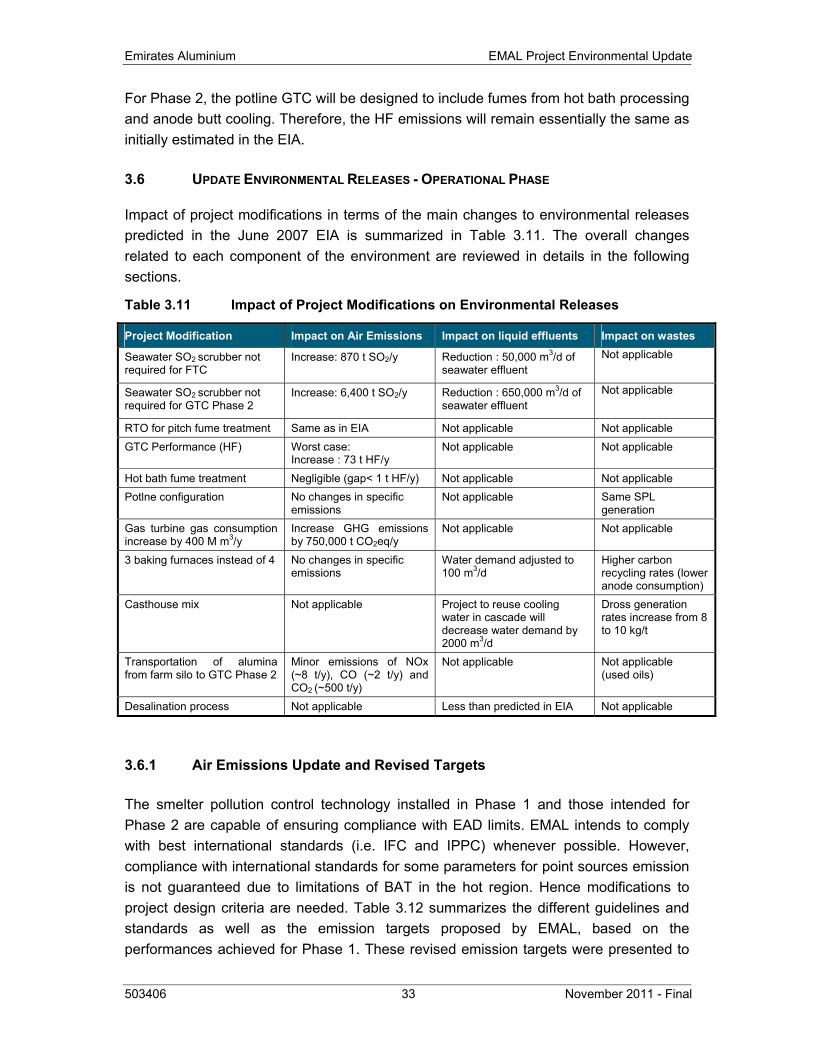
Emirates Aluminium EMAL Project Environmental Update
503406 33 November 2011 - Final
For Phase 2, the potline GTC will be designed to include fumes from hot bath processing and anode butt cooling. Therefore, the HF emissions will remain essentially the same as initially estimated in the EIA.
3.6 UPDATE ENVIRONMENTAL RELEASES - OPERATIONAL PHASE
Impact of project modifications in terms of the main changes to environmental releases predicted in the June 2007 EIA is summarized in Table 3.11. The overall changes related to each component of the environment are reviewed in details in the following sections.
Table 3.11 Impact of Project Modifications on Environmental Releases
Project Modification Impact on Air Emissions Impact on liquid effluents Impact on wastes
Seawater SO2 scrubber not required for FTC
Increase: 870 t SO2/y Reduction : 50,000 m3/d of seawater effluent
Not applicable
Seawater SO2 scrubber not required for GTC Phase 2
Increase: 6,400 t SO2/y Reduction : 650,000 m3/d of seawater effluent
Not applicable
RTO for pitch fume treatment Same as in EIA Not applicable Not applicable GTC Performance (HF) Worst case:
Increase : 73 t HF/y Not applicable Not applicable
Hot bath fume treatment Negligible (gap< 1 t HF/y) Not applicable Not applicable Potlne configuration No changes in specific
emissions Not applicable Same SPL
generation Gas turbine gas consumption increase by 400 M m3/y
Increase GHG emissions by 750,000 t CO2eq/y
Not applicable Not applicable
3 baking furnaces instead of 4 No changes in specific emissions
Water demand adjusted to 100 m3/d
Higher carbon recycling rates (lower anode consumption)
Casthouse mix Not applicable Project to reuse cooling water in cascade will decrease water demand by 2000 m3/d
Dross generation rates increase from 8 to 10 kg/t
Transportation of alumina from farm silo to GTC Phase 2
Minor emissions of NOx (~8 t/y), CO (~2 t/y) and CO2 (~500 t/y)
Not applicable Not applicable (used oils)
Desalination process Not applicable Less than predicted in EIA Not applicable
3.6.1 Air Emissions Update and Revised Targets
The smelter pollution control technology installed in Phase 1 and those intended for Phase 2 are capable of ensuring compliance with EAD limits. EMAL intends to comply with best international standards (i.e. IFC and IPPC) whenever possible. However, compliance with international standards for some parameters for point sources emission is not guaranteed due to limitations of BAT in the hot region. Hence modifications to project design criteria are needed. Table 3.12 summarizes the different guidelines and standards as well as the emission targets proposed by EMAL, based on the performances achieved for Phase 1. These revised emission targets were presented to
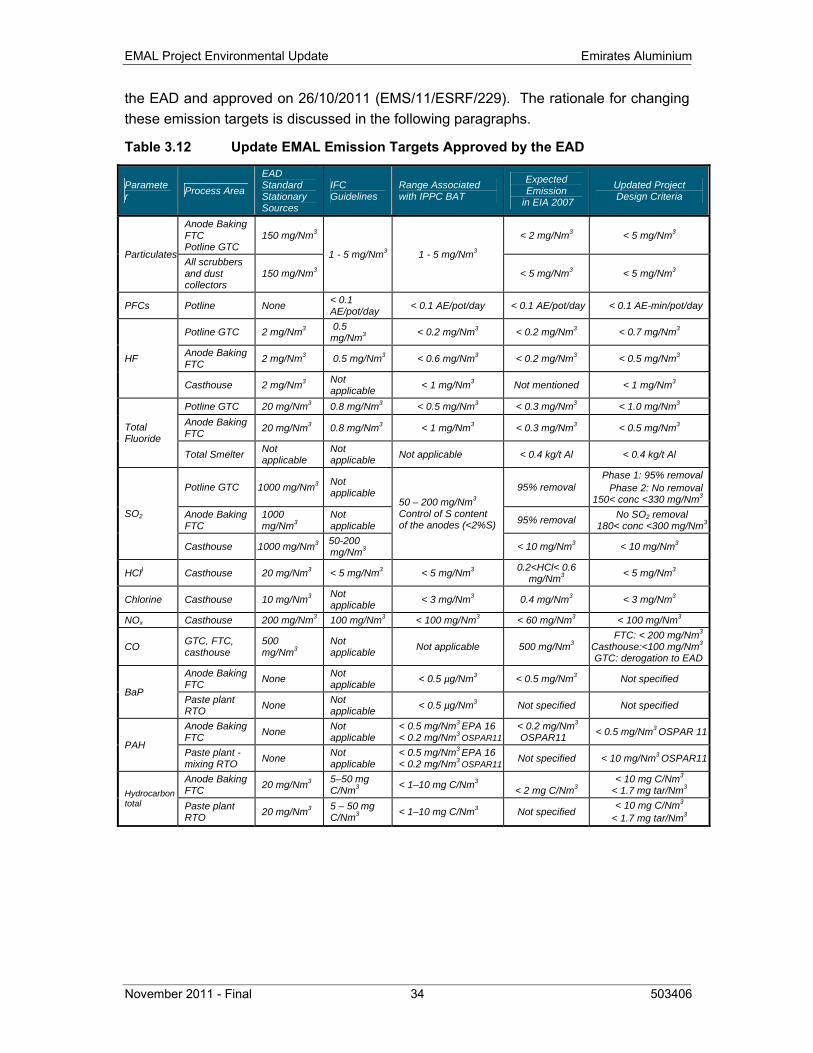
EMAL Project Environmental Update Emirates Aluminium
November 2011 - Final 34 503406
the EAD and approved on 26/10/2011 (EMS/11/ESRF/229). The rationale for changing these emission targets is discussed in the following paragraphs.
Table 3.12 Update EMAL Emission Targets Approved by the EAD
Parameter Process Area
EAD Standard Stationary Sources
IFC Guidelines
Range Associated with IPPC BAT
Expected Emission
in EIA 2007
Updated Project Design Criteria
Particulates
Anode Baking FTC Potline GTC
150 mg/Nm3
1 - 5 mg/Nm3 1 - 5 mg/Nm3
< 2 mg/Nm3 < 5 mg/Nm3
All scrubbers and dust collectors
150 mg/Nm3 < 5 mg/Nm3 < 5 mg/Nm3
PFCs Potline None < 0.1 AE/pot/day < 0.1 AE/pot/day < 0.1 AE/pot/day < 0.1 AE-min/pot/day
HF
Potline GTC 2 mg/Nm3 0.5 mg/Nm3 < 0.2 mg/Nm3 < 0.2 mg/Nm3 < 0.7 mg/Nm3
Anode Baking FTC 2 mg/Nm3 0.5 mg/Nm3 < 0.6 mg/Nm3 < 0.2 mg/Nm3 < 0.5 mg/Nm3
Casthouse 2 mg/Nm3 Not applicable < 1 mg/Nm3 Not mentioned < 1 mg/Nm3
Total Fluoride
Potline GTC 20 mg/Nm3 0.8 mg/Nm3 < 0.5 mg/Nm3 < 0.3 mg/Nm3 < 1.0 mg/Nm3
Anode Baking FTC 20 mg/Nm3 0.8 mg/Nm3 < 1 mg/Nm3 < 0.3 mg/Nm3 < 0.5 mg/Nm3
Total Smelter Not applicable
Not applicable Not applicable < 0.4 kg/t Al < 0.4 kg/t Al
SO2
Potline GTC 1000 mg/Nm3 Not applicable
50 – 200 mg/Nm3
Control of S content of the anodes (<2%S)
95% removal Phase 1: 95% removal
Phase 2: No removal150< conc <330 mg/Nm3
Anode Baking FTC
1000 mg/Nm3
Not applicable 95% removal No SO2 removal
180< conc <300 mg/Nm3
Casthouse 1000 mg/Nm3 50-200 mg/Nm3 < 10 mg/Nm3 < 10 mg/Nm3
HCl) Casthouse 20 mg/Nm3 < 5 mg/Nm3 < 5 mg/Nm3 0.2<HCl< 0.6 mg/Nm3 < 5 mg/Nm3
Chlorine Casthouse 10 mg/Nm3 Not applicable < 3 mg/Nm3 0.4 mg/Nm3 < 3 mg/Nm3
NOx Casthouse 200 mg/Nm3 100 mg/Nm3 < 100 mg/Nm3 < 60 mg/Nm3 < 100 mg/Nm3
CO GTC, FTC, casthouse
500 mg/Nm3
Not applicable Not applicable 500 mg/Nm3
FTC: < 200 mg/Nm3
Casthouse:<100 mg/Nm3
GTC: derogation to EAD
BaP
Anode Baking FTC None Not
applicable < 0.5 µg/Nm3 < 0.5 mg/Nm3 Not specified
Paste plant RTO None Not
applicable < 0.5 µg/Nm3 Not specified Not specified
PAH
Anode Baking FTC None Not
applicable < 0.5 mg/Nm3 EPA 16< 0.2 mg/Nm3 OSPAR11
< 0.2 mg/Nm3 OSPAR11 < 0.5 mg/Nm3 OSPAR 11
Paste plant - mixing RTO None Not
applicable < 0.5 mg/Nm3 EPA 16< 0.2 mg/Nm3 OSPAR11 Not specified < 10 mg/Nm3 OSPAR11
Hydrocarbon total
Anode Baking FTC 20 mg/Nm3 5–50 mg
C/Nm3 < 1–10 mg C/Nm3 < 2 mg C/Nm3
< 10 mg C/Nm3
< 1.7 mg tar/Nm3 Paste plant RTO 20 mg/Nm3 5 – 50 mg
C/Nm3 < 1–10 mg C/Nm3 Not specified < 10 mg C/Nm3 < 1.7 mg tar/Nm3
Emirates Aluminium EMAL Project Environmental Update
503406 35 November 2011 - Final
3.6.1.1 Hydrogen Fluoride (HF)
For the time being, BAT limits have not yet been developed for hot weather regions. Experience with smelters in the Arabian Gulf shows that HF emissions are higher in hot weather climates than in smelters located in cooler climates on which the experience of GTC suppliers was mainly developed. The IFC limit of 0.5 mg HF/Nm3 was based on guarantees usually provided by GTC suppliers in cooler climates.
Operation of the GTCs with wet scrubbers at EMAL Phase 1 results in HF emissions lower than 0.1 mg HF/Nm3, which is better than the maximum levels of 0.2 mg HF/Nm3 predicted in the 2007 EIA. However, due to some commissioning issues, the wet scrubbers entered gradually in operation on 17 January 2011 and were in operation about 40% of the time from January to June 2011. Full operation of wet scrubbers is expected in Q1 2012.
After 22 months of operation, with good operation procedures, the limit of 0.5 mg HF/Nm3 has been difficult to be consistently achieved for GTC’s alumina dry scrubbers when the wet scrubbers were not in operation. This situation in EMAL is not different from the other smelters in the Arabian Gulf. Recent experience of other smelters with alumina dry scrubbers installed in the last three years show that the annual average of HF emissions is approximately 0.7 mg/Nm3, with peak values up to 1.4 mg/Nm3 occurring in the summer months. Despite these facts, the GTC supplier provided a guarantee of 0.5 mg HF/Nm3 for the Phase 2 GTCs as they expect to gain knowledge from the optimization of the GTC operation for Phase 1.
Therefore, EMAL proposes a revised project emission target of 0.7 mg HF/Nm3 for annual average. In terms of total fluorides, as the proportion of gaseous fluorides (HF) and particulate fluoride is approximately 2/3 – 1/3, the annual target for total fluorides will be 1 mg/Nm3. However, maximum HF emission will comply with the EAD HF emission standard (2.0 mg/Nm3). Considering that the HF emissions may potentially be higher than expected in the 2007 EIA, air dispersion modelling is updated in Section 5.3.1.2.
3.6.1.2 Sulphur Dioxide (SO2)
The SO2 emissions are related to the sulphur content of raw materials (coke and pitch). Contrarily to the expected sulphur content predicted for coke (3.5% S) in the 2007 EIA, EMAL will be able to procure in a sustainable manner coke with a Sulphur content up to 2.8% (equivalent to 2.5% S anodes). The EU IPPC Draft Reference Document on BAT in the Non Ferrous Metal Industries (July 2009) mentions that emission levels between 50 and 200 mg/Nm3 can be obtained if the anode sulphur content is less than 2%. The IFC limits refer to this same range only for the SO2 emissions from holding and degassing of molten aluminium (casthouse).
EMAL will not be below these concentration levels for each single source in the smelter. While SO2 concentrations from Phase 1 GTC’s will be lower (less than 20 mg/Nm3) than
EMAL Project Environmental Update Emirates Aluminium
November 2011 - Final 36 503406
the IPPC range due to the use of seawater scrubbers and that SO2 emissions from casthouse will be below 50 mg/Nm3, the expected SO2 emissions from Phase 2 GTC’s should be close to 200 mg/Nm3 as shown from the actual emission monitoring data collected at Phase 1 GTCs (see Table 3.8 and discussion in Section 3.5.1). These levels will be confirmed by the CEMS data that will be collected for the Phase 2 GTC’s.
The performance and efficiency tests on both FTCs and GTCs show that actual SO2 emissions are lower than the values predicted by the mass balance. From mass balance calculations, the emission of SO2 in the flue gas of Phase 2 GTC’s would be in the range of 330 mg/Nm3 at the entry of the potline dry scrubber for a 2.8% S coke. The maximum values of 330 mg/Nm3 for the GTCs and 300 mg/Nm3 for the FTCs in Table 3.12 represent the maximum concentrations as per mass balance calculations (2.8%S coke).
All EMAL sources of atmospheric emissions will always meet the EAD SO2 emission standard of 1000 mg/Nm3 for stationary sources. SO2 levels will be lower than the IFC limits of 50-200 mg/Nm3 required for holding and degassing of molten aluminium (casthouse).
3.6.1.3 Carbon Monoxide (CO)
The EAD CO emission standard of 500 mg/Nm3 applies to all combustion sources of EMAL that is all the equipment burning natural gas. There are no emission guidelines from either IFC or EU BAT.
The EAD CO emission standard will not apply to the reduction process (GTC’s stacks), as it is not a combustion source where combustion can be adjusted with air addition. The CO ambient air monitoring data collected at ADPC and EMAL AAQMS presented in Section 4.2.2.3 shows that CO levels in ambient air are much lower than EAD ambient air standards and are not a concern for the air quality in the area.
3.6.1.4 Polycyclic Aromatic Hydrocarbons (PAHs)
With regard to PAHs, the best available technology (RTO) was selected to control emissions of pitch fumes and PAH from the paste plant (see section 3.5.2). The EU BAT levels are 0.2 mg/Nm3 (OSPAR11) or 0.5 mg/Nm3 (EPA16). There are no limits specified by IFC.
Knowledge of suppliers of BAT equipment is incomplete in certain applications, such as RTO. The PAH emissions measured during the first performance tests in Phase 1 were approximately 8 mg/Nm3 (OSPAR 11). Operation parameters were revised to obtain a better performance in terms of PAH emissions. PAH monitoring was conducted in August 2011 and results were 6.1 and 4.3 mg/Nm3 for RTO 1 and RTO 2 respectively. Additional PAH monitoring was recently conducted in October 2011 and results should be known by the end of 2011.

Emirates Aluminium EMAL Project Environmental Update
503406 37 November 2011 - Final
Considering that most (~ 95%) of the PAHs are removed and that the levels emitted are only traces, it is proposed that a revised target of 10 mg/Nm3 (OSPAR 11) be applied as an acceptable performance for the RTO.
In comparison with regulatory levels for PAH emissions from other countries (as requested by the EAD), it can be mentioned that Environment Canada is presently contemplating an emission standard of 20 g PAH (EPA 15) per tonne of paste. This emission limit reflects the operation of less efficient air pollution control equipment (coke injection dry scrubbers).
According to EMAL stack monitoring data, emissions of 10 mg/Nm3 (OSPAR 11) are approximately equivalent to a concentration of 20 mg/Nm3 (EPA 15). Considering the amount of paste produced during the performance tests, this concentration corresponds to an emission of 7 g PAH (EPA 15) per tonne of paste, which is 35% of the expected future Environment Canada PAH emission standard.
In conclusion, a PAH emission target of 10 mg/Nm3 (OSPAR11) is an achievable limit for EMAL and adapted for the operation of a RTO in hot weather climate. This level was approved by the EAD in October 2010.
With regard to anode baking FTCs, a PAH limit of 0.5 mg/Nm3 (OSPAR11) is proposed as a reasonable limit for the project, based on performance tests and expected monitoring results.
3.6.1.5 Updated Annual Air Emissions
Taking into consideration all the project modifications introduced in the design of the project, the annual atmospheric emissions predicted in the EIA are updated in Table 3.13.
The largest difference with the June 2007 EIA is related to the SO2 emissions. The removal of the seawater scrubbers for Phase 2 GTCs and all FTCs will increase the annual emissions by 7,300 tonnes. As mentioned in Section 3.6.1.2, SO2 emissions are estimated based on use of 2.8% S coke and 95% removal efficiency for wet scrubbers (Phase 1). For Phase 2, two cases are provided: an emission of 200 mg/Nm3 (GTC) and 300 mg/Nm3 (FTC) based on performance test; and an emission of 330 mg/Nm3 (GTC) and 280 mg/Nm3 (FTC).
Annual PAH (OSPAR11) emissions were estimated based on a worst-case emission of 10 mg/Nm3 at RTO stacks and 0.5 mg/Nm3 at FTC stacks. Overall the annual PAH emissions will be slightly less than predicted in the 2007 EIA.
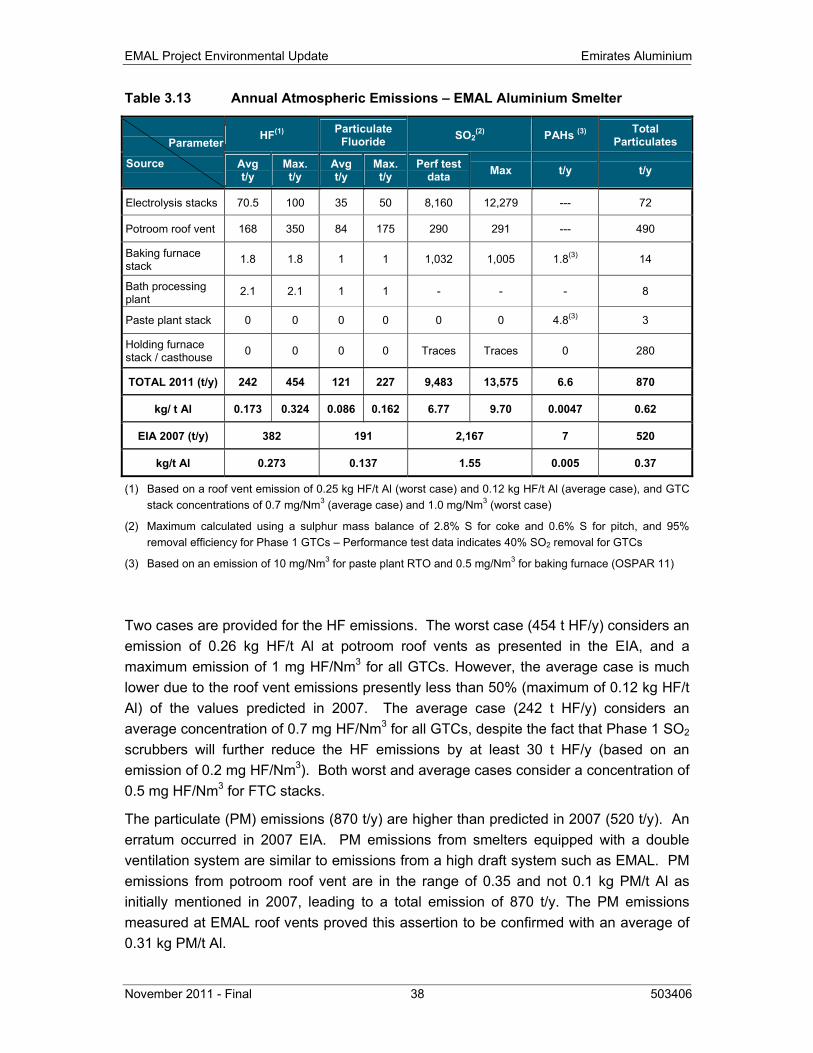
EMAL Project Environmental Update Emirates Aluminium
November 2011 - Final 38 503406
Table 3.13 Annual Atmospheric Emissions – EMAL Aluminium Smelter
Parameter
Source
HF(1) Particulate Fluoride SO2
(2) PAHs (3) Total Particulates
Avg t/y
Max. t/y
Avg t/y
Max.t/y
Perf test data Max t/y t/y
Electrolysis stacks 70.5 100 35 50 8,160 12,279 --- 72
Potroom roof vent 168 350 84 175 290 291 --- 490
Baking furnace stack 1.8 1.8 1 1 1,032 1,005 1.8(3) 14
Bath processing plant
2.1 2.1 1 1 - - - 8
Paste plant stack 0 0 0 0 0 0 4.8(3) 3
Holding furnace stack / casthouse 0 0 0 0 Traces Traces 0 280
TOTAL 2011 (t/y) 242 454 121 227 9,483 13,575 6.6 870
kg/ t Al 0.173 0.324 0.086 0.162 6.77 9.70 0.0047 0.62
EIA 2007 (t/y) 382 191 2,167 7 520
kg/t Al 0.273 0.137 1.55 0.005 0.37
(1) Based on a roof vent emission of 0.25 kg HF/t Al (worst case) and 0.12 kg HF/t Al (average case), and GTC stack concentrations of 0.7 mg/Nm3 (average case) and 1.0 mg/Nm3 (worst case)
(2) Maximum calculated using a sulphur mass balance of 2.8% S for coke and 0.6% S for pitch, and 95% removal efficiency for Phase 1 GTCs – Performance test data indicates 40% SO2 removal for GTCs
(3) Based on an emission of 10 mg/Nm3 for paste plant RTO and 0.5 mg/Nm3 for baking furnace (OSPAR 11)
Two cases are provided for the HF emissions. The worst case (454 t HF/y) considers an emission of 0.26 kg HF/t Al at potroom roof vents as presented in the EIA, and a maximum emission of 1 mg HF/Nm3 for all GTCs. However, the average case is much lower due to the roof vent emissions presently less than 50% (maximum of 0.12 kg HF/t Al) of the values predicted in 2007. The average case (242 t HF/y) considers an average concentration of 0.7 mg HF/Nm3 for all GTCs, despite the fact that Phase 1 SO2 scrubbers will further reduce the HF emissions by at least 30 t HF/y (based on an emission of 0.2 mg HF/Nm3). Both worst and average cases consider a concentration of 0.5 mg HF/Nm3 for FTC stacks.
The particulate (PM) emissions (870 t/y) are higher than predicted in 2007 (520 t/y). An erratum occurred in 2007 EIA. PM emissions from smelters equipped with a double ventilation system are similar to emissions from a high draft system such as EMAL. PM emissions from potroom roof vent are in the range of 0.35 and not 0.1 kg PM/t Al as initially mentioned in 2007, leading to a total emission of 870 t/y. The PM emissions measured at EMAL roof vents proved this assertion to be confirmed with an average of 0.31 kg PM/t Al.
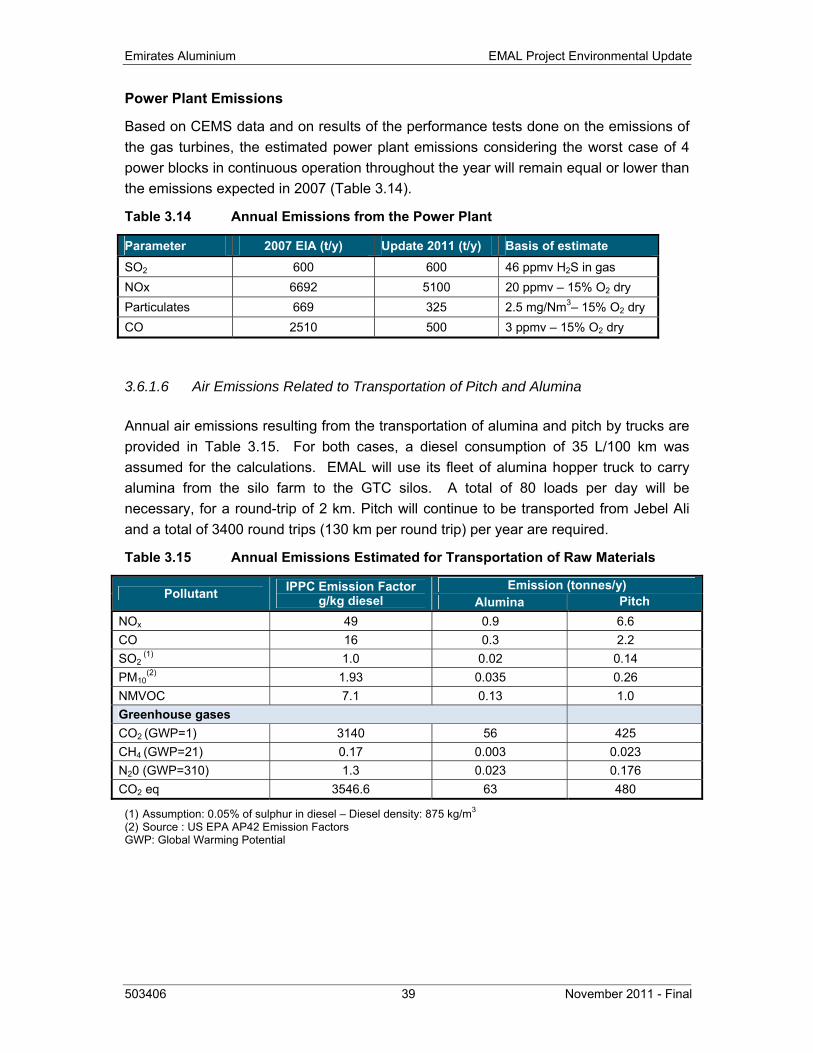
Emirates Aluminium EMAL Project Environmental Update
503406 39 November 2011 - Final
Power Plant Emissions
Based on CEMS data and on results of the performance tests done on the emissions of the gas turbines, the estimated power plant emissions considering the worst case of 4 power blocks in continuous operation throughout the year will remain equal or lower than the emissions expected in 2007 (Table 3.14).
Table 3.14 Annual Emissions from the Power Plant
Parameter 2007 EIA (t/y) Update 2011 (t/y) Basis of estimate SO2 600 600 46 ppmv H2S in gas NOx 6692 5100 20 ppmv – 15% O2 dry Particulates 669 325 2.5 mg/Nm3– 15% O2 dry CO 2510 500 3 ppmv – 15% O2 dry
3.6.1.6 Air Emissions Related to Transportation of Pitch and Alumina
Annual air emissions resulting from the transportation of alumina and pitch by trucks are provided in Table 3.15. For both cases, a diesel consumption of 35 L/100 km was assumed for the calculations. EMAL will use its fleet of alumina hopper truck to carry alumina from the silo farm to the GTC silos. A total of 80 loads per day will be necessary, for a round-trip of 2 km. Pitch will continue to be transported from Jebel Ali and a total of 3400 round trips (130 km per round trip) per year are required.
Table 3.15 Annual Emissions Estimated for Transportation of Raw Materials
Pollutant IPPC Emission Factor g/kg diesel
Emission (tonnes/y) Alumina Pitch
NOx 49 0.9 6.6 CO 16 0.3 2.2 SO2
(1) 1.0 0.02 0.14 PM10
(2) 1.93 0.035 0.26 NMVOC 7.1 0.13 1.0 Greenhouse gases CO2 (GWP=1) 3140 56 425 CH4 (GWP=21) 0.17 0.003 0.023 N20 (GWP=310) 1.3 0.023 0.176 CO2 eq 3546.6 63 480
(1) Assumption: 0.05% of sulphur in diesel – Diesel density: 875 kg/m3 (2) Source : US EPA AP42 Emission Factors GWP: Global Warming Potential
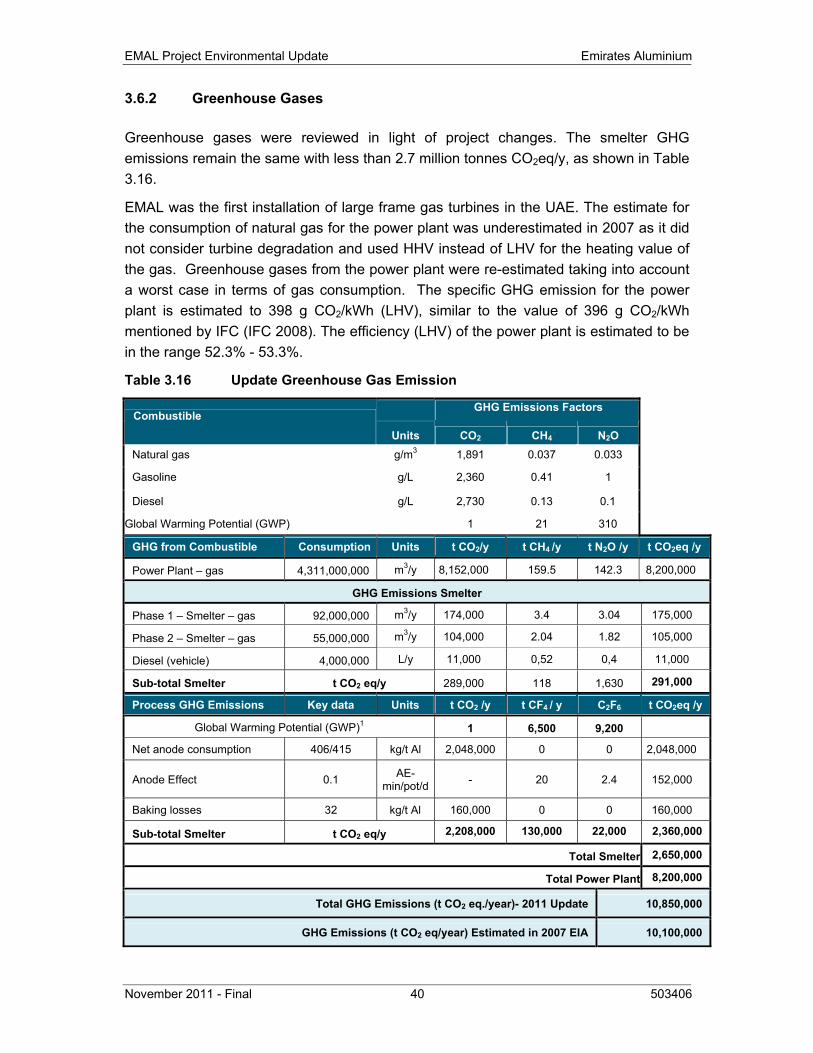
EMAL Project Environmental Update Emirates Aluminium
November 2011 - Final 40 503406
3.6.2 Greenhouse Gases
Greenhouse gases were reviewed in light of project changes. The smelter GHG emissions remain the same with less than 2.7 million tonnes CO2eq/y, as shown in Table 3.16.
EMAL was the first installation of large frame gas turbines in the UAE. The estimate for the consumption of natural gas for the power plant was underestimated in 2007 as it did not consider turbine degradation and used HHV instead of LHV for the heating value of the gas. Greenhouse gases from the power plant were re-estimated taking into account a worst case in terms of gas consumption. The specific GHG emission for the power plant is estimated to 398 g CO2/kWh (LHV), similar to the value of 396 g CO2/kWh mentioned by IFC (IFC 2008). The efficiency (LHV) of the power plant is estimated to be in the range 52.3% - 53.3%.
Table 3.16 Update Greenhouse Gas Emission
Combustible GHG Emissions Factors
Units CO2 CH4 N2O
Natural gas g/m3 1,891 0.037 0.033
Gasoline g/L 2,360 0.41 1
Diesel g/L 2,730 0.13 0.1
Global Warming Potential (GWP) 1 21 310
GHG from Combustible Consumption Units t CO2/y t CH4 /y t N2O /y t CO2eq /y
Power Plant – gas 4,311,000,000 m3/y 8,152,000 159.5 142.3 8,200,000
GHG Emissions Smelter
Phase 1 – Smelter – gas 92,000,000 m3/y 174,000 3.4 3.04 175,000
Phase 2 – Smelter – gas 55,000,000 m3/y 104,000 2.04 1.82 105,000
Diesel (vehicle) 4,000,000 L/y 11,000 0,52 0,4 11,000
Sub-total Smelter t CO2 eq/y 289,000 118 1,630 291,000
Process GHG Emissions Key data Units t CO2 /y t CF4 / y C2F6 t CO2eq /y
Global Warming Potential (GWP)1 1 6,500 9,200
Net anode consumption 406/415 kg/t Al 2,048,000 0 0 2,048,000
Anode Effect 0.1 AE-min/pot/d - 20 2.4 152,000
Baking losses 32 kg/t Al 160,000 0 0 160,000
Sub-total Smelter t CO2 eq/y 2,208,000 130,000 22,000 2,360,000
Total Smelter 2,650,000
Total Power Plant 8,200,000
Total GHG Emissions (t CO2 eq./year)- 2011 Update 10,850,000
GHG Emissions (t CO2 eq/year) Estimated in 2007 EIA 10,100,000
Emirates Aluminium EMAL Project Environmental Update
503406 41 November 2011 - Final
3.6.3 Water Management Update
The same principles mentioned in June 2007 EIA still guide the water management strategies in EMAL smelter (Phases 1 and 2):
• Minimize water consumption and tend as much as possible to a zero discharge for process wastewater from the aluminium smelter.
• To the maximum extent possible, wastewater is recycled to another part of the process that has a lower quality requirement (e.g., casthouse cooling tower blowdown will be recycled in cascade in other casthouse cooling towers prior to use through the anode baking fume treatment conditioning tower).
• Sanitary wastewaters are segregated and treated by a dedicated facility designed to treat most of the wastewater from the construction site works.
• No washdown water is used on floors in the process areas (except for the mobile equipment washing area), and the process areas are not be equipped with floor drains.
• Landscaped areas will be equipped with an irrigation system. The irrigation system will use recycled water (disinfected treated sanitary wastewaters and settled storm water runoff) to the maximum possible extent.
• Wastewater generated at the power/desalination plant (including boiler blowdown, neutralized demineraliser regenerant and desalination system blowdown and cooling water) are fed to the cooling tower basins and serve as part of the tower system makeup water.
3.6.3.1 Water Balance
The water balance has been substantially optimized since 2007 and is presented in Figure A.3. Based on current water demand, less process water than initially estimated will be required for the different processes, whether it’d be for cooling purposes or for SO2 seawater scrubbers:
• The removal of the seawater scrubbers for all the FTC’s and Phase 2 GTC’s will reduce the consumption of seawater by 700,000 m3/d.
• A lower liquid to air ratio will be required to maintain a SO2 removal efficiency of 95% than initially planned in the design (3.2 l/Nm3 versus design value of 3.5 l/Nm3) reduces the amount of seawater consumed by approximately 50,000 m3/d.
• Cooling tower requirements in permeate water as makeup water for air compressors will be reduced by 1,500 m3/d to 500 m3/d.
EMAL Project Environmental Update Emirates Aluminium
November 2011 - Final 42 503406
3.6.3.2 Final Effluent
The final liquid effluent from EMAL site is mostly composed of the effluent from the SO2 wet scrubbers and the blowdown from the seawater cooling towers. While the June 2007 EIA provided only an estimation of the quality of this effluent prior to its discharge to ADPC marine outfall, Phase 1 monitoring data is now available (Table 3.17) and provides a sound basis for the prediction of the impacts associated with Phase 2. Though the seawater SO2 scrubbers were in operation 40% of the time between January and June 2011, the ‘time on’ was increased to 50% in July and 75% in August and September 2011, during the three hottest months of the year. Apart from pH levels that were reduced by approximately 0.5 units (from 8.1 to 7.6 in average), there are no clear trends observed on other parameters for the liquid effluent.
As per the monitoring data collected so far, the final effluent quality is in compliance with the EAD limits for all parameters and generally complies with the IFC criteria. Results obtained for the following parameters are discussed below: Free Residual Chlorine (FRC), Chemical Oxygen Demand (COD), temperature, Total Dissolved Solids (TDS) and salinity:
• Free Residual Chlorine (FRC): The FRC daily average (0.09 mg/l) in the final effluent is complying with both the EAD limit (1 mg/l) and the IFC guideline (0.2 mg/l). However, 12% of the measurements have exceeded the IFC guideline (without exceeding the EAD limit). These higher levels were probably due to chlorine shock treatments to prevent marine biofouling. The operating data and shock treatment procedure will be reviewed to ensure that free chlorine at effluent remains within IFC limits. It is expected that FRC levels at the final effluent will reduce when the seawater scrubbers will be in full operation. Between 20 July and 2 October 2011 when 75% of the seawater scrubbers were in operation, the highest chlorine level was 0.14 mg/l.
• Chemical Oxygen Demand (COD): The COD weekly average (44 mg/l) is complying with both the EAD limit (100 mg/l) and the IFC guideline (50 mg/l). Although the COD levels have slightly exceeded the IFC guideline on two occasions (maximum: 58 mg/l) over 41 values, the guideline has been achieved for 95% of the measurements. As per the IFC Guidelines for Thermal Power Plants (2008), the effluent guidelines should be achieved, without dilution, at least 95% of the time that the plant or unit is operating, to be calculated as a proportion of annual operating hours.
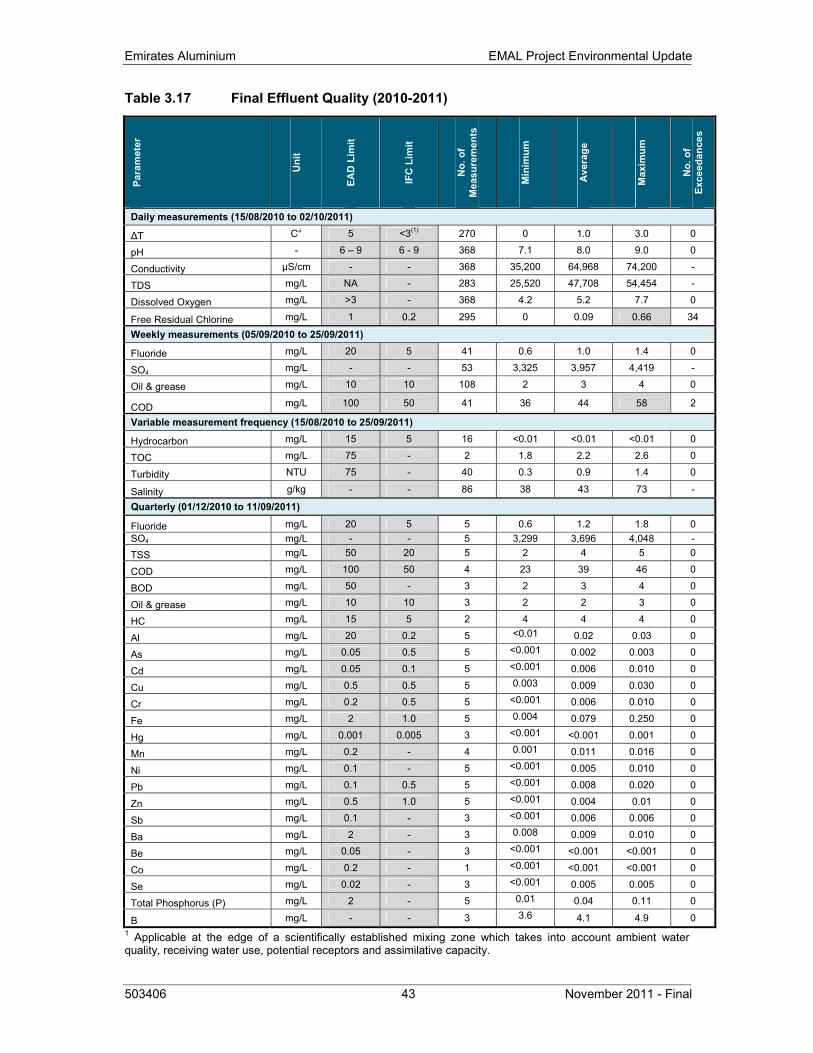
Emirates Aluminium EMAL Project Environmental Update
503406 43 November 2011 - Final
Table 3.17 Final Effluent Quality (2010-2011)
Para
met
er
Uni
t
EAD
Lim
it
IFC
Lim
it
No.
of
Mea
sure
men
ts
Min
imum
Ave
rage
Max
imum
No.
of
Exce
edan
ces
Daily measurements (15/08/2010 to 02/10/2011)
ΔT C° 5 <3(1) 270 0 1.0 3.0 0
pH - 6 – 9 6 - 9 368 7.1 8.0 9.0 0
Conductivity µS/cm - - 368 35,200 64,968 74,200 -
TDS mg/L NA - 283 25,520 47,708 54,454 -
Dissolved Oxygen mg/L >3 - 368 4.2 5.2 7.7 0
Free Residual Chlorine mg/L 1 0.2 295 0 0.09 0.66 34
Weekly measurements (05/09/2010 to 25/09/2011)
Fluoride mg/L 20 5 41 0.6 1.0 1.4 0
SO4 mg/L - - 53 3,325 3,957 4,419 -
Oil & grease mg/L 10 10 108 2 3 4 0
COD mg/L 100 50 41 36 44 58 2
Variable measurement frequency (15/08/2010 to 25/09/2011)
Hydrocarbon mg/L 15 5 16 <0.01 <0.01 <0.01 0
TOC mg/L 75 - 2 1.8 2.2 2.6 0
Turbidity NTU 75 - 40 0.3 0.9 1.4 0
Salinity g/kg - - 86 38 43 73 -
Quarterly (01/12/2010 to 11/09/2011)
Fluoride mg/L 20 5 5 0.6 1.2 1.8 0 SO4 mg/L - - 5 3,299 3,696 4,048 - TSS mg/L 50 20 5 2 4 5 0
COD mg/L 100 50 4 23 39 46 0
BOD mg/L 50 - 3 2 3 4 0
Oil & grease mg/L 10 10 3 2 2 3 0
HC mg/L 15 5 2 4 4 4 0
Al mg/L 20 0.2 5 <0.01 0.02 0.03 0
As mg/L 0.05 0.5 5 <0.001 0.002 0.003 0
Cd mg/L 0.05 0.1 5 <0.001 0.006 0.010 0
Cu mg/L 0.5 0.5 5 0.003 0.009 0.030 0
Cr mg/L 0.2 0.5 5 <0.001 0.006 0.010 0
Fe mg/L 2 1.0 5 0.004 0.079 0.250 0
Hg mg/L 0.001 0.005 3 <0.001 <0.001 0.001 0
Mn mg/L 0.2 - 4 0.001 0.011 0.016 0
Ni mg/L 0.1 - 5 <0.001 0.005 0.010 0
Pb mg/L 0.1 0.5 5 <0.001 0.008 0.020 0
Zn mg/L 0.5 1.0 5 <0.001 0.004 0.01 0
Sb mg/L 0.1 - 3 <0.001 0.006 0.006 0
Ba mg/L 2 - 3 0.008 0.009 0.010 0
Be mg/L 0.05 - 3 <0.001 <0.001 <0.001 0
Co mg/L 0.2 - 1 <0.001 <0.001 <0.001 0
Se mg/L 0.02 - 3 <0.001 0.005 0.005 0
Total Phosphorus (P) mg/L 2 - 5 0.01 0.04 0.11 0
B mg/L - - 3 3.6 4.1 4.9 0 1 Applicable at the edge of a scientifically established mixing zone which takes into account ambient water quality, receiving water use, potential receptors and assimilative capacity.
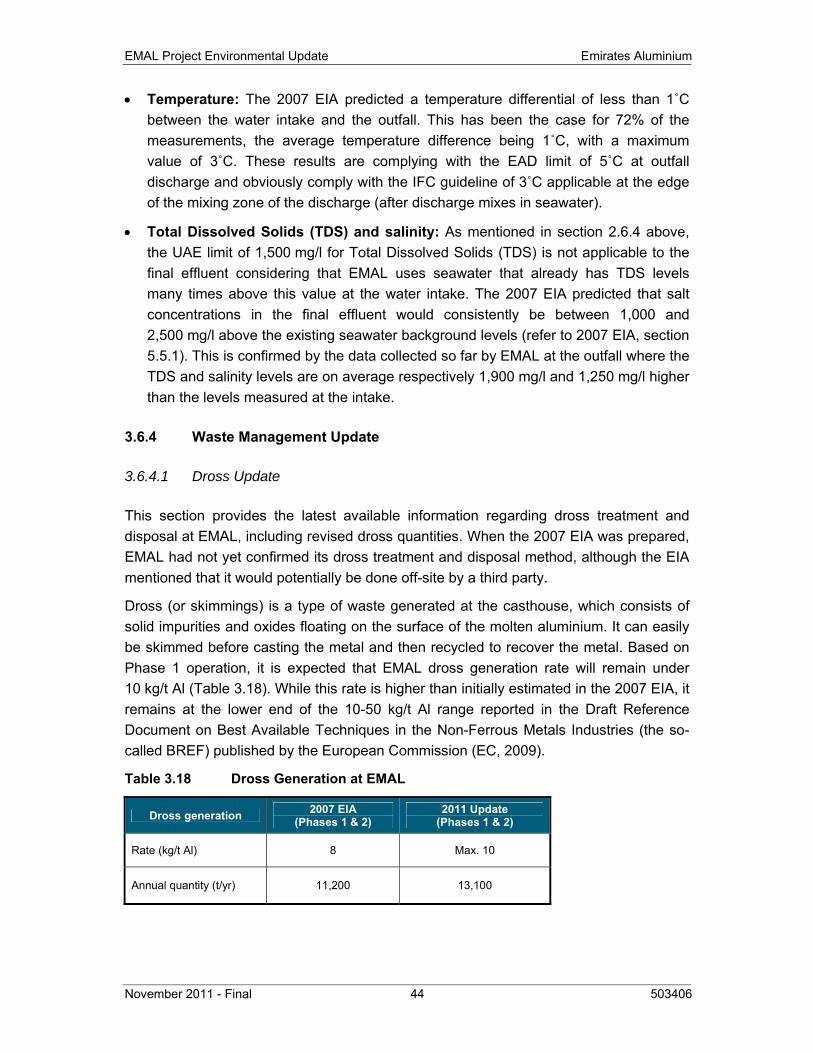
EMAL Project Environmental Update Emirates Aluminium
November 2011 - Final 44 503406
• Temperature: The 2007 EIA predicted a temperature differential of less than 1˚C between the water intake and the outfall. This has been the case for 72% of the measurements, the average temperature difference being 1˚C, with a maximum value of 3˚C. These results are complying with the EAD limit of 5˚C at outfall discharge and obviously comply with the IFC guideline of 3˚C applicable at the edge of the mixing zone of the discharge (after discharge mixes in seawater).
• Total Dissolved Solids (TDS) and salinity: As mentioned in section 2.6.4 above, the UAE limit of 1,500 mg/l for Total Dissolved Solids (TDS) is not applicable to the final effluent considering that EMAL uses seawater that already has TDS levels many times above this value at the water intake. The 2007 EIA predicted that salt concentrations in the final effluent would consistently be between 1,000 and 2,500 mg/l above the existing seawater background levels (refer to 2007 EIA, section 5.5.1). This is confirmed by the data collected so far by EMAL at the outfall where the TDS and salinity levels are on average respectively 1,900 mg/l and 1,250 mg/l higher than the levels measured at the intake.
3.6.4 Waste Management Update
3.6.4.1 Dross Update
This section provides the latest available information regarding dross treatment and disposal at EMAL, including revised dross quantities. When the 2007 EIA was prepared, EMAL had not yet confirmed its dross treatment and disposal method, although the EIA mentioned that it would potentially be done off-site by a third party.
Dross (or skimmings) is a type of waste generated at the casthouse, which consists of solid impurities and oxides floating on the surface of the molten aluminium. It can easily be skimmed before casting the metal and then recycled to recover the metal. Based on Phase 1 operation, it is expected that EMAL dross generation rate will remain under 10 kg/t Al (Table 3.18). While this rate is higher than initially estimated in the 2007 EIA, it remains at the lower end of the 10-50 kg/t Al range reported in the Draft Reference Document on Best Available Techniques in the Non-Ferrous Metals Industries (the so-called BREF) published by the European Commission (EC, 2009).
Table 3.18 Dross Generation at EMAL
Dross generation 2007 EIA (Phases 1 & 2)
2011 Update (Phases 1 & 2)
Rate (kg/t Al) 8 Max. 10
Annual quantity (t/yr) 11,200 13,100
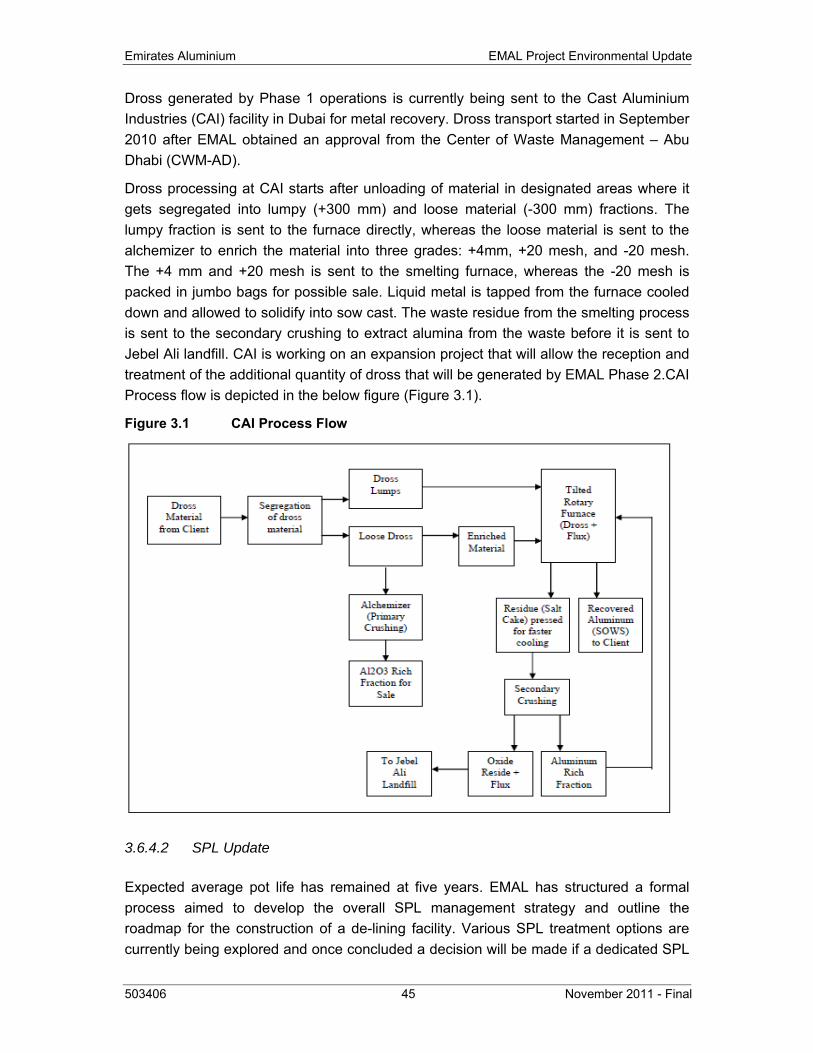
Emirates Aluminium EMAL Project Environmental Update
503406 45 November 2011 - Final
Dross generated by Phase 1 operations is currently being sent to the Cast Aluminium Industries (CAI) facility in Dubai for metal recovery. Dross transport started in September 2010 after EMAL obtained an approval from the Center of Waste Management – Abu Dhabi (CWM-AD).
Dross processing at CAI starts after unloading of material in designated areas where it gets segregated into lumpy (+300 mm) and loose material (-300 mm) fractions. The lumpy fraction is sent to the furnace directly, whereas the loose material is sent to the alchemizer to enrich the material into three grades: +4mm, +20 mesh, and -20 mesh. The +4 mm and +20 mesh is sent to the smelting furnace, whereas the -20 mesh is packed in jumbo bags for possible sale. Liquid metal is tapped from the furnace cooled down and allowed to solidify into sow cast. The waste residue from the smelting process is sent to the secondary crushing to extract alumina from the waste before it is sent to Jebel Ali landfill. CAI is working on an expansion project that will allow the reception and treatment of the additional quantity of dross that will be generated by EMAL Phase 2.CAI Process flow is depicted in the below figure (Figure 3.1).
Figure 3.1 CAI Process Flow
3.6.4.2 SPL Update
Expected average pot life has remained at five years. EMAL has structured a formal process aimed to develop the overall SPL management strategy and outline the roadmap for the construction of a de-lining facility. Various SPL treatment options are currently being explored and once concluded a decision will be made if a dedicated SPL
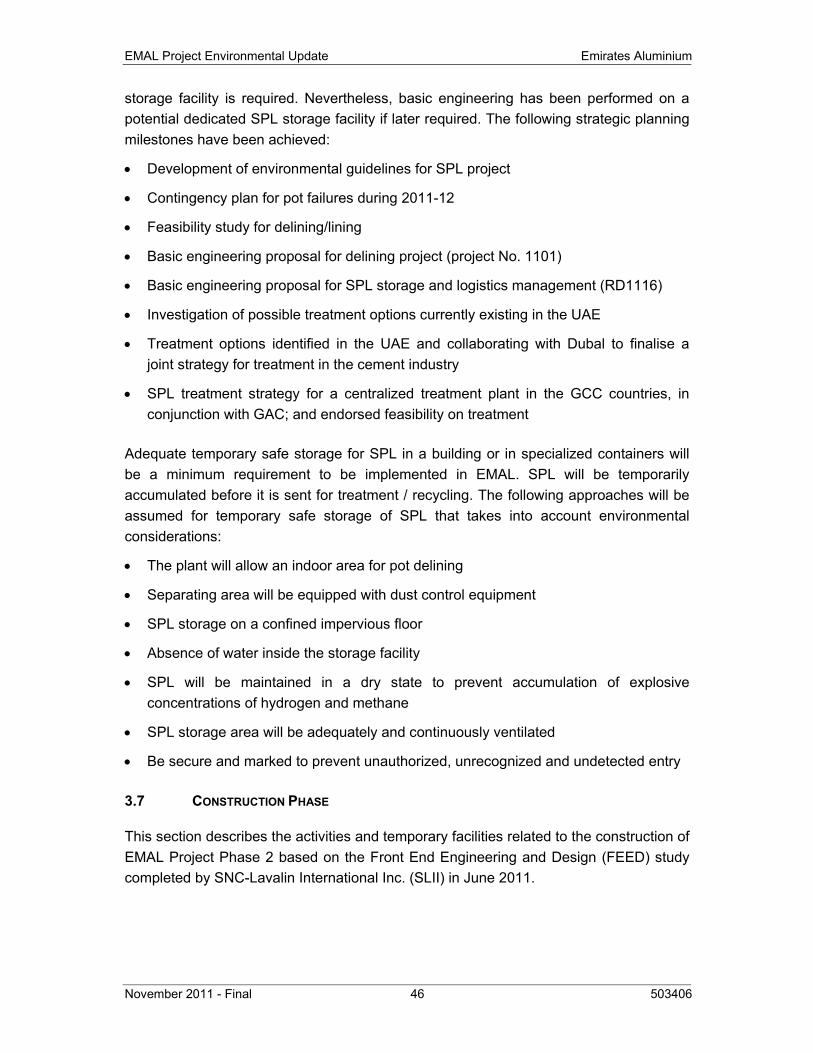
EMAL Project Environmental Update Emirates Aluminium
November 2011 - Final 46 503406
storage facility is required. Nevertheless, basic engineering has been performed on a potential dedicated SPL storage facility if later required. The following strategic planning milestones have been achieved:
• Development of environmental guidelines for SPL project
• Contingency plan for pot failures during 2011-12
• Feasibility study for delining/lining
• Basic engineering proposal for delining project (project No. 1101)
• Basic engineering proposal for SPL storage and logistics management (RD1116)
• Investigation of possible treatment options currently existing in the UAE
• Treatment options identified in the UAE and collaborating with Dubal to finalise a joint strategy for treatment in the cement industry
• SPL treatment strategy for a centralized treatment plant in the GCC countries, in conjunction with GAC; and endorsed feasibility on treatment
Adequate temporary safe storage for SPL in a building or in specialized containers will be a minimum requirement to be implemented in EMAL. SPL will be temporarily accumulated before it is sent for treatment / recycling. The following approaches will be assumed for temporary safe storage of SPL that takes into account environmental considerations:
• The plant will allow an indoor area for pot delining
• Separating area will be equipped with dust control equipment
• SPL storage on a confined impervious floor
• Absence of water inside the storage facility
• SPL will be maintained in a dry state to prevent accumulation of explosive concentrations of hydrogen and methane
• SPL storage area will be adequately and continuously ventilated
• Be secure and marked to prevent unauthorized, unrecognized and undetected entry
3.7 CONSTRUCTION PHASE
This section describes the activities and temporary facilities related to the construction of EMAL Project Phase 2 based on the Front End Engineering and Design (FEED) study completed by SNC-Lavalin International Inc. (SLII) in June 2011.
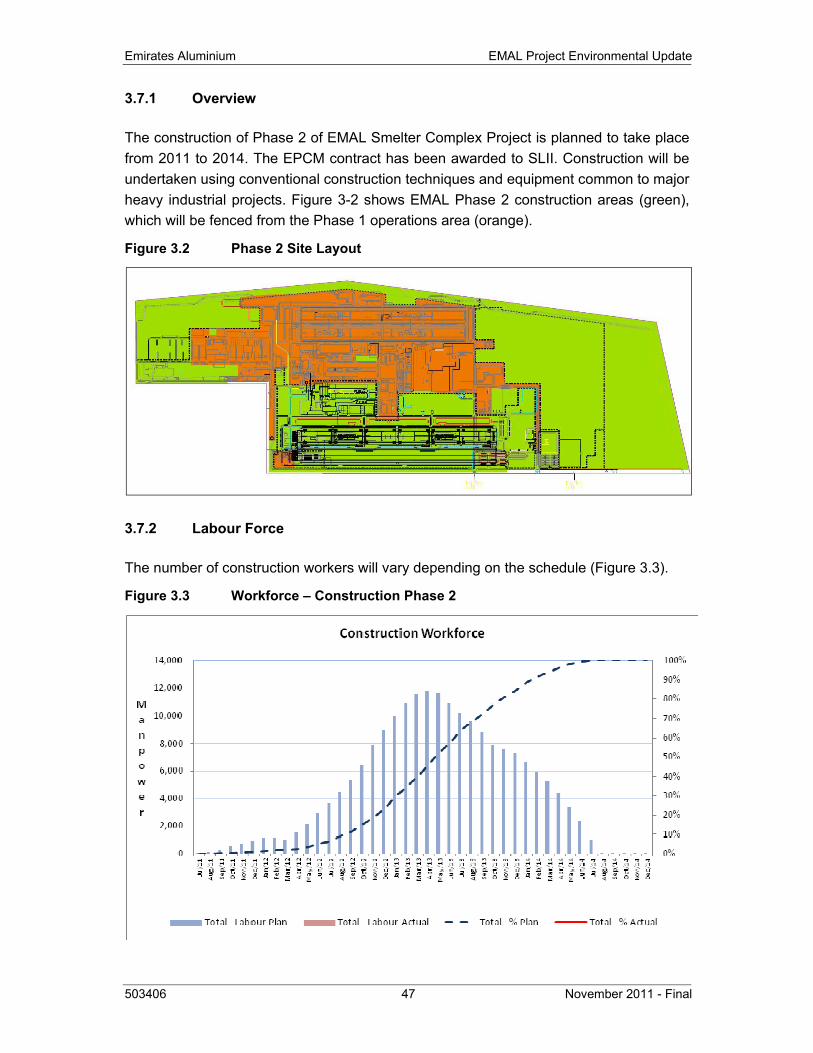
Emirates Aluminium EMAL Project Environmental Update
503406 47 November 2011 - Final
3.7.1 Overview
The construction of Phase 2 of EMAL Smelter Complex Project is planned to take place from 2011 to 2014. The EPCM contract has been awarded to SLII. Construction will be undertaken using conventional construction techniques and equipment common to major heavy industrial projects. Figure 3-2 shows EMAL Phase 2 construction areas (green), which will be fenced from the Phase 1 operations area (orange).
Figure 3.2 Phase 2 Site Layout
3.7.2 Labour Force
The number of construction workers will vary depending on the schedule (Figure 3.3).
Figure 3.3 Workforce – Construction Phase 2
EMAL Project Environmental Update Emirates Aluminium
November 2011 - Final 48 503406
It is estimated that there will be an average of 5,000 workers and a peak workforce of 12,000. It is expected that the breakdown of the total workforce will be approximately: 30% unskilled and semi-skilled, 60% trade people and 10% supervision and management professionals. The contractors mobilized on EMAL Project will provide accommodation to their workers in existing camps located in Taweelah, Jebel Ali, Mussafah or elsewhere and the workers will commute by bus to the construction site. There will not be any construction workers accommodated on site.
3.7.3 Construction Activities
3.7.3.1 Site Preparation
Some of the permanent bulk earthworks required for Phase 2 were completed in 2008-2009 following the completion of Phase 1 site preparation activities. The required backfill material was sourced from a municipal borrow pit located in Sweihan (approximately 70% of the material) and another borrow pit located in Area B (east) of Khalifa Industrial Zone Abu Dhabi (KIZAD) (approximately 30% of the material) by 35 to 40 m3 trucks on local roads. It is to be noted that EMAL informed the EAD of these activities in October 2008 (refer to letter EMAL/1000/L0012/SA/aw dated 15 October 2008).
The remaining scope, comprising permanent fill and cut-to-fill works along with temporary earthworks for building construction roads and creating laydown areas, will be done as early as possible since this activity is part of the project’s critical path. The primary source of supply of off-site general backfill material will be identified and selected by the site preparation contractor.
The site levels for both Phases are based on an internal study that has been conducted to define the safe operation floor elevation, in terms of storm surge, wave action and sea level rise. The recommended site formation level is +2.40 m NADD (New Abu Dhabi Datum) and the study has concluded that a safe floor level for buildings should be set at a minimum of +2.70 m NADD, which allows a 300 mm freeboard in case of overtopping from events greater than the 1 in 100 year return period.
3.7.3.2 Fencing
The complete permanent fencing of EMAL site has been completed as part of Phase 1. Additional fencing will be used extensively during the construction of Phase 2 in order to segregate the construction and operation areas. Approximately 19 km of fencing will be used for this purpose.
3.7.3.3 Roads
The permanent site access roads up to the plant fence have been completed as part of Phase 1, however, these roads are currently being relocated as part of ADPC and
Emirates Aluminium EMAL Project Environmental Update
503406 49 November 2011 - Final
KIZAD development plan. As for the internal roads, a perimeter access road and a network of temporary unpaved roads have been built to be used during the construction phases. The permanent road network required for Phase 1 has also been completed and consists of hot metal and service roads that will be extended to meet the Phase 2 requirements.
3.7.3.4 Foundations
As confirmed by the geotechnical investigation, Phase 2 foundations will be generally identical to those of Phase 1 (i.e. concrete piles and stone columns). Exception will be taken in cases where new buildings will be in close proximity to existing Phase 1 structures and when stone columns placement could impact Phase 1 operations.
3.7.3.5 Concrete Works
The major concrete works include the foundations and the slabs on grade for the main sectors of the smelter (reduction, carbon plant and casthouse) and power plant. Many structural slabs will also be pre-cast on site (e.g. floor slabs, busbar supports, anode baking furnace walls, etc.). Concrete reinforcing steel bars will be generally supplied to the site pre-cut and bent with some pre-assembly of the steel reinforcing cages done off site.
3.7.3.6 Steel and Sheeting
As soon as concrete operations will have progressed sufficiently to provide a safe work area, structural steel erection will begin, using standard techniques. This will involve the delivery of pre-fabricated structural steel to the site and their erection with cranes. Sheeting will be delivered to the site and erected using cranes and special mobile gantries that travel along the structure. The GTCs and alumina silos in the potroom courtyards will be installed when the foundations have been constructed.
3.7.3.7 Mechanical and Electrical Works
The mechanical erection and installation of the numerous items of mechanical equipment will start in sections of the buildings, as their construction is complete. Likewise, electrical lighting and cabling will commence after closure of the building or after completion of steel erection in the case of open structures. Mechanical erection also includes the installation of the ventilation ducting, dust collection systems, conveyors, mechanical machinery and internal electrical system. Extensive use will be made of construction cranes to install mechanical equipment.
A major activity will be the installation and welding of the busbar system, which will occur in the basement of the potrooms. The busbar system will be pre-fabricated off-site and delivered as sub-assemblies to ensure accuracy in assembly and minimize on-site work.
EMAL Project Environmental Update Emirates Aluminium
November 2011 - Final 50 503406
3.7.3.8 Equipment Installation
Most of the equipment will be delivered to the site in large pre-assembled sections to reduce site installation time. Bulky and heavy equipment may require delivery by barge.
The gas turbines, steam turbines, and HRSGs are composed of large modules that will need to be installed on their foundations before building erection is completed. This major construction phase will take place during the final year of construction.
3.7.4 Temporary Facilities
3.7.4.1 Construction Cabins
A number of facilities put in place during the construction of Phase 1 will be used for Phase 2. This includes the site cafeteria and mosque, first aid medical services, security cabins and gates and construction warehouse. However, all existing construction cabins are to be relocated. The installation of additional construction cabins will also be required on Phase 2, all project engineering will be performed on site and this will result in a net increase of personnel for the EPCM contractor when compared to Phase 1.
3.7.4.2 Laydown Areas
Contractors mobilizing on site for Phase 2 will be allocated dedicated laydown areas where they will install their temporary offices, storage areas, work areas and maintenance workshops.
3.7.4.3 Construction Batch Plant & Precast Yard
Concrete will be supplied by two site-specific concrete batch plants already installed at the eastern end of the site during Phase 1. The batch plants will remain available on site until the end of Phase 2 works, with two central mixers in operation, and will be dismantled at the end of the construction phase. The existing precast yard installed adjacent to the batch plant during Phase 1 will remain available at its current location until the end of Phase 2 works. However, the original size of the precast yard size will be reduced. Fugitive emissions from the batch plants are described in Section 0.
3.7.5 Temporary Services
3.7.5.1 Power Supply
A study has shown that power produced by generators is more expensive than power purchased from Abu Dhabi Distribution Company (ADDC). Consequently, the 11 kV construction power infrastructures will be reviewed and rearranged to provide power to
Emirates Aluminium EMAL Project Environmental Update
503406 51 November 2011 - Final
as many contractors as possible for their laydown area offices. Construction power will be supplied through generators.
3.7.5.2 Water Supply for Construction Activities
Water will be required for various construction activities (e.g. dust abatement, ground compaction, piling, etc.). During construction of Phase 1, these water needs were met by pumping seawater at two temporary stations located on Abu Dhabi Port Company (ADPC) land (approximately 500 m from EMAL site) and by pumping brackish groundwater from four shallow water lagoons dug on site. Although the 2007 EIA did not mention that groundwater and seawater would be used for construction purposes, the EAD was informed about the situation in 2008 (refer to letter EMAL/1000/L001/SA/vh dated 28 July 2008)
Similarly, seawater and groundwater will also be used for Phase 2 construction activities and the water lagoons that are located within the Phase 2 footprint will cease to be utilised. In addition, the treated sewage effluent from EMAL Sewage Treatment Plant (STP) that is not used for irrigation purpose may be used for construction activities.
3.7.5.3 Potable Water Supply
Although most of the potable water will be used on site for human consumption, some construction activities such as concrete fabrication and concrete curing will require potable water.
During the construction of Phase 1, the EPCM contractor collected data regarding potable water consumption on site. This data is presented below on a daily basis and compared to manpower on site (Figure 3.4). With an average close to 400 m3/day, potable water consumption reached a maximum of approximately 1,400 m3/day. Based on these figures, it is estimated that the construction of Phase 2 will necessitate approximately 300 m3/day on average and could reach a maximum of 1,000 m3/day.
The existing tie-in to ADDC distribution network will be used to provide most of the potable water required during construction of Phase 2. Various tapping points on the existing water line installed on site and used during Phase 1 to supply water to the power plant will allow both smelter and power plant contractors to fill their tankers to provide water in their own areas.
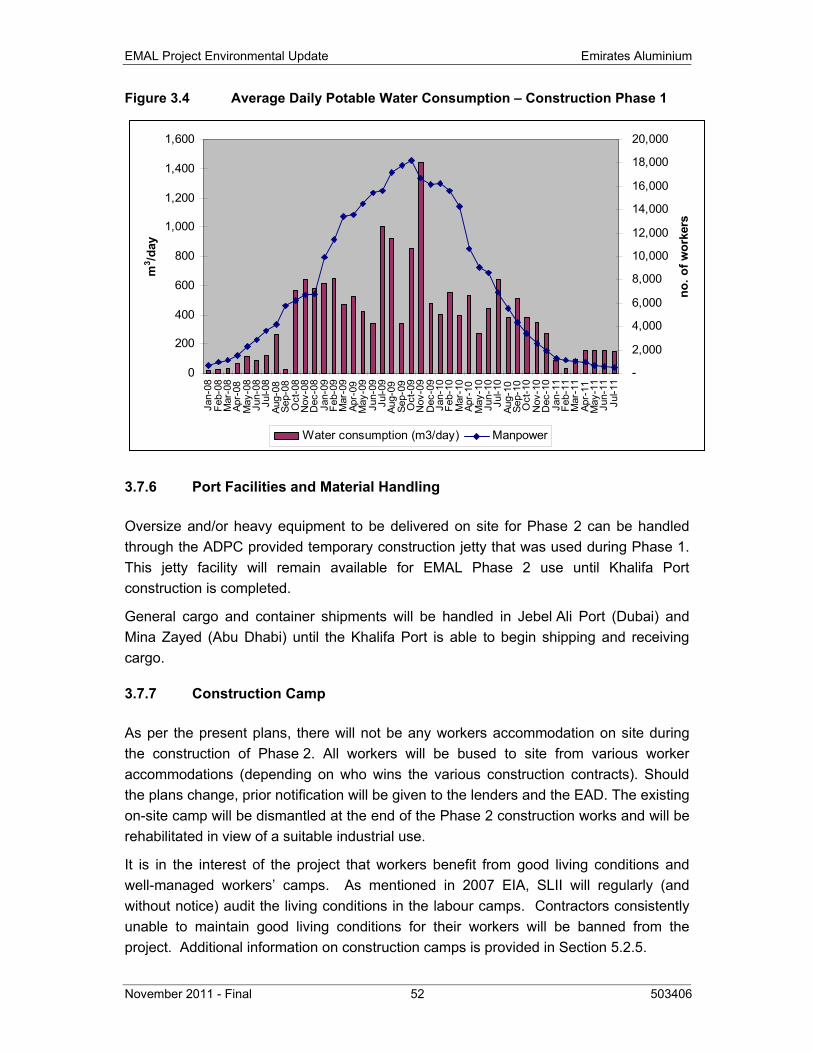
EMAL Project Environmental Update Emirates Aluminium
November 2011 - Final 52 503406
Figure 3.4 Average Daily Potable Water Consumption – Construction Phase 1
3.7.6 Port Facilities and Material Handling
Oversize and/or heavy equipment to be delivered on site for Phase 2 can be handled through the ADPC provided temporary construction jetty that was used during Phase 1. This jetty facility will remain available for EMAL Phase 2 use until Khalifa Port construction is completed.
General cargo and container shipments will be handled in Jebel Ali Port (Dubai) and Mina Zayed (Abu Dhabi) until the Khalifa Port is able to begin shipping and receiving cargo.
3.7.7 Construction Camp
As per the present plans, there will not be any workers accommodation on site during the construction of Phase 2. All workers will be bused to site from various worker accommodations (depending on who wins the various construction contracts). Should the plans change, prior notification will be given to the lenders and the EAD. The existing on-site camp will be dismantled at the end of the Phase 2 construction works and will be rehabilitated in view of a suitable industrial use.
It is in the interest of the project that workers benefit from good living conditions and well-managed workers’ camps. As mentioned in 2007 EIA, SLII will regularly (and without notice) audit the living conditions in the labour camps. Contractors consistently unable to maintain good living conditions for their workers will be banned from the project. Additional information on construction camps is provided in Section 5.2.5.
0
200
400
600
800
1,000
1,200
1,400
1,600
Jan-
08Fe
b-08
Mar
-08
Apr-
08M
ay-0
8Ju
n-08
Jul-0
8Au
g-08
Sep-
08O
ct-0
8N
ov-0
8D
ec-0
8Ja
n-09
Feb-
09M
ar-0
9Ap
r-09
May
-09
Jun-
09Ju
l-09
Aug-
09Se
p-09
Oct
-09
Nov
-09
Dec
-09
Jan-
10Fe
b-10
Mar
-10
Apr-
10M
ay-1
0Ju
n-10
Jul-1
0Au
g-10
Sep-
10O
ct-1
0N
ov-1
0D
ec-1
0Ja
n-11
Feb-
11M
ar-1
1Ap
r-11
May
-11
Jun-
11Ju
l-11
m3 /d
ay
-
2,000
4,000
6,000
8,000
10,000
12,000
14,000
16,000
18,000
20,000
no. o
f wor
kers
Water consumption (m3/day) Manpower
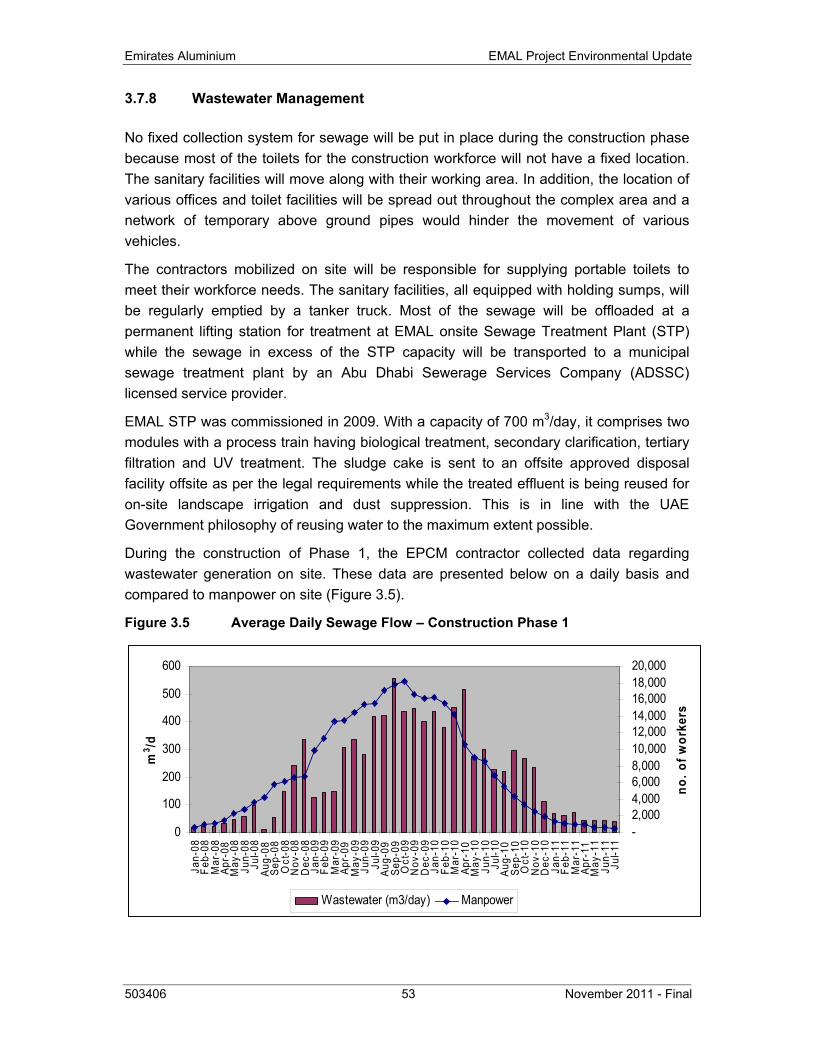
Emirates Aluminium EMAL Project Environmental Update
503406 53 November 2011 - Final
3.7.8 Wastewater Management
No fixed collection system for sewage will be put in place during the construction phase because most of the toilets for the construction workforce will not have a fixed location. The sanitary facilities will move along with their working area. In addition, the location of various offices and toilet facilities will be spread out throughout the complex area and a network of temporary above ground pipes would hinder the movement of various vehicles.
The contractors mobilized on site will be responsible for supplying portable toilets to meet their workforce needs. The sanitary facilities, all equipped with holding sumps, will be regularly emptied by a tanker truck. Most of the sewage will be offloaded at a permanent lifting station for treatment at EMAL onsite Sewage Treatment Plant (STP) while the sewage in excess of the STP capacity will be transported to a municipal sewage treatment plant by an Abu Dhabi Sewerage Services Company (ADSSC) licensed service provider.
EMAL STP was commissioned in 2009. With a capacity of 700 m3/day, it comprises two modules with a process train having biological treatment, secondary clarification, tertiary filtration and UV treatment. The sludge cake is sent to an offsite approved disposal facility offsite as per the legal requirements while the treated effluent is being reused for on-site landscape irrigation and dust suppression. This is in line with the UAE Government philosophy of reusing water to the maximum extent possible.
During the construction of Phase 1, the EPCM contractor collected data regarding wastewater generation on site. These data are presented below on a daily basis and compared to manpower on site (Figure 3.5).
Figure 3.5 Average Daily Sewage Flow – Construction Phase 1
0
100
200
300
400
500
600
Jan-
08Fe
b-08
Mar
-08
Apr-
08M
ay-0
8Ju
n-08
Jul-0
8Au
g-08
Sep-
08O
ct-0
8N
ov-0
8D
ec-0
8Ja
n-09
Feb-
09M
ar-0
9Ap
r-09
May
-09
Jun-
09Ju
l-09
Aug-
09Se
p-09
Oct
-09
Nov
-09
Dec
-09
Jan-
10Fe
b-10
Mar
-10
Apr-
10M
ay-1
0Ju
n-10
Jul-1
0Au
g-10
Sep-
10O
ct-1
0N
ov-1
0D
ec-1
0Ja
n-11
Feb-
11M
ar-1
1Ap
r-11
May
-11
Jun-
11Ju
l-11
m3 /d
-2,0004,0006,0008,00010,00012,00014,00016,00018,00020,000
no. o
f wor
kers
Wastewater (m3/day) Manpower
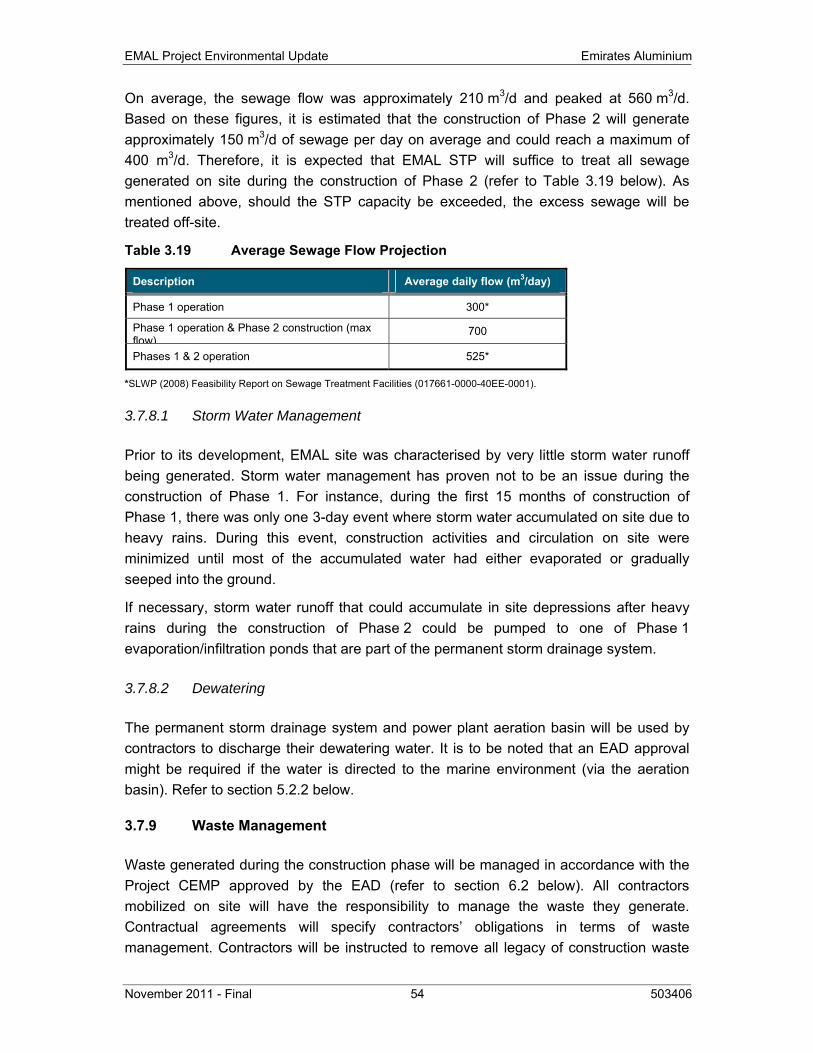
EMAL Project Environmental Update Emirates Aluminium
November 2011 - Final 54 503406
On average, the sewage flow was approximately 210 m3/d and peaked at 560 m3/d. Based on these figures, it is estimated that the construction of Phase 2 will generate approximately 150 m3/d of sewage per day on average and could reach a maximum of 400 m3/d. Therefore, it is expected that EMAL STP will suffice to treat all sewage generated on site during the construction of Phase 2 (refer to Table 3.19 below). As mentioned above, should the STP capacity be exceeded, the excess sewage will be treated off-site.
Table 3.19 Average Sewage Flow Projection
Description Average daily flow (m3/day)
Phase 1 operation 300*
Phase 1 operation & Phase 2 construction (max flow)
700
Phases 1 & 2 operation 525*
*SLWP (2008) Feasibility Report on Sewage Treatment Facilities (017661-0000-40EE-0001).
3.7.8.1 Storm Water Management
Prior to its development, EMAL site was characterised by very little storm water runoff being generated. Storm water management has proven not to be an issue during the construction of Phase 1. For instance, during the first 15 months of construction of Phase 1, there was only one 3-day event where storm water accumulated on site due to heavy rains. During this event, construction activities and circulation on site were minimized until most of the accumulated water had either evaporated or gradually seeped into the ground.
If necessary, storm water runoff that could accumulate in site depressions after heavy rains during the construction of Phase 2 could be pumped to one of Phase 1 evaporation/infiltration ponds that are part of the permanent storm drainage system.
3.7.8.2 Dewatering
The permanent storm drainage system and power plant aeration basin will be used by contractors to discharge their dewatering water. It is to be noted that an EAD approval might be required if the water is directed to the marine environment (via the aeration basin). Refer to section 5.2.2 below.
3.7.9 Waste Management
Waste generated during the construction phase will be managed in accordance with the Project CEMP approved by the EAD (refer to section 6.2 below). All contractors mobilized on site will have the responsibility to manage the waste they generate. Contractual agreements will specify contractors’ obligations in terms of waste management. Contractors will be instructed to remove all legacy of construction waste
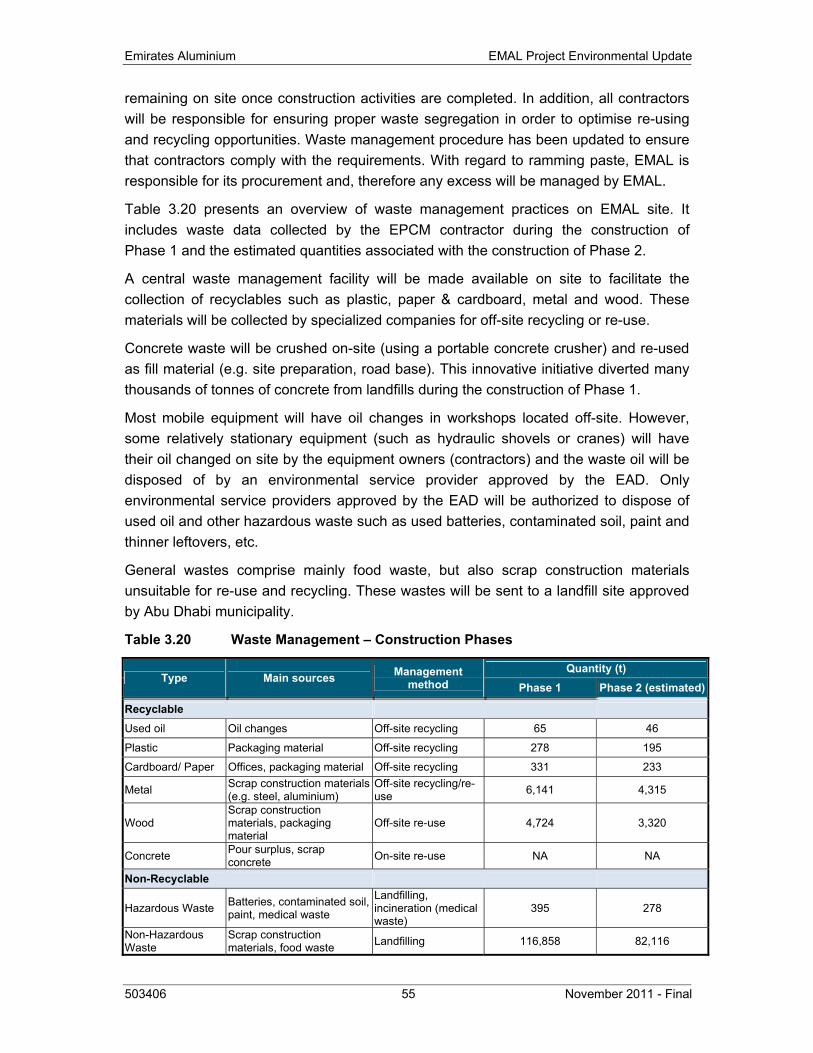
Emirates Aluminium EMAL Project Environmental Update
503406 55 November 2011 - Final
remaining on site once construction activities are completed. In addition, all contractors will be responsible for ensuring proper waste segregation in order to optimise re-using and recycling opportunities. Waste management procedure has been updated to ensure that contractors comply with the requirements. With regard to ramming paste, EMAL is responsible for its procurement and, therefore any excess will be managed by EMAL.
Table 3.20 presents an overview of waste management practices on EMAL site. It includes waste data collected by the EPCM contractor during the construction of Phase 1 and the estimated quantities associated with the construction of Phase 2.
A central waste management facility will be made available on site to facilitate the collection of recyclables such as plastic, paper & cardboard, metal and wood. These materials will be collected by specialized companies for off-site recycling or re-use.
Concrete waste will be crushed on-site (using a portable concrete crusher) and re-used as fill material (e.g. site preparation, road base). This innovative initiative diverted many thousands of tonnes of concrete from landfills during the construction of Phase 1.
Most mobile equipment will have oil changes in workshops located off-site. However, some relatively stationary equipment (such as hydraulic shovels or cranes) will have their oil changed on site by the equipment owners (contractors) and the waste oil will be disposed of by an environmental service provider approved by the EAD. Only environmental service providers approved by the EAD will be authorized to dispose of used oil and other hazardous waste such as used batteries, contaminated soil, paint and thinner leftovers, etc.
General wastes comprise mainly food waste, but also scrap construction materials unsuitable for re-use and recycling. These wastes will be sent to a landfill site approved by Abu Dhabi municipality.
Table 3.20 Waste Management – Construction Phases
Type Main sources Management method
Quantity (t) Phase 1 Phase 2 (estimated)
Recyclable
Used oil Oil changes Off-site recycling 65 46
Plastic Packaging material Off-site recycling 278 195
Cardboard/ Paper Offices, packaging material Off-site recycling 331 233
Metal Scrap construction materials (e.g. steel, aluminium)
Off-site recycling/re-use 6,141 4,315
Wood Scrap construction materials, packaging material
Off-site re-use 4,724 3,320
Concrete Pour surplus, scrap concrete On-site re-use NA NA
Non-Recyclable
Hazardous Waste Batteries, contaminated soil, paint, medical waste
Landfilling, incineration (medical waste)
395 278
Non-Hazardous Waste
Scrap construction materials, food waste Landfilling 116,858 82,116
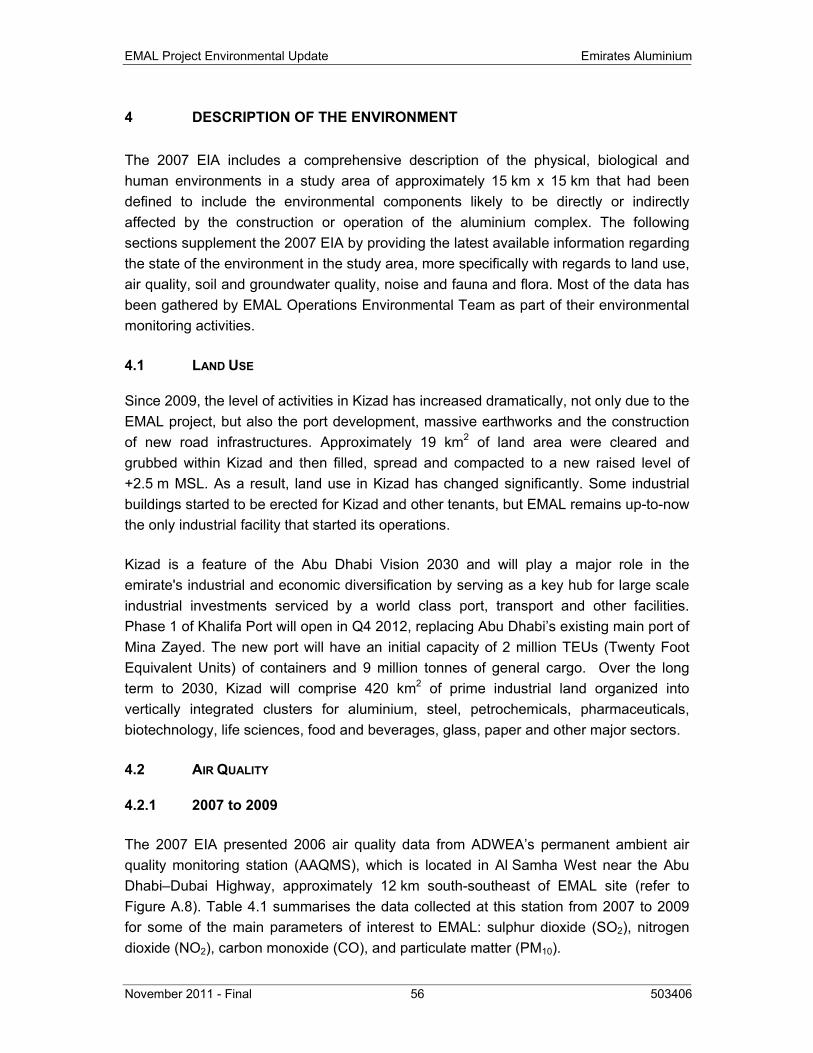
EMAL Project Environmental Update Emirates Aluminium
November 2011 - Final 56 503406
4 DESCRIPTION OF THE ENVIRONMENT
The 2007 EIA includes a comprehensive description of the physical, biological and human environments in a study area of approximately 15 km x 15 km that had been defined to include the environmental components likely to be directly or indirectly affected by the construction or operation of the aluminium complex. The following sections supplement the 2007 EIA by providing the latest available information regarding the state of the environment in the study area, more specifically with regards to land use, air quality, soil and groundwater quality, noise and fauna and flora. Most of the data has been gathered by EMAL Operations Environmental Team as part of their environmental monitoring activities.
4.1 LAND USE
Since 2009, the level of activities in Kizad has increased dramatically, not only due to the EMAL project, but also the port development, massive earthworks and the construction of new road infrastructures. Approximately 19 km2 of land area were cleared and grubbed within Kizad and then filled, spread and compacted to a new raised level of +2.5 m MSL. As a result, land use in Kizad has changed significantly. Some industrial buildings started to be erected for Kizad and other tenants, but EMAL remains up-to-now the only industrial facility that started its operations.
Kizad is a feature of the Abu Dhabi Vision 2030 and will play a major role in the emirate's industrial and economic diversification by serving as a key hub for large scale industrial investments serviced by a world class port, transport and other facilities. Phase 1 of Khalifa Port will open in Q4 2012, replacing Abu Dhabi’s existing main port of Mina Zayed. The new port will have an initial capacity of 2 million TEUs (Twenty Foot Equivalent Units) of containers and 9 million tonnes of general cargo. Over the long term to 2030, Kizad will comprise 420 km2 of prime industrial land organized into vertically integrated clusters for aluminium, steel, petrochemicals, pharmaceuticals, biotechnology, life sciences, food and beverages, glass, paper and other major sectors.
4.2 AIR QUALITY
4.2.1 2007 to 2009
The 2007 EIA presented 2006 air quality data from ADWEA’s permanent ambient air quality monitoring station (AAQMS), which is located in Al Samha West near the Abu Dhabi–Dubai Highway, approximately 12 km south-southeast of EMAL site (refer to Figure A.8). Table 4.1 summarises the data collected at this station from 2007 to 2009 for some of the main parameters of interest to EMAL: sulphur dioxide (SO2), nitrogen dioxide (NO2), carbon monoxide (CO), and particulate matter (PM10).
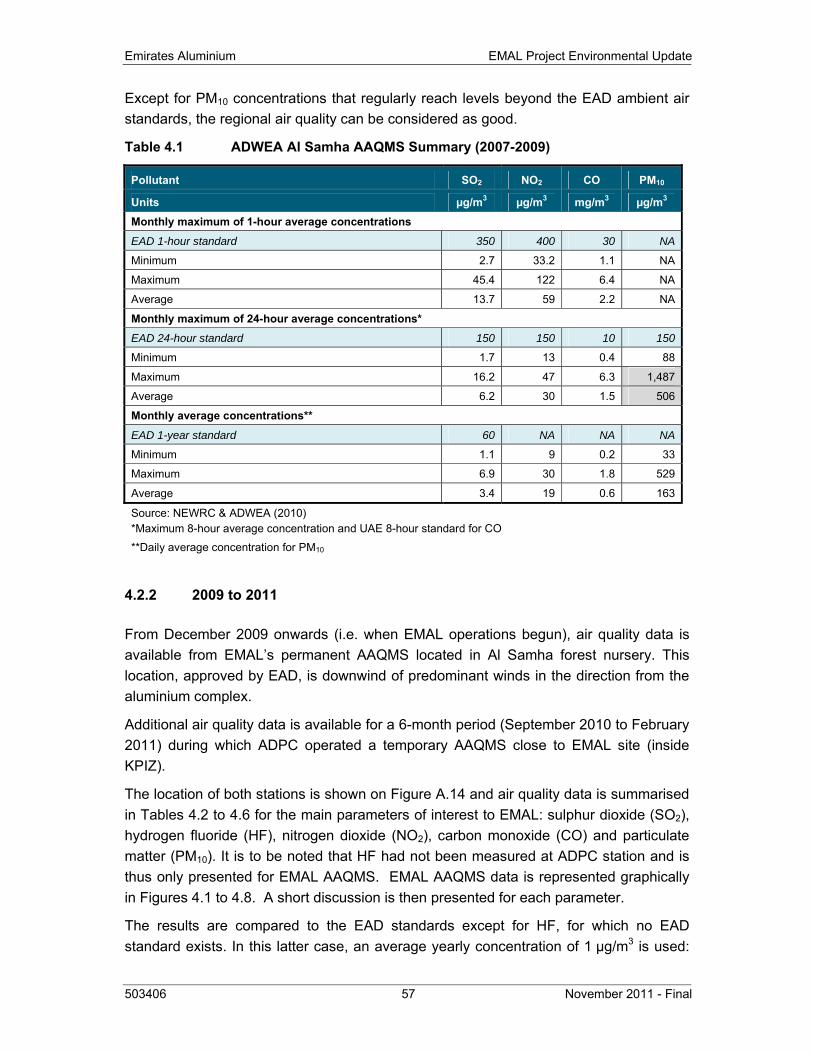
Emirates Aluminium EMAL Project Environmental Update
503406 57 November 2011 - Final
Except for PM10 concentrations that regularly reach levels beyond the EAD ambient air standards, the regional air quality can be considered as good.
Table 4.1 ADWEA Al Samha AAQMS Summary (2007-2009)
Pollutant SO2 NO2 CO PM10
Units µg/m3 µg/m3 mg/m3 µg/m3 Monthly maximum of 1-hour average concentrations
EAD 1-hour standard 350 400 30 NA
Minimum 2.7 33.2 1.1 NA
Maximum 45.4 122 6.4 NA
Average 13.7 59 2.2 NA
Monthly maximum of 24-hour average concentrations* EAD 24-hour standard 150 150 10 150
Minimum 1.7 13 0.4 88
Maximum 16.2 47 6.3 1,487
Average 6.2 30 1.5 506
Monthly average concentrations**
EAD 1-year standard 60 NA NA NA
Minimum 1.1 9 0.2 33
Maximum 6.9 30 1.8 529
Average 3.4 19 0.6 163
Source: NEWRC & ADWEA (2010) *Maximum 8-hour average concentration and UAE 8-hour standard for CO
**Daily average concentration for PM10
4.2.2 2009 to 2011
From December 2009 onwards (i.e. when EMAL operations begun), air quality data is available from EMAL’s permanent AAQMS located in Al Samha forest nursery. This location, approved by EAD, is downwind of predominant winds in the direction from the aluminium complex.
Additional air quality data is available for a 6-month period (September 2010 to February 2011) during which ADPC operated a temporary AAQMS close to EMAL site (inside KPIZ).
The location of both stations is shown on Figure A.14 and air quality data is summarised in Tables 4.2 to 4.6 for the main parameters of interest to EMAL: sulphur dioxide (SO2), hydrogen fluoride (HF), nitrogen dioxide (NO2), carbon monoxide (CO) and particulate matter (PM10). It is to be noted that HF had not been measured at ADPC station and is thus only presented for EMAL AAQMS. EMAL AAQMS data is represented graphically in Figures 4.1 to 4.8. A short discussion is then presented for each parameter.
The results are compared to the EAD standards except for HF, for which no EAD standard exists. In this latter case, an average yearly concentration of 1 µg/m3 is used:
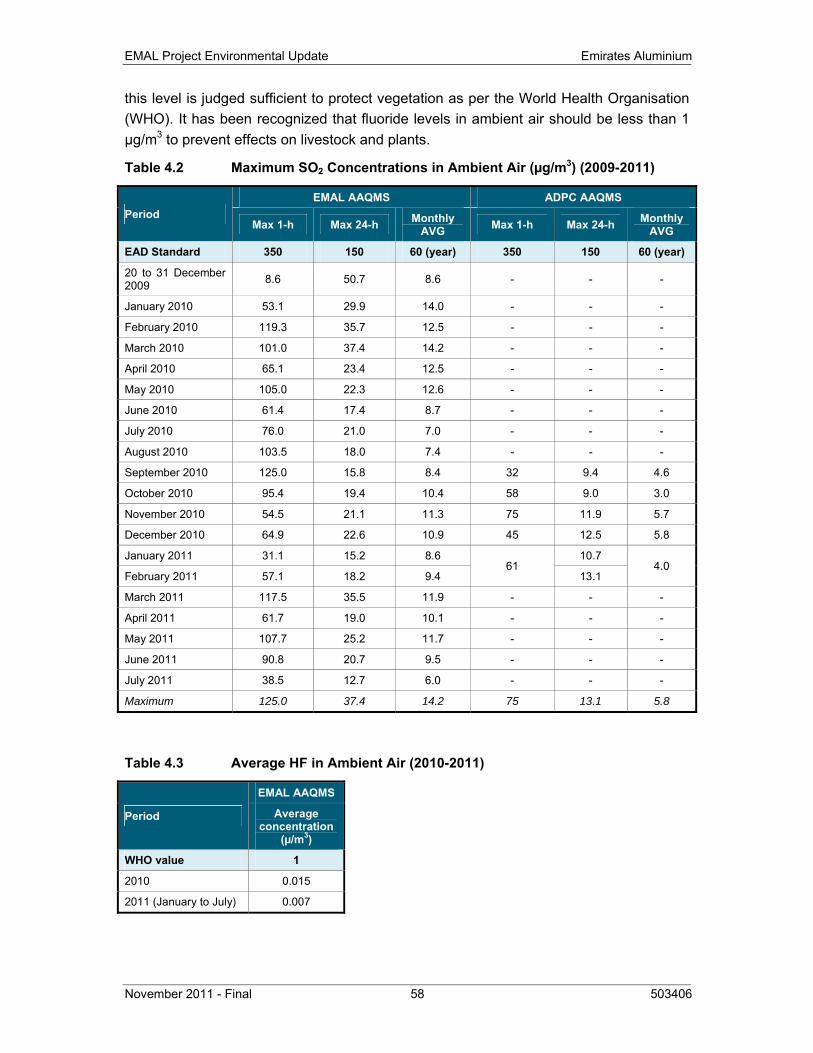
EMAL Project Environmental Update Emirates Aluminium
November 2011 - Final 58 503406
this level is judged sufficient to protect vegetation as per the World Health Organisation (WHO). It has been recognized that fluoride levels in ambient air should be less than 1 μg/m3 to prevent effects on livestock and plants.
Table 4.2 Maximum SO2 Concentrations in Ambient Air (µg/m3) (2009-2011)
Period EMAL AAQMS ADPC AAQMS
Max 1-h Max 24-h Monthly AVG Max 1-h Max 24-h Monthly
AVG
EAD Standard 350 150 60 (year) 350 150 60 (year)
20 to 31 December 2009 8.6 50.7 8.6 - - -
January 2010 53.1 29.9 14.0 - - -
February 2010 119.3 35.7 12.5 - - -
March 2010 101.0 37.4 14.2 - - -
April 2010 65.1 23.4 12.5 - - -
May 2010 105.0 22.3 12.6 - - -
June 2010 61.4 17.4 8.7 - - -
July 2010 76.0 21.0 7.0 - - -
August 2010 103.5 18.0 7.4 - - -
September 2010 125.0 15.8 8.4 32 9.4 4.6
October 2010 95.4 19.4 10.4 58 9.0 3.0
November 2010 54.5 21.1 11.3 75 11.9 5.7
December 2010 64.9 22.6 10.9 45 12.5 5.8
January 2011 31.1 15.2 8.6 61
10.7 4.0
February 2011 57.1 18.2 9.4 13.1
March 2011 117.5 35.5 11.9 - - -
April 2011 61.7 19.0 10.1 - - -
May 2011 107.7 25.2 11.7 - - -
June 2011 90.8 20.7 9.5 - - -
July 2011 38.5 12.7 6.0 - - -
Maximum 125.0 37.4 14.2 75 13.1 5.8
Table 4.3 Average HF in Ambient Air (2010-2011)
Period
EMAL AAQMS
Average concentration
(µ/m3)
WHO value 1
2010 0.015
2011 (January to July) 0.007
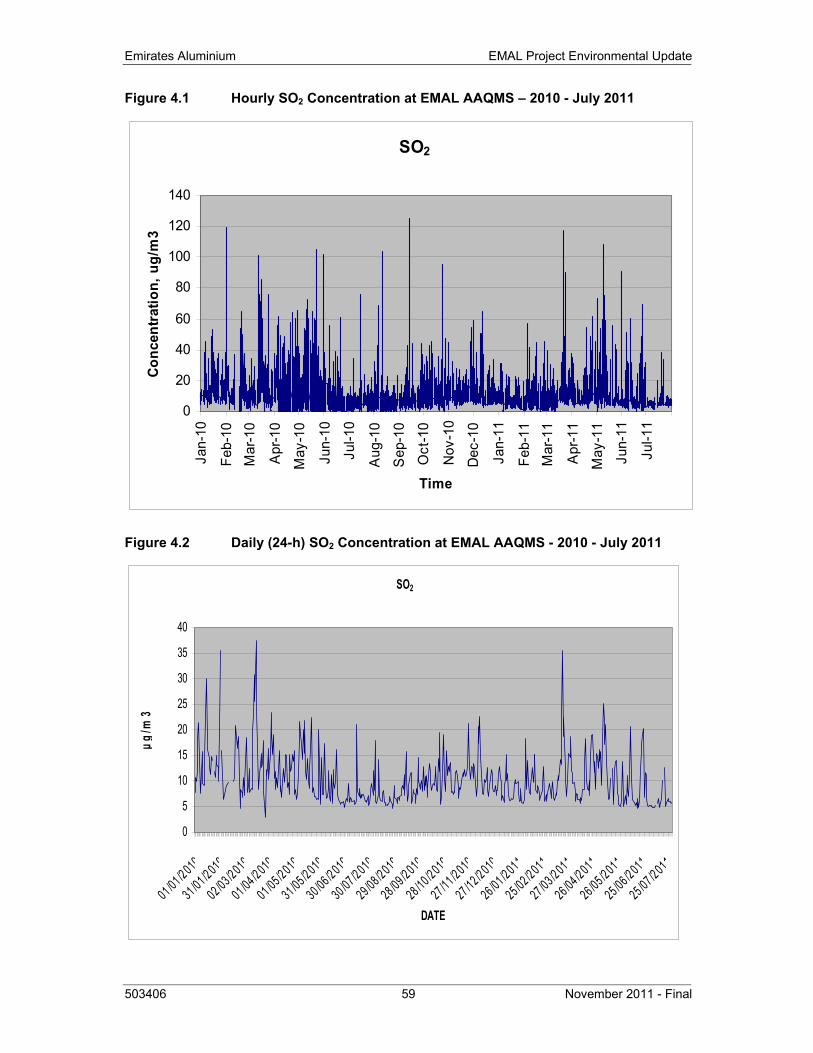
Emirates Aluminium EMAL Project Environmental Update
503406 59 November 2011 - Final
Figure 4.1 Hourly SO2 Concentration at EMAL AAQMS – 2010 - July 2011
Figure 4.2 Daily (24-h) SO2 Concentration at EMAL AAQMS - 2010 - July 2011
SO2
0
20
40
60
80
100
120
140Ja
n-10
Feb-
10M
ar-1
0
Apr
-10
May
-10
Jun-
10
Jul-1
0
Aug
-10
Sep
-10
Oct
-10
Nov
-10
Dec
-10
Jan-
11
Feb-
11M
ar-1
1
Apr
-11
May
-11
Jun-
11
Jul-1
1
Time
Conc
entr
atio
n, u
g/m
3
SO2
0
5
10
15
20
25
30
35
40
01 /01 /2 010
31 /01 /2 010
02 /03 /2 010
01 /04 /2 010
01 /05 /2 010
31 /05 /2 010
30 /06 /2 010
30 /07 /2 010
29 /08 /2 010
28 /09 /2 010
28 /10 /2 010
27 /11 /2 010
27 /12 /2 010
26 /01 /2 011
25 /02 /2 011
27 /03 /2 011
26 /04 /2 011
26 /05 /2 011
25 /06 /2 011
25 /07 /2 011
DATE
µg/m
3
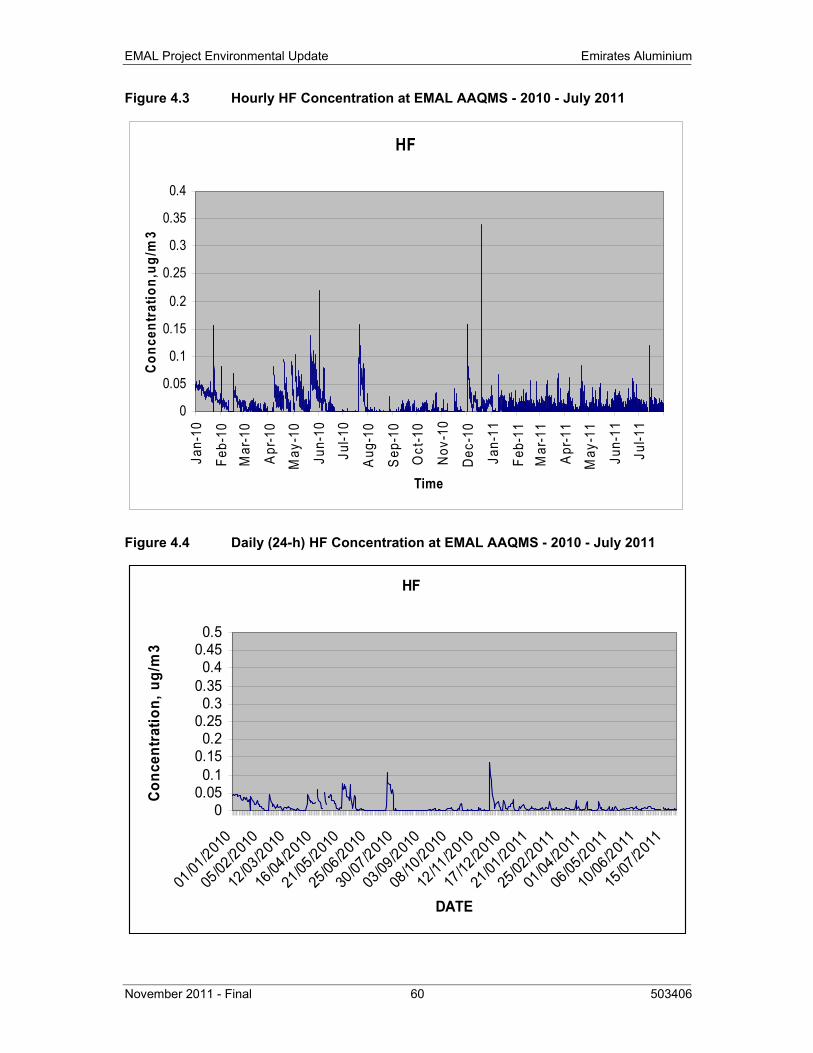
EMAL Project Environmental Update Emirates Aluminium
November 2011 - Final 60 503406
Figure 4.3 Hourly HF Concentration at EMAL AAQMS - 2010 - July 2011
Figure 4.4 Daily (24-h) HF Concentration at EMAL AAQMS - 2010 - July 2011
HF
0
0.05
0.1
0.15
0.2
0.25
0.3
0.35
0.4Ja
n-10
Feb-
10M
ar-1
0
Apr
-10
May
-10
Jun-
10
Jul-1
0
Aug
-10
Sep
-10
Oct
-10
Nov
-10
Dec
-10
Jan-
11
Feb-
11M
ar-1
1
Apr
-11
May
-11
Jun-
11
Jul-1
1
Time
Conc
entr
atio
n,ug
/m3
HF
00.050.1
0.150.2
0.250.3
0.350.4
0.450.5
01/01
/2010
05/02
/2010
12/03
/2010
16/04
/2010
21/05
/2010
25/06
/2010
30/07
/2010
03/09
/2010
08/10
/2010
12/11
/2010
17/12
/2010
21/01
/2011
25/02
/2011
01/04
/2011
06/05
/2011
10/06
/2011
15/07
/2011
DATE
Con
cent
ratio
n, u
g/m
3
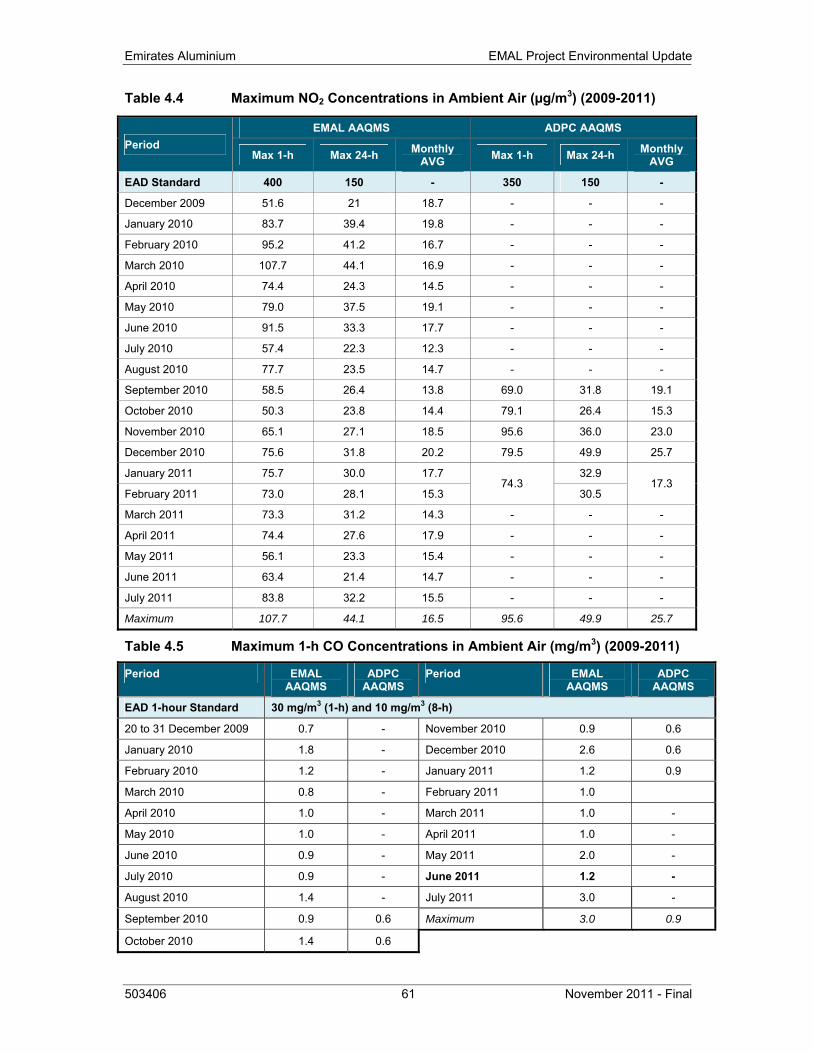
Emirates Aluminium EMAL Project Environmental Update
503406 61 November 2011 - Final
Table 4.4 Maximum NO2 Concentrations in Ambient Air (µg/m3) (2009-2011)
Period EMAL AAQMS ADPC AAQMS
Max 1-h Max 24-h Monthly AVG Max 1-h Max 24-h Monthly
AVG
EAD Standard 400 150 - 350 150 -
December 2009 51.6 21 18.7 - - -
January 2010 83.7 39.4 19.8 - - -
February 2010 95.2 41.2 16.7 - - -
March 2010 107.7 44.1 16.9 - - -
April 2010 74.4 24.3 14.5 - - -
May 2010 79.0 37.5 19.1 - - -
June 2010 91.5 33.3 17.7 - - -
July 2010 57.4 22.3 12.3 - - -
August 2010 77.7 23.5 14.7 - - -
September 2010 58.5 26.4 13.8 69.0 31.8 19.1
October 2010 50.3 23.8 14.4 79.1 26.4 15.3
November 2010 65.1 27.1 18.5 95.6 36.0 23.0
December 2010 75.6 31.8 20.2 79.5 49.9 25.7
January 2011 75.7 30.0 17.7 74.3
32.9 17.3
February 2011 73.0 28.1 15.3 30.5
March 2011 73.3 31.2 14.3 - - -
April 2011 74.4 27.6 17.9 - - -
May 2011 56.1 23.3 15.4 - - -
June 2011 63.4 21.4 14.7 - - -
July 2011 83.8 32.2 15.5 - - -
Maximum 107.7 44.1 16.5 95.6 49.9 25.7
Table 4.5 Maximum 1-h CO Concentrations in Ambient Air (mg/m3) (2009-2011)
Period EMAL AAQMS
ADPC AAQMS
Period EMAL AAQMS
ADPC AAQMS
EAD 1-hour Standard 30 mg/m3 (1-h) and 10 mg/m3 (8-h)
20 to 31 December 2009 0.7 - November 2010 0.9 0.6
January 2010 1.8 - December 2010 2.6 0.6
February 2010 1.2 - January 2011 1.2 0.9
March 2010 0.8 - February 2011 1.0
April 2010 1.0 - March 2011 1.0 -
May 2010 1.0 - April 2011 1.0 -
June 2010 0.9 - May 2011 2.0 -
July 2010 0.9 - June 2011 1.2 -
August 2010 1.4 - July 2011 3.0 -
September 2010 0.9 0.6 Maximum 3.0 0.9
October 2010 1.4 0.6
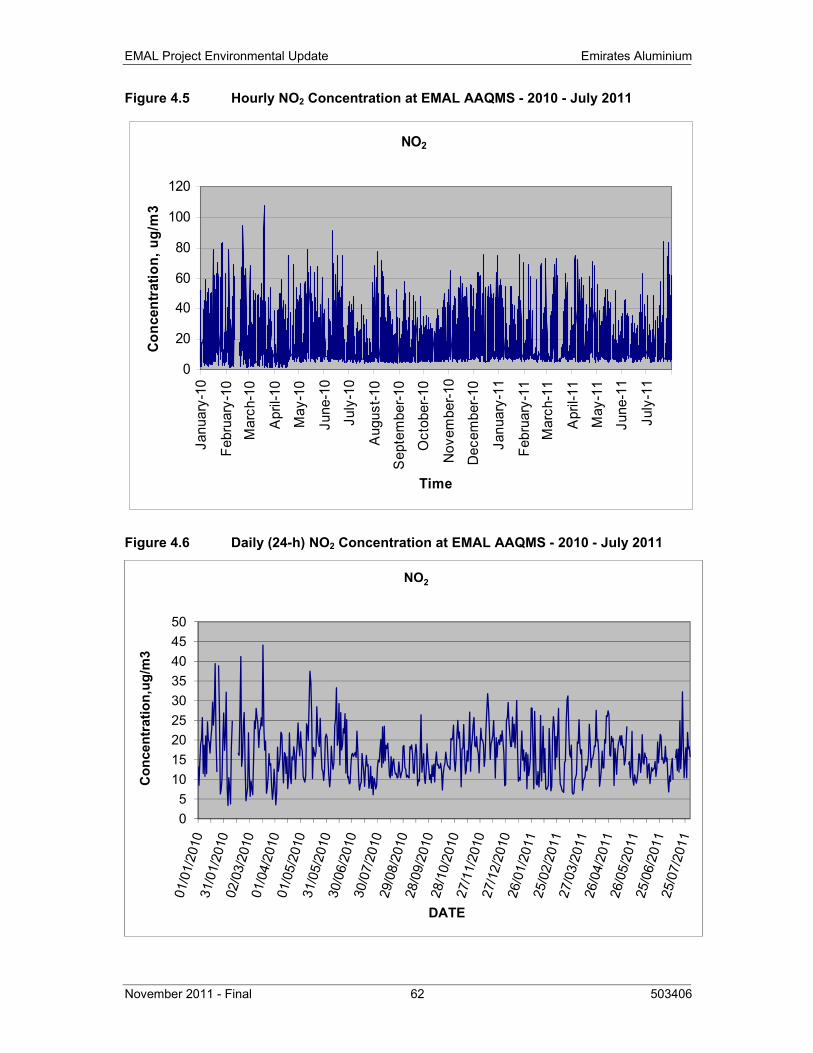
EMAL Project Environmental Update Emirates Aluminium
November 2011 - Final 62 503406
Figure 4.5 Hourly NO2 Concentration at EMAL AAQMS - 2010 - July 2011
Figure 4.6 Daily (24-h) NO2 Concentration at EMAL AAQMS - 2010 - July 2011
NO2
0
20
40
60
80
100
120Ja
nuar
y-10
Febr
uary
-10
Mar
ch-1
0
Apr
il-10
May
-10
June
-10
July
-10
Aug
ust-1
0
Sep
tem
ber-1
0
Oct
ober
-10
Nov
embe
r-10
Dec
embe
r-10
Janu
ary-
11
Febr
uary
-11
Mar
ch-1
1
Apr
il-11
May
-11
June
-11
July
-11
Time
Conc
entr
atio
n, u
g/m
3
05
101520253035404550
Con
cent
ratio
n,ug
/m3
DATE
NO2
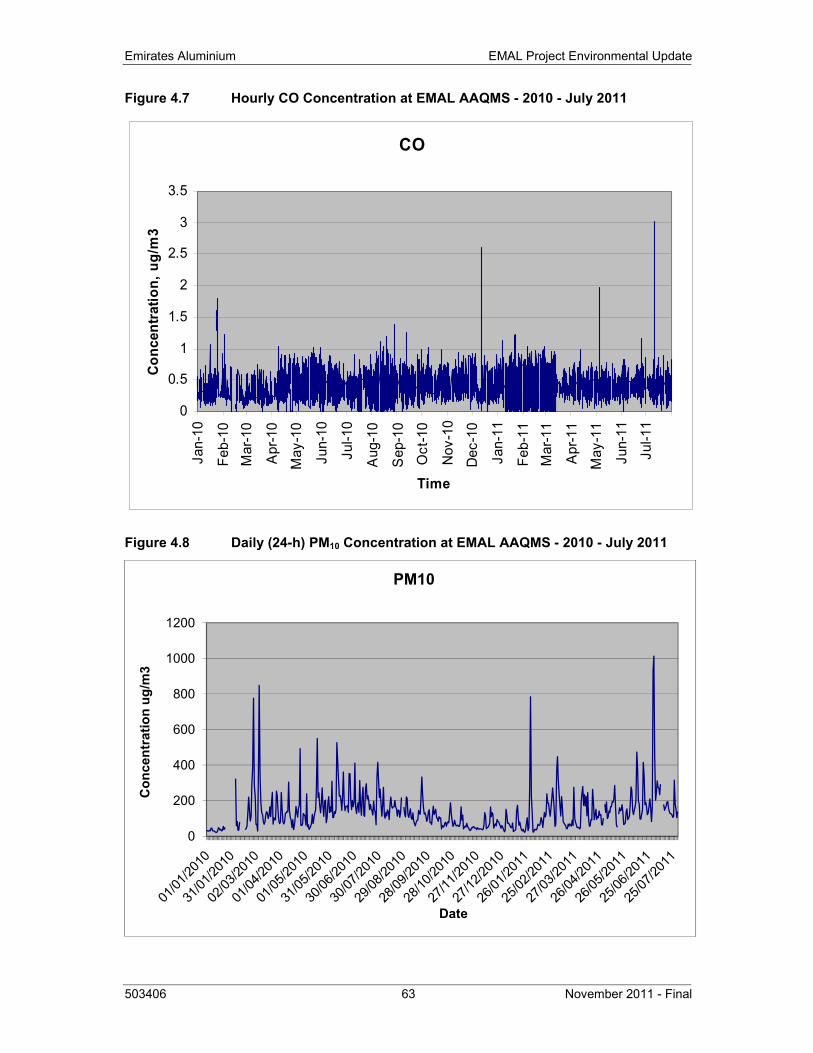
Emirates Aluminium EMAL Project Environmental Update
503406 63 November 2011 - Final
Figure 4.7 Hourly CO Concentration at EMAL AAQMS - 2010 - July 2011
Figure 4.8 Daily (24-h) PM10 Concentration at EMAL AAQMS - 2010 - July 2011
CO
0
0.5
1
1.5
2
2.5
3
3.5Ja
n-10
Feb-
10M
ar-1
0
Apr
-10
May
-10
Jun-
10
Jul-1
0
Aug
-10
Sep
-10
Oct
-10
Nov
-10
Dec
-10
Jan-
11
Feb-
11M
ar-1
1
Apr
-11
May
-11
Jun-
11
Jul-1
1
Time
Con
cent
ratio
n, u
g/m
3
0
200
400
600
800
1000
1200
Con
cent
ratio
n ug
/m3
Date
PM10
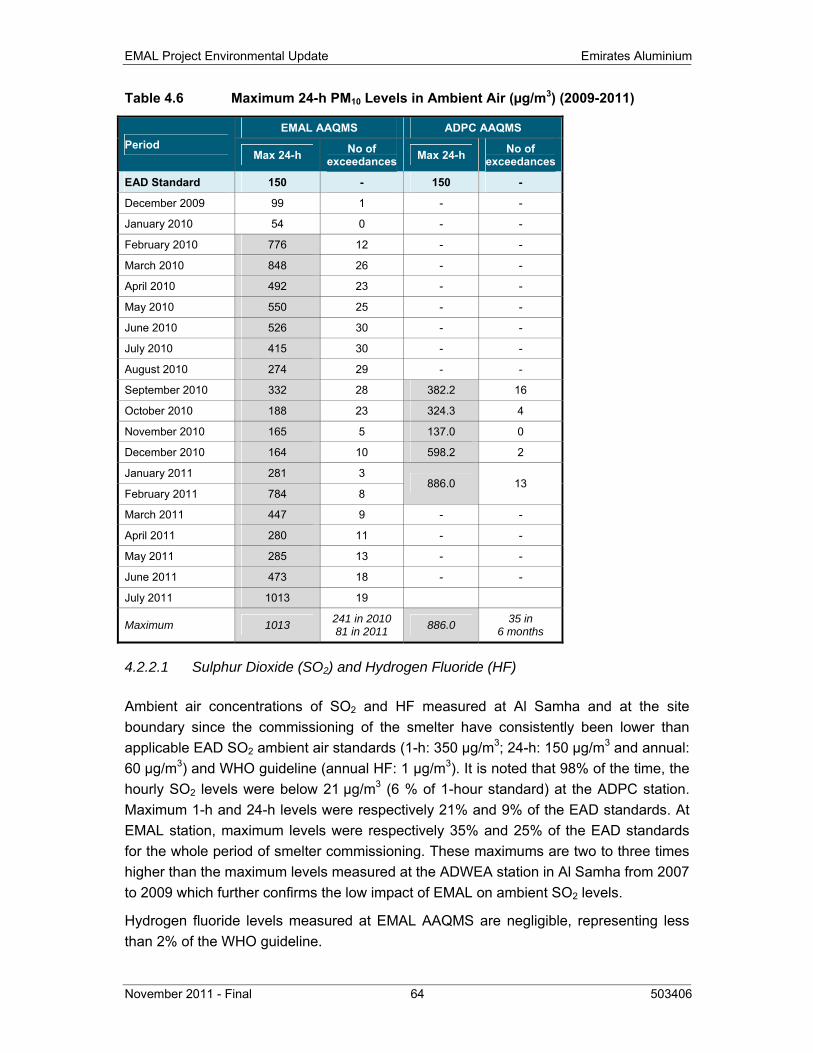
EMAL Project Environmental Update Emirates Aluminium
November 2011 - Final 64 503406
Table 4.6 Maximum 24-h PM10 Levels in Ambient Air (µg/m3) (2009-2011)
Period EMAL AAQMS ADPC AAQMS
Max 24-h No of exceedances Max 24-h No of
exceedances
EAD Standard 150 - 150 -
December 2009 99 1 - -
January 2010 54 0 - -
February 2010 776 12 - -
March 2010 848 26 - -
April 2010 492 23 - -
May 2010 550 25 - -
June 2010 526 30 - -
July 2010 415 30 - -
August 2010 274 29 - -
September 2010 332 28 382.2 16
October 2010 188 23 324.3 4
November 2010 165 5 137.0 0
December 2010 164 10 598.2 2
January 2011 281 3 886.0 13
February 2011 784 8
March 2011 447 9 - -
April 2011 280 11 - -
May 2011 285 13 - -
June 2011 473 18 - -
July 2011 1013 19
Maximum 1013 241 in 2010 81 in 2011 886.0 35 in
6 months
4.2.2.1 Sulphur Dioxide (SO2) and Hydrogen Fluoride (HF)
Ambient air concentrations of SO2 and HF measured at Al Samha and at the site boundary since the commissioning of the smelter have consistently been lower than applicable EAD SO2 ambient air standards (1-h: 350 µg/m3; 24-h: 150 µg/m3 and annual: 60 µg/m3) and WHO guideline (annual HF: 1 µg/m3). It is noted that 98% of the time, the hourly SO2 levels were below 21 µg/m3 (6 % of 1-hour standard) at the ADPC station. Maximum 1-h and 24-h levels were respectively 21% and 9% of the EAD standards. At EMAL station, maximum levels were respectively 35% and 25% of the EAD standards for the whole period of smelter commissioning. These maximums are two to three times higher than the maximum levels measured at the ADWEA station in Al Samha from 2007 to 2009 which further confirms the low impact of EMAL on ambient SO2 levels.
Hydrogen fluoride levels measured at EMAL AAQMS are negligible, representing less than 2% of the WHO guideline.
Emirates Aluminium EMAL Project Environmental Update
503406 65 November 2011 - Final
4.2.2.2 Nitrogen Dioxide (NO2)
The NO2 maximum concentrations were well below the EAD ambient air standards (1 h: 400 µg/m3; 24-h: 150 µg/m3), the maximum levels being less than 1/3 of the standard, whether hourly or daily maximums. These levels were very similar to the ambient air results recorded by ADWEA in Al Samha.
4.2.2.3 Carbon Monoxide (CO)
Carbon monoxide is not usually related to air quality issues around aluminium smelters, and the same conclusion applies for EMAL, with the maximum hourly concentration in air ambient for each month being less than 2.6 mg/m3 at ADPC and EMAL AAQMS, compared to the EAD 1-h and 8-h ambient air quality standards of 30 and 10 mg/m3. It is noted that, 98% of the time, the hourly CO concentration levels were below 0.4 mg/m3 at the ADPC station. These maximum levels are two times less than the highest hourly concentration monitored at the ADWEA station in Al Samha.
4.2.2.4 Particulates (PM10)
As for PM10, exceedances of the UAE 24-hour standard of 150 mg/m3 have frequently been measured in the above-mentioned three monitoring locations. These exceedances may be attributed to climatic factors, sand storms and land use in the area. The 2007 EIA mentions that it is normal in that type of environment to record particulate concentrations exceeding the standards. It was also noted in ADPC Baseline Ambient Air Quality Report (NILU, 2011) that heavy wind and dust clouds were experienced several times in the Emirates between August 2010 and February 2011 (i.e. the monitoring period of ADPC temporary station).
4.3 SOIL AND GROUNDWATER QUALITY
As there are no national guidelines available for comparison of the soil and groundwater quality parameters, soil and groundwater quality results presented below are compared to the target values (T values) and intervention values (I values) from the Dutch Government (Dutch Ministry of Housing, Spatial planning and Environment, 2000). The T values for soil indicate the level at which there is a sustainable soil quality while the T values for groundwater are indicative of background levels (for the Netherlands) and must only be viewed as a guide. The I values for both soil and groundwater are representative of the level of contamination above which there is a serious case of contamination.
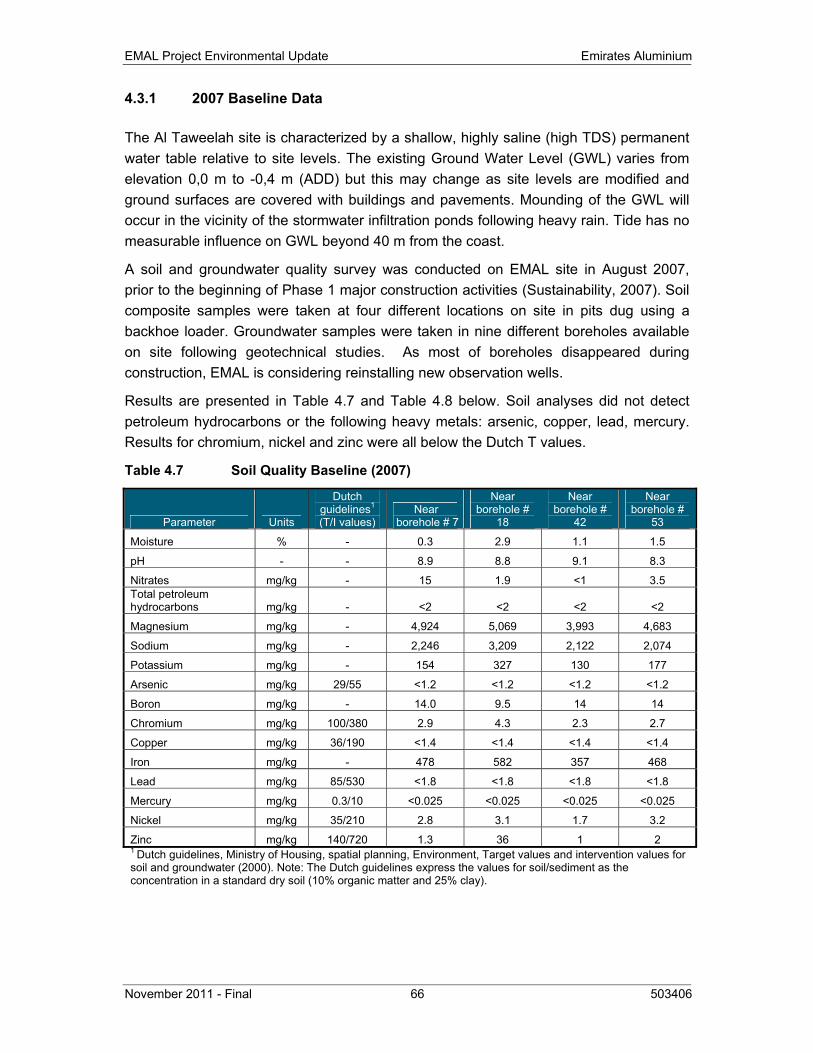
EMAL Project Environmental Update Emirates Aluminium
November 2011 - Final 66 503406
4.3.1 2007 Baseline Data
The Al Taweelah site is characterized by a shallow, highly saline (high TDS) permanent water table relative to site levels. The existing Ground Water Level (GWL) varies from elevation 0,0 m to -0,4 m (ADD) but this may change as site levels are modified and ground surfaces are covered with buildings and pavements. Mounding of the GWL will occur in the vicinity of the stormwater infiltration ponds following heavy rain. Tide has no measurable influence on GWL beyond 40 m from the coast.
A soil and groundwater quality survey was conducted on EMAL site in August 2007, prior to the beginning of Phase 1 major construction activities (Sustainability, 2007). Soil composite samples were taken at four different locations on site in pits dug using a backhoe loader. Groundwater samples were taken in nine different boreholes available on site following geotechnical studies. As most of boreholes disappeared during construction, EMAL is considering reinstalling new observation wells.
Results are presented in Table 4.7 and Table 4.8 below. Soil analyses did not detect petroleum hydrocarbons or the following heavy metals: arsenic, copper, lead, mercury. Results for chromium, nickel and zinc were all below the Dutch T values.
Table 4.7 Soil Quality Baseline (2007)
Parameter Units
Dutch guidelines1
(T/I values) Near
borehole # 7
Near borehole #
18
Near borehole #
42
Near borehole #
53
Moisture % - 0.3 2.9 1.1 1.5
pH - - 8.9 8.8 9.1 8.3
Nitrates mg/kg - 15 1.9 <1 3.5 Total petroleum hydrocarbons mg/kg - <2 <2 <2 <2
Magnesium mg/kg - 4,924 5,069 3,993 4,683
Sodium mg/kg - 2,246 3,209 2,122 2,074
Potassium mg/kg - 154 327 130 177
Arsenic mg/kg 29/55 <1.2 <1.2 <1.2 <1.2
Boron mg/kg - 14.0 9.5 14 14
Chromium mg/kg 100/380 2.9 4.3 2.3 2.7
Copper mg/kg 36/190 <1.4 <1.4 <1.4 <1.4
Iron mg/kg - 478 582 357 468
Lead mg/kg 85/530 <1.8 <1.8 <1.8 <1.8
Mercury mg/kg 0.3/10 <0.025 <0.025 <0.025 <0.025
Nickel mg/kg 35/210 2.8 3.1 1.7 3.2
Zinc mg/kg 140/720 1.3 36 1 2 1 Dutch guidelines, Ministry of Housing, spatial planning, Environment, Target values and intervention values for soil and groundwater (2000). Note: The Dutch guidelines express the values for soil/sediment as the concentration in a standard dry soil (10% organic matter and 25% clay).
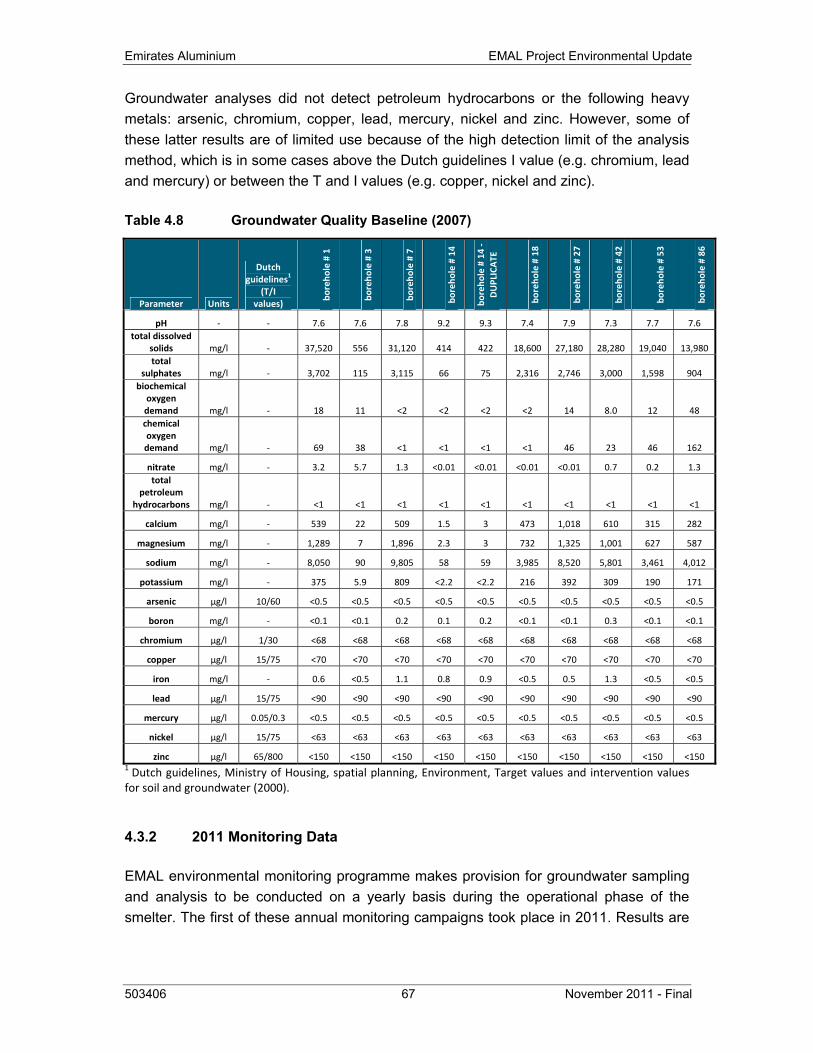
Emirates Aluminium EMAL Project Environmental Update
503406 67 November 2011 - Final
Groundwater analyses did not detect petroleum hydrocarbons or the following heavy metals: arsenic, chromium, copper, lead, mercury, nickel and zinc. However, some of these latter results are of limited use because of the high detection limit of the analysis method, which is in some cases above the Dutch guidelines I value (e.g. chromium, lead and mercury) or between the T and I values (e.g. copper, nickel and zinc).
Table 4.8 Groundwater Quality Baseline (2007)
Parameter Units
Dutch guidelines1
(T/I values)
boreho
le # 1
boreho
le # 3
boreho
le # 7
boreho
le # 14
boreho
le # 14 ‐
DUPLICATE
boreho
le # 18
boreho
le # 27
boreho
le # 42
boreho
le # 53
boreho
le # 86
pH ‐ ‐ 7.6 7.6 7.8 9.2 9.3 7.4 7.9 7.3 7.7 7.6 total dissolved
solids mg/l ‐ 37,520 556 31,120 414 422 18,600 27,180 28,280 19,040 13,980 total
sulphates mg/l ‐ 3,702 115 3,115 66 75 2,316 2,746 3,000 1,598 904 biochemical oxygen demand mg/l ‐ 18 11 <2 <2 <2 <2 14 8.0 12 48 chemical oxygen demand mg/l ‐ 69 38 <1 <1 <1 <1 46 23 46 162
nitrate mg/l ‐ 3.2 5.7 1.3 <0.01 <0.01 <0.01 <0.01 0.7 0.2 1.3 total
petroleum hydrocarbons mg/l ‐ <1 <1 <1 <1 <1 <1 <1 <1 <1 <1
calcium mg/l ‐ 539 22 509 1.5 3 473 1,018 610 315 282
magnesium mg/l ‐ 1,289 7 1,896 2.3 3 732 1,325 1,001 627 587
sodium mg/l ‐ 8,050 90 9,805 58 59 3,985 8,520 5,801 3,461 4,012
potassium mg/l ‐ 375 5.9 809 <2.2 <2.2 216 392 309 190 171
arsenic µg/l 10/60 <0.5 <0.5 <0.5 <0.5 <0.5 <0.5 <0.5 <0.5 <0.5 <0.5
boron mg/l ‐ <0.1 <0.1 0.2 0.1 0.2 <0.1 <0.1 0.3 <0.1 <0.1
chromium µg/l 1/30 <68 <68 <68 <68 <68 <68 <68 <68 <68 <68
copper µg/l 15/75 <70 <70 <70 <70 <70 <70 <70 <70 <70 <70
iron mg/l ‐ 0.6 <0.5 1.1 0.8 0.9 <0.5 0.5 1.3 <0.5 <0.5
lead µg/l 15/75 <90 <90 <90 <90 <90 <90 <90 <90 <90 <90
mercury µg/l 0.05/0.3 <0.5 <0.5 <0.5 <0.5 <0.5 <0.5 <0.5 <0.5 <0.5 <0.5
nickel µg/l 15/75 <63 <63 <63 <63 <63 <63 <63 <63 <63 <63
zinc µg/l 65/800 <150 <150 <150 <150 <150 <150 <150 <150 <150 <150 1 Dutch guidelines, Ministry of Housing, spatial planning, Environment, Target values and intervention values for soil and groundwater (2000).
4.3.2 2011 Monitoring Data
EMAL environmental monitoring programme makes provision for groundwater sampling and analysis to be conducted on a yearly basis during the operational phase of the smelter. The first of these annual monitoring campaigns took place in 2011. Results are
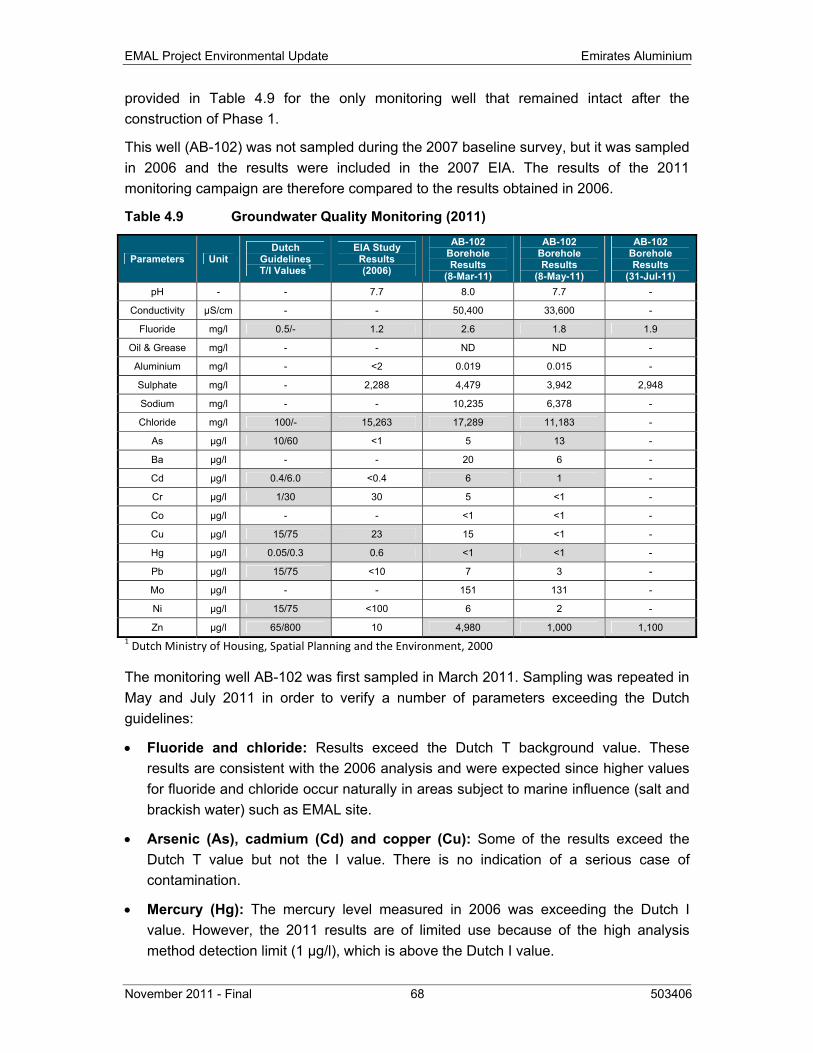
EMAL Project Environmental Update Emirates Aluminium
November 2011 - Final 68 503406
provided in Table 4.9 for the only monitoring well that remained intact after the construction of Phase 1.
This well (AB-102) was not sampled during the 2007 baseline survey, but it was sampled in 2006 and the results were included in the 2007 EIA. The results of the 2011 monitoring campaign are therefore compared to the results obtained in 2006.
Table 4.9 Groundwater Quality Monitoring (2011)
Parameters Unit Dutch
Guidelines T/I Values 1
EIA Study Results (2006)
AB-102 Borehole Results
(8-Mar-11)
AB-102 Borehole Results
(8-May-11)
AB-102 Borehole Results
(31-Jul-11) pH - - 7.7 8.0 7.7 -
Conductivity µS/cm - - 50,400 33,600 -
Fluoride mg/l 0.5/- 1.2 2.6 1.8 1.9
Oil & Grease mg/l - - ND ND -
Aluminium mg/l - <2 0.019 0.015 -
Sulphate mg/l - 2,288 4,479 3,942 2,948
Sodium mg/l - - 10,235 6,378 -
Chloride mg/l 100/- 15,263 17,289 11,183 -
As µg/l 10/60 <1 5 13 -
Ba µg/l - - 20 6 -
Cd µg/l 0.4/6.0 <0.4 6 1 -
Cr µg/l 1/30 30 5 <1 -
Co µg/l - - <1 <1 -
Cu µg/l 15/75 23 15 <1 -
Hg µg/l 0.05/0.3 0.6 <1 <1 -
Pb µg/l 15/75 <10 7 3 -
Mo µg/l - - 151 131 -
Ni µg/l 15/75 <100 6 2 -
Zn µg/l 65/800 10 4,980 1,000 1,100 1 Dutch Ministry of Housing, Spatial Planning and the Environment, 2000 The monitoring well AB-102 was first sampled in March 2011. Sampling was repeated in May and July 2011 in order to verify a number of parameters exceeding the Dutch guidelines:
• Fluoride and chloride: Results exceed the Dutch T background value. These results are consistent with the 2006 analysis and were expected since higher values for fluoride and chloride occur naturally in areas subject to marine influence (salt and brackish water) such as EMAL site.
• Arsenic (As), cadmium (Cd) and copper (Cu): Some of the results exceed the Dutch T value but not the I value. There is no indication of a serious case of contamination.
• Mercury (Hg): The mercury level measured in 2006 was exceeding the Dutch I value. However, the 2011 results are of limited use because of the high analysis method detection limit (1 µg/l), which is above the Dutch I value.
Emirates Aluminium EMAL Project Environmental Update
503406 69 November 2011 - Final
• Zinc (Zn): All 2011 results exceed the Dutch I value which indicates a serious case of contamination.
It is to be noted that an engineering project has been initiated to drill new boreholes to replace some of the damaged wells so that monitoring of groundwater quality can be done at more than one location in the future. Results for zinc will be analysed in regard of the entire smelter. It should be noted that whilst the 2006 baseline results on EMAL site show low zinc concentrations, the results of metal analysis conducted in 2005 (by PB Power & Dome Oilfield) from 21 various wells at Al-Taweelah complex show that zinc concentration is above T values (65 ppb) in all 21 wells; and above I values (800 ppb) in 9 of these wells. These wells are located in the northeast portion of existing Taweelah complex and are less than 500m from the closest boundary with KPIZ area A to the east and close to EMAL.
4.4 SEAWATER QUALITY
As part of its environmental monitoring programme, EMAL is analysing the seawater quality at the water intake. The results so far obtained are summarised below (Table 4.10) and compared to the EAD Recommended Ambient Marine Water Quality Standards for Abu Dhabi Emirate. In general, the quality of the seawater received at the seawater intake is good, except for the levels of total phosphorus found 10 to 50 times above EAD ambient marine standard:
• pH: The six first daily pH measurements (6 on 362) were between 8.5 and 8.6, slightly above the EAD expected range of 6.5-8.5. Subsequent levels were all in the expected range. Adjustment seems to be done on the monitoring equipment after the first week of operation of the equipment,
• Free Residual Chlorine (FRC): With an average value of 0.45 mg/l. These levels are not representative of ambient marine water quality as water samples are taken in the intake after the point of injection of chlorine used to prevent marine biofouling.
• Total Organic Compounds (TOC): This parameter was measured on a daily basis for a period of one month starting on 2 October 2010. One exceedance of the EAD standard for TOC was measured (2.8 mg/l versus a limit of 2.5 mg/l).
• Cadmium (Cd) and Copper (Cu): The first campaign of the four quarterly monitoring campaigns conducted by EMAL showed Cd and Cu levels above EAD standards in the seawater intake. However the level of quantification for the analysis was increased to the ppb level for the metals after the first campaign and concentration levels for all metals decreased in subsequent campaigns.
• Total Phosphorus (P): All four quarterly monitoring campaigns conducted by EMAL so far have shown P levels above EAD standard of 0.001 mg/l.
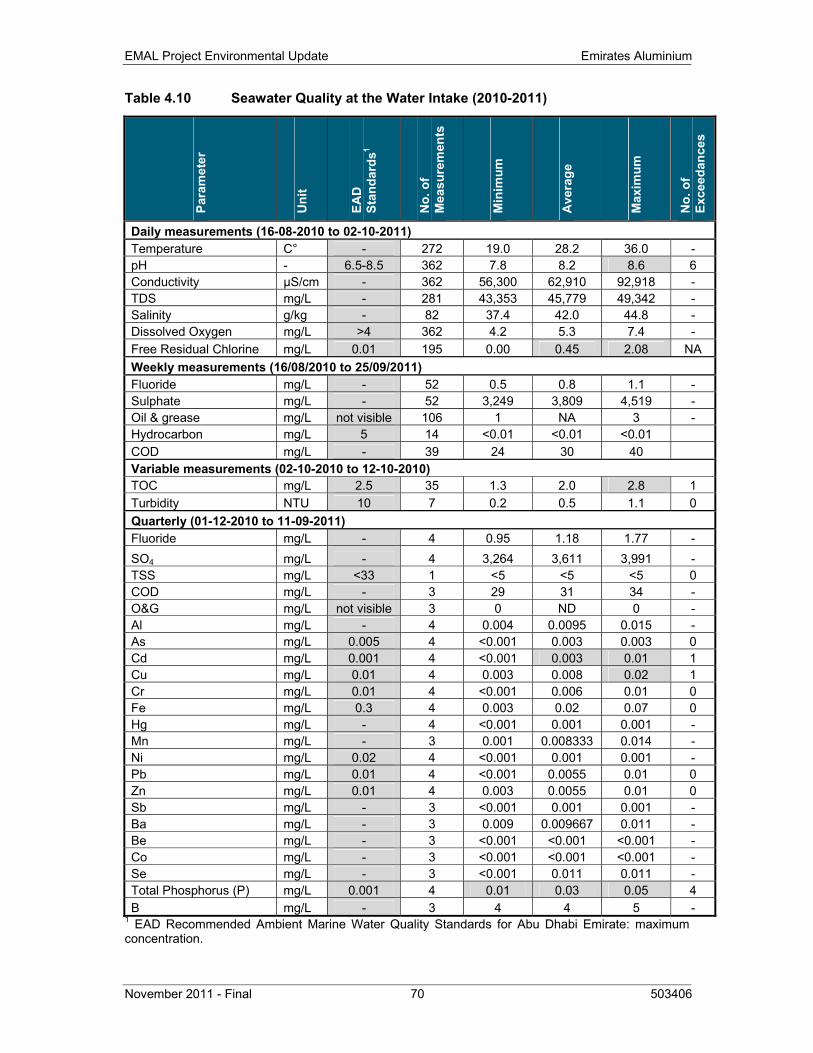
EMAL Project Environmental Update Emirates Aluminium
November 2011 - Final 70 503406
Table 4.10 Seawater Quality at the Water Intake (2010-2011)
Para
met
er
Uni
t
EAD
St
anda
rds1
No.
of
Mea
sure
men
ts
Min
imum
Ave
rage
Max
imum
No.
of
Exce
edan
ces
Daily measurements (16-08-2010 to 02-10-2011) Temperature C° - 272 19.0 28.2 36.0 - pH - 6.5-8.5 362 7.8 8.2 8.6 6 Conductivity µS/cm - 362 56,300 62,910 92,918 - TDS mg/L - 281 43,353 45,779 49,342 - Salinity g/kg - 82 37.4 42.0 44.8 - Dissolved Oxygen mg/L >4 362 4.2 5.3 7.4 - Free Residual Chlorine mg/L 0.01 195 0.00 0.45 2.08 NA Weekly measurements (16/08/2010 to 25/09/2011) Fluoride mg/L - 52 0.5 0.8 1.1 - Sulphate mg/L - 52 3,249 3,809 4,519 - Oil & grease mg/L not visible 106 1 NA 3 - Hydrocarbon mg/L 5 14 <0.01 <0.01 <0.01 COD mg/L - 39 24 30 40 Variable measurements (02-10-2010 to 12-10-2010) TOC mg/L 2.5 35 1.3 2.0 2.8 1 Turbidity NTU 10 7 0.2 0.5 1.1 0 Quarterly (01-12-2010 to 11-09-2011) Fluoride mg/L - 4 0.95 1.18 1.77 - SO4 mg/L - 4 3,264 3,611 3,991 - TSS mg/L <33 1 <5 <5 <5 0 COD mg/L - 3 29 31 34 - O&G mg/L not visible 3 0 ND 0 - Al mg/L - 4 0.004 0.0095 0.015 - As mg/L 0.005 4 <0.001 0.003 0.003 0 Cd mg/L 0.001 4 <0.001 0.003 0.01 1 Cu mg/L 0.01 4 0.003 0.008 0.02 1 Cr mg/L 0.01 4 <0.001 0.006 0.01 0 Fe mg/L 0.3 4 0.003 0.02 0.07 0 Hg mg/L - 4 <0.001 0.001 0.001 - Mn mg/L - 3 0.001 0.008333 0.014 - Ni mg/L 0.02 4 <0.001 0.001 0.001 - Pb mg/L 0.01 4 <0.001 0.0055 0.01 0 Zn mg/L 0.01 4 0.003 0.0055 0.01 0 Sb mg/L - 3 <0.001 0.001 0.001 - Ba mg/L - 3 0.009 0.009667 0.011 - Be mg/L - 3 <0.001 <0.001 <0.001 - Co mg/L - 3 <0.001 <0.001 <0.001 - Se mg/L - 3 <0.001 0.011 0.011 - Total Phosphorus (P) mg/L 0.001 4 0.01 0.03 0.05 4 B mg/L - 3 4 4 5 -
1 EAD Recommended Ambient Marine Water Quality Standards for Abu Dhabi Emirate: maximum concentration.
Emirates Aluminium EMAL Project Environmental Update
503406 71 November 2011 - Final
4.5 MARINE ENVIRONMENT
The 2007 EIA mentioned that the live patch coral resource in Taweelah is the most important in eastern Qatar and Abu Dhabi and might be the largest continuum of pristine coral in the Gulf (7 km reef), and of key importance to the long term survival of coral habitat in the emirate of Abu Dhabi and the entire Gulf Region (see Figure A.15). To protect this ‘national treasure’, ADPC has invested 240 million of dollars to build an environmental breakwater of 8 km and the way the port is constructed will prevent, should an accident occur, any chemicals or other products from leaking out beyond the port. The following paragraphs present the results of the Corals monitoring program as provided by ADPC.
The coral is satellite mapped and also monitored three times a year through reference points on the seabed to enable immediate recognition of its development during camera drags. The monitoring program extends in the area between the western boundary of Khalifa Port’s construction footprint and the western side of the biggest Ras Ghanada breakwater (entrance channel to the palace). This area includes all habitats that were considered to be of critical biodiversity value in the Khalifa Port EIA and the Ecological and Environmental Conditions Baseline Survey and Mapping. Chosen habitats for monitoring are dense and sparse coral, and dense seagrass.
The monitoring program consists of quarterly visits to 85 points at which short, geo-referenced video-clips are taken (see Figure A.16). These points were previously visited in the January 2008 baseline survey, three times in 2008, three times in 2009 (January, May, and October), and three times in 2010 (January, May and September) and three times in 2011 (January, May, and September) hence offer an opportunity to compare the status of the seabed through time. The results provided by ADPC cover the surveys including January 2011. A total of 40 photo-transects were placed randomly in four permanent stations that were originally installed during the January 2008 baseline and revised twice during 2008 (May and September), three times in 2009 (January, May, and October), and three times in 2010 (January, May, September). From both the 85 video points and the 40 photo-transect stations, 4 levels of degradation of environment and coral assemblage are measured:
GREEN: comparable to baseline, no visible degradation
BLUE: slight degradation; impact <10%
ORANGE: moderate degradation; impact <25%
RED: heavy degradation; impact > 25%
The first monitoring period in May/June 2008 showed an absence of impacts, hence overall condition GREEN. A significant amount of brown algae was observed in the peripheral sparse coral areas of the study site, but this was not deemed to be adversely impacting status of the coral assemblage.
EMAL Project Environmental Update Emirates Aluminium
November 2011 - Final 72 503406
The second monitoring period in October 2008 also showed absence of impacts in most areas but slight to severe degradation due to port construction in a sparse coral area.
The third monitoring period in January 2009 still showed an absence of impacts on the majority of the dense coral area, but previously observed impacts in the sparse coral area continued and expanded slightly (three impacted sites in January 2009 versus one in October 2008; SC-7, SC-23) and the seagrass area (one impacted site in January 2009; SG-1) in proximity to a recently constructed causeway.
The fourth monitoring period in May 2009 confirmed overall absence of impacts in the dense coral area, but previously observed impacts continued in the sparse coral area (sites SC-7, SC-23 did not recover). Also an increase in brown algal prevalence was observed as in May 2008, which added impacts that are, however, considered reversible. A dense seagrass site (SG-1) that had showed impacts in January 2009 had recovered by May 2009 and was returned to condition GREEN. Overall condition was GREEN, with two dense coral and nine sparse coral sites BLUE due to a (most likely) temporary algae bloom (DC-12, DC-13, SC 1, 2, 3, 13, 18, 19, 20, 21, 25) and two monitoring station (SC-7, SC-23) remained at RED. Impacts were concentrated in the immediate area of construction operations and not in the main critical habitat area. None of the habitat polygons required changes, thus the overall impacts were slight.
The fifth monitoring period in October 2009 saw all stations revert to GREEN status, with the exception of sparse coral SC-7 which moved from RED in May to BLUE in October, and SC-23 which remained fully degraded and therefore RED. The large-scale shift back to GREEN for most sites occurred because of the absence of Padina algae that was prevalent in May 2009. Overall condition was therefore GREEN for October 2009.
The sixth monitoring period in January 2010 saw many stations move to BLUE status, due to partial coral mortality in these sites. While overall coral colony frequency did not decline markedly, live tissue-cover on many colonies, in particular the indicator species Porites harrisoni, showed declines. The likely reason is an accumulation of stresses from disease and sedimentation. No impacts were observed in the seagrass community. A single sparse coral station, SC-10, was elevated to RED status in January 2010 because of severe sedimentation. The station is however in close proximity to the construction footprint and the impact was not unexpected.
The seventh monitoring period in May 2010 saw two additional dense coral stations move to BLUE status (DC-2, DC-13), due to partial coral mortality in these sites. While overall coral colony frequency did not decline markedly, live tissue-cover on many colonies, in particular the indicator species Porites harrisoni, showed declines. Overall live tissue cover on the reef declined from ~50% at baseline, to ~40% presently. This decline represents a stabilization of what was observed in the previous monitoring period, not a new decline. The likely reason is an accumulation of stresses from disease and sedimentation. Impacts were also observed in the seagrass community (SG-7 moved to RED status). Three sparse coral stations, SC-7, SC-12, SC-23, were elevated
Emirates Aluminium EMAL Project Environmental Update
503406 73 November 2011 - Final
to RED status in May 2010. The stations are however in close proximity to the construction footprint and the impact was not unexpected.
The eighth monitoring period in September 2010 coincided with a very hot summer with associated bleaching in many coral taxa. Construction activities during the monitoring had already ceased (since July) and observed stress was natural. At the time of the survey, bleaching had already abated, but diseases continued to decimate corals. The branching coral genus Acropora experienced an overall decline of about 50% for all colonies. Also, Porites harrisoni experienced, in many areas, about 25% reduction in live tissue cover. Most faviids had already regained normal colour and mortality was <10%. The natural impacts of the hot 2010 summer far exceeded those of the construction process. The reef remains vibrant and regeneration is expected. The bleaching event of summer 2010 was a natural phenomenon. Similar bleaching was reported from the Indian Ocean (Maldives), the western Pacific (Mariana Islands), and the Caribbean. It was a world-wide event and can therefore not be connected with the construction activities at Khalifa Port.
The ninth monitoring period in January 2011 allowed assessment of regeneration from the September 2010 bleaching event, as well as the previous mortality due to stress accumulation over the summer 2009 and winter 2009/10. No further decline in coral condition was observed, but clear regeneration both from the 2009 and 2010 events. Corals had fully recovered from the bleaching and the disease outbreak that had caused significant mortality in the genus Acropora had abated. Porites that had suffered from these diseases and from partial mortality in 2009 had arrested tissue die-back and continued tissue regeneration. Faviids had suffered the least through these events and had expanded in coverage and showed clear signs of active recruitment. Overall, the reef gave a healthy impression.
The 8-km Environmental Breakwater was fully functional as of May 2010 and was completely finished in September 2010. At the time of survey in January 2011, no impacts from the port, at which ore offloading for the aluminium smelter was already in action, were discerned. Monitoring at 85 video points and 40 photo-transect stations revealed that the GIS map product produced for TO 001 remained valid within the assigned monitoring area.
4.6 AMBIENT NOISE
EMAL environmental monitoring programme for the operational phase includes ambient noise monitoring at the site boundary and at sensitive receptor locations in the surrounding environment. The results obtained so far are presented hereafter.
Ambient noise monitoring carried out as part of the environmental management of Phase 1 construction activities is discussed in section 5.2.4.
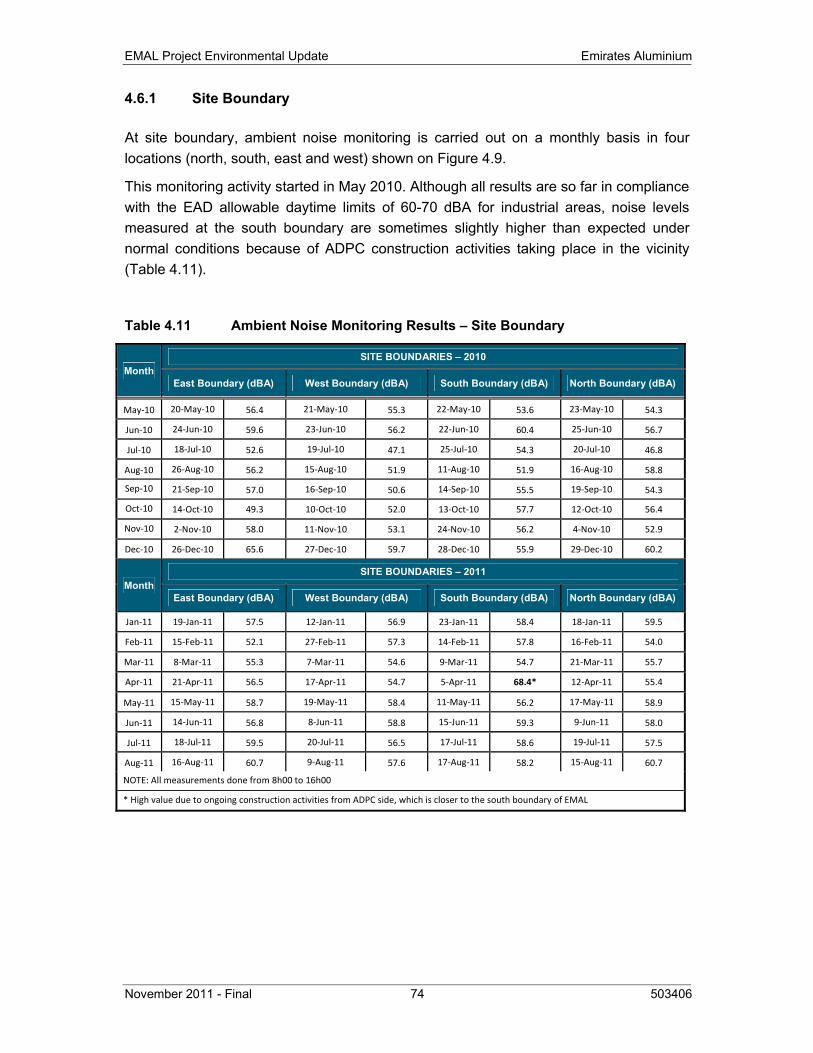
EMAL Project Environmental Update Emirates Aluminium
November 2011 - Final 74 503406
4.6.1 Site Boundary
At site boundary, ambient noise monitoring is carried out on a monthly basis in four locations (north, south, east and west) shown on Figure 4.9.
This monitoring activity started in May 2010. Although all results are so far in compliance with the EAD allowable daytime limits of 60-70 dBA for industrial areas, noise levels measured at the south boundary are sometimes slightly higher than expected under normal conditions because of ADPC construction activities taking place in the vicinity (Table 4.11).
Table 4.11 Ambient Noise Monitoring Results – Site Boundary
Month SITE BOUNDARIES – 2010
East Boundary (dBA) West Boundary (dBA) South Boundary (dBA) North Boundary (dBA)
May‐10 20‐May‐10 56.4 21‐May‐10 55.3 22‐May‐10 53.6 23‐May‐10 54.3
Jun‐10 24‐Jun‐10 59.6 23‐Jun‐10 56.2 22‐Jun‐10 60.4 25‐Jun‐10 56.7
Jul‐10 18‐Jul‐10 52.6 19‐Jul‐10 47.1 25‐Jul‐10 54.3 20‐Jul‐10 46.8
Aug‐10 26‐Aug‐10 56.2 15‐Aug‐10 51.9 11‐Aug‐10 51.9 16‐Aug‐10 58.8
Sep‐10 21‐Sep‐10 57.0 16‐Sep‐10 50.6 14‐Sep‐10 55.5 19‐Sep‐10 54.3
Oct‐10 14‐Oct‐10 49.3 10‐Oct‐10 52.0 13‐Oct‐10 57.7 12‐Oct‐10 56.4
Nov‐10 2‐Nov‐10 58.0 11‐Nov‐10 53.1 24‐Nov‐10 56.2 4‐Nov‐10 52.9
Dec‐10 26‐Dec‐10 65.6 27‐Dec‐10 59.7 28‐Dec‐10 55.9 29‐Dec‐10 60.2
Month SITE BOUNDARIES – 2011
East Boundary (dBA) West Boundary (dBA) South Boundary (dBA) North Boundary (dBA)
Jan‐11 19‐Jan‐11 57.5 12‐Jan‐11 56.9 23‐Jan‐11 58.4 18‐Jan‐11 59.5
Feb‐11 15‐Feb‐11 52.1 27‐Feb‐11 57.3 14‐Feb‐11 57.8 16‐Feb‐11 54.0
Mar‐11 8‐Mar‐11 55.3 7‐Mar‐11 54.6 9‐Mar‐11 54.7 21‐Mar‐11 55.7
Apr‐11 21‐Apr‐11 56.5 17‐Apr‐11 54.7 5‐Apr‐11 68.4* 12‐Apr‐11 55.4
May‐11 15‐May‐11 58.7 19‐May‐11 58.4 11‐May‐11 56.2 17‐May‐11 58.9
Jun‐11 14‐Jun‐11 56.8 8‐Jun‐11 58.8 15‐Jun‐11 59.3 9‐Jun‐11 58.0
Jul‐11 18‐Jul‐11 59.5 20‐Jul‐11 56.5 17‐Jul‐11 58.6 19‐Jul‐11 57.5
Aug‐11 16‐Aug‐11 60.7 9‐Aug‐11 57.6 17‐Aug‐11 58.2 15‐Aug‐11 60.7
NOTE: All measurements done from 8h00 to 16h00
* High value due to ongoing construction activities from ADPC side, which is closer to the south boundary of EMAL
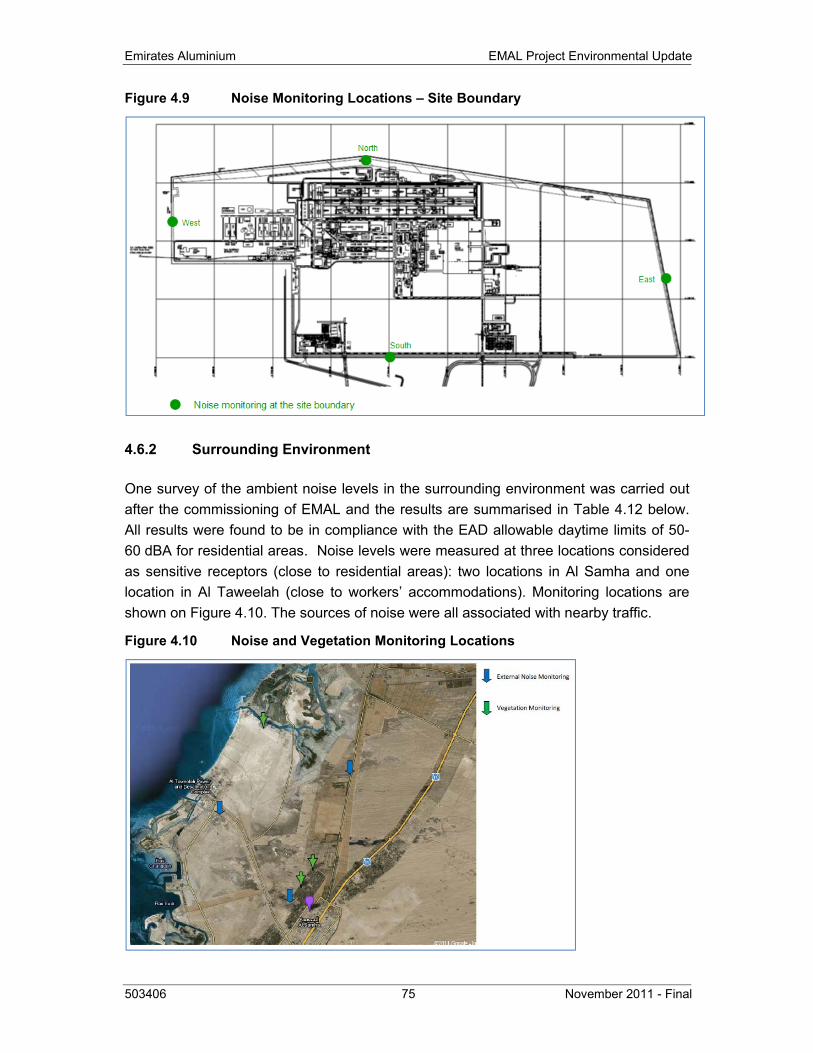
Emirates Aluminium EMAL Project Environmental Update
503406 75 November 2011 - Final
Figure 4.9 Noise Monitoring Locations – Site Boundary
4.6.2 Surrounding Environment
One survey of the ambient noise levels in the surrounding environment was carried out after the commissioning of EMAL and the results are summarised in Table 4.12 below. All results were found to be in compliance with the EAD allowable daytime limits of 50-60 dBA for residential areas. Noise levels were measured at three locations considered as sensitive receptors (close to residential areas): two locations in Al Samha and one location in Al Taweelah (close to workers’ accommodations). Monitoring locations are shown on Figure 4.10. The sources of noise were all associated with nearby traffic.
Figure 4.10 Noise and Vegetation Monitoring Locations
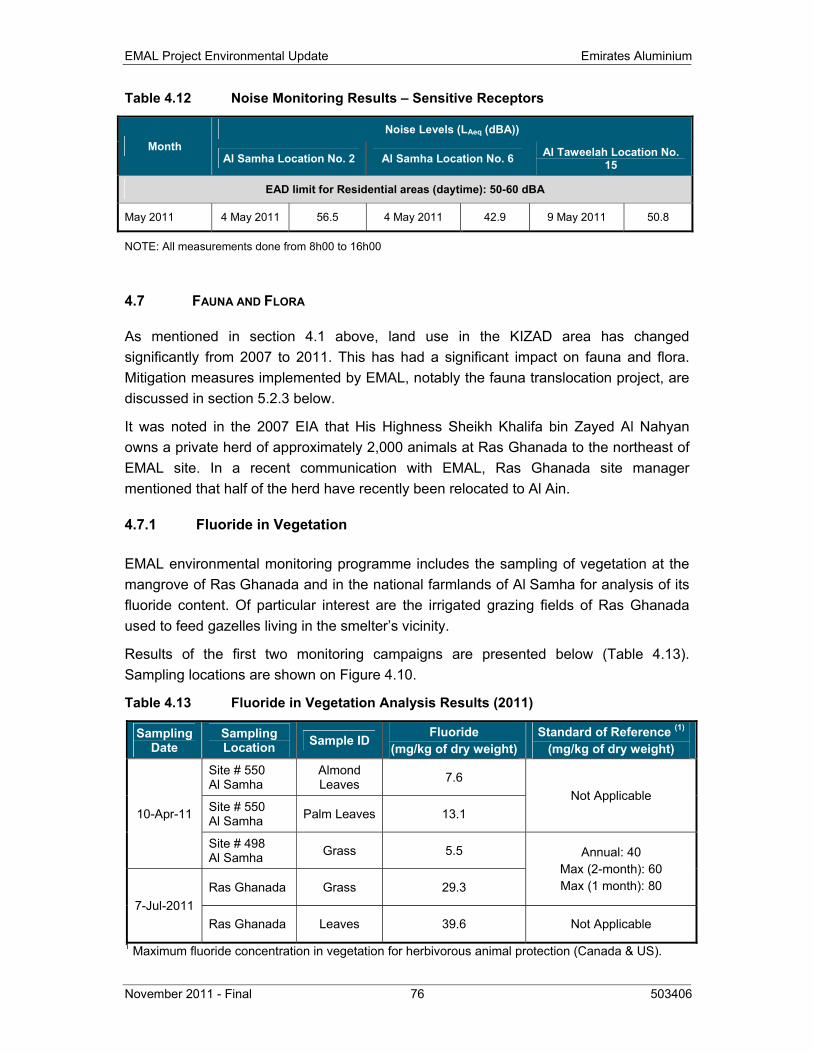
EMAL Project Environmental Update Emirates Aluminium
November 2011 - Final 76 503406
Table 4.12 Noise Monitoring Results – Sensitive Receptors
Month Noise Levels (LAeq (dBA))
Al Samha Location No. 2 Al Samha Location No. 6 Al Taweelah Location No. 15
EAD limit for Residential areas (daytime): 50-60 dBA
May 2011 4 May 2011 56.5 4 May 2011 42.9 9 May 2011 50.8
NOTE: All measurements done from 8h00 to 16h00
4.7 FAUNA AND FLORA
As mentioned in section 4.1 above, land use in the KIZAD area has changed significantly from 2007 to 2011. This has had a significant impact on fauna and flora. Mitigation measures implemented by EMAL, notably the fauna translocation project, are discussed in section 5.2.3 below.
It was noted in the 2007 EIA that His Highness Sheikh Khalifa bin Zayed Al Nahyan owns a private herd of approximately 2,000 animals at Ras Ghanada to the northeast of EMAL site. In a recent communication with EMAL, Ras Ghanada site manager mentioned that half of the herd have recently been relocated to Al Ain.
4.7.1 Fluoride in Vegetation
EMAL environmental monitoring programme includes the sampling of vegetation at the mangrove of Ras Ghanada and in the national farmlands of Al Samha for analysis of its fluoride content. Of particular interest are the irrigated grazing fields of Ras Ghanada used to feed gazelles living in the smelter’s vicinity.
Results of the first two monitoring campaigns are presented below (Table 4.13). Sampling locations are shown on Figure 4.10.
Table 4.13 Fluoride in Vegetation Analysis Results (2011)
Sampling Date
Sampling Location Sample ID Fluoride
(mg/kg of dry weight) Standard of Reference (1)
(mg/kg of dry weight)
10-Apr-11
Site # 550 Al Samha
Almond Leaves 7.6
Not Applicable Site # 550 Al Samha Palm Leaves 13.1
Site # 498 Al Samha Grass 5.5 Annual: 40
Max (2-month): 60 Max (1 month): 80
7-Jul-2011 Ras Ghanada Grass 29.3
Ras Ghanada Leaves 39.6 Not Applicable 1 Maximum fluoride concentration in vegetation for herbivorous animal protection (Canada & US).
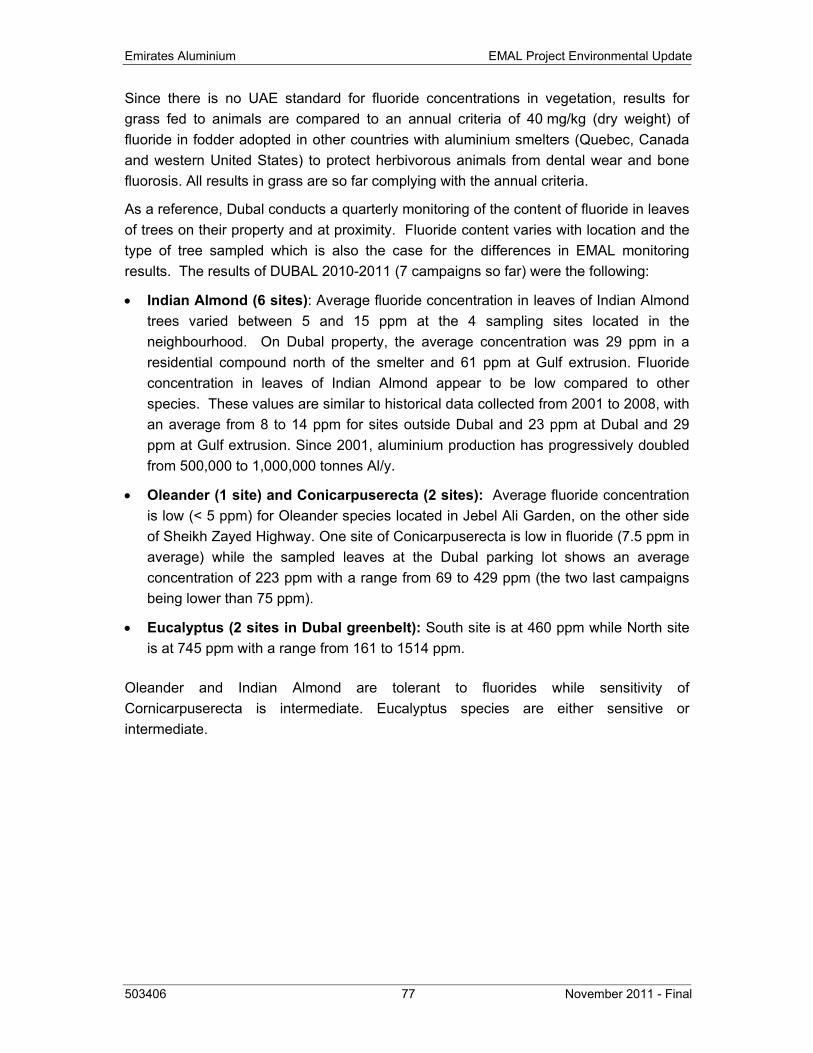
Emirates Aluminium EMAL Project Environmental Update
503406 77 November 2011 - Final
Since there is no UAE standard for fluoride concentrations in vegetation, results for grass fed to animals are compared to an annual criteria of 40 mg/kg (dry weight) of fluoride in fodder adopted in other countries with aluminium smelters (Quebec, Canada and western United States) to protect herbivorous animals from dental wear and bone fluorosis. All results in grass are so far complying with the annual criteria.
As a reference, Dubal conducts a quarterly monitoring of the content of fluoride in leaves of trees on their property and at proximity. Fluoride content varies with location and the type of tree sampled which is also the case for the differences in EMAL monitoring results. The results of DUBAL 2010-2011 (7 campaigns so far) were the following:
• Indian Almond (6 sites): Average fluoride concentration in leaves of Indian Almond trees varied between 5 and 15 ppm at the 4 sampling sites located in the neighbourhood. On Dubal property, the average concentration was 29 ppm in a residential compound north of the smelter and 61 ppm at Gulf extrusion. Fluoride concentration in leaves of Indian Almond appear to be low compared to other species. These values are similar to historical data collected from 2001 to 2008, with an average from 8 to 14 ppm for sites outside Dubal and 23 ppm at Dubal and 29 ppm at Gulf extrusion. Since 2001, aluminium production has progressively doubled from 500,000 to 1,000,000 tonnes Al/y.
• Oleander (1 site) and Conicarpuserecta (2 sites): Average fluoride concentration is low (< 5 ppm) for Oleander species located in Jebel Ali Garden, on the other side of Sheikh Zayed Highway. One site of Conicarpuserecta is low in fluoride (7.5 ppm in average) while the sampled leaves at the Dubal parking lot shows an average concentration of 223 ppm with a range from 69 to 429 ppm (the two last campaigns being lower than 75 ppm).
• Eucalyptus (2 sites in Dubal greenbelt): South site is at 460 ppm while North site is at 745 ppm with a range from 161 to 1514 ppm.
Oleander and Indian Almond are tolerant to fluorides while sensitivity of Cornicarpuserecta is intermediate. Eucalyptus species are either sensitive or intermediate.
EMAL Project Environmental Update Emirates Aluminium
November 2011 - Final 78 503406
5 DESCRIPTION AND ASSESSMENT OF ENVIRONMENTAL IMPACTS
5.1 METHODOLOGY
The Report follows the same environmental impact assessment methodology that was used in the 2007 EIA (refer to 2007 EIA Volume 1, chapter 5).
For the impacts associated with the construction phase, the Report addresses the impacts associated with Phase 2 only, based on environmental data gathered during the construction of Phase 1. For the impacts associated with operation activities, both Phases are considered.
5.2 CONSTRUCTION PHASE
The environmental impacts associated with the construction phase are described and assessed based on the impacts of Phase 1 construction activities documented by the Phase 1 Engineering, Procurement and Construction Management (EPCM) contractor (SNC-Lavalin/Worley Parsons - SLWP) from 2007 to 2011. The impacts are compared with those that were foreseen in the 2007 EIA for both phases. It is to be noted that social impacts have not been included.
5.2.1 Ambient Air Quality
The main atmospheric emissions that can have an impact on air quality during the construction phase are the following:
• Dust emissions
• Exhaust emission
5.2.1.1 Dust Emissions
Sources of dust during the construction of Phase 2 include vehicle traffic on unpaved roads and raw material handling at the concrete batch plant. The site preparation activities such as earthmoving, backfilling and grading were the main sources of dust during Phase 1 construction. These activities will continue at a reduced pace as some of the earthworks were completed as part of Phase 1 and will thus represent a more limited source of dust during the construction of Phase 2.
During the construction of Phase 1, dust (PM10) levels in ambient air quality have been periodically sampled over 24-hr using one of the following methods:
• High-volume sampler: carried out by a third party (an EAD-accredited laboratory)
• Laser photometer (DustTrackTM II Aerosol Monitor): carried out by SLWP
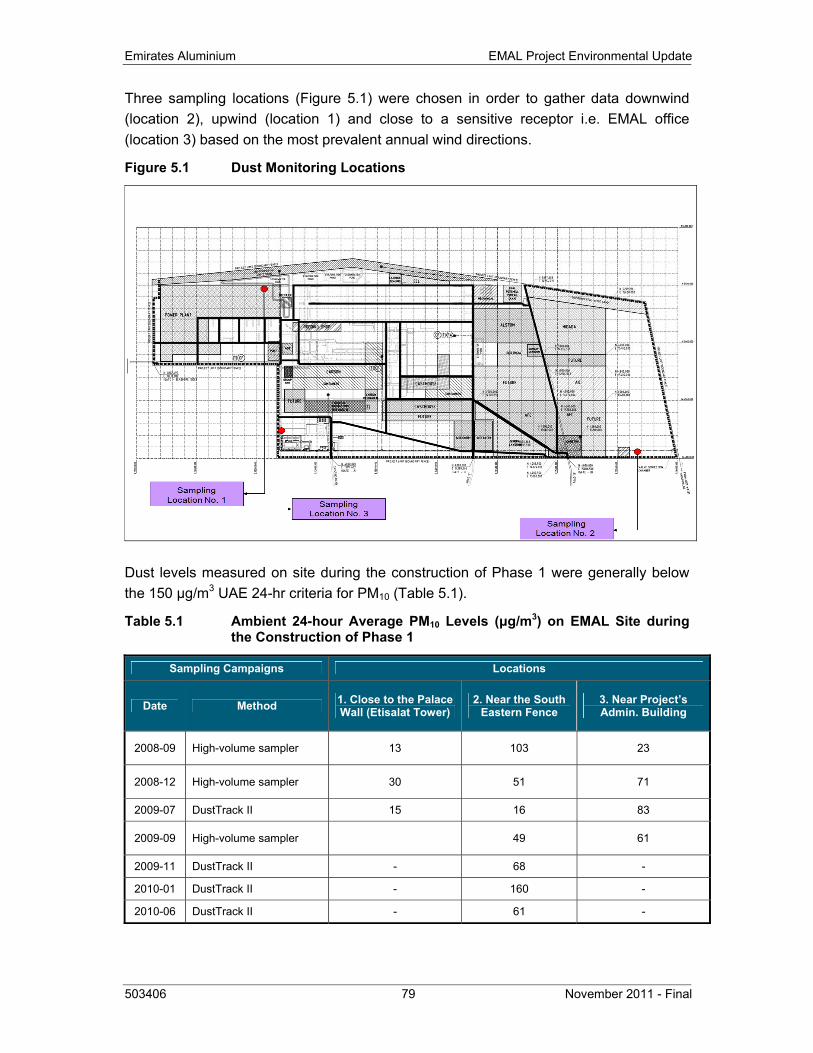
Emirates Aluminium EMAL Project Environmental Update
503406 79 November 2011 - Final
Three sampling locations (Figure 5.1) were chosen in order to gather data downwind (location 2), upwind (location 1) and close to a sensitive receptor i.e. EMAL office (location 3) based on the most prevalent annual wind directions.
Figure 5.1 Dust Monitoring Locations
Dust levels measured on site during the construction of Phase 1 were generally below the 150 μg/m3 UAE 24-hr criteria for PM10 (Table 5.1).
Table 5.1 Ambient 24-hour Average PM10 Levels (μg/m3) on EMAL Site during the Construction of Phase 1
Sampling Campaigns Locations
Date Method 1. Close to the Palace Wall (Etisalat Tower)
2. Near the South Eastern Fence
3. Near Project’s Admin. Building
2008-09 High-volume sampler 13 103 23
2008-12 High-volume sampler 30 51 71
2009-07 DustTrack II 15 16 83
2009-09 High-volume sampler 49 61
2009-11 DustTrack II - 68 -
2010-01 DustTrack II - 160 -
2010-06 DustTrack II - 61 -
EMAL Project Environmental Update Emirates Aluminium
November 2011 - Final 80 503406
The only measure exceeding the criteria (160 μg/m3 at site 2) was associated with wind speed in excess of 30 km/hr for most of the sampling period. It is to be noted that because of climatic factors and land use in the area, ambient dust levels tend to be high (refer to 2007 EIA - Volume 1, chapter 4). Dust levels measured at EMAL permanent ambient air quality monitoring station located in Al Samha are frequently higher than the UAE criteria for PM10.
Dust mitigation measures listed in EMAL Construction Environmental Management Plan (CEMP) include:
• On-site perimeter asphalt roads
• Dust suppression (water spraying) on unpaved roads
• Use of tarpaulins to cover truck loads (as per the municipality requirements)
• Keeping the drop height of loaders as low as possible when handling dusty material
5.2.1.2 Batch Plant Fugitive Emissions
Fugitive emissions from the batch plant were estimated by using the US EPA AP-42 Emission Factors (updated August 2011) and the estimated amount of concrete that will be required for Phase 2 (310,000 m3). All the emission sources listed in AP-42 were taken into consideration into the analysis including:
• Aggregate transfer
• Sand transfer
• Cement unloading to elevated storage silo (pneumatic)
• Cement supplement unloading to elevated storage silo (pneumatic)
• Weigh hopper loading
• Mixer loading (central mix)
Emissions from aggregate and sand transfer as well as from weigh hopper loading are controlled at the batch plant. As emission factors are only available for uncontrolled sources, these sources are not considered in the estimate. The estimated fugitive emissions related to the controlled sources of concrete batching will be approximately 21 tonnes of PM over two years, in which 4 tonnes a year will be emitted as PM10. This level will be less than 0.5% of the annual PM10 levels emitted by the smelter. Dust levels taken downwind of batch plants during Phase 1 (Site 2 in Table 5.1) showed that concrete batching does not lead, by itself, to exceedances of EAD ambient air standards.
During Phase 1, the last three mitigation measures detailed below were implemented at the batch plant to minimize emissions of fugitive dust and reduce ambient PM10 levels
Emirates Aluminium EMAL Project Environmental Update
503406 81 November 2011 - Final
after a 24-h concentration of 103 μg/m3 was recorded downwind of batch plant in September 2011.
• Sand and aggregates to be stored in hoppers or bunkers which shield the materials from winds
• Enclosed aggregate/sand conveyors at the batch plant
• Use of curtains for the transfer point between loader and conveyor
• Use of cement bulkers with tight blower systems to transfer the cementitious materials from the truck to the elevated silos
Considering that the above-mentioned mitigation measures implemented in Phase 1 will be maintained for Phase 2 and the PM10 levels regularly below 50% of the EAD 24-h standard (150 µg/m3) downwind of EMAL batch plants, their impact on air quality is considered negligible.
5.2.1.3 Exhaust Emissions
Any stationary equipment (e.g. compressors, electricity generators, etc.), mobile equipment (e.g. cranes, loaders, graders etc) and vehicles (e.g. transport trucks, buses and cars) equipped with diesel or gasoline engines will generate air pollutants such as nitrogen oxides (NOx), carbon monoxide (CO), carbon dioxide (CO2), sulphur dioxide (SO2), particulate matter (PM10) and hydrocarbons (often expressed as non methane volatile organic compounds).
During the construction of Phase 1, SLWP recorded the consumptions of diesel from its own use as well as the contractors. From 2007 to December 2010, a total of approximately 32 million litres of diesel was consumed by machinery and generators on site. Taking into account the magnitude of the works planned for Phase 2, a total of 21 million litres can be expected to be consumed for construction of Phase 2. By using IPPC (1996) emission factors estimated for European non-road mobile sources and machinery, the total amounts of air pollutants likely to be generated for non-road equipment during Phase 2 were estimated and presented in Table 5.2.
Road vehicles were excluded from the calculations given the difficulty to keep track of fuel consumptions of every car, bus or truck entering or leaving site. The emissions presented in this table are the global emissions estimated for Phase 2 on-site construction activities over the total duration of Phase 2 (~2.5 years). These emissions are not significant and the impact on air quality is expected to remain very low.
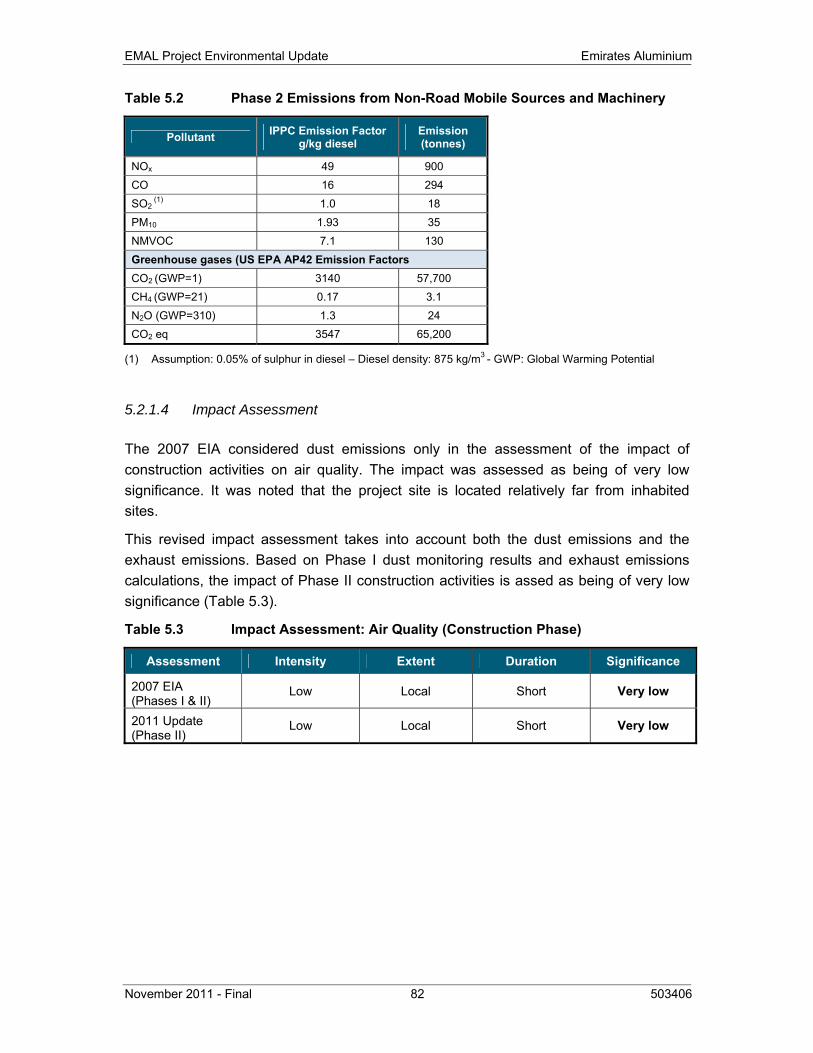
EMAL Project Environmental Update Emirates Aluminium
November 2011 - Final 82 503406
Table 5.2 Phase 2 Emissions from Non-Road Mobile Sources and Machinery
Pollutant IPPC Emission Factor g/kg diesel
Emission (tonnes)
NOx 49 900 CO 16 294 SO2
(1) 1.0 18 PM10
1.93 35 NMVOC 7.1 130 Greenhouse gases (US EPA AP42 Emission Factors CO2 (GWP=1) 3140 57,700 CH4 (GWP=21) 0.17 3.1 N2O (GWP=310) 1.3 24 CO2 eq 3547 65,200
(1) Assumption: 0.05% of sulphur in diesel – Diesel density: 875 kg/m3 - GWP: Global Warming Potential
5.2.1.4 Impact Assessment
The 2007 EIA considered dust emissions only in the assessment of the impact of construction activities on air quality. The impact was assessed as being of very low significance. It was noted that the project site is located relatively far from inhabited sites.
This revised impact assessment takes into account both the dust emissions and the exhaust emissions. Based on Phase I dust monitoring results and exhaust emissions calculations, the impact of Phase II construction activities is assed as being of very low significance (Table 5.3).
Table 5.3 Impact Assessment: Air Quality (Construction Phase)
Assessment Intensity Extent Duration Significance
2007 EIA (Phases I & II)
Low Local Short Very low
2011 Update (Phase II)
Low Local Short Very low
Emirates Aluminium EMAL Project Environmental Update
503406 83 November 2011 - Final
5.2.2 Water and Soil Quality
The 2007 EIA identified the following potential sources of impact on water (groundwater and/or seawater) and soil quality during the construction of the smelter complex:
• Stormwater run-off with elevated suspended solids
• Dewatering activities
• Spill of contaminants (e.g. lubricants, fuel, oil, chemicals)
• Waste storage (e.g. sewage, hazardous waste)
Stormwater
During the construction of Phase 1, stormwater run-off had not been identified as a source of impact on seawater quality. This is due to rain paucity and to the fact that EMAL site is not directly adjacent to the sea.
Dewatering
Dewatering took place on EMAL site from November 2008 until it ceased on 1 April 2010. During the construction of Phase 1, the volume of water to be removed from various excavations precluded practical disposal via the conventional method of infiltration and evaporation from the surface. Therefore, EAD approval was sought to direct this groundwater to the marine environment which is close to the western fence of the project property line. The quantity of groundwater that was directed to the sea was approximately 1,000 m3/hr at the peak of the dewatering. This flow rate later on reduced considerably. The EAD approval included three specific conditions:
• Ensure that the dewatering equipment including pipes is installed in the right manner to avoid water leakage.
• The water shall be directed first to the settling tanks to ensure that the concentration of total suspended solids (TSS <50 mg/l) and turbidity (<75 NTU) are within the authorized limits as mentioned in the environmental regulations. If in any case the abovementioned limits increase, the pumping shall cease immediately and the water shall be pretreated to meet the limits.
• The pumping of water to the marine environment shall be at an optimum rate where the output from the pipes does not disturb the receiving environment and the sediments get enough time to settle thereby reducing the turbidity caused by the water flow.
In order to meet the EAD specific permit requirements, strict measures were put in place by SLWP, including:
EMAL Project Environmental Update Emirates Aluminium
November 2011 - Final 84 503406
• Complete analysis of the marine water close to the discharge point (April 2009) to ensure that the project’s discharge was not causing any damage to the receiving environment (cf. Table 5.4)
• Regular inspections of the water discharge hoses to check for any leaks/disruption of water transfer
• Daily analysis of the water samples to check for the turbidity from May 2009. Most of the daily values were below 2 NTU units with occasional excursions between 2 and 3 NTU (maximum: 3.4).
• Provision for extra holding capacity in case the discharges had to be held on site for pre-treatment and
• Provision for the control of the flow rate of the dewatered groundwater to the marine environment in case there was any sudden surges in the groundwater abstraction.
During the first six months of dewatering, weekly monitoring of TSS was done and results ranged from 10 to 21 mg/l. In May 2009, this program was changed, with the EAD approval, to daily analysis of turbidity.
Two single values exceeded applicable guidelines: manganese was twice as the EAD limit on the 2nd campaign but not detectable a week after. COD levels doubled from March 25 to March 31, over the IFC limit of 50 mg/l.
COD levels were high the same day that TDS levels were unusually higher than seawater background (66,800 versus 40-45,000 mg/l). Chloride levels may have interfered in the analysis. Low COD concentrations (< 50 mg/l) should be analysed by titrating a solution of mercuric sulphate on the basis of a weight ratio of 10:1, HgSO4:Cl¯ to eliminate chloride interference, using the amount of Cl¯ present in the original volume of sample (5220 B – Open Reflux Method - Chemical oxygen Demand). If groundwater must be dewatered in Phase 2, concentrations of chloride and sodium will be added to the list of parameters and special care will be taken for chloride interference for the analysis of COD.
During the first months of dewatering, there was a concern that the seabed was disturbed by the dewatering flow and causing turbidity. This situation was resolved by connecting the end of the discharge hoses to steel pipes kept in place by barrels. This setting enabled the water to be discharged at approximately 50 to 70 cm above the seabed thereby curtailing any disturbances that may add to the ambient turbidity and sedimentation levels.
Based on monitoring data gathered by SLWP, there is no evidence that Phase 1 dewatering activities have constituted a significant source of impact on seawater quality.
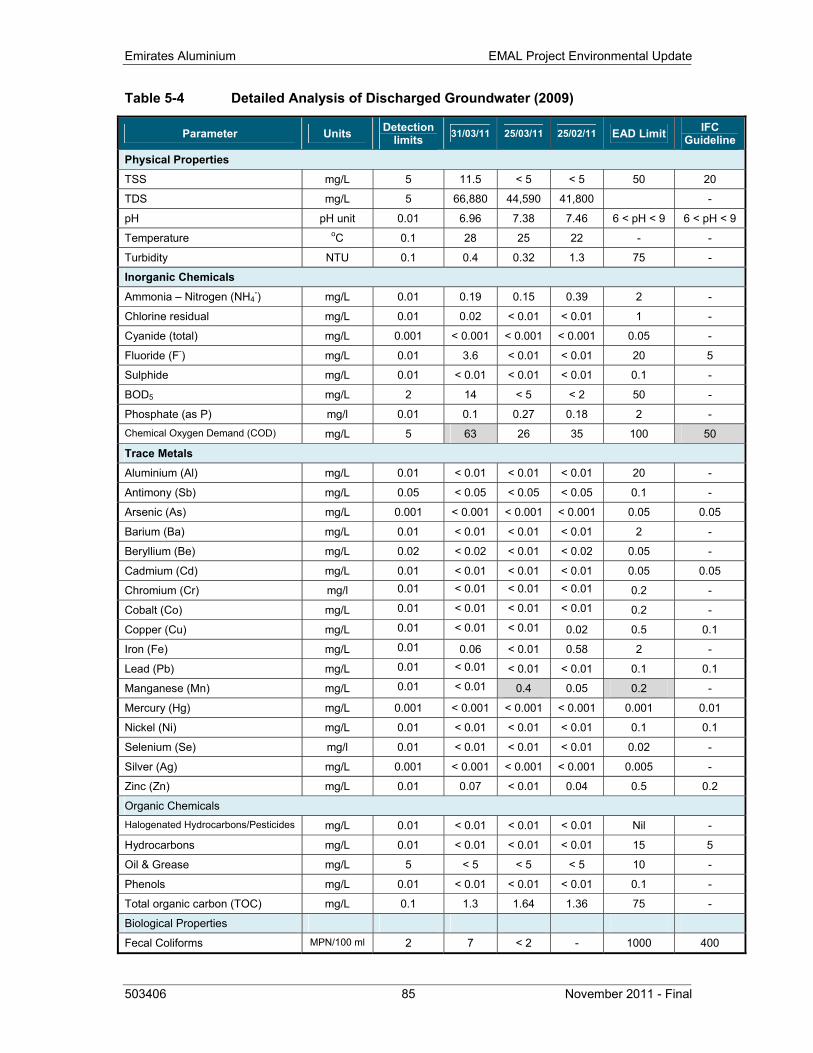
Emirates Aluminium EMAL Project Environmental Update
503406 85 November 2011 - Final
Table 5-4 Detailed Analysis of Discharged Groundwater (2009)
Parameter Units Detection limits 31/03/11 25/03/11 25/02/11 EAD Limit IFC
Guideline
Physical Properties
TSS mg/L 5 11.5 < 5 < 5 50 20
TDS mg/L 5 66,880 44,590 41,800 -
pH pH unit 0.01 6.96 7.38 7.46 6 < pH < 9 6 < pH < 9
Temperature oC 0.1 28 25 22 - -
Turbidity NTU 0.1 0.4 0.32 1.3 75 -
Inorganic Chemicals
Ammonia – Nitrogen (NH4-) mg/L 0.01 0.19 0.15 0.39 2 -
Chlorine residual mg/L 0.01 0.02 < 0.01 < 0.01 1 -
Cyanide (total) mg/L 0.001 < 0.001 < 0.001 < 0.001 0.05 -
Fluoride (F-) mg/L 0.01 3.6 < 0.01 < 0.01 20 5
Sulphide mg/L 0.01 < 0.01 < 0.01 < 0.01 0.1 -
BOD5 mg/L 2 14 < 5 < 2 50 -
Phosphate (as P) mg/l 0.01 0.1 0.27 0.18 2 - Chemical Oxygen Demand (COD) mg/L 5 63 26 35 100 50
Trace Metals
Aluminium (Al) mg/L 0.01 < 0.01 < 0.01 < 0.01 20 -
Antimony (Sb) mg/L 0.05 < 0.05 < 0.05 < 0.05 0.1 -
Arsenic (As) mg/L 0.001 < 0.001 < 0.001 < 0.001 0.05 0.05
Barium (Ba) mg/L 0.01 < 0.01 < 0.01 < 0.01 2 -
Beryllium (Be) mg/L 0.02 < 0.02 < 0.01 < 0.02 0.05 -
Cadmium (Cd) mg/L 0.01 < 0.01 < 0.01 < 0.01 0.05 0.05
Chromium (Cr) mg/l 0.01 < 0.01 < 0.01 < 0.01 0.2 -
Cobalt (Co) mg/L 0.01 < 0.01 < 0.01 < 0.01 0.2 -
Copper (Cu) mg/L 0.01 < 0.01 < 0.01 0.02 0.5 0.1
Iron (Fe) mg/L 0.01 0.06 < 0.01 0.58 2 -
Lead (Pb) mg/L 0.01 < 0.01 < 0.01 < 0.01 0.1 0.1
Manganese (Mn) mg/L 0.01 < 0.01 0.4 0.05 0.2 -
Mercury (Hg) mg/L 0.001 < 0.001 < 0.001 < 0.001 0.001 0.01
Nickel (Ni) mg/L 0.01 < 0.01 < 0.01 < 0.01 0.1 0.1
Selenium (Se) mg/l 0.01 < 0.01 < 0.01 < 0.01 0.02 -
Silver (Ag) mg/L 0.001 < 0.001 < 0.001 < 0.001 0.005 -
Zinc (Zn) mg/L 0.01 0.07 < 0.01 0.04 0.5 0.2
Organic Chemicals Halogenated Hydrocarbons/Pesticides mg/L 0.01 < 0.01 < 0.01 < 0.01 Nil -
Hydrocarbons mg/L 0.01 < 0.01 < 0.01 < 0.01 15 5
Oil & Grease mg/L 5 < 5 < 5 < 5 10 -
Phenols mg/L 0.01 < 0.01 < 0.01 < 0.01 0.1 -
Total organic carbon (TOC) mg/L 0.1 1.3 1.64 1.36 75 -
Biological Properties
Fecal Coliforms MPN/100 ml 2 7 < 2 - 1000 400
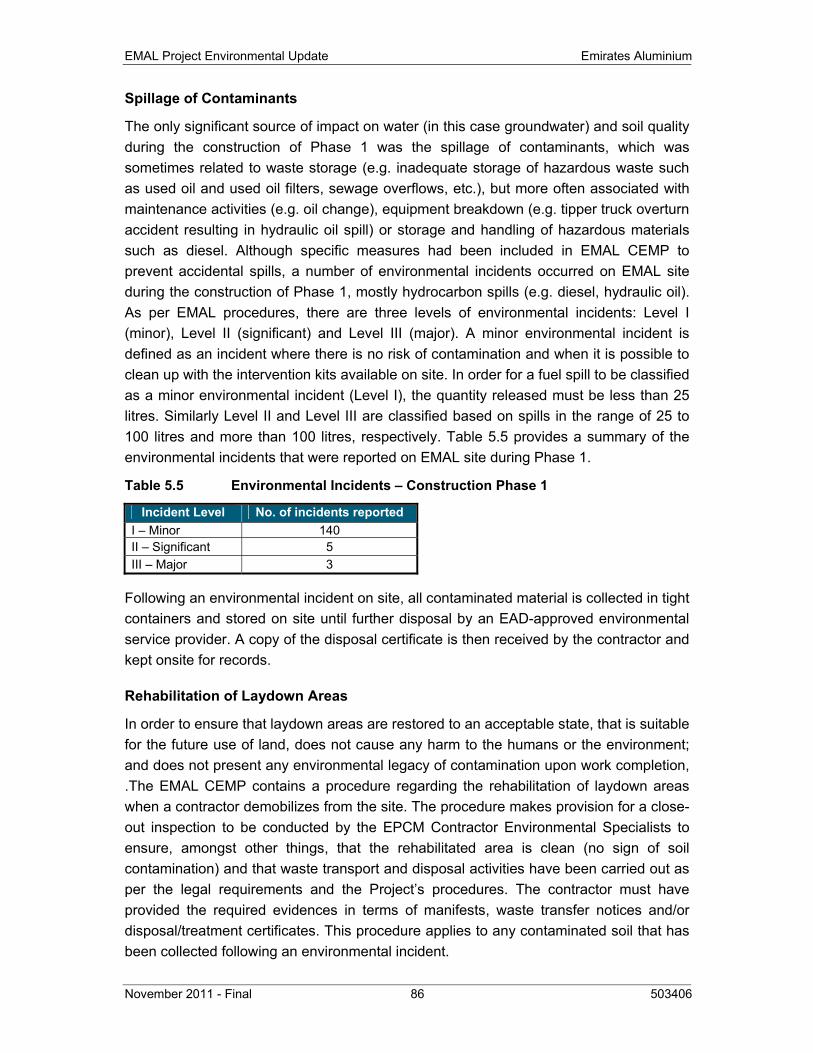
EMAL Project Environmental Update Emirates Aluminium
November 2011 - Final 86 503406
Spillage of Contaminants
The only significant source of impact on water (in this case groundwater) and soil quality during the construction of Phase 1 was the spillage of contaminants, which was sometimes related to waste storage (e.g. inadequate storage of hazardous waste such as used oil and used oil filters, sewage overflows, etc.), but more often associated with maintenance activities (e.g. oil change), equipment breakdown (e.g. tipper truck overturn accident resulting in hydraulic oil spill) or storage and handling of hazardous materials such as diesel. Although specific measures had been included in EMAL CEMP to prevent accidental spills, a number of environmental incidents occurred on EMAL site during the construction of Phase 1, mostly hydrocarbon spills (e.g. diesel, hydraulic oil). As per EMAL procedures, there are three levels of environmental incidents: Level I (minor), Level II (significant) and Level III (major). A minor environmental incident is defined as an incident where there is no risk of contamination and when it is possible to clean up with the intervention kits available on site. In order for a fuel spill to be classified as a minor environmental incident (Level I), the quantity released must be less than 25 litres. Similarly Level II and Level III are classified based on spills in the range of 25 to 100 litres and more than 100 litres, respectively. Table 5.5 provides a summary of the environmental incidents that were reported on EMAL site during Phase 1.
Table 5.5 Environmental Incidents – Construction Phase 1
Incident Level No. of incidents reportedI – Minor 140 II – Significant 5 III – Major 3
Following an environmental incident on site, all contaminated material is collected in tight containers and stored on site until further disposal by an EAD-approved environmental service provider. A copy of the disposal certificate is then received by the contractor and kept onsite for records.
Rehabilitation of Laydown Areas
In order to ensure that laydown areas are restored to an acceptable state, that is suitable for the future use of land, does not cause any harm to the humans or the environment; and does not present any environmental legacy of contamination upon work completion, .The EMAL CEMP contains a procedure regarding the rehabilitation of laydown areas when a contractor demobilizes from the site. The procedure makes provision for a close-out inspection to be conducted by the EPCM Contractor Environmental Specialists to ensure, amongst other things, that the rehabilitated area is clean (no sign of soil contamination) and that waste transport and disposal activities have been carried out as per the legal requirements and the Project’s procedures. The contractor must have provided the required evidences in terms of manifests, waste transfer notices and/or disposal/treatment certificates. This procedure applies to any contaminated soil that has been collected following an environmental incident.
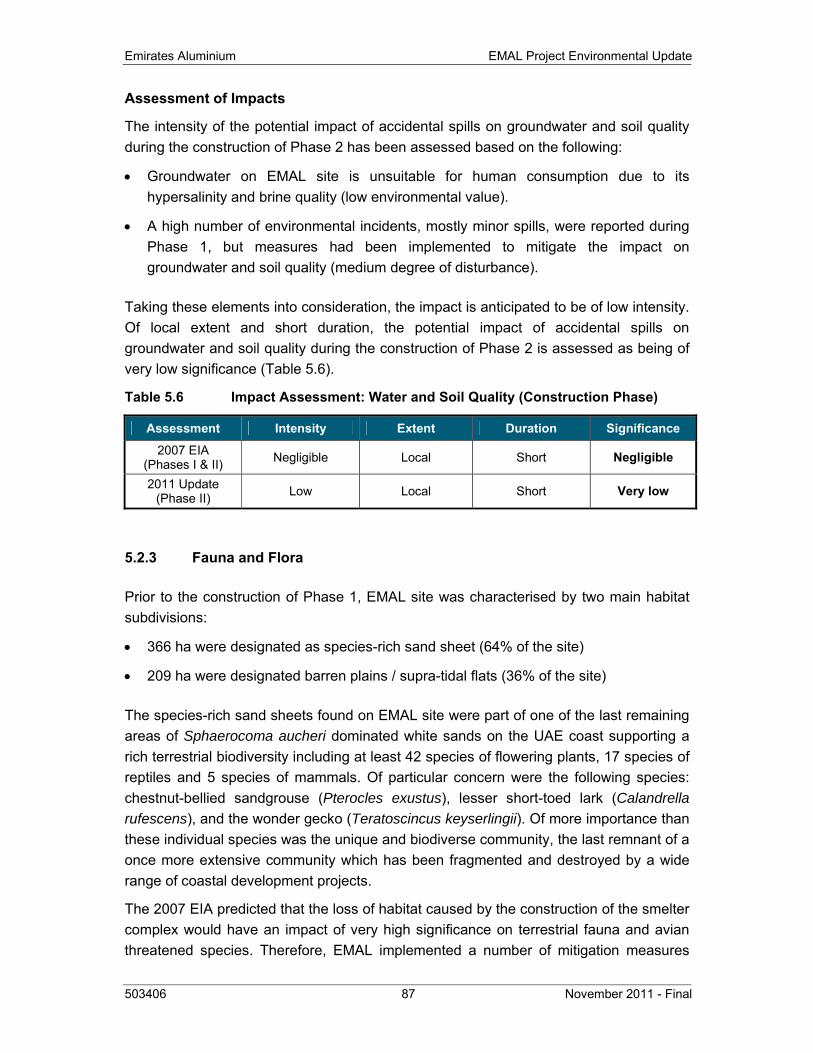
Emirates Aluminium EMAL Project Environmental Update
503406 87 November 2011 - Final
Assessment of Impacts
The intensity of the potential impact of accidental spills on groundwater and soil quality during the construction of Phase 2 has been assessed based on the following:
• Groundwater on EMAL site is unsuitable for human consumption due to its hypersalinity and brine quality (low environmental value).
• A high number of environmental incidents, mostly minor spills, were reported during Phase 1, but measures had been implemented to mitigate the impact on groundwater and soil quality (medium degree of disturbance).
Taking these elements into consideration, the impact is anticipated to be of low intensity. Of local extent and short duration, the potential impact of accidental spills on groundwater and soil quality during the construction of Phase 2 is assessed as being of very low significance (Table 5.6).
Table 5.6 Impact Assessment: Water and Soil Quality (Construction Phase)
Assessment Intensity Extent Duration Significance
2007 EIA (Phases I & II) Negligible Local Short Negligible
2011 Update (Phase II) Low Local Short Very low
5.2.3 Fauna and Flora
Prior to the construction of Phase 1, EMAL site was characterised by two main habitat subdivisions:
• 366 ha were designated as species-rich sand sheet (64% of the site)
• 209 ha were designated barren plains / supra-tidal flats (36% of the site)
The species-rich sand sheets found on EMAL site were part of one of the last remaining areas of Sphaerocoma aucheri dominated white sands on the UAE coast supporting a rich terrestrial biodiversity including at least 42 species of flowering plants, 17 species of reptiles and 5 species of mammals. Of particular concern were the following species: chestnut-bellied sandgrouse (Pterocles exustus), lesser short-toed lark (Calandrella rufescens), and the wonder gecko (Teratoscincus keyserlingii). Of more importance than these individual species was the unique and biodiverse community, the last remnant of a once more extensive community which has been fragmented and destroyed by a wide range of coastal development projects.
The 2007 EIA predicted that the loss of habitat caused by the construction of the smelter complex would have an impact of very high significance on terrestrial fauna and avian threatened species. Therefore, EMAL implemented a number of mitigation measures
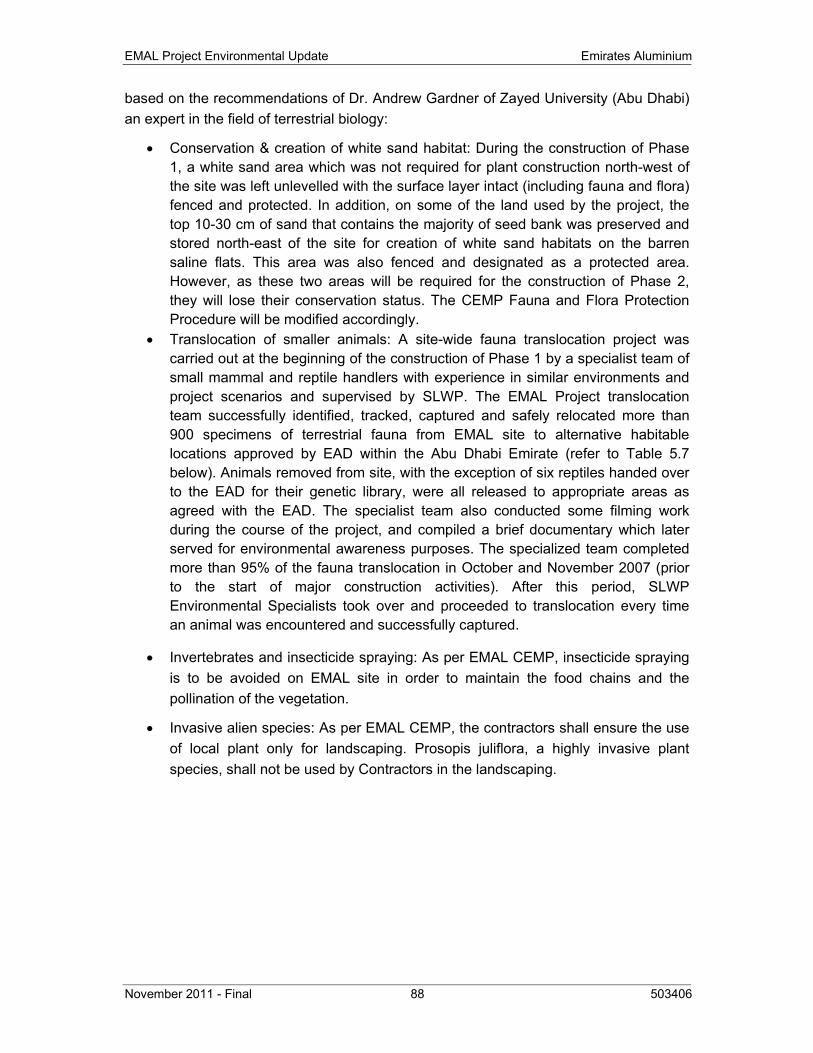
EMAL Project Environmental Update Emirates Aluminium
November 2011 - Final 88 503406
based on the recommendations of Dr. Andrew Gardner of Zayed University (Abu Dhabi) an expert in the field of terrestrial biology:
• Conservation & creation of white sand habitat: During the construction of Phase 1, a white sand area which was not required for plant construction north-west of the site was left unlevelled with the surface layer intact (including fauna and flora) fenced and protected. In addition, on some of the land used by the project, the top 10-30 cm of sand that contains the majority of seed bank was preserved and stored north-east of the site for creation of white sand habitats on the barren saline flats. This area was also fenced and designated as a protected area. However, as these two areas will be required for the construction of Phase 2, they will lose their conservation status. The CEMP Fauna and Flora Protection Procedure will be modified accordingly.
• Translocation of smaller animals: A site-wide fauna translocation project was carried out at the beginning of the construction of Phase 1 by a specialist team of small mammal and reptile handlers with experience in similar environments and project scenarios and supervised by SLWP. The EMAL Project translocation team successfully identified, tracked, captured and safely relocated more than 900 specimens of terrestrial fauna from EMAL site to alternative habitable locations approved by EAD within the Abu Dhabi Emirate (refer to Table 5.7 below). Animals removed from site, with the exception of six reptiles handed over to the EAD for their genetic library, were all released to appropriate areas as agreed with the EAD. The specialist team also conducted some filming work during the course of the project, and compiled a brief documentary which later served for environmental awareness purposes. The specialized team completed more than 95% of the fauna translocation in October and November 2007 (prior to the start of major construction activities). After this period, SLWP Environmental Specialists took over and proceeded to translocation every time an animal was encountered and successfully captured.
• Invertebrates and insecticide spraying: As per EMAL CEMP, insecticide spraying is to be avoided on EMAL site in order to maintain the food chains and the pollination of the vegetation.
• Invasive alien species: As per EMAL CEMP, the contractors shall ensure the use of local plant only for landscaping. Prosopis juliflora, a highly invasive plant species, shall not be used by Contractors in the landscaping.
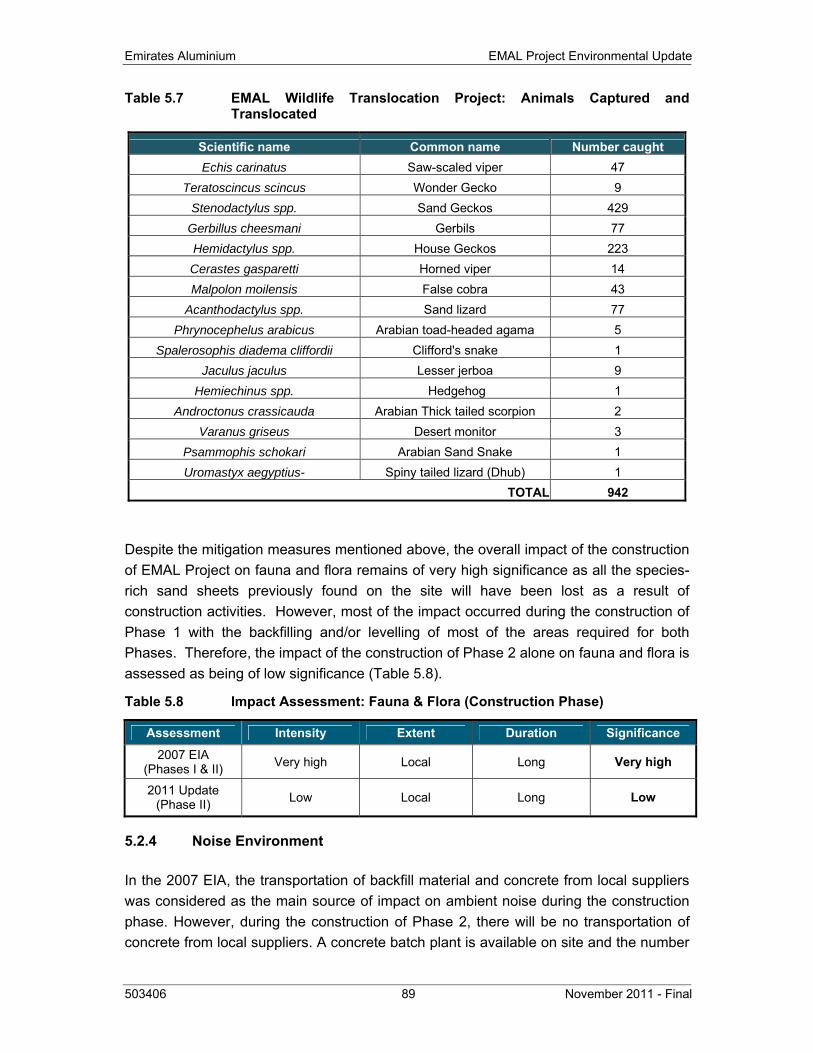
Emirates Aluminium EMAL Project Environmental Update
503406 89 November 2011 - Final
Table 5.7 EMAL Wildlife Translocation Project: Animals Captured and Translocated
Scientific name Common name Number caught Echis carinatus Saw-scaled viper 47
Teratoscincus scincus Wonder Gecko 9 Stenodactylus spp. Sand Geckos 429
Gerbillus cheesmani Gerbils 77 Hemidactylus spp. House Geckos 223 Cerastes gasparetti Horned viper 14 Malpolon moilensis False cobra 43
Acanthodactylus spp. Sand lizard 77 Phrynocephelus arabicus Arabian toad-headed agama 5
Spalerosophis diadema cliffordii Clifford's snake 1 Jaculus jaculus Lesser jerboa 9
Hemiechinus spp. Hedgehog 1 Androctonus crassicauda Arabian Thick tailed scorpion 2
Varanus griseus Desert monitor 3 Psammophis schokari Arabian Sand Snake 1 Uromastyx aegyptius- Spiny tailed lizard (Dhub) 1
TOTAL 942
Despite the mitigation measures mentioned above, the overall impact of the construction of EMAL Project on fauna and flora remains of very high significance as all the species-rich sand sheets previously found on the site will have been lost as a result of construction activities. However, most of the impact occurred during the construction of Phase 1 with the backfilling and/or levelling of most of the areas required for both Phases. Therefore, the impact of the construction of Phase 2 alone on fauna and flora is assessed as being of low significance (Table 5.8).
Table 5.8 Impact Assessment: Fauna & Flora (Construction Phase)
Assessment Intensity Extent Duration Significance
2007 EIA (Phases I & II) Very high Local Long Very high
2011 Update (Phase II) Low Local Long Low
5.2.4 Noise Environment
In the 2007 EIA, the transportation of backfill material and concrete from local suppliers was considered as the main source of impact on ambient noise during the construction phase. However, during the construction of Phase 2, there will be no transportation of concrete from local suppliers. A concrete batch plant is available on site and the number
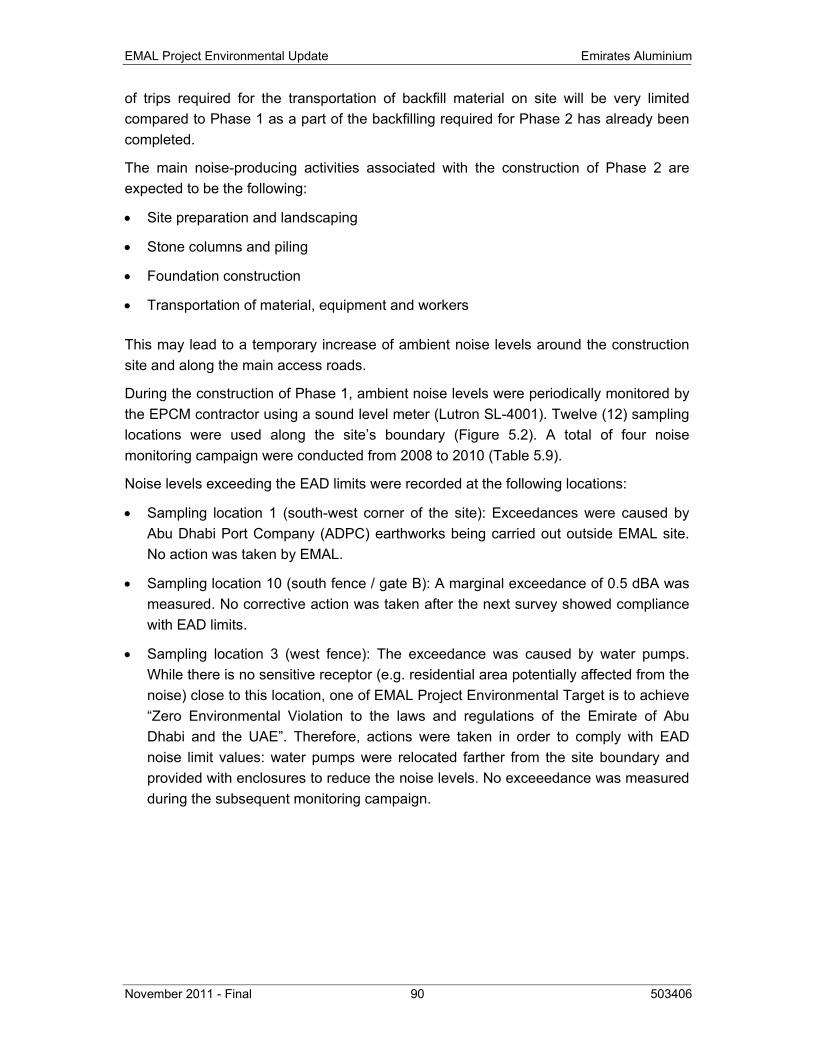
EMAL Project Environmental Update Emirates Aluminium
November 2011 - Final 90 503406
of trips required for the transportation of backfill material on site will be very limited compared to Phase 1 as a part of the backfilling required for Phase 2 has already been completed.
The main noise-producing activities associated with the construction of Phase 2 are expected to be the following:
• Site preparation and landscaping
• Stone columns and piling
• Foundation construction
• Transportation of material, equipment and workers
This may lead to a temporary increase of ambient noise levels around the construction site and along the main access roads.
During the construction of Phase 1, ambient noise levels were periodically monitored by the EPCM contractor using a sound level meter (Lutron SL-4001). Twelve (12) sampling locations were used along the site’s boundary (Figure 5.2). A total of four noise monitoring campaign were conducted from 2008 to 2010 (Table 5.9).
Noise levels exceeding the EAD limits were recorded at the following locations:
• Sampling location 1 (south-west corner of the site): Exceedances were caused by Abu Dhabi Port Company (ADPC) earthworks being carried out outside EMAL site. No action was taken by EMAL.
• Sampling location 10 (south fence / gate B): A marginal exceedance of 0.5 dBA was measured. No corrective action was taken after the next survey showed compliance with EAD limits.
• Sampling location 3 (west fence): The exceedance was caused by water pumps. While there is no sensitive receptor (e.g. residential area potentially affected from the noise) close to this location, one of EMAL Project Environmental Target is to achieve “Zero Environmental Violation to the laws and regulations of the Emirate of Abu Dhabi and the UAE”. Therefore, actions were taken in order to comply with EAD noise limit values: water pumps were relocated farther from the site boundary and provided with enclosures to reduce the noise levels. No exceeedance was measured during the subsequent monitoring campaign.
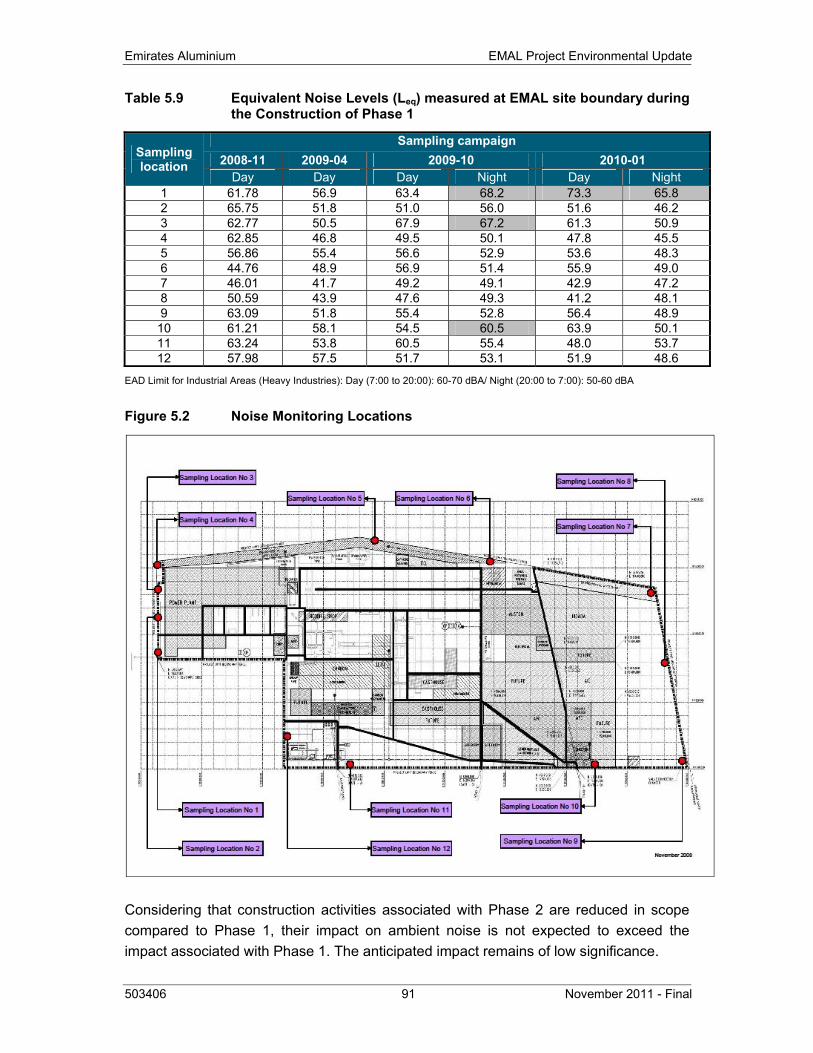
Emirates Aluminium EMAL Project Environmental Update
503406 91 November 2011 - Final
Table 5.9 Equivalent Noise Levels (Leq) measured at EMAL site boundary during the Construction of Phase 1
Sampling location
Sampling campaign2008-11 2009-04 2009-10 2010-01
Day Day Day Night Day Night 1 61.78 56.9 63.4 68.2 73.3 65.8 2 65.75 51.8 51.0 56.0 51.6 46.2 3 62.77 50.5 67.9 67.2 61.3 50.9 4 62.85 46.8 49.5 50.1 47.8 45.5 5 56.86 55.4 56.6 52.9 53.6 48.3 6 44.76 48.9 56.9 51.4 55.9 49.0 7 46.01 41.7 49.2 49.1 42.9 47.2 8 50.59 43.9 47.6 49.3 41.2 48.1 9 63.09 51.8 55.4 52.8 56.4 48.9
10 61.21 58.1 54.5 60.5 63.9 50.1 11 63.24 53.8 60.5 55.4 48.0 53.7 12 57.98 57.5 51.7 53.1 51.9 48.6
EAD Limit for Industrial Areas (Heavy Industries): Day (7:00 to 20:00): 60-70 dBA/ Night (20:00 to 7:00): 50-60 dBA
Figure 5.2 Noise Monitoring Locations
Considering that construction activities associated with Phase 2 are reduced in scope compared to Phase 1, their impact on ambient noise is not expected to exceed the impact associated with Phase 1. The anticipated impact remains of low significance.
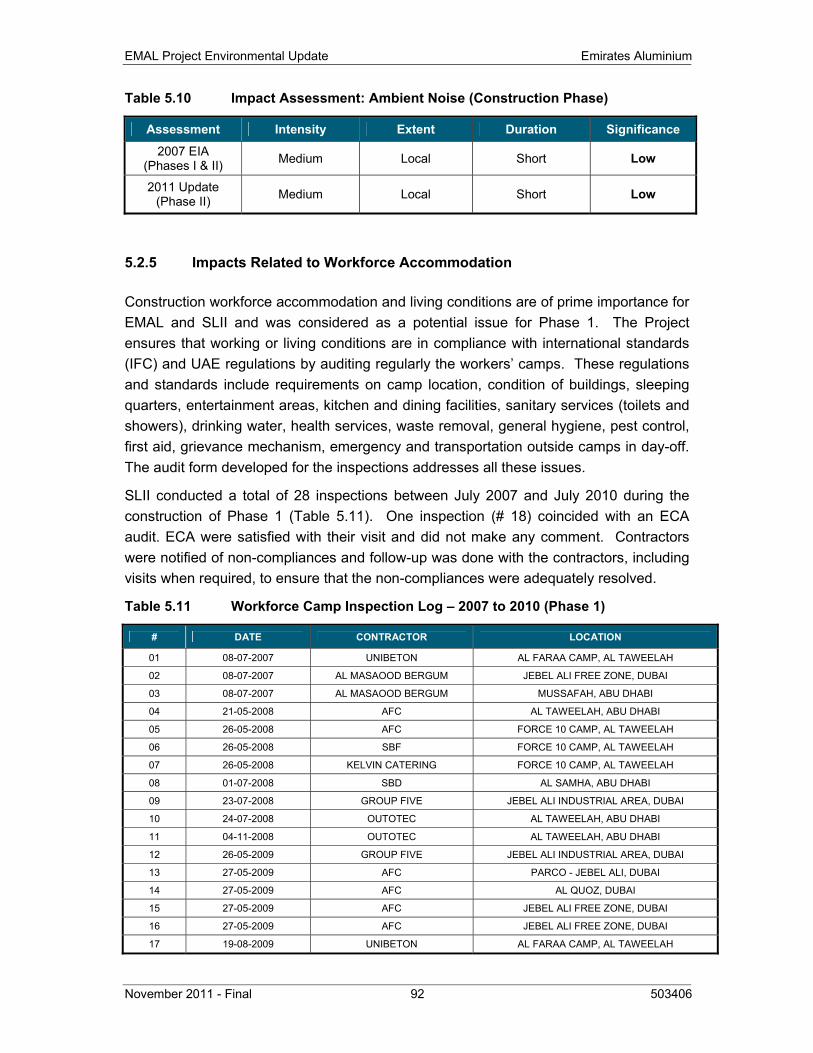
EMAL Project Environmental Update Emirates Aluminium
November 2011 - Final 92 503406
Table 5.10 Impact Assessment: Ambient Noise (Construction Phase)
Assessment Intensity Extent Duration Significance
2007 EIA (Phases I & II) Medium Local Short Low
2011 Update (Phase II) Medium Local Short Low
5.2.5 Impacts Related to Workforce Accommodation
Construction workforce accommodation and living conditions are of prime importance for EMAL and SLII and was considered as a potential issue for Phase 1. The Project ensures that working or living conditions are in compliance with international standards (IFC) and UAE regulations by auditing regularly the workers’ camps. These regulations and standards include requirements on camp location, condition of buildings, sleeping quarters, entertainment areas, kitchen and dining facilities, sanitary services (toilets and showers), drinking water, health services, waste removal, general hygiene, pest control, first aid, grievance mechanism, emergency and transportation outside camps in day-off. The audit form developed for the inspections addresses all these issues.
SLII conducted a total of 28 inspections between July 2007 and July 2010 during the construction of Phase 1 (Table 5.11). One inspection (# 18) coincided with an ECA audit. ECA were satisfied with their visit and did not make any comment. Contractors were notified of non-compliances and follow-up was done with the contractors, including visits when required, to ensure that the non-compliances were adequately resolved.
Table 5.11 Workforce Camp Inspection Log – 2007 to 2010 (Phase 1)
# DATE CONTRACTOR LOCATION
01 08-07-2007 UNIBETON AL FARAA CAMP, AL TAWEELAH
02 08-07-2007 AL MASAOOD BERGUM JEBEL ALI FREE ZONE, DUBAI
03 08-07-2007 AL MASAOOD BERGUM MUSSAFAH, ABU DHABI
04 21-05-2008 AFC AL TAWEELAH, ABU DHABI
05 26-05-2008 AFC FORCE 10 CAMP, AL TAWEELAH
06 26-05-2008 SBF FORCE 10 CAMP, AL TAWEELAH
07 26-05-2008 KELVIN CATERING FORCE 10 CAMP, AL TAWEELAH
08 01-07-2008 SBD AL SAMHA, ABU DHABI
09 23-07-2008 GROUP FIVE JEBEL ALI INDUSTRIAL AREA, DUBAI
10 24-07-2008 OUTOTEC AL TAWEELAH, ABU DHABI
11 04-11-2008 OUTOTEC AL TAWEELAH, ABU DHABI
12 26-05-2009 GROUP FIVE JEBEL ALI INDUSTRIAL AREA, DUBAI
13 27-05-2009 AFC PARCO - JEBEL ALI, DUBAI
14 27-05-2009 AFC AL QUOZ, DUBAI
15 27-05-2009 AFC JEBEL ALI FREE ZONE, DUBAI
16 27-05-2009 AFC JEBEL ALI FREE ZONE, DUBAI
17 19-08-2009 UNIBETON AL FARAA CAMP, AL TAWEELAH
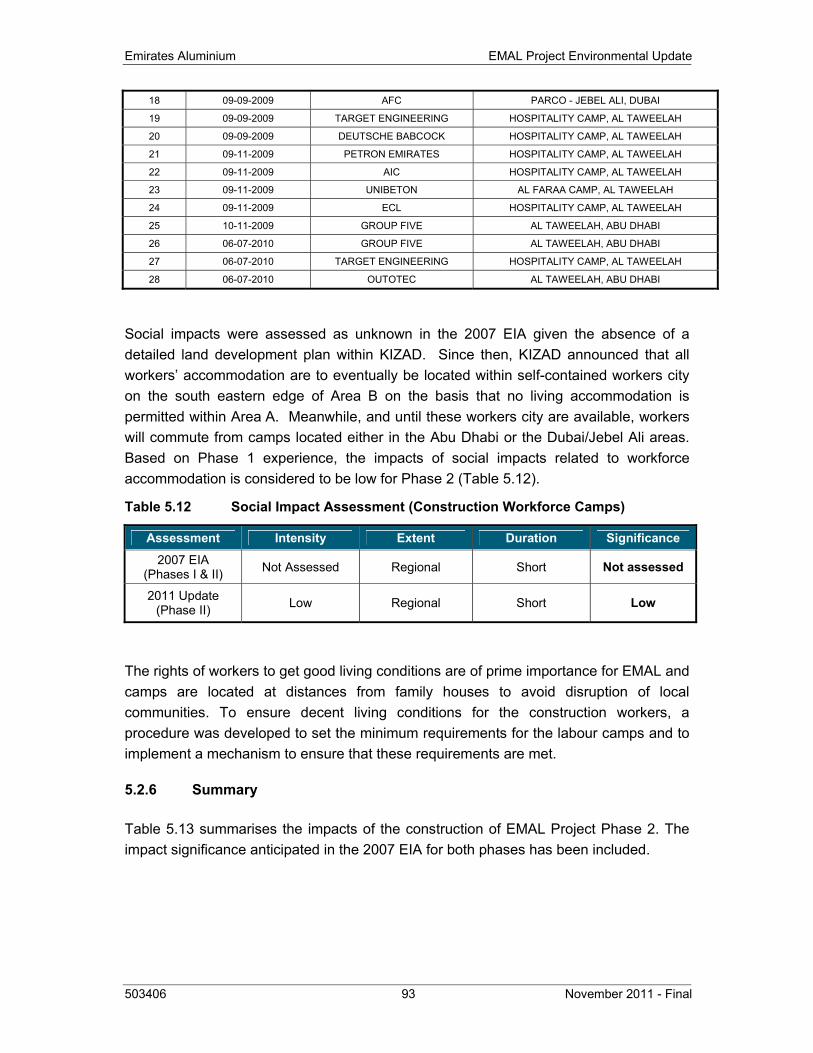
Emirates Aluminium EMAL Project Environmental Update
503406 93 November 2011 - Final
18 09-09-2009 AFC PARCO - JEBEL ALI, DUBAI
19 09-09-2009 TARGET ENGINEERING HOSPITALITY CAMP, AL TAWEELAH
20 09-09-2009 DEUTSCHE BABCOCK HOSPITALITY CAMP, AL TAWEELAH
21 09-11-2009 PETRON EMIRATES HOSPITALITY CAMP, AL TAWEELAH
22 09-11-2009 AIC HOSPITALITY CAMP, AL TAWEELAH
23 09-11-2009 UNIBETON AL FARAA CAMP, AL TAWEELAH
24 09-11-2009 ECL HOSPITALITY CAMP, AL TAWEELAH
25 10-11-2009 GROUP FIVE AL TAWEELAH, ABU DHABI
26 06-07-2010 GROUP FIVE AL TAWEELAH, ABU DHABI
27 06-07-2010 TARGET ENGINEERING HOSPITALITY CAMP, AL TAWEELAH
28 06-07-2010 OUTOTEC AL TAWEELAH, ABU DHABI
Social impacts were assessed as unknown in the 2007 EIA given the absence of a detailed land development plan within KIZAD. Since then, KIZAD announced that all workers’ accommodation are to eventually be located within self-contained workers city on the south eastern edge of Area B on the basis that no living accommodation is permitted within Area A. Meanwhile, and until these workers city are available, workers will commute from camps located either in the Abu Dhabi or the Dubai/Jebel Ali areas. Based on Phase 1 experience, the impacts of social impacts related to workforce accommodation is considered to be low for Phase 2 (Table 5.12).
Table 5.12 Social Impact Assessment (Construction Workforce Camps)
Assessment Intensity Extent Duration Significance
2007 EIA (Phases I & II) Not Assessed Regional Short Not assessed
2011 Update (Phase II) Low Regional Short Low
The rights of workers to get good living conditions are of prime importance for EMAL and camps are located at distances from family houses to avoid disruption of local communities. To ensure decent living conditions for the construction workers, a procedure was developed to set the minimum requirements for the labour camps and to implement a mechanism to ensure that these requirements are met.
5.2.6 Summary
Table 5.13 summarises the impacts of the construction of EMAL Project Phase 2. The impact significance anticipated in the 2007 EIA for both phases has been included.
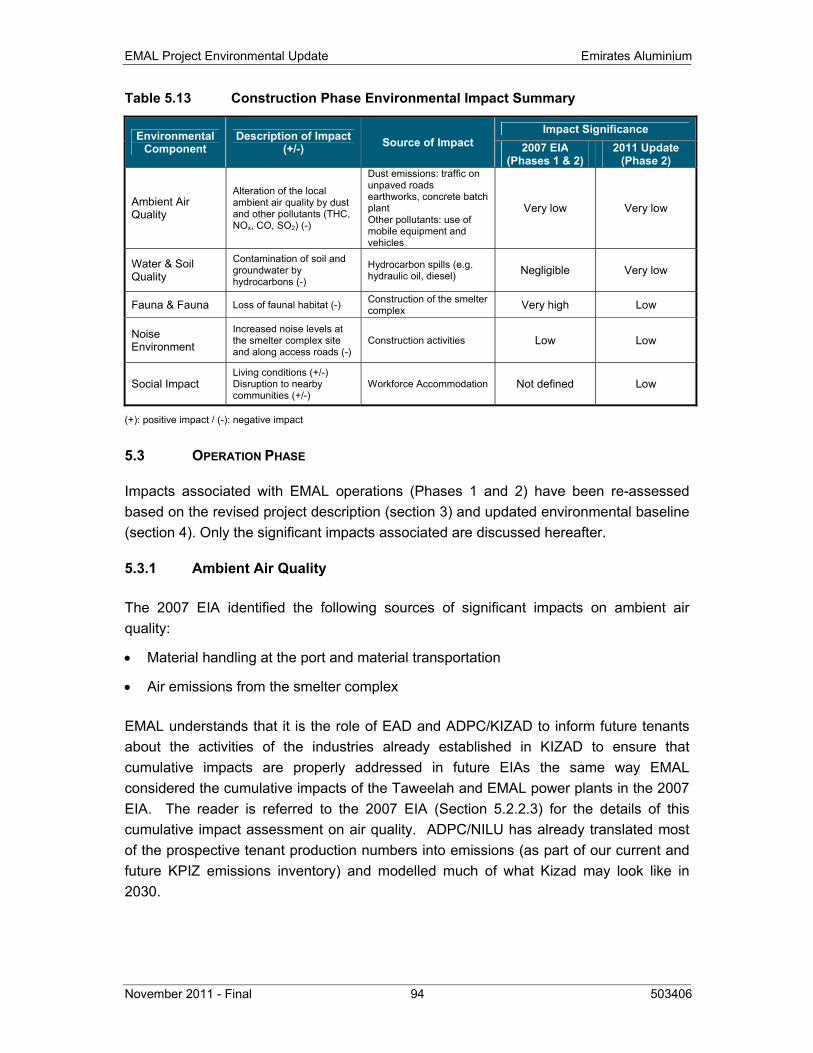
EMAL Project Environmental Update Emirates Aluminium
November 2011 - Final 94 503406
Table 5.13 Construction Phase Environmental Impact Summary
Environmental Component
Description of Impact(+/-) Source of Impact
Impact Significance 2007 EIA
(Phases 1 & 2) 2011 Update
(Phase 2)
Ambient Air Quality
Alteration of the local ambient air quality by dust and other pollutants (THC, NOx, CO, SO2) (-)
Dust emissions: traffic on unpaved roads earthworks, concrete batch plant Other pollutants: use of mobile equipment and vehicles
Very low Very low
Water & Soil Quality
Contamination of soil and groundwater by hydrocarbons (-)
Hydrocarbon spills (e.g. hydraulic oil, diesel) Negligible Very low
Fauna & Fauna Loss of faunal habitat (-) Construction of the smelter complex Very high Low
Noise Environment
Increased noise levels at the smelter complex site and along access roads (-)
Construction activities Low Low
Social Impact Living conditions (+/-) Disruption to nearby communities (+/-)
Workforce Accommodation Not defined Low
(+): positive impact / (-): negative impact
5.3 OPERATION PHASE
Impacts associated with EMAL operations (Phases 1 and 2) have been re-assessed based on the revised project description (section 3) and updated environmental baseline (section 4). Only the significant impacts associated are discussed hereafter.
5.3.1 Ambient Air Quality
The 2007 EIA identified the following sources of significant impacts on ambient air quality:
• Material handling at the port and material transportation
• Air emissions from the smelter complex
EMAL understands that it is the role of EAD and ADPC/KIZAD to inform future tenants about the activities of the industries already established in KIZAD to ensure that cumulative impacts are properly addressed in future EIAs the same way EMAL considered the cumulative impacts of the Taweelah and EMAL power plants in the 2007 EIA. The reader is referred to the 2007 EIA (Section 5.2.2.3) for the details of this cumulative impact assessment on air quality. ADPC/NILU has already translated most of the prospective tenant production numbers into emissions (as part of our current and future KPIZ emissions inventory) and modelled much of what Kizad may look like in 2030.
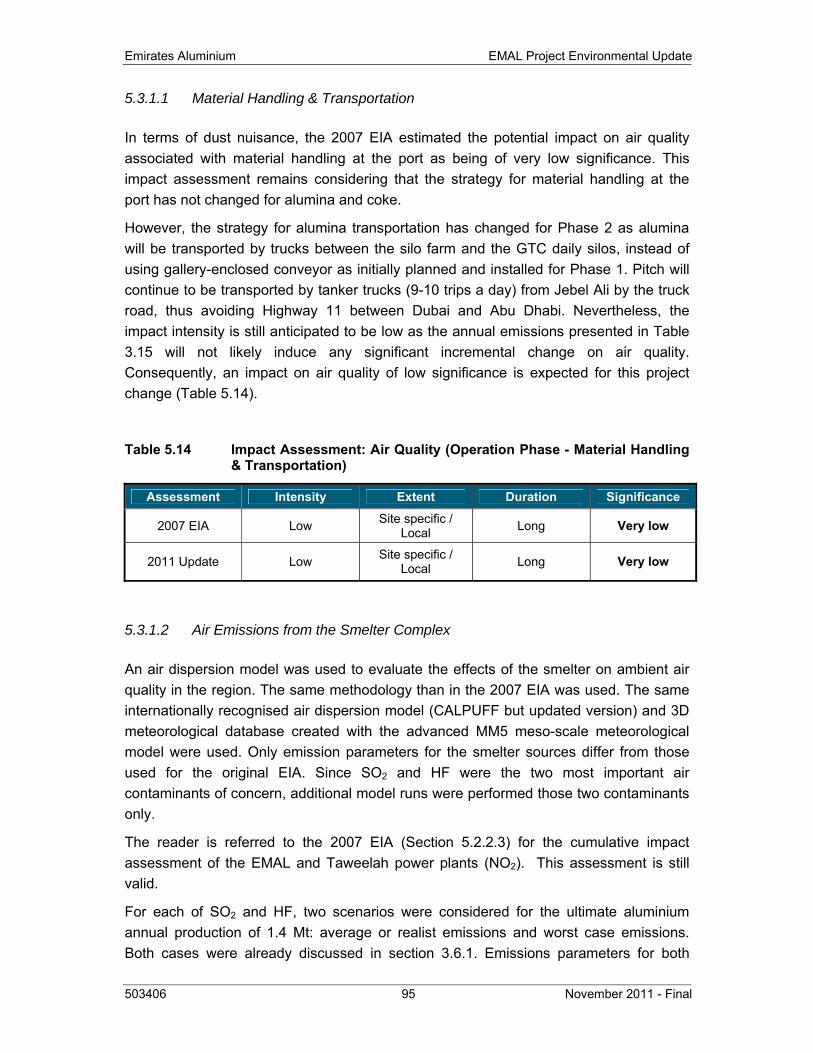
Emirates Aluminium EMAL Project Environmental Update
503406 95 November 2011 - Final
5.3.1.1 Material Handling & Transportation
In terms of dust nuisance, the 2007 EIA estimated the potential impact on air quality associated with material handling at the port as being of very low significance. This impact assessment remains considering that the strategy for material handling at the port has not changed for alumina and coke.
However, the strategy for alumina transportation has changed for Phase 2 as alumina will be transported by trucks between the silo farm and the GTC daily silos, instead of using gallery-enclosed conveyor as initially planned and installed for Phase 1. Pitch will continue to be transported by tanker trucks (9-10 trips a day) from Jebel Ali by the truck road, thus avoiding Highway 11 between Dubai and Abu Dhabi. Nevertheless, the impact intensity is still anticipated to be low as the annual emissions presented in Table 3.15 will not likely induce any significant incremental change on air quality. Consequently, an impact on air quality of low significance is expected for this project change (Table 5.14).
Table 5.14 Impact Assessment: Air Quality (Operation Phase - Material Handling & Transportation)
Assessment Intensity Extent Duration Significance
2007 EIA Low Site specific / Local Long Very low
2011 Update Low Site specific / Local Long Very low
5.3.1.2 Air Emissions from the Smelter Complex
An air dispersion model was used to evaluate the effects of the smelter on ambient air quality in the region. The same methodology than in the 2007 EIA was used. The same internationally recognised air dispersion model (CALPUFF but updated version) and 3D meteorological database created with the advanced MM5 meso-scale meteorological model were used. Only emission parameters for the smelter sources differ from those used for the original EIA. Since SO2 and HF were the two most important air contaminants of concern, additional model runs were performed those two contaminants only.
The reader is referred to the 2007 EIA (Section 5.2.2.3) for the cumulative impact assessment of the EMAL and Taweelah power plants (NO2). This assessment is still valid.
For each of SO2 and HF, two scenarios were considered for the ultimate aluminium annual production of 1.4 Mt: average or realist emissions and worst case emissions. Both cases were already discussed in section 3.6.1. Emissions parameters for both
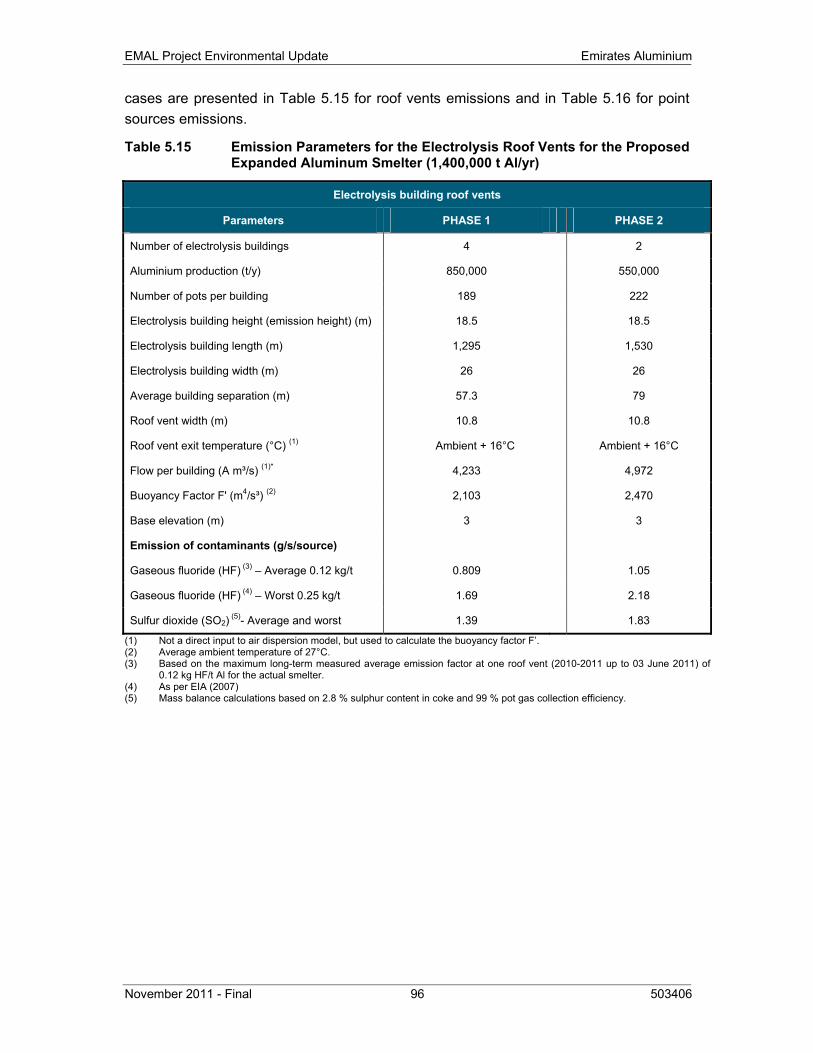
EMAL Project Environmental Update Emirates Aluminium
November 2011 - Final 96 503406
cases are presented in Table 5.15 for roof vents emissions and in Table 5.16 for point sources emissions.
Table 5.15 Emission Parameters for the Electrolysis Roof Vents for the Proposed Expanded Aluminum Smelter (1,400,000 t Al/yr)
Electrolysis building roof vents
Parameters PHASE 1 PHASE 2
Number of electrolysis buildings 4 2
Aluminium production (t/y) 850,000 550,000
Number of pots per building 189 222
Electrolysis building height (emission height) (m) 18.5 18.5
Electrolysis building length (m) 1,295 1,530
Electrolysis building width (m) 26 26
Average building separation (m) 57.3 79
Roof vent width (m) 10.8 10.8
Roof vent exit temperature (°C) (1) Ambient + 16°C Ambient + 16°C
Flow per building (A m³/s) (1)* 4,233 4,972
Buoyancy Factor F' (m4/s³) (2) 2,103 2,470
Base elevation (m) 3 3
Emission of contaminants (g/s/source)
Gaseous fluoride (HF) (3) – Average 0.12 kg/t 0.809 1.05
Gaseous fluoride (HF) (4) – Worst 0.25 kg/t 1.69 2.18
Sulfur dioxide (SO2) (5)- Average and worst 1.39 1.83
(1) Not a direct input to air dispersion model, but used to calculate the buoyancy factor F’. (2) Average ambient temperature of 27°C. (3) Based on the maximum long-term measured average emission factor at one roof vent (2010-2011 up to 03 June 2011) of
0.12 kg HF/t Al for the actual smelter. (4) As per EIA (2007) (5) Mass balance calculations based on 2.8 % sulphur content in coke and 99 % pot gas collection efficiency.
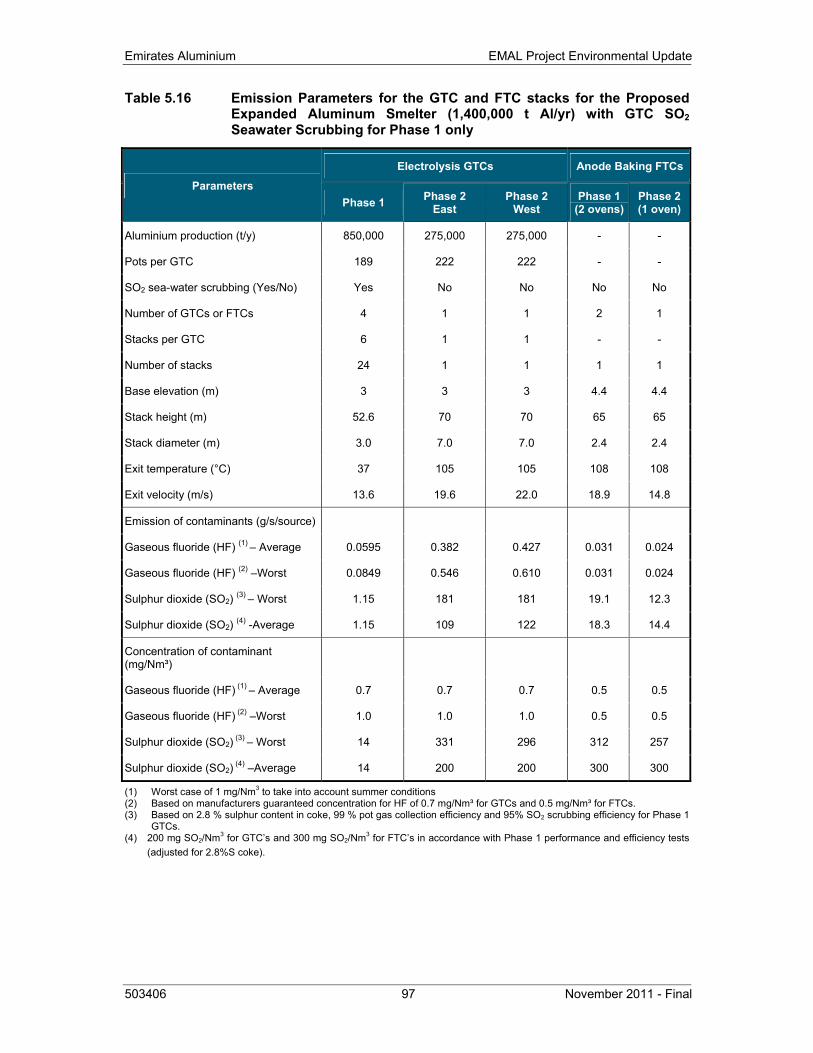
Emirates Aluminium EMAL Project Environmental Update
503406 97 November 2011 - Final
Table 5.16 Emission Parameters for the GTC and FTC stacks for the Proposed Expanded Aluminum Smelter (1,400,000 t Al/yr) with GTC SO2 Seawater Scrubbing for Phase 1 only
Parameters
Electrolysis GTCs Anode Baking FTCs
Phase 1 Phase 2 East
Phase 2 West
Phase 1 (2 ovens)
Phase 2(1 oven)
Aluminium production (t/y) 850,000 275,000 275,000 - -
Pots per GTC 189 222 222 - -
SO2 sea-water scrubbing (Yes/No) Yes No No No No
Number of GTCs or FTCs 4 1 1 2 1
Stacks per GTC 6 1 1 - -
Number of stacks 24 1 1 1 1
Base elevation (m) 3 3 3 4.4 4.4
Stack height (m) 52.6 70 70 65 65
Stack diameter (m) 3.0 7.0 7.0 2.4 2.4
Exit temperature (°C) 37 105 105 108 108
Exit velocity (m/s) 13.6 19.6 22.0 18.9 14.8
Emission of contaminants (g/s/source)
Gaseous fluoride (HF) (1) – Average 0.0595 0.382 0.427 0.031 0.024
Gaseous fluoride (HF) (2) –Worst 0.0849 0.546 0.610 0.031 0.024
Sulphur dioxide (SO2) (3) – Worst 1.15 181 181 19.1 12.3
Sulphur dioxide (SO2) (4) -Average 1.15 109 122 18.3 14.4
Concentration of contaminant (mg/Nm³)
Gaseous fluoride (HF) (1) – Average 0.7 0.7 0.7 0.5 0.5
Gaseous fluoride (HF) (2) –Worst 1.0 1.0 1.0 0.5 0.5
Sulphur dioxide (SO2) (3) – Worst 14 331 296 312 257
Sulphur dioxide (SO2) (4) –Average 14 200 200 300 300
(1) Worst case of 1 mg/Nm3 to take into account summer conditions (2) Based on manufacturers guaranteed concentration for HF of 0.7 mg/Nm³ for GTCs and 0.5 mg/Nm³ for FTCs. (3) Based on 2.8 % sulphur content in coke, 99 % pot gas collection efficiency and 95% SO2 scrubbing efficiency for Phase 1
GTCs. (4) 200 mg SO2/Nm3 for GTC’s and 300 mg SO2/Nm3 for FTC’s in accordance with Phase 1 performance and efficiency tests
(adjusted for 2.8%S coke).
EMAL Project Environmental Update Emirates Aluminium
November 2011 - Final 98 503406
Results for SO2 and HF for both average and worst case emission scenarios are presented on maps of the area in Appendix A:
Figure A.4: Worst Case Maximum Predicted Hourly Average Concentration of SO2 in ambient Air
Figure A.5: Worst Case Number of Exceedances of the EAD Hourly Standard for SO2 in ambient Air
Figure A.6: Average Case Maximum Predicted Hourly Average Concentration of SO2 in ambient Air
Figure A.7: Average Case Number of Exceedances of the EAD Hourly Standard for SO2 in ambient Air
Figure A.8: Worst Case Maximum Predicted Daily Average Concentration of SO2 in ambient Air
Figure A.9: Average Case Maximum Predicted Daily Average Concentration of SO2 in ambient Air
Figure A.10: Worst Case Maximum Predicted Long-Term Average Concentration of SO2 in ambient Air
Figure A.11: Average Case Maximum Predicted Long-Term Average Concentration of SO2 in ambient Air
Figure A.12: Worst Case Maximum Predicted Long-Term Average Concentration of HF in ambient Air
Figure A.13: Average Case Maximum Predicted Long-Term Average Concentration of HF in ambient Air
It must be noted that the scale of figures A.8 and A.9 for maximum daily average concentrations of SO2 in ambient air was adjusted to show the Al Sahma area and the 20 µg/m³ curve that will be used in the discussion on human health issues later on in this report (Section 5.3.2).
Maximum predicted concentration of SO2 in ambient air for the worst and average emissions cases are summarised on Table 5.17 for selected areas: property line, Ras Ghanada mangrove and ambient air monitoring sites. For large areas (property line and mangrove) the range of maximum concentrations over the area are indicated. The contribution of the smelter to maximum ground-level concentrations of SO2 in ambient air remain well below the EAD standards with the exception of maximum hourly concentration very close to the smelter. Some exceedences of the 1-hour EAD standard of 350 µg/m³ are predicted at some area of EMAL property line and at the KPIZ monitoring site for both emissions case scenarios. At the border of the mangrove area, some exceedences (up to 3 over a 5-year period) are predicted for the worst case emission scenario only.
Predicted concentrations are higher than predicted concentration presented in the EIA. Highest increases are at the property line. In Al Samha City, the contribution of the smelter to ambient SO2 concentrations increases, but predicted concentration remain well below the EAD of IFC/WHO standards.
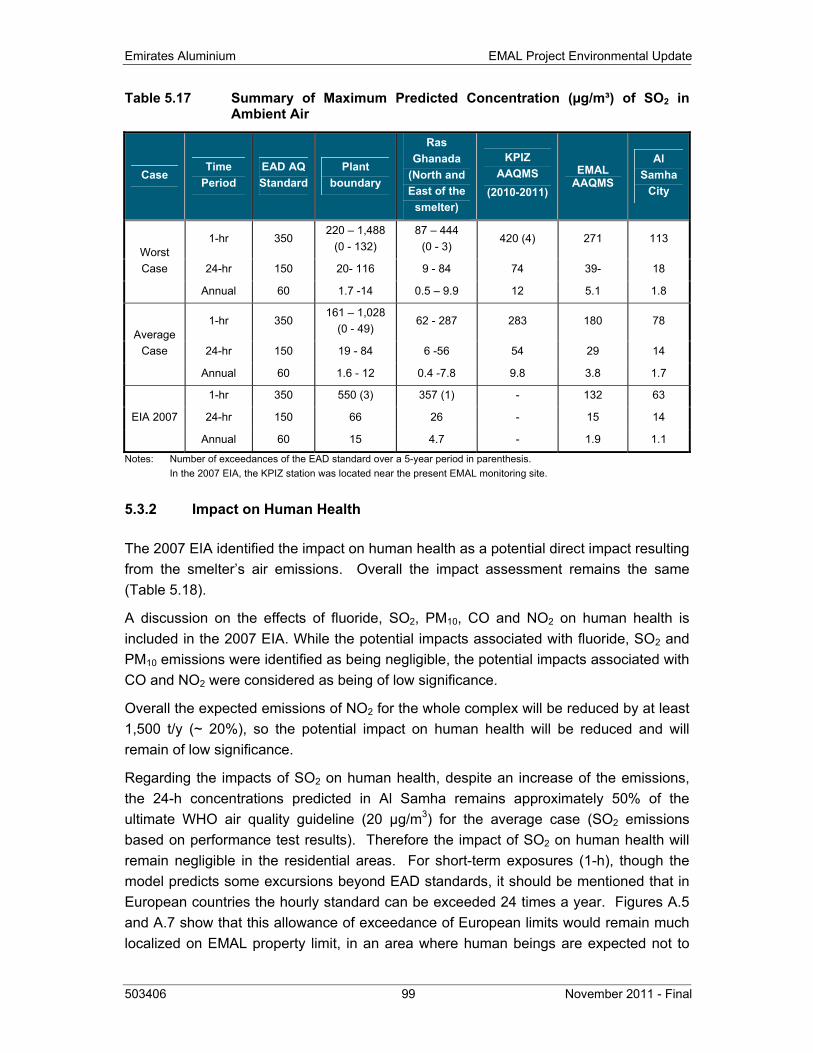
Emirates Aluminium EMAL Project Environmental Update
503406 99 November 2011 - Final
Table 5.17 Summary of Maximum Predicted Concentration (µg/m³) of SO2 in Ambient Air
Case Time
Period EAD AQ Standard
Plant boundary
Ras Ghanada
(North and East of the
smelter)
KPIZ AAQMS
(2010-2011)
EMAL AAQMS
Al Samha
City
Worst Case
1-hr 350 220 – 1,488
(0 - 132) 87 – 444
(0 - 3) 420 (4) 271 113
24-hr 150 20- 116 9 - 84 74 39- 18
Annual 60 1.7 -14 0.5 – 9.9 12 5.1 1.8
Average Case
1-hr 350 161 – 1,028
(0 - 49) 62 - 287 283 180 78
24-hr 150 19 - 84 6 -56 54 29 14
Annual 60 1.6 - 12 0.4 -7.8 9.8 3.8 1.7
EIA 2007
1-hr 350 550 (3) 357 (1) - 132 63
24-hr 150 66 26 - 15 14
Annual 60 15 4.7 - 1.9 1.1
Notes: Number of exceedances of the EAD standard over a 5-year period in parenthesis. In the 2007 EIA, the KPIZ station was located near the present EMAL monitoring site.
5.3.2 Impact on Human Health
The 2007 EIA identified the impact on human health as a potential direct impact resulting from the smelter’s air emissions. Overall the impact assessment remains the same (Table 5.18).
A discussion on the effects of fluoride, SO2, PM10, CO and NO2 on human health is included in the 2007 EIA. While the potential impacts associated with fluoride, SO2 and PM10 emissions were identified as being negligible, the potential impacts associated with CO and NO2 were considered as being of low significance.
Overall the expected emissions of NO2 for the whole complex will be reduced by at least 1,500 t/y (~ 20%), so the potential impact on human health will be reduced and will remain of low significance.
Regarding the impacts of SO2 on human health, despite an increase of the emissions, the 24-h concentrations predicted in Al Samha remains approximately 50% of the ultimate WHO air quality guideline (20 µg/m3) for the average case (SO2 emissions based on performance test results). Therefore the impact of SO2 on human health will remain negligible in the residential areas. For short-term exposures (1-h), though the model predicts some excursions beyond EAD standards, it should be mentioned that in European countries the hourly standard can be exceeded 24 times a year. Figures A.5 and A.7 show that this allowance of exceedance of European limits would remain much localized on EMAL property limit, in an area where human beings are expected not to
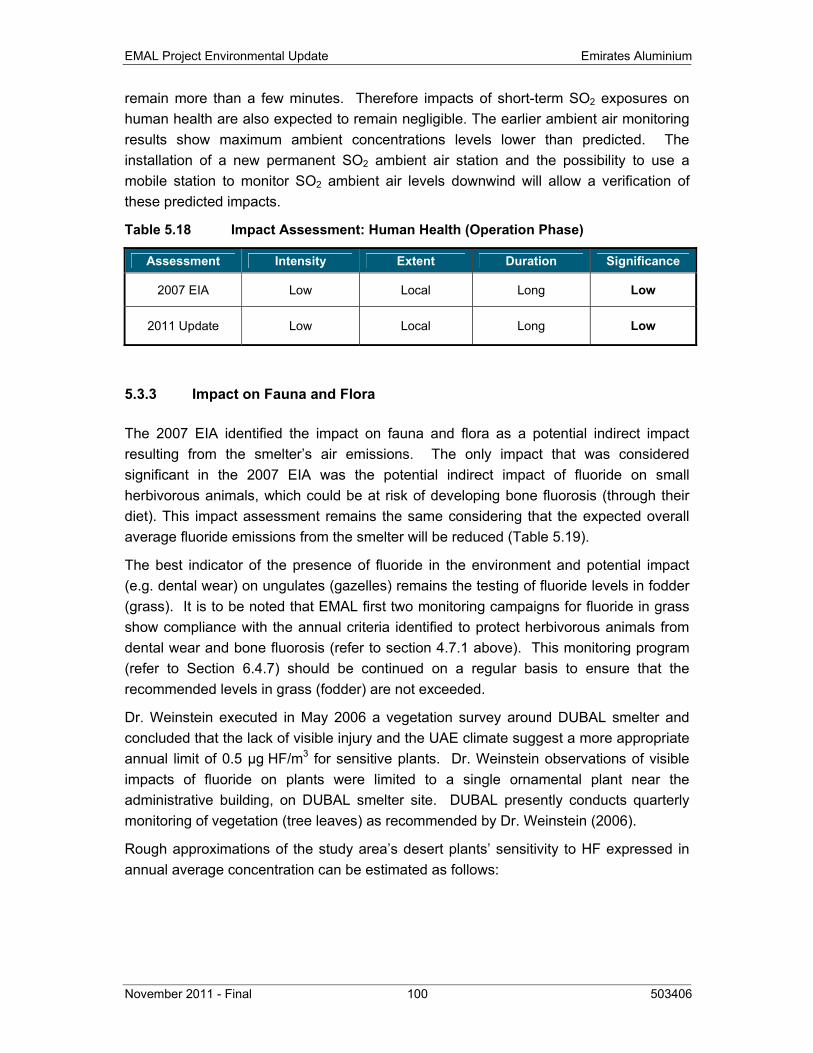
EMAL Project Environmental Update Emirates Aluminium
November 2011 - Final 100 503406
remain more than a few minutes. Therefore impacts of short-term SO2 exposures on human health are also expected to remain negligible. The earlier ambient air monitoring results show maximum ambient concentrations levels lower than predicted. The installation of a new permanent SO2 ambient air station and the possibility to use a mobile station to monitor SO2 ambient air levels downwind will allow a verification of these predicted impacts.
Table 5.18 Impact Assessment: Human Health (Operation Phase)
Assessment Intensity Extent Duration Significance
2007 EIA Low Local Long Low
2011 Update Low Local Long Low
5.3.3 Impact on Fauna and Flora
The 2007 EIA identified the impact on fauna and flora as a potential indirect impact resulting from the smelter’s air emissions. The only impact that was considered significant in the 2007 EIA was the potential indirect impact of fluoride on small herbivorous animals, which could be at risk of developing bone fluorosis (through their diet). This impact assessment remains the same considering that the expected overall average fluoride emissions from the smelter will be reduced (Table 5.19).
The best indicator of the presence of fluoride in the environment and potential impact (e.g. dental wear) on ungulates (gazelles) remains the testing of fluoride levels in fodder (grass). It is to be noted that EMAL first two monitoring campaigns for fluoride in grass show compliance with the annual criteria identified to protect herbivorous animals from dental wear and bone fluorosis (refer to section 4.7.1 above). This monitoring program (refer to Section 6.4.7) should be continued on a regular basis to ensure that the recommended levels in grass (fodder) are not exceeded.
Dr. Weinstein executed in May 2006 a vegetation survey around DUBAL smelter and concluded that the lack of visible injury and the UAE climate suggest a more appropriate annual limit of 0.5 μg HF/m3 for sensitive plants. Dr. Weinstein observations of visible impacts of fluoride on plants were limited to a single ornamental plant near the administrative building, on DUBAL smelter site. DUBAL presently conducts quarterly monitoring of vegetation (tree leaves) as recommended by Dr. Weinstein (2006).
Rough approximations of the study area’s desert plants’ sensitivity to HF expressed in annual average concentration can be estimated as follows:
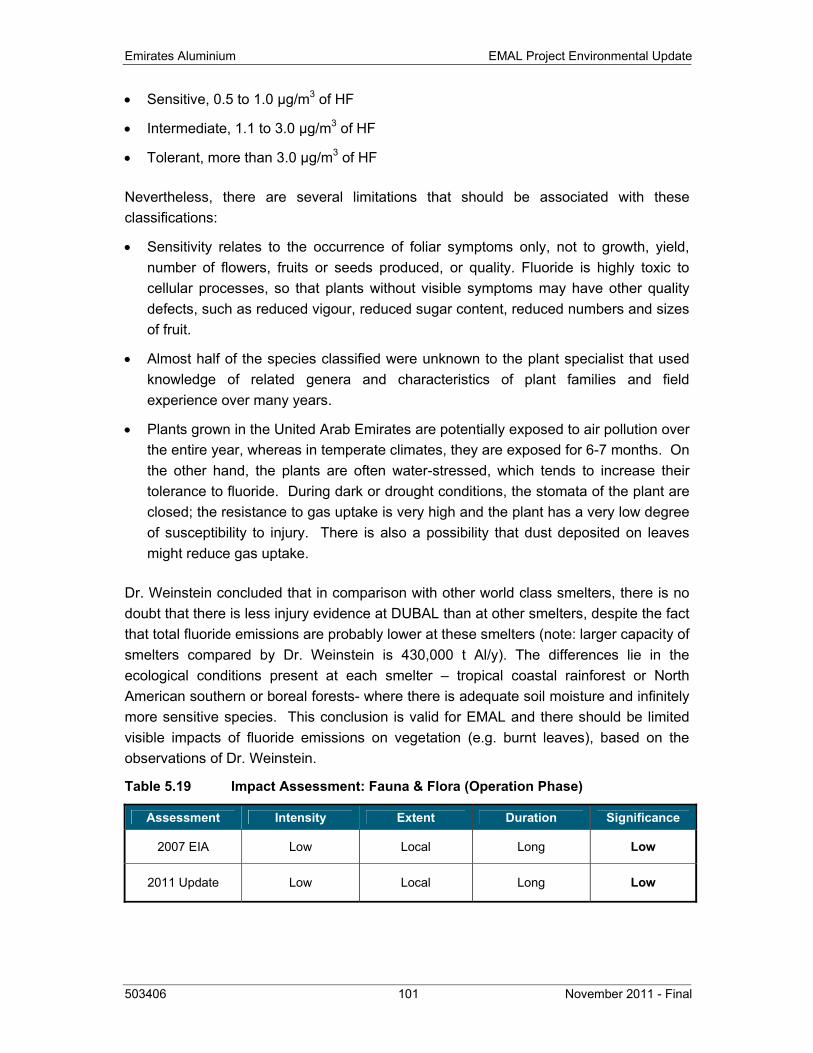
Emirates Aluminium EMAL Project Environmental Update
503406 101 November 2011 - Final
• Sensitive, 0.5 to 1.0 μg/m3 of HF
• Intermediate, 1.1 to 3.0 μg/m3 of HF
• Tolerant, more than 3.0 μg/m3 of HF
Nevertheless, there are several limitations that should be associated with these classifications:
• Sensitivity relates to the occurrence of foliar symptoms only, not to growth, yield, number of flowers, fruits or seeds produced, or quality. Fluoride is highly toxic to cellular processes, so that plants without visible symptoms may have other quality defects, such as reduced vigour, reduced sugar content, reduced numbers and sizes of fruit.
• Almost half of the species classified were unknown to the plant specialist that used knowledge of related genera and characteristics of plant families and field experience over many years.
• Plants grown in the United Arab Emirates are potentially exposed to air pollution over the entire year, whereas in temperate climates, they are exposed for 6-7 months. On the other hand, the plants are often water-stressed, which tends to increase their tolerance to fluoride. During dark or drought conditions, the stomata of the plant are closed; the resistance to gas uptake is very high and the plant has a very low degree of susceptibility to injury. There is also a possibility that dust deposited on leaves might reduce gas uptake.
Dr. Weinstein concluded that in comparison with other world class smelters, there is no doubt that there is less injury evidence at DUBAL than at other smelters, despite the fact that total fluoride emissions are probably lower at these smelters (note: larger capacity of smelters compared by Dr. Weinstein is 430,000 t Al/y). The differences lie in the ecological conditions present at each smelter – tropical coastal rainforest or North American southern or boreal forests- where there is adequate soil moisture and infinitely more sensitive species. This conclusion is valid for EMAL and there should be limited visible impacts of fluoride emissions on vegetation (e.g. burnt leaves), based on the observations of Dr. Weinstein.
Table 5.19 Impact Assessment: Fauna & Flora (Operation Phase)
Assessment Intensity Extent Duration Significance
2007 EIA Low Local Long Low
2011 Update Low Local Long Low
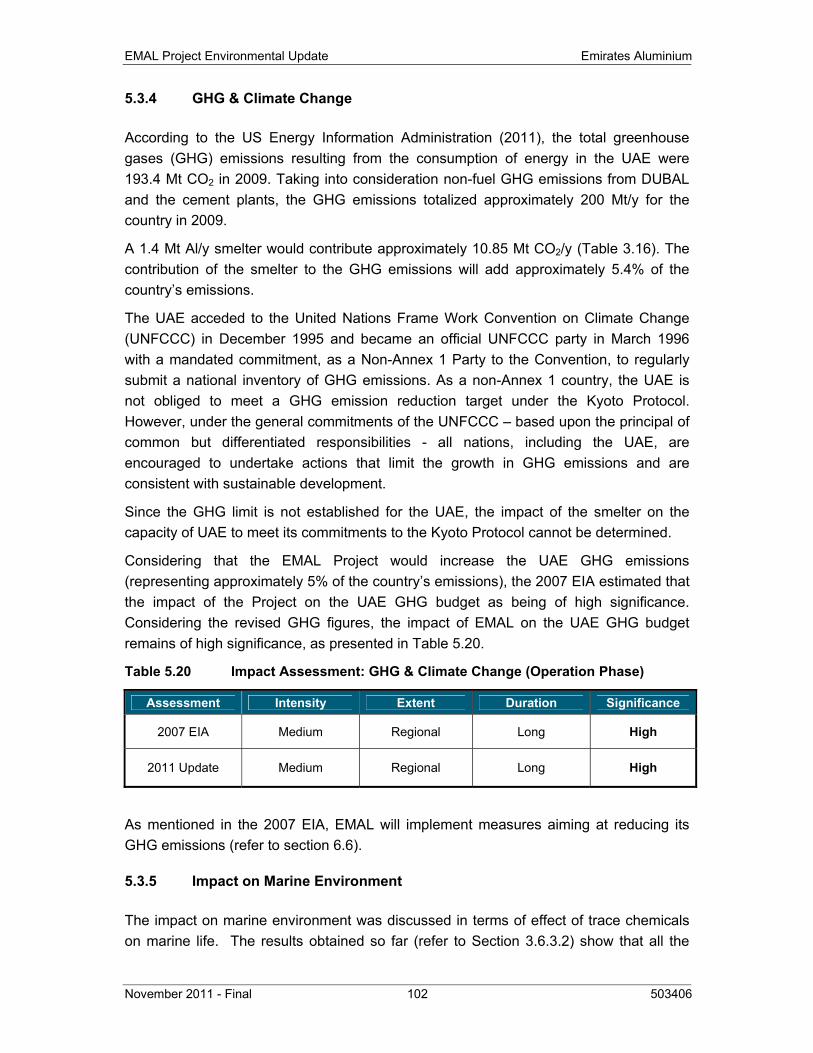
EMAL Project Environmental Update Emirates Aluminium
November 2011 - Final 102 503406
5.3.4 GHG & Climate Change
According to the US Energy Information Administration (2011), the total greenhouse gases (GHG) emissions resulting from the consumption of energy in the UAE were 193.4 Mt CO2 in 2009. Taking into consideration non-fuel GHG emissions from DUBAL and the cement plants, the GHG emissions totalized approximately 200 Mt/y for the country in 2009.
A 1.4 Mt Al/y smelter would contribute approximately 10.85 Mt CO2/y (Table 3.16). The contribution of the smelter to the GHG emissions will add approximately 5.4% of the country’s emissions.
The UAE acceded to the United Nations Frame Work Convention on Climate Change (UNFCCC) in December 1995 and became an official UNFCCC party in March 1996 with a mandated commitment, as a Non-Annex 1 Party to the Convention, to regularly submit a national inventory of GHG emissions. As a non-Annex 1 country, the UAE is not obliged to meet a GHG emission reduction target under the Kyoto Protocol. However, under the general commitments of the UNFCCC – based upon the principal of common but differentiated responsibilities - all nations, including the UAE, are encouraged to undertake actions that limit the growth in GHG emissions and are consistent with sustainable development.
Since the GHG limit is not established for the UAE, the impact of the smelter on the capacity of UAE to meet its commitments to the Kyoto Protocol cannot be determined.
Considering that the EMAL Project would increase the UAE GHG emissions (representing approximately 5% of the country’s emissions), the 2007 EIA estimated that the impact of the Project on the UAE GHG budget as being of high significance. Considering the revised GHG figures, the impact of EMAL on the UAE GHG budget remains of high significance, as presented in Table 5.20.
Table 5.20 Impact Assessment: GHG & Climate Change (Operation Phase)
Assessment Intensity Extent Duration Significance
2007 EIA Medium Regional Long High
2011 Update Medium Regional Long High
As mentioned in the 2007 EIA, EMAL will implement measures aiming at reducing its GHG emissions (refer to section 6.6).
5.3.5 Impact on Marine Environment
The impact on marine environment was discussed in terms of effect of trace chemicals on marine life. The results obtained so far (refer to Section 3.6.3.2) show that all the
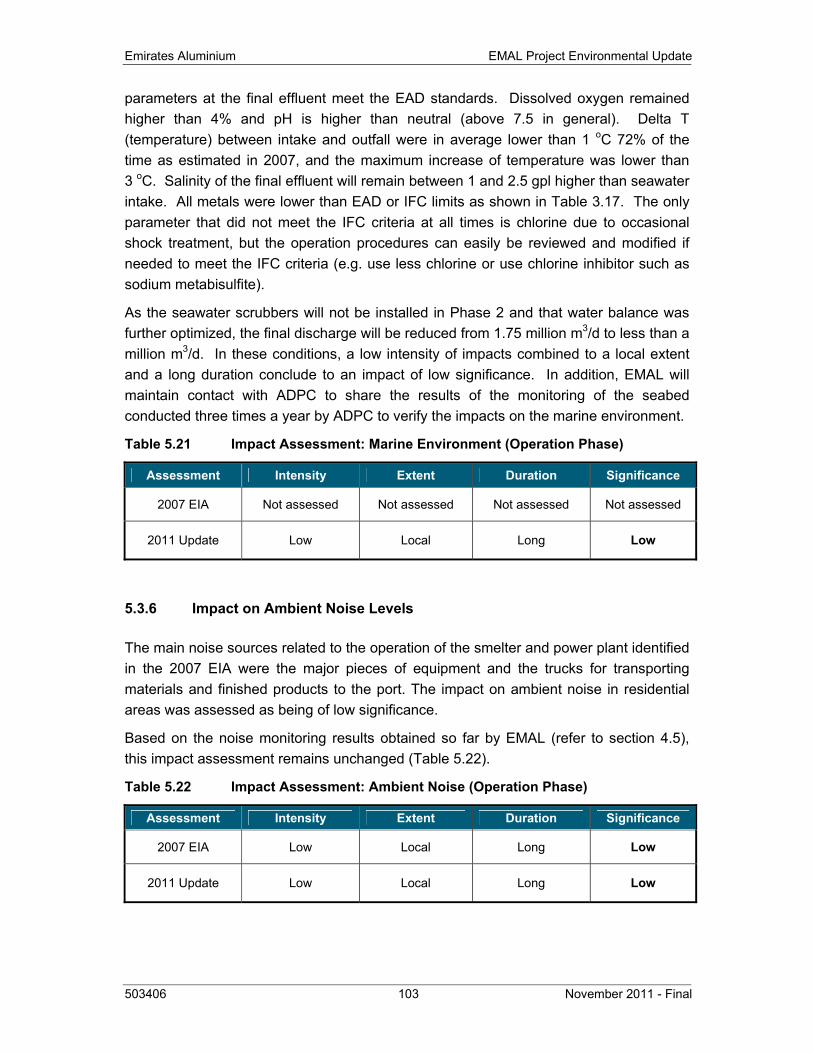
Emirates Aluminium EMAL Project Environmental Update
503406 103 November 2011 - Final
parameters at the final effluent meet the EAD standards. Dissolved oxygen remained higher than 4% and pH is higher than neutral (above 7.5 in general). Delta T (temperature) between intake and outfall were in average lower than 1 oC 72% of the time as estimated in 2007, and the maximum increase of temperature was lower than 3 oC. Salinity of the final effluent will remain between 1 and 2.5 gpl higher than seawater intake. All metals were lower than EAD or IFC limits as shown in Table 3.17. The only parameter that did not meet the IFC criteria at all times is chlorine due to occasional shock treatment, but the operation procedures can easily be reviewed and modified if needed to meet the IFC criteria (e.g. use less chlorine or use chlorine inhibitor such as sodium metabisulfite).
As the seawater scrubbers will not be installed in Phase 2 and that water balance was further optimized, the final discharge will be reduced from 1.75 million m3/d to less than a million m3/d. In these conditions, a low intensity of impacts combined to a local extent and a long duration conclude to an impact of low significance. In addition, EMAL will maintain contact with ADPC to share the results of the monitoring of the seabed conducted three times a year by ADPC to verify the impacts on the marine environment.
Table 5.21 Impact Assessment: Marine Environment (Operation Phase)
Assessment Intensity Extent Duration Significance
2007 EIA Not assessed Not assessed Not assessed Not assessed
2011 Update Low Local Long Low
5.3.6 Impact on Ambient Noise Levels
The main noise sources related to the operation of the smelter and power plant identified in the 2007 EIA were the major pieces of equipment and the trucks for transporting materials and finished products to the port. The impact on ambient noise in residential areas was assessed as being of low significance.
Based on the noise monitoring results obtained so far by EMAL (refer to section 4.5), this impact assessment remains unchanged (Table 5.22).
Table 5.22 Impact Assessment: Ambient Noise (Operation Phase)
Assessment Intensity Extent Duration Significance
2007 EIA Low Local Long Low
2011 Update Low Local Long Low
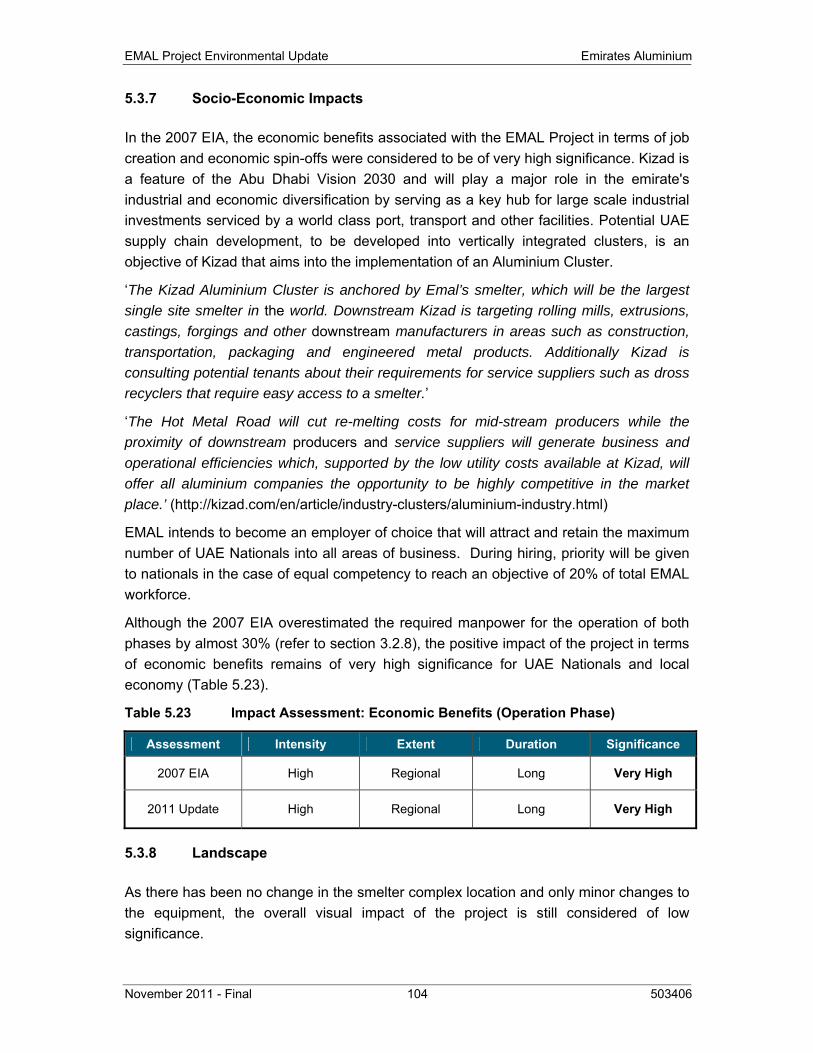
EMAL Project Environmental Update Emirates Aluminium
November 2011 - Final 104 503406
5.3.7 Socio-Economic Impacts
In the 2007 EIA, the economic benefits associated with the EMAL Project in terms of job creation and economic spin-offs were considered to be of very high significance. Kizad is a feature of the Abu Dhabi Vision 2030 and will play a major role in the emirate's industrial and economic diversification by serving as a key hub for large scale industrial investments serviced by a world class port, transport and other facilities. Potential UAE supply chain development, to be developed into vertically integrated clusters, is an objective of Kizad that aims into the implementation of an Aluminium Cluster.
‘The Kizad Aluminium Cluster is anchored by Emal’s smelter, which will be the largest single site smelter in the world. Downstream Kizad is targeting rolling mills, extrusions, castings, forgings and other downstream manufacturers in areas such as construction, transportation, packaging and engineered metal products. Additionally Kizad is consulting potential tenants about their requirements for service suppliers such as dross recyclers that require easy access to a smelter.’
‘The Hot Metal Road will cut re-melting costs for mid-stream producers while the proximity of downstream producers and service suppliers will generate business and operational efficiencies which, supported by the low utility costs available at Kizad, will offer all aluminium companies the opportunity to be highly competitive in the market place.’ (http://kizad.com/en/article/industry-clusters/aluminium-industry.html)
EMAL intends to become an employer of choice that will attract and retain the maximum number of UAE Nationals into all areas of business. During hiring, priority will be given to nationals in the case of equal competency to reach an objective of 20% of total EMAL workforce.
Although the 2007 EIA overestimated the required manpower for the operation of both phases by almost 30% (refer to section 3.2.8), the positive impact of the project in terms of economic benefits remains of very high significance for UAE Nationals and local economy (Table 5.23).
Table 5.23 Impact Assessment: Economic Benefits (Operation Phase)
Assessment Intensity Extent Duration Significance
2007 EIA High Regional Long Very High
2011 Update High Regional Long Very High
5.3.8 Landscape
As there has been no change in the smelter complex location and only minor changes to the equipment, the overall visual impact of the project is still considered of low significance.
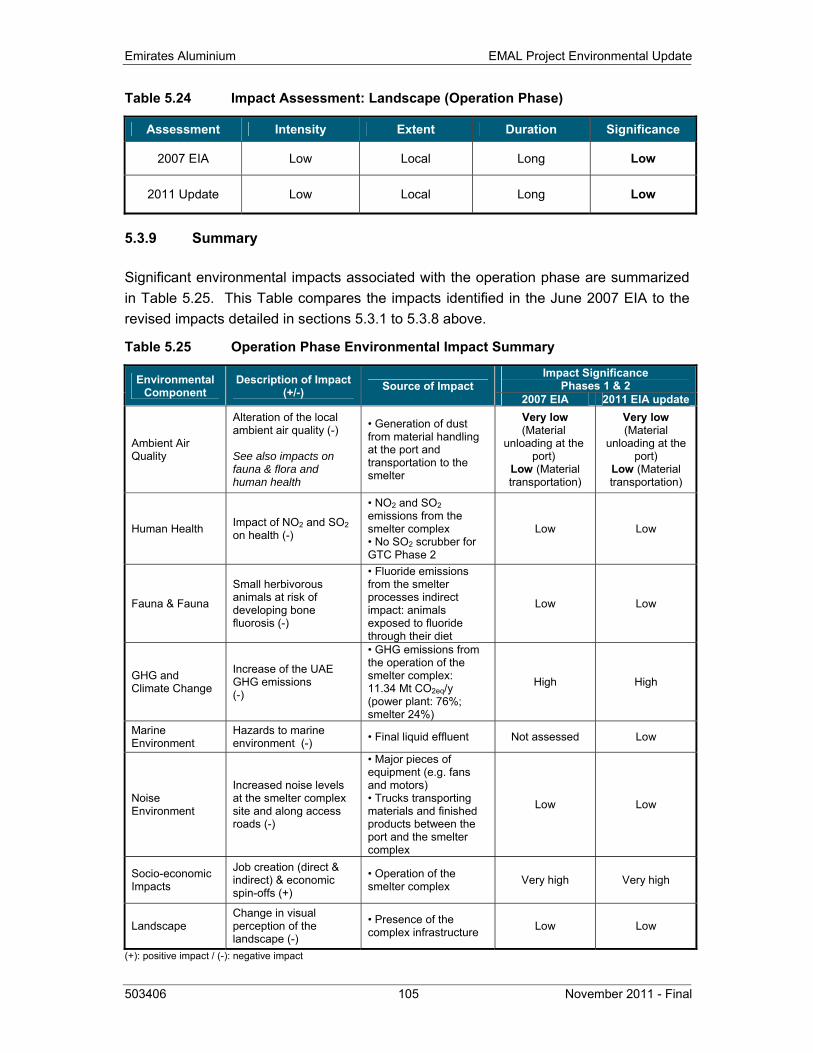
Emirates Aluminium EMAL Project Environmental Update
503406 105 November 2011 - Final
Table 5.24 Impact Assessment: Landscape (Operation Phase)
Assessment Intensity Extent Duration Significance
2007 EIA Low Local Long Low
2011 Update Low Local Long Low
5.3.9 Summary
Significant environmental impacts associated with the operation phase are summarized in Table 5.25. This Table compares the impacts identified in the June 2007 EIA to the revised impacts detailed in sections 5.3.1 to 5.3.8 above.
Table 5.25 Operation Phase Environmental Impact Summary
Environmental Component
Description of Impact(+/-) Source of Impact
Impact Significance Phases 1 & 2
2007 EIA 2011 EIA update
Ambient Air Quality
Alteration of the local ambient air quality (-) See also impacts on fauna & flora and human health
• Generation of dust from material handling at the port and transportation to the smelter
Very low (Material
unloading at the port)
Low (Material transportation)
Very low (Material
unloading at the port)
Low (Material transportation)
Human Health Impact of NO2 and SO2 on health (-)
• NO2 and SO2 emissions from the smelter complex • No SO2 scrubber for GTC Phase 2
Low Low
Fauna & Fauna
Small herbivorous animals at risk of developing bone fluorosis (-)
• Fluoride emissions from the smelter processes indirect impact: animals exposed to fluoride through their diet
Low Low
GHG and Climate Change
Increase of the UAE GHG emissions (-)
• GHG emissions from the operation of the smelter complex: 11.34 Mt CO2eq/y (power plant: 76%; smelter 24%)
High High
Marine Environment
Hazards to marine environment (-) • Final liquid effluent Not assessed Low
Noise Environment
Increased noise levels at the smelter complex site and along access roads (-)
• Major pieces of equipment (e.g. fans and motors) • Trucks transporting materials and finished products between the port and the smelter complex
Low Low
Socio-economic Impacts
Job creation (direct & indirect) & economic spin-offs (+)
• Operation of the smelter complex Very high Very high
Landscape Change in visual perception of the landscape (-)
• Presence of the complex infrastructure Low Low
(+): positive impact / (-): negative impact
EMAL Project Environmental Update Emirates Aluminium
November 2011 - Final 106 503406
6 ENVIRONMENTAL AND SOCIAL MANAGEMENT PLANS
This section aims at presenting an overview of the following key documents/strategies that are part of EMAL environmental and social management system:
• Environmental, Health and Safety (EHS) Policy
• Construction Environmental Management Plan (CEMP)
• Operation Environmental and Social Management Plan (OESMP)
• Environmental Monitoring Programme
• Greenhouse Gases Management System (GHGMS)
• Landscaping Strategy
• Community Engagement Plan
6.1 ENVIRONMENTAL, HEALTH AND SAFETY (EHS) POLICY
EMAL EHS Policy, which was not available when the EIA was issued in 2007, is presented in Appendix B, signed by Saeed Fadhel Al Mazrooei, EMAL actual President and Chief Executive Officer. The Phase 2 EPCM Contractor’s EHS Policy is also included in the same appendix.
6.2 CONSTRUCTION ENVIRONMENTAL MANAGEMENT PLAN (CEMP)
EMAL Phase 2 EPCM contractor (SLII) is fully committed to continue to be an industry Environment, Health and Safety (EHS) implementation role model. This specifically includes:
• Placing the highest priority on the health and safety of all EMAL Phase 2 project stakeholders
• Minimizing the environmental footprint of the project
In this context, EMAL Construction Environmental Management Plan (CEMP) is a key component of the EPCM Contractor’s EHS Management Plan. It describes the resources and activities that the EPCM Contractor is committed to deploying during the construction of the EMAL Project so as to minimize potential environmental impacts on the surrounding area. It also includes the following procedures for environmental and social management during the construction phase as well as the transitional phase between construction and operation of the Project:
Emirates Aluminium EMAL Project Environmental Update
503406 107 November 2011 - Final
• Environmental Management
• Environmental Follow-up
• Site Environmental Inspection by External Entities
• Water Management
• Dust Management
• Noise Control
• Waste Management
• Hazardous Materials Management
• Contaminated Soil Management
• Environmental Issues related to Maintenance, Fuelling and Cleaning of Vehicles and Equipment
• Cultural and Archaeological Heritage
• Rehabilitation of Laydown Areas
• Labour Camp Requirements
Labour Camp
The CEMP is a dynamic tool that permits a quick response, not only to planned construction site activities but to unforeseen environmental issues that can arise during the work and that require an immediate response. It is designed to meet requirements pursuant to the laws and regulations of the Emirate of Abu Dhabi and the UAE. It permits a prompt response to any environmental disturbance to the surrounding area through the implementation of measures designed to alleviate or to compensate for any unanticipated impact.
EMAL submitted its Phase 1 Construction Environmental Management Plan (CEMP) to the EAD in July 2007 (EAD approvals EPD/07/ESR/0017 & EPD/07/ESRF/0076). Revision 1 of the CEMP was issued in July 2008 (EAD approval EMS/08/ESRF/0173). The EAD more recently approved the document to be used on Phase 2 (refer to EAD conditions No. 01862 attached to EMAL industrial license No.1497 renewed on 17 February 2011). Procedures of the CEMP have been updated in October 2011 to reflect the most recent information on the project.
EMAL Project Environmental Update Emirates Aluminium
November 2011 - Final 108 503406
6.3 OPERATION ENVIRONMENTAL AND SOCIAL MANAGEMENT PLAN (OESMP)
The main purpose of EMAL Operations Environmental and Social Management Programme (OESMP) is to ensure that:
• All potential impacts on the environment as a result of operations of EMAL Smelter are recognised and appropriate provision is made for the effective management of such impacts. Management implies preventing or minimising negative impacts while maximising the positive impacts (benefits) of the activity
• Relevant environmental legal requirements are recognised, planned for and met during operations of the smelter
• International lender requirements are recognised, planned for and met during operations of the smelter
• Best practice is promoted and supported in implementing the required environmental and social management functions, and
• A basis is established for continual improvement of environmental and social management into the future
The OESMP has been based on the ISO14001 Environmental Management Systems standard. This approach is to allow for an effective transition to a certifiable Environmental Management System (EMS) at a later stage but more importantly to ensure that the programme presented in the OESMP is based on a robust management philosophy. As such the structure fulfils the requirement of being able to comply with standards such as ISO, OHSAS and so forth, and lends itself to being integrated with the smelter’s overall Integrated EHSQ Management System. The OESMP has accordingly been structured to reflect the different components of the ISO14001 standard. This structure is prefaced by a brief description of the project (so the OESMP can serve as a standalone document) and then a description of the overall environmental and social management approach that underpins the OESMP.
EMAL OESMP was prepared prior to the beginning of EMAL operations. It was formally submitted to the EAD in December 2009, and then revised in January 2010 (EAD Approval EMS/10/ESRF/0086).
6.4 ENVIRONMENTAL MONITORING PROGRAMME
Environmental monitoring is one of the most important tasks performed by EMAL environmental team. This includes not only the monitoring of EMAL effluents (e.g. air emissions, water final effluent), but also the monitoring of the surrounding environment (e.g. air quality, ambient noise, vegetation).
EMAL’s comprehensive environmental monitoring programme is based on the proposed programme described in the 2007 EIA and includes the following aspects:
Emirates Aluminium EMAL Project Environmental Update
503406 109 November 2011 - Final
• Ambient air quality;
• Emissions to air;
• Seawater quality;
• Water effluent quality;
• Potable water quality;
• Treated sewage effluent & sewage sludge;
• Stormwater quality;
• Groundwater quality;
• Vegetation; and,
• Ambient noise.
The 2007 EIA mentioned that the environmental monitoring program would be revised after two years of operation. EMAL has begun this revision process after 18 months of operation and informed EAD in the Technical Modifications Document no. 2 issued in June 2011 (EAD approval issued in October 2011). Revision of the programme takes into account the monitoring results obtained so far. In addition, some monitoring frequencies and parameters have been adjusted to reflect current practices in the aluminium industry and expected observations for an aluminium smelter located in a hot weather climate country.
6.4.1 Ambient Air Quality
Proposed ambient air quality monitoring program is presented in Table 6.1. As specified in the EIA, EMAL has installed an Ambient Air Quality Monitoring Station (AAQMS) in Al Samha forest nursery. The only changes to the AAQMS concern the addition of a permanent SO2 ambient station near the smelter where the highest number of exceedances of EAD 1-h SO2 standard is predicted by the air dispersion model (Figure A.14), the deployment of a mobile ambient air station around the smelter site, the list of parameters and the HF monitoring method.
CO2 has been removed from the list of parameters to be monitored (as there are no criteria for CO2 in ambient air) and O3 and NMHC have been added upon EAD request (refer to EPD/07/ESR/0019 - Revised EIA approval with conditions). As for HF monitoring, in the expectation of obtaining more accurate results on a continuous basis, EMAL decided to install a real time monitor (Picarro G1205) instead of using manual sampling with weekly analyses.
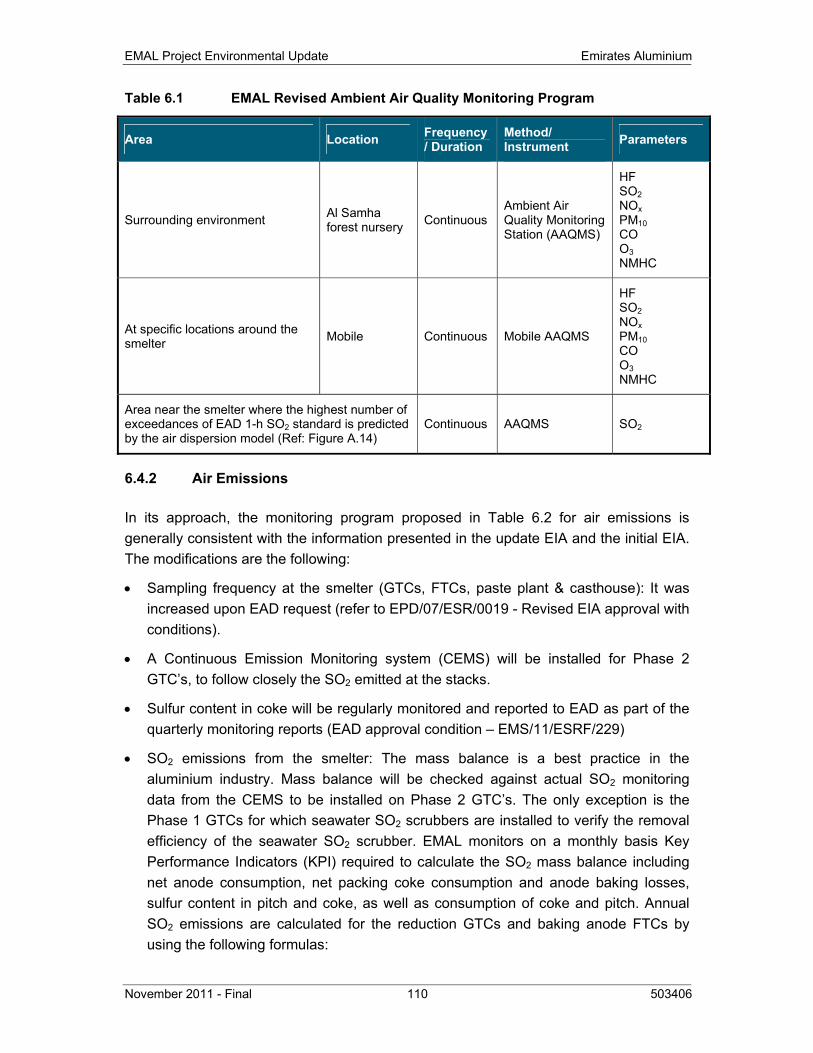
EMAL Project Environmental Update Emirates Aluminium
November 2011 - Final 110 503406
Table 6.1 EMAL Revised Ambient Air Quality Monitoring Program
Area Location Frequency/ Duration
Method/ Instrument Parameters
Surrounding environment Al Samha forest nursery Continuous
Ambient Air Quality Monitoring Station (AAQMS)
HF SO2 NOx PM10 CO O3 NMHC
At specific locations around the smelter Mobile Continuous Mobile AAQMS
HF SO2 NOx PM10 CO O3 NMHC
Area near the smelter where the highest number of exceedances of EAD 1-h SO2 standard is predicted by the air dispersion model (Ref: Figure A.14)
Continuous AAQMS SO2
6.4.2 Air Emissions
In its approach, the monitoring program proposed in Table 6.2 for air emissions is generally consistent with the information presented in the update EIA and the initial EIA. The modifications are the following:
• Sampling frequency at the smelter (GTCs, FTCs, paste plant & casthouse): It was increased upon EAD request (refer to EPD/07/ESR/0019 - Revised EIA approval with conditions).
• A Continuous Emission Monitoring system (CEMS) will be installed for Phase 2 GTC’s, to follow closely the SO2 emitted at the stacks.
• Sulfur content in coke will be regularly monitored and reported to EAD as part of the quarterly monitoring reports (EAD approval condition – EMS/11/ESRF/229)
• SO2 emissions from the smelter: The mass balance is a best practice in the aluminium industry. Mass balance will be checked against actual SO2 monitoring data from the CEMS to be installed on Phase 2 GTC’s. The only exception is the Phase 1 GTCs for which seawater SO2 scrubbers are installed to verify the removal efficiency of the seawater SO2 scrubber. EMAL monitors on a monthly basis Key Performance Indicators (KPI) required to calculate the SO2 mass balance including net anode consumption, net packing coke consumption and anode baking losses, sulfur content in pitch and coke, as well as consumption of coke and pitch. Annual SO2 emissions are calculated for the reduction GTCs and baking anode FTCs by using the following formulas:
Emirates Aluminium EMAL Project Environmental Update
503406 111 November 2011 - Final
Reduction GTC: NAC X %S-BA X 2 X Prod X [1% + 99% X (1-SO2%removal)]
Baking anode FTV: PAC X %S-Coke X 2 + Pitch X %S-Pitch X 2
Where : NAC is net anode consumption (in kg C/t Al)
%S-BA is % of sulfur in baked anodes
Prod: Production of aluminium (t Al/y)
PAC: Net packing coke consumption (t C/y)
%S coke: Average content of sulfur in coke (%)
Pitch: Annual consumption of pitch (t/y)
%S pitch: Average content of sulfur in pitch (%)
SO2 %removal = Global removal of sulfur dioxide with the seawater SO2 scrubber
• PAH emissions (carbon stacks): Considering that only a supplier has the capacity to do PAH sampling in the UAE and that these samples must be analysed abroad, this parameter will be monitored on an annual basis
• Total tars are removed for reduction (GTCs and potroom vents). For the aluminium industry, emissions of tars and PAH related to former Söderberg reduction process were quasi-eliminated with the anode prebake process
• RTO stacks: The list of pollutants to be monitored at the paste plant has been revised mainly to take into account the specificity of the RTO (refer to Technical Modifications no.1 – January 2011). The following parameters have been added: TPM, PAH, VOC, NOx and CO
• Casthouse: CO for which there is an EAD emission standard, has been added to the list of parameters
• TPM emissions monitoring at power plant was eliminated completely would it be manual sampling or Continuous Emission Monitoring System (CEMS), since PM emissions are very low and that there are no international standards for PM emitted from gas-fired turbines
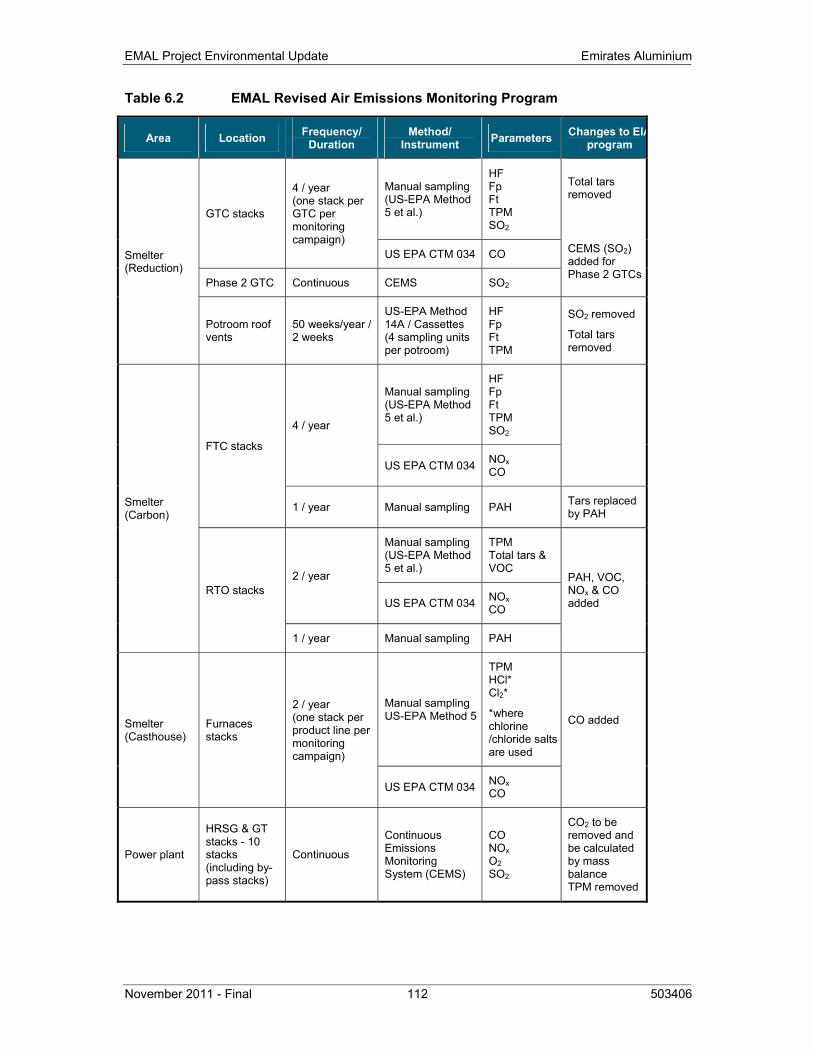
EMAL Project Environmental Update Emirates Aluminium
November 2011 - Final 112 503406
Table 6.2 EMAL Revised Air Emissions Monitoring Program
Area Location Frequency/ Duration
Method/ Instrument Parameters Changes to EIA
program
Smelter (Reduction)
GTC stacks
4 / year (one stack per GTC per monitoring campaign)
Manual sampling (US-EPA Method 5 et al.)
HF Fp Ft TPM SO2
Total tars removed
CEMS (SO2) added for Phase 2 GTCs
US EPA CTM 034 CO
Phase 2 GTC Continuous CEMS SO2
Potroom roof vents
50 weeks/year / 2 weeks
US-EPA Method 14A / Cassettes (4 sampling units per potroom)
HF Fp Ft TPM
SO2 removed
Total tars removed
Smelter (Carbon)
FTC stacks
4 / year
Manual sampling (US-EPA Method 5 et al.)
HF Fp Ft TPM SO2
US EPA CTM 034 NOx CO
1 / year Manual sampling PAH Tars replaced by PAH
RTO stacks 2 / year
Manual sampling (US-EPA Method 5 et al.)
TPM Total tars & VOC
PAH, VOC, NOx & CO added US EPA CTM 034 NOx
CO
1 / year Manual sampling PAH
Smelter (Casthouse)
Furnaces stacks
2 / year (one stack per product line per monitoring campaign)
Manual sampling US-EPA Method 5
TPM HCl* Cl2*
*where chlorine /chloride salts are used
CO added
US EPA CTM 034 NOx CO
Power plant
HRSG & GT stacks - 10 stacks (including by-pass stacks)
Continuous
Continuous Emissions Monitoring System (CEMS)
CO NOx O2 SO2
CO2 to be removed and be calculated by mass balance TPM removed
Emirates Aluminium EMAL Project Environmental Update
503406 113 November 2011 - Final
6.4.3 Seawater Intake and Final Effluent
Continuous monitoring of the seawater quality (from the intake) and final effluent quality (from the discharge pipe to the outfall) for parameters such as flow pH and temperature will be carried out as per the EIA.
The main modification proposed for the monitoring program of the seawater intake & outfall presented in Table 6.3 is a reduction in the monitoring frequency of some other parameters (fluoride, sulfates, hydrocarbons, COD) from weekly to monthly (24-hour composite).
In the case of the monitoring to be conducted on a quarterly basis, the list of parameters was revised to include TSS, Hg and Pb (to be able to compare with effluent standards) and exclude morpholine (because this additive is not used).
6.4.4 Sewage Treatment Plant
The monitoring strategy for the treated sewage effluent has been revised based on RSB Recycled Water & Biosolids Regulations 2010, which were not available when the EIA was issued in 2007.
Monitoring is carried out to ensure compliance with RSB Regulations in order to re-use the treated sewage effluent for irrigation. Values are reported directly to RSB.
6.4.5 Stormwater
The monitoring strategy for stormwater monitoring has been revised based on the final arrangement of the stormwater management system (Table 6.4).
Stormwater is not intended to be directly sent to the sea. It is not judged necessary to measure some parameters continuously at the outlet of the First Flush Ponds (FFP) nor the Evaporation / Infiltration Ponds (EIP). In the unlikely event of sea discharge2, stormwater would be directed to the sea water discharge line and would be mixed with the other effluents from the smelter and power plant before reaching the discharge outfall. The final effluent is continuously monitored for parameters such as flow, temperature and pH.
The monitoring strategy consists in grab sampling and laboratory analysis of the stormwater quality from the FFP prior to discharge for aluminium, fluoride, sulfates, TSS, oil and grease, COD, pH, dissolved oxygen, conductivity, TDS, salinity, and metals.
2 The stormwater management system relies on evaporation for ultimate disposal.
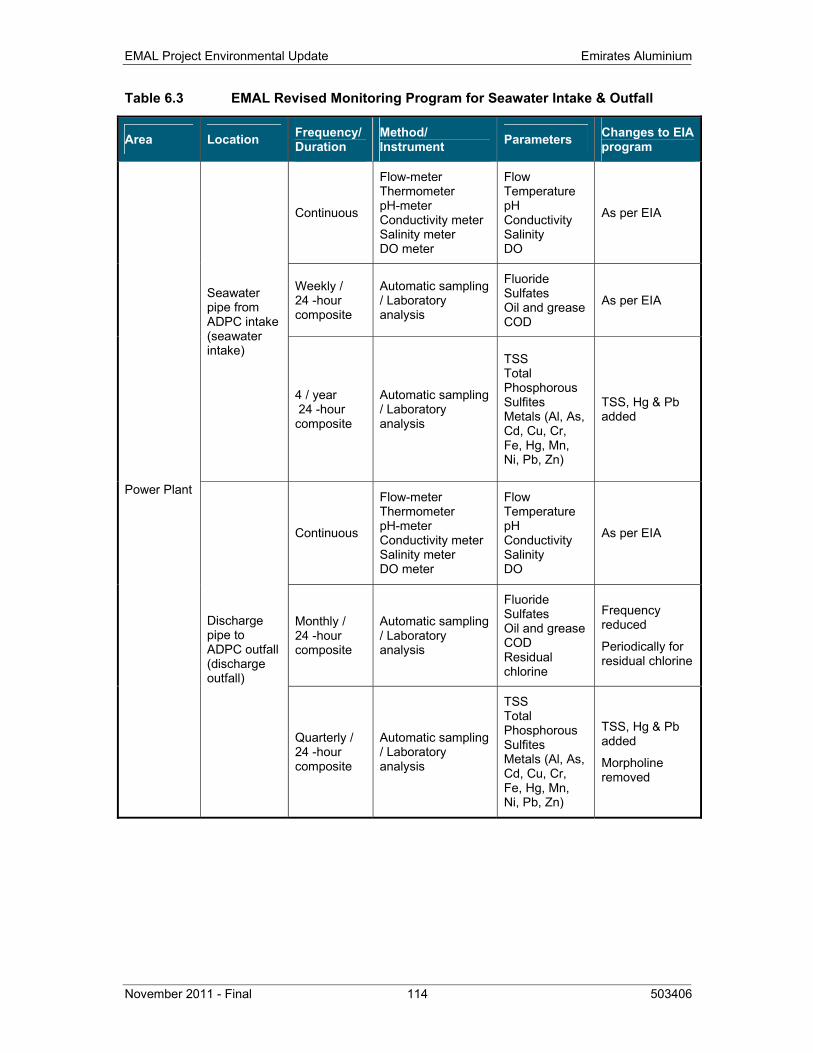
EMAL Project Environmental Update Emirates Aluminium
November 2011 - Final 114 503406
Table 6.3 EMAL Revised Monitoring Program for Seawater Intake & Outfall
Area Location Frequency/ Duration
Method/ Instrument Parameters Changes to EIA
program
Power Plant
Seawater pipe from ADPC intake (seawater intake)
Continuous
Flow-meter Thermometer pH-meter Conductivity meter Salinity meter DO meter
Flow Temperature pH Conductivity Salinity DO
As per EIA
Weekly / 24 -hour composite
Automatic sampling / Laboratory analysis
Fluoride Sulfates Oil and grease COD
As per EIA
4 / year 24 -hour composite
Automatic sampling / Laboratory analysis
TSS Total Phosphorous Sulfites Metals (Al, As, Cd, Cu, Cr, Fe, Hg, Mn, Ni, Pb, Zn)
TSS, Hg & Pb added
Discharge pipe to ADPC outfall (discharge outfall)
Continuous
Flow-meter Thermometer pH-meter Conductivity meter Salinity meter DO meter
Flow Temperature pH Conductivity Salinity DO
As per EIA
Monthly / 24 -hour composite
Automatic sampling / Laboratory analysis
Fluoride Sulfates Oil and grease COD Residual chlorine
Frequency reduced
Periodically for residual chlorine
Quarterly / 24 -hour composite
Automatic sampling / Laboratory analysis
TSS Total Phosphorous Sulfites Metals (Al, As, Cd, Cu, Cr, Fe, Hg, Mn, Ni, Pb, Zn)
TSS, Hg & Pb added
Morpholine removed
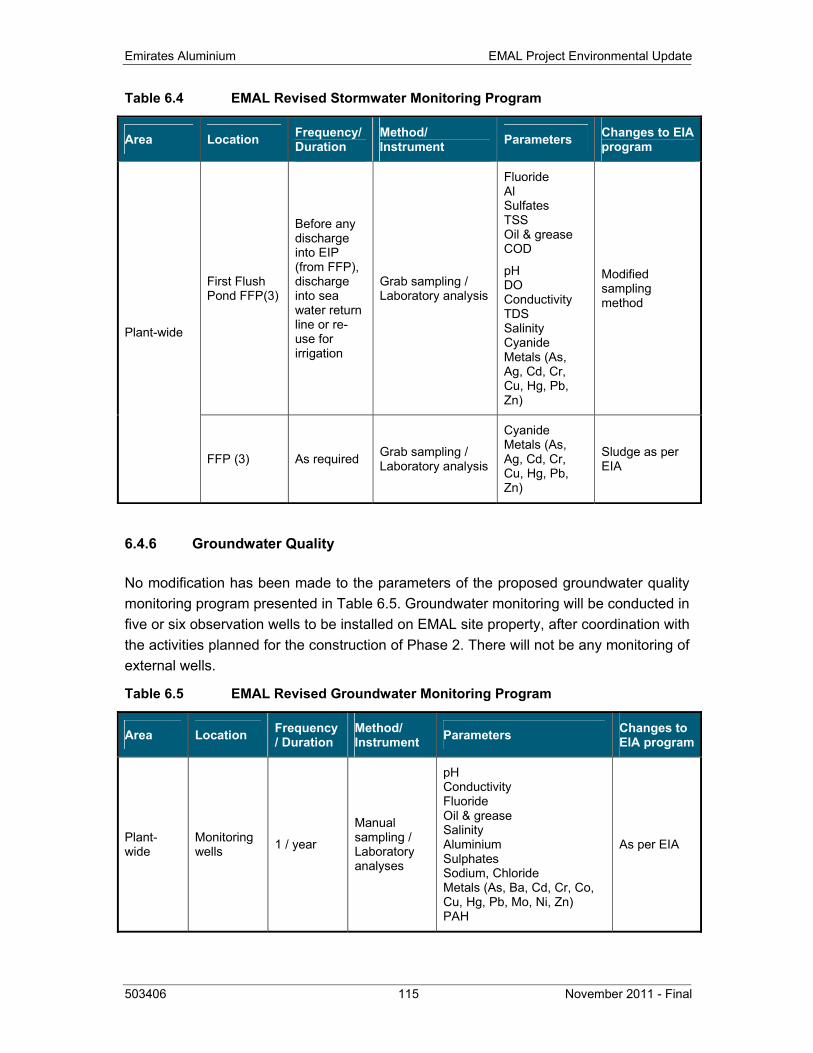
Emirates Aluminium EMAL Project Environmental Update
503406 115 November 2011 - Final
Table 6.4 EMAL Revised Stormwater Monitoring Program
Area Location Frequency/ Duration
Method/ Instrument Parameters Changes to EIA
program
Plant-wide
First Flush Pond FFP(3)
Before any discharge into EIP (from FFP), discharge into sea water return line or re-use for irrigation
Grab sampling / Laboratory analysis
Fluoride Al Sulfates TSS Oil & grease COD
pH DO Conductivity TDS Salinity Cyanide Metals (As, Ag, Cd, Cr, Cu, Hg, Pb, Zn)
Modified sampling method
FFP (3) As required Grab sampling / Laboratory analysis
Cyanide Metals (As, Ag, Cd, Cr, Cu, Hg, Pb, Zn)
Sludge as per EIA
6.4.6 Groundwater Quality
No modification has been made to the parameters of the proposed groundwater quality monitoring program presented in Table 6.5. Groundwater monitoring will be conducted in five or six observation wells to be installed on EMAL site property, after coordination with the activities planned for the construction of Phase 2. There will not be any monitoring of external wells.
Table 6.5 EMAL Revised Groundwater Monitoring Program
Area Location Frequency/ Duration
Method/ Instrument Parameters Changes to
EIA program
Plant-wide
Monitoring wells 1 / year
Manual sampling / Laboratory analyses
pH Conductivity Fluoride Oil & grease Salinity Aluminium Sulphates Sodium, Chloride Metals (As, Ba, Cd, Cr, Co, Cu, Hg, Pb, Mo, Ni, Zn) PAH
As per EIA
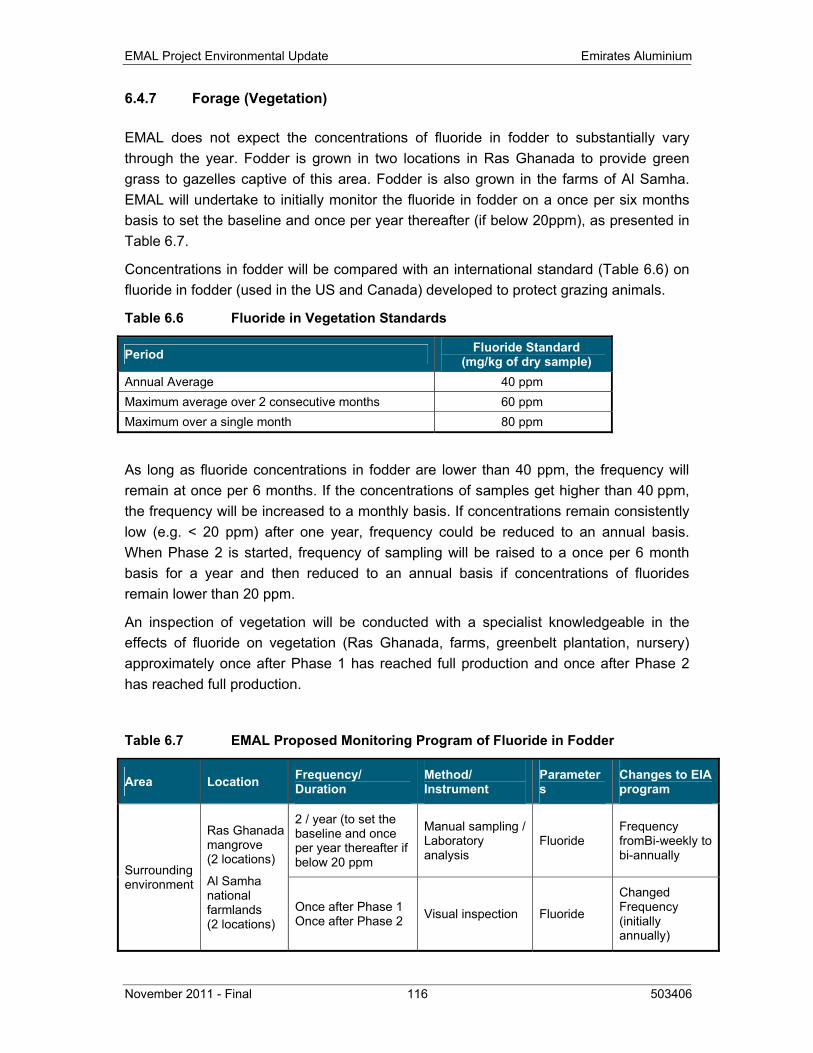
EMAL Project Environmental Update Emirates Aluminium
November 2011 - Final 116 503406
6.4.7 Forage (Vegetation)
EMAL does not expect the concentrations of fluoride in fodder to substantially vary through the year. Fodder is grown in two locations in Ras Ghanada to provide green grass to gazelles captive of this area. Fodder is also grown in the farms of Al Samha. EMAL will undertake to initially monitor the fluoride in fodder on a once per six months basis to set the baseline and once per year thereafter (if below 20ppm), as presented in Table 6.7.
Concentrations in fodder will be compared with an international standard (Table 6.6) on fluoride in fodder (used in the US and Canada) developed to protect grazing animals.
Table 6.6 Fluoride in Vegetation Standards
Period Fluoride Standard (mg/kg of dry sample)
Annual Average 40 ppm Maximum average over 2 consecutive months 60 ppm Maximum over a single month 80 ppm
As long as fluoride concentrations in fodder are lower than 40 ppm, the frequency will remain at once per 6 months. If the concentrations of samples get higher than 40 ppm, the frequency will be increased to a monthly basis. If concentrations remain consistently low (e.g. < 20 ppm) after one year, frequency could be reduced to an annual basis. When Phase 2 is started, frequency of sampling will be raised to a once per 6 month basis for a year and then reduced to an annual basis if concentrations of fluorides remain lower than 20 ppm.
An inspection of vegetation will be conducted with a specialist knowledgeable in the effects of fluoride on vegetation (Ras Ghanada, farms, greenbelt plantation, nursery) approximately once after Phase 1 has reached full production and once after Phase 2 has reached full production.
Table 6.7 EMAL Proposed Monitoring Program of Fluoride in Fodder
Area Location Frequency/ Duration
Method/ Instrument
Parameters
Changes to EIA program
Surrounding environment
Ras Ghanada mangrove (2 locations)
Al Samha national farmlands (2 locations)
2 / year (to set the baseline and once per year thereafter if below 20 ppm
Manual sampling / Laboratory analysis
Fluoride Frequency fromBi-weekly to bi-annually
Once after Phase 1 Once after Phase 2 Visual inspection Fluoride
Changed Frequency (initially annually)
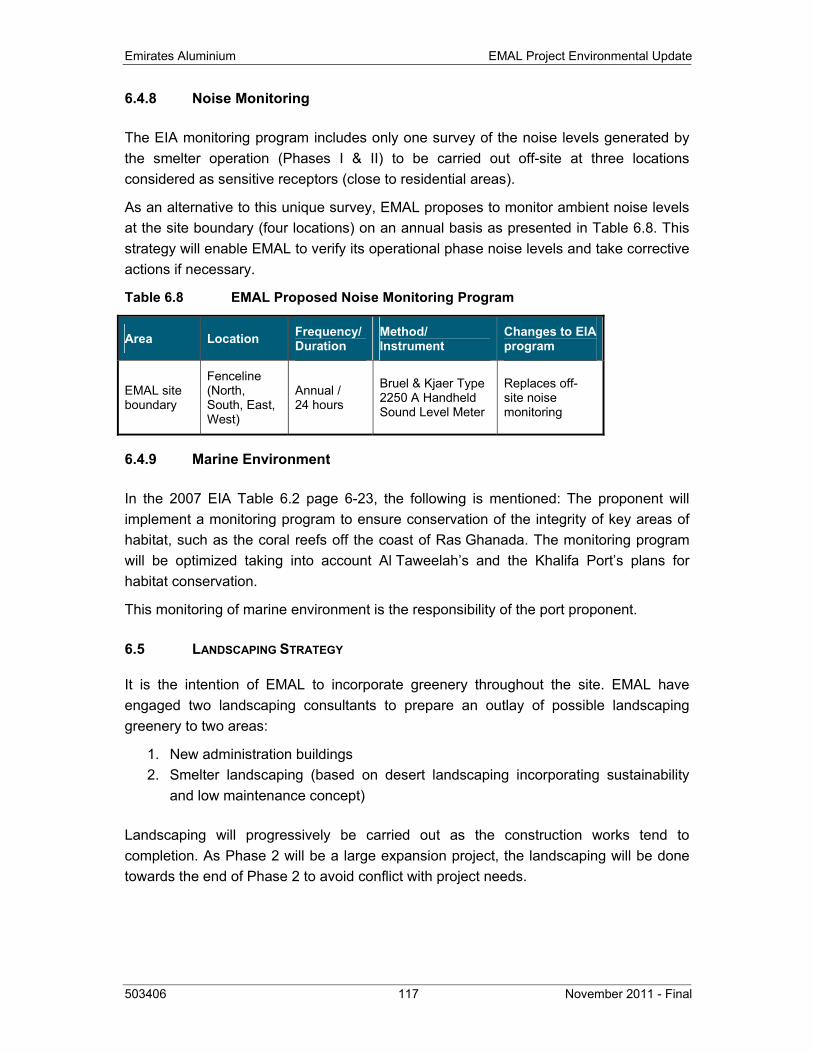
Emirates Aluminium EMAL Project Environmental Update
503406 117 November 2011 - Final
6.4.8 Noise Monitoring
The EIA monitoring program includes only one survey of the noise levels generated by the smelter operation (Phases I & II) to be carried out off-site at three locations considered as sensitive receptors (close to residential areas).
As an alternative to this unique survey, EMAL proposes to monitor ambient noise levels at the site boundary (four locations) on an annual basis as presented in Table 6.8. This strategy will enable EMAL to verify its operational phase noise levels and take corrective actions if necessary.
Table 6.8 EMAL Proposed Noise Monitoring Program
Area Location Frequency/ Duration
Method/ Instrument
Changes to EIA program
EMAL site boundary
Fenceline (North, South, East, West)
Annual / 24 hours
Bruel & Kjaer Type 2250 A Handheld Sound Level Meter
Replaces off-site noise monitoring
6.4.9 Marine Environment
In the 2007 EIA Table 6.2 page 6-23, the following is mentioned: The proponent will implement a monitoring program to ensure conservation of the integrity of key areas of habitat, such as the coral reefs off the coast of Ras Ghanada. The monitoring program will be optimized taking into account Al Taweelah’s and the Khalifa Port’s plans for habitat conservation.
This monitoring of marine environment is the responsibility of the port proponent.
6.5 LANDSCAPING STRATEGY
It is the intention of EMAL to incorporate greenery throughout the site. EMAL have engaged two landscaping consultants to prepare an outlay of possible landscaping greenery to two areas:
1. New administration buildings 2. Smelter landscaping (based on desert landscaping incorporating sustainability
and low maintenance concept)
Landscaping will progressively be carried out as the construction works tend to completion. As Phase 2 will be a large expansion project, the landscaping will be done towards the end of Phase 2 to avoid conflict with project needs.
EMAL Project Environmental Update Emirates Aluminium
November 2011 - Final 118 503406
6.6 GREENHOUSE GASES MANAGEMENT SYSTEM (GHGMS)
The environmental impact associated with EMAL greenhouse gases (GHG) emissions has been identified as being of high significance considering that EMAL Project will result in a significant increase of the overall GHG emissions in the UAE. In order to mitigate this impact, EMAL is developing a GHG Management System (GHGMS) made up of the following elements:
• Reducing GHG emissions at source using technology based on Best Available Techniques (BAT);
• Monitoring GHG emissions to check the effectiveness of emissions management strategies;
• Preparing a GHG inventory;
• Reporting the GHG inventory;
• Reviewing the performance;
• Developing objectives & targets for continual improvement; and,
• Checking the performance by system of internal & external audits.
6.7 PUBLIC CONSULTATION PROCESS
6.7.1 Background
EMAL is an Emirati company, aligned with the Abu Dhabi 2030 vision and built for the benefits of present and future generations. Since its inception, EMAL has been determined to position itself as a considerate and constructive corporate citizen.
This document is part of the overall Stakeholder Engagement Plan Programme (SEP).
EMAL’s Stakeholder Engagement Plan (SEP) is based on the principle of “Neighbour of Choice”, in order to ensure that stakeholders have opportunities to engage effectively with EMAL on an on-going basis. Effective implementation of the SEP will ensure that EMAL actively establishes itself as an integral part of the local community, so that the presence of the smelter in Al Taweelah is seen as a source of pride for the residents of the local community and the region.
This plan provides the basis for effective, transparent and honest two-way communications between EMAL and its stakeholders.
As a local company, it is aiming to align its strategy with the Emirati cultural and social values and benefit from the pride and trust that the Emirati people have for their country and government. The methodologies employed for the public consultation programme are culturally sensitive due to the fact that the culture in the UAE is different from Western countries.
Emirates Aluminium EMAL Project Environmental Update
503406 119 November 2011 - Final
6.7.2 Purpose and Objectives
EMAL has aimed to maintain two way communications with its stakeholders which includes the local community, government entities, and the NGO’s.
The International Finance Corporation (IFC) describes consultation as a two-way process of dialogue between the project company and its stakeholders. The IFC Performance Standards, the basis of the Equator Principles stress that public consultation should continue through the entire life of the project and must be documented to demonstrate that stakeholders had the opportunity to influence the project and be informed of on-going developments (both positive and negative) at the project. The public participation process described below has been designed to fulfil the IFC and Equator Principles objectives for adequate stakeholder consultation, taking into account the culture and the accepted information sharing process in the UAE. This is reinforced by good practice guidance which dictates that the objectives of public participation during environmental authorisation, taking into consideration regulatory requirements and good practice guidelines are to provide sufficient and accessible information to stakeholders to:
• Raise issues of concern and suggestions for enhanced benefits.
• Verify that their issues have been recorded.
• Assist in identifying reasonable alternatives.
• Contribute relevant local information and traditional knowledge to the environmental assessment.
6.7.3 Public Participation Approach
Identification of stakeholders:
Through its Stakeholder Engagement Programme (SEP), EMAL has already identified its stakeholders and they are listed below:
• Government authorities at the National, Regional and Local levels, including Traditional leadership groups.
• Non-commercial and Non-governmental Organizations at the International, National, Regional and Local levels, including organised community-based organisations or interest groups (labour, youth, education, religious, business, etc.).
• EMAL’s local communities, including individual residents as well as non-organised groups with particular areas of interest or that may be at risk (elderly, gender focus, people with disabilities, ethnic minorities, indigenous groups, etc.). EMAL’s local community is defined as the area surrounding the plant site within a radius of 15 km. (other section, earlier in the document)
EMAL Project Environmental Update Emirates Aluminium
November 2011 - Final 120 503406
• Commercial organizations and business associations.
• Employees
• Media
6.7.4 Announcement of the opportunity to become involved in the Phase II consultation process
EMAL uses a range of methods to ensure its stakeholders have the opportunity to participate in the process, which include:
6.7.4.1 The Emirati cultural consultation process – The Majlis
Majlis is a key feature of civilisation in UAE. For decades, friends, neighbours and families would gather in a Majlis.
Meaning 'place of sitting' in Arabic, the term is used to describe a place for social gathering. In a tradition that spans centuries, most homes in the Gulf have a Majlis, where the head of the family hosts guests.
EMAL will update the stakeholders who will attend the Majlis event on the Phase 1 operations including what has been achieved during this phase. Furthermore, the Project team will inform the attendees on EMAL Phase 2 expansion plans. EMAL will also provide the participants the processes to provide feedback in regards to the company’s operations.
EMAL will formally announce the Majlis consultation process by various methods.
Letters of invitation will be sent out to stakeholders and reminder phone calls to ensure maximum participation.
Announcements will also include flyers and advertisement in the newspaper.
The invitations will be sent to specific stakeholder groups (already identified in the Stakeholder Engagement Plan - SEP) which include, as detailed below, ministries at the national level, Abu Dhabi authorities and entities at the regional level, local communities and organizations, non-governmental organizations and employees.
Emirates Aluminium EMAL Project Environmental Update
503406 121 November 2011 - Final
Government Authorities:
On a national level, EMAL is working on building relationships with all Government institutions and ministries. It will continue to engage with:
• Ministry of Defence
• Ministry of Interior
• Ministry of Education
• Ministry of Presidential Affairs
• Ministry of Higher Education and Scientific Research
• Ministry of Economy
• Ministry of Energy
• Ministry of Health
• Ministry of Environment and Water
• Ministry of Culture, Youth and Community Development
• Ministry of Labour
• Ministry of Social Affairs
Letters of invitation to the Majlis event will be sent to the following regional stakeholders:
Emirate of Abu Dhabi
EMAL considers the Emirate of Abu Dhabi as its key regional stakeholder where a close working relationshipsis required with its authorities and entities, including:-
• General authority of youth and sports welfare
• Federal electricity and water authority
• General authority of Islamic affairs and endowments
• Emirates Identity authority
• UAE Red Crescent
• Abu Dhabi Municipality
• Abu Dhabi Police
• Abu Dhabi Authority for Culture & Heritage
• Abu Dhabi Sports Council
• Emirates Foundation
EMAL Project Environmental Update Emirates Aluminium
November 2011 - Final 122 503406
• Health Authority - Abu Dhabi
• Khalifa Fund for Enterprise development
• Family development foundation
• Zayed Higher Organization for Humanitarian & special needs
Local community:
• ADPC
• Al Rahba Police
• KIZAD
• Dolphin Energy
• Schools and kindergartens
• Emirates Post – Al Rahba
• Al Rahba Hospital
• Culture & Heritage Club - Al Samha
• Al Wehda Club- Al Shahama
• Al Samha Civil Defence
• Navy Base – Al Taweelah
• Al Taweelah Power Station
• Al Shahama Municipality
• Al Shahama Transportation –DoT
Letters of invitations to the Majlis event will be sent to all the Non-government agencies (eg. Emirates Wildlife Society, EEG etc.) that work in the UAE, public and community-based organisations that promote Environmental, Safety and Health awareness and supporting humanitarian causes. Communicating with these NGO’s will allow EMAL to convey to them its Environmental and Community commitment and answer all their queries and concerns.
Stakeholder lists for local communities will be developed throughout the stakeholder engagement process and the implementation of the SEP.
Stakeholders may be individual residents or representatives of an interest group such as an agricultural association, youth group or business collective. The purpose of stakeholder identification within the local communities is to identify, document and manage different stakeholder interests and issues pertaining to the project. Local
Emirates Aluminium EMAL Project Environmental Update
503406 123 November 2011 - Final
communities will not be considered as one stakeholder group, as individuals and groups may have numerous, diverse and conflicting interests
Announcement of the Majlis to the commercial organisations will be done through press releases.
EMAL is an Emirati company, operating in the UAE. Thus, one of its main objectives is to contribute to the national economy growth and to contribute to the individual welfare. Providing business opportunities to the local companies is one way to fulfil this objective.
Therefore, EMAL is providing opportunities to commercial organisations owned by UAE Nationals, with a focus on people from the community.
The procurement department has a policy to give priority to companies listed in Khalifa Fund for Enterprise Development and Fund Mohammed bin Rashid Establishment for Young Business Leaders.
Announcement of the Majlis event to the employees will be done through internal newsletters and internal emails.
Employees should be considered a stakeholder category, however, as with project-affected communities, not all employees will have the same interests or issues. Within the category of project employees, there may be many stakeholders. Stakeholders in this category may be individuals with specific issues and interests or groups, such as a labour union.
Announcement of the Majlis event to the Media will be done through press releases which will include:
• Journalists: Analysts, Business editors, environment and social editors
• Geographic outreach: International, Regional and National media
• Media Vehicle: Print, broadcast and online
• Languages: mainly in Arabic and English
6.7.4.2 Information sharing
EMAL engages the public and shares credible and transparent information with the public through various methods including:
• (Mujtama’una) a quarterly community newsletter that includes EMAL updates achievements, job offers and community events.
• Majlis
• A dedicated website with a section dedicated to grievance email
• Press release and photo stories.
• Open days with the community.
EMAL Project Environmental Update Emirates Aluminium
November 2011 - Final 124 503406
• National Days.
• Site tours.
EMAL includes contacts on the website and the community newsletter to ensure interested parties have various easy means to contact EMAL regarding any issue.
6.7.4.3 Comments and Responses Received
EMAL will capture all the comments that will be raised by the community members during the Majlis event. This will include capturing their verbal comments and/or by requesting them to fill a survey form which will be distributed to all attendees before they leave the Majlis area. The survey will try to capture all cooments, questions, any concerns, identify the key areas (both positive and negative), EMAL’s response process, future consultation processes etc.
6.7.4.4 Opportunity for on-going participation
The grievance mechanism is a management tool designed to help address stakeholder concerns promptly and facilitate a trustworthy and constructive relationship. The purpose of a grievance mechanism is to demonstrate responsiveness to stakeholder needs. It is a mechanism through which the communities and individuals affected my EMAL’s activities can formally communicate their concerns and grievances to the company and facilitate resolutions that are mutually acceptable by the parties, within a reasonable timeframe.
EMAL grievance mechanism may be submitted by telephone, in writing, via the EMAL Cares link on www.emal.ae or in person at the company offices, or verbally through the Community Officer and Senior Executive, who will put the grievance in writing for management purposes.
All formal grievances will receive a formal reply within two weeks (10 working days). The formal response will provide additional information or, if appropriate, further instructions on proposed measures to resolve the issues. All grievances will be documented. The importance of documenting all grievances is to make sure problems are accurately understood and handled appropriately.
After the Majlis event EMAL will collect feedback from the attendees and schedule continuous face to face meetings.
SMS messages and emails will be sent to the Majlis attendees to thank them for joining the Majlis and to re-inform them about the website section where they can also include their feedback.
Emirates Aluminium EMAL Project Environmental Update
503406 125 November 2011 - Final
7 REFERENCES
DUBAL. Fluoride levels in vegetation. Personal communication. October 2011
Dutch Ministry of Housing, Spatial Planning and the Environment 2000. Circular on target values and intervention values for soil remediation.
European Commission (EC) 2009. Integrated Pollution Prevention and Control. Draft Reference Document on Best Available Techniques in the Non Ferrous Metals Industries. 842 p.
Higher Corporation for Specialized Economic Zones (ZonesCorp) September 2008. Code of Practice – EHS Management for Workers’ Residential Cities. ZonesCorp COP-EHS08. 35 p.
International Finance Corporation (IFC) and the European Bank for Reconstruction and Development (EBRD) August 2009. Workers’ accommodation: processes and standards. Guidance note by IFC and the EBRD. 34 p.
International Finance Corporation (IFC) December 2008. Environmental, Health and Safety Guidelines for Thermal Power Plants. 33 p.
International Finance Corporation (IFC) 2007. Environmental, Health and Safety Guidelines – Base Metal Smelting and Refining. 23 p.
IPPC 1996. Estimated Emission Factors for European Non-Road Mobile Sources and Machinery.
National Energy & Water Research Center (NEWRC) / Abu Dhabi Water and Electricity Authority (ADWEA) 2010. Samha Air Quality Summary Report - January 2007 to December 2009.
Norwegian Institute for Air Research (NILU) 2011. Baseline Ambient Air Quality Monitoring at KPIZ, Abu Dhabi.
PB Power and Dome Oilfield 2005. New Taweelah B Extension Project. Environmental Statement. 254 p. and appendices.
SNC-Lavalin International Inc. (SLII) May- June 2011. EMAL Taweelah Aluminium Smelter Complex Phase 2 - Front End Engineering and Design (FEED) Study Report.
SNC-Lavalin International Inc. (SLII). October 2011. Response to EAD Observations on EMAL Smelter Complex Phase 2 Technical Modifications # 2. EMAL Smelter Complex Phase 2. 15 p. + annexes
SNC-Lavalin International Inc. (SLII). June 2011. Technical Modifications # 2. EMAL Smelter Complex Phase 2. 37 p. + annexes
SNC-Lavalin International Inc. (SLII). January 2011. Technical Modifications. EMAL Smelter Complex Phase 2. 21 p.
EMAL Project Environmental Update Emirates Aluminium
November 2011 - Final 126 503406
SNC-Lavalin Environment 2007a. Emirates Aluminium Environmental Impact Assessment
SNC-Lavalin Environment 2007b. Emirates Aluminium Environmental Impact Assessment – Addendum A
Sustainability for Environment & Education Consulting (Sustainability) 2007. Soil and Groundwater Environmental Baseline Data for EMAL Aluminium Smelter Complex Site. Document no. 017661-LB-RDC-0001.
WEINSTEIN, L. 2006. Vegetation Survey and Impact of Fluorides from DUBAL. Unpublished report.

APPENDIX A


www.snclavalin.com
SNC-LAVALIN Inc. 455 René-Lévesque Blvd. West Montreal, Quebec H2Z 1Z3 Canada Tel.: (514) 393-1000 Fax: (514) 866-0795