elemental composition of biogas residues: variability and alteration during anaerobic digestion
TRANSCRIPT
ww.sciencedirect.com
b i om a s s a n d b i o e n e r g y 6 7 ( 2 0 1 4 ) 8 9e9 8
Available online at w
ScienceDirect
http: / /www.elsevier .com/locate/biombioe
Elemental composition of biogas residues:Variability and alteration during anaerobicdigestion
Doreen Zirkler a,*, Andre Peters b, Martin Kaupenjohann a
aTechnical University of Berlin, Department of Soil Science, Ernst-Reuter-Platz 1, 10587 Berlin, GermanybTechnical University of Berlin, Department of Soil Conservation, Ernst-Reuter-Platz 1, 10587 Berlin, Germany
a r t i c l e i n f o
Article history:
Received 22 January 2014
Received in revised form
15 April 2014
Accepted 17 April 2014
Available online
Keywords:
Digestate
Heavy metals
Nutrients
Biogas plant feedstock
Element balance
Element recovery
* Corresponding author. Tel.: þ49 30 314 73 5E-mail addresses: doreen.zirkler@tu-berl
(M. Kaupenjohann).http://dx.doi.org/10.1016/j.biombioe.2014.04.0961-9534/ª 2014 Elsevier Ltd. All rights rese
a b s t r a c t
Biogas production and the amount of thereby incurred digestates increased remarkably in
the last decade. Digestates should be used as soil fertilizers to close nutrient cycles.
However, knowledge about the elemental composition of digestates from biogas produc-
tion and element losses or accumulations during fermentation process is insufficient so
far. Intending to enlarge the database for the elemental composition of digestates and to
investigate element in- and outputs of biogas fermenters, we measured the concentrations
of C, N, P, K, S, Ca, Mg, Fe, Mn, Zn, Cu, Pb, Cd, Ni, Mo and Se of digestates and feedstock
(ingestates) of four full-scale biogas plants in Germany monthly over a one year period.
Ingestates were sewage sludge, fat and mash (SEW1), sewage sludge and fat (SEW2), pig
slurry, treacle and food residues (SL) and maize silage (M). We developed a statistical
method to calculate the number of required sampling dates which have to be integrated for
the calculation of reliable element budgets between ingestates and digestates for the case
when information about the amount and composition of the produced biogas is not
available. Our results suggest that two (SEW2), five (SEW1, M) and 10 (SL) sampling dates
had to be integrated for reliable balances. All fermenters revealed losses of N, most likely
due to volatilization of NH3. Losses of S (probably H2S), Mg (precipitation of struvite), Cd and
Zn (precipitation of sulfides) could be detected in some cases. Iron and Mn accumulations
can be attributed to attrition of the stirrer.
ª 2014 Elsevier Ltd. All rights reserved.
1. Introduction
Whilst the worldwide growing demand for energy has to be
satisfied, the concentration of greenhouse gases in the at-
mosphere steadily increases due to emissions from fossil fuel
combustions [1]. Thus, in recent decades, the urgent need for
the production of renewable energy has been well-known.
20; fax: þ49 30 314 73 54in.de (D. Zirkler), andre.p
021rved.
Biogas production, for example, expanded rapidly in the last
10 years. In Germany, the number of biogas plants increased
from nearly 1600 in 2002 to more than 7000 in 2011 [2]. This
development is especially driven by the German policy of
promoting renewable energies by the “EEG” (Erneuerbare-
Energien-Gesetz) in year 2000 and its amendments in the
following years. Biogas can replace fossil fuels in power and
heat production and can also be used as gaseous vehicle fuel
[email protected] (A. Peters), [email protected]
Abbreviations
SEW1 Digestate derived from sewage sludge, fat and
mash
SEW2 Digestate derived from sewage sludge and a
small amount of fat
SL Digestate derived from pig slurry and food
residues
M Digestate derived from maize silage and little
grass
EEG German law “Erneuerbare-Energien-Gesetz”
b i om a s s a n d b i o e n e r g y 6 7 ( 2 0 1 4 ) 8 9e9 890
[1]. However, production of energy crops for anaerobic diges-
tion competes against food production for agricultural land.
Additionally, the increasing cultivation of energy crops pro-
vokes land-use changes and monocultures which often
involve environmental disadvantages such as loss of biodi-
versity or soil erosion [3]. Therefore, wastes and edible organic
residues are preferable feedstocks for anaerobic digestion. An
additional benefit of waste fermentation is the reduction of
odour and mass reduction of landfilled agricultural and
municipal waste due to the conversion of organic material to
methane (CH4) and carbon dioxide (CO2) [4].
For a life cycle assessment of biogas production the whole
process chain has to be considered [5]. This also includes the
recirculation of digestates and nutrients contained therein to
the soil where new biomass is cultivated. Alburquerque et al.
[5] even assume advantages of digestate fertilization
compared to non-fermented organic fertilizers, such as a
greater microbial stability and hygiene as well as greater
available nitrogen (N). But before utilization as fertilizer or
amendment, the elemental composition of digestates has to
be known to evaluate fertilizing effects and to prevent
contamination of soils. Since anaerobic digestion alters the
chemical properties of the initial biomass (ingestate), knowl-
edge about the composition of the initial material is not suf-
ficient. However, investigations about the elemental
composition of the resulting digestates are scarce [4,6,7]. Table
1 shows some chemical characteristics of various digestates
which can be found in the literature so far. Furthermore, a
number of non-peer-reviewed publications about character-
istics of digestates exist but are not cited here.
Scanning the literature reveals that mostly only a few
chemical characteristics have been investigated so far, with
most authors focussing on N, P and K. In particular, heavy
metals like lead (Pb), cadmium (Cd) or nickel (Ni) are under-
represented. Thus, more extensive data for digestate charac-
teristics are needed. Table 1 also shows that element
concentrations of digestates are highly variable and depend
on the kind of ingestate. Additionally, the elemental compo-
sition of digestates is influenced by digestion process char-
acteristics. During fermentation, varying amounts of N and S
can volatilize from the ingestate [16,18] and heavy metals can
accumulate in the ingestate due to attrition from the stirrer,
for example [15]. A few authors [19,20] studied the fate of
nutrients during fermentation and calculated element mass
balances. However, again these studies only focussed on N, P
and K. Furthermore, data about the mass of produced biogas
are not always available as in the mentioned studies [19,20],
i.e. another way to account for the mass losses due to biogas
emission from the substrate has to be found to conduct an
element balance in this case.
Thus, the aims of our study were:
1. To give an overview of the elemental composition, partic-
ularly heavy metal concentrations, of digestates from four
full-scale biogas plants in Germany.
2. To investigate the temporal variability of digestates’
elemental composition within one biogas plant.
3. To investigate the difference in digestates’ elemental
composition between different biogas plants.
4. To identify element losses or accumulations during the
digestion process.
2. Materials and methods
2.1. Digestates and element analysis
We collected digestates and ingestates from four biogas plants
(wet fermentation) at intervals of one month over one year.
The main process parameters of the biogas plants and diges-
tate abbreviations used in this study are given in Table 2.
Digestates and ingestates were freeze-dried and ground in
the laboratory. Carbon (C), N and sulfur (S) weremeasured by a
CNS Analyser (Elementar Vario EL III). Additionally, digestates
and ingestates were digested with 10 ml 69% HNO3 (Suprapur,
Roth, Karlsruhe, Germany) for 15 min at 180 �C in amicrowave
pressure apparatus (Mars Xpress, CEM, Kamp-Lintfort, Ger-
many). All samples were digested in duplicate. Concentra-
tions of calcium (Ca), magnesium (Mg), potassium (K), iron
(Fe), manganese (Mn), zinc (Zn) and copper (Cu) were analysed
with flame AAS (Perkin Elmer Atomic Absorption Spectro-
photometer 1100B). Lead, Cd and Ni were determined by a
Varian graphite furnace AAS (SpectrAA 880Z), molybdenum
(Mo) and selenium (Se) by an ICP-OES (iCAP 6000 Series,
Thermo Scientific) and phosphorus (P) by a Continuous Flow
Analyser (880 nm wavelength, Skalar San plus system 5120).
2.2. Correction of nitrogen analysis
Mineral N is mainly present as ammonium (NH4þ) in digestates
due to anaerobic conditions in the biogas fermenter. High pHof
the digestates can facilitate gaseous losses of N as ammonia
(NH3) [21]. Ammonia emissions during digestate preparation in
the laboratory can therefore lead to an underestimation of N
concentrations in the digestates. Previous acidification of the
digestates with hydrochloric acid (HCl) could be a suitable
method to prevent NH3 emissions during sample preparations.
Exemplarily, we acidified the digestates prior to any further
treatment at six different sampling dates and compared N
concentrations to those of non-acidified digestates in order to
find the average potential for N losses of the digestates and to
get a correction factorwhichwe applied to our N concentration
data obtained fromnon-acidified digestates.We added 1 MHCl
to the digestates until a pH of 6 was reached. Under these con-
ditions the amount of NH3 should be decreased to 0.1% and the
majority of mineral N should be present as non-volatile NH4þ

Table 1 e Digestates and analyzed chemical parameters in the literature (FS: Fermenter scale, F: Full-scale biogas plant, L: Laboratory or pilot scale fermenter, ±: standarddeviation over different samples).
Author Ingestate FS pH dm TOC N P K S Ca Mg Fe Mn Zn Cu Pb Cd Ni Mo Se
g kg�1 related to dm mgkg�1 related to dm
[9] Cattle slurryþ 4% glycerine L 5.6 38b 465 49 13 47 4.6 40 7 3.0 358 473 282 e e e e e
Cattle slurryþ 6% glycerine L 7.4 73b 587 32 5 22 3.6 24 5 2.3 235 388 178 e e e e e
Cattle slurryþ 5% orange peel residues L 7.9 24b 385 59 8 45 4.6 41 11 1.2 246 316 115 e e e e e
Pig slurryþ 0.6% pasteurized slaughterhouse waste L 8.0 21b 276 138 24 105 10 38 15 2.4 543 4019 681 e e e e e
Pig slurryþ 1% sludge from slaughterhouse wastewater
treatment plantþ 6.5% biodiesel wastewater
F 8.2 20b 303 205 10 103 35 11 3 1.1 149 1779 206 e e e e e
Cattle slurryþ 4.3% cattle manureþ 11.6% maize oat silage F 7.5 90b 374 44 9 34 5 45 8 3.3 305 307 120 e e e e e
[10] Pig slurryþ 1% sludge from slaughterhouse wastewater
treatment plantþ 6.5% biodiesel wastewater
F 8.3 1.9a 247 200 6 52 e 26 10 1 158 1158 211 2 0.5 e e e
[11] Source-separated biodegradable household waste F 8.0 1.5a e 152 16 78 7 50 10 e <0.7 79 13 e e e e e
[12] Cattle slurry L 8.5 e 500 42 9 13 3.6 20 6 2.0 164 137 44 e e e e e
Pig slurry L 7.3 e 551 43 20 18 4.6 34 12 1.0 245 1304 121 e e e e e
Poultry slurry L 7.8 e 452 67 24 24 5.3 92 6 1.8 663 578 105 e e e e e
[13] Cattle slurry L 7.7 9.2a 355c 43 7 47 e e 18 e e e e e e e e e
[14] Maize L e e e e e e e e e e e 34 29 1.3 0.05 5 e e
Horse manure L e e e e e e e e e e e 43 14 3.2 0.3 3.8 e e
[6] 80% OFMSWþ 20% pig slurrye F e 4� 1a 481� 30 144� 8 5.4� 2 23� 2 e e e e e e e e e e e e
48% Pig slurryþ 24% milk serumþ 14% cow slurryþ 10%
maize silageþ 4% rice residuesdF e 4� 1a 483� 13 93� 14 11 13.5� 2 e e e e e e e e e e e e
65% Pig slurryþ 20% blood industry residuesþ 15%
maize silageeF e 6� 0.5a 488� 9 88� 4 12� 1 28� 6 e e e e e e e e e e e e
[8] Sewage sludged F e 20� 1a 291� 18 42� 11 32� 5 e e e e e e e e e e e e e
17% Fatþ 75% rabbit manure and urban sludgeþ 8%
duck slaughterhouse sludge
F e 20a 365 25 14 e e e e e e e e e e e e e
70% cattle manureþ 7% rabbit manureþ 3% garden
wastesþ 17% fruits and vegetables
F e 24a 330 20 8 e e e e e e e e e e e e e
Source-selected fraction of municipal solid wastesd F e 44� 2a 274� 104 14� 1 6� 5 e e e e e e e e e e e e e
[15] Organic fraction of municipal solid waste L e e e e e e e e e e e 77 25 5 0 50 e e
[16] 25 Different mixtures of pig and/or cattle slurry,
manure and maize and/or grass silage
F e e e e e e 4.4� 0.7 e e 2.6� 1.6 e e e e e 6.2� 3.3 3� 1 0.5� 0.3
[17] Cow slurry F 8.6 5.2a 274c 22 1 17 e 20 e e e ee e e e e e e
Mean 399 76 11 42 8 37 9 2 279 764 153 2.9 0.21 16 e e
Standard deviation 104 60 6 30 9 21 4 0.8 187 1079 173 1.6 0.23 23 e e
a dm (Dry matter) in %.b dm in g l�1.c Total C.d Average over two different samples.e Average over three different samples.
bio
mass
and
bio
energy
67
(2014)89e98
91
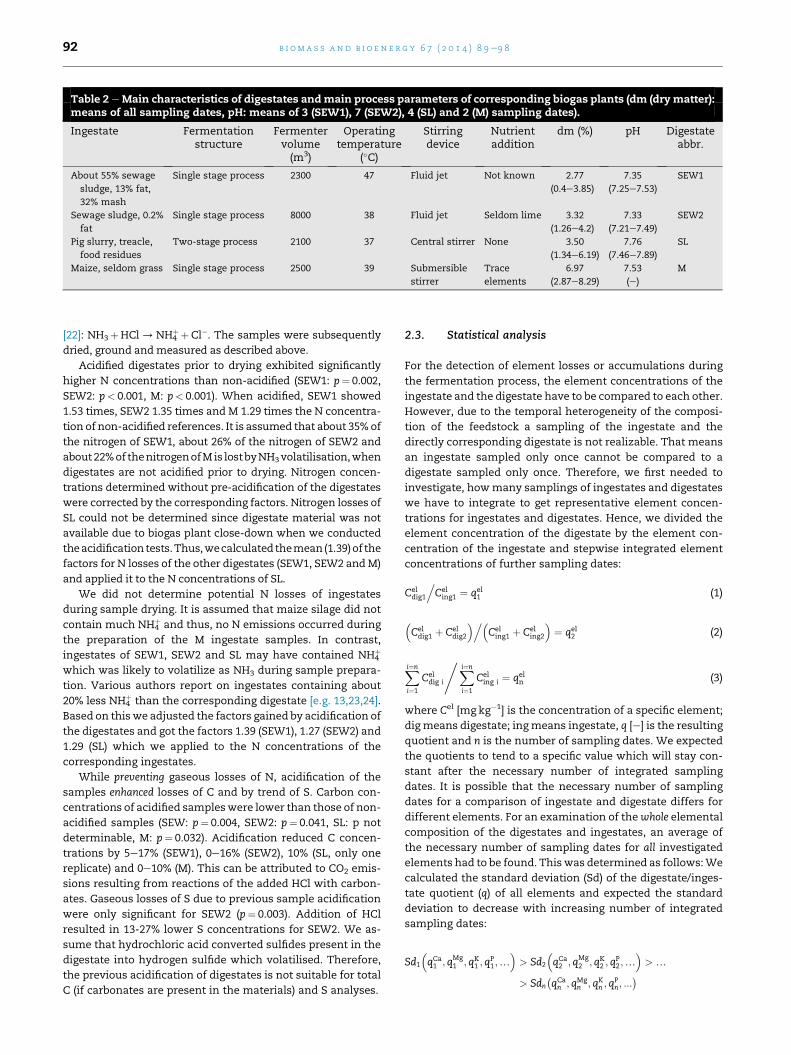
Table 2 eMain characteristics of digestates andmain process parameters of corresponding biogas plants (dm (drymatter):means of all sampling dates, pH: means of 3 (SEW1), 7 (SEW2), 4 (SL) and 2 (M) sampling dates).
Ingestate Fermentationstructure
Fermentervolume(m3)
Operatingtemperature
(�C)
Stirringdevice
Nutrientaddition
dm (%) pH Digestateabbr.
About 55% sewage
sludge, 13% fat,
32% mash
Single stage process 2300 47 Fluid jet Not known 2.77
(0.4e3.85)
7.35
(7.25e7.53)
SEW1
Sewage sludge, 0.2%
fat
Single stage process 8000 38 Fluid jet Seldom lime 3.32
(1.26e4.2)
7.33
(7.21e7.49)
SEW2
Pig slurry, treacle,
food residues
Two-stage process 2100 37 Central stirrer None 3.50
(1.34e6.19)
7.76
(7.46e7.89)
SL
Maize, seldom grass Single stage process 2500 39 Submersible
stirrer
Trace
elements
6.97
(2.87e8.29)
7.53
(e)
M
b i om a s s a n d b i o e n e r g y 6 7 ( 2 0 1 4 ) 8 9e9 892
[22]: NH3þHCl/NH4þþCl�. The samples were subsequently
dried, ground andmeasured as described above.
Acidified digestates prior to drying exhibited significantly
higher N concentrations than non-acidified (SEW1: p¼ 0.002,
SEW2: p< 0.001, M: p< 0.001). When acidified, SEW1 showed
1.53 times, SEW2 1.35 times and M 1.29 times the N concentra-
tion of non-acidified references. It is assumed that about 35%of
the nitrogen of SEW1, about 26% of the nitrogen of SEW2 and
about22%of thenitrogenofM is lostbyNH3volatilisation,when
digestates are not acidified prior to drying. Nitrogen concen-
trations determined without pre-acidification of the digestates
were corrected by the corresponding factors. Nitrogen losses of
SL could not be determined since digestate material was not
available due to biogas plant close-down when we conducted
theacidification tests.Thus,wecalculated themean(1.39)of the
factors for N losses of the other digestates (SEW1, SEW2 andM)
and applied it to the N concentrations of SL.
We did not determine potential N losses of ingestates
during sample drying. It is assumed that maize silage did not
contain much NH4þ and thus, no N emissions occurred during
the preparation of the M ingestate samples. In contrast,
ingestates of SEW1, SEW2 and SL may have contained NH4þ
which was likely to volatilize as NH3 during sample prepara-
tion. Various authors report on ingestates containing about
20% less NH4þ than the corresponding digestate [e.g. 13,23,24].
Based on thiswe adjusted the factors gained by acidification of
the digestates and got the factors 1.39 (SEW1), 1.27 (SEW2) and
1.29 (SL) which we applied to the N concentrations of the
corresponding ingestates.
While preventing gaseous losses of N, acidification of the
samples enhanced losses of C and by trend of S. Carbon con-
centrations of acidified sampleswere lower than those of non-
acidified samples (SEW: p¼ 0.004, SEW2: p¼ 0.041, SL: p not
determinable, M: p¼ 0.032). Acidification reduced C concen-
trations by 5e17% (SEW1), 0e16% (SEW2), 10% (SL, only one
replicate) and 0e10% (M). This can be attributed to CO2 emis-
sions resulting from reactions of the added HCl with carbon-
ates. Gaseous losses of S due to previous sample acidification
were only significant for SEW2 (p¼ 0.003). Addition of HCl
resulted in 13-27% lower S concentrations for SEW2. We as-
sume that hydrochloric acid converted sulfides present in the
digestate into hydrogen sulfide which volatilised. Therefore,
the previous acidification of digestates is not suitable for total
C (if carbonates are present in the materials) and S analyses.
2.3. Statistical analysis
For the detection of element losses or accumulations during
the fermentation process, the element concentrations of the
ingestate and the digestate have to be compared to each other.
However, due to the temporal heterogeneity of the composi-
tion of the feedstock a sampling of the ingestate and the
directly corresponding digestate is not realizable. That means
an ingestate sampled only once cannot be compared to a
digestate sampled only once. Therefore, we first needed to
investigate, howmany samplings of ingestates and digestates
we have to integrate to get representative element concen-
trations for ingestates and digestates. Hence, we divided the
element concentration of the digestate by the element con-
centration of the ingestate and stepwise integrated element
concentrations of further sampling dates:
Celdig1
.Celing1 ¼ qel
1 (1)
�Celdig1 þ Cel
dig2
�.�Celing1 þ Cel
ing2
�¼ qel
2 (2)
Xi¼n
i¼1
Celdig i
,Xi¼n
i¼1
Celing i ¼ qel
n (3)
where Cel [mg kg�1] is the concentration of a specific element;
dig means digestate; ingmeans ingestate, q [e] is the resulting
quotient and n is the number of sampling dates. We expected
the quotients to tend to a specific value which will stay con-
stant after the necessary number of integrated sampling
dates. It is possible that the necessary number of sampling
dates for a comparison of ingestate and digestate differs for
different elements. For an examination of thewhole elemental
composition of the digestates and ingestates, an average of
the necessary number of sampling dates for all investigated
elements had to be found. Thiswas determined as follows:We
calculated the standard deviation (Sd) of the digestate/inges-
tate quotient (q) of all elements and expected the standard
deviation to decrease with increasing number of integrated
sampling dates:
Sd1
�qCa1 ;qMg
1 ;qK1 ;q
P1;.
�> Sd2
�qCa2 ;qMg
2 ;qK2 ; q
P2;.
�> .
> Sdn
�qCan ; qMg
n ; qKn ;q
Pn; :::
�
b i om a s s a n d b i o e n e r g y 6 7 ( 2 0 1 4 ) 8 9e9 8 93
We also expect the standard deviation to tend to a mini-
mumwhich should stay constant after the necessary number
of integrated sampling dates was approached. Subsequently,
we intended to compare the element concentrations of the
ingestate to the element concentrations of the digestate after
integration of the previously determined number of sampling
dates. However, concentrations cannot be simply compared
to each other since they refer to differing dry masses due to
gaseous losses of matter during the fermentation process.
Thus, a reference remaining constant during fermentation
processes had to be found and we considered K to meet this
requirement. This assumption is in accordance with Banks
et al. [19] who showed that 96.4% of the K in the ingestate was
recovered after anaerobic digestion. We compared the ratio of
K concentration and element concentration of the ingestate to
the ratio of K concentration and element concentration of the
digestate. Concentrations for this were averages from the
previously determined number of sampling dates. These av-
erages were generated in five replicates, always using another
set of sampling dates, in order to test the precision of the
determination of sampling dates. Then we calculated the
quotient qK of the ingestate ratio and the digestate ratio. If the
result was nearly 1, no accumulation or losses had occurred. If
the result was greater than 1, an accumulation had occurred
during the fermentation process, and if it was less than 1, an
element loss had occurred.
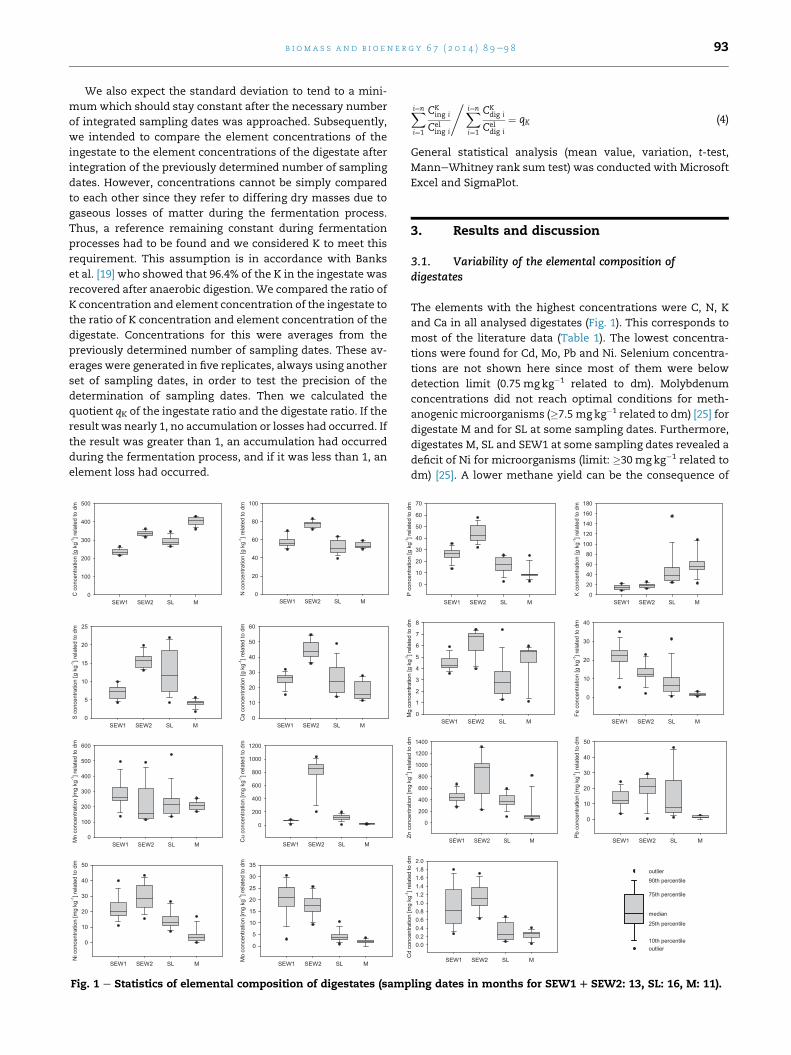
Fig. 1 e Statistics of elemental composition of digestates (samp
Xi¼n
i¼1
CKing i
Celing i
,Xi¼n
i¼1
CKdig i
Celdig i
¼ qK (4)
General statistical analysis (mean value, variation, t-test,
ManneWhitney rank sum test) was conducted with Microsoft
Excel and SigmaPlot.
3. Results and discussion
3.1. Variability of the elemental composition ofdigestates
The elements with the highest concentrations were C, N, K
and Ca in all analysed digestates (Fig. 1). This corresponds to
most of the literature data (Table 1). The lowest concentra-
tions were found for Cd, Mo, Pb and Ni. Selenium concentra-
tions are not shown here since most of them were below
detection limit (0.75 mg kg�1 related to dm). Molybdenum
concentrations did not reach optimal conditions for meth-
anogenicmicroorganisms (�7.5 mg kg�1 related to dm) [25] for
digestate M and for SL at some sampling dates. Furthermore,
digestates M, SL and SEW1 at some sampling dates revealed a
deficit of Ni for microorganisms (limit: �30 mg kg�1 related to
dm) [25]. A lower methane yield can be the consequence of
ling dates in months for SEW1D SEW2: 13, SL: 16, M: 11).
b i om a s s a n d b i o e n e r g y 6 7 ( 2 0 1 4 ) 8 9e9 894
these low trace element concentrations. However, re-
quirements of methanogens for micronutrients heavily
depend on the type of ingestate [26].
As expected for sewage sludge, digestates SEW1 and SEW2
showed high P concentrations. Phosphorus concentrations of
SEW2 (up to 60 g kg�1 related to dm) even exceeded those
found in the literature (Table 1, 1e32 g kg�1 related to dm).
This can be attributed to the fact that nearly 100% of the
ingestate of SEW2 was sewage sludge. In comparison to SL, M
and literature data, SEW1 and SEW2 additionally exhibited
high Fe concentrations which is also typical for sewage sludge
material since Fe is often applied in order to precipitate P
during wastewater treatment. Iron concentration for the only
sewage sludge derived digestate found in the literature was
not determined by the authors cited in Table 1. Digestates
SEW1 and SEW2 also showed highest concentrations of other
heavy metals like Zn, Pb, Cd and Ni. Copper concentrations of
SEW2 (up to 1.2 g kg�1 related to dm) partly exceeded the range
of literature data (0.01e0.7 g kg�1 related to dm) and threshold
value of the German limits for sewage sludge (0.8 g kg�1
related to dm) [27]. Copper (up to 0.2 g kg�1 related to dm) and
Zn (up to 0.6 g kg�1 related to dm) concentrations of SL were
also above threshold values of the German decree for bio-
wastes which has to be consulted in this case (Cu: 0.1 g kg�1
and Zn: 0.4 g kg�1 related to dm) [28]. These high Cu and Zn
concentrations in SL are most likely a result of Cu and Zn
addition to pig feed. Another possible reason is the co-
fermentation of slurry with other wastes and residues. The
latter may have increased Cu and Zn concentrations in SL to a
minor degree as well. Compared to the other digestates,
digestate M showed low heavy metal concentrations but
particularly high C and K concentrations which is typical of
plants, such as maize, the ingestate of digestate M. It is less
decomposed than sewage sludge or slurry which have already
passed a human or animal digestive tract. Other element
concentrations of M were unremarkable compared to litera-
ture data.With the exception of concentrations of P, Fe, Cu, Pb
and Cd for SEW2 and in some cases SEW1, element concen-
trations of the investigated digestates were in the wide range
of literature data.
Our results indicate that the elemental composition of
digestates varied remarkably depending on the kind of
ingestate and fermentation procedure. This is in accordance
with findings of Alburquerque et al. [5, 9] and Schattauer et al.
[29]. The latter found variations of 1e2 orders of magnitude
concerning the trace element concentrations of the digestates
of 10 different biogas plants. However, variation does not only
occur between digestates of different biogas plants but also
between digestates of one single biogas plant over time.
Temporal variations were particularly pronounced for SL,
followed by SEW2 and SEW1. These digestates derived from
co-fermentation of different ingestates, which were mixed in
varying proportions. Digestate M originated from predomi-
nantly homogenous ingestate and accordingly showed the
lowest temporal variations in elemental composition.
3.2. Ingestateedigestate relationship
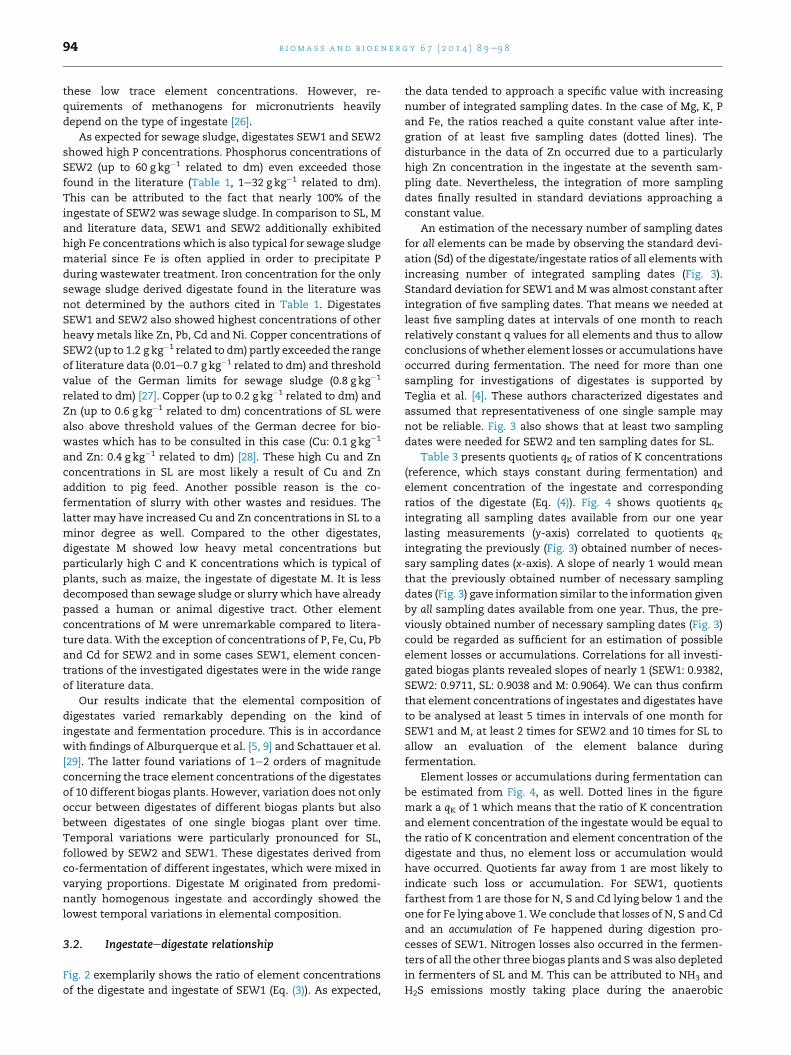
Fig. 2 exemplarily shows the ratio of element concentrations
of the digestate and ingestate of SEW1 (Eq. (3)). As expected,
the data tended to approach a specific value with increasing
number of integrated sampling dates. In the case of Mg, K, P
and Fe, the ratios reached a quite constant value after inte-
gration of at least five sampling dates (dotted lines). The
disturbance in the data of Zn occurred due to a particularly
high Zn concentration in the ingestate at the seventh sam-
pling date. Nevertheless, the integration of more sampling
dates finally resulted in standard deviations approaching a
constant value.
An estimation of the necessary number of sampling dates
for all elements can be made by observing the standard devi-
ation (Sd) of the digestate/ingestate ratios of all elements with
increasing number of integrated sampling dates (Fig. 3).
Standard deviation for SEW1 and Mwas almost constant after
integration of five sampling dates. That means we needed at
least five sampling dates at intervals of one month to reach
relatively constant q values for all elements and thus to allow
conclusions of whether element losses or accumulations have
occurred during fermentation. The need for more than one
sampling for investigations of digestates is supported by
Teglia et al. [4]. These authors characterized digestates and
assumed that representativeness of one single sample may
not be reliable. Fig. 3 also shows that at least two sampling
dates were needed for SEW2 and ten sampling dates for SL.
Table 3 presents quotients qK of ratios of K concentrations
(reference, which stays constant during fermentation) and
element concentration of the ingestate and corresponding
ratios of the digestate (Eq. (4)). Fig. 4 shows quotients qKintegrating all sampling dates available from our one year
lasting measurements (y-axis) correlated to quotients qKintegrating the previously (Fig. 3) obtained number of neces-
sary sampling dates (x-axis). A slope of nearly 1 would mean
that the previously obtained number of necessary sampling
dates (Fig. 3) gave information similar to the information given
by all sampling dates available from one year. Thus, the pre-
viously obtained number of necessary sampling dates (Fig. 3)
could be regarded as sufficient for an estimation of possible
element losses or accumulations. Correlations for all investi-
gated biogas plants revealed slopes of nearly 1 (SEW1: 0.9382,
SEW2: 0.9711, SL: 0.9038 and M: 0.9064). We can thus confirm
that element concentrations of ingestates and digestates have
to be analysed at least 5 times in intervals of one month for
SEW1 and M, at least 2 times for SEW2 and 10 times for SL to
allow an evaluation of the element balance during
fermentation.
Element losses or accumulations during fermentation can
be estimated from Fig. 4, as well. Dotted lines in the figure
mark a qK of 1 which means that the ratio of K concentration
and element concentration of the ingestate would be equal to
the ratio of K concentration and element concentration of the
digestate and thus, no element loss or accumulation would
have occurred. Quotients far away from 1 are most likely to
indicate such loss or accumulation. For SEW1, quotients
farthest from 1 are those for N, S and Cd lying below 1 and the
one for Fe lying above 1. We conclude that losses of N, S and Cd
and an accumulation of Fe happened during digestion pro-
cesses of SEW1. Nitrogen losses also occurred in the fermen-
ters of all the other three biogas plants and Swas also depleted
in fermenters of SL and M. This can be attributed to NH3 and
H2S emissions mostly taking place during the anaerobic
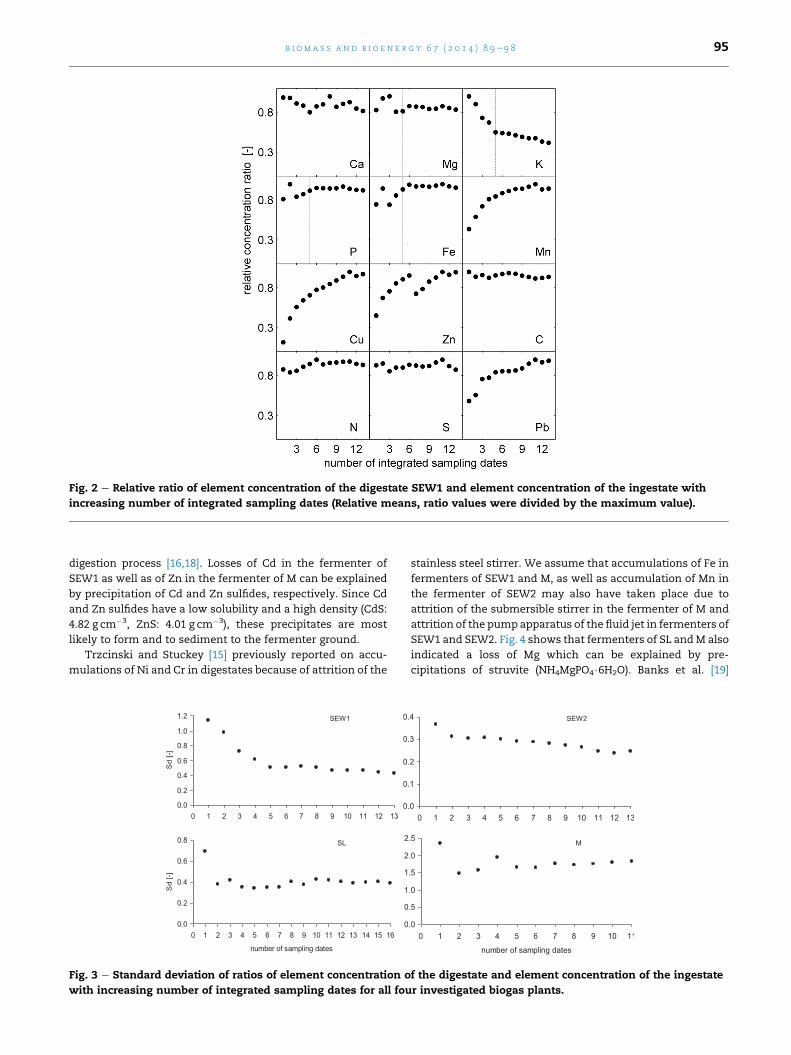
Fig. 2 e Relative ratio of element concentration of the digestate SEW1 and element concentration of the ingestate with
increasing number of integrated sampling dates (Relative means, ratio values were divided by the maximum value).
b i om a s s a n d b i o e n e r g y 6 7 ( 2 0 1 4 ) 8 9e9 8 95
digestion process [16,18]. Losses of Cd in the fermenter of
SEW1 as well as of Zn in the fermenter of M can be explained
by precipitation of Cd and Zn sulfides, respectively. Since Cd
and Zn sulfides have a low solubility and a high density (CdS:
4.82 g cm�3, ZnS: 4.01 g cm�3), these precipitates are most
likely to form and to sediment to the fermenter ground.
Trzcinski and Stuckey [15] previously reported on accu-
mulations of Ni and Cr in digestates because of attrition of the
Fig. 3 e Standard deviation of ratios of element concentration o
with increasing number of integrated sampling dates for all fou
stainless steel stirrer. We assume that accumulations of Fe in
fermenters of SEW1 and M, as well as accumulation of Mn in
the fermenter of SEW2 may also have taken place due to
attrition of the submersible stirrer in the fermenter of M and
attrition of the pumpapparatus of the fluid jet in fermenters of
SEW1 and SEW2. Fig. 4 shows that fermenters of SL andM also
indicated a loss of Mg which can be explained by pre-
cipitations of struvite (NH4MgPO4$6H2O). Banks et al. [19]
f the digestate and element concentration of the ingestate
r investigated biogas plants.
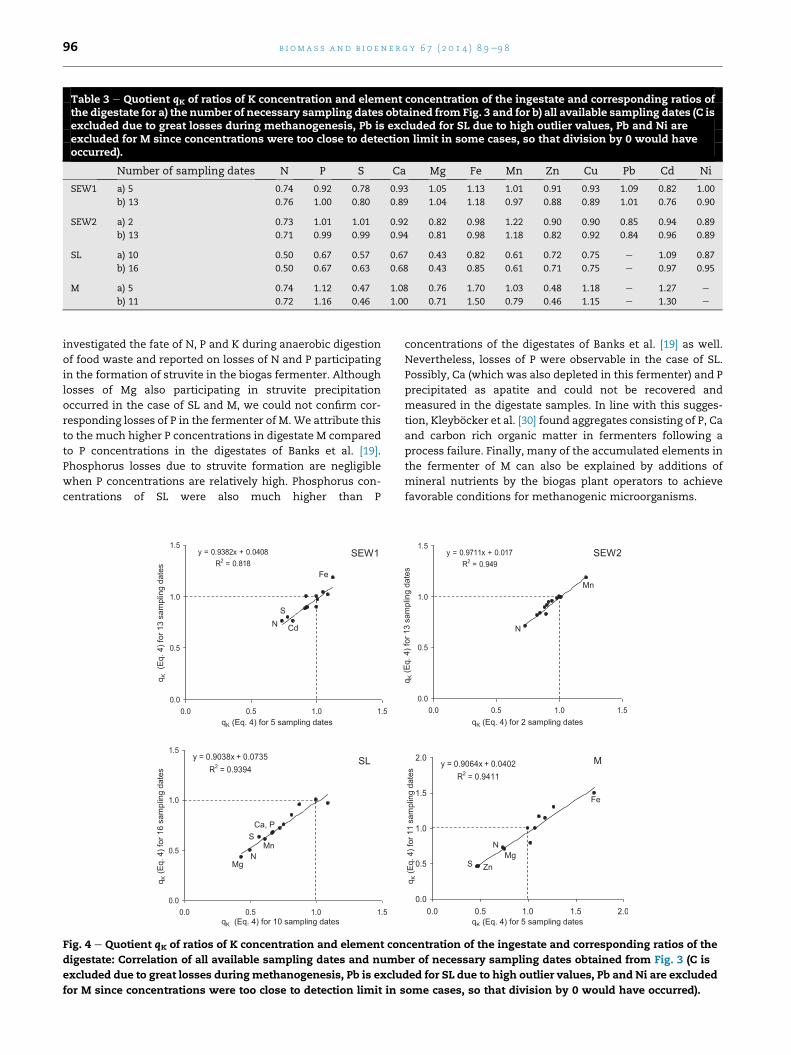
Table 3 e Quotient qK of ratios of K concentration and element concentration of the ingestate and corresponding ratios ofthe digestate for a) the number of necessary sampling dates obtained from Fig. 3 and for b) all available sampling dates (C isexcluded due to great losses during methanogenesis, Pb is excluded for SL due to high outlier values, Pb and Ni areexcluded for M since concentrations were too close to detection limit in some cases, so that division by 0 would haveoccurred).
Number of sampling dates N P S Ca Mg Fe Mn Zn Cu Pb Cd Ni
SEW1 a) 5 0.74 0.92 0.78 0.93 1.05 1.13 1.01 0.91 0.93 1.09 0.82 1.00
b) 13 0.76 1.00 0.80 0.89 1.04 1.18 0.97 0.88 0.89 1.01 0.76 0.90
SEW2 a) 2 0.73 1.01 1.01 0.92 0.82 0.98 1.22 0.90 0.90 0.85 0.94 0.89
b) 13 0.71 0.99 0.99 0.94 0.81 0.98 1.18 0.82 0.92 0.84 0.96 0.89
SL a) 10 0.50 0.67 0.57 0.67 0.43 0.82 0.61 0.72 0.75 e 1.09 0.87
b) 16 0.50 0.67 0.63 0.68 0.43 0.85 0.61 0.71 0.75 e 0.97 0.95
M a) 5 0.74 1.12 0.47 1.08 0.76 1.70 1.03 0.48 1.18 e 1.27 e
b) 11 0.72 1.16 0.46 1.00 0.71 1.50 0.79 0.46 1.15 e 1.30 e
b i om a s s a n d b i o e n e r g y 6 7 ( 2 0 1 4 ) 8 9e9 896
investigated the fate of N, P and K during anaerobic digestion
of food waste and reported on losses of N and P participating
in the formation of struvite in the biogas fermenter. Although
losses of Mg also participating in struvite precipitation
occurred in the case of SL and M, we could not confirm cor-
responding losses of P in the fermenter of M. We attribute this
to the much higher P concentrations in digestate M compared
to P concentrations in the digestates of Banks et al. [19].
Phosphorus losses due to struvite formation are negligible
when P concentrations are relatively high. Phosphorus con-
centrations of SL were also much higher than P
Fig. 4 e Quotient qK of ratios of K concentration and element con
digestate: Correlation of all available sampling dates and numb
excluded due to great losses duringmethanogenesis, Pb is exclu
for M since concentrations were too close to detection limit in s
concentrations of the digestates of Banks et al. [19] as well.
Nevertheless, losses of P were observable in the case of SL.
Possibly, Ca (which was also depleted in this fermenter) and P
precipitated as apatite and could not be recovered and
measured in the digestate samples. In line with this sugges-
tion, Kleybocker et al. [30] found aggregates consisting of P, Ca
and carbon rich organic matter in fermenters following a
process failure. Finally, many of the accumulated elements in
the fermenter of M can also be explained by additions of
mineral nutrients by the biogas plant operators to achieve
favorable conditions for methanogenic microorganisms.
centration of the ingestate and corresponding ratios of the
er of necessary sampling dates obtained from Fig. 3 (C is
ded for SL due to high outlier values, Pb and Ni are excluded
ome cases, so that division by 0 would have occurred).
b i om a s s a n d b i o e n e r g y 6 7 ( 2 0 1 4 ) 8 9e9 8 97
4. Summary and conclusions
The elemental composition of digestates varies greatly and
depends very much on the feedstock material and the kind of
fermentation procedure. Even within one biogas plant,
digestates show a distinct heterogeneity in their characteris-
tics over time. For representative statements about the
elemental composition of digestates and for an element
balancing during anaerobic digestion processes, a single
sampling point is not sufficient. Our statistical analysis has
proven suitable to determine the necessary number of sam-
pling dates for an element balancing and to discover element
losses or accumulations during fermentation processes of the
investigated biogas plants. Depending on the diversity of
ingestates and the variation of ingestates over time, a sam-
pling of at least 2e5, and in one case even 10, is needed.Within
the limits of the four selected biogas plants, a loss of N and in
three cases of S during the anaerobic digestion process could
be detected. Losses of Cd, Zn and Mg occurred as well, prob-
ably due to precipitations of metal sulfides and struvite. Ac-
cumulations of metals like Fe and Mn cannot be excluded.
Further investigations should cover an expanded scope of
digestates with regard to elemental characterizations and
therefore necessary number of sample takings.
Acknowledgments
We thank the Federal Ministry for the Environment, Nature
Conservation, Building and Nuclear Safety (03KB018E) for fund-
ing and Claudia Kuntz for a good portion of the measurements.
We also thank Ralph P. Overend as Editor and two anonymous
reviewers for their insightful comments and suggestions.
r e f e r e n c e s
[1] Weiland P. Biogas production: current state and perspectives.Appl Microbiol Biotechnol 2010;85(4):849e60.
[2] FNR. Biogas. 8th ed. Gulzow-Pruzen (DE): FachagenturNachwachsende Rohstoffe e.V.; 2012. p. 42.
[3] Emmann CH, Guenther-Lubbers W, Theuvsen L. Impacts ofbiogas production on the production factors land and laboure current effects, possible consequences and furtherresearch needs. Int J Food Syst Dyn 2013;4(1):38e50.
[4] Teglia C, Tremier A, Martel JL. Characterization of soliddigestates: part 1, review of existing indicators to assess soliddigestates agricultural use. Waste Biomass Valoriz2011;2(1):43e58.
[5] Alburquerque JA, de la Fuente C, Bernal MP. Chemicalproperties of anaerobic digestates affecting C and Ndynamics in amended soils. Agric Ecosyst Environ 2012October;160:15e22.
[6] Tambone F, Scaglia B, D’Imporzano G, Schievano A, Orzi V,Salati S, et al. Assessing amendment and fertilizingproperties of digestates from anaerobic digestion through acomparative study with digested sludge and compost.Chemosphere 2010;81(5):577e83.
[7] Whelan M, Everitt T, Villa R. A mass transfer model ofammonia volatilisation from anaerobic digestate. WasteManage 2010;30(10):1808e12.
[8] Teglia C, Tremier A, Martel J. Characterization of soliddigestates: part 2, assessment of the quality and suitabilityfor composting of six digested products. Waste BiomassValoriz 2011;2(2):113e26.
[9] Alburquerque JA, de la Fuente C, Ferrer-Costa A, Carrasco L,Cegarra J, Abad M, et al. Assessment of the fertiliser potentialof digestates from farm and agroindustrial residues. BiomassBioenerg 2012 May;40:181e9.
[10] Alburquerque J, de la Fuente C, Campoy M, Carrasco L,Najera I, Baixauli C, et al. Agricultural use of digestate forhorticultural crop production and improvement of soilproperties. Eur J Agron 2012 November;43:119e28.
[11] Haraldsen T, Andersen U, Krogstad T, Sørheim R. Liquiddigestate from anaerobic treatment of source-separatedhousehold waste as fertilizer to barley. Waste Manage Res2011;29(12):1271e6.
[12] Kirchmann H, Witter E. Composition of fresh, aerobic andanaerobic farm animal dungs. Bioresour Technol1992;40(2):137e42.
[13] Moller K, Stinner W, Deuker A, Leithold G. Effects of differentmanuring systems with and without biogas digestion onnitrogen cycle and crop yield in mixed organic dairy farmingsystems. Nutr Cycl Agroecosyst 2008;82(3):209e32.
[14] Selling R, Hakansson T, Bjornsson L. Two-stage anaerobicdigestion enables heavy metal removal. Water Sci Technol2008;57(4):553e8.
[15] Trzcinski AP, Stuckey D. Parameters affecting the stability ofthe digestate from a two-stage anaerobic process treating theorganic fraction of municipal solid waste. Waste Manage2011;31(7):1480e7.
[16] Vintiloiu A, Lemmer A, Oechsner H, Jungbluth T. Mineralsubstances and macronutrients in the anaerobic conversionof biomass: an impact evaluation. Eng Life Sci2012;12(3):287e94.
[17] Walsh JJ, Jones DL, Edwards-Jones G, Williams AP. Replacinginorganic fertilizer with anaerobic digestate may maintainagricultural productivity at less environmental cost. J PlantNutr Soil Sci 2012;175(6):840e5.
[18] Kaltschmitt M, Hartmann H, Hofbauer H. Energie ausBiomasse e Grundlagen. Techniken und Verfahren. 2nd ed.Heidelberg: Springer; 2009.
[19] Banks CJ, Chesshire M, Heaven S, Arnold R. Anaerobicdigestion of source-segregated domestic food waste:performance assessment by mass and energy balance.Bioresour Technol 2011;102(2):612e20.
[20] Pognani M, Barrena R, Font X, Sanchez A. A complete massbalance of a complex combined anaerobic/aerobic municipalsource-separated waste treatment plant. Waste Manage2012;32(5):799e805.
[21] Pain B, Misselbrook T, Clarkson C, Rees Y. Odour andammonia emissions following the spreading ofanaerobically-digested pig slurry on grassland. Biol Waste1990;34(3):259e67.
[22] Scheffer F, Schachtschabel P. Lehrbuch der Bodenkunde.15th ed. Heidelberg: Spektrum; 2002.
[23] Johansen A, Carter MS, Jensen ES, Hauggard-Nielsen H,Ambus P. Effects of digestate from anaerobically digestedcattle slurry and plant materials on soil microbialcommunity and emission of CO2 and N2O. Appl Soil Ecol 2013January;63:36e44.
[24] Seppala M, Pyykkonen V, Vaisanen A, Rintala J. Biomethaneproduction from maize and liquid cow manure e effect ofshare of maize, post-methanation potential and digestatecharacteristics. Fuel 2013 May;107:209e16.
[25] Bauer C, Lebuhn M, Gronauer A. Mikrobiologische Prozessein landwirtschaftlichen Biogasanlagen. 1st ed. Freising-Weihenstephan (DE): LfL (Bayerische Landesanstalt furLandwirtschaft); 2009 September. p. 38.
b i om a s s a n d b i o e n e r g y 6 7 ( 2 0 1 4 ) 8 9e9 898
[26] Demirel B, Scherer P. Trace element requirements ofagricultural biogas digesters during biological conversion ofrenewable biomass to methane. Biomass Bioenerg2011;35(3):992e8.
[27] AbfKlarV 1992. Klarschlammverordnung vom 15. April 1992(BGBl. I S. 912), die zuletzt durch Artikel 5 Absatz 12 desGesetzes vom 24. Februar 2012 (BGBl. I S. 212) geandertworden ist.
[28] BioAbfV 2012. Bioabfallverordnung vom 21. September 1998(BGBl. I S. 2955), in der Fassung der Bekanntmachung vom 4;April 2013 (BGBl. I S. 658).
[29] Schattauer A, Abdoun E, Weiland P, Plochl M, Heiermann M.Abundance of trace elements in demonstration biogasplants. Biosyst Eng 2011;108(1):57e65.
[30] Kleybocker A, Liebrich M, Kasina M, Kraume M, Wittmaier M,Wurdemann H. Comparison of different procedures tostabilize biogas formation after process failure in athermophilic waste digestion system: influence of aggregateformation on process stability. Waste Manage2012;32(6):1122e30.