electron microscopic studies on the lithium ion … · electron microscopic studies on the lithium...
TRANSCRIPT
Electron Microscopic Studies on the Lithium Ion Conducting Materials
Rajesh Cheruku, Lakshmi Vijayan and G.Govindaraj*
Department of Physics, School of Physical, Chemical and Applied Sciences, Pondicherry University, R.V. Nagar, Kalapet, Pondicherry -605 014, India
Lithium ion conducting materials find applications in energy storage devices like advanced solid-state batteries and sensors. Present chapter deals electron microscopic studies of various lithium based materials in cubic, inverse spinel and sodium super ion conductor (NASICON) structures. The dependence of different synthesis techniques on the physical properties such as surface morphology, density, crystallite size and shape on a particular material are explored in this study. Different features of surface morphology are investigated by using various surface coatings and at different operating voltages. Ac electrical properties are also reported.
Keywords Li based materials, surface morphology, synthesis techniques, chelating agents.
1. Introduction
Research efforts over the last three decades have identified several solids for possible application as cathodes and anodes in lithium batteries. At present employ graphite as anode and LiCoO2 as cathode [1]. The latter having the α-NaFeO2 structure reversibly intercalates lithium around 4.0V [2]. Another promising cathode material is LixMn2O4 based on the spinel structure that intercalates lithium around 3.0V in the range 1≤x≤2 and at 4.0V in the range 0≤x≤1. Current research effort is directed toward finding better cathode/anode materials in terms of energy density, repeated cycling, safety, toxicity and cost. A cathode material based on iron is especially attractive in terms of cost, abundance and environmental compatibility. Unfortunately, layered LiFeO2 possessing the α-NaFeO2 structure which operates on Fe4+/Fe3+ redox couple, gives unimpressive performance as cathode material because the energy of Fe4+/Fe3+redox couple is unfavourably placed with respect to the Fermi energy of lithium anode. These considerations have led to a search for new lithium cathode materials based on Fe3+/Fe2+ redox couple. In this regard, LiFePO4 has been identified as a possible cathode material based on Fe3+/Fe2+couple that shows attractive performance in terms of voltage (3.5V vs. lithium) and electrode capacity (165mAh/g). An effort has been made to develop new lithium cathode materials operate on Fe3+/Fe2+redox couple (and in general M3+/M2+ couple) [3]. In this concern, nano materials hold the key to fundamental advances in energy conversion and storage, both are vital in order to meet the challenge of global warming and the finite nature of fossil fuels. Nanomaterials in particular offer unique properties or combinations of properties as electrodes and electrolytes in a range of energy devices. Present study describes the alternative lithium ion conducting metal oxides: (i) Li3Fe2(PO4)3(ii) LiTi2(PO4)3
(LTP)(iii) Li0.5Fe2.5O4 (iv) Li2NiTiO4 and (v) Li2NiZrO4 are prepared in the nanocrystalline form. The systems (i), (iii) and (v) are prepared by the solution combustion technique and system (iv) is prepared by sol-gel technique. System (i) is synthesized by solution combustion technique using different fuels i.e., glycine in 1:2 molar ratio and ethylene glycol: citric acid mixture in 1:1 molar ratio. In this study, for the systems (iii) and (v) citric acid is used as a fuel; which forms citrate complexes with metal ions. The pH of the homogenous solution is maintained above 8 for solution combustion technique for avoiding precipitate formation thus for maintaining stoichiometry of compound. The system (ii) is prepared by the high energy ball-milling method in the form of nanocrystalline. The systems (ii) and (iii) are also prepared by solid state reaction in the microcrystalline form. The systems (iv) and (v) are the lithium rich transition metal oxides compounds. The sintered powder was consisting of single phase of these materials which was confirmed by X-ray diffraction (XRD) and the average crystallite size is calculated from the Scherrer’s formula. The scanning electron microscope (SEM) is used for the morphology and transmission electron microscope (TEM) is used for identifying the nanocrystalline nature of the materials. The energy dispersive X-ray (EDX) technique is used for identifying elemental composition of the specimen. The electrochemical studies were done by broad band dielectric spectroscopy. Dielectric spectroscopy tool is used to obtain equivalent circuit, thus separating grain-interior and grain-boundary elements. Electrical properties of nanocrystalline material are studied over wide range of frequency and temperature.
2. Experimental details
The Li2NiTiO4 material is prepared by sol-gel technique; it is one of good technique for preparing the nanocrystalline materials. In this technique the metal nitrates, titanium tetrabutoxide (oxidants) and citric acid (fuel) were mixed with dry methanol in required 1:1molar ratio to obtain homogenous solution. The experiment was done in the nitrogen atmosphere to avoiding the moisture and the solution was stirred for 12 h at 60˚C and then the temperature was increased to 100˚C. It led to the evaporation of methanol and subsequently the formation of a viscous transparent gel.
Current Microscopy Contributions to Advances in Science and Technology (A. Méndez-Vilas, Ed.)
© 2012 FORMATEX 1312
The gel was heated at 300˚C for 3 h, leading to a partial decomposition of organic substances and then calcined at different temperatures in air. In self-propagating combustion synthesis, metal nitrates act as oxidizing agent and organic fuels like citric acid, urea and glycine acts as reducing agent. The following events take place during combustion process: (i) generation of heat of combustion and (ii) gas evolution. Heat of combustion (or flame temperature) helps in crystallization and formation of the desired phase. However, high flame temperature adversely affects the powder characteristics like crystallite size and agglomeration, leads to reduction in surface area and sinterability [4].Heat of combustion and gas evolution depend on nature of the fuel and oxidant to fuel ratio. The combustion synthesized powders have high surface area and can obtain high densities even at lower sintering temperatures. The Li2NiZrO4 nanocrystalline material is prepared by the solution combustion technique. Here the material properties can be systematically tuned by altering the oxidant to fuel ratio. Addition of starting materials changes the concentration of nitrate ions and it can change the amount of fuel to oxidizer ratio. In present study, fuel to oxidizer ratio is maintained at unity i.e., 1=O/(-n)F where, n is the molar fraction of fuel, F is the reducing valency and O is the oxidizing valency [5]. The increase of nitrate ions in low pH is expected to decrease the enthalpy of exothermic reaction by decreasing the fuel to oxidizer ratio. Thus, the rate of combustion reaction decreases and in this condition particles come closer to form agglomerates. The pH of the precursor solution has remarkable influence on its stability and affects chelation between cation and associated fuel/complexing agent. The fuel-metal cation bond is unstable at low pH values, while at very high values, precipitates are formed in the precursor solution. The optimum value of pH varies with fuels/complexing agents and systems. So, optimized pH of the solution is retained above 8 in this study for maintaining the stoichiometry and adjustment of pH is done by addition of nitric acid or ammonium hydroxide. The overall reaction for formation of Li2NiZrO4 is given by:
2LiNO3+Ni(NO3)2.6H2O+ZrN2O7+nC6H8O7 ∆ Li2NiZrO4 +3N2+6nCO2 +(6+4n)H2O (1)
According to the concepts of propellant chemistry [5], the oxidizing valency of LiNO3 is -5, Ni(NO3)2.6H2O is -10, ZrN2O7 is -10 and the reducing valency of citric acid is +18. The amount of citric acid required for the combustion is calculated using general empirical formula for Li2NiZrO4 is n=1.666M. As a result, the combustion process can produce CO2, H2O and N2 gases without the necessity of getting oxygen from outside. The optimized fuel ratio is resulted in effective combustion process and the formation of small crystallites. In the similar way, Li0.5Fe2.5O4 nanocrystalline material is also prepared by this technique. Here the oxidizing valency of LiNO3 is -5, Fe (NO3)3.9H2O is -15 and the reducing valency of citric acid is +18. The amount of citric acid required for the combustion is n=2.22 M. The overall reaction for the prepared sample is given by:
0.5LiNO3+2.5Fe (NO3)3.9H2O+ nC6H8O7 ∆ Li0.5Fe2.5O4+4N2+6nCO2+(22.5+4n)H2O+(10-4.5n)O2 (2)
Apart from combustion synthesis, the sample Li0.5Fe2.5O4 was also prepared from the following analytical reagents i.e. Li2CO3 and Fe2O3 by solid state reaction. The chemical reaction for the formation of above sample is given by:
0.25Li2CO3+1.25Fe2O3 ∆ Li0.5Fe2.5O4+0.25CO2+2O2 (3)
In the present study, the Fe3+ based NASICON type Li3Fe2(PO4)3 material was synthesized using citric acid: ethylene glycol mixture (EG:CA) by solution combustion technique. The metal cations were complexed by citric acid (C6H8O7) and pH of the resultant solution is adjusted in the range 7-8 using ammonia solution. This solution is kept under constant stirring and NH4H2PO4 is added to it. After proper stirring, ethylene glycol is added by maintaining 1:1 molar ratio with citric acid. The homogenous solution is heated further for formation of as-prepared material and calcination at 800◦C resulted in phase pure product. Objective of the present investigation is to synthesise nanocrystalline materials by a unique combination of citric acid (as chelating agent) and ethylene glycol (as polymerizing agent). In the presence of ethylene glycol, esterification (reaction between alcohol and acid) resulted in the formation of gel. The Li3Fe2(PO4)3 is also prepared by solution combustion technique using glycine in 1:2 molar ratio. High energy ball-milling is a versatile method for the preparation of nanoceramics and this method have the control over the crystallite size by controlling the milling duration [6]. Ball-milling is used as a method for the synthesis of materials which are difficult to synthesize by conventional techniques like solid-state reaction. For the preparation of nanocrystalline material, stoichiometric mixture is ball-milled for long duration to reduce the size of the mixture to nanometer range. Milling reduces the crystallinity of the stoichiometric mixture and further heat treatments, at comparatively less temperature, are required to obtain the single phase nanocrystalline material. This process is called mechanically activated self-propagating high temperature synthesis. The LiTi2(PO4)3 is a NASICON type, Li+ ion conducting polycrystalline material in rhombohedral symmetry with R3̅c space group. The room temperature conductivity of LiTi2(PO4)3is low for practical applications [7] and several methods have been tried to increase its conductivity.
Current Microscopy Contributions to Advances in Science and Technology (A. Méndez-Vilas, Ed.)
© 2012 FORMATEX 1313
The powder XRD patterns are recorded at room temperature using Philips X’pert PRO diffractometer in the 2θ range 10˚-80˚. SEM and EDX are recorded using model S-3400 from Hitachi and TEM using JEOL 2100F. Silver paint is evenly applied on both sides of pellet for better electrical contact.AC electrical measurements are carried out on 900◦C sintered samples using broadband dielectric spectrometer with the oscillatory voltage of 0.5V in the temperature range from 283K to 403K.
3. Results and Discussions
3.1 X-ray powder diffraction analysis
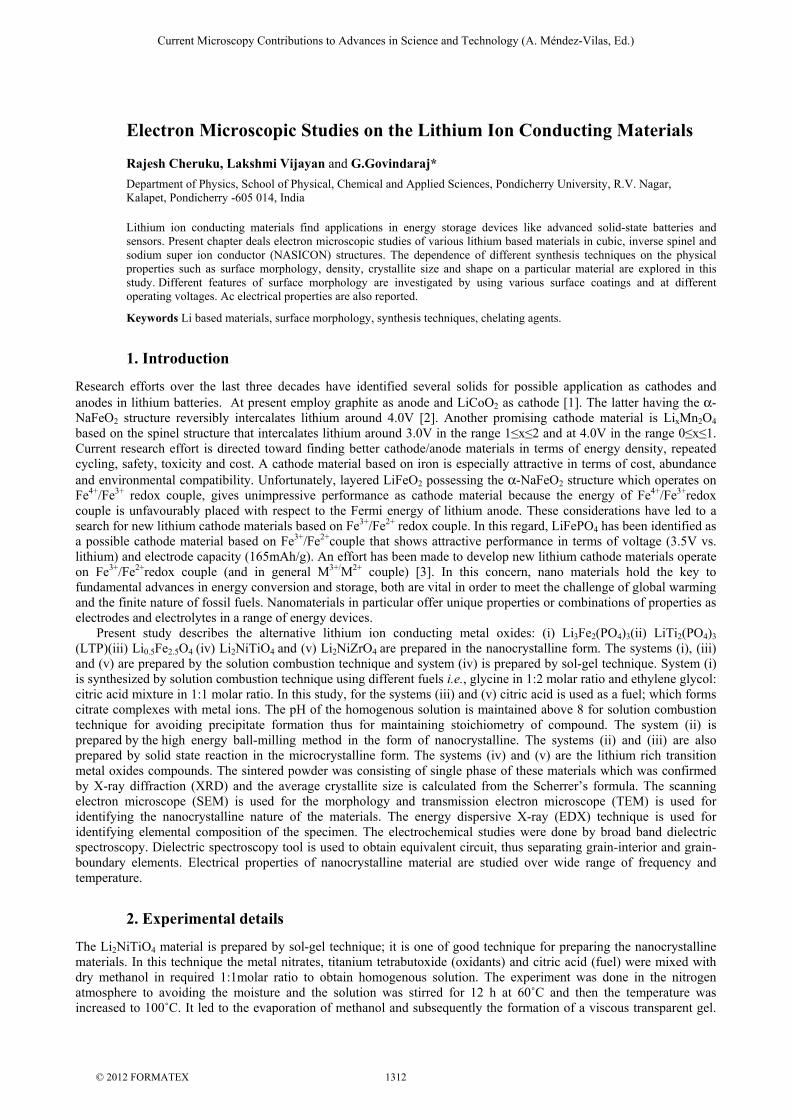
The Li3Fe2(PO4)3 synthesised by ceramic route is crystallized in Fe2(SO4)3-type monoclinic symmetry and exhibited reversible structural phase transitions below 350˚C, that are not completely separated [8]. Its XRD patterns do not show modifications due to structural phase transitions implying the Li+ ion distribution or ordering, rather than ordering of the networks. d’Yvoireet al. [9]showed that the monoclinic Li3Fe2(PO4)3 transforms reversibly to the orthorhombic phase upon heating above 270˚C, due to progressive breaking of long-range ordering of Li+ ions in the interstitial space. The Fe2(SO4)3-type phase generally crystallize in two symmetries: (i) orthorhombic (Pcan) of highest symmetry and (ii) primitive monoclinic (P21/n) symmetry [10]. In the present study, Li3Fe2(PO4)3 is synthesized by solution combustion technique using different fuels i.e., glycine in 1:2 molar ratio and ethylene glycol: citric acid mixture in 1:1 molar ratio. Both of these Li3Fe2(PO4)3 is crystallized as mixture of monoclinic (P21/n) and orthorhombic (Pcan) symmetry. Due to sintering in air, XRD patterns showed presence of minor phases of LiFeP2O7 that crystallized in monoclinic symmetry.
Fig.1 XRD patterns of (a) Li3Fe2(PO4)3-G (b) Li3Fe2(PO4)3:EG:CA are sintered at 900˚C. Fig. 1 shows XRD patterns of (a) Li3Fe2(PO4)3-G (b) Li3Fe2(PO4)3:EG:CA are sintered at 900˚C, synthesized using glycine, citric acid and ethylene glycol. In the Fig. 1(a), black and red colour indexes are due to reflections from monoclinic and orthorhombic symmetry respectively. The violet colour index shows reflections from LiFeP2O7 phase. In contradiction with the conventional synthesis process, solution combustion technique crystallized the material as a mixture of room temperature and high temperature phases. In the high temperature orthorhombic phase, alkali ions are distributed disorderly in the available sites; hence the structural phase transitions are absent in the investigated Li3Fe2(PO4)3 material.The crystallite size is calculated using Scherrer’s formula, D=Kλ/Bcosθ (4) where θ is the Bragg angle of 100% XRD peak, K is the Scherrer’s constant, D is the average crystallite size and is the wave length of CuKα1 radiation and its value is1.5406Å. For Gaussian X-ray profiles, B is calculated as: B = B − B (5) where Bm and Bs are FWHM of XRD peak of synthesized material and silicon standard, which is used to eliminate the instrumental broadening. The density of sintered pellets is measured by Archimedes principle. The lattice parameters and unit cell volume are calculated for sintered pellets using Celref3 software. It is a well-known software provided by collaborative computational project number 14 (CCP14) and the method used to refine the lattice parameter is a least squares refinement. The crystal system and physical parameters of NASICON type materials are given in Table 1. It is evident from Table 1 that lattice parameters and crystallite sizes are reliable on nature of the fuel/chelating agents and its molar ratios. Figs. 2(a) and 2(b) show XRD patterns of the microcrystalline and 40h ball-milled LiTi2(PO4)3 pellets after sintering at 1073K. The peaks in the XRD pattern correspond to the single phase of LiTi2(PO4)3material while, XRD pattern of the materials sintered at high temperatures contain few minor peaks of TiP2O7 phase in the low 2θ range up to 29˚ due to Li loss at high temperatures [11]. But the patterns with the minority phase are not given in Figs. 2(a) and 2(b).The lattice parameters of LTP are calculated using Eq. (4) and Eq. (5) and results are given in Table 1. Ball-milling induces
1 0 2 0 3 0 4 0 5 0 6 0 7 0
(231
)(222
)
(022
)
(-11
1)
(011
)
(534
)
(381
)
(074
)
(136
)
(551
)
(273
)
(434
)
(371
)
(452
)
(080
)(163
)
(-44
2)
(353
)
(-17
1)(-11
5)(4
13)
(440
)(-1
53)
(-26
0)(2
24)
(-43
1)(1
61)
(323
)
(204
)(-
124)
(233
)(-
233)(4
01)
(052
)(-
242)
(-22
3)(-15
1)
(-13
3)(33
0)
(-31
2)
(-23
2)(0
42)
(-32
1)
(023
)(-
113)
(222
)(-
310)
(-21
2)(0
40)
(202
)
(122
)
(-12
2)(-
131)
(-22
0)(1
30)
(-13
0)(-21
1)(2
01)
(012
)
(121
)
(-12
1)
(111
)
2 θ ( d e g r e e s )
(020
)
L i3
F e2
( P O4
)3
: G
M o n o c l i n i c : P 2 1 / nO r t h o r h o m b i c : P c a nL i F e ( P
2O
7) : P 2 1 / n
Inte
nsit
y (a
.u.)
( a )
( b )
L i3
F e2
( P O4
)3
: E G : C A
Current Microscopy Contributions to Advances in Science and Technology (A. Méndez-Vilas, Ed.)
© 2012 FORMATEX 1314
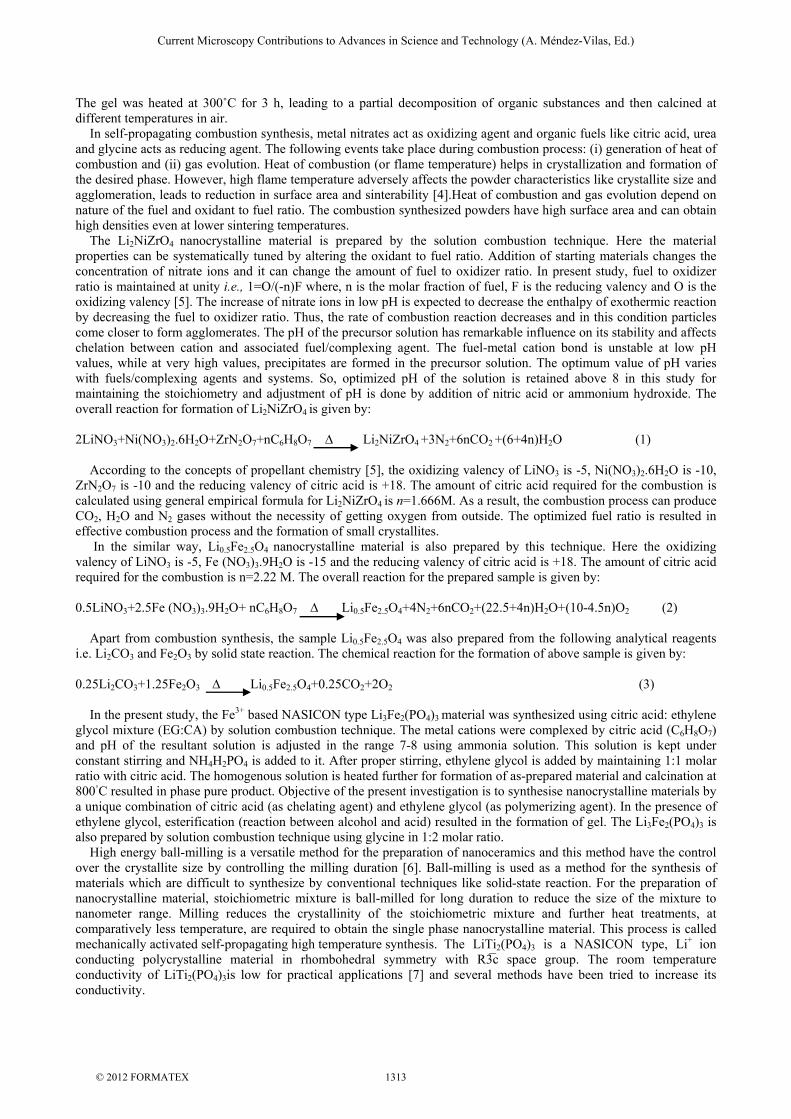
strain in lattice and decreases the average crystallite size to 70nm for 40h ball-milled LiTi2(PO4)3 material. Milling reduces the average crystallite size to nanometer range. But there are evidences that long hours of ball-milling lead to the formation of an amorphous state [12]. Hence, sintering at high temperature after ball-milling resulted in the formation of nanocrystallites instead of microcrystalline material. XRD pattern gradually broadened and the particle size decreased with milling time. The nanocrystalline nature of the ball-milled materials is evident in the broadened peak and there is decrease in the intensity of XRD peak compared to the microcrystalline material.
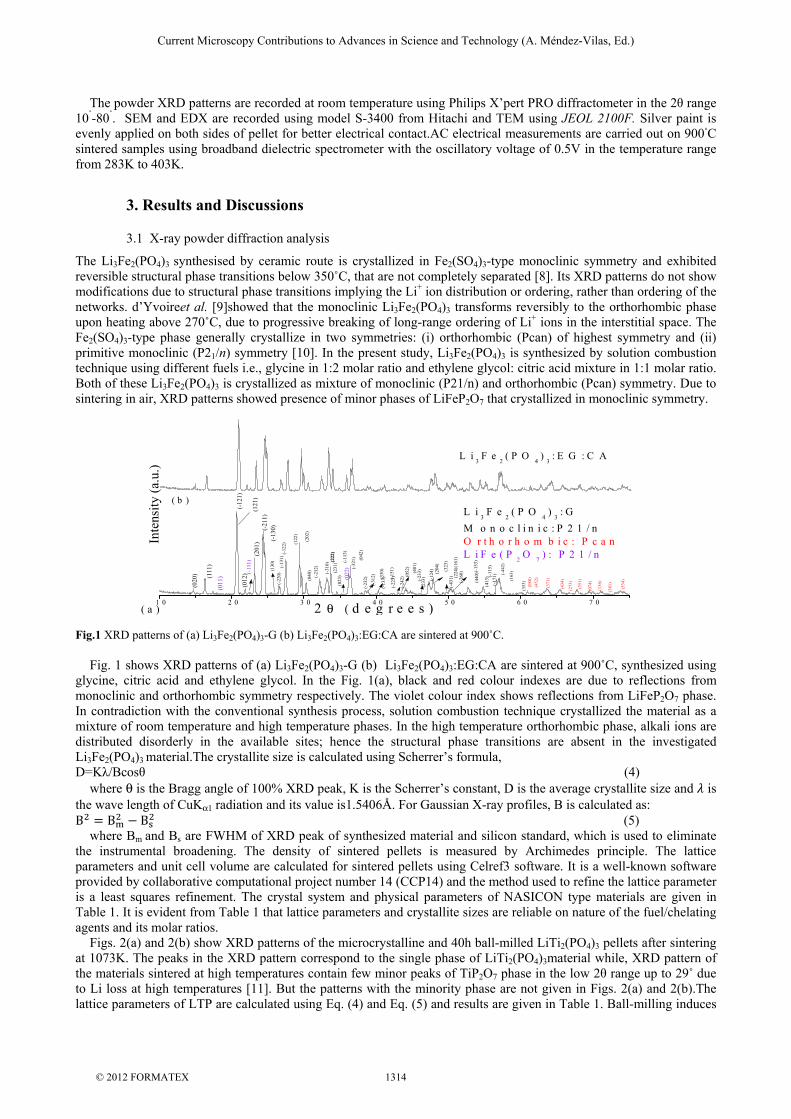
Fig.2 X-ray powder diffraction patterns of (a) microcrystalline LiTi2(PO4)3(b) nanocrystalline LiTi2(PO4)3. The XRD patterns for the Li0.5Fe2.5O4material prepared in solution combustion technique and solid state reaction are recorded in the range of 2θ from 10-80 in a step size of 0.02. Figure 3(a) and 3(b) shows the X-ray diffractograms of lithium ferrites sintered at various temperatures as prepared by combustion synthesis method and solid state reaction process respectively. The pattern matched with the standard lithium ferrite with reference code 01-088-0671 and from the standard pattern respective h, k, l values of the diffraction peaks were assigned. The phase pure crystallites are formed in a stable cubic structure of space group p4332 [13] and lattice parameter was found with a refinement from celref3 software and corresponding parameters are given in the Table 1. In combustion synthesis case, nanocrystalline nature of the material got confirmed. As the sintering temperature increases, the width of the central maxima decreases and the intensity of the peaks increases. This is due to the increase in the grain size of the ferrite particles as the firing temperature increases.
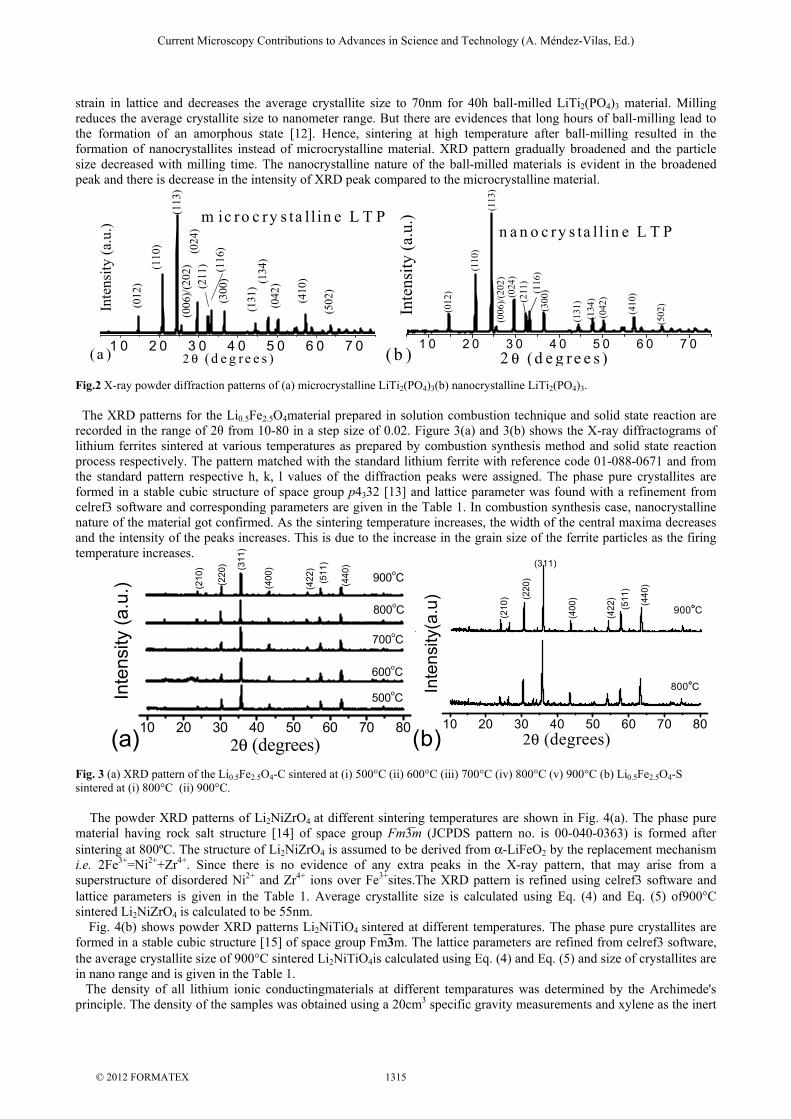
Fig. 3 (a) XRD pattern of the Li0.5Fe2.5O4-C sintered at (i) 500°C (ii) 600°C (iii) 700°C (iv) 800°C (v) 900°C (b) Li0.5Fe2.5O4-S sintered at (i) 800°C (ii) 900°C. The powder XRD patterns of Li2NiZrO4 at different sintering temperatures are shown in Fig. 4(a). The phase pure material having rock salt structure [14] of space group Fm3m̅ (JCPDS pattern no. is 00-040-0363) is formed after sintering at 800ºC. The structure of Li2NiZrO4 is assumed to be derived from α-LiFeO2 by the replacement mechanism i.e. 2Fe3+=Ni2++Zr4+. Since there is no evidence of any extra peaks in the X-ray pattern, that may arise from a superstructure of disordered Ni2+ and Zr4+ ions over Fe3+sites.The XRD pattern is refined using celref3 software and lattice parameters is given in the Table 1. Average crystallite size is calculated using Eq. (4) and Eq. (5) of900°C sintered Li2NiZrO4 is calculated to be 55nm. Fig. 4(b) shows powder XRD patterns Li2NiTiO4 sintered at different temperatures. The phase pure crystallites are formed in a stable cubic structure [15] of space group Fm͞3m. The lattice parameters are refined from celref3 software, the average crystallite size of 900°C sintered Li2NiTiO4is calculated using Eq. (4) and Eq. (5) and size of crystallites are in nano range and is given in the Table 1. The density of all lithium ionic conductingmaterials at different temparatures was determined by the Archimede's principle. The density of the samples was obtained using a 20cm3 specific gravity measurements and xylene as the inert
1 0 2 0 3 0 4 0 5 0 6 0 7 02 θ (d e g re e s )
(502
)
(410
)
(042
)(1
34)
(131
)
(300
) (11
6)(2
11)
(024
)(0
06)/
(202
)(1
13)
(110
)
(012
)
( b )
Inte
nsit
y (a
.u.)
n a n o c ry s ta l l in e L T P
1 0 2 0 3 0 4 0 5 0 6 0 7 0(5
02)
( a )
m ic ro c ry s ta l l in e L T P
(410
)
(042
)(134
)(1
31)
(300
)
(211
)
(11
6)(024
)(0
06)/
(202
)(1
13)
(110
)
(012
)
2 θ (d e g re e s )
Inte
nsit
y (a
.u.)
10 20 30 40 50 60 70 80
(422
)(5
11)
(440
)
(400
)
800oC
900oC
700oC
600oC
500oC
(210
)
(220
) (311
)
2θ (degrees)
Inte
nsity
(a.u
.)
(a)10 20 30 40 50 60 70 80
(b)
(311)(4
00) (440
)
(511
)(4
22)(2
20)
(210
)
900oC
2θ (degrees)
800oCInte
nsity
(a.u
)
Current Microscopy Contributions to Advances in Science and Technology (A. Méndez-Vilas, Ed.)
© 2012 FORMATEX 1315
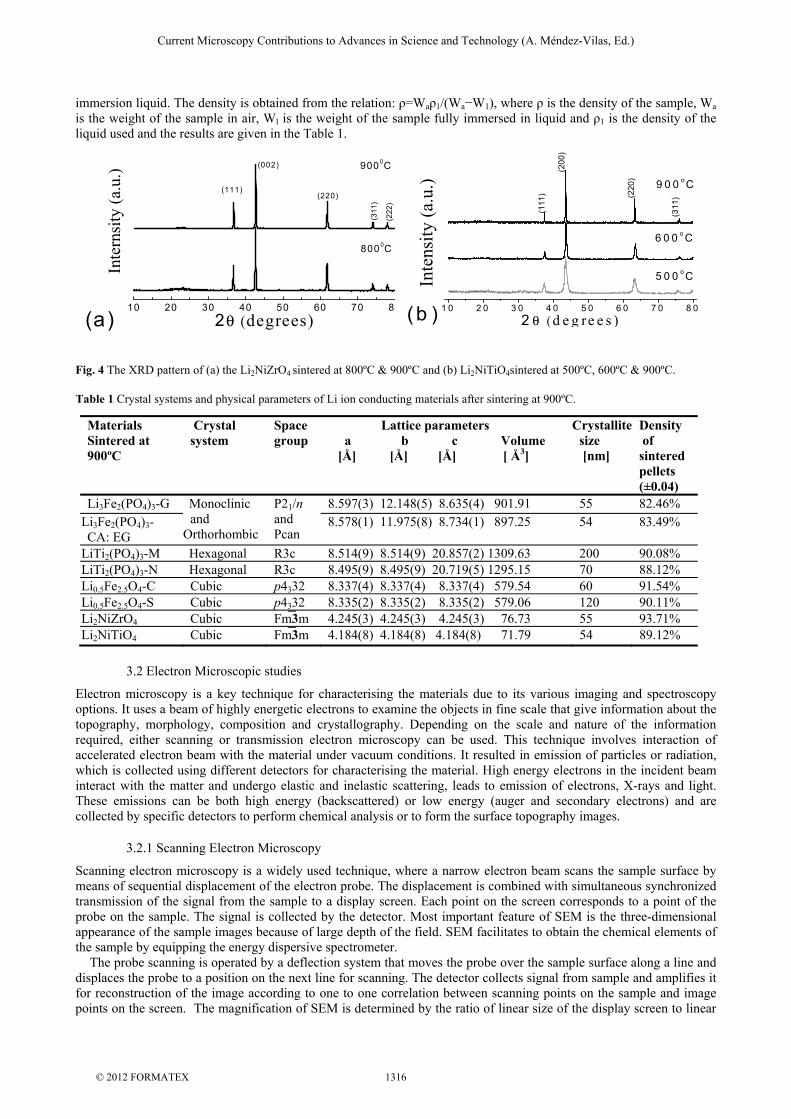
immersion liquid. The density is obtained from the relation: ρ=Waρ1/(Wa−W1), where ρ is the density of the sample, Wa is the weight of the sample in air, Wl is the weight of the sample fully immersed in liquid and ρ1 is the density of the liquid used and the results are given in the Table 1.
Fig. 4 The XRD pattern of (a) the Li2NiZrO4 sintered at 800ºC & 900ºC and (b) Li2NiTiO4sintered at 500ºC, 600ºC & 900ºC. Table 1 Crystal systems and physical parameters of Li ion conducting materials after sintering at 900ºC.
3.2 Electron Microscopic studies
Electron microscopy is a key technique for characterising the materials due to its various imaging and spectroscopy options. It uses a beam of highly energetic electrons to examine the objects in fine scale that give information about the topography, morphology, composition and crystallography. Depending on the scale and nature of the information required, either scanning or transmission electron microscopy can be used. This technique involves interaction of accelerated electron beam with the material under vacuum conditions. It resulted in emission of particles or radiation, which is collected using different detectors for characterising the material. High energy electrons in the incident beam interact with the matter and undergo elastic and inelastic scattering, leads to emission of electrons, X-rays and light. These emissions can be both high energy (backscattered) or low energy (auger and secondary electrons) and are collected by specific detectors to perform chemical analysis or to form the surface topography images.
3.2.1 Scanning Electron Microscopy
Scanning electron microscopy is a widely used technique, where a narrow electron beam scans the sample surface by means of sequential displacement of the electron probe. The displacement is combined with simultaneous synchronized transmission of the signal from the sample to a display screen. Each point on the screen corresponds to a point of the probe on the sample. The signal is collected by the detector. Most important feature of SEM is the three-dimensional appearance of the sample images because of large depth of the field. SEM facilitates to obtain the chemical elements of the sample by equipping the energy dispersive spectrometer. The probe scanning is operated by a deflection system that moves the probe over the sample surface along a line and displaces the probe to a position on the next line for scanning. The detector collects signal from sample and amplifies it for reconstruction of the image according to one to one correlation between scanning points on the sample and image points on the screen. The magnification of SEM is determined by the ratio of linear size of the display screen to linear
Materials Sintered at 900ºC
Crystal system
Space group
Lattice parameters a b c Volume [Å] [Å] [Å] [ Å3]
Crystallite size [nm]
Density of sintered pellets (±0.04)
Li3Fe2(PO4)3-G Monoclinic and
Orthorhombic
P21/n and Pcan
8.597(3) 12.148(5) 8.635(4) 901.91 55 82.46% Li3Fe2(PO4)3-CA: EG
8.578(1) 11.975(8) 8.734(1) 897.25 54 83.49%
LiTi2(PO4)3-M Hexagonal R3c 8.514(9) 8.514(9) 20.857(2) 1309.63 200 90.08% LiTi2(PO4)3-N Hexagonal R3c 8.495(9) 8.495(9) 20.719(5) 1295.15 70 88.12% Li0.5Fe2.5O4-C Cubic p4332 8.337(4) 8.337(4) 8.337(4) 579.54 60 91.54% Li0.5Fe2.5O4-S Cubic p4332 8.335(2) 8.335(2) 8.335(2) 579.06 120 90.11% Li2NiZrO4 Cubic Fm͞3m 4.245(3) 4.245(3) 4.245(3) 76.73 55 93.71% Li2NiTiO4 Cubic Fm͞3m 4.184(8) 4.184(8) 4.184(8) 71.79 54 89.12%
10 20 30 40 50 60 70 802θ (degrees)
Inte
rnsi
ty (
a.u.
) 9000C
(222
)
(311
)
(220)
(002)
(111)
8000C
(a)1 0 2 0 3 0 4 0 5 0 6 0 7 0 8 0
(311
)(220
)
6 0 0 o C
(b )
Inte
nsit
y (a
.u.)
(200
)
(111
)
5 0 0 o C
9 0 0 o C
2 θ (d e g re e s )
Current Microscopy Contributions to Advances in Science and Technology (A. Méndez-Vilas, Ed.)
© 2012 FORMATEX 1316
size of the sample that is being scanned. Secondary electrons (SE) are ejected from the outer orbital of the sample due to its interaction with incident radiation. Due to less energy (<50eV), these electrons may be absorbed by the sample and those that are able to exit the surface layers will be collected by the detectors. The images obtained will provide information on sample’s surface topography. The backscattered electrons (BSE) are high energy particles from the incident beam; they have undergone a few inelastic interactions. These are reflected by the sample and signal contains significant information about material’s chemical composition. Depending on how these signals are processed, the resulting images will provide either an image of the element’s distribution according to their atomic number, the surface topographical information, or crystallographic orientation of the surface. Cathode luminescence is the emission of photons in the energy range of ultraviolet, visible and infrared from a semiconducting or insulating material that is subject to the electron interaction. Cathode luminescence results from the electron-hole recombination created by electron beam. These images give information about the recombination centres that are intrinsic or extrinsic. For best images and to avoid charging of samples, it is preferable to coat the sample with gold or carbon prior to the examination. An alternative way to reduce the surface charging is to connect an electrical discharge bridge (a copper tape) from sample to the ground mount. In the present study, Hitachi make S-3400N SEM is used for morphological analysis. The resolution is 3nm@30kV for ultra-high vacuum mode and 10nm@3kV for high vacuum mode. Detectors are secondary electron and semiconductor backscattered electron (Quad type). The magnification capacity of the particular instrument is 5x to 300,000x. The integrated EDS from Thermo, USA, haspeltier cooled X-ray head.
3.2.2 Transmission Electron Microscopy
The TEM images are of much higher magnification and resolution compared to SEM images. The high resolution results from short wavelength of electron beam which illuminates the material. Electron beam wavelength is 10,000 times smaller than the visible light and resolution of TEM is of the order of 0.1nm.The high energy electrons are generated from electron gun and are accelerated by high voltage. The accelerating voltage determines resolution of the microscope to a larger extent. To achieve a high resolution, TEM is usually operated under an acceleration voltage of greater than 100kV. TEM uses electromagnetic lens to focus the high energy electron beam and its magnification power can be altered by changing the current passing through solenoid of the lens. A diffraction pattern is formed on the back-focal plane of the objective lens when an electron beam passes through a crystalline sample [16]. In the diffraction mode, a pattern of selected area diffraction can be further enlarged on the screen. Electron diffraction is not only useful to generate images of diffraction contrast, but also for crystal structure analysis, similar to X-ray diffraction methods. Preparation of sample is the most tedious step in TEM examination. To be electronically transparent, sample thickness should be <100nm. For higher atomic weight materials, sample should be thinner.
3.2.3 Elemental Analysis using X-ray Spectroscopy Techniques
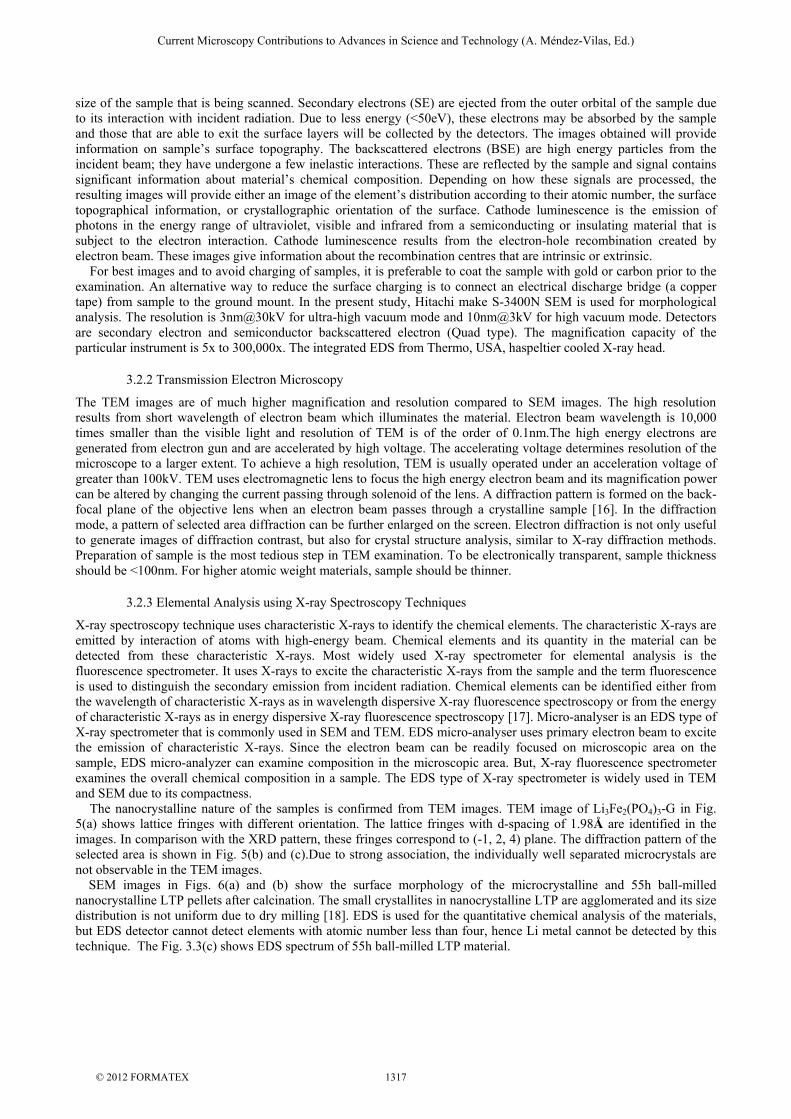
X-ray spectroscopy technique uses characteristic X-rays to identify the chemical elements. The characteristic X-rays are emitted by interaction of atoms with high-energy beam. Chemical elements and its quantity in the material can be detected from these characteristic X-rays. Most widely used X-ray spectrometer for elemental analysis is the fluorescence spectrometer. It uses X-rays to excite the characteristic X-rays from the sample and the term fluorescence is used to distinguish the secondary emission from incident radiation. Chemical elements can be identified either from the wavelength of characteristic X-rays as in wavelength dispersive X-ray fluorescence spectroscopy or from the energy of characteristic X-rays as in energy dispersive X-ray fluorescence spectroscopy [17]. Micro-analyser is an EDS type of X-ray spectrometer that is commonly used in SEM and TEM. EDS micro-analyser uses primary electron beam to excite the emission of characteristic X-rays. Since the electron beam can be readily focused on microscopic area on the sample, EDS micro-analyzer can examine composition in the microscopic area. But, X-ray fluorescence spectrometer examines the overall chemical composition in a sample. The EDS type of X-ray spectrometer is widely used in TEM and SEM due to its compactness. The nanocrystalline nature of the samples is confirmed from TEM images. TEM image of Li3Fe2(PO4)3-G in Fig. 5(a) shows lattice fringes with different orientation. The lattice fringes with d-spacing of 1.98Å are identified in the images. In comparison with the XRD pattern, these fringes correspond to (-1, 2, 4) plane. The diffraction pattern of the selected area is shown in Fig. 5(b) and (c).Due to strong association, the individually well separated microcrystals are not observable in the TEM images. SEM images in Figs. 6(a) and (b) show the surface morphology of the microcrystalline and 55h ball-milled nanocrystalline LTP pellets after calcination. The small crystallites in nanocrystalline LTP are agglomerated and its size distribution is not uniform due to dry milling [18]. EDS is used for the quantitative chemical analysis of the materials, but EDS detector cannot detect elements with atomic number less than four, hence Li metal cannot be detected by this technique. The Fig. 3.3(c) shows EDS spectrum of 55h ball-milled LTP material.
Current Microscopy Contributions to Advances in Science and Technology (A. Méndez-Vilas, Ed.)
© 2012 FORMATEX 1317
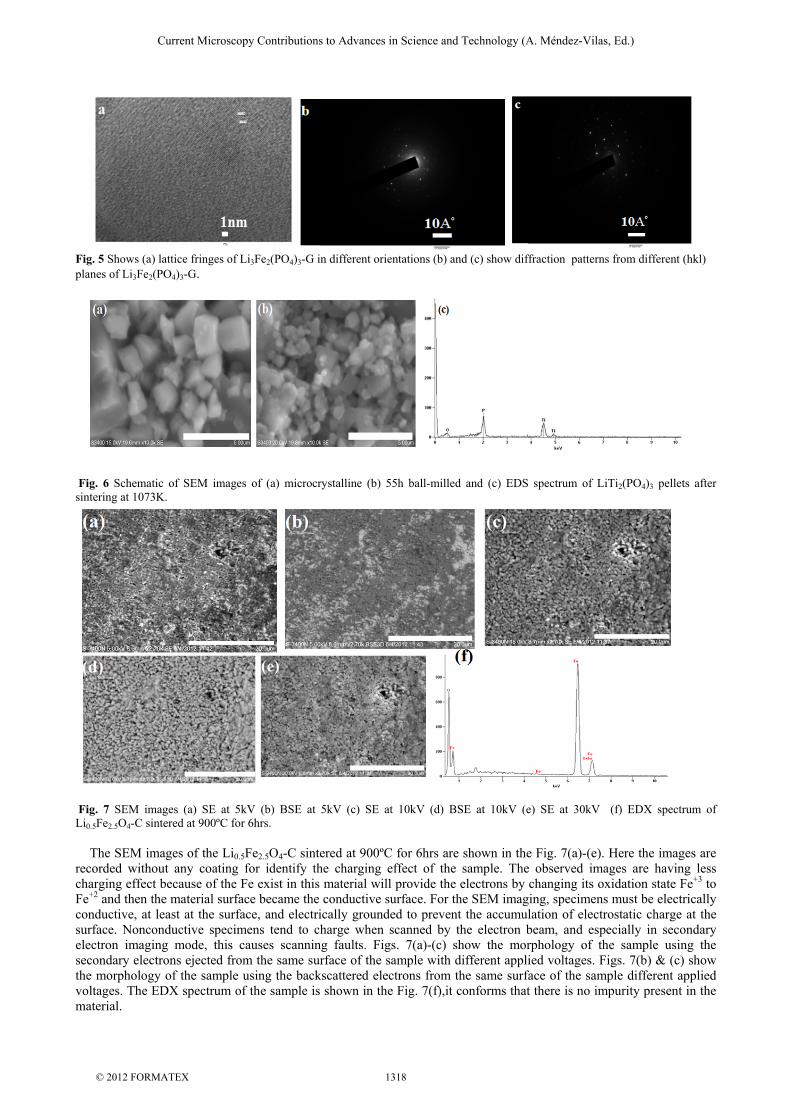
Fig. 5 Shows (a) lattice fringes of Li3Fe2(PO4)3-G in different orientations (b) and (c) show diffraction patterns from different (hkl) planes of Li3Fe2(PO4)3-G.
Fig. 6 Schematic of SEM images of (a) microcrystalline (b) 55h ball-milled and (c) EDS spectrum of LiTi2(PO4)3 pellets after sintering at 1073K.
Fig. 7 SEM images (a) SE at 5kV (b) BSE at 5kV (c) SE at 10kV (d) BSE at 10kV (e) SE at 30kV (f) EDX spectrum of Li0.5Fe2.5O4-C sintered at 900ºC for 6hrs. The SEM images of the Li0.5Fe2.5O4-C sintered at 900ºC for 6hrs are shown in the Fig. 7(a)-(e). Here the images are recorded without any coating for identify the charging effect of the sample. The observed images are having less charging effect because of the Fe exist in this material will provide the electrons by changing its oxidation state Fe+3 to Fe+2 and then the material surface became the conductive surface. For the SEM imaging, specimens must be electrically conductive, at least at the surface, and electrically grounded to prevent the accumulation of electrostatic charge at the surface. Nonconductive specimens tend to charge when scanned by the electron beam, and especially in secondary electron imaging mode, this causes scanning faults. Figs. 7(a)-(c) show the morphology of the sample using the secondary electrons ejected from the same surface of the sample with different applied voltages. Figs. 7(b) & (c) show the morphology of the sample using the backscattered electrons from the same surface of the sample different applied voltages. The EDX spectrum of the sample is shown in the Fig. 7(f),it conforms that there is no impurity present in the material.
Current Microscopy Contributions to Advances in Science and Technology (A. Méndez-Vilas, Ed.)
© 2012 FORMATEX 1318
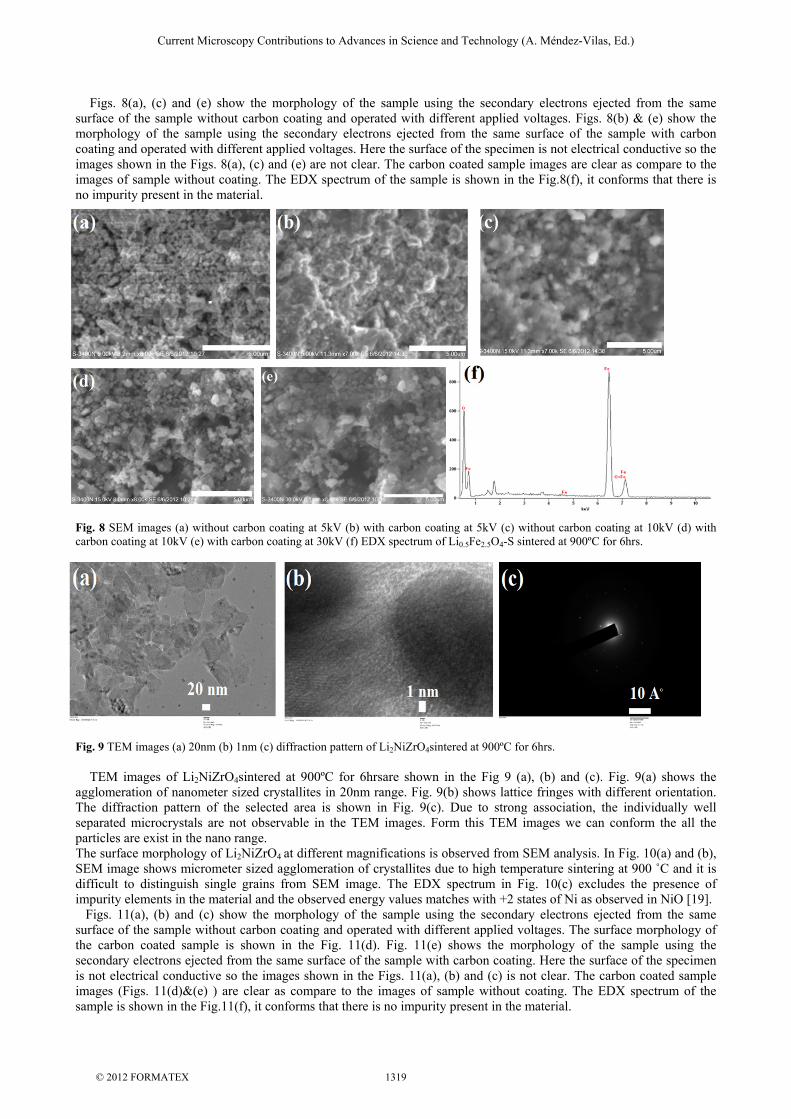
Figs. 8(a), (c) and (e) show the morphology of the sample using the secondary electrons ejected from the same surface of the sample without carbon coating and operated with different applied voltages. Figs. 8(b) & (e) show the morphology of the sample using the secondary electrons ejected from the same surface of the sample with carbon coating and operated with different applied voltages. Here the surface of the specimen is not electrical conductive so the images shown in the Figs. 8(a), (c) and (e) are not clear. The carbon coated sample images are clear as compare to the images of sample without coating. The EDX spectrum of the sample is shown in the Fig.8(f), it conforms that there is no impurity present in the material.
Fig. 8 SEM images (a) without carbon coating at 5kV (b) with carbon coating at 5kV (c) without carbon coating at 10kV (d) with carbon coating at 10kV (e) with carbon coating at 30kV (f) EDX spectrum of Li0.5Fe2.5O4-S sintered at 900ºC for 6hrs.
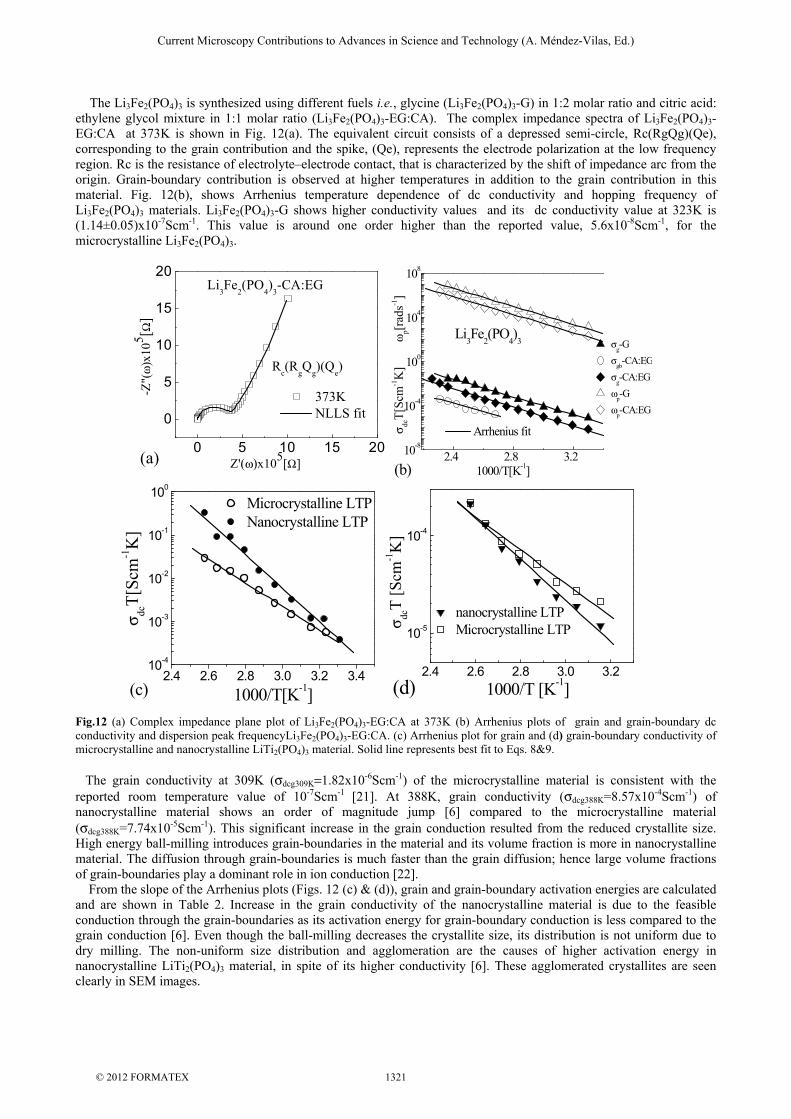
Fig. 9 TEM images (a) 20nm (b) 1nm (c) diffraction pattern of Li2NiZrO4sintered at 900ºC for 6hrs. TEM images of Li2NiZrO4sintered at 900ºC for 6hrsare shown in the Fig 9 (a), (b) and (c). Fig. 9(a) shows the agglomeration of nanometer sized crystallites in 20nm range. Fig. 9(b) shows lattice fringes with different orientation. The diffraction pattern of the selected area is shown in Fig. 9(c). Due to strong association, the individually well separated microcrystals are not observable in the TEM images. Form this TEM images we can conform the all the particles are exist in the nano range. The surface morphology of Li2NiZrO4 at different magnifications is observed from SEM analysis. In Fig. 10(a) and (b), SEM image shows micrometer sized agglomeration of crystallites due to high temperature sintering at 900 ˚C and it is difficult to distinguish single grains from SEM image. The EDX spectrum in Fig. 10(c) excludes the presence of impurity elements in the material and the observed energy values matches with +2 states of Ni as observed in NiO [19]. Figs. 11(a), (b) and (c) show the morphology of the sample using the secondary electrons ejected from the same surface of the sample without carbon coating and operated with different applied voltages. The surface morphology of the carbon coated sample is shown in the Fig. 11(d). Fig. 11(e) shows the morphology of the sample using the secondary electrons ejected from the same surface of the sample with carbon coating. Here the surface of the specimen is not electrical conductive so the images shown in the Figs. 11(a), (b) and (c) is not clear. The carbon coated sample images (Figs. 11(d)&(e) ) are clear as compare to the images of sample without coating. The EDX spectrum of the sample is shown in the Fig.11(f), it conforms that there is no impurity present in the material.
Current Microscopy Contributions to Advances in Science and Technology (A. Méndez-Vilas, Ed.)
© 2012 FORMATEX 1319
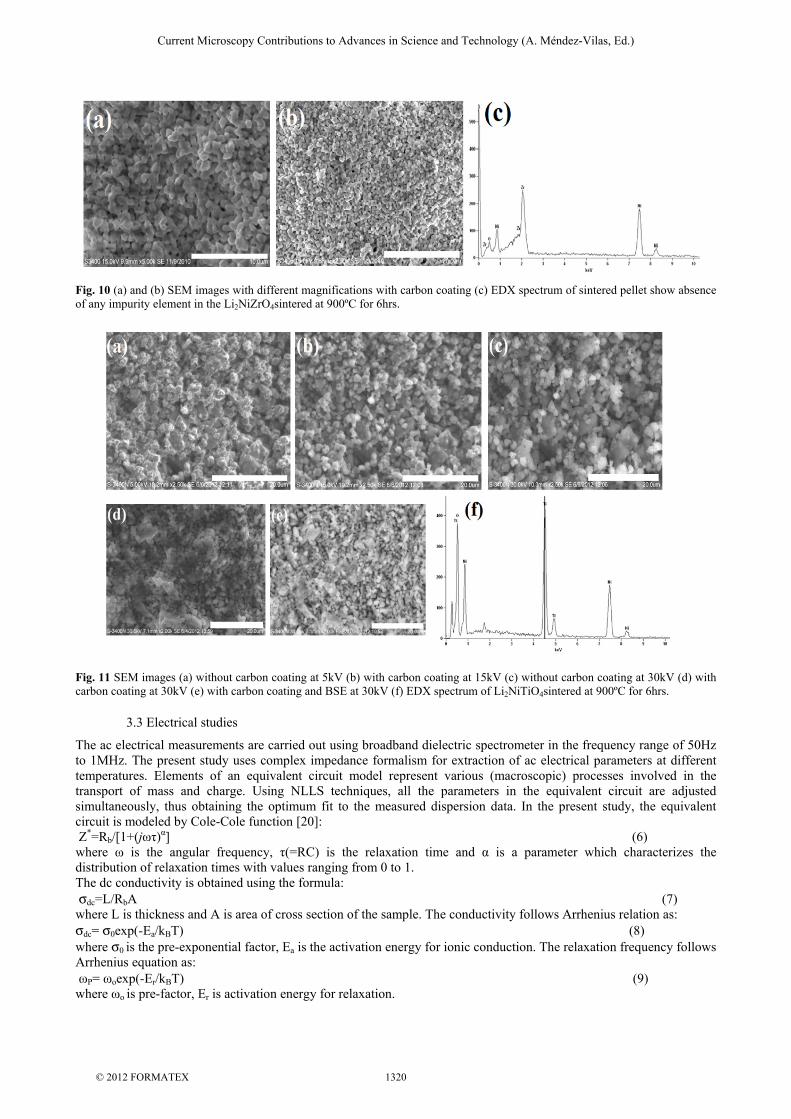
Fig. 10 (a) and (b) SEM images with different magnifications with carbon coating (c) EDX spectrum of sintered pellet show absence of any impurity element in the Li2NiZrO4sintered at 900ºC for 6hrs.
Fig. 11 SEM images (a) without carbon coating at 5kV (b) with carbon coating at 15kV (c) without carbon coating at 30kV (d) with carbon coating at 30kV (e) with carbon coating and BSE at 30kV (f) EDX spectrum of Li2NiTiO4sintered at 900ºC for 6hrs.
3.3 Electrical studies
The ac electrical measurements are carried out using broadband dielectric spectrometer in the frequency range of 50Hz to 1MHz. The present study uses complex impedance formalism for extraction of ac electrical parameters at different temperatures. Elements of an equivalent circuit model represent various (macroscopic) processes involved in the transport of mass and charge. Using NLLS techniques, all the parameters in the equivalent circuit are adjusted simultaneously, thus obtaining the optimum fit to the measured dispersion data. In the present study, the equivalent circuit is modeled by Cole-Cole function [20]: Z*=Rb/[1+(jωτ)α] (6) where ω is the angular frequency, τ(=RC) is the relaxation time and α is a parameter which characterizes the distribution of relaxation times with values ranging from 0 to 1. The dc conductivity is obtained using the formula: σdc=L/RbA (7) where L is thickness and A is area of cross section of the sample. The conductivity follows Arrhenius relation as: σdc= σ0exp(-Ea/kBT) (8) where σ0 is the pre-exponential factor, Ea is the activation energy for ionic conduction. The relaxation frequency follows Arrhenius equation as: ωP= ωoexp(-Er/kBT) (9) where ωo is pre-factor, Er is activation energy for relaxation.
Current Microscopy Contributions to Advances in Science and Technology (A. Méndez-Vilas, Ed.)
© 2012 FORMATEX 1320
The Li3Fe2(PO4)3 is synthesized using different fuels i.e., glycine (Li3Fe2(PO4)3-G) in 1:2 molar ratio and citric acid: ethylene glycol mixture in 1:1 molar ratio (Li3Fe2(PO4)3-EG:CA). The complex impedance spectra of Li3Fe2(PO4)3- EG:CA at 373K is shown in Fig. 12(a). The equivalent circuit consists of a depressed semi-circle, Rc(RgQg)(Qe), corresponding to the grain contribution and the spike, (Qe), represents the electrode polarization at the low frequency region. Rc is the resistance of electrolyte–electrode contact, that is characterized by the shift of impedance arc from the origin. Grain-boundary contribution is observed at higher temperatures in addition to the grain contribution in this material. Fig. 12(b), shows Arrhenius temperature dependence of dc conductivity and hopping frequency of Li3Fe2(PO4)3 materials. Li3Fe2(PO4)3-G shows higher conductivity values and its dc conductivity value at 323K is (1.14±0.05)x10-7Scm-1. This value is around one order higher than the reported value, 5.6x10⁻⁸Scm-1, for the microcrystalline Li3Fe2(PO4)3.
Fig.12 (a) Complex impedance plane plot of Li3Fe2(PO4)3-EG:CA at 373K (b) Arrhenius plots of grain and grain-boundary dc conductivity and dispersion peak frequencyLi3Fe2(PO4)3-EG:CA. (c) Arrhenius plot for grain and (d) grain-boundary conductivity of microcrystalline and nanocrystalline LiTi2(PO4)3 material. Solid line represents best fit to Eqs. 8&9. The grain conductivity at 309K (σdcg309K=1.82x10⁻⁶Scm-1) of the microcrystalline material is consistent with the reported room temperature value of 10-7Scm-1 [21]. At 388K, grain conductivity (σdcg388K=8.57x10⁻⁴Scm-1) of nanocrystalline material shows an order of magnitude jump [6] compared to the microcrystalline material (σdcg388K=7.74x10⁻⁵Scm-1). This significant increase in the grain conduction resulted from the reduced crystallite size. High energy ball-milling introduces grain-boundaries in the material and its volume fraction is more in nanocrystalline material. The diffusion through grain-boundaries is much faster than the grain diffusion; hence large volume fractions of grain-boundaries play a dominant role in ion conduction [22]. From the slope of the Arrhenius plots (Figs. 12 (c) & (d)), grain and grain-boundary activation energies are calculated and are shown in Table 2. Increase in the grain conductivity of the nanocrystalline material is due to the feasible conduction through the grain-boundaries as its activation energy for grain-boundary conduction is less compared to the grain conduction [6]. Even though the ball-milling decreases the crystallite size, its distribution is not uniform due to dry milling. The non-uniform size distribution and agglomeration are the causes of higher activation energy in nanocrystalline LiTi2(PO4)3 material, in spite of its higher conductivity [6]. These agglomerated crystallites are seen clearly in SEM images.
0 5 10 15 20
0
5
10
15
20
373K NLLS fit
-Z
"(ω
)x10
5 [Ω]
Rc(R
gQ
g)(Q
e)
Z'(ω)x105[Ω]
Li3Fe
2(PO
4)
3-CA:EG
(a) 2.4 2.8 3.210-8
10-4
100
104
108
Arrhenius fit
Li3Fe
2(PO
4)
3
σ dcT
[Scm
-1K
]
ω
p[rad
s-1]
1000/T[K-1]
σg-G
σgb
-CA:EG
σg-CA:EG
ωp-G
ωp-CA:EG
(b)
2.4 2.6 2.8 3.0 3.2 3.410-4
10-3
10-2
10-1
100
(c)
Microcrystalline LTPNanocrystalline LTP
σ dcT
[Scm
-1K
]
1000/T[K-1]
2.4 2.6 2.8 3.0 3.2
10-5
10-4
(d)
nanocrystalline LTPMicrocrystalline LTP
σdc
T [
Scm
-1K
]
1000/T [K-1]
Current Microscopy Contributions to Advances in Science and Technology (A. Méndez-Vilas, Ed.)
© 2012 FORMATEX 1321
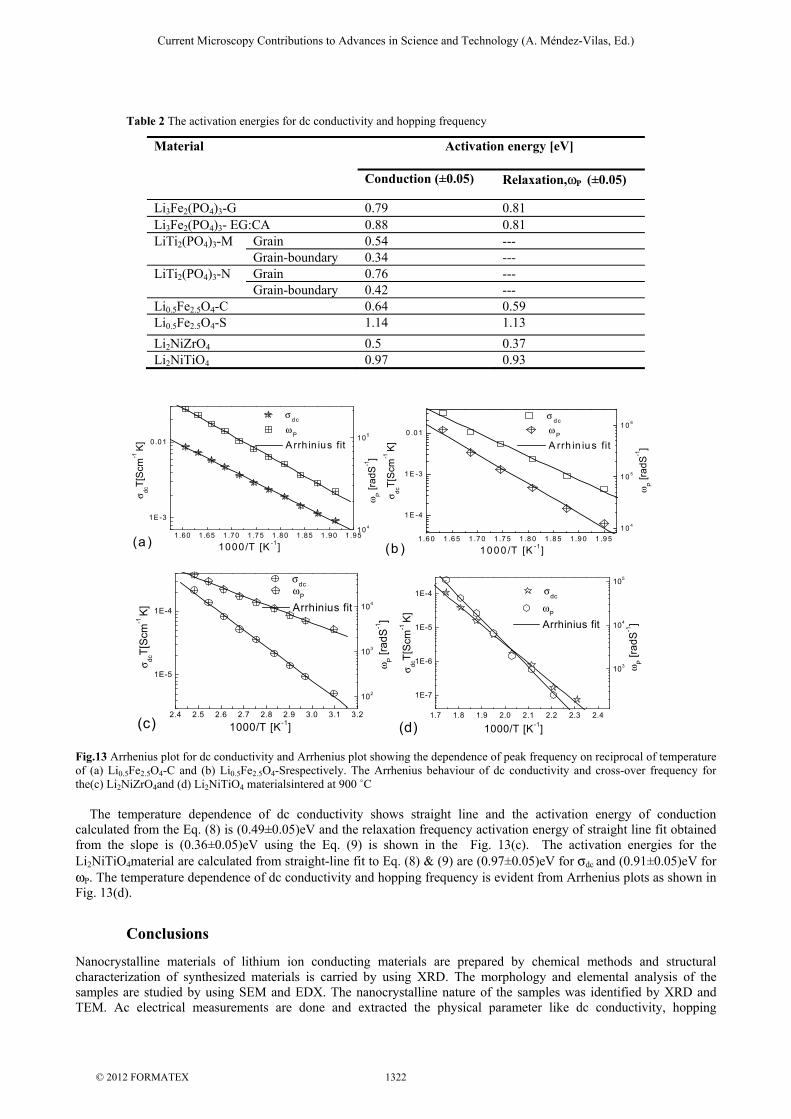
Table 2 The activation energies for dc conductivity and hopping frequency
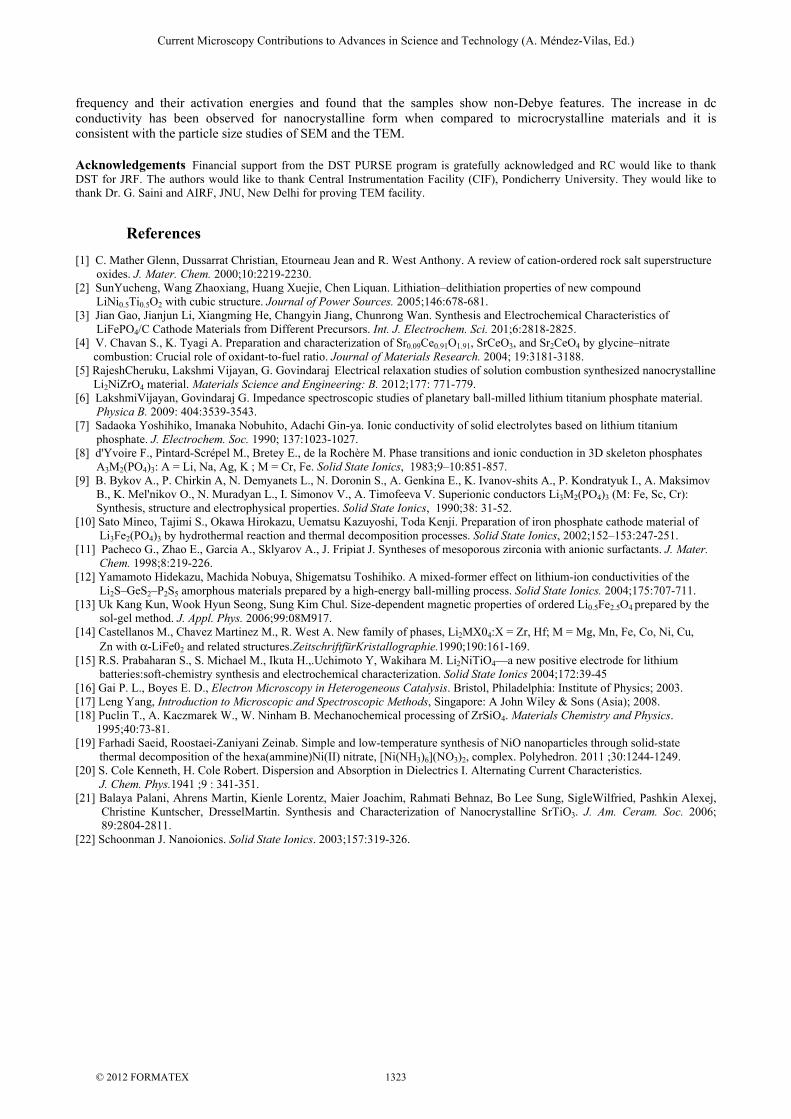
Fig.13 Arrhenius plot for dc conductivity and Arrhenius plot showing the dependence of peak frequency on reciprocal of temperature of (a) Li0.5Fe2.5O4-C and (b) Li0.5Fe2.5O4-Srespectively. The Arrhenius behaviour of dc conductivity and cross-over frequency for the(c) Li2NiZrO4and (d) Li2NiTiO4 materialsintered at 900 ˚C The temperature dependence of dc conductivity shows straight line and the activation energy of conduction calculated from the Eq. (8) is (0.49±0.05)eV and the relaxation frequency activation energy of straight line fit obtained from the slope is (0.36±0.05)eV using the Eq. (9) is shown in the Fig. 13(c). The activation energies for the Li2NiTiO4material are calculated from straight-line fit to Eq. (8) & (9) are (0.97±0.05)eV for σdc and (0.91±0.05)eV for ωP. The temperature dependence of dc conductivity and hopping frequency is evident from Arrhenius plots as shown in Fig. 13(d).
Conclusions
Nanocrystalline materials of lithium ion conducting materials are prepared by chemical methods and structural characterization of synthesized materials is carried by using XRD. The morphology and elemental analysis of the samples are studied by using SEM and EDX. The nanocrystalline nature of the samples was identified by XRD and TEM. Ac electrical measurements are done and extracted the physical parameter like dc conductivity, hopping
Material Activation energy [eV]
Conduction (±0.05) Relaxation,ωP (±0.05)
Li3Fe2(PO4)3-G 0.79 0.81 Li3Fe2(PO4)3- EG:CA 0.88 0.81 LiTi2(PO4)3-M Grain 0.54 ---
Grain-boundary 0.34 --- LiTi2(PO4)3-N Grain 0.76 ---
Grain-boundary 0.42 --- Li0.5Fe2.5O4-C 0.64 0.59 Li0.5Fe2.5O4-S 1.14 1.13
Li2NiZrO4 0.5 0.37 Li2NiTiO4 0.97 0.93
1 .6 0 1 .6 5 1 .7 0 1 .7 5 1 .8 0 1 .8 5 1 .9 0 1 .9 5
1 E -4
1 E -3
0 .0 1
σ d c
1 0 0 0 /T [K -1]
σ dcT[
Scm
-1 K]
1 0 4
1 0 5
1 0 6
(b )
ω P
A rrh in iu s fit
ωP [r
adS-1
]
1 .60 1 .65 1.70 1.75 1.80 1.85 1.90 1.95
1E -3
0.01
(a )
σ dc
1000/T [K -1]
σ dcT[
Scm
-1 K
]
10 4
10 5 ω P
A rrh in ius fit
ωP [r
adS
-1]
2.4 2.5 2.6 2.7 2.8 2.9 3.0 3.1 3.2
1E-5
1E-4
σdc
1000/T [K-1]
σ dcT[
Scm
-1 K
]
102
103
104
(c)
ωP
Arrhinius fit
ωP [r
adS-1
]
1.7 1.8 1.9 2.0 2.1 2.2 2.3 2.4
1E-7
1E-6
1E-5
1E-4
σdc
1000/T [K-1]
σ dcT[
Scm
-1 K
]
103
104
105
(d)
ωP
Arrhinius fitω
P [r
adS-1
]
Current Microscopy Contributions to Advances in Science and Technology (A. Méndez-Vilas, Ed.)
© 2012 FORMATEX 1322
frequency and their activation energies and found that the samples show non-Debye features. The increase in dc conductivity has been observed for nanocrystalline form when compared to microcrystalline materials and it is consistent with the particle size studies of SEM and the TEM.
Acknowledgements Financial support from the DST PURSE program is gratefully acknowledged and RC would like to thank DST for JRF. The authors would like to thank Central Instrumentation Facility (CIF), Pondicherry University. They would like to thank Dr. G. Saini and AIRF, JNU, New Delhi for proving TEM facility.
References
[1] C. Mather Glenn, Dussarrat Christian, Etourneau Jean and R. West Anthony. A review of cation-ordered rock salt superstructure oxides. J. Mater. Chem. 2000;10:2219-2230. [2] SunYucheng, Wang Zhaoxiang, Huang Xuejie, Chen Liquan. Lithiation–delithiation properties of new compound LiNi0.5Ti0.5O2 with cubic structure. Journal of Power Sources. 2005;146:678-681. [3] Jian Gao, Jianjun Li, Xiangming He, Changyin Jiang, Chunrong Wan. Synthesis and Electrochemical Characteristics of LiFePO4/C Cathode Materials from Different Precursors. Int. J. Electrochem. Sci. 201;6:2818-2825. [4] V. Chavan S., K. Tyagi A. Preparation and characterization of Sr0.09Ce0.91O1.91, SrCeO3, and Sr2CeO4 by glycine–nitrate combustion: Crucial role of oxidant-to-fuel ratio. Journal of Materials Research. 2004; 19:3181-3188. [5] RajeshCheruku, Lakshmi Vijayan, G. Govindaraj Electrical relaxation studies of solution combustion synthesized nanocrystalline Li2NiZrO4 material. Materials Science and Engineering: B. 2012;177: 771-779. [6] LakshmiVijayan, Govindaraj G. Impedance spectroscopic studies of planetary ball-milled lithium titanium phosphate material. Physica B. 2009: 404:3539-3543. [7] Sadaoka Yoshihiko, Imanaka Nobuhito, Adachi Gin-ya. Ionic conductivity of solid electrolytes based on lithium titanium phosphate. J. Electrochem. Soc. 1990; 137:1023-1027. [8] d'Yvoire F., Pintard-Scrépel M., Bretey E., de la Rochère M. Phase transitions and ionic conduction in 3D skeleton phosphates A3M2(PO4)3: A = Li, Na, Ag, K ; M = Cr, Fe. Solid State Ionics, 1983;9–10:851-857. [9] B. Bykov A., P. Chirkin A, N. Demyanets L., N. Doronin S., A. Genkina E., K. Ivanov-shits A., P. Kondratyuk I., A. Maksimov B., K. Mel'nikov O., N. Muradyan L., I. Simonov V., A. Timofeeva V. Superionic conductors Li3M2(PO4)3 (M: Fe, Sc, Cr): Synthesis, structure and electrophysical properties. Solid State Ionics, 1990;38: 31-52. [10] Sato Mineo, Tajimi S., Okawa Hirokazu, Uematsu Kazuyoshi, Toda Kenji. Preparation of iron phosphate cathode material of Li3Fe2(PO4)3 by hydrothermal reaction and thermal decomposition processes. Solid State Ionics, 2002;152–153:247-251. [11] Pacheco G., Zhao E., Garcia A., Sklyarov A., J. Fripiat J. Syntheses of mesoporous zirconia with anionic surfactants. J. Mater. Chem. 1998;8:219-226. [12] Yamamoto Hidekazu, Machida Nobuya, Shigematsu Toshihiko. A mixed-former effect on lithium-ion conductivities of the Li2S–GeS2–P2S5 amorphous materials prepared by a high-energy ball-milling process. Solid State Ionics. 2004;175:707-711. [13] Uk Kang Kun, Wook Hyun Seong, Sung Kim Chul. Size-dependent magnetic properties of ordered Li0.5Fe2.5O4 prepared by the sol-gel method. J. Appl. Phys. 2006;99:08M917. [14] Castellanos M., Chavez Martinez M., R. West A. New family of phases, Li2MX04:X = Zr, Hf; M = Mg, Mn, Fe, Co, Ni, Cu, Zn with α-LiFe02 and related structures.ZeitschriftfürKristallographie.1990;190:161-169. [15] R.S. Prabaharan S., S. Michael M., Ikuta H.,.Uchimoto Y, Wakihara M. Li2NiTiO4—a new positive electrode for lithium batteries:soft-chemistry synthesis and electrochemical characterization. Solid State Ionics 2004;172:39-45 [16] Gai P. L., Boyes E. D., Electron Microscopy in Heterogeneous Catalysis. Bristol, Philadelphia: Institute of Physics; 2003. [17] Leng Yang, Introduction to Microscopic and Spectroscopic Methods, Singapore: A John Wiley & Sons (Asia); 2008. [18] Puclin T., A. Kaczmarek W., W. Ninham B. Mechanochemical processing of ZrSiO4. Materials Chemistry and Physics. 1995;40:73-81. [19] Farhadi Saeid, Roostaei-Zaniyani Zeinab. Simple and low-temperature synthesis of NiO nanoparticles through solid-state thermal decomposition of the hexa(ammine)Ni(II) nitrate, [Ni(NH3)6](NO3)2, complex. Polyhedron. 2011 ;30:1244-1249. [20] S. Cole Kenneth, H. Cole Robert. Dispersion and Absorption in Dielectrics I. Alternating Current Characteristics. J. Chem. Phys.1941 ;9 : 341-351. [21] Balaya Palani, Ahrens Martin, Kienle Lorentz, Maier Joachim, Rahmati Behnaz, Bo Lee Sung, SigleWilfried, Pashkin Alexej,
Christine Kuntscher, DresselMartin. Synthesis and Characterization of Nanocrystalline SrTiO3. J. Am. Ceram. Soc. 2006; 89:2804-2811.
[22] Schoonman J. Nanoionics. Solid State Ionics. 2003;157:319-326.
Current Microscopy Contributions to Advances in Science and Technology (A. Méndez-Vilas, Ed.)
© 2012 FORMATEX 1323