electricity department, government of...
TRANSCRIPT

Petition for approval of
Aggregate Revenue Requirement (ARR), Expected Revenue fromCharges (ERC)
And
Tariff Revision for FY2012-13
Of
Electricity Department, Government of Puducherry
Submitted to
The Hon’ble Joint Electricity Regulatory Commission Gurgaon
By
Electricity Department, Government of Puducherry

Aggregate Revenue Requirement, Expected Revenue from Charges & Tariff Petition FY 2012-13
Electricity Department, Puducherry 2
Contents
1 Introduction 8
Electricity Department of Puducherry 11
Consumer & Sales Mix 11
2 Revised estimate for FY2011-12 13
Introduction 13
Capital expenditure 13
Sales 13
Losses 15
Cost of power purchase 17
Operations & maintenance expenditure 21
Employee cost 22
Repairs & Maintenance 22
Administrative & General 22
Depreciation 23
Interest & finance charges 23
Interest on working capital 23
Provision for bad & doubtful debts 24
Return on capital base 24
Revenue from UI sales 25
Non-tariff income 25
Summary of revenue requirement 26
Average Cost to Serve 27
Revenue from charges & gap for FY2011-12 27
3 Capital Expenditure for 2012-13 28
4 Sales projection, losses & energy balance 30
Introduction 30
Approach to forecasting sales 30
Estimated consumers & sales 31
Losses 33
Energy Balance 33

Aggregate Revenue Requirement, Expected Revenue from Charges & Tariff Petition FY 2012-13
Electricity Department, Puducherry 3
5 Aggregate revenue requirement for FY2012-13 35
Projected cost of power purchase in 2012 – 13 35
Operation & Maintenance expenses 41
Employee Costs 42
Repairs & maintenance expenses 43
Administrative & General (A&G) expenses 44
Depreciation 44
Interest & finance charges 45
Interest on working capital 45
Provision for bad & doubtful debts 46
Return on capital base 47
Non – Tariff Income 48
Summary of Revenue Requirement 50
Average Cost to Serve 51
6 Expected revenue from charges & gap 52
7 Tariff petition 53
Necessity for tariff petition 53
Tariff philosophy 53
Proposed tariff 54
8 Prayer 56
9 Proposed Tariff Schedule 57
A. Low Tension Supply 57
DomesticPurposes(A2) 57
HutServices(A3) 57
Commercial(A1) 58
Agricultural Services (D) 59
CottageIndustries/Horticulture /PoultryFarms(D2): 60
Publiclighting 61
Industrial(C) 61
B. High tension supply 62
HighTension–I (a) 62
HighTension–I (b) 62

Aggregate Revenue Requirement, Expected Revenue from Charges & Tariff Petition FY 2012-13
Electricity Department, Puducherry 4
High Tension –I (C) 62
HighTension-II 63
HighTension-III 64
C. Temporary supply 64
10 Proposed schedule of services & charges 66
Charges for service connections 66
Testing of installation 66
Testing of meters & metering arrangements 67
Testing of HT/EHT consumer protective equipment 67
Disconnection / Re-connection charges 68
Title transfer of services 68
Furnishing of certified copies 68
Meter rent charges 68
Fuse renewal charges 69
Shifting of meter board at consumer’s request 69
Belated payment surcharge 69
11 Annexures 70
Annexure 1 – Financial statements 70
Financial Statements for FY2010-11 71
PART B: NOTES FORMING PART OF ACCOUNTS 85
Annexure 2 – Regulatory formats 89
Aggregate Revenue Requirement, Expected Revenue from Charges & Tariff Petition FY 2012-13
Electricity Department, Puducherry 5
List of Tables
Table 1: Network Configuration (as on 31st march 2011) 11
Table 2: Consumer & Sales Mix 12
Table 3: Power Consumption across categories (10-11) 12
Table 4: FY2011-12 - Proposed capital expenditure & capitalisation 13
Table 5: 1HFY2011 - 12 - Actual achievement 13
Table 6: FY2011-12 – Projected sales vs actual sales for 1HFY12 14
Table 7: Revised estimates for FY12 15
Table 8: FY2011-12 – T&D and AT&C losses (Revised estimate) 16
Table 9: Summary of credit & debit notes accounted in 1HFY12 18
Table 10: 1HFY12 - Power purchase cost (Actual) 19
Table 11: FY2011-12 – Energy balance statement (Revised estimate) 21
Table 12: FY2011-12 – Employee costs (Revised estimate) 22
Table 13: 1HFY2011-12 – Depreciation 23
Table 14: FY2011-12 – Interest on working capital (Revised estimate) 24
Table 15: FY2011-12 – Return on capital base (Revised estimate) 24
Table 16: FY2011-12 - Non tariff income (Revised estimate) 26
Table 17: FY2011-12 – Aggregate Revenue Requirement (Revised estimate) 26
Table 18: FY2011-12 – Average CoS (Revised estimate) 27
Table 19: FY2011-12 - Revenue from charges & gap (Revised estimate) 27
Table 20: Capital Expenditure (FY11, HY12) 28
Table 21: Proposed Capital Expenditure in FY13 29
Table 22: LT - Projected Consumer data for FY13 32
Table 23: LT - Projected Sales Data - FY13 32
Table 24: HT - Projected Sales data - FY13 33
Table 25: Energy Balance Statement 34
Table 26: Power Purchase - NTPC Licensee Share Assumed 35
Table 27: Power Purchase - NTPC PLF Assumed 36
Table 28: Power Purchase - NLC Licensee Share Assumed 37
Table 29: Power Purchase - NLC PLF Assumed 37
Table 30: Power Purchase - NPCIL Licensee Share Assumed 38
Table 31: Power Purchase - NPCIL PLF Assumed 38
Table 32: Power Purchase Cost summary – FY2012-13 (Projected) 39
Table 33: RPO Compliance Cost FY12-13 (Projected) 40
Table 34: Total Power Purchase Cost – FY2012 – 13 (Projected) 41
Table 35: O&M Costs 42
Table 36: Employee Strength Projection – FY2012-13 42
Table 37: Employee Cost - Summary 43
Table 38: R&M Costs 43
Table 39: FY2012- 13 - A&G Expenses 44
Table 40: Depreciation Rates Applied 44

Aggregate Revenue Requirement, Expected Revenue from Charges & Tariff Petition FY 2012-13
Electricity Department, Puducherry 6
Table 41: Projected Depreciation (FY13) 45
Table 42: Projections of Interest on Working Capital (FY13) 46
Table 43: Segregated figures of outstanding dues from permanently disconnected HT consumers 46
Table 44: Return on Capital Base (FY13) 48
Table 45: Non-Tariff Income (FY13) 50
Table 46: Net Revenue Requirement (FY13) 50
Table 47: Change in proportion of costs in gross ARR 51
Table 48: Average Cost to Serve 51
Table 49: Revenue from Charges - Summary 52
Table 50: FY2012-13 – Category-wise cost recovery at existing tariff 53
Table 51: FY2012-13 – Summary of existing & proposed tariff 54
Table 52: Category-wise cost recovery at proposed tariff 55
Table 53: Balance sheet as on 31.03.2011 71
Table 54: Profit & loss account for the year ended 31.03.2011 72
Table 55: Cashflow statement for the year ended 31.03.2011 73
Table 56: Schedules forming part of the unaudited financial statements for FY2010-11 74
Table 57: F1 - Energy demand 90
Table 58: F2 - AT&C losses 91
Table 59: F3 - Energy balance 91
Table 60: F4 - Power purchase cost - FY2010-11 (Actual) 92
Table 61: F4 - Power purchase cost - FY2011-12 (Revised estimate) 93
Table 62: F4 - Power purchase cost - FY2012-13 (Projected) 94
Table 63: F6 - Return on capital base 96
Table 64: F7 - Original cost of fixed assets 96
Table 65: F8 - Capital works in progress 96
Table 66: F9 - Interest capitalised 96
Table 67: F10 - Loans for the year 98
Table 68: F11 - Restructuring of outstanding loans 99
Table 69: F12 - Assets & Depreciation Charge 100
Table 70: F13 - Advance against depreciation 101
Table 71: F14 - Repairs & maintenance 101
Table 72: F15 - Total employee count 101
Table 73: F16 - Employee cost 102
Table 74: F17 - A&G expenses 102
Table 75: F18 - Bad & doubtful debts 102
Table 76: F19 - Interest on working capital 103
Table 77: F20 - Foreign exchange rate variation 103
Table 78: F21 - Non tariff income 103
Table 79: F22 - Revenue from other business 103
Table 80: F23 - Lease details 104
Table 81: F24 - Wholesale price index 104
Table 82: F25 - Equity & loans 104

Aggregate Revenue Requirement, Expected Revenue from Charges & Tariff Petition FY 2012-13
Electricity Department, Puducherry 7
Table 83: F26 – CF for Ensuing Year 104
Table 84: F27 - ARR 105
Table 85: F28 - Expected revenue from charges - FY2010-11 (Actual) 106
Table 86: F28 - Expected revenue from charges - FY2011-12 (Revised estimate) 107
Table 87: F28 - Expected revenue from charges - FY2012-13 (Estimated) 109

Aggregate Revenue Requirement, Expected Revenue from Charges & Tariff Petition FY 2012-13
Electricity Department, Puducherry 8
1 Introduction 1.1 The Union Territory of Puducherry is spread over an area of 492 sq.km., which consists of the four
erstwhile French establishments of Puducherry, Karaikal, Mahe and Yanam. The total population
of the UT of Puducherry is 12, 44, 464 as per provisional results of Census 2011
i) Puducherry region, which is the largest of all the four, lies on the east coast, consisting of 12
scattered areas, surrounded by the State of Tamil Nadu and by the Bay of Bengal on the East
ii) Karaikal region is about 150 km South of Puducherry. Like Puducherry region, the Karaikal
region is also surrounded by the State of Tamil Nadu and by the Bay of Bengal on the East
iii) Yanam region is located approximately 840 km north-east of Puducherry near Kakinada in
Andhra Pradesh
1.2 Puducherry region is situated on the Coramandal Coast north of Pennaiyar River and is bounded
by Bay of Bengal on the East and South Arkot districts of Tamil Nadu on other sides. It has an area
of 293 sq. kms. Puducherry is not a contiguous area but interspersed with bits of territory of Tamil
Nadu. Puducherry town is the capital of Union Territory
1.3 Karaikal region lies 150 kilometers south of Puducherry and it is bounded on North, South and
West by the Thanjavur district of Tamil Nadu and on the East by Bay of Bengal. It has an area of
160 sq. kms lying in the Cauvery Delta being irrigated by the canals of the Cauvery River. The soil
is composed of sand and alluvial deposits which is suitable for paddy cultivation.
1.4 Mahe region is isolated from Puducherry by about 500 miles and has an area of 9 sq. kms and is
located at a distance of about 6 kms South of Tellichery town. Mahe town is situated on the
Southern bank of Mahe region.
1.5 Yanam region is situated on the East coast as a pocket in the East Godavari District of Andhra
Pradesh and Lies at a distance of 28 kms. south of Kakinada town. This is the smallest of the 4
regions in terms of population even though it has an area of 30sq. kms. Yanam is built on the spot
where the rivers of Godavari and Coringa separate and is bounded on the east and south by one
or the other of these two rivers.
Aggregate Revenue Requirement, Expected Revenue from Charges & Tariff Petition FY 2012-13
Electricity Department, Puducherry 9
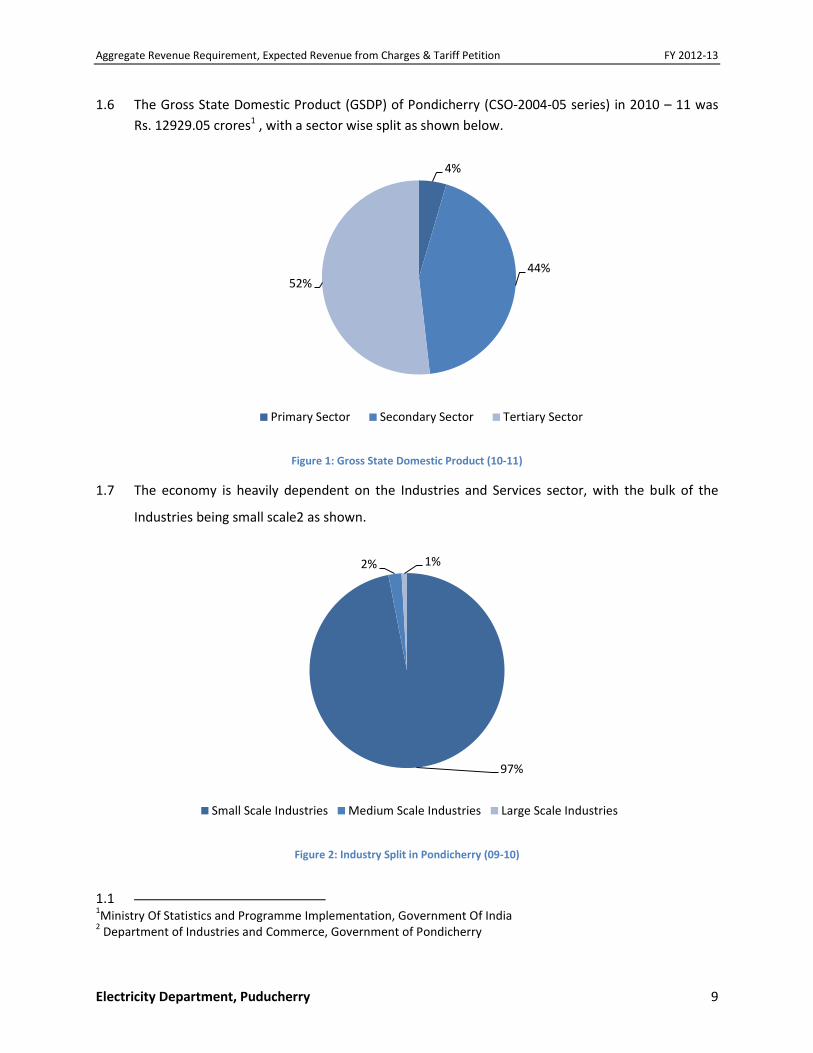
1.6 The Gross State Domestic Product (GSDP) of Pondicherry (CSO-2004-05 series) in 2010 – 11 was
Rs. 12929.05 crores1 , with a sector wise split as shown below.
Figure 1: Gross State Domestic Product (10-11)
1.7 The economy is heavily dependent on the Industries and Services sector, with the bulk of the
Industries being small scale2 as shown.
Figure 2: Industry Split in Pondicherry (09-10)
1.1 1Ministry Of Statistics and Programme Implementation, Government Of India
2 Department of Industries and Commerce, Government of Pondicherry
4%
44% 52%
Primary Sector Secondary Sector Tertiary Sector
97%
2% 1%
Small Scale Industries Medium Scale Industries Large Scale Industries

Aggregate Revenue Requirement, Expected Revenue from Charges & Tariff Petition FY 2012-13
Electricity Department, Puducherry 10

Aggregate Revenue Requirement, Expected Revenue from Charges & Tariff Petition FY 2012-13
Electricity Department, Puducherry 11
Electricity Department of Puducherry
1.9 Electricity Department of Puducherry performs thefunctions of transmission and distribution of
electric power to the Union Territory. The sole generating station in Puducherry is a 32.5 MW
combined cycle gas power plant in Karaikal owned by the Puducherry Power Corporation Limited.
The entire power requirement of Puducherry is met from the power allocated from the Central
Generating Stations, Tamil Nadu Electricity Board, Kerala State Electricity Board and from the
Puducherry Power Corporation Limited
1.10 EDP operates a transmission network of 110 kV and 230 kV and distribution network at 33 kV, 22
kV, 11 kV and LT levels. The network configuration as on 31st March, 2011 is as given below.
Voltage Lines (Ckt Km)
Substations (Nos & capacity)
Transformation Capacity (MVA)
Transmission
230 kV/110kV 45 2 360
132 kV/33-11 kV 30 1 36
110 kV/22-11 kV 182 13 499
Distribution
33/11kV 10.2 1 10
22 kV & 11 kV (Overhead) 1208.27
2071
22 kV & 11 kV (Underground)
67.72
LT (Overhead) 4425.5
LT (Underground) 794.89
Table 1: Network Configuration (as on 31st march 2011)
1.11 The Transmission and Distribution Losses and the AT & C losses are comparatively lower than
many of the other States. The Transmission & distribution loss of the system is estimated to be
around 13.6% for the year 2010-11.
Consumer & Sales Mix
1.12 The number of consumers in each category is shown below
Consumers [No] FY06 FY07 FY08 FY09 FY10 FY11
Domestic 222,914 234,734 245,822 256,245 269,755 275,847
Commercial 34,824 36,205 37,407 38,427 40,539 40,531
Agriculture 8,772 8,834 8,897 8,960 6,810 6,810
Street lighting 41,880 43,421 44,859 45,617 47,686 48,167
Industrial 5,383 5,516 5,643 5,769 5,885 5,955
LT total 313,773 328,710 342,628 355,018 370,675 377,310

Aggregate Revenue Requirement, Expected Revenue from Charges & Tariff Petition FY 2012-13
Electricity Department, Puducherry 12
Consumers [No] FY06 FY07 FY08 FY09 FY10 FY11
HT I 354 402 408 420 379 394
HT II 32 32 32 32 40 41
HT III 5 5 5 5 6 7
HT total 391 439 445 457 425 442
Total consumers 314,164 329,149 343,073 355,475 371,100 377,752 Table 2: Consumer & Sales Mix
1.13 The total consumption of power in Puducherry for 2010-11 across various categories is given
below.
Category Actual [MU]
Domestic 508.3
Hut services 10.2
Commercial 156.3
Agriculture 76.7
Public lighting 22.1
Industrial 114.5
Water tanks 35.2
Temporary supply 7.9
LT total 931.2
Industrial 1,005.7
State & Central government establishments
34.9
Industrial Extra High Tension 237.4
Commercial -
Temporary supply -
HT Total 1,278.0
Total sales within UT 2,209.3
Table 3: Power Consumption across categories (10-11)

Aggregate Revenue Requirement, Expected Revenue from Charges & Tariff Petition FY 2012-13
Electricity Department, Puducherry 13
2 Revised estimate for FY2011-12
Introduction 2.1 The ARR & ERC petition, along with a tariff petition for FY2011 – 12 was filed on 30th September
2011, and is currently under the consideration of the Hon’ble Commission
2.2 In this chapter, we present the actual performance of the EDP for the first 6 months of FY2011-12
and revised projections, if any, for the full year
Capital expenditure
2.3 In its petition for FY2011-12, the EDP had projected capital expenditure of 84.58 Crs across
transmission and normal development schemes, and had proposed to capitalize 61.64 Crs. The
details are given below for easy reference
Expenditure [Crs] Capitalization [Crs]
Transmission 63.65 40.71
Distribution 20.93 20.93
Total 84.58 61.64
Table 4: FY2011-12 - Proposed capital expenditure & capitalisation
2.4 The actual performance for the first half of the year is presented below
Expenditure
[Crs] Capitalization
[Crs]
Transmission 2.76 3.53
Distribution 7.85 7.85
Others 0.14 0.14
10.74 11.51
Table 5: 1HFY2011 - 12 - Actual achievement
2.5 Historically, implementation of capital schemes, and associated capitalisation pick up pace in the
second half of the year. Therefore, we propose no changes to the earlier projection of capital
expenditure & capitalisation
Sales
2.6 The table below shows the sales projections made by the EDP in its ARR & ERC petition for
FY2011-12, and actual sales for the first 6 months of FY12.

Aggregate Revenue Requirement, Expected Revenue from Charges & Tariff Petition FY 2012-13
Electricity Department, Puducherry 14
FY2011 - 12 (Original estimate)
1HFY2011 – 12 (actual)
Description Consumers
[No] Connected load
[HP / kVA] Sales [MU]
Sales [MU]
LT
Domestic 252,452 563.1 292.0
Hut services 35,447 9.3 4.4
Commercial 41,854 172.1 90.5
Agriculture 6,810 59,538 76.7 37.8
Public lighting 48,280 23.4 12.5
Industrial 6,028 124.9 63.1
Water tanks 58 35.2 27.4
Temporary supply 15 9.2
Total LT 390,928 59,538 1019.7 536.9
HT
Industrial 402 245,630 1,016.3 509.7
State & Central government establishments
42 14,265 37.3 20.9
Industrial Extra High Tension 7 80,495 236.5 153.5
Total HT 451 340,390 1,290.0 684.1
Total metered 349,122 2,223.8 1,178.8
Total unmetered 42,257 86.1 42.2
Total 391,379 2,309.7 1,221.0 Table 6: FY2011-12 – Projected sales vs actual sales for 1HFY12
2.7 The first few months of the financial year are summer months in Puducherry, and typically
witness higher than average consumption. As the monsoons arrive, consumption typically
moderates and therefore, we have largely maintained our original projection for sales in FY2011-
12. The only change expected is in temporary supply, where the first 6 months have already
shown a sale of 9.2 MU. For this category, the expected sale for the year has been revised to
approximately 23 MU.
2.8 Therefore, the total sales estimate for FY2011-12 is revised to 2317.5 MU compared to 2309.9
MU and is provided in the table below.
Description Consumers [No]
Connected load [HP /
kVA]
Sales [MU]
LT
Domestic 252,452 563.1
Hut services 35,447 9.3
Commercial 41,854 172.1
Agriculture 6,810 59,538 76.7
Public lighting 48,280 23.4
Industrial 6,028 124.9
Water tanks 58 35.2

Aggregate Revenue Requirement, Expected Revenue from Charges & Tariff Petition FY 2012-13
Electricity Department, Puducherry 15
Temporary supply 22.6
Total LT 390,928 59,538 1,027.5
HT
Industrial 403 245,630 1,016.3
State & Central government establishments
41 14,265 37.3
Industrial Extra High Tension 7 80,495 236.5
Temporary supply
Total HT 451 340,390 1,290.0
Total metered 349,122 2,231.4
Total unmetered 42,257 86.1
Total 391,379 2,317.5 Table 7: Revised estimates for FY12
Losses
2.9 The EDP had proposed to achieve a T&D loss percentage of 13.47% for FY2011 – 12, based on the
projected sales of 2309.9MU and energy input of 2669.5 MU
2.10 Whilst the EDP operates a relatively smaller system, reduction in losses becomes progressively
more difficult due to technical parameters. A rough estimate of the losses in the HT system, up till
11kV level is 4%. This value can be conclusively determined only after all DTRs are metered under
the approved R-APDRP scheme and a full load flow study is conducted.
Losses in the LT distribution system are higher, given the lower voltage and older assets. Further,
the EDP is experiencing an increasingly adverse LT:HT sales mix. Considering that the HT:LT system
ratio is 1:3.4, and much higher technical losses in the lower voltage system, significant
improvement needs to be made in the LT distribution system to progressively reduce the losses.
Given the paucity of funds required to make the requisite improvement in the LT system, we are
proposing only marginal decrease in losses for FY2011-12
2.11 Presently, the EDP is not in a position to calculate feeder-wise loss levels, which it hopes to
provide once the R-APDRP scheme proposed for the UT, for which the Hon’ble Commission has
given its approval for, is implemented. The EDP shall endeavour to provide this data as soon as
the scheme is implemented and sufficient data is collected
2.12 The actual sales for the first 6 months of FY12 is 1221MU, with a net energy input of 1411.5 MU,
showing a T&D loss of 13.50%. However, the collection efficiency for the same period was only
84%, compared to the proposed collection efficiency of 93.8%. The summary of energy input and

Aggregate Revenue Requirement, Expected Revenue from Charges & Tariff Petition FY 2012-13
Electricity Department, Puducherry 16
sales as per earlier estimates, actuals for the period and revised estimates is given below for easy
reference
Particulars Units FY2011 – 12 (Original estimate)
1HFY2011 - 12 (Actual)
FY2011 - 12 (Revised estimate)
Generation (Connected generation – PPCL) MU 242.9 119.7 242.9
Metered import at interface point MU 2,817.8 1,477.6 2,868.8
Sale through Unscheduled interchange MU 391.2 185.8 433.4
Energy available for sale within the UT MU 2,669.5 1,411.5 2,678.2
Metered sales MU 2,223.8 1,178.8 2,231.4
Unmetered sales MU 86.1 42.2 86.1
Total energy sold MU 2,309.9 1,221.0 2,317.5
Revenue from sales within UT Rs 692.8 362.6 696.6
Amount realized from billed sales Rs 649.8 304.6 653.4
Collection efficiency % 93.8% 84.0% 93.8%
Energy realized MU 2,166.6 1,025.8 2,173.7
Distribution Loss % 13.47% 13.50% 13.47%
AT&C Loss % 18.84% 27.32% 18.84%
Table 8: FY2011-12 – T&D and AT&C losses (Revised estimate)
2.13 Given the growth in demand in the UT, the EDP earlier found itself short of power, which meant
that it had to either overdraw and incur significant penalty or shed load, causing inconvenience and
hardship to consumers & revenue loss to the licensee. In order to fully serve the demand in the UT,
which is also seeing rapid growth from LT services, additional power allocation was requested,
which was granted to the UT. This has resulted in practically no load being shed since September
2010. Any load shedding that has happened since then has been on account of instantaneous
requirement to maintain grid discipline, violation of which will incur heavy penalty in the form of UI
charges for consumption above schedule.
Further, once capacity is allocated, it has to be paid for under the ABT mechanism. Given the fixed
cost commitment required to fully serve load even if energy is not drawn and since allocation is
from thermal / nuclear stations. EDP has not requested for back-down of capacity allocated and
instead chooses to sell through UI and use the entire earnings from UI sales, to offset the gross cost
to serve in the license area. For the year FY11-12, the average cost of power purchase is Rs
2.88/kWh as against the proposed sale of power through UI at an average rate of Rs. 3.48/kWh
expected to be received by the end of the year FY12.

Aggregate Revenue Requirement, Expected Revenue from Charges & Tariff Petition FY 2012-13
Electricity Department, Puducherry 17
Due to the current power supply position of the UT together with the allocations, EDP would be in
a comfortable position to serve load fully and expects that any excess power available will be sold
through UI. The revenue realized from the sale of UI is reduced in arriving at the cost of sale to
consumers in the license area.
As we are largely maintaining our forecast for sales in FY12, the increased availability of power at
the periphery will largely translate into higher UI sales. This is borne out by the fact that the UI
sales in the first 6 months have already reached 186 MU. The revised estimate for metered import
and UI sales is 2,868.8 MU & 433.4MU respectively.
2.14 Even though the collection efficiency has not been satisfactory during the first 6 months of the
fiscal, mainly on account of a delay in raising of bills through the system, incorporating the
relevant FCA adjustments.This has been addressed currently and we believe our original target for
collection efficiency of 93.8% for the full year can be achieved.
Cost of power purchase
2.15 The actual power purchase cost for the first 6 months of FY12 was filed in response to letter
Ref.No.16/15/2011-JERC dated 20th October 2011. As the compilation of accounts for the first
half of FY2011-12 has just been concluded, there are slight changes to the payment due to true-
up for previous years. The summary of debit & credit notes accounted in 1HFY12 is shown below
Date Debit / Credit notes Amount [Rs Crs]
PGCIL
1/6/2011 PG/SR/PED/2011-12/DNOTE/02 2.11
1/6/2011 PG/ER/PED/2011-12/DNOTE/04 0.03
1/7/2011 PG/SR/PED/2011-12/DNOTE/03 0.45
1/8/2011 PG/SR/PED/2011-12/DNOTE/05 9.80
1/10/2011 PG/ER/PED/2011-12/DNOTE/10 0.00
1/10/2011 PG/SR/PED/2011-12/DNOTE/07 2.34
2/5/2011 PG/SR/PED/2011-12/DNOTE/01 0.64
2/9/2011 PG/ER/PED/2011-12/DNOTE/09 0.06
2/9/2011 PG/SR/PED/2011-12/DNOTE/06 1.19
16/05/2011 PG/ER/PED/2011-12/DNOTE/03 0.02
13/07/2011 PG/SR/PED/2011-12/DNOTE/04 7.15
21/10/2011 PG/SR/PED/2011-12/CNOTE/08 (5.54)
Total 18.25
NLC
16/07/2011 Debit Note - Invoice No. 86/ CERC Arrears/ Comml/ TPS II/ PED/ 2011-12 85.04

Aggregate Revenue Requirement, Expected Revenue from Charges & Tariff Petition FY 2012-13
Electricity Department, Puducherry 18
8/8/2011 Credit Note - Invoice No. 125/ Comml/ Mine Closure/ PED/ 2011-12 (22.29)
Total 62.75
NTPC
5/5/2011 For the month of April (5.16)
6/6/2011 For the month of May 0.54
5/7/2011 For the month of June 0.24
6/8/2011 For the month of July 2011 (16.19)
Total (20.56)
Total 60.43
Table 9: Summary of credit & debit notes accounted in 1HFY12
2.16 The tariff charged by NLC stations for the period 1.4.2004 to 31.3.2009 was fixed by the Hon’ble
CERC in its Order on Petition No. 68/2005 dated 17th August 2006 and Petition No. 118/2007
dated 26th February 2008. Mine closure costs, at higher rates as approved by earlier Ministry of
Coal guidelines, was included in the lignite transfer price and hence, energy charges approved in
the Orders. As this was a valid tariff notified by the Hon’ble CERC, bills at this tariff were paid
from budgetary allocations provided to the EDP during respective years. Details of the credit note
received are provided below
Date 2003-04
2004-05
2005-06
2006-07
2007-08
2008-09
2009-10
2010-11
2011-12
TOTAL
8/8/2011 - (2.38) (2.40) (2.10) (3.04) (2.71) (3.98) (4.38) (1.31) (22.29)
Table 9a: Details of NLC credit note received
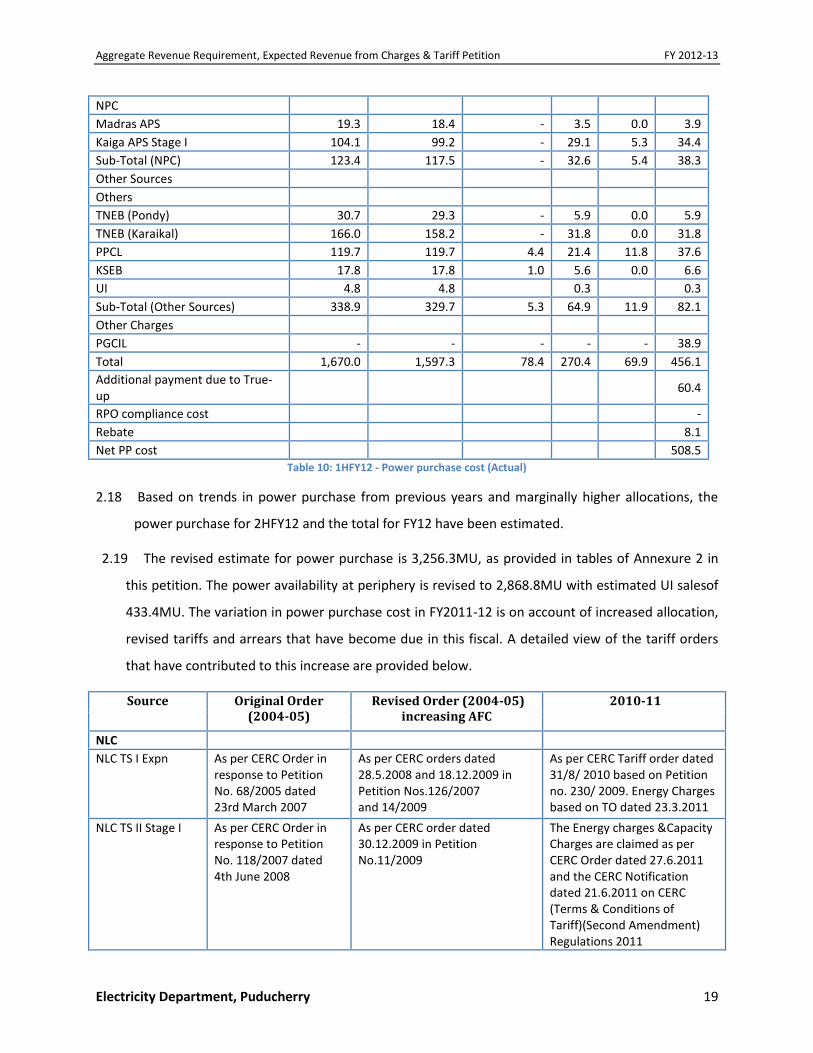
2.17 Further, there have been adjustments relating to the current period by PGCIL & NTPC, amounting
to 4.7 Crs. Also, the total rebate on prompt payment for power for the first half of the year is 8.1
Crs. The revised cost of power purchase for the first half is as presented below
Source Purchase
[MU]
Energy received
[MU]
Fixed Charge [Rs
Crs]
VC [Rs Crs]
Others [Rs Crs]
Total [Rs Crs]
NLC
TS II Stage I 272.9 259.9 13.5 45.7 2.7 61.8
TS II Stage II 103.5 98.5 5.2 17.1 1.1 23.5
TS I Expn 59.0 56.2 8.4 10.6 0.3 19.4
Sub-Total (NLC) 435.3 414.6 27.1 73.4 4.1 104.7
NTPC
Ramagundam STPS Stage I & II 404.8 385.7 17.1 49.1 17.8 84.0
Ramagundam STPS Stage III 98.5 93.7 8.9 12.0 5.6 26.5
Talcher STPS Stage II 266.9 254.0 19.5 37.8 25.1 82.5
Simhadri 2.1 2.0 0.4 0.6 - 1.0
Sub-Total (NTPC) 772.3 735.5 45.9 99.5 48.5 192.1
Aggregate Revenue Requirement, Expected Revenue from Charges & Tariff Petition FY 2012-13
Electricity Department, Puducherry 19
NPC
Madras APS 19.3 18.4 - 3.5 0.0 3.9
Kaiga APS Stage I 104.1 99.2 - 29.1 5.3 34.4
Sub-Total (NPC) 123.4 117.5 - 32.6 5.4 38.3
Other Sources
Others
TNEB (Pondy) 30.7 29.3 - 5.9 0.0 5.9
TNEB (Karaikal) 166.0 158.2 - 31.8 0.0 31.8
PPCL 119.7 119.7 4.4 21.4 11.8 37.6
KSEB 17.8 17.8 1.0 5.6 0.0 6.6
UI 4.8 4.8
0.3
0.3
Sub-Total (Other Sources) 338.9 329.7 5.3 64.9 11.9 82.1
Other Charges
PGCIL - - - - - 38.9
Total 1,670.0 1,597.3 78.4 270.4 69.9 456.1
Additional payment due to True-up
60.4
RPO compliance cost
-
Rebate
8.1
Net PP cost
508.5
Table 10: 1HFY12 - Power purchase cost (Actual)
2.18 Based on trends in power purchase from previous years and marginally higher allocations, the
power purchase for 2HFY12 and the total for FY12 have been estimated.
2.19 The revised estimate for power purchase is 3,256.3MU, as provided in tables of Annexure 2 in
this petition. The power availability at periphery is revised to 2,868.8MU with estimated UI salesof
433.4MU. The variation in power purchase cost in FY2011-12 is on account of increased allocation,
revised tariffs and arrears that have become due in this fiscal. A detailed view of the tariff orders
that have contributed to this increase are provided below.
Source Original Order (2004-05)
Revised Order (2004-05) increasing AFC
2010-11
NLC
NLC TS I Expn As per CERC Order in response to Petition No. 68/2005 dated 23rd March 2007
As per CERC orders dated 28.5.2008 and 18.12.2009 in Petition Nos.126/2007 and 14/2009
As per CERC Tariff order dated 31/8/ 2010 based on Petition no. 230/ 2009. Energy Charges based on TO dated 23.3.2011
NLC TS II Stage I As per CERC Order in response to Petition No. 118/2007 dated 4th June 2008
As per CERC order dated 30.12.2009 in Petition No.11/2009
The Energy charges &Capacity Charges are claimed as per CERC Order dated 27.6.2011 and the CERC Notification dated 21.6.2011 on CERC (Terms & Conditions of Tariff)(Second Amendment) Regulations 2011

Aggregate Revenue Requirement, Expected Revenue from Charges & Tariff Petition FY 2012-13
Electricity Department, Puducherry 20
NLC TS II Stage II As per CERC Order in response to Petition No. 118/2007 dated 4th June 2008
As per CERC order dated 30.12.2009 in Petition No.11/2009
The Energy charges &Capacity Charges are claimed as per CERC Order dated 27.6.2011 and the CERC Notification dated 21.6.2011 on CERC (Terms & Conditions of Tariff)(Second Amendment) Regulations 2012
NTPC
NTPC, Ramagundam Stage I & II
As per CERC Order dated 30th June 2006 in response to Petition No. 148/2004 with IA No. 39/2005
As per CERC Order dated 11.1.2010
As per CERC Tariff order dated 6/7/ 2011 based on Petition no. 278/ 2009. Annual fixed charge is subject to adjustment as per proviso of Clause (3) of Regulation 5 of 2009 Regulations after final order is issued. Energy charges shall be determined in terms of clause (5) and 6(a) of Regulation 21 of the 2009 regulations on a month to month basis
NTPC, Ramagundam Stage III
As per CERC Order dated 15th October 2007 in response to Petition No. 140/2005
As per CERC Order dated 12.10.2011 in response Petition
No. 123/2009. This was a Revision of order dated
11.1.2010 and 12.10.2010 in the light of the judgment of the
Appellate Tribunal for Electricity dated 19.4.2011 in Appeal No.
76/2010
As per CERC Tariff order dated 6/7/ 2011 based on Petition no. 256/ 2009. Annual fixed charge is subject to adjustment as per proviso of Clause (3) of Regulation 5 of 2009 Regulations after final order is issued. Energy charges shall be determined in terms of clause (5) and 6(a) of Regulation 21 of the 2009 regulations on a month to month basis
NTPC, Talcher Stage II
As per CERC Order dated 31st January 2008 in response to Petition No.179/2004
As per CERC Order dated 19.2.2010 in Petition No.
138/2009 with I.A. 49/2009
As per CERC Tariff order dated 6/7/ 2011 based on Petition no. 269/ 2009. Annual fixed charge is subject to adjustment as per proviso of Clause (3) of Regulation 5 of 2009 Regulations after final order is issued. Energy charges shall be determined in terms of clause (5) and 6(a) of Regulation 21 of the 2009 regulations on a month to month basis
NPC
Madras Atomic Power Station The Tariff is a one part tariff. 1.7918 Rs/Unit

Aggregate Revenue Requirement, Expected Revenue from Charges & Tariff Petition FY 2012-13
Electricity Department, Puducherry 21
Kaiga Atomic Power Station Stages 1&2
The Tariff is a one part tariff. 2.795 Rs/Unit
Kaiga Atomic Power Station Stages 3&4
The Tariff is a one part tariff. 2.795 Rs/Unit
Other Sources
PPCL As per JERC Tariff order dated 6/8/2011 based on Petition no. 18/ 2010
Table 10a: Tariff Orders for AFC Revision
2.20 The revised detailed power purchase statement for FY2011-12, in the regulatory format, is
provided in Annexure 2 for the Hon’ble Commission’s reference
2.21 The revised estimate for the energy balance statement is provided below
Item
FY2011-12 (Original estimate)
[MU]
1HFY2011 - 12 (Actual)
[MU]
FY2011 - 12 (Revised estimate)
[MU]
ENERGY REQUIREMENT
Metered sales 2,223.8 1,178.8 2,231.4
Unmetered sales 86.1 42.2 86.1
Total sales within the UT 2,309.9 1,221.0 2,317.5
Sales – UI 391.2 185.8 433.4
Total sales 2,701.1 1,406.8 2,750.9
T&D losses
% 13.47% 13.50% 13.47%
MU 359.6 190.5 360.8
Total energy requirement 3,060.7 1,597.3 3,111.7
ENERGY AVAILABILITY
Net thermal generation (Own+ IPP + Share from Central Stations)
2,538.0 1,450.7 2,581.0
Power Purchased from
Common pool / UI 10.0 4.8 10.0
Traders
PX
Others 665.2 214.5 665.3
Net power purchase 3213.2 1,670.0 3,256.3
Total energy availability @ periphery 3060.7 1,597.3 3,111.7
Table 11: FY2011-12 – Energy balance statement (Revised estimate)
Operations & maintenance expenditure
2.22 In the petition for FY2011-12, total O&M expenses estimated was 66.8 Crs. In 1HFY12, the total
expenses under the head amount to 42.3 Crs.

Aggregate Revenue Requirement, Expected Revenue from Charges & Tariff Petition FY 2012-13
Electricity Department, Puducherry 22
2.23 Each of the expense heads under O&M are discussed separately below
Employee cost
2.24 In the petition for FY2011-12, the total employee cost estimated was 52.55 Crs, net of
capitalisation of 18.04 Crs. In the accounts prepared for 1HFY12, the employee cost works out to
35.80Crs, net of capitalisation of 1.86 Crs
Table 12: FY2011-12 – Employee costs (Revised estimate)
FY2011-12 (Original
estimate) [Crs]
1HFY2011-12 (Actual) [Crs]
FY2011 - 12 (Revised
estimate) [Crs]
Salary 68.77 37.14 68.77
Wages 0.85 0.07 0.85
Stipend 0.22
0.17 0.22
Overtime 0.76 0.29 0.76
Total 70.60 37.66 70.60
Capitalized 18.04 1.86 18.04
Net amount 52.55 35.80 52.55
Prior period expenses - - -
Total employee costs 52.55 35.80 52.55
2.25 Historically, implementation of capital schemes, and associated capitalisation pick up pace in the
second half of the year. Along with the actual capitalisation, applicable employee costs will also
be capitalised, thus reducing the component of employee cost to be charged to ARR for FY2011-
12
2.26 Therefore, EDP would like to maintain the original estimation for employee costs
Repairs & Maintenance
2.27 In the petition for FY2011-12, the total R&M expenditure estimated was 10.34 Crs
2.28 In the accounts prepared for 1HFY12, the R&M expenditure works out to 4.68 Crs, and for the full
year, we maintain our original projection of 10.34 Crs, working out to approximately 1.9% of value
of assets in service during the year
Administrative & General
2.29 In the petition for FY2011-12, the total A&G expenditure estimated was 3.91 Crs
2.30 In the accounts prepared for 1HFY12, the A&G expenditure works out to 1.84 Crs, and for the full
year, we maintain our original projection of 3.91 Crs, working out to approximately 0.6% of value

Aggregate Revenue Requirement, Expected Revenue from Charges & Tariff Petition FY 2012-13
Electricity Department, Puducherry 23
of revenue from normal tariff for the year
Depreciation
2.31 In the petition for FY2011-12, the EDP had projected depreciation of 25.07 Crs for the full year
2.32 The actual depreciation for the first half of the year on the basis of opening GFA and capitalisation
during the year works out to 11.15 Crs as detailed below
Class of Assets Rate of
depreciation
1HFY2011 - 12 (Actual) [Crs]
Opening GFA
Addition during first half
Depreciation for first half
Land and land rights 0.0% 5.25 1.10 -
Buildings 3.3% 16.10 0.06 0.3
Plant and machinery 5.3% 180.92 1.84 4.1
Lines and cable network 5.3% 261.70 7.12 5.9
Vehicles 9.5% 3.00 0.07 0.0
Furniture and fixtures 6.3% 0.10 - 0.0
Office equipment 6.3% 1.77 - 0.0
IT Equipment 15.0% 1.63 - 0.0
Testing & measuring equipment 5.3% 8.21 0.01 0.2
SCADA center 5.3% 24.36 - 0.6
Total
503.05 10.19 11.15
Table 13: 1HFY2011-12 – Depreciation
2.33 Additional projects are expected to be completed and capitalised during the second half of the
year. In light of the above, we maintain our original estimate of 25.07 Crs for FY2011-12
Interest & finance charges
2.34 In its petition for FY2011-12, the EDP had estimated expenditure under this head of 1.95 Crs
2.35 In the accounts prepared for 1HFY12, the total expenditure under this head is 0.48 Crs to date,
mainly on account of reduced finance charges. However, we maintain our original estimation for
total expenditure under this head in light of expectations for higher requirements in the second
half of the year
Interest on working capital
2.36 In the original petition for FY2011-12, the EDP had projected expenditure under this head of 10.18
Crs. For the first 6 months of FY2011-12, the working capital requirements have been higher,
primarily on account of higher cost of power purchase

Aggregate Revenue Requirement, Expected Revenue from Charges & Tariff Petition FY 2012-13
Electricity Department, Puducherry 24
2.37 The actual interest on working capital for 1HFY2011-12 is 5.39 Crs, and for the full year, the
revised estimate of expenditure is 10.42 Crs
Table 14: FY2011-12 – Interest on working capital (Revised estimate)
Particulars
FY2011 - 12 (Original estimate)
[Crs]
1HFY2011-12 (Actual)
[Crs]
FY2011 - 12 (Revised estimate)
[Crs]
One month's power purchase cost 81.22 84.74 83.11
One month's employee costs 4.38 5.97 4.38
One month's A&G expenses 0.29 0.32 0.32
One month's R&M cost 0.78 0.78 0.86
Total 86.67 91.80 88.68
State Bank PLR on 1st
March 11.75% 11.75% 11.75%
Interest on working capital 10.18 5.39 10.42
2.38 As the higher requirement for interest on working capital is on account of increase in power
purchase costs, mainly due to new allocations and revised tariffs as per the orders mentioned
earlier, we request the Hon’ble JERC to approve the revised estimate of 10.42 Crs
Provision for bad & doubtful debts
2.39 EDP has already commenced steps to analyse its sundry debtors and arrears, and obtain an age-
wise breakup of the same from the revenue billing system. It also is in the process of reconciling
the list of arrears with the sundry debtor balances as per the financial statements. This process is
likely to take a significant amount of time and effort
2.40 Therefore, as we have not been able to provide the analysis required, we are not claiming any
provision for bad & doubtful debts for pass through in tariff to consumers
Return on capital base
2.41 In the original petition for FY2011-12, the EDP had estimated return on NFA at 3% of capital base.
The revised estimate is as shown below
Table 15: FY2011-12 – Return on capital base (Revised estimate)
Particulars FY2011 - 12
(original estimate)
[Crs]
FY2011 - 12
(Revised estimate)
[Crs]
Gross block at beginning of the year 503.08 503.05
Opening CWIP 64.92 64.92
Working capital for the year 86.67 88.68

Aggregate Revenue Requirement, Expected Revenue from Charges & Tariff Petition FY 2012-13
Electricity Department, Puducherry 25
Less accumulated depreciation 234.58 234.57
Less accumulated consumer contribution - -
Less opening debt 13.16 13.16
Net capital base at the beginning of the year
406.91 408.92
Reasonable return @3% on capital base
12.21 12.27
2.42 We request the Hon’ble Commission to approve the revised estimate of 12.27 Crs for return on
capital base
Revenue from UI sales
2.43 In the petition for FY2011-12, the EDP had estimated UI sales of 391.2 MU and revenue from UI
sales of 136.25 Crs at an average realization of Rs. 3.48/kWh
2.44 As explained earlier, the UI sales for the 6 months of FY2011-12 has been 185.8 MU and revenue
from UI sales has been 52.1 Crs at an average of Rs. 2.80/kWh
2.45 The revised estimate for total UI sales is 433.4 MU, the total revenue from UI sales for the year
has been estimated at 138.1 Crs. This is based on an expected sales realisation of 3.48/kWh for
the second half of the year
2.46 We request the Hon’ble Commission to approve the UI sales at 433.4 MU, and revenue from UI
sales at 138.1 Crs
Non-tariff income
2.47 The non-tariff income includes Reactive Energy Charges, STOA Charges, CTU Charges, Interest
Income, Departmental charges on sale of material and UI Sales
2.48 In the petition for FY2011-12, the EDP had estimated UI sales of 391.2 MU and revenue from UI
sales of 136.25 Crs, together with other income of 7 Crs, giving a total of 143.25 Crs under non-
tariff income
2.49 The actual non-tariff income for 1HFY2011-12 is 57.09 Crs consisting of other income of 5.31 Crs
and revenue from UI sales of 51.78 Crs
FY2011-12 (Original estimate)
[Crs]
1HFY2011-12 (Actual)
[Crs]
FY2011-12 (Revised estimate)
[Crs]
Reactive energy charges 7.00 5.31 9.00
STOA charges

Aggregate Revenue Requirement, Expected Revenue from Charges & Tariff Petition FY 2012-13
Electricity Department, Puducherry 26
CTU charges
Interest income
Departmental charges on sale of material
UI sales 136.25 51.78 138.10
Total NTI 143.25 57.09 147.10
Table 16: FY2011-12 - Non tariff income (Revised estimate)
2.50 As explained in the section on revenue from UI sales, we have estimated the total revenue from
UI sales as 138.1 Crs for the full year. In addition to this, we estimate other income for the period
to be 9 Crs, giving a total of 147.1 Crs
2.51 We request the Hon’ble Commission to approve the revised estimate of non-tariff income for
FY2011-12 at 147.1 Crs
Summary of revenue requirement
2.52 The revised estimate for aggregate revenue requirement for FY2011-12 is summarised below for
easy reference
Item of expense FY2011-12 (Original estimate)
[Crs]
FY2011-12 (Revised estimate)
[Crs]
Cost of power purchase 975.5 997.3
Employee costs 52.6 52.6
R&M expenses 10.3 10.3
A&G expenses 3.9 3.9
Depreciation 25.1 25.1
Interest & finance charges 2.0 2.0
Interest on working capital 10.2 10.4
Provision for bad debts - -
Return on NFA / Equity 12.2 12.3
Aggregate revenue requirement
1,091.7 1,113.8
Non-tariff income 143.2 147.1
Net revenue requirement 948.4 966.7 Table 17: FY2011-12 – Aggregate Revenue Requirement (Revised estimate)
2.53 The reasons for variances from petition for FY2011-12 have been explained in the relevant
sections, where applicable. The revised estimate of net ARR is 966.7 Crs
2.54 We request the Hon’ble Commission to approve the revised estimate of net revenue requirement
for FY2011-12 at 966.7 Crs

Aggregate Revenue Requirement, Expected Revenue from Charges & Tariff Petition FY 2012-13
Electricity Department, Puducherry 27
Average Cost to Serve
2.55 Based on the revised estimate for 2011-12, the average CoS works out to 4.17/kWh compared to
the earlier estimate of 4.11/kWh. The details of this calculation are shown below
Table 18: FY2011-12 – Average CoS (Revised estimate)
Item Unit Original estimate
Revised estimate
Net ARR Crs 948.4 966.7
Sales MU 2,309.9 2,317.53
Avg CoS Rs/kWh 4.11 4.17
Revenue from charges & gap for FY2011-12
2.56 The original estimate for expected revenue from tariff for FY2011-12 was 646.4 Crs. Additional
revenue, of 46.4 Crs towards recovery of fuel charges was considered, giving the total expected
revenue from charges of 692.8 Crs for FY2011-12
2.57 The revised estimate for revenue from tariff is 650.2 Crs, with additional revenue as approved of
46.4 Crs, giving a total expected revenue from charges of 696.6 Crs. This variance is largely on
account of additional sales to the temporary category estimated
2.58 The revised estimate for average realisation from tariff is 3.01/kWh compared to the average CoS
of 4.17/kWh, and the revised estimate of total gap for FY2011-12 is 270.1 Crs
Table 19: FY2011-12 - Revenue from charges & gap (Revised estimate)
FY2011-12 (Original estimate) [Crs] FY2011-12 (Revised estimate) [Crs]
Revenue from tariff 646.4 650.2
Revenue from FCA 46.4 46.4
Surplus / (Gap) (255.6) (270.1)
2.59 We request the Hon’ble Commission to approve the revised estimate for the gap of FY2011-12 at
270.1 Crs

Aggregate Revenue Requirement, Expected Revenue from Charges & Tariff Petition FY 2012-13
Electricity Department, Puducherry 28
3 Capital Expenditure for 2012-13 3.1 The capital expenditure, CWIP and capitalization was arrived at based on accounts prepared as
per accounting principles, with data drawn from the work order system (distribution works) and
manual accounts (transmission works) of the EDP.
2011 2012
Expenditure Capitalization Expenditure Capitalization
(Rs. Cr) (Rs. Cr) (Rs. Cr) (Rs. Cr)
Transmission
Thondamanatham lines
Upgradation 7.56 26.82 2.76 3.53
Distribution - - - -
EOS to services and lights 12.77 12.77 5.36 5.36
HT & LT 6.60 6.60 2.60 2.60
Cable Conversion 4.08 4.08 2.10 2.10
100% metering programme 0.33 0.33 0.20 0.20
Others - - - -
Testing and Measuring Equipments 1.05 1.05 0.01 0.01
IT Equipments 0.03 0.03 - -
Furniture 0.03 0.03 - -
Vehicles 0.00 0.00 0.07 0.07
Building 0.09 0.09 0.06 0.06
Office equipment 0.01 0.01 - -
Table 20: Capital Expenditure (FY11, HY12)
3.2 For the year FY2012-13, the EDP proposes capital expenditure & capitalisation as shown in the
table below
Name of Scheme Estimated Cost (Rs Cr)
Outlay for 2012-13
Normal Development schemes
Extension of supply to services & Street lights 4.00
Improvement of HT & LT Distribution network 8.00
Cable conversion works 3.50
General schemes 8.00
10% metering programme 1.50
Transmission schemes
Establishment of new 110KV substation 159.23 22.54
Augmentation of existing 110KV substation 124.4 30.26
Erection of new 230KV substation 156.58 14.22

Aggregate Revenue Requirement, Expected Revenue from Charges & Tariff Petition FY 2012-13
Electricity Department, Puducherry 29
Erection/Extension of 110KV/132KV lines 21.76 5.46
Total 97.48
Table 21: Proposed Capital Expenditure in FY13
3.3 The petitioner plans to capitalize Rs. 66.35 Crores of this outlay in the year 2012-13. The
petitioner prays the Hon’ble Commission allow the capitalization to be reviewed at the true – up
stage
3.4 All the capital works schemes are geared towards improving service delivery to consumers, and
we propose to step up the pace of implementation
3.5 Therefore, we request the Hon’ble Commission to approve the proposed capital expenditure and
capitalisation for FY2012-13

Aggregate Revenue Requirement, Expected Revenue from Charges & Tariff Petition FY 2012-13
Electricity Department, Puducherry 30
4 Sales projection, losses & energy balance
Introduction
4.1 The Electricity Department Puducherry, in response to the changed legal & regulatory framework
governing the electricity sector, is making changes to its various processes and procedures to
ensure compliance to regulatory requirements, as well as to discharge its primary duty of
supplying quality electricity at competitive prices to its consumers
4.2 One of the key requirements of operating on efficient, commercial principles is the presence of a
robust database of the consumers served by the EDP, capturing relevant information that ensures
effective billing, management of receivables and feeds into better projection of energy demand to
be served
4.3 In order to achieve the above, EDP understands the need to have accurate data being fed in to
the system. Towards this end, we have initiated a stringent verification procedure to verify the
compliance to tariff conditions by One Hut One Bulb (OHOB) consumers. Any current OHOB
consumer found to be violating the conditions for availing highly subsidized electricity will be
converted to a domestic consumer and billed accordingly. Given the large number of consumer
connections to be verified, this process will take longer to complete. We expect that this process
will be complete by March 2012. The results of the study will be reported to the Hon’ble
Commission upon completion, and will aim to show the revenue impact in the ARR & ERC filing for
FY2013-14, which is to be filed by November 30th 2012
Approach to forecasting sales
4.4 We have adopted the historical trend method for projecting growth in consumers and sales for
FY2012- 13, and applied a 6 year CAGR to the consumer and sales numbers for the FY2011-12.
4.5 The LT categories to which this approach was not applied are agricultural consumers and
temporary supply connections
The reason for not applying this method to agricultural consumers is that the EDP is currently in
the process of verifying the number of consumers and connected load in this category. The
preliminary details of this verification exercise were presented to the Honourable Commission in

Aggregate Revenue Requirement, Expected Revenue from Charges & Tariff Petition FY 2012-13
Electricity Department, Puducherry 31
the Petitioner’s tariff proposal submitted in September earlier this year. In addition, the net
additions to the agricultural category are approximately zero in every year
In the case of temporary supply connections, we have by and large followed the trends of
previous years to forecast the likely quantum of sale to this category
4.6 Further, the number of consumers and sales for the HT categories has been taken based on the
actual data for 6 months of FY12. Growth rates for HT consumers are minimal, and these have
been applied to the billed sales numbers for FY12 to arrive at the sales for FY13.
4.7 The EDP would like to appraise the Hon’ble Commission that the physical verification exercise of
agricultural consumers, results of which have been presented to the Hon’ble JERC, is ongoing.
Whilst no connection is given without a meter, there have been issues with malfunctioning
meters etc., which need to be replaced before a truly representative study can be conducted. The
replacement of meters is ongoing, in parallel with the R-APDRP program, and the final study
results are expected to be filed with the petition for FY2013-14. Hence, the estimation of sales to
agriculture has been done on the basis of connected load, no of hours, no of days, diversity factor
& PF basis. The sales figures have been estimated based on the following assumptions:
Hours – 8 / day
o In taking 8 hours/day of operation, the load factor has been considered and is
0.33
Days – 270 / year
o In taking 270 days/year of operation, the seasonality factor has been considered
and is 0.74
PF – 0.8
Diversity factor is relevant to calculate peak load in the system, and not for energy calculation.
Hence, implicitly it is considered as 1
Estimated consumers & sales
4.8 The number of consumers served by the EDP, 6 year CAGR and the projected number of
consumers is summarised in the table below
Consumers [No] FY06 FY07 FY08 FY09 FY10 FY11 FY12 6 Year CAGR
Estimated no. of
consumers in FY13
Domestic 222,914 234,734 245,822 256,245 269,755 275,847 287,899 4% 300,439
Commercial 34,824 36,205 37,407 38,427 40,539 40,531 41,854 3% 43,156
Agriculture 8,772 8,834 8,897 8,960 6,810 6,810 6,810 0% 6,810

Aggregate Revenue Requirement, Expected Revenue from Charges & Tariff Petition FY 2012-13
Electricity Department, Puducherry 32
Street lighting 41,880 43,421 44,859 45,617 47,686 48,167 48,280 2% 49,438
Industrial 5,383 5,516 5,643 5,769 5,885 5,955 6,086 2% 6,212
LT total 313,773 328,710 342,628 355,018 370,675 377,310 390,928 4% 406,055
Table 22: LT - Projected Consumer data for FY13
4.9 The number of domestic consumers projected is including OHOB consumers.Growth in other
categories, is expected to be largely in line with the trend seen over the years, with the exception
of the agricultural category for the reason mentioned earlier
4.10 The estimated sales for LT consumers has also been based on the 6 year CAGR and is shown in the
table below
Sales [MU] FY06 FY07 FY08 FY09 FY10 FY11 FY12 6 Year CAGR
Estimated sales in
FY13
Domestic 324 357 393 426 513 519 572 10% 629
Commercial 112 130 132 138 150 156 172 7% 185
Agriculture 89 101 82 54 77 77 77 0% 76.7
Street lighting 13 16 16 17 17 22 23 11% 26
Industrial 114 126 133 135 147 150 160 6% 169
Temporary Supply 7.9 22.6 25
LT total 652 729 756 770 904 923 1,005 7% 1111.26
Table 23: LT - Projected Sales Data - FY13
4.11 Sales to agricultural category of consumers has been maintained as constant for reasons
explained earlier
4.12 Sales to all other categories has been estimated based on the trend seen over the years.
Temporary supply from LT has been estimated at 25 MU.
4.13 The number of consumers in the HT categories and the average billing demand has been based on
the actual values extracted from the HT billing database for FY11 and first 6 months of FY12. The
total number of consumers projected for the year 2012-13 in the HT category is 461
4.14 The sales has been estimated on similar lines, and considering the marginal increase in HT
consumers, the growth rates considered for the HT category are marginal. The estimated increase
in sales to HT category is only 13 MU, with the bulk of additional sales expected from HT1
category of consumers
Sales [MU] FY06 FY07 FY08 FY09 FY10 FY11 FY12 6
Year CAGR
Estimated Sales in
FY13
HT I 953 998 1,020 954 958 1,002 1,016 1% 1,027
HT II 25 26 26 26 34 35 37 7% 40

Aggregate Revenue Requirement, Expected Revenue from Charges & Tariff Petition FY 2012-13
Electricity Department, Puducherry 33
HT III 238 271 270 249 262 239 236 0% 236
HT total 1,216 1,296 1,316 1,229 1,255 1,276 1,290 1% 1,303 Table 24: HT - Projected Sales data - FY13
4.15 The total estimated sale in FY2012-13 is2414.5 MU, with and LT: HT sales mix of 45%:55%. This
reflects the reality of increasing number of LT consumers and their consumption, whereasthe
consumption in HT categories is largely stagnant
4.16 We request the Hon’ble Commission to approve the sales for FY2012-13 at 2414.5 MU
Losses
4.17 The T&D loss estimated for FY2011-12 is 13.47%. Whilst the EDP operates a relatively smaller
system, reduction in losses becomes progressively more difficult due to technical parameters.
Further, as detailed earlier, the EDP is experiencing an increasingly adverse LT: HT sales mix.
4.18 Given this reality, the EDP proposes to achieve a loss of 13.35% for FY2012-13. We request the
Hon’ble Commission to approve the T&D loss for FY2012-13 at 13.35%
4.19 The achieved collection efficiency in FY2010-11 was 93.8%, a marked improvement from FY2009-
10. The same efficiency is proposed to be met in 2011-12. Keeping in line with the proposal of the
EDP to corporatize operations soon, the petitioner proposes to increase the collection efficiency
to 96% in FY2012-13
Energy Balance
4.20 Considering the proposed sales of 2414.5 MU and the proposed T&D loss for FY2012-13, the
energyrequirement at periphery works out to 2,786.5MU
4.21 The total energy purchase expected is explained in the next chapter based on expected
availability fromvarious sources of power purchase available to EDP
4.22 Considering the energy requirement to serve demand in the license area and the expected
availability ofpower, the energy balance statement is shown below
Particulars Units FY2010 - 11
(Actuals)
FY2011 - 12
(Revised Estimate)
FY2012 - 13 (Projection)
Generation (Connected Generation – PPCL) MU 182.8 242.9 242.9 Metered Import at interface point MU 2,635.8 2,868.8 2,942.6 Sale through Unscheduled Interchange MU 262.4 433.4 398.9 Energy available for sale within the UT MU 2,556.2 2,678.3 2,786.5

Aggregate Revenue Requirement, Expected Revenue from Charges & Tariff Petition FY 2012-13
Electricity Department, Puducherry 34
Metered Sales MU 2,122.3 2,231.5 2,328.5 Unmetered Sales MU 87.0 86.1 86.1 Total energy sold MU 2,209.3 2,317.5 2,414.5 Revenue from sales within UT Rs 630.8 696.6 675.9 Amount realized by billed sales Rs 591.7 653.4 648.86 Collection efficiency % 93.8% 93.8% 96.0% Energy realized MU 2,072.2 2,173.7 2,317.9 Distribution Loss % 13.57% 13.47% 13.35% AT&C Loss % 18.93% 18.84% 16.82%
Table 25: Energy Balance Statement

Aggregate Revenue Requirement, Expected Revenue from Charges & Tariff Petition FY 2012-13
Electricity Department, Puducherry 35
5 Aggregate revenue requirement for FY2012-13
Projected cost of power purchase in 2012 – 13
5.1 Power purchase of the Electricity Department Puducherry is mainly from the following sources
i) Central Generating Stations
ii) TNEB & KSEB
iii) PPCL
5.2 The assumptions made to arrive at the projections for each of the above sources are provided in
detail below:
Central generating Stations
NTPC Stations
5.3 Electricity Department of Puducherry currently has firm allocation from the NTPC Thermal station
of Ramagundam STPS Stages 1, 2 & 3 and NTPC Talcher Stage 2. Allocations from NTPC Simhadri
have commenced from the month of September 2011.
5.4 The following assumptions have been taken to arrive at the cost of power purchase from the
thermal stations of NTPC –
i) Licensee share assumed to be the same as 2011-12, except for Simhadri where the firm
allocation has been taken for calculation. To calculate the expected allocation from each of
the NTPC stations, the Petitioner has considered the actual energy received from each of
the stations during the first 6 months of previous year as against the total generation during
that period, to arrive at the effective allocation that EDP has received for FY12. The table
below provides a summary of the EDP’s firm allocation and the actual allocation based on
the energy received from each of these stations
Station FY12 (Revised Estimate)
FY13 (Projections)
Firm Received Firm Received
Ramagundam STPS Stage I & II 5.20% 4.45% 5.16% 4.45%
Ramagundam STPS Stage III 5.40% 4.70% 5.44% 4.70%
Talcher STPS Stage II 4.00% 3.54% 3.95% 3.54%
Simhadri 1.85% 1.85% 3.69% 3.69%
Table 26: Power Purchase - NTPC Licensee Share Assumed

Aggregate Revenue Requirement, Expected Revenue from Charges & Tariff Petition FY 2012-13
Electricity Department, Puducherry 36
ii) PLF of the generating station taken as average of the previous 2 years i.e. 2010 – 11 and
2011 – 12
Station FY 11 (Actuals)
FY12 (Revised Estimate)
FY13 (Projections)
Ramagundam STPS Stage I & II 93.80% 93.60% 93.70%
Ramagundam STPS Stage III 95.00% 98.10% 96.55%
Talcher STPS Stage II 90.00% 90.90% 90.45%
Simhadri 77.80% 77.80%
Table 27: Power Purchase - NTPC PLF Assumed
iii) External loss of 5% has been assumed for all stations
iv) CERC in its recent Provisional Orders dated 06/07/ 2011 based on Petition numbers
278/2009, 269/2009 and 256/2009 has stated that the energy charges shall be determined
on a month to month basis for Ramagundam Stage 1 &2, Talcher Stage 2 and Ramagundam
Stage 3 respectively for the year 2011- 12.
5.5 In order to arrive at an approximate figure for FY13 power purchase cost projection, the
petitioner has assumed the energy charge for each station as follows:
a. NTPC RSTPS - Avg of 3 months of new tariff considered
b. NTPC TSTPS - Avg of 3 months of new tariff considered
c. NTPC SSTPS - VC for September assumed
v) Other costs have been assumed same as the previous year i.e. FY12
NLC Stations
5.6 EDP currently purchases power from NLC TS I expansion, TS II Stages 1 &2. The following
assumptions have been taken to arrive at the cost of power purchase from the thermal stations of
NLC:
i) Licensee share assumed to be the same as last year. To calculate the expected allocation
from each of the NLC stations, Petitioner has considered the actual energy received from
each of the stations during the first 6 months of previous year as against the total
generation during that period, to arrive at the effective allocation that EDP has received for
FY12. The table below provides a summary of the EDP’s firm allocation and the actual
allocation based on the energy received from each of these stations
Station FY12 (Revised Estimate)
FY13 (Projections)

Aggregate Revenue Requirement, Expected Revenue from Charges & Tariff Petition FY 2012-13
Electricity Department, Puducherry 37
Firm Received Firm Received
TS II Stage I 12.30% 10.82% 12.32% 10.82%
TS II Stage II 3.80% 3.21% 3.76% 3.21%
TS I Expn 4.20% 3.77% 4.21% 3.77%
Table 28: Power Purchase - NLC Licensee Share Assumed
ii) PLF of the generating station taken as average of the previous 2 years i.e. 2010 – 11 and
2011 – 12
Station FY 11 (Actuals)
FY12 (Revised Estimate)
FY13 (Projections)
TS II Stage I 83.00% 80.20% 81.60%
TS II Stage II 83.00% 83.90% 83.45%
TS I Expn 82.00% 81.50% 81.75%
Table 29: Power Purchase - NLC PLF Assumed
iii) External loss of 5% has been assumed for all stations
5.7 CERC, in its Orders dated 31/08/ 2010 based on Petition numbers 230/2009 and 231/2009 and
has approved the annual fixed costs as well as the energy charges per unit TS I expansion and TS II
Stages 1 & 2 respectively for the year 2001- 12. Based on the Firm allocation to EDP from each of
these stations, the fixed costs have appropriately apportioned.
i) The total power purchase costs projected for the NLC stations have been computed on the
basis of the projected quantum of energy allocated to EDP and the charges applicable, as
decided by CERC. In order to arrive at an approximate figure for FY13 power purchase cost
projection, the petitioner has assumed the energy charge for each station as follows:
a. NLC Stage 1 & 2 - Avg of 4 months of new tariff considered
b. NLC TS 1 Exp - Avg of 6 months of new tariff considered
ii) Other costs have been assumed same as the previous year i.e. FY12
NPCIL Stations
5.8 EDP currently receives power from NPCIL’s nuclear plant, Madras Atomic Power Station (MAPS)
and Kaiga Atomic Power Stations (KAPS) Stages 1-4. The following assumptions have been taken
to arrive at the cost of power purchase from the atomic stations of NPCIL
i) Licensee share assumed to be the same as last year. To calculate the expected allocation
from each of the NPCIL stations, the Petitioner has considered the actual energy received

Aggregate Revenue Requirement, Expected Revenue from Charges & Tariff Petition FY 2012-13
Electricity Department, Puducherry 38
from each of the stations during the first 6 months of previous year as against the total
generation during that period, to arrive at the effective allocation that EDP has received for
FY12. The table below provides a summary of the EDP’s firm allocation and the actual
allocation based on the energy received from each of these stations
Station FY12 (Revised Estimated)
FY13 (Projections)
Firm Received Firm Received
Madras APS 1.90% 1.44% 1.91% 1.44%
Kaiga APS 4.40% 4.19% 4.43% 4.19%
Table 30: Power Purchase - NPCIL Licensee Share Assumed
ii) PLF of the generating station taken as average of the previous 2 years i.e. 2010 – 11 and
2011 – 12
Station FY 11 (Actuals)
FY12 (Revised Estimate)
FY13 (Projections)
Madras APS 53.10% 53.10% 53.10%
Kaiga APS Stage I 55.10% 55.10% 55.10%
Table 31: Power Purchase - NPCIL PLF Assumed
iii) External loss of 5% has been assumed for all stations
iv) NPCIL has provided the single part tariff applicable to MAPS and KAIGA stages 1-4. The same
rates have been applied to estimate the power purchase costs from these nuclear stations
v) Other costs have been assumed same as the previous year i.e. FY12
5.9 EDP purchases power from TNEB to service the regions of Karaikal and Pondicherry at a mutually
agreed rate. To arrive at the projected quantum of power purchase from TNEB for the FY2012- 13,
the Petitioner has examined the power purchase units consumed for the past 2 periods, i.e. FY11
and FY12 to arrive at average monthly units procured. The same figure has then been used to
project the estimated power purchase for the entire year. External loss has been assumed to be
4%.
5.10 EDP also purchases power from KSEB to service the region of Mahe at the bulk supply tariff rate
as approved by KSERC for KSEB. To arrive at the projected quantum of power purchase from TNEB
for the FY2012- 13, the Petitioner has examined the power purchase units consumed for the past
2 periods, i.e. FY11 and FY12 to arrive at average monthly units procured. The same figure has
then been used to project the estimated power purchase for the entire year.

Aggregate Revenue Requirement, Expected Revenue from Charges & Tariff Petition FY 2012-13
Electricity Department, Puducherry 39
5.11 EDP also purchases power from PPCL at the rates approved by JERC vide its Order dated 06/ 08/
2011in response to Petition no. 18/210. The PLF assumed for this generating station is 87%, which
is the NAPAF set by the Hon’ble Commission based on the average PLF between the CERC norm of
85% for fixed cost recovery and 90% NAPAF corresponding to the generation of 257MU’s of PPCL.
5.12 PGCIL costs have been projected based on the per unit cost of transmission incurred by EDP in
FY12.
5.13 A summary of the power purchase cost for FY13 is given below.
Source of power purchase Station Power Purchase Cost [Rs. Cr]
NLC
TS II Stage I 125.0
TS II Stage II 50.7
TS I Expn 36.7
NTPC
Ramagundam STPS Stage I & II 167.1
Ramagundam STPS Stage III 49.4
Talcher STPS Stage II 194.8
Simhadri 55.2
NPCIL Madras APS 5.3
Kaiga APS Stage I 60.5
TNEB (Pondy) 14.1
TNEB (Karaikal) 62.6
PPCL
83.4
KSEB
12.5
PGCIL
79.7
Total 997
Table 32: Power Purchase Cost summary – FY2012-13 (Projected)
5.14 The increase in total power purchase cost from last year is approximately 3%
5.15 In addition to the above power purchase, the Petitioner is also committed to fulfilling its
renewable purchase obligations (RPO) set by the Hon’ble Commission in the JERC Procurement of
Renewal Energy Regulations 2010 dated 15/12/ 2010. In order to meet the RPO obligations for
the period of 2012-13, EDP will have to purchase power at the defined 3% of the total of all sales
in its areas for the FY 13. EDP currently does not purchase power from renewable energy sources
and hence proposes to meet this obligation through the purchase of Renewable Energy
Certificates. Solar RECs are not being traded currently in the Power Exchange market in India. EDP

Aggregate Revenue Requirement, Expected Revenue from Charges & Tariff Petition FY 2012-13
Electricity Department, Puducherry 40
would hence request the Hon’ble Commission to approve of the entire RPO of EDP to be met
through the purchase of non- solar RECs.
5.16 Figure shows the equilibrium price of RECs traded at IEX
Figure 3: REC Equilibrium Price of RECs (Source: IEX)
5.17 The Renewable Energy Certificate trading session scheduled for 31 August 2011 was postponed to
2 September 2011.
5.18 As can be seen from the figure, the price of RECs has seen a steep rise in the past 2 months, owing
to growing demand from states in order to comply with the RPO. This demand is seasonal and can
be expected to wane from April 2012, once the deadline for the RPO compliance is over. Given
this, the Petitioner has assumed that EDP would purchase RECs at an average price of Rs. 2550
per REC. The table below provides a summary of the RPO of EDP and the estimated costs that EDP
would incur to comply with its RPO, which amounts to Rs. 18.5 crores
Sales for 2012-13 (MU)
RPO for 2012-13 (MU)
No of RECs to be purchased
REC Equilibrium
Price (Rs./REC)
Cost of RPO Compliance
[Crs]
2,414.50 72.44 72,435.15 2550 18.5 Table 33: RPO Compliance Cost FY12-13 (Projected)
5.19 Further, we have estimated that we will receive approximately 17 Crs of rebates for prompt
payment for power in FY2012-13. The rebate assumed is at the same percentage as that for 2010-
11 and 2011-12.
0
500
1000
1500
2000
2500
3000
3500
4000
4500
Rs
/ R
EC

Aggregate Revenue Requirement, Expected Revenue from Charges & Tariff Petition FY 2012-13
Electricity Department, Puducherry 41
5.20 The total power purchase costs projected for FY 2012- 13 have been provided as per Format 4 of
the JERC Tariff Regulations in Annexure 2 of this petition. A summary of the total power purchase
costs are provided below:
Source of power purchase Station Power Purchase Cost
[Rs. Cr]
NLC TS II Stage I 125.0
TS II Stage II 50.7
TS I Expn 36.7
NTPC Ramagundam STPS Stage I & II 167.1
Ramagundam STPS Stage III 49.4
Talcher STPS Stage II 194.8
Simhadri 55.2
NPCIL Madras APS 5.3
Kaiga APS Stage I 60.5
TNEB (Pondy) 14.1
TNEB (Karaikal) 62.6
PPCL 83.4
KSEB 12.5
PGCIL 79.7
RPO Compliance Cost 18.5
Rebate on prompt payment (17.7)
Net Power Purchase Cost 997.8
Table 34: Total Power Purchase Cost – FY2012 –13 (Projected)
5.21 We request the Hon’ble Commission to approve the estimated total power purchase cost for
FY2012-13 at Rs.997.8Crs.
Operation & Maintenance expenses
5.22 O&M costs of the EDP consist of Employee costs, Repairs & Maintenance expenses and
Administrative & General expenses. A summary of the projections for each of these cost heads
are provided below
Item of expense FY2010 - 11 (Actuals )[Crs]
FY2011 - 12 (Revised
Estimate)[Crs]
FY2012 - 13 (Projections)[Crs]
Projections
Employee costs 49.88 52.55 54.8
R&M expenses 7.95 10.34 10.77
Administration & general expenses 3.53 3.91 3.91

Aggregate Revenue Requirement, Expected Revenue from Charges & Tariff Petition FY 2012-13
Electricity Department, Puducherry 42
Total O&M 61.36 66.80 69.48
Table 35: O&M Costs
5.23 As per the JERC Tariff regulations, O&M expenses for subsequent years are to be determined by
adjusting the Base O&M expenses approved according to the variation in the rate of WPI per
annum.
5.24 It can be seen that the WPI variation for the subsequent two years totals to 13.36% as furnished
in Table 81: F24 - Wholesale price indexof this petition. The actual increase in O&M cost from the
base year is only 13.22%.
5.25 Details of each of the heads under O&M expenses are provided below
Employee Costs
5.26 The employee cost expenses stated comprise of all the costs related to employees like basic
salary, dearness allowance, medical reimbursement charges, leave and travel allowance,
honorariumetc.
5.27 The petitioner has not considered the pension and terminal benefits of the ex-employees as it
does not maintain accounts related to pension benefits of ex-employees. Hence the same has not
been included while calculating the employee costs.
5.28 A summary of the employee numbers of EDP have been furnished as per Format 15 of the
Regulations and provided below:
Particulars FY2010 - 11 (Actuals)
[Nos]
FY2011 – 12 (Revised Estimate)
[Nos]
FY2012 - 13 (Projection)
[Nos]
Number of employees as on 1st April 2,298 2,293 2,361
Employees on deputation/ foreign service as on 1st April
10 10 10
Total number of employees (1+2) 2,308 2,303 2,371
Number of employees retired/ retiring during the year
55 43 73
Net transfers [ In / (Out)] 12 (1) -
Recruitment 38 112 -
Number of employees at the end of the year (3-4+5+6)
2,303 2,371 2,298
Table 36: Employee Strength Projection – FY2012-13
5.29 The summary of employee costs projected for 2012-13 is given below.
FY2010 – 11 (Actuals)
FY2011 – 12 (Revised Estimate)
FY2012 - 13 (Projection)

Aggregate Revenue Requirement, Expected Revenue from Charges & Tariff Petition FY 2012-13
Electricity Department, Puducherry 43
[Crs] [Crs] [Crs]
Salary 65.49 68.77 74.05
Wages 0.85 0.85 0.85
Stipend 0.22 0.22 0.22
Overtime 0.76 0.76 0.76
Total 67.32 70.60 75.88
Capitalized 17.44 18.04 21.09
Net amount 49.88 52.55 54.80
Prior period expenses - - -
Total employee costs
49.88 52.55 54.80
Table 37: Employee Cost - Summary
5.30 The projections for salaries and allowances for FY2012- 13 have been made on the basis of the
salary costs incurred in line with the 6th Pay commission revision for the respective grades. The
figures arrived at have also taken into account the increase in employee costs on account of
promotions and the proposed Modified Assured Career Progression (MACP) scheme of the EDP.
The total increase in salary cost for FY2012-13 is estimated at about 8%.
5.31 Estimated employee costs in relation to the execution of capital works is expected to amount to
21.09 Crs for FY2012- 13. The net employee costs after deduction of the above mentioned
capitalized amount would amount to 54.80 Crs
5.32 We request the Hon’ble Commission to approve the employee cost for FY2012-13 at 54.80 Crs
Repairs & maintenance expenses
5.33 R&M expenses include expenses on repairs and maintenance of electrical equipment, distribution
network vehicles, furniture and fixtures, office equipment, buildings etc. The summary of the
R&M expenses projected for FY 2012- 13 are shown below
FY2010 - 11 (Actuals) [Crs]
FY2011 – 12 (Revised Estimate) [Crs]
FY2012 – 13 (Projection) [Crs]
R&M 7.95 10.34 10.77
Table 38: R&M Costs
5.34 The petitioner would like to submit that the reason for the increase is mainly due to the increases
in maintenance necessitated in some of the EHV substations of the EDP, periodic maintenances of
EDP owned buildings, increase in the maintenance costs of streetlights etc
5.35 We request the Hon’ble Commission to approve the R&M expenses for FY2012-13 at 10.77 Crs

Aggregate Revenue Requirement, Expected Revenue from Charges & Tariff Petition FY 2012-13
Electricity Department, Puducherry 44
Administrative & General (A&G) expenses
5.36 The A&G expenses include rent rates and taxes, expenses on computerization, telephone
expenses, taxes, legal charges etc. The summary of the projected A&G expenses are shown below
FY2010 - 11 (Actuals)
[Crs]
FY2011 – 12 (Revised Estimate)
[Crs]
FY2012 – 13 (Projection)
[Crs]
Office expense 1.49 1.58 1.61
Miscellaneous expenses 2.04 2.34 2.30
Total 3.53 3.91 3.91
Table 39: FY2012- 13 - A&G Expenses
Depreciation
5.37 Depreciation has been calculated on the basis of straight-line method using the Gross Fixed Assets
at the beginning of the year and addition in assets during the financial year. The depreciation is
based on the original cost of the Gross Fixed Assets.
5.38 Regulation 26 of the JERC (Terms and Conditions for Determination of Tariff) Regulations, 2009
specifies that depreciation for the assets shall be calculated annually at the rates specified by
CERC from time to time. The effective rate of depreciation used for computation of depreciation
has been taken vide Appendix III (Depreciation schedule of CERC (Terms and Conditions of Tariff)
Regulations, 2009. The rates used are as given below-
Name of the Assets Rate of depreciation
Land and land rights 0.0%
Buildings 3.3%
Plant and machinery 5.3%
Lines and cable network 5.3%
Vehicles 9.5%
Furniture and fixtures 6.3%
Office equipment 6.3%
IT Equipments 15.0%
Testing & measuring equipment 5.3%
SCADA centre 5.3% Table 40: Depreciation Rates Applied
5.39 The projected depreciation for the year 2012-13 has been worked out based on the following
assumptions:
1. Depreciation for 2012-13 has been projected based on the opening balance of assets for the
year, without considering the assets that have reached 90% of their value during the year

Aggregate Revenue Requirement, Expected Revenue from Charges & Tariff Petition FY 2012-13
Electricity Department, Puducherry 45
2. Additionof assets for the year 2012-13 have been considered based on thecapital
expenditure proposed to be capitalized for the year
3. Additions in each category of assets have been taken in the same proportion as the previous
year i.e. 2011-12
5.40 The projected depreciation for 2012-13 is shown below.
Particulars FY2010 – 11 (Actuals) [Crs]
FY2011 - 12 (Revised Estimate)
[Crs]
FY2012 - 13 (Projection) [Crs]
GFA at the beginning of the year 452.19 503.05 564.69
Asset Additions through the year 50.86 61.64 66.36
Depreciation Charges 22.13 25.07 33.04
Table 41: Projected Depreciation (FY13)
5.41 No advance against depreciation is being claimed for the year 2012-13.
Interest & finance charges
5.42 The petitioner being a government department submits that the entire capital employed till date
has been funded through equity infusion by the GoP through budgetary support and without any
external borrowings
5.43 The Interest & Finance Charges relate to financial leases taken by EDP and bank charges towards
LCs for payment for power purchased. For the purpose of computation of the finance lease
charges, the rate of interest applied is as per actuals at 8.22% p.a.
5.44 We request the Hon’ble Commission to approve 1.88 Crs towards expenditure under this head
Interest on working capital
5.45 The petitioner has computed the interest on working capital for FY 2012-13 on normative basis as
provided by the JERC Tariff Regulations, 2009, which states that the working capital for integrated
utility shall be the sum of one month requirement for meeting:
i. Power purchase cost
ii. Employees cost
iii. Administrative & General Expenses
iv. Repairs & Maintenance Expenses
v. Sum of two month requirement for meeting fuel cost
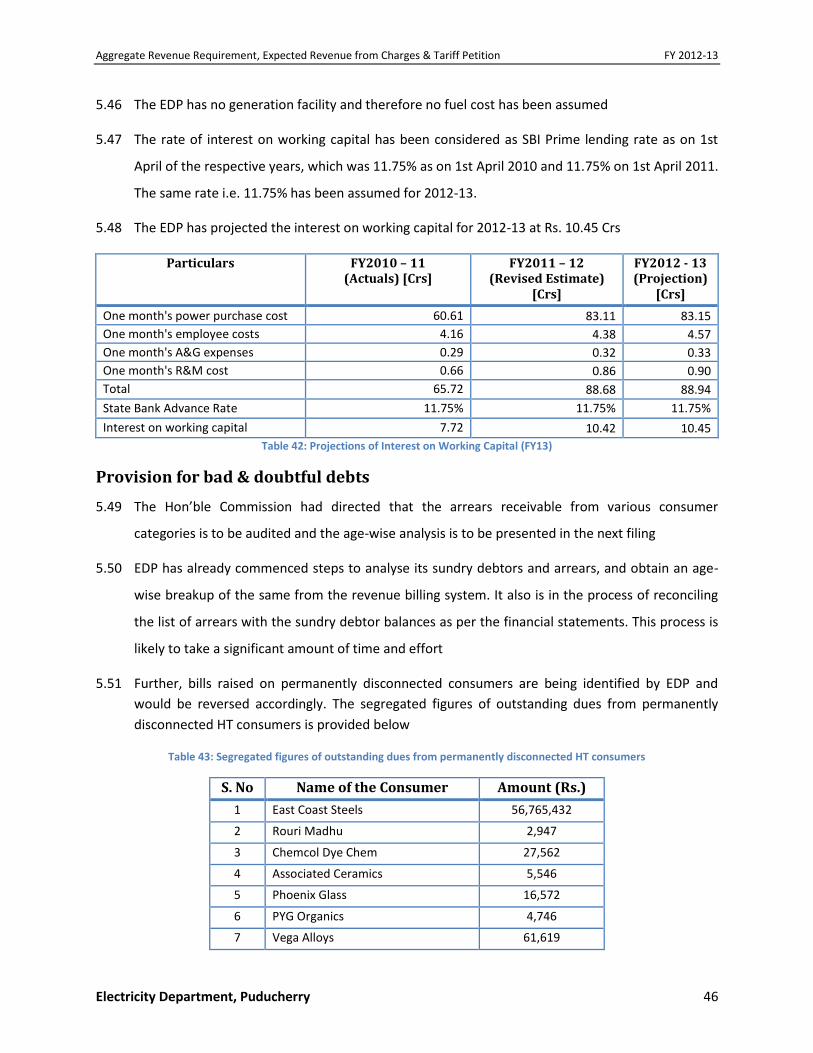
Aggregate Revenue Requirement, Expected Revenue from Charges & Tariff Petition FY 2012-13
Electricity Department, Puducherry 46
5.46 The EDP has no generation facility and therefore no fuel cost has been assumed
5.47 The rate of interest on working capital has been considered as SBI Prime lending rate as on 1st
April of the respective years, which was 11.75% as on 1st April 2010 and 11.75% on 1st April 2011.
The same rate i.e. 11.75% has been assumed for 2012-13.
5.48 The EDP has projected the interest on working capital for 2012-13 at Rs. 10.45 Crs
Particulars FY2010 – 11 (Actuals) [Crs]
FY2011 – 12 (Revised Estimate)
[Crs]
FY2012 - 13 (Projection)
[Crs]
One month's power purchase cost 60.61 83.11 83.15
One month's employee costs 4.16 4.38 4.57
One month's A&G expenses 0.29 0.32 0.33
One month's R&M cost 0.66 0.86 0.90
Total 65.72 88.68 88.94
State Bank Advance Rate 11.75% 11.75% 11.75%
Interest on working capital 7.72 10.42 10.45
Table 42: Projections of Interest on Working Capital (FY13)
Provision for bad & doubtful debts
5.49 The Hon’ble Commission had directed that the arrears receivable from various consumer
categories is to be audited and the age-wise analysis is to be presented in the next filing
5.50 EDP has already commenced steps to analyse its sundry debtors and arrears, and obtain an age-
wise breakup of the same from the revenue billing system. It also is in the process of reconciling
the list of arrears with the sundry debtor balances as per the financial statements. This process is
likely to take a significant amount of time and effort
5.51 Further, bills raised on permanently disconnected consumers are being identified by EDP and
would be reversed accordingly. The segregated figures of outstanding dues from permanently
disconnected HT consumers is provided below
Table 43: Segregated figures of outstanding dues from permanently disconnected HT consumers
S. No Name of the Consumer Amount (Rs.)
1 East Coast Steels 56,765,432
2 Rouri Madhu 2,947
3 Chemcol Dye Chem 27,562
4 Associated Ceramics 5,546
5 Phoenix Glass 16,572
6 PYG Organics 4,746
7 Vega Alloys 61,619

Aggregate Revenue Requirement, Expected Revenue from Charges & Tariff Petition FY 2012-13
Electricity Department, Puducherry 47
8 Sapthagiri Industries 129,459
9 Coromandel Pigments 141,709
10 Sri Gomathi Steels Ltd 3,409,168
11 Universal Carbides 932,002
12 Shakti Alloys 99,899
13 Shibi Capsules 229,228
14 VSK Ferro Alloys 15,460,392
15 Kaundinya Udyog 243,311
16 Silcal Metallurgics 14,367,927
17 Bhuvaneshwari Chemicals 1,960,132
18 Zenith Food Industries 331,782
19 Alternative Energy Industries 11,487
20 JBF Industries 61,719
21 Vijaya Industries Alcohol 40,094
22 Amaravathi Chemicals 384,685
Total 94,687,418
5.52 As EDP is in the process of reconciling the list of arrears with the sundry debtor balances as per
the financial statements, we are not claiming any provision for bad & doubtful debts in the ARR of
FY2012-13, for pass through in tariff to consumers
Return on capital base
5.53 The ED-Pondicherry is an integrated utility in its present form as defined in Regulation 2 (9) of the
JERC (Terms and Conditions for Determination of Tariff) Regulations, 2009. The ED- Pondicherry is
not restructured and corporatized. As an integrated utility, it is entitled to return on capital base
under the provisions of Schedule VI of the repealed Electricity (Supply) Act, 1948 vide proviso
under Regulation 23 of JERC (Terms and Conditions for Determination of Tariff) Regulations, 2009
5.54 The basic requirement for consideration of return on capital base is the annual accounts and fixed
assets record. The petitioner would like to bring to the notice of the Hon’ble Commission that the
ED – Pondicherry has prepared the opening balance sheet as on April 1, 2009, annual financial
statements for the years 2009-10 and 2010-11 and Fixed Assets Statement with the advice and
assistance of a professional firm. The accounts for the 1st half of FY2011-12 have also been
prepared
5.55 The EDP is in the process of selecting an auditor. The department has sent out tenders on an
invitational basis to various firms interested in providing audit services. The EDP would like to
submit to the Hon’ble Commission that the auditor to audit the financial statements specified
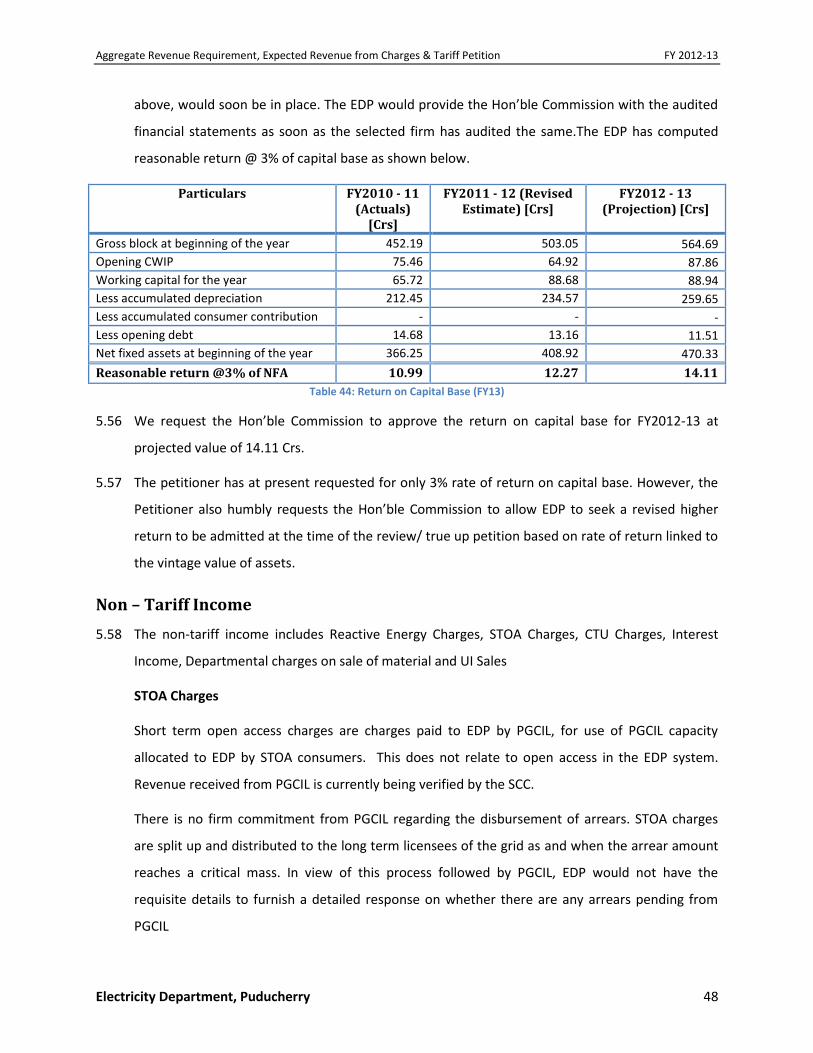
Aggregate Revenue Requirement, Expected Revenue from Charges & Tariff Petition FY 2012-13
Electricity Department, Puducherry 48
above, would soon be in place. The EDP would provide the Hon’ble Commission with the audited
financial statements as soon as the selected firm has audited the same.The EDP has computed
reasonable return @ 3% of capital base as shown below.
Particulars FY2010 - 11 (Actuals)
[Crs]
FY2011 - 12 (Revised Estimate) [Crs]
FY2012 - 13 (Projection) [Crs]
Gross block at beginning of the year 452.19 503.05 564.69
Opening CWIP 75.46 64.92 87.86
Working capital for the year 65.72 88.68 88.94
Less accumulated depreciation 212.45 234.57 259.65
Less accumulated consumer contribution - - -
Less opening debt 14.68 13.16 11.51
Net fixed assets at beginning of the year 366.25 408.92 470.33
Reasonable return @3% of NFA 10.99 12.27 14.11
Table 44: Return on Capital Base (FY13)
5.56 We request the Hon’ble Commission to approve the return on capital base for FY2012-13 at
projected value of 14.11 Crs.
5.57 The petitioner has at present requested for only 3% rate of return on capital base. However, the
Petitioner also humbly requests the Hon’ble Commission to allow EDP to seek a revised higher
return to be admitted at the time of the review/ true up petition based on rate of return linked to
the vintage value of assets.
Non – Tariff Income
5.58 The non-tariff income includes Reactive Energy Charges, STOA Charges, CTU Charges, Interest
Income, Departmental charges on sale of material and UI Sales
STOA Charges
Short term open access charges are charges paid to EDP by PGCIL, for use of PGCIL capacity
allocated to EDP by STOA consumers. This does not relate to open access in the EDP system.
Revenue received from PGCIL is currently being verified by the SCC.
There is no firm commitment from PGCIL regarding the disbursement of arrears. STOA charges
are split up and distributed to the long term licensees of the grid as and when the arrear amount
reaches a critical mass. In view of this process followed by PGCIL, EDP would not have the
requisite details to furnish a detailed response on whether there are any arrears pending from
PGCIL
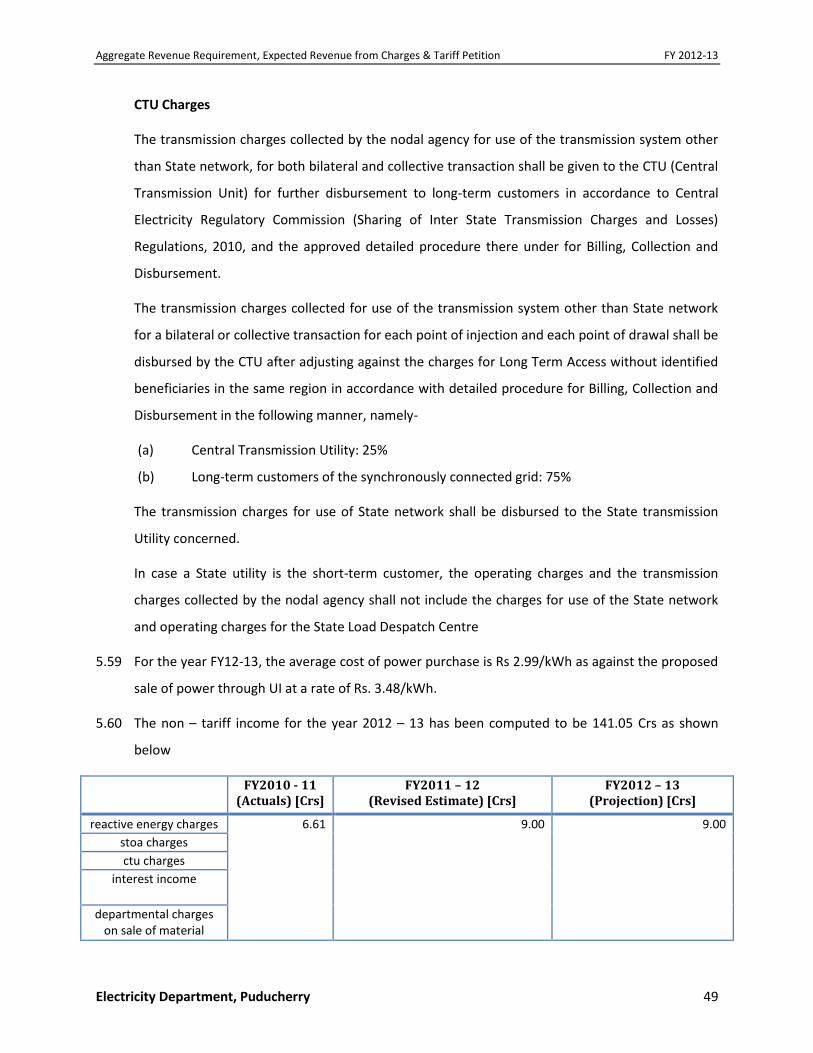
Aggregate Revenue Requirement, Expected Revenue from Charges & Tariff Petition FY 2012-13
Electricity Department, Puducherry 49
CTU Charges
The transmission charges collected by the nodal agency for use of the transmission system other
than State network, for both bilateral and collective transaction shall be given to the CTU (Central
Transmission Unit) for further disbursement to long-term customers in accordance to Central
Electricity Regulatory Commission (Sharing of Inter State Transmission Charges and Losses)
Regulations, 2010, and the approved detailed procedure there under for Billing, Collection and
Disbursement.
The transmission charges collected for use of the transmission system other than State network
for a bilateral or collective transaction for each point of injection and each point of drawal shall be
disbursed by the CTU after adjusting against the charges for Long Term Access without identified
beneficiaries in the same region in accordance with detailed procedure for Billing, Collection and
Disbursement in the following manner, namely-
(a) Central Transmission Utility: 25%
(b) Long-term customers of the synchronously connected grid: 75%
The transmission charges for use of State network shall be disbursed to the State transmission
Utility concerned.
In case a State utility is the short-term customer, the operating charges and the transmission
charges collected by the nodal agency shall not include the charges for use of the State network
and operating charges for the State Load Despatch Centre
5.59 For the year FY12-13, the average cost of power purchase is Rs 2.99/kWh as against the proposed
sale of power through UI at a rate of Rs. 3.48/kWh.
5.60 The non – tariff income for the year 2012 – 13 has been computed to be 141.05 Crs as shown
below
FY2010 - 11 (Actuals) [Crs]
FY2011 – 12 (Revised Estimate) [Crs]
FY2012 – 13 (Projection) [Crs]
reactive energy charges 6.61 9.00 9.00
stoa charges
ctu charges
interest income
departmental charges on sale of material

Aggregate Revenue Requirement, Expected Revenue from Charges & Tariff Petition FY 2012-13
Electricity Department, Puducherry 50
UI sales 90.11 138.1 132.05
Total NTI 96.72 147.1 141.05
Table 45: Non-Tariff Income (FY13)
Summary of Revenue Requirement
5.61 The aggregate revenue requirement for FY2012-13, and the comparison with FY2010-11 and
FY2011-12 is shown below
Item of expense FY2010 - 11 (Actuals)[Crs]
FY2011 - 12 (Revised
Estimate)[Crs]
FY2012 - 13 (Projections)[Crs]
Cost of power purchase 727.3 997.3 997.8
Employee costs 49.9 52.6 54.8
R&M expenses 8.0 10.3 10.8
Administration & general expenses 3.5 3.9 3.9
Depreciation 22.1 25.1 33.0
Interest & finance charges 1.9 2.0 1.9
Interest on working capital 7.7 10.4 10.5
Provision for bad debts -
-
-
Return on NFA / Equity 11.0 12.3 14.1
Amortization ofregulatory asset proposed for previous FYs
57.8
Aggregate revenue requirement 831.4 1,113.8 1,184.6
Non-tariff income 96.7 147.1 141.0
Net revenue requirement 734.6 966.7 1043.6
Table 46: Net Revenue Requirement (FY13)
5.62 EDP proposes to amortize the regulatory asset proposed for previous FYs to the tune of Rs. 57.8
Crores in FY12-13
5.63 The cost structure of the EDP, showing the contribution of different components of aggregate
revenue requirement, towards the total costs incurred is given below for easy reference
Item of Expense FY2010 - 11 (Actuals)
FY2011 - 12 (Revised Estimate)
FY2012 - 13 (Projections)
Cost of power purchase 87% 90% 89%
Employee costs 6% 5% 5%
R&M expenses 1% 1% 1%
Administration & general expenses 0% 0% 0%
Depreciation 3% 2% 3%
Interest & finance charges 0% 0% 0%
Interest on working capital 1% 1% 1%

Aggregate Revenue Requirement, Expected Revenue from Charges & Tariff Petition FY 2012-13
Electricity Department, Puducherry 51
Provision for bad debts 0% 0% 0%
Return on NFA / Equity 1% 1% 1%
Table 47: Change in proportion of costs in gross ARR
5.64 As can be seen, close to 90% of the gross aggregate revenue requirement is on account of power
purchase costs. The % mix of the expense items are more or less the same as that for FY2011-12.
5.65 The EDP, being a transmission and distribution utility, has no owned generation, and is primarily
dependent on external sources of power, and hence has no control over the cost of power
purchased
5.66 Given this reality, we request the Hon’ble Commission to approve the net revenue requirement
for FY2012-13 at 1043.6 Crs
Average Cost to Serve
5.67 We have calculated the average Cost to Serve based on the total projected sales. This avg CoS
captures the impact of T&D losses in the system, incurred to serve demand.
5.68 Based on the projected net ARR and the projected sales, the average CoS works out to 4.32/kWh
for FY2012-13
Net ARR (Rs Cr) 1043.58
Sales (MU) 2414.53
Avg CoS (Rs/Unit) 4.32 Table 48: Average Cost to Serve

Aggregate Revenue Requirement, Expected Revenue from Charges & Tariff Petition FY 2012-13
Electricity Department, Puducherry 52
6 Expected revenue from charges & gap 6.1 The expected revenue from charges is based on sales projections & approved tariff rates that are
currently applicable for different consumer categories and slabs. The detailed working is provided
in format F28 – Expected revenue from charges. The summary of the revenue from charges is
given below
Item of expense FY2010 - 11 (Actuals)[Crs]
FY2011 - 12 (Revised
Estimate)[Crs]
FY2012 - 13 (Projections)[Crs]
Revenue from tariff 630.8 650.2 675.9
Revenue from FCA
46.4
Surplus / (Gap) (104.5) (270.1) (367.4)
Surplus / (Gap) from previous year (68.2) (172.7) (385.2)
Total surplus / (gap) (172.7) (442.8) (752.6) Table 49: Revenue from Charges - Summary
6.2 The expected revenue from tariff for FY2012-13 is 675.9 Crs
6.3 Considering the net ARR of 1043.6 Crs,the gap for FY2012-13 will be 367.4 Crs. In addition, the
aggregate gap of previous years of 385.2 Crs, comprising of the gap of 68.2 Crs for FY2009-10,
104.5 Crs for FY2010-11 and 270.1 Crs for FY2011-12 would result in an total aggregate gap of Rs
752.6 Crs from FY2009- 10 to FY 2012- 13.
6.4 EDP proposes to recover part of the proposed regulatory asset requested for approval upto 2011-
12 during the FY12- 13 to the tune of Rs 57.8 Cr.
6.5 We request the Hon’ble Commission to approve the consolidated gap for recovery from tariff as
752.6 Crs

Aggregate Revenue Requirement, Expected Revenue from Charges & Tariff Petition FY 2012-13
Electricity Department, Puducherry 53
7 Tariff petition
Necessity for tariff petition
7.1 The gap for FY2012-13 alone is 367.4 Crs. Adding the gap from FY2009-10, FY2010-11 &FY2011-12 of68 Crs, 105
Crs &270 Crs respectively, the total gap to be recovered is 752.6 Crs
7.2 The average realisation from consumers at current tariff is only 2.80/kWh compared to the average CoS of
4.32/kWh leading to under realisation of 1.52/kWh
7.3 This is in addition to under realisation in earlier years including FY2009-10 as well, which will lead to accumulated
losses of 385.2 Crs at the beginning of FY2012-13
7.4 Therefore, there is an urgent need to revise tariff to ensure sustainable operations of the EDP
Tariff philosophy
7.5 The tariff philosophy adopted in proposing revised tariffs draws upon the principles of
i) National Tariff Policy which indicates that cost recovery from consumers should be within ±20% of the
average CoS
ii) Avoiding tariff shock to consumers, as far as possible
iii) Recovery of fixed costs through demand charges and energy costs through energy charges
7.6 The table below shows the category-wise cost recovery at existing tariffs as a percentage of average CoS of
4.32/kWh
Category Avg.
Realization [Rs/Unit]
Cost Recovery
[%]
Domestic 1.17 27%
OHOB 0.68 16%
Commercial 3.60 83%
Agriculture 0.09 2%
Public lighting 2.90 67%
LT Industrial 2.72 63%
Temporary supply - LT 5.00 116%
HT 1 Industrial 3.55 82%
HT 2 - Government & water tank 3.67 85%
HT 3 - EHT 3.80 88%
Table 50: FY2012-13 – Category-wise cost recovery at existing tariff
7.7 Since more than 99.5% of electricity is being sold at less than average CoS, the EDP has no option but to propose a
tariff hike across the board for all consumer categories

Aggregate Revenue Requirement, Expected Revenue from Charges & Tariff Petition FY 2012-13
Electricity Department, Puducherry 54
Proposed tariff
7.8 The category and slab-wise tariff has been proposed keeping in mind the tariff philosophy mentioned above
7.9 Further, we are proposing to recover almost the entire gap for the current year of 367.4 Crs, and propose to treat
the accumulated gap of previous years amounting to 385.2 Crs as regulatory asset. The summary of the existing
and proposed tariff is presented below
Fixed charges Energy charges
Existing
Proposed (2012-13)
Change Existing Proposed (2012-13)
Change
Domestic
0 - 50 - 20.00 20.00 - 1.50 1.50
51-150 - 20.00 20.00 - 2.30 2.30
151-250 - 20.00 20.00 - 4.00 4.00
251-350 - 20.00 20.00 - 4.50 4.50
351-500 - 20.00 20.00 - 5.00 5.00
>500 - 20.00 20.00 - 5.20 5.20
OHOB 15.00 50.00 35.00 - - -
Commercial
0 - 100 25.00 30.00 5.00 2.15 4.20 2.05
101 - 250 25.00 30.00 5.00 3.15 4.60 1.45
250-500 25.00 30.00 5.00 3.65 5.00 1.35
> 500 25.00 30.00 5.00 - 5.20 5.20
Agriculture
Small farmers 25.00 75.00 50.00 - - -
Other farmers 100.00 200.00 100.00 - - -
Public lighting - - - 2.90 4.30 1.40
LT Industrial
0 - 1000 25.00 25.00 - 2.60 3.90 1.30
> 1000 25.00 25.00 - 2.80 4.20 1.40
Water tank 25.00 25.00 - 2.90 4.30 1.40
Temporary supply - LT - - - 5.00 8.25 3.25
HT 1 Industrial & Commercial
(A) - CD < 2000
0 - 100000 155.00 210.00 55.00 2.95 4.10 1.15
>100000 155.00 210.00 55.00 3.10 4.20 1.10
(B) - 2000 < CD < 5000
>0 160.00 210.00 50.00 3.15 4.25 1.10
(C)
>0 - 210.00 210.00 - 4.40 4.40
HT 2 - Government & water tank 190.00 200.00 10.00 2.85 4.20 1.35
HT 3 - EHT 160.00 190.00 30.00 3.15 4.10 0.95
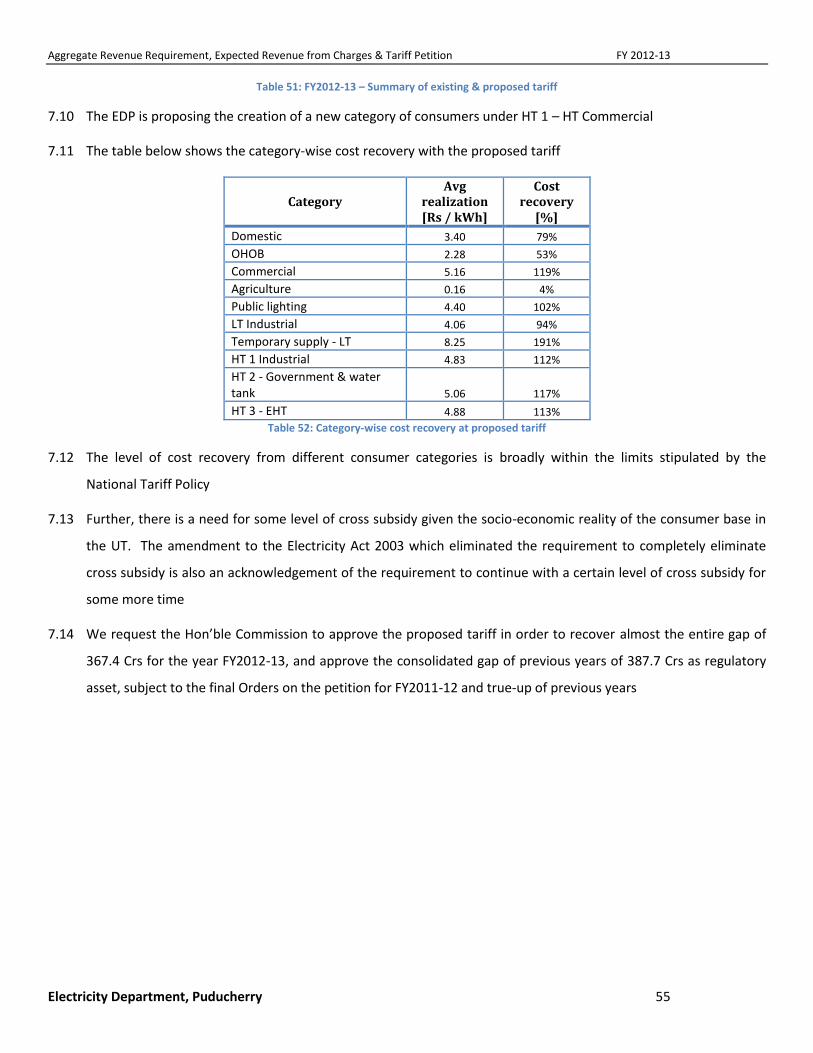
Aggregate Revenue Requirement, Expected Revenue from Charges & Tariff Petition FY 2012-13
Electricity Department, Puducherry 55
Table 51: FY2012-13 – Summary of existing & proposed tariff
7.10 The EDP is proposing the creation of a new category of consumers under HT 1 – HT Commercial
7.11 The table below shows the category-wise cost recovery with the proposed tariff
Category Avg
realization [Rs / kWh]
Cost recovery
[%]
Domestic 3.40 79%
OHOB 2.28 53%
Commercial 5.16 119%
Agriculture 0.16 4%
Public lighting 4.40 102%
LT Industrial 4.06 94%
Temporary supply - LT 8.25 191%
HT 1 Industrial 4.83 112%
HT 2 - Government & water tank 5.06 117%
HT 3 - EHT 4.88 113%
Table 52: Category-wise cost recovery at proposed tariff
7.12 The level of cost recovery from different consumer categories is broadly within the limits stipulated by the
National Tariff Policy
7.13 Further, there is a need for some level of cross subsidy given the socio-economic reality of the consumer base in
the UT. The amendment to the Electricity Act 2003 which eliminated the requirement to completely eliminate
cross subsidy is also an acknowledgement of the requirement to continue with a certain level of cross subsidy for
some more time
7.14 We request the Hon’ble Commission to approve the proposed tariff in order to recover almost the entire gap of
367.4 Crs for the year FY2012-13, and approve the consolidated gap of previous years of 387.7 Crs as regulatory
asset, subject to the final Orders on the petition for FY2011-12 and true-up of previous years

Aggregate Revenue Requirement, Expected Revenue from Charges & Tariff Petition FY 2012-13
Electricity Department, Puducherry 56
8 Prayer 8.1 The Electricity Department, Government of Puducherry (EDP) respectfully prays to the Hon’ble Commission to
i) Admit this petition for approval of Aggregate Revenue Requirement (ARR), Expected Revenue from Charges
and revision of Tariffs
ii) Review the actual performance of FY2011-12, and provisionally approve the Aggregate Revenue Requirement
(ARR), Expected Revenue from Charges (ERC) and the gap for FY2011-12 based on half year accounts prepared
by the EDP, and projections, subject to final approval on the basis of true-up based on audited accounts
iii) Provisionally approve the consolidated gap upto end of FY2011-12 based on accounts prepared by the EDP,
and projections, subject to final approval on the basis of true-up based on audited accounts
iv) Approve the Aggregate Revenue Requirement (ARR), Expected Revenue from Charges (ERC) and the gap for
FY2012-13
v) Approve the proposed revision in tariff to recover the gap for FY2012-13 and the tariff schedule
vi) Create a regulatory asset for the consolidated gap upto end of FY2011-12
vii) Approve the amortization of part of the proposed regulatory asset as indicated in (vi) above to the tune of Rs.
57.8 Crores in this tariff petition.
viii) Grant approval for the proposed charges for services
ix) Grant any other relief as the Hon’ble Commission may consider appropriate. The petitioner craves leave of
the Hon’ble Commission to allow further submission, addition and alteration to this petition as may be
necessary from time to time
x) To pass any other Order as the Hon’ble Commission may deem fit and appropriate under the circumstances of
the case and in the interest of justice
8.2 The petitioner declares that the subject matter of the petition has not been raised by the petitioner before any
other competent forum, and that no other competent forum is currently seized of the matter or has passed any
order in relation thereto
Place: Puducherry
Dated: 21st December 2011 Signature of Petitioner

Aggregate Revenue Requirement, Expected Revenue from Charges & Tariff Petition FY 2012-13
Electricity Department, Puducherry 57
9 Proposed Tariff Schedule
A. Low Tension Supply
DomesticPurposes(A2)
9.1 Thistariffisapplicabletoservicesforlights,fans,Air-conditioning, Heating
andothersmalldomesticappliancesetcusedfor:
9.2 Genuinedomesticpurposesincludingcommonservicesforstair-case,lifts,water
tankswithmotornotexceeding3 H.Pinthedomesticapartments.
9.3 Supply to actual places of public worship such as temples, mosques, churches.
9.4 Ashrams and Mutts, Non-commercial orphanage homes and old people homes run by religious
and charitable institutions, social welfare and voluntary organisations.
9.5 Government owned Youth hostels, Adi Dravida hostels, Rehabilitation Centres, Anganwadies and
Balwadies run by Social Welfare Department.
9.6 Forownresidenceswhereoneroomissetapartforthepurposeofconsultation
bydoctors,lawyers,engineers,architectsandauditors.
9.7 Tohandloominresidenceofhandloomweavers(regardlessofthefactwhether
outsidelabourisemployedornot)andtohandloominshedserected.
9.8 Totheresidenceswheresupplyfromahouseisextendedtotailoringshops,Job
typing,documentwriting,Laundrypressing,andsmallcatererssetup in the
verandahofthehousewithsmalllightingloadonly(onetubelightonly).
9.9 The ProposedenergychargesforDomesticServiceareasindicatedinthetablebelow.
Consumption [kWh/month] Rate [Rs/kWh/month]
0 - 50 1.50
51-150 2.30
151-250 4.00
251-350 4.50
351-500 5.00
>500 5.20
9.10 FixedCharges:Rs. 20.00per connection permonth
HutServices(A3)
9.11 Forsupplytobonafidehutserviceswithonlytwonumbersof40WFlorescentTube lights.

Aggregate Revenue Requirement, Expected Revenue from Charges & Tariff Petition FY 2012-13
Electricity Department, Puducherry 58
9.12 Theenergychargesforhutservice(OHOB)areasindicatedinTablebelow:
Description Fixed Charges [Rs/connection/month]
Hut Services 50
Note:
9.13 Hutisdefinedasalivingplacenotexceeding300sq.ft.or27.87sq.m.withmud
wall/brickwallorthatchedwallandthatchedroofonly.Hutdoesnotincludefarm
huts.Ifanyoftheconditionsischangedatalaterstage,thisconcessionalsupply
willbediscontinuedandtheconsumerwillhavetotakemeteredsupply.
9.14 The tariff under this item is a l s o applicable for houses constructed for economically
weakersectionsunderthe"Chief Minister’s5000
housesprogramme"andhousesconstructedbythe DistrictRuralDevelopmentAgency
underIndiraAwaasYojanaandbytheAdiDravidarWelfareDepartmenthavinga
livingspacenotexceeding300sq.ft.or27.87sq.
9.15 Theconsumerunderthiscategoryshoulduseonlytwonumbersof40 watts
florescenttubelights.Heshouldnotusebulbs/tubelightsof higherwattageor connectany
otherelectricalequipment/appliancesotherthanthosementioned
above.Supplyfromsuchservicesshouldnot betappedforanyotherpurposes
includingfunctions, publicmeetingsandalsofor neighbouringhuts.Ifatanytime,
anyunauthorizedloadorextension,useofhigherwattagebulbsoruseofservice
forotherpurposesisdetected,theservicewillbedisconnectedforthwith.
Commercial(A1)
9.16 ThistariffisforLightsandcombined installation oflightsandfans,mixedloadsof
lightsandpower,heatingandair-conditioningapplicableto:
i) Non-domesticandnon-industrialconsumers,tradeandcommercialpremises.
ii) Educational institutions, hostels, public libraries.
iii) Hotels, Restaurants, Boarding and Lodging Homes
iv) Hospitals, Private clinics, Nursing Homes, Diagnostic Centres, X-ray Units etc.
v) IT related development Centres and Service centres.
vi) Common services for Stair-case, lifts, water tanks with motor not exceeding 5 H.P. etc. in the
purely commercial/combinationofcommercialanddomestic.
9.17 The proposed energychargesareasindicatedinthetablebelow:

Aggregate Revenue Requirement, Expected Revenue from Charges & Tariff Petition FY 2012-13
Electricity Department, Puducherry 59
Consumption [kWh/month] Rate [Rs/kWh/month]
0–100 4.20
101–250 4.60
251 – 500 5.00
>500 5.20
9.18 Other charges
Fixed Charges Rs. 30per service per month
Service Charges Rs. 25.00 per service per month
Agricultural Services (D)
9.19 Agriculture/Cottage Industries, etc. For supply to bonafide Agricultural Services with a connected
load of not less than 3HP per service.
Agriculture(D1)
Description Fixed Charges [Rs/HP/annum]
Small Farmers 75
Other Farmers 200
9.20 For other farmers, a service charge of 200/service/annum will be charged, in addition to charges
as above
9.21 Electricity will be supplied under the tariff category “Small farmers” to those consumers whose
families are solely dependent on the income derived from their agricultural and holding, which
should not exceed two and half acres of wetland or five acres of dry land. A certificate to this
effect from Revenue authority shall be produced. "Small farmer means a person whose total
holding, whether as owner, tenant or mortgaged with possession or partly in one capacity and
partly in another, does not exceed two-and-half acres of wetland so five acres of dry land.
Incomputing the extent of land held by a person who holds both wet and dry lands, two acres of
dry land shall be taken as equivalent to one acre of wet land.
9.22 The above concession will be withdrawn if resale of energy or unauthorized load/extension or use
for other purpose is detected by the Department.
9.23 Agricultural powerloadsbelow3H.P.willbechargedunderGeneralCategory TariffA1.Abonafide
farmer may use his motor in the Agricultural Service for allied agricultural purposes such as sugar
cane crushing, thrashing etc. With the prior approval of concerned Executive Engineer (Operation
& Maintenance), Electricity Department.

Aggregate Revenue Requirement, Expected Revenue from Charges & Tariff Petition FY 2012-13
Electricity Department, Puducherry 60
9.24 However, power supply to Farm Houses shall be metered separately and
chargedunderDomestictariff.
PaymentofTariffChargesbyAgricultureconsumers
9.25 TheTariffshallbecollectedinthreeequalinstalmentspayableinApril,August
andDecemberineachyear.Theinstalmentsshallbepayablebeforethe15thof
therespectivemonths.TheservicechargesofRs200 p e r annumshallalsobe
collectedinthreeinstalmentsofRs.75,Rs.75andRs.50alongwithinstalmentofflatrateinApril,Augustan
dDecembermonths.
9.26 For new service, thefirst instalmentshall beproportionate tothenumber of whole months
remaining till the month in which the first instalmentis due. Fractionofamonthshallbereckonedasa
wholemonth.
CottageIndustries/Horticulture /PoultryFarms(D2):
9.27 Itisapplicabletocottage industries, privateHorticultural nurseries including Plant tissue culture
media and bonafidepoultryfarms.
9.28 Theenergychargesareasindicatedinthetablebelow:
Description Energy Charges
Cottage Industries Tariff rates as applicable in case of Domestic Consumers Horticulture
Poultry Farms
(a) Cottageindustries
9.29 The following conditions should be satisfied in order that an industry may be
classifiedasabonafidecottageindustry:
9.30 Itshouldbeconductedentirelywithinthehome,thehomebeingdeemedtobe
permanentresidenceoftheproprietor.
9.31 The industry shall not cause any residence toconstitute afactory within the
meaningoftheFactoriesAct,1948.
9.32 Notmorethantwopersonsoutsidetheimmediatefamilyoftheproprietorshallbe
employedinthefactory.
9.33 It shouldbecertifiedbytheDirectorofIndustriesthattheindustryforwhichpower
isusedisacottageindustry.
9.34 Theproduce isnotpurelyutilizedmainlyforthedomestic consumptionofthe
proprietorbutshouldalsobeavailableforsaletothepublic.

Aggregate Revenue Requirement, Expected Revenue from Charges & Tariff Petition FY 2012-13
Electricity Department, Puducherry 61
(b) Poultryfarms
9.35 The following conditions should be satisfied in order that the service may be
classifiedasabonafidepoultryfarm.
9.36 Thecapacityofthefarmshallbeaminimumof100birdsandmaximumof5,000
birds(bothlayerandbroilerbirds).
9.37 Theapplicationofthebeneficiaryseekingsuchconcessionshallbeverifiedand
recommendedbytheAnimalHusbandryDepartment.
(c)Horticultural
9.38 Theapplicationsofthebeneficiaryseekingsuchconcessionshallbeverifiedand
recommendedbytheDirector,AgricultureDepartment.
Publiclighting
9.39 The Proposed tariffforpubliclighting(exclusiveofinstallation,renewalcharges,etc.)shallbe
asfollows:
Description Rate [Rs/kWh/month)
Public Lighting 4.30
9.40 Thistariffwillalsoapplytopubliclightinginmarkets,busstands,trafficsignals,high
mastlightsonpublicways,publicparks,publiclightinginnotifiedindustrialestates.
Industrial(C)
LTIndustrial(C1)
9.41 Applicable to low tension industrial consumers including lighting in the industrial
servicesexceptthosementionedinTariff`C2'category.
9.42 The Proposed energychargesareasindicatedinthetablebelow.
Consumption [kWh/month] Rate [Rs/kWh/month]
0 – 1000 3.90
> 1000 4.20
9.43 Other charges
Minimum Charges Rs. 60 /HP / month
Service Charges Rs. 25 /service / month
LTIndustrial(C2)- Water tanks
9.44 Applicable to water tanks including lighting in the premises maintained by State
GovernmentDepartments/UndertakingsandLocalBodies.
9.45 The Proposed energychargesareasindicatedinthetablebelow.

Aggregate Revenue Requirement, Expected Revenue from Charges & Tariff Petition FY 2012-13
Electricity Department, Puducherry 62
Consumption [kWh / month] Rate [Rs/kWh/Month]
Entire consumption 4.30
9.46 Other charges
Fixed Charges Rs. 25 / service / month
LT supply Limit
9.47 For single phase connection, the connected load shall not exceed 4kW, and for 3 phase
connection, the connected load shall not exceed 130 HP or 97 kW
B. High tension supply
HighTension–I (a)
9.48 Applicable to industrial establishments, registered under F actories Act with Contracted
Maximum demand of 2000KVA &less, The Proposed
DemandandtheEnergyChargesareasindicatedinthetablebelow
Description Unit Slab Charges
Demand Charges Rs. / kVA / month NA 210.00
Energy Charges Rs. / kWh/ month 0 – 100, 000 kWh / month 4.10
Rs. / kWh/ month > 100, 000 kWh / month 4.20
HighTension–I (b)
9.49 Applicable to industrial establishments, registered under F actories Act with Contracted
Maximum demand of greaterthan2000&lessthanorequalto 5000KVA, The Proposed
DemandandtheEnergyChargesareasindicatedinthetablebelow
Description Unit Slab Charges
Demand Charges Rs. / kVA / month NA 210.00
Energy Charges Rs. / kWh/ month Entire consumption 4.25
High Tension –I (C)
9.50 For Commercial Establishments including Laboratories, Hotels, Marriage Halls, Cinema Theatres,
Private educational Institutions, Private Hospitals, shopping Malls, Telephone exchanges,
broadcasting companies, IT companies.
Description Unit Slab Charges
Demand Charges Rs. / kVA / month NA 210.00
Energy Charges Rs. / kWh/ month Entire consumption 4.40
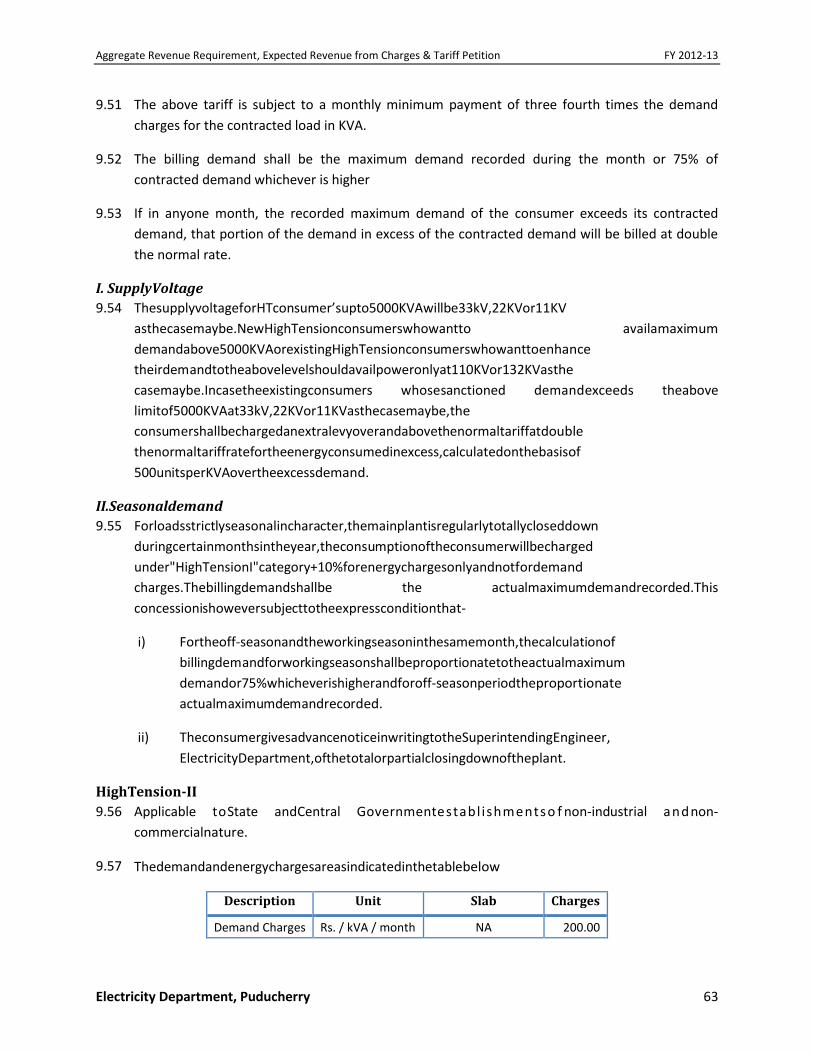
Aggregate Revenue Requirement, Expected Revenue from Charges & Tariff Petition FY 2012-13
Electricity Department, Puducherry 63
9.51 The above tariff is subject to a monthly minimum payment of three fourth times the demand
charges for the contracted load in KVA.
9.52 The billing demand shall be the maximum demand recorded during the month or 75% of
contracted demand whichever is higher
9.53 If in anyone month, the recorded maximum demand of the consumer exceeds its contracted
demand, that portion of the demand in excess of the contracted demand will be billed at double
the normal rate.
I. SupplyVoltage
9.54 ThesupplyvoltageforHTconsumer’supto5000KVAwillbe33kV,22KVor11KV
asthecasemaybe.NewHighTensionconsumerswhowantto availamaximum
demandabove5000KVAorexistingHighTensionconsumerswhowanttoenhance
theirdemandtotheabovelevelshouldavailpoweronlyat110KVor132KVasthe
casemaybe.Incasetheexistingconsumers whosesanctioned demandexceeds theabove
limitof5000KVAat33kV,22KVor11KVasthecasemaybe,the
consumershallbechargedanextralevyoverandabovethenormaltariffatdouble
thenormaltariffratefortheenergyconsumedinexcess,calculatedonthebasisof
500unitsperKVAovertheexcessdemand.
II.Seasonaldemand
9.55 Forloadsstrictlyseasonalincharacter,themainplantisregularlytotallycloseddown
duringcertainmonthsintheyear,theconsumptionoftheconsumerwillbecharged
under"HighTensionI"category+10%forenergychargesonlyandnotfordemand
charges.Thebillingdemandshallbe the actualmaximumdemandrecorded.This
concessionishoweversubjecttotheexpressconditionthat-
i) Fortheoff-seasonandtheworkingseasoninthesamemonth,thecalculationof
billingdemandforworkingseasonshallbeproportionatetotheactualmaximum
demandor75%whicheverishigherandforoff-seasonperiodtheproportionate
actualmaximumdemandrecorded.
ii) TheconsumergivesadvancenoticeinwritingtotheSuperintendingEngineer,
ElectricityDepartment,ofthetotalorpartialclosingdownoftheplant.
HighTension-II
9.56 Applicable toState andCentral Governmentestabl ishmentso f non-industrial andnon-
commercialnature.
9.57 Thedemandandenergychargesareasindicatedinthetablebelow
Description Unit Slab Charges
Demand Charges Rs. / kVA / month NA 200.00

Aggregate Revenue Requirement, Expected Revenue from Charges & Tariff Petition FY 2012-13
Electricity Department, Puducherry 64
Energy Charges Rs. / kWh/ month Entire consumption 4.20
9.58 Theabovetariffissubjecttoamonthlyminimumpaymentofthree-fourthtimesthe
demandchargesforthecontractedloadinKVA.
HighTension-III
9.59 Applicabletoalltypesofindustriessuppliedat110KVor132KVasthecasemay be.
9.60 The proposed demandandenergychargesareasindicatedinthetablebelow.
Description Unit Slab Charges
Demand Charges Rs. / kVA / month NA 190.00
Energy Charges Rs. / kWh/ month Entire consumption 4.10
9.61 Theabovetariffissubjecttoamonthlyminimumpaymentofthree-fourthtimesthe
demandchargesforthecontractedloadinKVA.
9.62 Thebillingdemandshallbethemaximumdemandrecordedduringthemonthor75% of
c o n t r a c t e d d e m a n d w h i c h e v e r ishigher.
9.63 If in anyone month, the recorded maximum
demandoftheconsumerexceedsitscontracteddemand,thatportionof
thedemandinexcessofthecontracteddemandwillbebilledatdoublethenormal rate.
C.Temporary supply 9.64 Thetariffapplicableandminimumchargesforthetemporary S e r v i c e s m o r e t h a n a p e r i o d o f
f i f t e e n d a y s willbe asfollows:
9.65
Category Unit Slab Rate [Rs/kWh] Minimum charges
Lights or combined installation of lights and fans, Motive Power, Heating and others
Rs / kWh / month
Entire consumption 8.25 Rs. 120 / service /
month
Special Illumination Rs / kWh /
month Entire Consumption
8.25
Rs. 300 / service / month
Construction and testing purpose for load exceeding 130 HP or 97 KW
Rs / kWh / month
Entire Consumption 8.25 As in
High tension-I
Note:
9.66 TherateforSpecialilluminationshallapplytoweddings,garden-partiesandother
Private/Governmentfunctionswhentheilluminationis obtainedthroughbulbs fastenedin
othersurfacesofwallofbuildings,ontreesandpolesinsidethe
compoundandinpandaletc.,outsidethemainbuilding

Aggregate Revenue Requirement, Expected Revenue from Charges & Tariff Petition FY 2012-13
Electricity Department, Puducherry 65
9.67 IncaseswheresuchSpecialilluminationisdoneintheexistingregularservices
theenergyutilizedforsuchilluminationshallbe meteredseparatelyandthe consumptionwillbe
chargedunderSpecialilluminationchargeas leviedunder temporarysupply.
9.68 Wherever suchSpecial illumination isdone un-authorisedly, apenalcharge of Rs.100 for service
shall be levied in addition to the existing tariff of the installation.
9.69 Other conditions for collection of line and service connection charges,
dismantling,securitydepositetc.willbeaspertherulesnowinforce.
9.70 Forsupplyrequiredatshortnoticethatiswithinthreedaysfromthedateof
applicationfortemporaryserviceconnections,anurgencychargeofRs.25shall
bepaidalongwithothernormaltariffcharges.

Aggregate Revenue Requirement, Expected Revenue from Charges & Tariff Petition FY 2012-13
Electricity Department, Puducherry 66
10 Proposed schedule of services &charges
Charges for service connections
Category Proposed charges [Rs]
(A) New LT overhead service lines
(i) One hut one Bulb Nil
(ii) Other single phase Services
250
(iii) Three phase Services
500
(iv)L.T C.T operated Meter services
3000
(v) H.T Services 5000
(B) New LT underground service lines
(i) Single Phase services -
500
(ii) Three phase Services
1000
(C) Rating / re-rating of services
(i)Single phase Services
125
(ii)Three phase Services
250
(iii) L.T C.T operated Meter service
1500
(iv) H.T Service 2500
Note: The above charges under (A) & (B) will be applicable for addition or alteration or reduction of connected load and enhancement or reduction of CMD or alteration of internal Electrical installations.
Testing of installation
Testing for servicing a new installation (or of an extension or alteration) - For the first test No
Charge. Subsequent testing warranted due to absence of contractor or his representative (or)
due to defects in wiring of consumer's premises or at the request of the consumer or at
occasions that warrant testing of installations for the second time for reasons attributable to the
consumers

Aggregate Revenue Requirement, Expected Revenue from Charges & Tariff Petition FY 2012-13
Electricity Department, Puducherry 67
Proposed Charges (Rs.)
i) Domestic lighting/Commercial lighting/Agriculture Services
200
(ii) Other LT Services 900
(iii) HT/EHT Services 7500
Testing of meters & metering arrangements
For testing of meter at the instance of the consumer:
Proposed Charges (Rs.)
(i) Single phase direct meter 150
(ii) Three phase direct meter upto 50 A 200
(iii) L.T C.T coil test 800
(iv) H.T Tri-vector Meter (0.5 class accuracy or CT operated LT meters.
1500
(v) H.T Tri-vector Meter (0.2 class accuracy)
2000
(vi) H.T Metering Cubicle 3500
Testing of HT/EHT consumer protective equipment
Proposed Charges (Rs.)
Testing charges for protective relays (Earth fault,line fault etc.)
4500
Testing charges for one set of current transformer.
4500
Testing charges for one set of potential transformers.
4500
Testing charges for one set of circuit breaker
4500
Testing charges for measurement of earth resistance.
3000
Testing charges for Transformer oils 500

Aggregate Revenue Requirement, Expected Revenue from Charges & Tariff Petition FY 2012-13
Electricity Department, Puducherry 68
Disconnection / Re-connection charges
Proposed Charges (Rs.)
(i)Disconnection of L.T service on request
100
(ii) Disconnection of HT service on request
500
(iii) Reconnection of L.T Service(on all occasions) .
100
(iv)Reconnection of HT Service ( on all occasions).
500
Title transfer of services
Proposed Charges (Rs.)
(i) Domestic 250
(ii) Commercial lighting installation 500
(iii) All other LT installation 1000
(iv) HT/EHT Services 2000
Furnishing of certified copies
(To be issued to the consumer only)
Proposed Charges (Rs.)
Issue of duplicate Monthly bills for a month.
10.00
(ii) Contractor's completion-cum-test report
10.00
(iii) Ledger extract 20.00 / calendar year or part thereof.
(iv) Agreement 50.00
(v) Estimate
50.00
Meter rent charges
. Particulars Proposed Charges (Rs.)
(i) single-phase meter 10/- per meter/ month. or part

Aggregate Revenue Requirement, Expected Revenue from Charges & Tariff Petition FY 2012-13
Electricity Department, Puducherry 69
thereof
(ii) Three phase meter 25/- per meter/ month. or part
thereof
(iii) LT C.T operated meters 200/- per meter/ month. or part
hereof
(iv) HT/EHT metering
equipments
500/- per meter/ month .or part
thereof
Fuse renewal charges
Proposed Charges (Rs.)
(i) Domestic -NIL
(ii) Commercial 50
(iii) L.T Industrial 50
(iv) High Tension/Extra High Tension installation
250
Shifting of meter board at consumer’s request
Proposed Charges (Rs.)
(i) LT single phase supply 125
(ii) LT Three phase supply 250
Belated payment surcharge
All High Tension and low tension consumer bills shall be paid within the due date as specified in
the respective bills. Bills not paid within this stipulated time will be subjected to a levy of 1.5%
surcharges per month. Period of delay less than one month will be reckoned as one month. The
above charges will be levied subject to a minimum of Rs 6/- for L.T domestic consumers , Rs 10
/-for other LT consumers and Rs 500/- for H.T /EHT consumers

Aggregate Revenue Requirement, Expected Revenue from Charges & Tariff Petition FY 2012-13
Electricity Department, Puducherry 70
11 Annexures
Annexure 1 – Financial statements
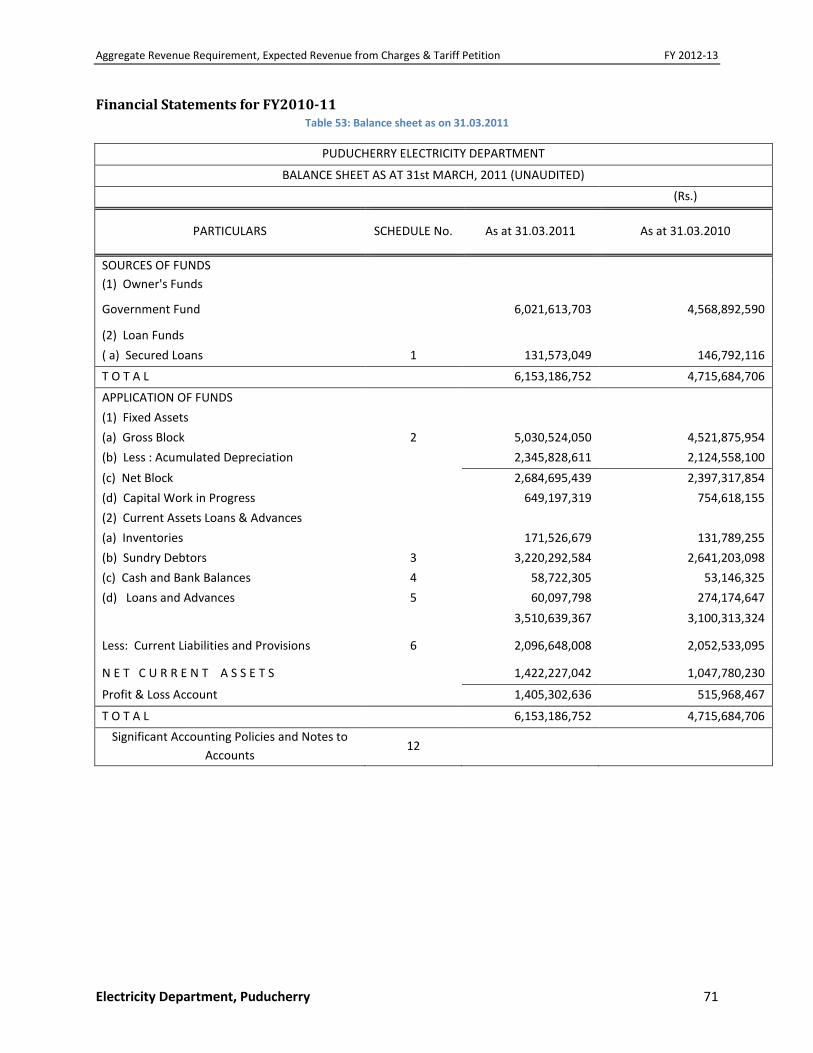
Aggregate Revenue Requirement, Expected Revenue from Charges & Tariff Petition FY 2012-13
Electricity Department, Puducherry 71
Financial Statements for FY2010-11 Table 53: Balance sheet as on 31.03.2011
PUDUCHERRY ELECTRICITY DEPARTMENT
BALANCE SHEET AS AT 31st MARCH, 2011 (UNAUDITED)
(Rs.)
PARTICULARS SCHEDULE No. As at 31.03.2011 As at 31.03.2010
SOURCES OF FUNDS
(1) Owner's Funds
Government Fund
6,021,613,703 4,568,892,590
(2) Loan Funds
( a) Secured Loans 1 131,573,049 146,792,116
T O T A L
6,153,186,752 4,715,684,706
APPLICATION OF FUNDS
(1) Fixed Assets
(a) Gross Block 2 5,030,524,050 4,521,875,954
(b) Less : Acumulated Depreciation
2,345,828,611 2,124,558,100
(c) Net Block
2,684,695,439 2,397,317,854
(d) Capital Work in Progress
649,197,319 754,618,155
(2) Current Assets Loans & Advances
(a) Inventories
171,526,679 131,789,255
(b) Sundry Debtors 3 3,220,292,584 2,641,203,098
(c) Cash and Bank Balances 4 58,722,305 53,146,325
(d) Loans and Advances 5 60,097,798 274,174,647
3,510,639,367 3,100,313,324
Less: Current Liabilities and Provisions 6 2,096,648,008 2,052,533,095
N E T C U R R E N T A S S E T S
1,422,227,042 1,047,780,230
Profit & Loss Account
1,405,302,636 515,968,467
T O T A L
6,153,186,752 4,715,684,706
Significant Accounting Policies and Notes to
Accounts 12

Aggregate Revenue Requirement, Expected Revenue from Charges & Tariff Petition FY 2012-13
Electricity Department, Puducherry 72
Table 54: Profit & loss account for the year ended 31.03.2011
PUDUCHERRY ELECTRICITY DEPARTMENT
Profit and Loss Account for year ended 31st March, 2011 (UNAUDITED)
(Rs.)
PARTICULARS SCH. No. Year Ended Year Ended
31st March, 2011 31st March, 2010
I N C O M E
Revenue from Sale of Power 7 7,178,804,177 6,133,604,442
Other Income 8 66,145,002 46,416,417
T O T A L I N C O M E
7,244,949,179 6,180,020,858
E X P E N D I T U R E
Purchase of Power
7,280,773,858 5,880,690,355
Employee Costs 9 498,864,186 474,705,349
Operations & Maintenance Expenses
79,450,828 96,302,974
Administration and General Expenses 10 35,391,274 31,847,353
Other Expenses
666,611 721,801
Depreciation
221,270,511 198,734,002
Interest and Finance Charges 11 17,866,079 12,987,491
T O T A L E X P E N D I T U R E
8,134,283,348 6,695,989,325
Net Profit / (Loss) before prior period
adjustments (889,334,169) (515,968,467)
Net Prior Period Credits / (Charges)
- -
Profit / (Loss) before Tax
(889,334,169) (515,968,467)
Less : Provision for Taxation
Profit / (Loss) after Tax
(889,334,169) (515,968,467)
Profit / (Loss) brought forward from previous year (515,968,467) -
Balance carried to Balance Sheet
(1,405,302,636) (515,968,467)

Aggregate Revenue Requirement, Expected Revenue from Charges & Tariff Petition FY 2012-13
Electricity Department, Puducherry 73
Table 55: Cashflow statement for the year ended 31.03.2011
Puducherry Electricity Department
CASH FLOW STATEMENT FOR THE YEAR ENDED MARCH 31, 2011 (UNAUDITED)
Particulars 2010-11 2009-10
A. Cash flows from operating activities
Net profit / (loss) before tax (889,334,169) (515,968,467)
Adjustment for :
Depreciation 221,270,511 198,734,002
Interest Income (1,490,037) (2,848,053)
Interest Expenses 17,866,079 12,987,491
Operating profit / (loss) before working capital
changes (651,687,616) (307,095,027)
Changes in Working Capital
(Increase) / Decrease in Inventories (39,737,424) (15,081,209)
(Increase) / Decrease in Debtors (579,089,486) (688,124,787)
(Increase) / Decrease in Loans & Advances
214,076,849 (100,694,531)
Increase / (Decrease) in Trade Payables & Provisions
35,879,230 676,868,224
Cash generated from operations (1,020,558,447) (434,127,330)
Less: Direct taxes paid
- Income Tax - -
- Fringe Benefit Tax - -
Net cash from operating activities (1,020,558,447) (434,127,330)
B. Cash flows from investing activities
(Increase) / Decrease in Fixed Assets (508,648,096) (318,864,799)
(Increase) / Decrease in Capital WIP 105,420,836 (85,571,675)
Interest received 1,490,037 2,848,053
Net cash from investing activities (401,737,223) (401,588,422)
C. Cash flows from financing activities
Repayment of long term borrowings (15,219,067) (14,022,371)
Government Fund 1,460,956,796 870,323,090
Interest paid (17,866,079) (12,987,491)
Net cash flow from financing activities 1,427,871,650 843,313,228
Net increase/(decrease) in cash and cash equivalents
(A+B+C) 5,575,980 7,597,476
Opening Balance of Cash and Cash Equivalents 53,146,325 45,548,849
Closing Balance of Cash and Cash Equivalents 58,722,305 53,146,325

Aggregate Revenue Requirement, Expected Revenue from Charges & Tariff Petition FY 2012-13
Electricity Department, Puducherry 74
Table 56: Schedules forming part of the unaudited financial statements for FY2010-11
SCHEDULE -1
SECURED LOANS
(Rs.)
S.No. Particulars
As at 31.03.2011 As at 31.03.2010
1 Finance Lease Liability
131,573,049 146,792,116
(The lease is relating to the System Control Centre)
TOTAL
131,573,049 146,792,116
SCHEDULE -3
SUNDRY DEBTORS
(Rs.)
S.No. Particulars
As at 31.03.2011 As at 31.03.2010
1 Sundry Debtors for Sale of Power
2,389,317,056 2,080,557,446
2 UI Charges receivable
257,473,304 54,676,784
3 Receivable from Other Department for Sale of
materials 221,235 207,056
4 Unbilled Debtors
573,280,989 505,761,812
TOTAL
3,220,292,584 2,641,203,098
SCHEDULE -4
CASH & BANK BALANCES
(Rs.)
S.No. Particulars
As at 31.03.2011 As at 31.03.2010
1 Cash in hand
2,189,241 5,592,779
2 Cheques in hand
6,160,554 3,429,560
3 Margin money with Bank
50,372,510 44,123,986

Aggregate Revenue Requirement, Expected Revenue from Charges & Tariff Petition FY 2012-13
Electricity Department, Puducherry 75
TOTAL
58,722,305 53,146,325
SCHEDULE -5
LOANS & ADVANCES
(Rs.)
S.No. Particulars
As at 31.03.2011 As at 31.03.2010
1 Other Income receivable
9,022,862 11,793,311
2 Lease advances
3,100,000 2,945,950
3 Advances to Creditors
31,260,915 257,824,248
4 Tariff Subsidy receivable
16,714,021 1,611,138
TOTAL
60,097,798 274,174,647
SCHEDULE -6
CURRENT LIABILITIES & PROVISIONS
(Rs.)
S.No. Particulars
As at 31.03.2011 As at 31.03.2010
1 Consumer Deposits
642,474,352 562,036,729
(refer note 9 of Part B – Notes to accounts)
2 Consumer Contribution for Deposit Works
32,201,521 18,733,278
3 Sundry Creditors
1,380,200,281 1,450,343,023
4 Interest Payable on Finance Lease
901,003 1,005,222
5 Other Liabilities
1,011,604 808,301
6 Vendor/Contractor Deposits
2,432,268 2,225,014
7 Provision for expenses
2,208,179 10,032,844
8 Sales Tax Payable
26,983,117 -

Aggregate Revenue Requirement, Expected Revenue from Charges & Tariff Petition FY 2012-13
Electricity Department, Puducherry 76
9 Un-reconciled balance on account of Fixed assets
8,235,683 7,348,683
TOTAL
2,096,648,008 2,052,533,095
SCHEDULE -7
REVENUE FROM SALE OF POWER
(Rs.)
S.No. Particulars
Year ended 31st March,
2011
Year ended 31st March,
2010
1 LT consumers
1,531,007,564 1,375,741,339
2 HT consumers
4,594,380,330 4,071,047,600
3 Government Buildings
6,422,714 10,647,722
4 Street Light Charges
49,624,373 60,756,049
5 Agriculture
44,230,104 7,137,578
6 Tariff Subsidy on Sale of Power
15,102,883 1,611,138
6,240,767,968 5,526,941,426
Add Un-billed revenue as at the end of the year
573,280,989 505,761,812
Less Un-billed revenue as at the beginning of the year 505,761,812 447,784,518
Revenue from Sale of Power
6,308,287,145 5,584,918,720
7 UI Charges for the year
870,517,032 548,685,722
7,178,804,177 6,133,604,442
SCHEDULE -8
OTHER INCOME
(Rs.)
S.No. Particulars
Year ended 31st
March, 2011
Year ended 31st March,
2010
1 Sale of Trading Materials
751,604 813,831
2 Interest Income on Margin Money Deposit with Bank 1,490,037 2,848,053

Aggregate Revenue Requirement, Expected Revenue from Charges & Tariff Petition FY 2012-13
Electricity Department, Puducherry 77
3 Other receipts
63,903,360 42,754,532
TOTAL
66,145,002 46,416,417
SCHEDULE -9
EMPLOYEE COSTS
(Rs.)
S.No. Particulars
Year ended 31st March,
2011
Year ended 31st March,
2010
1 Salary
673,809,932 570,723,600
2 Wages
8,520,000 1,519,000
3 Stipend
2,217,000 1,616,000
4 Overtime Payment
7,603,000 7,492,000
692,149,932 581,350,600
Less Departmental Charges
18,888,746 29,299,251
Less Salary Costs Capitalized
174,397,000 77,346,000
TOTAL
498,864,186 474,705,349
SCHEDULE -10
ADMINISTRATION & GENERAL EXPENSES
(Rs.)
S.No. Particulars
Year ended 31st March,
2011
Year ended 31st
March, 2010
1 Office Expenses
14,944,624 12,228,910
2 Other Miscellaneous Expenses
20,446,650 19,618,443
TOTAL
35,391,274 31,847,353
SCHEDULE -11
INTEREST AND FINANCE CHARGES

Aggregate Revenue Requirement, Expected Revenue from Charges & Tariff Petition FY 2012-13
Electricity Department, Puducherry 78
(Rs.)
S.No. Particulars
Year ended 31st March,
2011
Year ended 31st
March, 2010
1 Interest Charges on Finance Lease
10,666,128 11,815,648
2 Bank Charges
7,199,951 1,171,843
TOTAL
17,866,079 12,987,491

Aggregate Revenue Requirement, Expected Revenue from Charges & Tariff Petition FY 2012-13
Electricity Department, Puducherry 79
Schedule 2 - Fixed Assets Schedule for FY2010-11
Gross Block Depreciation
Net Block
Ass
ets
gro
up
nu
mb
er
Ass
ets
gro
up
des
crip
tio
n
Op
enin
g b
alan
ce*
Ad
dit
ion
s d
uri
ng
the
per
iod
Ded
uct
ion
s fo
r
per
iod
Co
st a
t th
e en
d o
f
the
year
Op
enin
g b
alan
ce
Dep
reci
atio
n o
n
Op
enin
g B
alan
ce
Dep
reci
atio
n o
n
add
itio
ns
du
rin
g th
e
per
iod
Dep
reci
atio
n f
or
the
year
Dep
reci
atio
n o
n
Ded
uct
ion
s d
uri
ng
the
per
iod
Tota
l at
the
end
of
the
year
At
the
end
of
curr
ent
year
At
the
end
of
pre
vio
us
year
1 Land and land
rights
Sub Stations 52,138,000 - - 52,138,000 - - - - - - 52,138,000 52,138,000
Other 328,000 - - 328,000 - - - - - - 328,000 328,000
2 Buildings
Sub Stations 89,175,000 437,000 - 89,612,000 31,752,720 2,937,697 14,596 2,952,293 - 34,705,013 54,906,987 57,422,280
Other 70,979,922 450,000 - 71,429,922 27,490,884 2,145,647 15,030 2,160,677 - 29,651,561 41,778,361 43,489,038
3 Plant and
machinery
Sub Stations 1,404,290,876 82,343,532 - 1,486,634,408 733,298,863 60,145,736 4,347,738 64,493,475 - 797,792,338 688,842,070 670,992,013
Transformers 292,384,487 30,230,164 - 322,614,650 93,366,222 15,111,414 1,596,153 16,707,567 - 110,073,788 212,540,862 199,018,265
4 Lines and cable
network
Sub Station and
Others 2,233,081,697 383,945,332 - 2,617,027,029 1,057,953,810 95,482,600 20,272,314
115,754,91
3 - 1,173,708,723 1,443,318,306 1,175,127,887
5 Vehicles
Sub Station and
Others 29,975,300 46,000 - 30,021,300 23,207,582 872,488 4,370 876,858 - 24,084,440 5,936,860 6,767,719
6 Furniture and
fixtures
Sub Station and
Others 668,029 299,068 - 967,097 467,723 27,299 18,931 46,230 - 513,953 453,144 200,306
7
Office
equipment
(Office
equipment,
telephones &
Telephone lines,
Radio and high
frequency carrier
system (VHF))
Sub Station and
Others 17,569,000 100,000 - 17,669,000 12,961,322 568,472 6,330 574,802 - 13,536,124 4,132,876 4,607,678

Aggregate Revenue Requirement, Expected Revenue from Charges & Tariff Petition FY 2012-13
Electricity Department, Puducherry 80
Schedule 2 - Fixed Assets Schedule for FY2010-11
Gross Block Depreciation
Net Block
Ass
ets
gro
up
nu
mb
er
Ass
ets
gro
up
des
crip
tio
n
Op
enin
g b
alan
ce*
Ad
dit
ion
s d
uri
ng
the
per
iod
Ded
uct
ion
s fo
r
per
iod
Co
st a
t th
e en
d o
f
the
year
Op
enin
g b
alan
ce
Dep
reci
atio
n o
n
Op
enin
g B
alan
ce
Dep
reci
atio
n o
n
add
itio
ns
du
rin
g th
e
per
iod
Dep
reci
atio
n f
or
the
year
Dep
reci
atio
n o
n
Ded
uct
ion
s d
uri
ng
the
per
iod
Tota
l at
the
end
of
the
year
At
the
end
of
curr
ent
year
At
the
end
of
pre
vio
us
year
8 IT equipments
(Computers etc.)
Sub Station and
Others 16,040,413 252,000 - 16,292,413 11,922,440 748,675 37,800 786,475 - 12,708,915 3,583,498 4,117,973
9
Testing
&Measuring
Equipments
Sub Station and
Others 71,604,900 10,545,000 - 82,149,900 26,956,313 3,496,236 556,776 4,053,012 - 31,009,325 51,140,575 44,648,587
10 SCADA Centre
Sub Station and
Others 243,640,331 - - 243,640,331 105,180,221 12,864,209 - 12,864,209 - 118,044,431 125,595,900 138,460,110
Total 4,521,875,954 508,648,096 - 5,030,524,050 2,124,558,100 194,400,474 26,870,037
221,270,51
1 - 2,345,828,611 2,684,695,439 2,397,317,854

Aggregate Revenue Requirement, Expected Revenue from Charges & Tariff Petition FY 2012-13
Electricity Department, Puducherry 81
1.1.1.1 (12) SIGNIFICANT ACCOUNTING POLICIES AND NOTES TO ACCOUNTS FORMING PART OF THE
FINANCIAL STATEMENT FOR THE YEAR ENDED MARCH 31, 2011
Background
11.1 Puducherry Electricity Department (PED) is a part of the Government of Puducherry. It is responsible for
distribution and supply of electricity in Puducherry, Karaikal, Mahe and Yanam regions of the Union Territory of
Puducherry. PED is governed by the Electricity Act 2003, as a deemed licensee.
11.2 After the enactment of The Electricity Act 2003, it is mandatory for all electricity utilities to file their Annual
Revenue Requirement and Tariff Proposal in the form of a petition before the respective State Electricity
Regulatory Commission. The Commission after hearing all the stake holders, issues an appropriate order on the
ARR and Tariff Proposal. The Department had filed its first proposal for tariff fixation /revision for the year 2009-
10 and a Tariff Order was passed in February 2010.
11.3 Being a Government Department, the PED it maintains its books of accounts as per the Government system of
accounting, which essentially is cash based and to some extent a partial system of single and double entry
accounting. In other words, as typical to any other entity that maintains its accounts based on a commercial
accounting system, the PED does not prepare a Profit & Loss Account, Balance Sheet and Cash Flow Statements at
the end of the year. Further since there is no concept of Balance Sheet, the fixed assets are not capitalized and
fixed assets records are not kept in the manner required as in the case of any commercial organization.
11.4 In the Tariff Order which was passed in February 2010, the JERC had given a directive to the PED that it must
prepare separate Financial Statements and get the same audited. The Department is directed to prepare
Accounting Statements which includes balance sheet, profit and loss account, cash flow statement, report of the
auditors, etc., together with notes and such other supporting statements and submit the same along with the
next ARR and Tariff Petition.
11.5 It may be noted that the PED still continues to be a department of the Government of Puducherry and therefore
as of date still continues to maintain its books of accounts as per the Government system of accounting. This
would continue to be the case, till such time the PED is corporatized into a separate entity under the Companies
Act 1956. Therefore, the Financial Statements attached as a part of this ARR petition have been prepared solely
for the purposes of complying with the JERC’s directives and must be read and interpreted in that context.
11.6 The paragraphs below outline the methodology adopted for the preparation of the Financial Statements. As
indicated above, the base records continue to be the cash based Government system of accounting and books of
accounts maintained therein. Several adjustments have been carried out to the base amounts indicated in the
Government system of accounts to arrive at the Profit and Loss Account, Balance Sheet and Cash Flow Statement
for the financial years 2009-10 and 2010-11. These will continue to be done till such time the corporatization of

Aggregate Revenue Requirement, Expected Revenue from Charges & Tariff Petition FY 2012-13
Electricity Department, Puducherry 82
the PED is carried out. At that point of time, the corporatized entity will adopt the new commercial basis of
accounting and carry out the process of first time conversion in its maintenance of its basic books of accounts on
accrual basis,
Basis of the Financial Statements
11.7 The Department prepares its annual receipts and expenditure statement on cash basis, which is audited by the
state unit of the Comptroller and Auditor General. These audited amounts are compiled across all departments by
the Department of Treasury, Government of Puducherry and the Audited State Annual Accounts of the
Government of Puducherry are prepared and published. On its part, the Electricity Department reconciles its
annual receipts and expenditure statements (called as financial progress statements) with the Department of
Treasury. Since the published Audited State Annual Accounts is prepared for the State as whole (taking all
departments across the Government), some of the account heads and amounts pertaining to the Electricity
Department are rolled up at a higher level. However the financial progress statements (duly reconciled with the
Department of treasury) contain details of all the account heads used by the Electricity Department. Thus it may
be noted that the detailed head wise amounts as per the financial progress statements (which are on cash
basis) are duly reconciled with the Department of Treasury and form part of published Audited State Annual
Accounts by the CAG of India.
11.8 The above duly reconciled and audited figures on cash basis have formed the base documents for the compilation
of the financial statements. The amounts reported in these financial progress statements are adjusted to reflect
the accrual basis of accounting and other adjustments required for conforming to Generally Accepted Accounting
Principles. Therefore, whereas the amounts as per the financial progress statements are audited numbers as
indicated above, the adjustments have made to these numbers based on a detailed review and scrutiny of the
cash based accounts by the PED. The adjustments made to the cash based accounts to convert into commercial
accounting based financial statements have not been audited and to that extent, the Financial Statements could
be considered as unaudited. The Department is also currently in the process of appointing an auditor for auditing
these financial statements who will audit the adjustments made to the audited cash based numbers and provide
an audit report.
11.9 For the purposes of building the opening balance sheet, and the fixed assets schedule, the Audited State Annual
Accounts of the Government of Puducherry from the year 1990-91 have been considered as the starting point. It
is assumed that all capital expenditure incurred on assets except for land and building procured prior to 1990-91
would have been almost fully depreciated by the year 2009-10 and therefore do not impact the opening balance
sheet of the Department as on 1st April 2009

Aggregate Revenue Requirement, Expected Revenue from Charges & Tariff Petition FY 2012-13
Electricity Department, Puducherry 83
Revenue Recognition
11.10 Revenue from sale of power is accounted on accrual basis. The sale of power is as per the tariff fixed by concerned
authority. Revenue is accounted for on the basis of demand bills raised on the consumers of the Union Territory
of Puducherry. Revenue for the year is also adjusted for the un-billed revenue of the previous year and current
year on estimated basis. Revenue from sale of power is recognized net of sales tax/value added tax.
Fixed Assets
11.11 All Fixed Assets are stated at cost less accumulated depreciation. The cost of fixed assets shall include cost
incurred/money spent in acquiring or installing or constructing fixed asset, salary cost of the employees who are
deployed on the project / work.
11.12 Any addition to or improvement to the fixed asset that results in increasing the utility or useful life of the asset
shall be capitalized and included in the cost of fixed asset.
11.13 Any Fixed Asset, which has been acquired free of cost or in respect of which no payment has been made, is
recorded at NIL value. Cost of land improvements such as leveling, filling or any other developmental activity is
capitalized as a part of the cost of building.
11.14 Transmission network assets (Sub Stations and transmission lines) are capitalized in the year of commissioning.
Distribution network assets are capitalized in the year in which the expenditure is incurred. All costs are taken at
net of devolution. Devolution is the process by which materials are transferred to the store at a reduced rate and
later reissued at a weighted average rate of all such items. Storage at 2.5% of material costs and supervision
charges at 17% of total costs are capitalized as overhead allocations.
11.15 Fixed Assets are eliminated from the financial statement, either on disposal or on retirement from active use or
on becoming redundant. Generally, such assets are disposed off thereafter as per the policy of the department
Depreciation
11.16 The CERC has notified the rates of depreciation on fixed assets with effect from 01.04.2009.as per Notification No.
L-7/145/160/2008-CERC dated 19.01.2009 and the same have been adopted by the department in calculating the
depreciation on fixed assets.
11.17 Based on the above, the depreciation is calculated at following rates:
Description of Assets Rate of
Depreciation
Land and Land Rights - -
Building 3.34%
Plant and Machinery 5.28%
Lines and Cables 5.28%

Aggregate Revenue Requirement, Expected Revenue from Charges & Tariff Petition FY 2012-13
Electricity Department, Puducherry 84
Office Equipment 6.33%
IT Equipment 15.00%
Vehicles 9.50%
Furniture and Fixtures 6.33%
11.18 Depreciation is calculated annually based on straight-line method over the useful life of the asset under historical
cost. For the purpose of these financial statements, all purchases are considered to be at the beginning of the
year and all disposals are assumed to be at the end of the year. The residual value of all the assets is considered as
10%.
Capital Work in Progress
11.19 Materials issued to Capital Works in progress are valued at cost of purchase. Capital work in progress includes the
stock of material received under Direct Debit to works as well as material at site and proportionate storage and
supervision charges on the material issued for the works. The sub-station related assets are capitalized in the year
of commissioning.
Inventory
11.20 Inventories, stores and spares are valued at the cost and cost is determined based on the Weighted Average Cost.
Inventories issued to the Sections under various Schemes / Work / Project are considered as consumed at the
time of issue. The closing inventory as on year end with the section are added back to the inventory by reversing
the consumption
Salary Costs and Retirement Benefits
11.21 Salary and other cost (other than retirement benefits) are recognized on accrual basis. The retirement benefits
other than Pension are recognized on ‘Pay As You Go’ basis. Pension payment is managed by the Government so
the department does not account for the same in the accounts.
Provision for Bad and Doubtful debts
11.22 No provision for bad and doubtful debts has been made in the accounts as the reconciliation of the sundry
debtors is in progress. On completion, the management will decide on the policy for provisioning for bad and
doubtful debts and accordingly give effect of the same in the accounts in the financial year in which the process of
reconciliation is completed.
Consumer Contribution
11.23 Contribution received from consumers towards assets / works is disclosed as liabilities net of capital expenditure
incurred till year end under Deposit Works. In case of completed works, the respective fixed assets
created/acquired partly/wholly from consumer contribution, are accounted net of the consumer contribution.

Aggregate Revenue Requirement, Expected Revenue from Charges & Tariff Petition FY 2012-13
Electricity Department, Puducherry 85
Power Purchase
11.24 Power purchase costs are accounted based on the total number of units purchased upto the year end from the
Power Generators allocated to PED by the Ministry of Power, Government of India. The Power purchase cost is
net of rebates received on account of advance and / or prompt payments made by the department
Finance Lease
11.25 Assets taken on finance lease are accounted for as fixed assets. Accordingly, the assets are accounted at the
values certified by the developer. Lease payments are apportioned between finance charge and outstanding
liability. Interest expenses on the outstanding amount is recognized in the Profit and Loss account as period cost
Use of estimates
11.26 The preparation of financial statements requires the management of the department to make estimates and
assumptions that affect the reported balance of assets and liabilities, revenues and expenses and disclosures
relating to the contingent liabilities. The management believes that the estimates used in preparation of the
financial statements are prudent and reasonable. Future results could differ from these estimates. Any revision to
accounting estimates is recognized prospectively in the current and future periods. Examples of such estimates
include unbilled revenue, etc.
PART B: NOTES FORMING PART OF ACCOUNTS
(1) Contingent Liabilities :
(a) In respect of purchase of power from the Tamil Nadu Electricity Board (TNEB), the power availed are
charged at the rate paid by TNEB to NLC plus wheeling charges. The TNEB has revised the tariff to Rs.3.00
per kWh with effect from 01/12/2001 treating PED as a HT consumer. The PED has challenged this decision
by filing a petition before Hon’ble TNERC. The Hon’ble TNERC concluded that the sale of power between
PED and TNEB was in the nature of interstate sale of power and PED cannot be treated as a HT consumer
and ordered to maintain Status quo. The PED has challenged this in the Hon’ble High Court of Judicature, at
Madras and stay was granted and the Hon’ High Court directed payment to TNEB at the rate charged by NLC
plus wheeling charges. The PED made the payment accordingly. The matter is still pending with the High
Court. The estimated differential amounts, which would be outstanding as on the respective dates, if the
revised tariff as sought by the TNEB , is approved by the Hon’ High Court are as follows :
Particulars As on 31.03.2010 As on 31.03.2011
Estimated Differential Amount
Rs.290.33 Crores Rs.333.92 Crores
(b) Details of Unexpired Letters of Credit (L/Cs) are as follows :
Name of the Generating Station
Value of the L/C As on 31.03.2011
Rs. Crores
Expiry Date Value of the L/C As on 31.03.2010
Rs. Crores
Expiry Date

Aggregate Revenue Requirement, Expected Revenue from Charges & Tariff Petition FY 2012-13
Electricity Department, Puducherry 86
NPCIL - MAPS Rs.0.50 10/11/2011 Rs.0.50 10/11/2010 NPCIL - Kaiga Rs.2.50 10/09/2011 Rs.2.50 10/9/2010 PGCIL Rs.5.00 10/12/2011 Rs.5.00 10/12/2010 NTPC Rs.33.96 10/28/2011 Rs.24.82 10/2/2010
Rs.36.91 10/02/2011 Rs.28.74 2/15/2011 Total Rs.78.87 Crores Rs.61.56 Crores
(2) A Trial Balance for the period ended 31.03.2009 under Cash Method of Accounting has been prepared based on
the abstract financial statement prepared from the Audited State Financial Accounts from Financial Year 1990 –
1991 to Financial Year 2008 – 2009. This trial balance has been adjusted for the changes upto 31.03.2009 to
arrive at the Opening Trial Balance as on 01.04.2009 as per the accrual method of accounting. The adjustments
include provision for outstanding liabilities, accruing of receivables, accounting for unbilled revenue, accounting
for loans and advances, capitalisation of expenditure etc.
(3) For the purpose of Fixed Assets Schedule, the total amount spent under major works and salaries sub-heads for
plan expenditure have been cumulated from the year 1990 -1991 to arrive at the opening gross and net block of
fixed assets as on 01.04.2009 after making appropriate adjustments for capitalisation of assets as per generally
accepted accounting principles
There was an un-reconciled difference in the total capital cost between the identified assets and the
expenditure as per the Audited State Financial Accounts for the year 1990 – 1991 amounting to Rs. 21.46 crore
and the same has been adjusted as fixed assets addition for the year 1990 - 1991. Further, there is a un -
reconciled difference of Rs. 3.74 crore between total capital cost as per the State Accounts and Fixed Assets
Schedule as on 31.03.2009 and the same has been debited in the Government Fund account. During the year,
there is an additional un – reconciled difference of Rs. 0.09 crore (Rs. 0.73 crore previous year) between Fixed
Asset Schedule and balance as per the Financial Progress Statement which is credited in the Fixed Assets
Adjustment account in the Balance Sheet. This would be reconciled and will be adjusted in the same account
subsequently
(4) In the financial year 2002 – 2003, the Department had entered into a finance lease with the Power Grid
Corporation of India Ltd. (PGCIL) for development of System Control Centre. The total amount incurred for the
development of the centre is Rs. 24.36 crore, of which Rs. 23.07 crore has been covered under the finance lease.
The liability towards the finance lease transaction has been shown as a Secured Loan in the Financial Statement.
(5) The current year financial statement is prepared based on the duly reconciled Financial Progress Statement with
the Department of Accounts and Treasury after making appropriate adjustments for conversion into accrual
based accounts.
(6) The Sundry Debtors outstanding are calculated based on the following formula: Opening Balance + Billing for the
Year – Collection during the Year. There is an un-reconciled difference of Rs. 46.65 crore as on 31.03.2011
between the arrears details given by the department and balance as per the above method

Aggregate Revenue Requirement, Expected Revenue from Charges & Tariff Petition FY 2012-13
Electricity Department, Puducherry 87
(7) The Stock in-hand includes goods in-transit of Rs. 0.17 crore as on the year end. Further there is an un-
reconciled balance of Rs. 0.48 crore and Rs. 2.64 crore between the Stock register maintained by the PED Store
Department and balance as per State Accounts as on 31.03.2010 and 31.03.2011 respectively.
It also includes stock of Rs. 0.93 crore (on revenue account) lying with the various sections.
(8) Investment in Puducherry Power Corporation Limited, a power generating company, is in the name of the
Government of India; however the related shares are in the custody of PED. PED acts as the custodian of the
shares. Hence, these shares are not considered as an investment of the PED.
(9) Consumers provide security deposits either in the form of cash or FDR or Bank Guarantee. As on 31.03.2011,
the department is holding FDR of Rs. 52.53 crore and Bank Guarantee of Rs. 33.20 crore as security deposits.
The amount received in the form of cash is deposited with the DAT in K Deposit account and the total amount
outstanding on account of security deposit is included in the Consumer Deposit account disclosed in the
Schedule 6 of the Balance Sheet
As per the guideline issued by JERC, PED needs to provide interest on the deposits taken from the consumers.
However, PED has not made any provision for the interest in the accounts on the deposit amount because the
total amount outstanding on account of Security Deposits is not ascertainable. The department is in the process
of reconciling the deposit account to ascertain the liability toward the security deposit and the provision will be
made once the liability is determined
(10) Value Added Tax (sales tax) on sale of power became applicable to PED with effect from 7th November 2009.
PED charges the tax on sale of power to the various consumers as per the provision of the relevant act and pay it
to the commercial tax department accordingly. The PED recognizes the sales tax liability in the accounts on
collection basis and pays to the commercial department within seven days of the next month. The DAT was
settling the sale tax liability with the Commercial Tax Department upto August 2010. Therefore no amount was
shown as outstanding on account of Sales Tax as on 31.03.2010. With effect from September 2010 onwards, PED
has to settle the value added tax liability with the Commercial Tax department. The amount which is collected
from the consumers and not paid to the Commercial Tax department is shown as a Liability in the Balance Sheet
(11) Power Purchase invoices, debit and credit notes have been received from Power Generating Companies in the
financial year 2011-12 which include items pertaining to prior financial years. These bills are raised in the year
2011 – 2012 because of the orders passed by the respective regulatory commissions governing the respective
generating stations or due to the refunds / liabilities arising to the generating station on account of tax
assessments, etc., which have to be recovered from the PED. The department is in the process of checking and
verifying the same. These will be accounted in the financial year 2011-12 as they relate to liabilities which have
crystallized only in the financial year 2011-12. The generating stations from whom such invoices, debit and
credit notes are received are as follows:

Aggregate Revenue Requirement, Expected Revenue from Charges & Tariff Petition FY 2012-13
Electricity Department, Puducherry 88
Power Generating Company Value of Invoices/Debit Notes/Credit
Notes (Rs. Crores)
Neyveli Lignite Corporation (NLC) Rs. 62.78 Crores Power Grid Corporation of India Limited (PGCIL)
Rs. 14.92 Crores
National Thermal Power Corporation (NTPC)
Rs. (16.35) Crores
(12) PED, in April 2011, had petitioned the Hon’ble JERC to enable it to recover the increase in fuel prices for the
period April 2010 to March 2011, from its consumers. The Hon’ble JERC has approved the same through its
order issued in August 2011 and allowed it to recover an amount of Rs. 46.4 crore as fuel adjustment charges
over a period from September 2011 to March 2011. This recovery will be accounted in the financial year 2011-
12, the year in which the same has been crystallized.
(13) The Electricity Department has been accounting for procurement of office equipment, furniture, IT equipment
and motor vehicles under O&M and Administration & General expenses heads. Since this constitutes fixed
assets, the expenditure capitalized and not charged to the Profit and Loss account are as follows:
Salary Expenses: Rs. 17.44 crore (Rs. 7.73 crore previous year)
Operations and Maintenance Expenditure: Rs. 1.79 crore (Rs. 0.86 crore previous year)
Administration and General Expenses: Rs. 0.06 crore (Rs. 0.14 crore previous year)
(14) Total collection from Sundry Debtors includes Rs. 0.22 as on 31.03.2011 and Rs. 0.56 crore as on 31.03.2010 as
Cash In-hand. Similarly, it also includes Rs. 0.62 crore as on 31.03.2011 and Rs.0.34 crore as on 31.03.2010 as
Cheque In-hand
(15) The sale of power for the year includes Rs. 57.33 crore as Un-billed revenue and same is debited in Un-Billed
Debtors account in Balance Sheet. It also includes UI income for the year of Rs. 87.05 crore
The subsidy on sale of Power for the year is Rs. 1.51 crore (previous year Rs. 0.16) and included in the sale of
power
(16) Total interest expense for the year on the lease transaction is Rs. 1.07 crore (Rs.1.18 crore previous year). It is
net of Rs. 0.07 crore received as rebate for early / prompt payment of Outstanding Loan on account of Finance
Lease
(17) The previous year figures are regrouped or reclassified in the financial statement wherever required

Aggregate Revenue Requirement, Expected Revenue from Charges & Tariff Petition FY 2012-13
Electricity Department, Puducherry 89
Annexure 2 – Regulatory formats

Aggregate Revenue Requirement, Expected Revenue from Charges & Tariff Petition FY 2012-13
Electricity Department, Puducherry 90
Table 57: F1 - Energy demand
Description Consumers
[No]
Connected load [HP /
kVA]
Sales [MU]
Consumers [No]
Connected load [HP /
kVA]
Sales [MU]
Consumers [No]
Connected load [HP /
kVA]
Sales [MU]
LT
Domestic 236,881
508.3 252,452
563.1 264,992
620.0
Hut services 38,966
10.2 35,447
9.3 35,447
9.3
Commercial 40,531
156.3 41,854
172.1 43,156
184.9
Agriculture 6,810 59,538 76.7 6,810 59,538 76.7 6,810 59,538 76.7
Public lighting 48,167
22.1 48,280
23.4 49,438
26.0
Industrial 5,897
114.5 6,028
124.9 6,154
134.1
Water tanks 58
35.2 58
35.2 58
35.2
Temporary supply
7.9
22.6
25.0
Total LT 377,310 59,538 931.2 390,928 59,538 1,027.5 406,055 59,538 1,111.3
HT
Industrial 394 263,839 1,005.7 403 245,630 1,016.3 412 250,492 1,027.3
State & Central government establishments
41 13,308 34.9 41 14,265 37.3 41 14,265 39.7
Industrial Extra High Tension
7 72,910 237.4 7 80,495 236.5 7 80,495 236.2
Temporary supply
Total HT 442 350,058 1,278.0 451 340,390 1,290.0 461 345,252 1,303.2
Total metered 331,976
2,122.3 349,122
2,231.4 364,258
2,328.5
Total unmetered 45,776
87.0 42,257
86.1 42,257
86.1
Total 377,752
2,209.3 391,379
2,317.5 406,515
2,414.5

Aggregate Revenue Requirement, Expected Revenue from Charges & Tariff Petition FY 2012-13
Electricity Department, Puducherry 91
Table 58: F2 - AT&C losses
Particulars Units FY2010 - 11
(Actuals)
FY2011 - 12
(Revised Estimate)
FY2012 - 13 (Projection)
Generation (Connected Generation – PPCL) MU 182.8 242.9 242.9 Metered Import at interface point MU 2,635.8 2,868.8 2,942.6 Sale through Unscheduled Interchange MU 262.4 433.4 398.9 Energy available for sale within the UT MU 2,556.2 2,678.3 2,786.5 Metered Sales MU 2,122.3 2,231.5 2,328.5 Unmetered Sales MU 87.0 86.1 86.1 Total energy sold MU 2,209.3 2,317.5 2,414.5 Revenue from sales within UT Rs 630.8 696.6 675.9 Amount realized by billed sales Rs 591.7 653.4 648.86 Collection efficiency % 93.8% 93.8% 96.0% Energy realized MU 2,072.2 2,173.7 2,317.9 Distribution Loss % 13.57% 13.47% 13.35% AT&C Loss % 18.93% 18.84% 16.82%
Table 59: F3 - Energy balance
Item FY2010 - 11
(Actuals)
FY2011 - 12 (Revised Estimate)
FY2012 - 13 (Projection)
ENERGY REQUIREMENT
Metered sales 2,122.3 2,231.4 2,328.5
Unmetered sales 87.0 86.1 86.1
Total sales within the UT 2,209.3 2,317.5 2,414.5
Sales – UI 262.4 433.4 398.9
Total sales 2,471.7 2,750.9 2,813.5
T&D losses
% 13.57% 13.47% 13.35%
MU 346.9 360.8 372.0
Total energy requirement 2,818.6 3,111.7 3,185.5
ENERGY AVAILABILITY
Net thermal generation (Own+ IPP + Share from Central Stations)
2,317.7 2,581.0 2,658.2
Power Purchased from
Common pool / UI 19.2 10.0 -
Traders
PX
Others 630.5 665.3 676.3
Net power purchase 2,967.4 3,256.3 3,334.4
Energy availability @ periphery 2,818.2 3,111.7 3,185.5

Aggregate Revenue Requirement, Expected Revenue from Charges & Tariff Petition FY 2012-13
Electricity Department, Puducherry 92
Table 60: F4 - Power purchase cost - FY2010-11 (Actual)
Source Capacity
[MW]
Firm Allocation to Licensee
Generation [MU]
PLF [%]
AFC [Rs. Cr]
Licensee share
[%]
Purchase [MU]
External
Losses [%]
Energy received [MU]
VC [Rs/kWh]
Fixed Char
ge [Rs Crs]
VC [Rs Crs]
Others
[Rs Crs]
Total [Rs Crs]
% MW
NLC
TS II Stage I&II 1,470.0 7.2% 105.4 10,688.1 83.0% 301.8 7.2% 650.9 5.0% 618.3 1.75 22.3 78.76 13.1 114.1
TS I Expn 420.0 4.2% 17.8 3,018.3 82.0% 393.2 4.2% 113.6 5.0% 108.0 2.86 14.5 17.24 0.7 32.5
Sub-Total (NLC) 1,890.0
123.2 13,706.4
694.9 764.5
726.3 1.92 36.8 96.00 13.8 146.6
NTPC
Ramagundam STPS Stage I & II 2,100.0 4.8% 100.0 17,263.7 93.8% 460.8 4.8% 659.7 5.7% 622.1 2.00 19.6 79.64 32.8 132.0
Ramagundam STPS Stage III 500.0 5.0% 25.2 4,160.8 95.0% 303.0 5.0% 175.4 5.7% 165.4 2.58 13.7 19.32 12.2 45.2
Talcher STPS Stage II 2,000.0 3.9% 77.2 15,769.6 90.0% 957.9 3.9% 510.4 5.7% 481.3 2.50 35.2 56.89 35.3 127.4
NTPC-ER 3,440.0 2.2% 75.7
1232.5 2.2% 54.8 5.7% 51.6 3.03 3.0 9.81 3.8 16.6
Sub-Total (NTPC) 8,040.0
278.0 37,194.1
2953.8 1,400.3
1,320.4 2.29 71.4 165.66 84.1 321.1
NPC
Madras APS 440.0 1.8% 7.9 2,239.2 53.1% - 1.8% 29.4 6.0% 27.6 1.87 - 5.50 0.7 6.2
Kaiga APS Stage I 440.0 4.2% 18.7 3,873.0 55.1% - 4.2% 121.1 5.7% 114.1 2.87 - 34.79 5.1 39.9
Sub-Total (NPC) 880.0
26.6 6,112.2
- 150.5
141.8
- 40.28 5.8 46.1
Other Sources
Others
TNEB (Pondy)
86.0 4.2% 82.3 1.91
16.46 - 16.5
TNEB (Karaikal)
324.9 4.0% 311.9 1.91
62.20 - 62.2
PPCL 32.5 100.0% 32.5 195.5 68.7% 100.0% 182.8 0.0% 182.8 3.06
31.44 24.5 55.9
KSEB
33.4 0.0% 33.4 3.36
11.22 - 11.2
UI
19.2 0.0% 19.2 0.70
1.3
Sub-Total (Other Sources) 32.5
32.5
646.3
629.7
- 121.32 24.5 147.1
Other Charges
PGCIL
61.2
Total 10,842.5
460.2 57,012.8
2,961.6
2,818.2
108.2 423.26 128.1 722.1
Additional payment due to True-up
17.5
Rebate
12.3
Net PP cost
727.3

Aggregate Revenue Requirement, Expected Revenue from Charges & Tariff Petition FY 2012-13
Electricity Department, Puducherry 93
Table 61: F4 - Power purchase cost - FY2011-12 (Revised estimate)
Source Capacity
[MW]
Firm Allocation to Licensee Generati
on [MU] PLF [%]
AFC [Rs. Cr]
Licensee Share
[%]
Purchase [MU]
External Losses
[%]
Energy received [MU]
VC [Rs/kW
h]
Fixed Char
ge [Rs Crs]
VC [Rs Crs]
Others [Rs Crs]
Total [Rs Crs] % MW
NLC
TS II Stage I 630.0 12.30% 77.6 4,425.5 80.20% 214.22 10.82% 479.3 5.00% 455.3 1.93 26.3 85.4 2.9 114.6
TS II Stage II 840.0 3.80% 31.6 6,171.7 83.90% 297.46 3.21% 196.0 5.00% 186.2 1.93 11.3 34.9 1.2 47.4
TS I Expn 420.0 4.20% 17.7 2,999.6 81.50% 378.09 3.77% 113.3 5.00% 107.6 1.80 15.9 20.4 0.7 37.0
Sub-Total (NLC) 1,890.0
126.8 13,596.8
788.6
749.2
53.5 140.7 4.7 199.0
NTPC
Ramagundam STPS Stage I & II
2,100.0 5.20% 108.4 17,213.1 93.60% 771.06 4.45% 760.5 5.00% 722.5 1.60 40.1 106.0 20.0 166.2
Ramagundam STPS Stage III 500.0 5.40% 27.2 4,296.5 98.10% 328.01 4.70% 203.4 5.00% 193.2 1.71 17.7 29.9 6.2 53.8
Talcher STPS Stage II 2,000.0 4.00% 79.0 15,926.3 90.90% 1,092.02 3.54% 556.7 5.00% 528.9 2.35 43.7 105.8 26.9 176.4
Simhadri 500.0 1.85% 5.3 3,407.6 77.80% 567.07 1.85% 63.0 5.00% 59.9 2.65 10.5 16.7
27.2
Sub-Total (NTPC) 5,100.0
219.9 40,843.6
1,583.6
1,504.5
112.0 258.5 53.1 423.6
NPC
Madras APS 440.0 1.90% 8.4 2,046.0 53.10% 1.44% 29.6 5.00% 28.1 1.79 - 5.3 0.1 5.4
Kaiga APS Stage I 880.0 4.40% 39.0 4,244.8 55.10% 4.19% 179.2 5.00% 170.2 2.80 - 50.1 10.7 60.8
Sub-Total (NPC) 1,320.0
47.4 6,290.8
208.8
198.4
- 55.4 10.7 66.2
Other Sources
Others
TNEB (Pondy)
61.5 4.00% 59.0 1.91 - 11.8 0.0 11.8
TNEB (Karaikal)
328.6 4.00% 315.5 1.91 - 62.9 0.0 62.9
PPCL 32.5 100.00% 32.5 257.0 87.00% 242.9 0.00% 242.9 1.91 25.2 44.9 11.8 81.9
KSEB
32.3 0.00% 32.3 3.16 2.0 10.2 0.1 12.2
UI
10.0
10.0 0.70 - 0.7 - 0.7
Sub-Total (Other Sources) 32.5
32.5 257.0 0.9 675.3
659.7
27.1 130.4 11.9 169.5
Other Charges
PGCIL
78.2
Total 8,342.5
426.6 60,988.2
3,256.3
3,111.7
192.6 585.1 80.5 936.5
Additional payment due to
60.4

Aggregate Revenue Requirement, Expected Revenue from Charges & Tariff Petition FY 2012-13
Electricity Department, Puducherry 94
True-up
RPO compliance cost
17.0
Rebate
16.6
Net PP cost 997.3
Table 62: F4 - Power purchase cost - FY2012-13 (Projected)
Source Capacity
[MW]
Firm Allocation to Licensee Generatio
n [MU] PLF [%]
AFC [Rs. Cr]
Licensee Share
[%]
Purchase [MU]
External Losses
[%]
Energy received [MU]
VC [Rs/kW
h]
Fixed Charge [Rs Crs]
VC [Rs Crs]
Others [Rs Crs]
Total [Rs Crs] % MW
NLC
TS II Stage I 630.00 12.32% 77.62 4,503.34 81.60% 229.9 10.82% 487.35 5.00% 463.0 1.93 28.3 93.8 2.875 125.0
TS II Stage II 840.00 3.76% 31.58 6,140.58 83.45% 306.1 3.21% 197.12 5.00% 187.3 1.93 11.5 38.0 1.2 50.7
TS I Expn 420.00 4.21% 17.68 3,007.75 81.75% 371.2 3.77% 113.32 5.00% 107.7 1.80 15.6 20.4 0.7 36.7
Sub-Total (NLC) 1,890.0
126.9 13,651.7 797.8
757.9
55.5 152.2 4.7 212.4
NTPC
Ramagundam STPS Stage I & II
2,100.0 5.16% 108.36 17,237.05 93.70% 809.0 4.45% 767.42 5.00% 729.0 1.58 41.7 120.9 4.5 167.1
Ramagundam STPS Stage III 500.0 5.44% 27.20 4,228.89 96.55% 326.0 4.70% 198.69 5.00% 188.8 1.54 17.7 30.6 1.1 49.4
Talcher STPS Stage II 2,000.0 3.95% 79.00 15,846.84 90.45% 1,101.6 3.54% 560.97 5.00% 532.9 2.63 43.5 147.6 3.7 194.8
Simhadri 500.0 3.69% 18.45 3,407.64 77.80% 567.1 1.85% 125.74 5.00% 119.5 2.65 20.9 33.3 1.0 55.2
Sub-Total (NTPC) 5,100.0
233.0 40,720.4 1,652.8
1,570.2
123.9 332.4 10.2 466.6
NPC
Madras APS 440.0 1.91% 8.40 2,046.69 53.10% 1.44% 29.42 5.00% 27.9 1.79 - 5.3 0.1 5.3
Kaiga APS Stage I 880.0 4.43% 38.98 4,247.55 55.10% 4.19% 178.14 5.00% 169.2 2.80 - 49.8 10.7 60.5
Sub-Total (NPC) 1,320.0
47.4 6,294.2 207.6
197.2
- 55.1 10.8 65.8
Other Sources
Others
TNEB (Pondy)
0.00 0.00 73.75 4.00% 70.8 1.91
14.1 0.0 14.1
TNEB (Karaikal)
0.00 0.00 326.75 4.00% 313.7 1.91
62.5 0.0 62.6
PPCL 32.50 100.00% 32.50 257.00 87.00% 25.2 100.0% 242.90 0.00% 242.9 1.91 25.17 46.4 11.8 83.4
KSEB
0.00 0.00
32.85 0.00% 32.9 3.16 2.0 10.4 0.1 12.5
UI
0.0
0.0

Aggregate Revenue Requirement, Expected Revenue from Charges & Tariff Petition FY 2012-13
Electricity Department, Puducherry 95
Sub-Total (Other Sources) 32.5
32.5 257.0
676.3
660.2
27.2 133.4 11.9 172.5
Other Charges
PGCIL
79.7
Total 8,342.5
439.8 60,923.3
3,334.4
3,185.5
206.5 673.2 37.7 997.0
Additional payment due to True-up
RPO compliance cost
18.5
Rebate
17.7
Net PP cost
997.8

Aggregate Revenue Requirement, Expected Revenue from Charges & Tariff Petition FY 2012-13
Electricity Department, Puducherry 96
Table 63: F6 - Return on capital base
Particulars FY2010 - 11
(Actuals) [Crs]
FY2011 - 12 (Revised
Estimate) [Crs]
FY2012 - 13 (Projection)
[Crs]
Gross block at beginning of the year 452.19 503.05 564.69
Opening CWIP 75.46 64.92 87.86
Working capital for the year 65.72 88.68 88.94
Less accumulated depreciation 212.45 234.57 259.65
Less accumulated consumer contribution - - -
Less opening debt 14.68 13.16 11.51
Net fixed assets at beginning of the year 366.25 408.92 470.33
Reasonable return @3% of NFA 10.99 12.27 14.11
Table 64: F7 - Original cost of fixed assets
Assets group
FY2010 - 11 (Actuals) [Crs] FY2011 - 12 (Revised
Estimate) [Crs] FY2012 - 13
(Projection) [Crs]
Opening balance
Addition during year
Closing balance
Addition during year
Closing balance
Addition during year
Closing balance
Transmission & Distribution
452.19 50.86 503.05 61.64 564.69 66.36 631.05
Others - - - - - - -
Total 452.19 50.86 503.05 61.64 564.69 66.36 631.05
Table 65: F8 - Capital works in progress
Particulars
FY2010 - 11
(Actuals) [Crs]
FY2011 - 12
(Revised Estimate)
[Crs]
FY2012 - 13 (Projection)
[Crs]
Opening balance 75.5 64.9 87.9
Add: New investments 40.3 84.6 97.5
Total 115.8 149.5 185.3
Less investment capitalized 50.9 61.6 66.4
Closing balance 64.9 87.9 119.0
Table 66: F9 - Interest capitalised
Interest Capitalized
FY2010 - 11
(Actuals) [Crs]
FY2011 - 12 (Revised Estimate)
[Crs]
FY2012 - 13 (Projection)
[Crs]

Aggregate Revenue Requirement, Expected Revenue from Charges & Tariff Petition FY 2012-13
Electricity Department, Puducherry 97
WIP 70.19 76.39 103.42
GFA at the end of the year 503.05 564.72 631.05
WIP+GFA at the end of the year 573.2 641.1 734.5
Interest(excluding interest on WCL)
1.15 1.02 0.95
Interest Capitalized - - -

Aggregate Revenue Requirement, Expected Revenue from Charges & Tariff Petition FY 2012-13
Electricity Department, Puducherry 98
Table 67: F10 - Loans for the year
FY2010 - 11 (Actuals) FY2011 - 12 (Revised Estimate) [Crs] FY2012 - 13 (Projections)
Particulars (source)
Op
enin
g
bal
ance
[C
rs]
Rat
e o
f in
tere
st [
%]
Ad
dit
ion
d
uri
ng
the
year
[C
rs]
Rep
aym
ent
du
rin
g th
e ye
ar [
Crs
]
Clo
sin
g
bal
ance
[C
rs]
Am
ou
nt
of
inte
rest
pai
d
[Crs
]
Op
enin
g
bal
ance
[C
rs]
Rat
e o
f
inte
rest
[%
]
Ad
dit
ion
d
uri
ng
the
year
[C
rs]
Rep
aym
ent
du
rin
g th
e
year
[C
rs]
Clo
sin
g
bal
ance
[C
rs]
Am
ou
nt
of
inte
rest
pai
d
[Crs
]
Op
enin
g b
alan
ce [
Crs
]
Rat
e o
f
inte
rest
[%
]
Ad
dit
ion
d
uri
ng
the
year
[C
rs]
Rep
aym
ent
du
rin
g th
e ye
ar [
Crs
]
Clo
sin
g
bal
ance
[C
rs]
Am
ou
nt
of
inte
rest
pai
d
[Crs
]
SLR Bonds
Non SLR Bonds
LIC
REC
Commercial Banks
Bills discounting
Lease rental 14.68 8.22% - 1.52 13.16 1.15 13.16 8.22% - 1.65 11.51 1.02 11.51 8.22
% - 1.77 9.74 0.95
PFC
GPF
CSS
Working capital loan
Others
Total 14.68
- 1.52 13.16 1.15 13.16
- 1.65 11.51 1.02 11.51
- 1.77 9.74 0.95
Add Govt. loan
-State Govt.
-Central Govt.
Total
Total (13+14) 14.68
- 1.52 13.16 1.15 13.16
- 1.65 11.51 1.02 11.51
- 1.77 9.74 0.95
Less capitalization
-
-
-
Net interest
1.15
1.02
0.95
Add prior period
Total interest
1.15
1.02
0.95
Finance charges
0.72
0.93
0.93
Total interest and finance charges
1.87
1.95
1.88

Aggregate Revenue Requirement, Expected Revenue from Charges & Tariff Petition FY 2012-13
Electricity Department, Puducherry 99
Table 68: F11 - Restructuring of outstanding loans
Source of loan
Amount of original
loan [Crs]
Old rate of interest
[%]
Amount already restructured
[Crs]
Revised rate of
interest [%]
Amount now being
restructured [Crs]
New rate of interest
[%]
Not applicable

Aggregate Revenue Requirement, Expected Revenue from Charges & Tariff Petition FY 2012-13
Electricity Department, Puducherry 100
Table 69: F12 - Assets & Depreciation Charge
Particulars Name of the
Assets
Rate of depreciation*
FY2010 - 11 (Actuals) [Crs] FY2011 - 12 (Revised Estimate) [Crs] FY2012 - 13 (Projections) [Crs]
Opening GFA
Depreciation charges
Accumulated depreciation
Opening GFA
Depreciation charges
Accumulated depreciation
Opening GFA
Depreciation charges
Accumulated depreciation
Transmission & Distribution
Land and land rights
0.0% 5.25 - - 5.25 - - 5.25 - -
Buildings 3.3% 16.02 0.51 6.44 16.10 0.51 6.95 16.10 0.54 7.48
Plant and machinery
5.3% 169.67 8.12 90.78 180.92 8.12 98.90 181.84 9.65 108.55
Lines and cable network
5.3% 223.31 11.58 117.37 261.70 14.56 131.93 322.41 20.47 152.41
Vehicles 9.5% 3.00 0.09 2.41 3.00 0.08 2.48 3.00 0.29 2.77
Furniture and fixtures
6.3% 0.07 0.00 0.05 0.10 0.00 0.06 0.10 0.01 0.06
Office equipment
6.3% 1.76 0.06 1.35 1.77 0.04 1.40 1.77 0.11 1.51
IT Equipments 15.0% 1.60 0.08 1.27 1.63 0.06 1.33 1.63 0.25 1.58
Testing & measuring
equipments
5.3%
7.16 0.41 3.10 8.21 0.40 3.50 8.21 0.43 3.93
SCADA centre 5.3% 24.36 1.29 11.80 24.36 1.29 13.10 24.38 1.29 14.39
Total 452.19 22.13 234.57 503.06 25.07 259.65 564.69 33.04 292.69
Others - - - - - -
Grand Total (i to vi)
452.19 22.13 234.57 503.06 25.07 259.65 564.69 33.04 292.69

Aggregate Revenue Requirement, Expected Revenue from Charges & Tariff Petition FY 2012-13
Electricity Department, Puducherry 101
Table 70: F13 - Advance against depreciation
Particulars
FY2010 - 11
(Actuals) [Crs]
FY2011 - 12
(Revised Estimate)
[Crs]
FY2012 - 13 (Projection)
[Crs]
1/10th of the Loan(s) 1.47 1.32 1.15
Repayment of the Loan(s) as considered for working out Interest on Loan
1.52 1.65 1.77
Minimum of the Above 1.47 1.32 1.15
Less: Depreciation during the year 22.13 25.07 33.04
A (20.66) (23.75) (31.89)
Cumulative Repayment of the Loan(s) as considered for working out Interest on Loan
9.15 10.74 12.45
Less: Cumulative Depreciation 234.57 259.65 292.69
B (225.42) (248.92) (280.24)
Advance Against Depreciation (minimum of A or B) - - -
Table 71: F14 - Repairs & maintenance
FY2010 - 11
(Actuals) [Crs]
FY2011 - 12 (Revised Estimate)
[Crs]
FY2012 - 13 (Projection)
[Crs]
R&M 7.95 10.34 10.77
Table 72: F15 - Total employee count
Particulars FY2010 -
11 (Actuals)
FY2011 - 12
(Revised Estimate)
FY2012 - 13 (Projection)
Number of employees as on 1st April 2,298 2,293 2,361
Employees on deputation/ foreign service as on 1st April
10 10 10
Total number of employees (1+2) 2,308 2,303 2,371
Number of employees retired/ retiring during the year 55 43 73
Net transfers [ In / (Out)] 12 (1) -
Recruitment 38 112 -
Number of employees at the end of the year (3-4+5+6) 2,303 2,371 2,298

Aggregate Revenue Requirement, Expected Revenue from Charges & Tariff Petition FY 2012-13
Electricity Department, Puducherry 102
Table 73: F16 - Employee cost
FY2010 - 11
(Actuals) [Crs]
FY2011 - 12
(Revised Estimate)
[Crs]
FY2012 - 13 (Projection)
[Crs]
Salary 65.49 68.77 74.05
Wages 0.85 0.85 0.85
Stipend 0.22 0.22 0.22
Overtime 0.76 0.76 0.76
Total 67.32 70.60 75.88
Capitalised 17.44 18.04 21.09
Net amount 49.88 52.56 54.80
Prior period expenses
- - -
Total employee costs 49.88 52.56 54.80
Table 74: F17 - A&G expenses
FY2010 - 11
(Actuals) [Crs]
FY2011 - 12 (Revised
Estimate) [Crs]
FY2012 - 13 (Projection)
[Crs]
Office expense 1.49 1.56 1.61
Miscellaneous expenses
2.04 2.32 2.30
Total 3.53 3.88 3.91
Table 75: F18 - Bad & doubtful debts
Particulars
FY2010 - 11
(Actuals) [Crs]
FY2011 - 12
(Revised Estimate)
[Crs]
FY2012 - 13 (Projection)
[Crs]
Amount of receivable bad & doubtful debts
- - -
Provision made for debts in ARR
- - -

Aggregate Revenue Requirement, Expected Revenue from Charges & Tariff Petition FY 2012-13
Electricity Department, Puducherry 103
Table 76: F19 - Interest on working capital
Particulars
FY2010 - 11
(Actuals) [Crs]
FY2011 - 12
(Revised Estimate)
[Crs]
FY2012 - 13 (Projection)
[Crs]
One month's power purchase cost 60.61 83.11 83.15
One month's employee costs 4.16 4.38 4.57
One month's A&G expenses 0.29 0.32 0.33
One month's R&M cost 0.66 0.86 0.90
Total 65.72 88.68 88.94
Table 77: F20 - Foreign exchange rate variation
Particulars FY2010 – 11
(Actuals) [Crs]
FY2011 – 12
(Revised estimate)
[Crs]
FY2012 – 13
(Projection) [Crs]
Amount of liability provided NIL
Amount recovered
Amount adjusted
Table 78: F21 - Non tariff income
FY2010 - 11 (Actuals)
[Crs]
FY2011 - 12 (Revised
Estimate) [Crs]
FY2012 - 13 (Projection)
[Crs]
reactive energy charges
6.61 9.00 9.00
stoa charges
ctu charges
interest income
departmental charges on sale
of material
UI sales 90.11 138.10 132.05
Total NTI 96.72 147.10 141.05
Table 79: F22 - Revenue from other business
Particulars FY2010-11
(Actual) [Crs] FY2011-12 (Revised
estimate) [Crs] FY2012-13
(Projections) [Crs]

Aggregate Revenue Requirement, Expected Revenue from Charges & Tariff Petition FY 2012-13
Electricity Department, Puducherry 104
Total revenue from other business
NIL Income from other business to be
considered for licensed business as per regulations
Table 80: F23 - Lease details
Name of lesser
Gross assets [Crs]
Lease entered on
Lease rentals [Crs / pm]
Primary period ended/ ending
by
Secondary period ending by
Power Grid 23.07 Jul-02 0.22 Jun-17 NA
Table 81: F24 - Wholesale price index
Period WPI/ CPI*
Increase over previous year
As on April 1 of FY11 130.81 3.80%
As on April 1 of FY12 143.32 9.56%
As on April 1 of FY13 152.21 6.20%
Table 82: F25 - Equity & loans
Period Amount of equity
[Crs]
Amount of loan [Crs]
Ratio of equity & loan
As on March 31 2011 602.16 13.16 2%
As on March 31 2012 TBD 11.51 NA
As on March 31st 2013 TBD 9.74 NA
Table 83: F26 – CFfor Ensuing Year
Sl. No. Month Sources of receipt Amount Particulars of payment
Amount
1 April Sale of power 70.31 All expenses 92.82
2 May Sale of power 70.31 All expenses 92.82
3 June Sale of power 70.31 All expenses 92.82
4 July Sale of power 70.31 All expenses 92.82
5 August Sale of power 70.31 All expenses 92.82
6 September Sale of power 70.31 All expenses 92.82
7 October Sale of power 70.31 All expenses 92.82
8 November Sale of power 70.31 All expenses 92.82
9 December Sale of power 70.31 All expenses 92.82
10 January Sale of power 70.31 All expenses 92.82

Aggregate Revenue Requirement, Expected Revenue from Charges & Tariff Petition FY 2012-13
Electricity Department, Puducherry 105
11 February Sale of power 70.31 All expenses 92.82
12 March Sale of power 70.31 All expenses 92.82
Total 843.73 1,113.81
Table 84: F27 - ARR
Item of expense
FY2010 - 11 [Crs]
FY2011 - 12 [Crs]
FY2012 - 13 [Crs]
Actuals Revised Estimate
Projections
Cost of fuel
Cost of power purchase 727.3 997.3 997.8
Employee costs 49.9 52.6 54.8
R&M expenses 8.0 10.3 10.8
Administration & general expenses 3.5 3.9 3.9
Depreciation 22.1 25.1 33.0
Interest & finance charges 1.9 2.0 1.9
Interest on working capital 7.7 10.4 10.5
Provision for bad debts - - -
Return on NFA / Equity 11.0 12.3 14.1
Amortization of regulatory asset proposed for previous FYs
57.8
Aggregate revenue requirement
831.4 1,113.8 1,184.6
Non tariff income 96.7 147.1 141.0
Net revenue requirement 734.6 966.7 1,043.6

Aggregate Revenue Requirement, Expected Revenue from Charges & Tariff Petition FY 2012-13
Electricity Department, Puducherry 106
Table 85: F28 - Expected revenue from charges - FY2010-11 (Actual)
Category Consumers Sales [MU]
Contract demand / connected load
[kW, kVA, HP]
FC [Rs per month per connection / kW / kVA
/ HP]
EC [Rs/kWh]
Total FC [Crs]
Total EC [Crs]
Total ERC [Crs]
Domestic
0 - 100 120,266 223.2 - - 0.60 - 13.39 13.39
101 - 200 65,734 120.3 - - 0.90 - 10.83 10.83
201 - 300 26,909 59.0 - - 1.65 - 9.74 9.74
>300 23,972 105.8 - - 2.00 - 21.16 21.16
OHOB 38,966 10.2 - 15.00 - 0.70 - 0.70
Total 275,847 518.5 -
0.70 55.11 55.81
Commercial
0 - 100 20,718 32 - 25.00 2.15 0.62 6.93 7.55
101 - 250 9,248 29 - 25.00 3.15 0.28 9.27 9.54
> 250 10,565 95 - 25.00 3.65 0.32 34.53 34.85
Total 40,531 156.3 -
1.22 50.73 51.94
Agriculture
Small farmers 958 7.0 5,438.99 25.00 - 0.01 - 0.01
Other farmers 5,852 69.7 54,099.01 100.00 - 0.66 - 0.66
Total 6,810 76.7 59,538.00
0.67 - 0.67
Public lighting
Total 48,167 22.1 - - 2.90 - 6.41 6.41
LT Industrial
0 - 1000 5,027 21 - 25.00 2.60 0.15 5.50 5.65
> 1000 870 93 - 25.00 2.80 0.03 26.14 26.16
Water tank 58 35 - 25.00 2.90 0.00 10.22 10.22
Total 5,955 149.7 -
0.18 41.85 42.03
Temporary supply - LT
Total
7.9 - - 5.00 - 3.96 3.96
Total LT 377,310 931.3
2.8 158.1 160.8
HT 1 Industrial
(A) - CD < 2000
0 - 100000 267 225 68,621 155.00 2.95 12.76 66.42 79.19

Aggregate Revenue Requirement, Expected Revenue from Charges & Tariff Petition FY 2012-13
Electricity Department, Puducherry 107
>100000 92 225 74,745 155.00 3.10 13.90 69.90 83.80
(B) - 2000 < CD < 5000
>0 35 555 120,473 160.00 3.15 23.13 174.85 197.98
Total 394 1,005.7 263,839
49.80 311.17 360.97
HT 2 - Government & water tank
Total 41 34.9 13,308 190.00 2.85 3.03 9.96 12.99
HT 3 - EHT
Total 7 237.4 72,910 160.00 3.15 14.00 74.77 88.77
Total HT 442 1,278.0 350,057.63
66.83 395.90 462.7
Total 377,752 2,209.3
69.6 554.0 623.6
Reconciliation amount 7.2
Total revenue from sale of power 630.8
Table 86: F28 - Expected revenue from charges - FY2011-12 (Revised estimate)
Category Consumers Sales [MU]
Contract demand / connected load [kW, kVA, HP]
FC [Rs per month per connection / kW / kVA / HP]
EC [Rs/kWh]
Total FC
[Crs]
Total EC [Crs]
Total ERC [Crs]
Domestic
0 - 100 128,171 230 - - 0.60 - 13.80 13.80
101 - 200 70,055 134 - - 0.90 - 12.07 12.07
201 - 300 28,678 68 - - 1.65 - 11.24 11.24
>300 25,547 131 - - 2.00 - 26.20 26.20
OHOB 35,447 9 - 15.00 - 0.64 - 0.64
Total 287,899 572.5 -
0.64 63.30 63.94
Commercial
0 - 100 21,394 30 - 25.00 2.15 0.64 6.45 7.09
101 - 250 9,550 34 - 25.00 3.15 0.29 10.65 10.94
> 250 10,910 108 - 25.00 3.65 0.33 39.55 39.88
Total 41,854 172.1 -
1.26 56.65 57.90
Agriculture
Small farmers 958 7 5,438.99 25.00 - 0.01 - 0.01
Other farmers 5,852 70 54,099.01 100.00 - 0.66 - 0.66

Aggregate Revenue Requirement, Expected Revenue from Charges & Tariff Petition FY 2012-13
Electricity Department, Puducherry 108
Category Consumers Sales [MU]
Contract demand / connected load [kW, kVA, HP]
FC [Rs per month per connection / kW / kVA / HP]
EC [Rs/kWh]
Total FC
[Crs]
Total EC [Crs]
Total ERC [Crs]
Total 6,810 76.7 59,538.00
0.67 - 0.67
Public lighting
Total 48,280 23 - - 2.90 - 6.79 6.79
LT Industrial
0 - 1000 5,334 20 - 25.00 2.60 0.16 5.15 5.31
> 1000 694 105 - 25.00 2.80 0.02 29.43 29.45
Water tank 58 35 - 25.00 2.90 0.00 10.22 10.22
Total 6,086 160.1 -
0.18 44.79 44.97
Temporary supply - LT
Total
22.6 - - 5.00 - 11.32 11.32
Total LT 390,928 1,027.5
2.7 182.9 185.6
HT 1 Industrial
(A) - CD < 2000
0 - 100000 273 223 66,204 155.00 2.95 12.31 65.78 78.09
>100000 94 236 72,113 155.00 3.10 13.41 73.26 86.68
(B) - 2000 < CD < 5000
-
>0 37 557 107,313 160.00 3.15 20.60 175.44 196.04
Total 404 1,016.3 245,630
46.33 314.48 360.81
HT 2 - Government & water tank
Total 41 37 14,265 190.00 2.85 3.25 10.62 13.87
HT 3 - EHT
Total 7 236 80,495 160.00 3.15 15.46 74.49 89.95
Total HT 452 1,290.0 340,390.13
65.04 399.59 464.6
Total 391,380 2,317.5
67.8 582.4 650.2

Aggregate Revenue Requirement, Expected Revenue from Charges & Tariff Petition FY 2012-13
Electricity Department, Puducherry 109
Table 87: F28 - Expected revenue from charges - FY2012-13 (Estimated)
Category Consumers Sales [MU]
Contract demand / connected load
[kW, kVA, HP]
FC [Rs per month per
connection / kW / kVA /
HP]
EC [Rs/kWh]
Total FC [Crs]
Total EC [Crs]
Total ERC [Crs]
Domestic
0 - 100 134,538 236 - - 0.60 - 14.13 14.13
101 - 200 73,535 143 - - 0.90 - 12.84 12.84
201 - 300 30,102 77 - - 1.65 - 12.68 12.68
>300 26,816 165 - - 2.00 - 33.00 33.00
OHOB 35,447 9 - 15.00 - 0.64 - 0.64
Total 300,439 629.3 -
0.64 72.65 73.29
Commercial
0 - 100 22,060 10 - 25.00 2.15 0.66 2.24 2.90
101 - 250 9,847 15 - 25.00 3.15 0.30 4.64 4.94
> 250 11,249 160 - 25.00 3.65 0.34 58.30 58.63
Total 43,156 184.9 -
1.29 65.18 66.47
Agriculture
Small farmers 958 7 5,438.99 25.00 - 0.01 - 0.01
Other farmers 5,852 70 54,099.01 100.00 - 0.66 - 0.66
Total 6,810 76.7 59,538.00
0.67 - 0.67
Public lighting
Total 49,438 26 - - 2.90 - 7.53 7.53
LT Industrial
0 - 1000 5,445 96 - 25.00 2.60 0.16 25.02 25.18
> 1000 708 38 - 25.00 2.80 0.02 10.61 10.64
Water tank 58 35 - 25.00 2.90 0.00 10.22 10.22
Total 6,212 169.4 -
0.19 45.85 46.04
Temporary supply - LT
Total
25.0 - - 5.00 - 12.50 12.50
Total LT 406,055 1,111.3
2.8 203.7 206.5
HT 1 Industrial
(A) - CD < 2000
0 - 100000 278 236 67,532 155.00 2.95 12.56 69.55 82.11

Aggregate Revenue Requirement, Expected Revenue from Charges & Tariff Petition FY 2012-13
Electricity Department, Puducherry 110
Category Consumers Sales [MU]
Contract demand / connected load
[kW, kVA, HP]
FC [Rs per month per
connection / kW / kVA /
HP]
EC [Rs/kWh]
Total FC [Crs]
Total EC [Crs]
Total ERC [Crs]
>100000 96 235 73,285 155.00 3.10 13.63 72.77 86.40
(B) - 2000 < CD < 5000 - -
>0 38 557 109,675 160.00 3.15 21.06 175.38 196.44
Total 412 1,027.3 250,492
47.25 317.71 364.95
HT 2 - Government & water tank
Total 41 40 14,265 190.00 2.85 3.25 11.32 14.57
HT 3 - EHT
Total 7 236 80,495 160.00 3.15 15.46 74.41 89.87
Total HT 460 1,303.2 345,252.00
65.96 403.44 469.4
Total 406,515 2,414.5
68.7 607.1 675.9