electoral competition and the voter forthcoming, public
TRANSCRIPT
Electoral competition
1 1
Electoral Competition and the Voter
Forthcoming, Public Opinion Quarterly
Shaun Bowler Department of Political Science
University of California, Riverside Riverside, CA 92521
[email protected] 951.825.5595
951.827.3933 (fax)
Todd Donovan Department of Political Science Western Washington University
Bellingham, WA 98225 [email protected]
360.650.3018 360.650.2800 (fax)
(Corresponding author)
Keywords: Opinion, elections, electoral competition, campaign effects

Electoral competition
2 2
Author notes:
Shaun Bowler is a professor of political science at the University of California,
Riverside, Riverside, CA, USA. Todd Donovan is a professor of political science at
Western Washington University, Bellingham, WA. Address correspondence to Todd
Donovan, Department of Political Science, Western Washington University, Bellingham
WA, 98225, USA; email: [email protected]

Electoral competition
3 3
Abstract:
This note examines how electoral competition, in the form of district-level campaign
expenditures, affects voters' opinions about elections. We direct our attention at how
voters perceive competition, and at how electoral competition affects how people
perceive elections. Although people generally over estimate the competitiveness of US
House races, we demonstrate that perceptions of competition are connected to actual
levels of campaign activity. We also find that electoral competition may have
contradictory democratic effects. District-level spending is associated with greater
attention to news about the local campaign, but also with greater dissatisfaction with
election choices.
Electoral competition
4 4
Introduction
Studies examining electoral competition generally focus on how competition
affects the behavior of representatives (e.g. Key, 1949; McDonald and Samples 2006),
or how it affects voter turnout (e.g. Cox and Munger 1989; Blais 2000; Endersby el al
2002). A smaller body research examines the effects competitive elections might have
on voter attitudes (Brunell 2008; Brunell and Buchler 2009). We are interested here in
whether voters are aware of electoral competition, and whether campaign activity
associated with competition affects voters' perceptions and attitudes about elections.
We demonstrate that congressional campaign activity corresponds with
perceptions that the election in a person's district is close. We also find that when voters
are exposed to greater campaign activity they appear more attentive to campaign news.
However, competitive elections may not have uniformly positive democratic effects.
Exposure to competition also corresponds with greater dissatisfaction with election
choices.
How do voters perceive electoral competition?
Are voters' aware of how close elections might be, and does campaign activity
affect other perceptions about elections? The strategic voting literature assumes that
voters are not only aware of how close things are, but that these perceptions are accurate
and acted upon (e.g. Downs 1957; but see Green and Shapiro 1994). A large body of
work also documents that turnout in elections (Blais 2000) and instances of strategic
voting (Cox 1997; Karp et al 2002) both correlate with how close an election is. Blais'
(2000) extensive review of the voter turnout literature found that electoral competition is

Electoral competition
5 5
associated with increased turnout (see also Franklin 2004), but this effect could be
caused by the mobilization efforts of elites, rather than mass behavior being affected by
actual awareness of how close an election is (Cox and Munger 1989).
There are reasons to expect that voters might not be particularly aware of
district-level electoral competition, and reasons to expect that it may have limited
effects on attitudes and behavior. Campaigns compete for attention in an environment
where people generally pay little attention to politics (Converse 1962), and people have
limited factual information about politics (Delli Carpini and Keeter 1997). Ferejohn and
Fiorina (1974) provide a model of the decision to vote as a choice being made under
uncertainty about how close an election might be. Voters must sort between
information about the national contest and the reality of their local race when evaluating
electoral competition in their own district. Perceptions of electoral competition may
also be inaccurate, as people are biased toward over-estimating how close elections are
(Uhlaner and Grofman 1986).
It is an open question, then, how voters are affected by electoral competition.
We might expect they simply assume elections are competitive. Thus, regardless of
campaign spending prior to the vote, perceptions of the closeness of a race could be
independent of how much money is spent on the contest. Conversely, even if
perceptions of closeness tend to be inaccurate, they may be responsive to variation in
campaign activity.
District-level competition may not only affect how people view the closeness of
an election, but it may also affect interest in the election and attitudes about the election.
Studies have demonstrated that spending corresponds with greater exposure to campaign

Electoral competition
6 6
ads (Kenny and McBurnett 1997), and campaign spending has been demonstrated to
decrease the likelihood that people would see something positive about incumbents
(Coleman and Manna 2000). Exposure to campaign ads has been found to make
citizens more interested in an election and more familiar with candidates (Freedman et
al 2004). Chong and Druckman (2007) also demonstrate that democratic competition
stimulates deliberation and generates greater attention to issues.
But do these patterns mean that campaign activity leads voters to feel more
positive about the election? Most campaign expenditures in US House races are
dedicated to advertising, and research demonstrates that most congressional candidates
running ads in 2006 (the election examined here) went negative (Druckman et al
2009:14). Higher spending may increase the chances that voters are exposed to
information – positive and negative. Although some literature reviews (Lau et al 1999;
Coleman and Manna 2000) show that negative ads do not have pervasively detrimental
effects others show that negative campaigns may correspond with lower political
efficacy, less trust in government, a more negative public mood (Lau et al 2007),
demobilization, and increased cynicism (e.g. Ansolabehere et al 1994). Research also
demonstrates that people generally dislike politics and want to avoid it (Hibbing and
Theiss-Morse 2002). Active campaigns may thus have adverse effects on attitudes about
the election since they are a visible manifestation of the sort of politics that many people
distain.
We propose that people experience electoral competition through campaign
activity, and that this activity is best measured by campaign spending. For example, a
low spending contest may be close but without active advertising campaigns, such a

Electoral competition
7 7
race may have a limited effect on voter awareness and perceptions. People experience
electoral competition directly in the form of radio and television ads, direct mailing,
billboards, signs, phone calls and other campaign activity. Campaign spending serves as
a measure of the level campaign activity in a specific geographic area, and it has been
shown to be associated with candidate vote share (Jacobson and Kernell 1983; Pattie et
al 1995), changes in vote intentions in US House races (Jacobson 1990); variation in
voter turnout in gubernatorial (Patterson and Caldiera 1983) and US House races
(Gilliam 1985) and other elections (Matsusaka and Palda 1999). Active campaigns have
thus been shown to affect voter behavior. Here we test how they affect perceptions of
elections.
In short, competition in the form of campaign expenditures could affect whether
voters think their House contest is close, and affect their interest in the race. We suggest
that campaigns may focus greater critical attention on candidates and lead people to pay
attention to the contest. If people generally dislike politics, visible political campaigns
may sour their attitudes about the election. We test if greater exposure to political
campaigns reduces satisfaction with elections.
Modelling perceptions of competition and elections
We test our argument by modelling responses to October 2006 Pew survey
questions. This survey has an advantage over others because it included an item asking
about perceptions of competition in a respondent's district. It also included an over-

Electoral competition
8 8
sample of respondents in competitive US House districts1 and thus includes a rare,
robust sample of respondents exposed to competitive House races. Weights are used in
our analysis to account for this over-sample. Table 1 displays results from a question
asking respondents whether they thought their US House race was competitive or not.
This illustrates that although people clearly over estimated how close these races were
there is a 12 percent increase in perceptions that contests are close when respondents
from competitive districts are compared to those from non competitive districts.
Table 1 about here
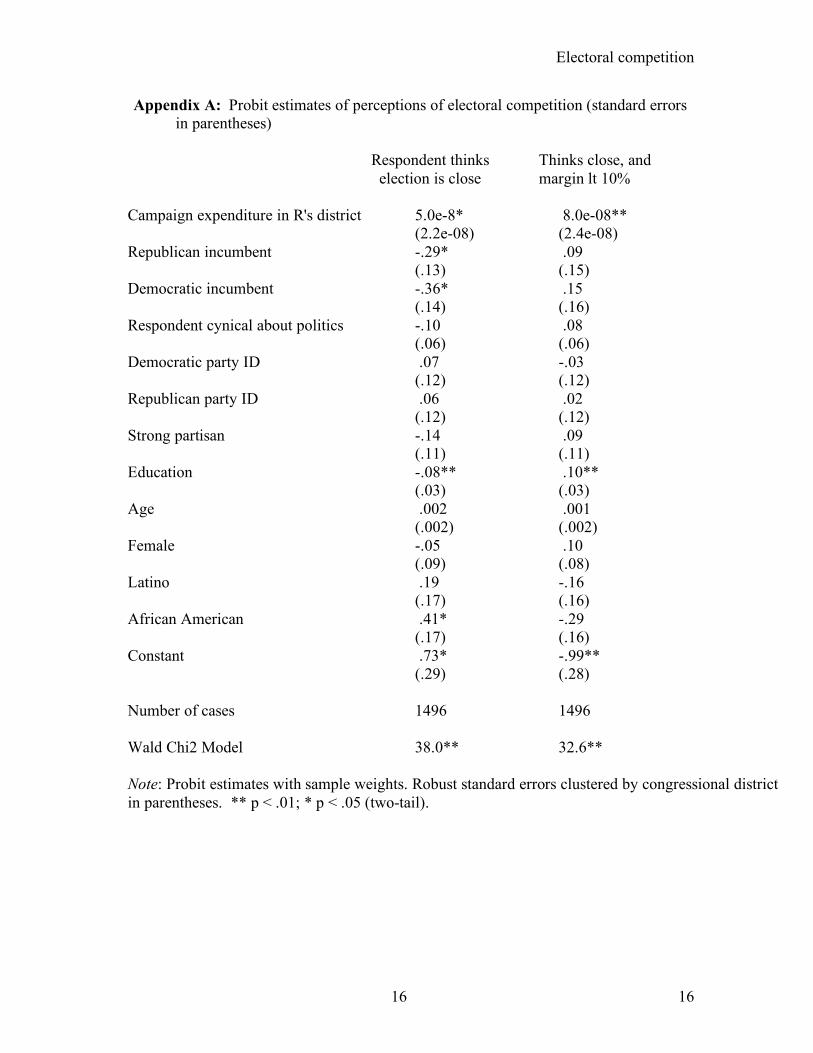
We estimated a model that tests if a respondent perceived their local race to be
close, and if this perception was roughly accurate. These perceptions are modelled as a
function of district-level campaign spending, district-level measures of whether the race
featured a Democratic or Republican incumbent (with open seats being the reference
category),2 individual-level attitudes about the political process, the respondent’s
partisanship, strength of partisanship, and standard demographic controls (age,
1 Details of question wording and sampling are in Appendix C. These districts were
identified with information from Congressional Quarterly, the Cook Political Report, the
Rothenberg Report, the New York Times, and Larry Sabato's Crystal Ball. Analysis
presented in this paper is weighted to account for the oversample and to balance
demographics. Michael McDonald of the Brookings Institution and John Samples of the
Cato Institute provided consultation on the study design.
2 Alternate specifications of perceptions of closeness controlled for whether a seat was
uncontested by one of the major parties, and if there were contested primaries. The
coefficients for these controls were not significant.

Electoral competition
9 9
education, race, ethnicity, and gender). These results are reported in Appendix A. We
also estimated similar models to test how district-level competition corresponds with
whether people pay attention to news about the campaign and to test whether
respondents were satisfied with the choices presented by the election (see Appendix B).
We expect that cynicism about politics will affect how people reason about
elections in general. Each model includes a measure of generalized dislike for politics.
Respondents were asked their views of the Democratic and Republican parties, as well
as Congress, and allowed to rate these institutions on a 5 point scale from “very
favorable” to “very unfavorable.” Our measure of political cynicism is a count of a
respondent's total number of “very unfavorable” responses. People who are generally
cynical about politics may also be skeptical about whether elections are close, and be
less satisfied with the choices they have in elections. Partisans, particularly strong
partisans, and people with more education, might be more attentive to campaigns. As
such, these variables are included as controls to better isolate the potential effects of
campaign activity.
We suggest that campaign spending is the most direct measure of how voters
experience the effects of electoral competition, as spending reflects the intensity of
campaign advertising, voter contacting, and voter mobilization efforts.3 We use total
spending in a district as a measure of electoral competition since the majority of
campaign spending goes to advertising that many voters are likely to be exposed to. We
assume that total expenditures is the most direct representation of how (or if)
3 The mean level of district spending was $2,899,000 (sd = 2,435,150 with a range from
$181,051 to $11,092,914).

Electoral competition
10 10
respondents are exposed to electoral competition. We are interested in here in the effects
of the total volume of campaign activity on perceptions, rather than distinguishing
between the effects of challenger versus incumbent spending. Spending was heavily
one-sided in small set of districts, however these tended to be lower spending contests.
Voters in these districts thus received relatively limited exposure to campaigns. Not
surprisingly, districts with the most total spending tended to be closer contests. District
vote margin in the 2006 House race is well correlated with spending (r = .62).4
However, unless voters are particularly attentive to district-level pre-election opinion
polls or to previous results, it is not clear how they can be directly affected by vote
margin in the immediate election since votes have not yet been counted.
We use probit and ordered probit with standard errors clustered by congressional
district to estimate our models. Perceptions of the existence of a competitive election are
coded dichotomously, with those who responded that their election "would be a close
contest" coded as 1, and other respondents coded as 0. Accurate perception are coded as
1 if a respondent said the contest would be close, and the actual margin was less than
10%, and 1 if the respondent said it would not be close and the margin was greater than
4 When vote margin and spending are included in the models at the same time, the
coefficients for spending remain significant and in the same directions in each
estimation, and none of the coefficients for vote margin are significantly different than
zero.

Electoral competition
11 11
10%.5 This measure is coded 0 otherwise. Attention to the local campaign is coded 1 if
the respondent reported following "news about candidates and election campaigns in
your state and district" very closely, and 0 if otherwise. Satisfaction with choices in the
campaign is coded 1 if a respondent said she was satisfied with choices in the election,
and 0 if otherwise. Question wording and sampling details are reported in Appendix C.
Additional estimates using a sample limited to respondents in competitive districts and
using alternate coding of dependent variables produced results similar to what we report
below. These estimates are included in the on-line appendix for this paper.
Results
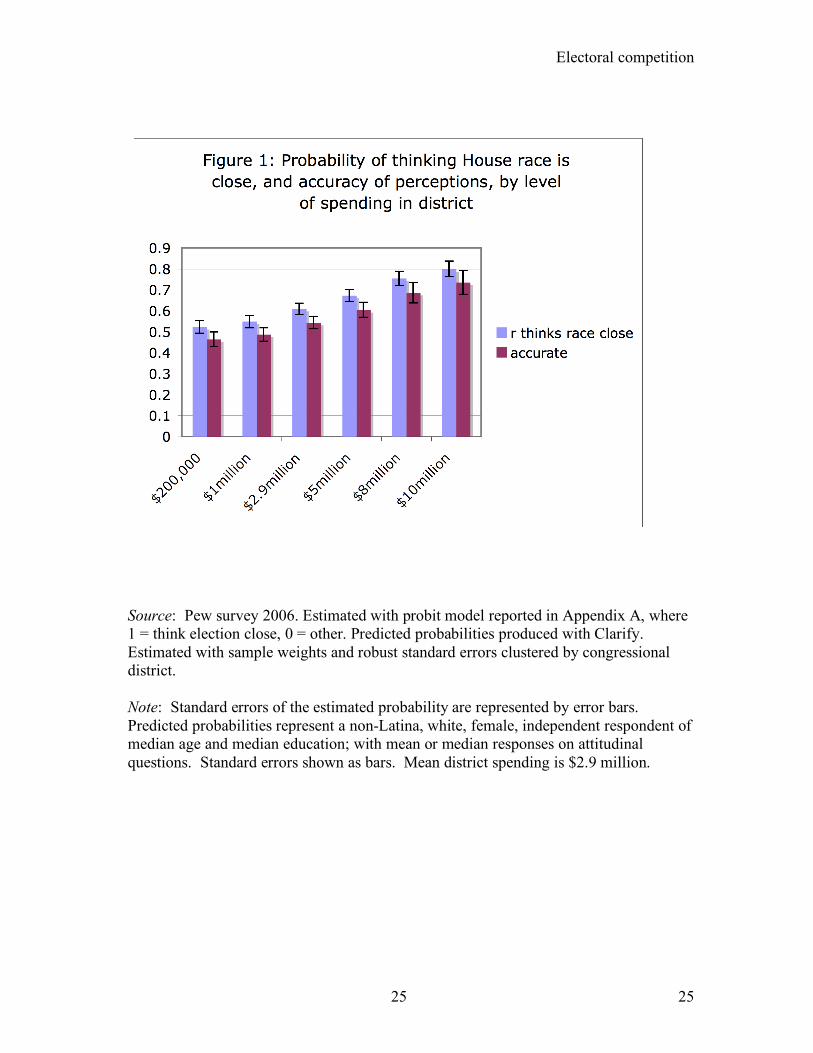
How then, do voters perceive electoral competition? As noted, many voters
over-estimated how close elections actually were. With key attitudes and
demographics accounted for, we find that electoral competition as represented by
campaign spending had a strong association with perceptions of elections. Figure 1
displays the probability (simulated from estimates reported in Appendix A) that a
respondent reported thinking her district had a close contest (the lighter bar), and the
probability that this perception was roughly accurate (the darker bar). People in districts
with very high spending ($10,000,000 total) are predicted to have had a .28 greater
probability of saying their election was close6 when compared to people in districts with
5 The 10% standard was used to define competitive ("marginal") districts by Mayhew
(1974).
6 All predicted probabilities reported are for an independent, moderate, non-Hispanic
white woman of median age and education.

Electoral competition
12 12
some of the lowest spending ($200,000). The probability that someone in the highest
spending districts had an accurate perception of a race being close was .27 greater than
someone in a district with low spending. Results in Appendix A also demonstrate that
higher education was associated with being less likely to say elections were close and
with accurate perceptions of closeness. Somewhat surprisingly, African Americans
were more likely than whites to think their contest was close in 2006. As expected,
people who were cynical about politics were significantly more likely to think their
election would not be close, as were people in districts with no incumbent.
Figure 1 about here
Models in Appendix B estimating attention to the campaign and whether a
respondent was satisfied with choices in the election are similar to those used in
Appendix A. Additional variables are included in the estimate of satisfaction to control
for attention to campaign news and for the party of the incumbent.
Figure 2 about here
Figure 2 reports the relationships between competition (district spending),
attention to the campaign, and satisfaction with the election. The figure compares the
simulated probabilities of responses expected from people residing in districts with low
spending ($200,000) to those residing in districts with high spending ($10,000,000).
Respondents exposed to greater campaign spending were more likely to say they were
dissatisfied with choices presented in the election. Compared to people in low spending
districts, those in districts with the most spending had a .12 lower probability of saying
they were satisfied with choices in the election. There are also significant differences in
attention to the campaign associated with campaigns. People from higher spending
Electoral competition
13 13
districts were more likely to say they were following news about the candidates and
campaigns. In lower spending districts a respondent is estimated to have a .21
probability of saying she followed news about the campaign. A similar respondent in a
high spending district is estimated to have a .30 probability of saying this. The control
variables indicate that political cynics were more likely to report following local
campaign news, and that strong partisans (rather than partisans per se), men, and older
respondents were more attentive. As expected, respondents with more years of formal
education were more attentive to campaign news. Political cynics, African Americans,
women, and people with less education were less satisfied with choices offered by
elections. Partisans,7 and those who followed campaign news, were more satisfied.
It is important to note that when we estimate perceptions using vote margin to
measure competition, results (not shown here) are a bit different. Margin is associated
with accurate perceptions of how close a race is, and with following campaign news. It
is not associated with the general impulse to view any election as close, nor with lower
satisfaction with elections - yet spending is. We expect this may reflect that spending
captures exposure to campaign activity that the vote margin measure does not fully
capture.
7 We also specified the models with a term to account for Democrats residing in districts
with Democratic incumbents, and a term for Republicans in districts with Republican
incumbents. The coefficients for these were not significant and did not alter the results
reported here.

Electoral competition
14 14
Discussion
This research has some mixed news for those who study the role that electoral
competition plays -- or should play -- in congressional elections. Despite a beneficial
effect that competitive districts may have on voters (more accurate perceptions about
whether a race is close, and increased attention to campaign news), voters appear less
satisfied with elections where campaigns are most active. This finding is consistent with
literature showing that people dislike being exposed to politics. Our results may be then
seen by some as a glass half full, and by others as a glass half empty. We assume that if
efforts to increase the number of competitive districts are successful (e.g. by changing
districting practices, adopting term limits, etc), that this might increase the proportion of
the electorate exposed to high-spending campaigns. This could increases in voter
attention to campaign news. When this is considered, greater electoral competition
appears as a normative gain. But intensive campaign spending might also stimulate
dissatisfaction with the candidates voters must select from.
The results of this study have implications for how we view the relationship
between campaigns and voters. We find that variation in electoral competition in the
form of spending affects voters' perceptions that a race is close, as well as other attitudes
and behavior. Although the Pew data are not suited for testing how campaign activity
might affect voter turnout or strategic voting, results reported here are consistent with
the idea that voters are aware of competitive campaigns and that they respond to them.
District-level campaign activity, as measured by campaign spending, appears to have a
substantial effect on whether people think the contest in their district will be close.
Commonly reported links between close elections, voter turnout, and strategic voting
Electoral competition
15 15
might then reflect direct voter awareness of, and responsiveness to, the intensity of
campaign activity and the fact that the contest is actually close.
Electoral competition
16 16
Appendix A: Probit estimates of perceptions of electoral competition (standard errors in parentheses)
Respondent thinks Thinks close, and election is close margin lt 10% Campaign expenditure in R's district 5.0e-8* 8.0e-08** (2.2e-08) (2.4e-08) Republican incumbent -.29* .09 (.13) (.15) Democratic incumbent -.36* .15 (.14) (.16) Respondent cynical about politics -.10 .08 (.06) (.06) Democratic party ID .07 -.03 (.12) (.12) Republican party ID .06 .02 (.12) (.12) Strong partisan -.14 .09 (.11) (.11) Education -.08** .10** (.03) (.03) Age .002 .001 (.002) (.002) Female -.05 .10 (.09) (.08) Latino .19 -.16 (.17) (.16) African American .41* -.29 (.17) (.16) Constant .73* -.99** (.29) (.28) Number of cases 1496 1496 Wald Chi2 Model 38.0** 32.6** Note: Probit estimates with sample weights. Robust standard errors clustered by congressional district in parentheses. ** p < .01; * p < .05 (two-tail).

Electoral competition
17 17
Appendix B: Probit estimates of attention to campaign news and perceptions of choices (standard errors in parentheses) Follows campaign news Satisfied with about district contest election choices District-level expenditure 4.2e-08** -3.2e-08* (1.5e-08) (1.6e-08) Republican incumbent --- .21 (.14) Democratic incumbent --- .11 (.15) Respondent cynical about politics .22** -.11 (.05) (.06) Respondent follows campaign news --- .12* (.05) Democratic party ID -.18 .48** (.10) (.12) Republican party ID -.28** .53** (.10) (.12) Strong party ID .43** .10 (.09) (.11) Education .10** -.05 (.03) (.03) Age .02** -.003 (.002) (.002) Female -.26** -.16 (.07) (.08) Latino -.20 .07 (.15) (.17) African American .01 -.39* (.18) (.17) Constant 1 -.28 .04 (.23) (.29) Constant 2 .41 (.22) Constant 3 1.7 (.24) Number of cases 1485 1485 Wald Chi2 Model 128.3** 67.4** Note: Probit and ordered probit estimates with sample weights. Robust standard errors clustered by congressional district in parentheses. ** = p < .01; * = p < .05 (two-tail).

Electoral competition
18 18
Appendix C. Data collection.
The data were collected via telephone interviews by Princeton Survey Research
Associates for the Pew Center for the People and the Press between October 17 and
October 22, 2006. The sample was drawn using list assisted random digit dialing, and
included an over-sample from 40 competitive congressional districts. Using AAPOR
standards the contact rate was 77 percent, the cooperation 37 percent, and the
completion rate was 91 percent. The resulting response rate was 26%. A total of 732
interviews were from competitive districts, and 1274 were from other districts.
Questions we examine were asked of registered voters.
Question wording and coding.
Election close?: What's your impression -- in the race for the U.S. House in your
district, is one candidate heavily favored to win or do you think this will be a close
contest? Response categories included: One candidate heavily favored (n=329), will be
a close contest (n=933), don't know/refused (volunteered, n=290). This is coded 1 if the
respondent reported one candidate was heavily favored, 0 if the race will be close or
don't know.
Follow local campaign news: How closely have you followed news about candidates
and election campaigns in your state and district? Have you followed it very closely,
fairly closely, not too closely, or not at all closely? Response categories included: Very
closely fairly closely (n=468), fairly closely (n=708) not too closely (n=240), not at all
Electoral competition
19 19
closely (125), don't know/refused (volunteered, n=11). This is coded so not at all = 0,
not too closely = 1, fairly closely = 2, and very closely = 3. 'Don't know' is omitted.
Satisfied with election choices?: Generally, are you satisfied with the choices you have
in the elections this year in your state, or do you wish there were other choices?
Response categories included: Satisfied (799), wish other choices (666), depends on
race (Volunteered, n=12), and don't know/refused (volunteered, n=75). This is coded
so satisfied = 1 and other responses = 0.

Electoral competition
20 20
Bibliography
Ansolabehere, Steven, Shanto Iyengar, Adam Simon, and Nicholas Valentino. 1994.
“Does Attack Advertising Demobilize the Electorate?” American Political
Science Review 88 (4), 829-38.
Blais, Andre. 2006. “What Affects Voter Turnout? Annual Review of Political
Science. 9 (1) 111- 125.
Brunell, Thomas. 2008. Redistricting and representation. Routledge.
Brunell, Thomas, and Justin Buchler. 2009. “Ideological Representation and
Competitive Congressional Elections.” Electoral Studies. 28 (3) 448 - 457.
Chong, Dennis and James Druckman. 2007. "Framing Public Opinion in Competitive
Democracies." American Political Science Review. 101: 637-56.
Coleman, John J., and Paul Manna. 2000. “Congressional Campaign Spending and the
Quality of Democracy.” Journal of Politics 62, 757-89.
Converse, Philip. 1962. “Information Flow and the Stability of Partisan Attitudes.”
Public Opinion Quarterly. 26 (4) 578 - 599.
Cox, Gary. 1997. Making Votes Count. Cambridge: Cambridge University Press.
Cox, Gary, and Michael Munger. 1989. “Closeness, Expenditures, and Turnout in the
1982 U.S. House Elections.” American Political Science Review 83 (1), 217-
231.
Delli Carpini and Scott Keeter. 1997. What Americans Know About Politics and Why
it Matters. New Haven, CT: Yale University Press.
Downs, Anthony. 1957. An Economic Theory of Democracy. New York: Harper and
Row.

Electoral competition
21 21
Druckman, James, M. Kifer, and M. Parkin. 2009. “Timeless Strategy Meets New
Medium: Going Negative on Congressional Campaign Websites, 2002 - 2006.”
Paper presented at the Midwestern Political Science Association Meeting.
Chicago, IL.
Endersby, James, Steven Galatas and Chapman Rackaway. 2002. “Closeness Counts
in Canada: Voter Participation in the 1993 and 1997 Federal Elections.” Journal
of Politics. 64 (2) 610-631.
Ferejohn, John and Morris P. Fiorina. 1974. “The Paradox of Not Voting: A Decision
Theoretic Analysis.” American Political Science Review. 68 (2) 525-536.
Franklin, Mark. 2004. Voter Turnout and the Dynamics of Electoral Competition in
Established Democracies Since 1945. Cambridge University Press.
Freedman, Paul, Michael Franz and Kenneth Goldstein. 2004. "Campaign Advertising
and Democratic Citizenship." American Journal of Political Science. 48 (4) 723-
741.
Gilliam, Frank Jr. 1985. "Influences on Voter Turnout for US House Elections in Non-
presidential Years." Legislative Studies Quarterly. 10(3): 339-351.
Green, Donald and Ian Shapiro. 1994. Pathologies of Rational Choice Theory. New
Haven, CT: Yale University Press.
Hibbing, John and Elizabeth Theiss Morse. 2002. Stealth Democracy. New York:
Cambridge University Press.
Jacobson, Gary and Samuel Kernell. 1983. Strategy and Choice in Congressional
Elections. New Haven: Yale University Press.
Electoral competition
22 22
Jacobson, Gary. 1990. "The Effects of Campaign Spending in House Elections: New
Evidence for Old Arguments." American Journal of Political Science. 34: 334-
62.
Karp, Jeffrey, Jack Vowles, Susan Banducci and Todd Donovan. 2002. “Strategic
Voting, Party Activity and Candidate Effects.” Electoral Studies. 21 (1) 1 - 22.
Kenny, Christopher and Michael McBurnett. 1997. "Up Close and Personal: Campaign
Contact and Candidate Spending in U.S. House Elections." Political Research
Quarterly. 50 (1) 75-96.
Key, V. O. 1949. Southern Politics in State and Nation. New York: Knopf.
Lau, Richard R., Lee Sigleman, Caroline Heldman, and Paul Babbit. 1999. "The
Effects of Negative Advertisements: A Meta-analytic Review. American
Political Science Review. 93 (4), 851-75.
Lau, Richard R., Lee Sigelman and Ivy Brown Rovner. 2007. “The Effects of
Negative Political Campaigns: A Meta-analytic Reassessment.” Journal of
Politics. 69 (4) 1176-1209.
Mayhew, David. 1974. "Congressional Elections: The Case of the Vanishing
Marginals." Polity. 6 (3): 297-317.
Matsusaka, John and Filp Palda. 1999. "Voter Turnout: How Much Can we Explain?"
Public Choice. 98: 431-446
McDonald, Michael P. and John Samples. 2006. The Marketplace of Democracy:
Electoral Competition and American Politics. Washington, DC: Brookings
Institution Press.
Electoral competition
23 23
Patterson, Samuel and Gregory Caldeira. 1983. "Getting out the Vote: Participation in
Gubernatorial Elections." American Political Science Review. 77: 675-89.
Pattie, Charles, Ronald Johnson and Edward Feildhouse. 1995. "Winning the Local
Vote: The Effectiveness of Constituency Campaign Spending in Great Britain,
1983-1992." American Political Science Review. 89 (4): 969-83.
Uhlaner, Carole and Bernard Grofman. 1986. “The Race may be Close but My
Horse is Going to Win: Wish fulfilment in the 1980 Presidential Election.” Political
Behavior. 8 (2) 101-129

Electoral competition
24 24
Electoral competition
25 25
Source: Pew survey 2006. Estimated with probit model reported in Appendix A, where 1 = think election close, 0 = other. Predicted probabilities produced with Clarify. Estimated with sample weights and robust standard errors clustered by congressional district. Note: Standard errors of the estimated probability are represented by error bars. Predicted probabilities represent a non-Latina, white, female, independent respondent of median age and median education; with mean or median responses on attitudinal questions. Standard errors shown as bars. Mean district spending is $2.9 million.

Electoral competition
26 26
Source: Pew survey 2006. Estimated with ordered probit and probit models reported in Appendix B. Estimated with sample weights and robust standard errors clustered by congressional district. Probabilities generated by Clarify. Note: Standard errors of the estimated probability are represented by error bars. Predicted probabilities represent a non-Latina, white, female, independent respondent of mean age, mean education, mean attention to the campaign and mean level of cynicism about politics. Low spending is a district with $200,000 in expenditures. High spending is $10,000,000.

Electoral competition
27 27
Table 1: Perceptions of electoral competition in US House race. R lives in
non competitive district
R lives in a competitive district
All respondents
One candidate is favored 24% 16% 21% Will be a close contest 56% 68% 60% Don’t know/refused 20% 16% 19% N 1017 535
1552
Source: October 2006 Pew Survey. Note: Respondents were asked, What's your impression -- in the race in the race for the U.S. House in your district, is one candidate heavily favored to win or do you think this will be a close contest. Seats are classified as competitive if the margin was greater than 10%. Chi-square = 24.1 (p < .000).
Electoral competition
28 28

Electoral competition
29 29

Electoral competition
30 30