electoral acceleration: the effect of minority population...
TRANSCRIPT

Electoral Acceleration:
The Effect of Minority Population on Minority Voter Turnout
June 2002
Felix Oberholzer-Gee The Wharton School
University of Pennsylvania
Joel Waldfogel The Wharton School
University of Pennsylvania & NBER
Abstract
Political outcomes are well understood to depend on the spatial distribution of citizen preferences. In this paper, we document that the same holds for the individual decision to be politically active. Using both cross-sectional and longitudinal evidence on turnout, we show that citizens are more likely to vote if they live in a jurisdiction with a larger number of persons sharing similar political preferences. As a result, changes in the identity of a district’s median citizen lead to even larger changes in the identity of its median voter, a phenomenon we term electoral acceleration. We present evidence that electoral acceleration is in part due to the structure of media markets. Candidates find it easier to direct campaign efforts at larger groups because many existing media outlets cater to this audience.
Keywords Voting Behavior, Role of Media Markets for Political Participation JEL D72, L82
We are grateful to seminar participants at Cornell and Wharton for comments on an earlier draft. Steve Coate, Bob Inman, John Matsusaka and Jeff Milyo provided particularly helpful comments. Thanks to Lisa George for assistance with the newspaper data used in the study. All errors are our own.

1
I. Introduction
What is the role of minority preferences in a democratic society? Few questions
in political economy resonate as deeply as this one. Interestingly, the two most important
concerns over minority preferences are diametrically opposed. On the one hand,
minorities are seen as powerless. The “tyranny of the majority” has long been considered
to be one of “the evils against which society requires to be on its guard” (Mill, 1859).
Based on this concern, the Framers of the U.S. constitution sought to design democratic
institutions that would render “the majority … unable to concert and carry into effect
schemes of oppression” (Madison, 1788). In contrast to the view that democracy would
leave minorities powerless, there is the fear, prominently expressed in Madison’s
discussion of factions, that small, but highly motivated groups might highjack the
democratic process and exert undue influence. The superior ability of small groups to
solve problems of collective action is one basis for the view that minorities are not
powerless but, relative to their size, all too influential in democratic decision-making
(Olson, 1971).
In this paper, we address the question of minority influence by examining how
electoral participation varies with the size of groups of citizens. Turnout is of interest not
only because electoral participation is often seen as a basic democratic ideal (Lijphart,
1997). Turnout also matters because systematic changes in the composition of the
electorate lead to substantial changes in policy. For instance, the elimination of poll
taxes and literacy tests in the United States led to a poorer pivotal voter and a sharp rise
in welfare spending (Husted and Kenny, 1997).
2
We show that citizens are more likely to participate in elections if they live in a
jurisdiction with a higher concentration of persons sharing similar preferences in media
content. In particular, we document that increases in the number of black citizens in a
district make other blacks in the district more likely to vote and non-blacks less likely to
participate in the election. Increases in the size of a group change the identity of the
median citizen, and such a change in the identity of the median citizen leads to an even
larger change in the identity of the median voter, a phenomenon we term electoral
acceleration.
While the main contribution of this study is our empirical documentation that
electoral acceleration occurs, we also offer empirical evidence on why it operates. It is
well known that candidates can increase political participation by campaigning to groups
of citizens (Wielhouwer and Lockerbie, 1994). Most channels of communication used to
disseminate campaign information – newspapers, radio and TV stations – carry
considerable fixed cost, which can only be overcome if the demand for these products is
sufficiently strong. For instance, radio stations or newspapers targeting a black audience
only exist in places with many blacks (Waldfogel, 1999). Where no black-targeted
newspapers exist, candidates have difficulty reaching black citizens, and these citizens
find it more costly to acquire information about candidates. Ultimately, such variation in
the relative price of information appears to be translated into variation in voting
tendencies for groups. Larger groups are more likely to be informed, and they are thus
more likely to turn out. For instance, we show that increases in the number of black-
targeted weekly newspapers increase black turnout. A similar effect holds for black-
targeted radio stations. Both types of media products are more numerous in cities with a
3
larger black population. Interestingly, the race of the stations’ owner is important as
well: While black-owned black-targeted stations increase turnout, we find no such effect
for white-owned black-targeted stations.
Is electoral acceleration as documented in this study truly a causal effect? It is
inherently difficult to document causal relationships in voting studies because
individuals’ voting tendencies are influenced by a multitude of unobservables. For
example, blacks may choose to live disproportionately in places where all people, black
or white, have elevated tendencies to vote. Alternatively, blacks with an unobserved
“taste for voting” may migrate to places with high black concentrations. Possibilities
such as these would give rise to a spurious correlation between group size and turnout.
We employ a number of cross sectional and longitudinal strategies to overcome
these concerns. First, we perform estimates with local fixed effects common to blacks
and whites, documenting that the tendency for blacks to vote, relative to whites, increases
in the jurisdiction’s black population share. Second, we construct longitudinal tests
making use of the fact that we observe turnout in one presidential (1996) and in two non-
presidential years (1994 and 1998). This allows us to ask how the black tendency to vote
changes in 1996 relative to 1994/1998 and whether this change varies with the size of the
local black population. We find that groups of locally isolated blacks experience a
sharper increase in turnout during presidential contests than blacks in heavily black
counties. This observation is consistent with the idea that the structure of media markets
influences turnout. In the absence of black-targeted local media, locally isolated blacks
have greater difficulty learning about local elections than blacks living in heavily black

4
areas. In contrast, both groups can learn about presidential contests through national
media coverage.
By highlighting the link between the structure of media markets and turnout, the
present study makes a first attempt to integrate the literatures on political economy and
the industrial organization of media markets. Recent voting studies (Shachar and
Nalebuff, 1999; Gerber and Green, 2000) emphasize the importance of voter mobilization
by political candidates. In modern electoral contests, such campaign efforts largely rely
on mass media to disseminate information. Thus, it appears natural to ask how the
structure of media markets influences mobilization efforts and ultimately turnout.
The paper proceeds in six sections. Section II discusses the role of the media in
influencing turnout rates. Section III describes the data used in the study. Section IV
presents evidence that political preferences differ between US blacks and whites. Section
V describes the empirical strategy employed in the study and presents evidence of
electoral acceleration. Section VI offers evidence for the mechanism that we posit. The
paper concludes with a discussion of the implications of our findings.
II. The Media and Political Participation
Political economy models of participation generally recognize two reasons why
citizens vote: the prospects of changing the outcome of an election and the utility that
voters get from the act of voting (Downs, 1957; Riker and Ordeshook, 1968). The chief
difficulty of explaining rational turnout in the standard framework is that both decision-
5
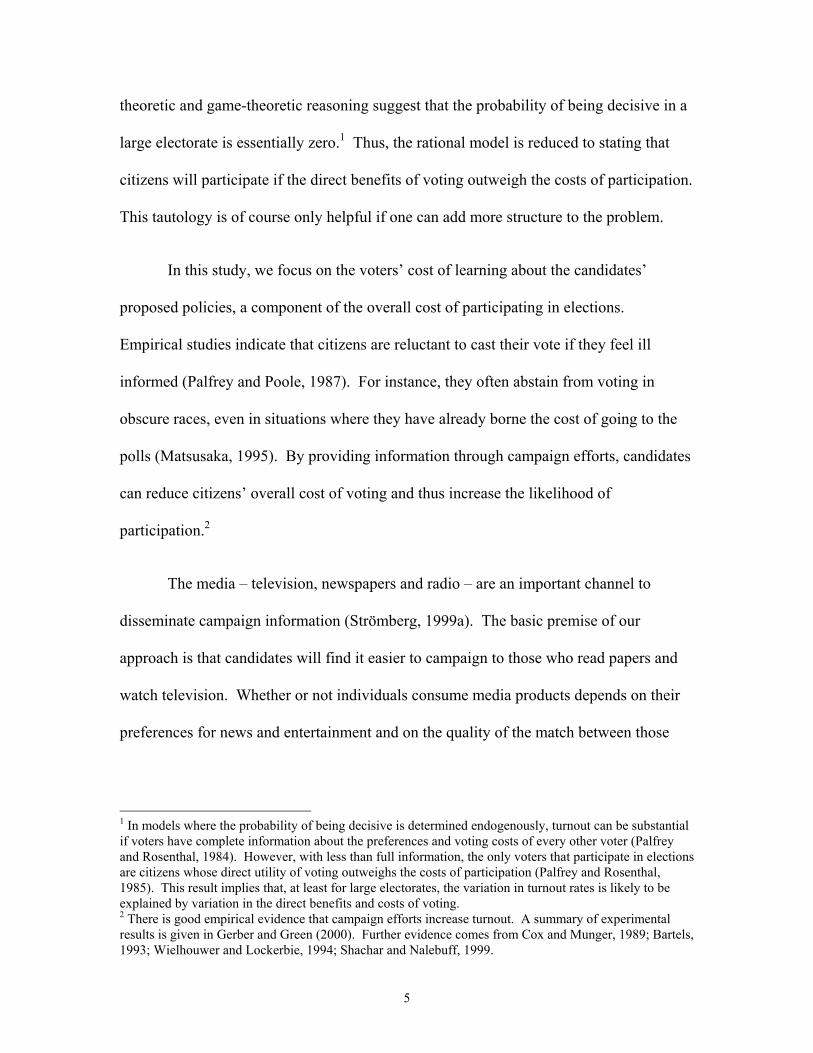
theoretic and game-theoretic reasoning suggest that the probability of being decisive in a
large electorate is essentially zero.1 Thus, the rational model is reduced to stating that
citizens will participate if the direct benefits of voting outweigh the costs of participation.
This tautology is of course only helpful if one can add more structure to the problem.
In this study, we focus on the voters’ cost of learning about the candidates’
proposed policies, a component of the overall cost of participating in elections.
Empirical studies indicate that citizens are reluctant to cast their vote if they feel ill
informed (Palfrey and Poole, 1987). For instance, they often abstain from voting in
obscure races, even in situations where they have already borne the cost of going to the
polls (Matsusaka, 1995). By providing information through campaign efforts, candidates
can reduce citizens’ overall cost of voting and thus increase the likelihood of
participation.2
The media – television, newspapers and radio – are an important channel to
disseminate campaign information (Strömberg, 1999a). The basic premise of our
approach is that candidates will find it easier to campaign to those who read papers and
watch television. Whether or not individuals consume media products depends on their
preferences for news and entertainment and on the quality of the match between those
1 In models where the probability of being decisive is determined endogenously, turnout can be substantial if voters have complete information about the preferences and voting costs of every other voter (Palfrey and Rosenthal, 1984). However, with less than full information, the only voters that participate in elections are citizens whose direct utility of voting outweighs the costs of participation (Palfrey and Rosenthal, 1985). This result implies that, at least for large electorates, the variation in turnout rates is likely to be explained by variation in the direct benefits and costs of voting. 2 There is good empirical evidence that campaign efforts increase turnout. A summary of experimental results is given in Gerber and Green (2000). Further evidence comes from Cox and Munger, 1989; Bartels, 1993; Wielhouwer and Lockerbie, 1994; Shachar and Nalebuff, 1999.

6
preferences and the programming that is on offer. The provision of media products
generally carries considerable fixed cost, which reduces the number of different products
that are available in the market. Thus, not all individuals will have access to products
that are to their liking. In particular, individuals are more likely to find appealing
programming if they are part of a larger group of consumers with similar preferences for
news and entertainment.
Two mechanisms give rise to this relationship between the size of a group and the
likelihood of consumption. First, larger markets support a greater variety of products and
hence increase the likelihood that individuals find media products they like. For
instance, black-targeted radio stations are only available in markets with many black
citizens (Siegelman and Waldfogel, 1998; Waldfogel, 1999). Second, for a given number
of products that can be supported in a market, product positioning is responsive to the
relative size of groups. For example, daily newspapers report more frequently about
issues of interest to blacks in cities with a larger black share of population. This in turn
increases black readership (George and Waldfogel, 2000).
A simple example illustrates the role of entry and positioning for the decision to
consume media products. For this example, we build on Hotelling’s (1929) classic model
of a linear city and consumers with unit demands to listen to a radio program. Candidates
use the radio to advertise their political platforms. Let ]1,0[∈nx denote the mix of
programming that station n offers. For instance, x might denote the fraction of
programming that is devoted to talk or to a particular style of music. The population
consists of a majority of size M and a minority of size m. Entertainment preferences are
7
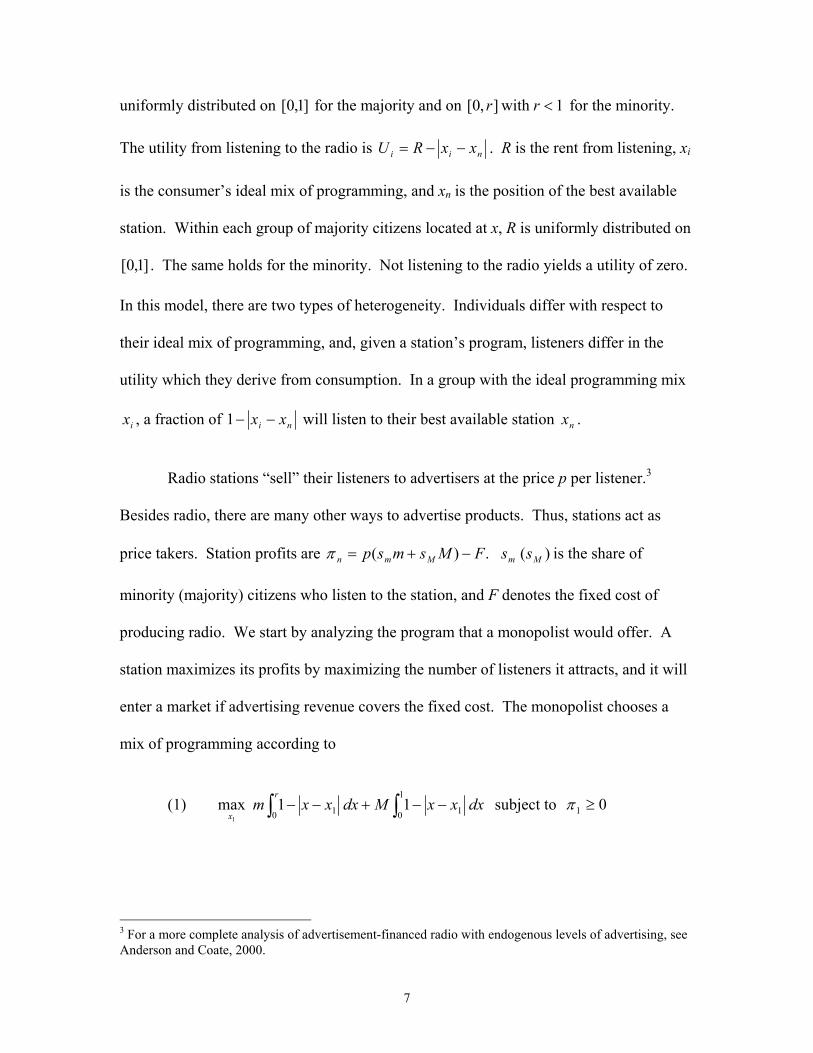
uniformly distributed on ]1,0[ for the majority and on 1 with ],0[ <rr for the minority.
The utility from listening to the radio is nii xxRU −−= . R is the rent from listening, xi
is the consumer’s ideal mix of programming, and xn is the position of the best available
station. Within each group of majority citizens located at x, R is uniformly distributed on
]1,0[ . The same holds for the minority. Not listening to the radio yields a utility of zero.
In this model, there are two types of heterogeneity. Individuals differ with respect to
their ideal mix of programming, and, given a station’s program, listeners differ in the
utility which they derive from consumption. In a group with the ideal programming mix
ix , a fraction of ni xx −−1 will listen to their best available station nx .
Radio stations “sell” their listeners to advertisers at the price p per listener.3
Besides radio, there are many other ways to advertise products. Thus, stations act as
price takers. Station profits are .)( FMsmsp Mmn −+=π )( Mm ss is the share of
minority (majority) citizens who listen to the station, and F denotes the fixed cost of
producing radio. We start by analyzing the program that a monopolist would offer. A
station maximizes its profits by maximizing the number of listeners it attracts, and it will
enter a market if advertising revenue covers the fixed cost. The monopolist chooses a
mix of programming according to
(1) dxxxMdxxxmr
x 1 1 max
1
0 1
0 11
∫∫ −−+−− subject to 01 ≥π
3 For a more complete analysis of advertisement-financed radio with endogenous levels of advertising, see Anderson and Coate, 2000.

8
Solving the above problem, the monopoly station, if it enters, offers
MMmrx −
−=21*
1 if *1xr ≤ and
MmMmrx
++
=21*
1 otherwise. Note that the number of
minority listeners would be maximized if the monopolist offered 21 rx = . For values of
1<r , the equilibrium mix is always to the “right” of the median minority citizen,
2*1 rx > . Furthermore, as the solutions to (1) indicate, the optimal mix moves closer to
the position of the median minority citizen as the minority increases in size,
0*1 <∂∂ mx .4 Hence, the number of minority listeners – and by implication the number
of minority citizens who receive campaign messages – increases in the size of the
minority. This is the product positioning effect discussed above. The larger the
minority, the better is the match of minority preferences and media content.
Next, suppose the market is large enough to support two stations, which offer 1x
and 2x , respectively. As above, stations maximize profits by choosing the locations that
attract the largest number of listeners. When choosing their own mix, stations take the
programming choice of the other station as given. We focus on cases where the
minority’s preferences are not too similar to the preferences of the majority. In
particular, we assume that 2)( *2
*1 xxr +< . The problem solved by the two stations is
4 The change in the optimal mix is given by 0
)(1
21
2
*1 <
+−
=∂∂
MmrM
mx
and 021*
1 <−=∂∂
Mr
mx
,
respectively.
9
(2) dxxxMdxxxmxx
r
x 1 1 max 2
0 1
0 1
21
1∫∫
+
−−+−− s.t. 01 ≥π
dxxxM xxx
1 max1
2 221
2∫ + −− s.t. 02 ≥π
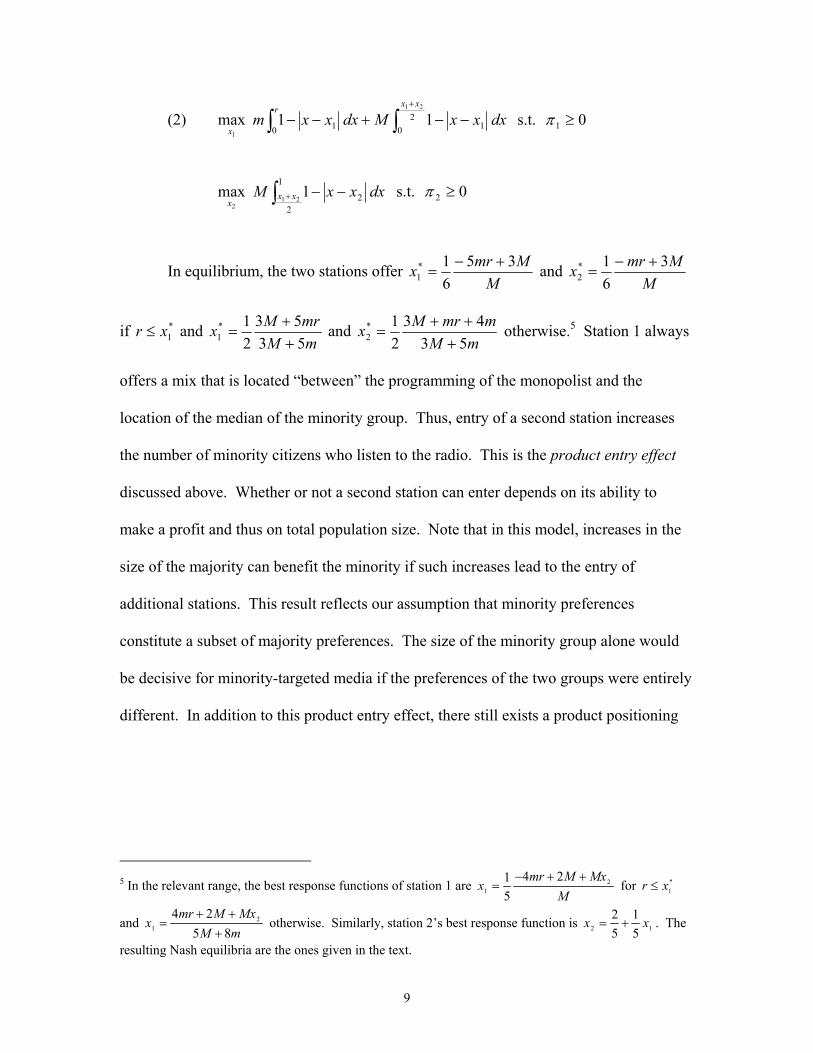
In equilibrium, the two stations offer M
Mmrx 3561*
1+−
= and M
Mmrx 361*
2+−
=
if *1xr ≤ and
mMmrMx
5353
21*
1 ++
= and mM
mmrMx53
4321*
2 +++
= otherwise.5 Station 1 always
offers a mix that is located “between” the programming of the monopolist and the
location of the median of the minority group. Thus, entry of a second station increases
the number of minority citizens who listen to the radio. This is the product entry effect
discussed above. Whether or not a second station can enter depends on its ability to
make a profit and thus on total population size. Note that in this model, increases in the
size of the majority can benefit the minority if such increases lead to the entry of
additional stations. This result reflects our assumption that minority preferences
constitute a subset of majority preferences. The size of the minority group alone would
be decisive for minority-targeted media if the preferences of the two groups were entirely
different. In addition to this product entry effect, there still exists a product positioning
5 In the relevant range, the best response functions of station 1 are
MMxMmr
x 21
2451 ++−
= for *1xr ≤
and mM
MxMmrx
8524 2
1 +++
= otherwise. Similarly, station 2’s best response function is 12 51
52 xx += . The
resulting Nash equilibria are the ones given in the text.

10
effect in the case with two stations. As the minority becomes larger, stations move
towards the median minority citizen.6
This example illustrates how a link between group size and the likelihood of
consumption can arise. If citizens who consume media products are more likely to
receive campaign messages and thus turn out, the model predicts a systematic
relationship between the size of groups and the likelihood of political participation.
Whether this suggested relationship is borne out in turnout data for the United States is
the subject of our empirical work. Before we turn to our results, we discuss the data
sources used in this study.
III. Data
This study draws on five sources of data. Voting data come from the 1994, 1996,
and 1998 Consumer Population Surveys (CPS). Every two years the CPS asks
individuals whether they voted in November. The dataset, which covers roughly 89,000
potential voters7 in 1994, 78,000 in 1996, and 77,000 in 1998, also reports socioeconomic
information about individuals, as well as geographic identifiers. While the 1994 CPS
reports counties for all observations, county identifiers are available for only about a
third of potential voters in 1996 and 1998. Table 1 shows how the raw tendency for US
6 The change for station 1 is 0
65*
1 <−=∂∂
Mr
mx
if *1xr ≤ and 0
)53(1
215
2
*1 <
+−
=∂∂
mMrM
mx
otherwise.
7 We include all persons who are eligible to vote whether they are registered or not. That is, we include individuals whose response to the question, “Did you vote in the November election?” was “yes” or “no”.
11
citizens over age 18 to vote varies between blacks and nonblacks in 1994, 1996, and
1998.8
The data on group size in each state and county are drawn from the 1990 Census.
The variation in group shares across states and counties is considerable. As Table 2
shows, the unweighted average white population share of counties is 84.5 percent, and
the median is 76.2 percent. The mean state black share is 8.6 percent, and the median is
1.7 percent. There is substantial variation, however. The 75th, 90th, and 95th percentile
states are 10, 30, and 41 percent black.
Whether or not differential turnout among white and black citizens influences
policy hinges on the political preferences of the two groups. We characterize their policy
preferences using data from the General Social Survey (GSS). The GSS has been
administered since 1972. The question on political preferences that we use was asked in
most years. These data include about 32,000 whites and 5,000 blacks.
The data for black-targeted weekly newspapers in each MSA is taken from
Burrelle’s Media Directory (2000). The Directory classifies each of the 9,772 weekly
newspapers in the United States according to its intended audience.9 These audiences
consist of twenty-three separate categories, including 224 papers in four categories we
classify as black-targeted (“black,” “black, general,” “ black, Hispanic,” and “black,
religious.”) Data on the number of black-targeted radio stations in each metro area are
derived from Duncan’s American Radio (Duncan and Moon, 1997).
8 Blacks are non-Hispanic blacks. 9 We classify a paper as “weekly” if it is published fewer than seven times per week.
12
IV. Electoral Acceleration Among Black Citizens
We chose to document electoral acceleration for the groups of black and non-
black citizens for two reasons. First, electoral acceleration is likely to arise if groups of
citizens have different media preferences. It is well known that the groups we study tend
to consume different radio shows, TV programs and newspapers. For example, in the
spring of 2001, seven out of the ten most popular TV shows among blacks were rated
among the ten least popular shows among whites (Nielson Media Research, 2001).
Second, differences in the likelihood of political participation are mostly of
interest if the political preferences of the minority differ from the views of the majority.
If blacks and whites had identical political preferences, a reduced tendency to vote
among black citizens would hardly matter because, by catering to white voters, elected
officials would implement policies which are also favored by blacks.10
How different are the policy preferences of white and black citizens? The GSS
asks respondents “Are we spending too much, too little, or the right amount on…” the
following 15 policies: space program, environment, health, city problems, crime, drugs,
education, race problems, defense, foreign aid, welfare, highways, social security, mass
transportation, and parks. Table 3 reports differences in policy preferences between
black and non-black respondents. Given the categorical nature of the data, we estimate
ordered probit models. The “Black-Nonblack” rows in Table 3 report, for each spending
10 Another possibility is that lawmakers direct beneficial programs at groups which can be reached via mass media. Strömberg (1999b) shows how New Deal spending was directed at those who owned radios.
13
category, the model’s predicted difference between the two groups in the probability of
giving a particular answer. The results are striking: blacks’ and nonblacks’ answers
differ significantly in all but one spending category (mass transportation). Relative to
nonblacks, blacks think that the US government spends too little on 11 of 15 categories
(except the space program, defense, and highways). These results indicate that blacks
and nonblacks have different political preferences. Thus, if black participation varies
with access to media products, such changes in turnout are likely to impact policy-
making (Husted and Kenny, 1997).
V. Documenting Electoral Acceleration
A. Empirical Implementation
We employ three basic empirical strategies for documenting the effect of group
size on a citizen’s tendency to vote. First, we examine the cross sectional relationship
between her tendency to vote in a particular election year and, say, the fraction that are of
her type in her jurisdiction. Second, by pooling black and nonblack data and including
jurisdiction fixed effects, we examine the relationship between, say, the percent black
and the gap between black and white turnout. Third, we make use of the contrast
between local and higher-level (statewide or national) elections to construct longitudinal
tests.

14
B. Specifications and Results
1. Cross-sectional Analyses
The simplest measurement framework one might employ is cross sectional,
(1) isii bXV ναβ ++= ,
where Vi denotes whether the individual votes, Xi contains individual characteristics
(income and education dummies, age terms, whether she lives in an MSA), bs is the state
black share (or the county black share bc) and νi is an error term. If, as we asserted in
Section 2, the positioning of media products is responsive to the relative size of groups,
we expect α to be positive for blacks. In addition to using shares, we can also use the
absolute levels of jurisdiction population. The size of the population is related to the
likelihood of product entry and in turn individual consumption. Let Ws be a state’s
nonblack population and Bs the black population. Then the basic setup is
(2) isb
sw
ii BAWAXV νβ +++= .
As product entry is more likely for larger groups, we expect Ab > 0 for blacks.
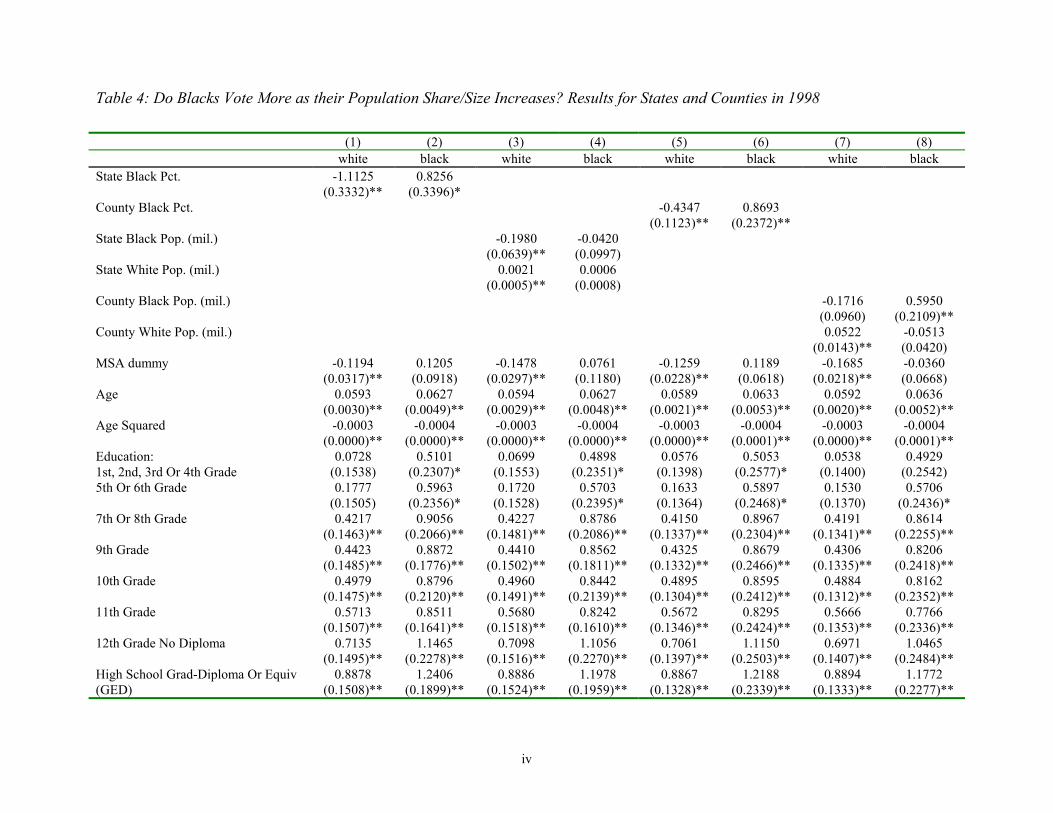
State and county-level estimates for these models are reported in table 4. The results are
quite striking. Increases in the black population share increase black and decrease white
participation rates significantly both at the state and at the county level. The effects for
the absolute population levels are more mixed. The size of the black population appears
to matter at the county, but not at the state level. Age, income, and education perform as
documented elsewhere in the literature (Wolfinger and Rosenstone, 1980; Matsusaka and

15
Palda, 1999). The tendency to vote increases almost monotonically in education and
household income, and it increases in age, albeit at a decreasing rate. We find
qualitatively similar results for 1996 and 1998.
Though highly suggestive, the basic cross section results are vulnerable to the
concern that the relationship between black population shares and group voting
tendencies reflects unobserved heterogeneity in state and county tendencies to vote. That
is, we are concerned that νi=µs+εi, where µs is a jurisdiction fixed effect and εi is a well-
behaved individual error. For example, blacks may tend to live in places where all
persons have high tendencies to vote due to unobservable factors. We can eliminate this
unobserved heterogeneity that is constant across groups within jurisdictions with
jurisdiction fixed effects estimates, which we implement by estimating voting probits on
the black percent and/or population terms interacted with a black dummy, as well as race-
specific MSA and education effects. That is, our second measurement approach pools
data by race and includes jurisdiction fixed effects that are common across race. Define
bδ as an indicator that is 1 for black individuals. For simplicity, we describe the model
in terms of the share model given in (1):
(3) issbbb
ib
ii bXXV εµδγδγβδβ +++++= 21 .
In this model, µs is the jurisdiction fixed effect and γ2, the coefficient on the black
dummy × jurisdiction black population share, reflects the effect of the state’s black share
on the difference between black and nonblack voting tendencies.

16
Table 5 reports these results for state-level variables. In 1994 and in 1998, blacks
are significantly more likely to vote, relative to whites, in states with higher black
population shares. We observe the same positive relationship in the presidential year,
though the effect is much smaller and not statistically significant. This is our first hint
that electoral acceleration operates differently in national and in local elections. We will
return to this point below. In columns 3, 6 and 9, we include the interactions of bδ with
both the black population share and with the absolute size of the black and the white
populations. We find that the fraction black is a more important determinant of turnout.
Linear probability models using county-level data confirm the basic pattern: Blacks are
more likely to turn out as the population share of blacks increases.11 These estimates
show that electoral acceleration is not attributable to the kinds of places where blacks
live.
2. Longitudinal Tests
The results above may still arise because politically engaged blacks choose to live
in cities with many blacks. We address this concern with longitudinal tests comparing
the changed tendency for blacks to vote in local and nonlocal elections. Consider two
black citizens, the first living in a city with many blacks and black-targeted media
products, the second in a city with few blacks and no local black-targeted media. In a
year with only local elections, the locally isolated black citizen is hard for candidates to
reach and he is relatively unlikely to participate in the local election. In the city with
11 For reasons of space, we do not always report county-level results. The full set of tables is available upon request.

17
black-targeted media, local candidates can use these channels to disseminate campaign
information, leading to a relatively higher likelihood of turning out for the black citizen
in the more heavily black city.
In years with a presidential contest, both local and national media provide
information. While the locally isolated black citizen had difficulty learning about local
races, he can now rely on national media outlets to learn about presidential candidates.
The citizen in the more heavily black city also has access to information from local and
national sources. However, as local sources already cover the presidential race from a
perspective that is of interest to blacks, adding a national media outlet provides blacks in
heavily black areas with less additional information than isolated blacks who have little
exposure to local reporting. This suggests that turnout among locally isolated blacks
should increase more sharply in the presence of a presidential race than turnout among
blacks in more heavily black areas. This is the logic that underlies our longitudinal tests.
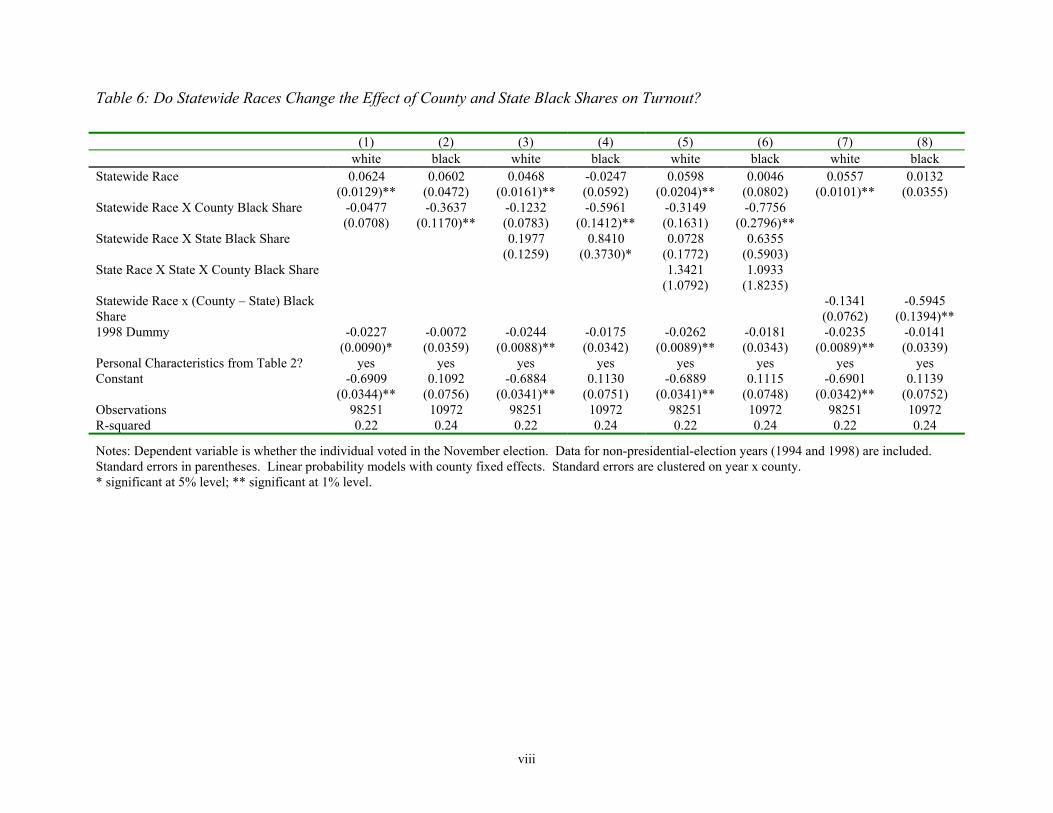
We start exploring this conjecture by asking whether blacks in predominantly
white counties are more energized by statewide elections than blacks in heavily black
counties. This question is best examined using election data from non-presidential years.
Define 98δ as an indicator for 1998, and sδ as an indicator for the existence of a
statewide race. Then one can estimate the effect of interest using the following
specification,
(4) iccss
ii bXV εµδφδφδφβ +++++= 3298
1 .

18
In this framework, µc is a county fixed effect. The model is estimated separately by race
on 1994 and 1998 data, and in the black model, the coefficient φ3 shows how much less a
statewide election increases the black tendency to vote as the citizen’s county is more
heavily black. The variable of primary interest, csbδ , varies only by year × county in our
sample. To account for this, we cluster standard errors on year × county. For counties
whiter than average for the state, we expect the non-local media coverage of the
statewide race to increase turnout more for isolated blacks. That is, we expect φ3 to be
negative for blacks. Columns (1) and (2) of table 6 report these results, for whites and
blacks, respectively. We find that φ3 is negative and significant for blacks and small and
insignificant for whites.
This specification is arguably incomplete because the effect of black isolation
should depend on how isolated blacks are in their states, relative to the state as a whole.
To accommodate this possibility, we augment specification (4) in three ways. First, we
add the state black share interacted with a statewide election dummy,
(4a) icss
css
ii bbXV εµδφδφδφδφβ ++++++= 43298
1 .
The higher the black population share at the state level, the greater the incentive for
regional media to cater to black interests throughout the state. Hence, we expect φ4 to be
positive and, as before, φ3 to be negative for blacks. Columns (3) and (4) of table 6
report these results. For blacks, φ4 is positive and significant and φ3 is negative and
significant. Neither is significant for whites.
19
In a second modification of (4), we include a statewide dummy interacted with
the county and the state black share. This allows the effect of the county black share to
differ according to the black share of the state,
(4b) iccss
ss
css
ii bbbbXV εµδφδφδφδφδφβ +++++++= 543298
1 .
Columns (5) and (6) of table 6 report these results, and φ5 is not significant. A third
possibility is a special case of (4a) that merits mention, namely φ3 = -φ4. We test whether
a county’s excess of black share over the state share influences turnout using the
following specification,
(4c) icscss
ii bbXV εµδφδφδφβ ++−+++= )(6298
1 .
Differences in media coverage at the local and the regional or national level lead us to
expect that φ6 < 0 for blacks. Columns (7) and (8) report this specification. Consistent
with our previous findings, φ6 is negative and significant for blacks and small and
insignificant for whites. That is, the increase in black turnout for a statewide race is
larger, the larger the white population share of the county is relative to the state-level
share of whites.
We can perform an analogous test with the presidential election year data. The
question is whether the increase in black voter turnout in presidential years is larger for
blacks isolated in predominantly white states than for blacks in more heavily black states.
The tests based on the presidential election are analogous to the statewide race tests,

20
except that the presidential race, unlike statewide races, occurs everywhere
simultaneously.
The simplest way to measure the effect is to run race-specific regressions with
year dummies, state fixed effects, the interaction of state black share with the 1996
dummy, and demographic controls. We also include a statewide election dummy, along
with its interaction with the state’s percent black.
(5) isssssii bbXV εµδφδφδαδφδφβ +++++++= 21969698989696 .
The coefficient 96α is of greatest interest; in the black regression it shows how the 1996
level of black voting deviates from the common national time pattern as the state is more
heavily black. The variable of interest, sb96δ , varies by year within state, and we cluster
standard errors correspondingly. In columns (1) and (2) of Table 7, we estimate the
coefficient to be –0.22 for blacks and 0.21 for whites, indicating that states with higher
black shares experience smaller increases in black turnout in presidential elections,
relative to other elections. This indicates that the presidential election raises turnout
among blacks more as they are more isolated in predominantly white states. We can also
estimate specification (5) with county instead of state-level shares of blacks. The county
results show the same pattern as our state-level findings. A presidential contest is
particularly effective in raising turnout among locally isolated blacks (results available
upon request).
Because we have two years of non-presidential election data, we can allow for
state- and race-specific time trends in turnout:

21
(6) iss
ssssii tbbXV εµλδφδφδαδφβ +++++++= 2196969696 .
In this specification, the year effects pick up deviations from the time trends. Columns
(3) and (4) of table 7 report estimates of (6). Here, again, standard errors are clustered on
year × state. The results are consistent with the findings in the first two columns of table
7. Turnout rates of locally isolated blacks increase to a greater extent in the presidential
year.
Tables 4-7 provide considerable evidence that electoral acceleration operates. As
black citizens make up a larger share of the population, they become more inclined to
participate in elections. There are many possible reasons for the cross-sectional
relationships that we observe. For instance, politically more active black citizens may
choose to live in cities with larger black populations. However, this type of unobserved
heterogeneity cannot account for our longitudinal results. Because the same people live
in each jurisdiction during both the local and nonlocal elections, the changed turnout in
local vs. nonlocal elections does not reflect the way that blacks sort themselves into
communities.12 In the next section, we investigate more closely one of the mechanisms
that can give rise to electoral acceleration, the availability of minority-targeted media
outlets.
12 The results can arise if blacks move to white states or counties only to the extent that they lack interest in local, but not in national, affairs. This seems implausible.
22
VI. Mechanism
Our arguments in Section 2 suggest that the structure of media markets may be
one reason why electoral acceleration exists. In this section, we explore this mechanism
empirically, using newspapers and radio stations as examples for channels of
communication that can be used to disseminate political information.
The first two columns of table 8 present regressions of the white and black
tendency to vote on the number of black-targeted newspapers in the MSA. We estimate
linear probability models because of the large numbers of MSA fixed effects, and we
cluster standard errors on MSA. The results are consistent with the hypothesis that a
larger number of black-targeted media outlets increases black participation rates. The
number of weeklies bears a positive relationship to the black tendency to vote, but none
to white participation rates. Column 3 includes a MSA fixed effect and confirms that,
relative to whites, blacks are more likely to vote in MSAs with more black weeklies. In
columns 4, 5 and 6 of table 8, we repeat the analysis for black weeklies with the number
of black-targeted radio stations. Again, we find that the number of black-targeted
stations bears a positive relationship to differences between black and white voting
tendencies. As the results in columns 3 and 6 indicate, the positive effect of the number
of minority-targeted media outlets on minority participation is not due to fixed
unobserved differences between MSAs.
The Federal Communication Commission (FCC) has long pursued policies
promoting minority ownership of broadcast media, so from a public policy perspective, it
is interesting to ask whether white and black owners of minority-targeted radio stations
23
offer the same inducement for blacks to participate in elections. We might expect to find
race-specific ownership effects if black owners receive greater benefits than whites from
disseminating political information that is of interest to blacks.13 In columns 7, 8 and 9,
we distinguish between black-owned and white-owned black-targeted stations. Both
types of stations induce blacks to vote, while there is no effect on white participation
rates.
The results in Table 8 appear to confirm that greater access to media increases the
likelihood of participating in elections. However, there is a concern that the number of
media outlets is endogenously determined with the tendency to vote. We address this
issue with a different identification strategy based on changes in the number of black-
targeted radio stations. The 1996 Telecommunications Act substantially lifted
restrictions on local station ownership. This change in legislation caused an increase in
ownership concentration, which in turn significantly reduced the growth of stations and
increased variety (Berry and Waldfogel, 2001).
Using longitudinal data on black-targeted media and voting, we can thus ask how
the black voting tendency changes, 1994 to 1998, with changes in the number of black-
targeted media outlets. The first two columns of table 9 show regressions of white and
black voting tendencies on a 1998 dummy, the number of local black-targeted radio
stations, which can substantially change between the two time periods as a result of the
13 Siegelman and Waldfogel (1998) find that the number of black-owned stations increases the number of black-targeted stations, all else constant, suggesting that black station owners have different motivations. Data on minority ownership of radio stations are taken from http://www.ntia.doc.gov/reports/97minority/list.htm.

24
change in legislation, and MSA fixed effects. We find that the white voting tendency is
unaffected by the number of black-targeted radio stations, while black participation rates
increase in the number of stations. These results, consistent with our cross sectional
findings, are not due to fixed unobserved heterogeneity.
Columns 3 and 4 show that black-targeted stations affect voting differently
according to whether the stations are black-owned. Black-owned and targeted stations
have a large effect on black voting (and a much smaller, albeit significant, positive
impact on white voting), while white-owned black-targeted stations have no significant
impact on black or white voting. This finding suggests that ownership has a
consequential effect on content, even within stations that are targeted at black
audiences.14
The results in tables 8 and 9 provide reasonable support for the view that electoral
acceleration is at least in part due to the structure of media markets. As the size of a
group increases, members of this group can enjoy a larger number of media products that
are specifically tailored to their tastes. The existence of these channels of communication
make it easier for candidates to target campaign efforts at the group, thereby lowering the
costs of learning about the candidates’ positions and thus increasing the likelihood of
participation.
14 This result is interesting in light of Siegelman and Waldfogel’s (2001) finding that increases in the number of black-owned stations raise the number of black-targeted stations.

25
VII. Concluding Discussion
Theories of democratic decision-making have long recognized that policy
outcomes depend on the spatial distribution of citizen preferences. In the standard
median voter model, for example, “moving” types from one jurisdiction to the next
affects policy by changing the identity of the median citizen. The novel empirical result
of this study is that the tendency to participate in elections also depends on the
distribution of types. Electoral acceleration produces a systematic bias between the
median voter and the median citizen toward the group whose participation is augmented
by its larger share.
But how large is this deviation? Our estimates allow us to calculate this. If
ΦW(p) and ΦB(p) are linear probability estimates mapping a county’s black population
share p to the white and black participation probabilities, respectively, then the black
share of voters is pV = pΦB(p) / [pΦB(p) + (1-p)ΦW(p)]. We calculated pV using our cross
sectional specification (3) with county-level data for 1998. When p is 0, so is pV. At the
median black population share (1.7%), the black share of voters is 30% below the black
share of population (χ2 = 45.36). At the 75th percentile, the difference is 21% (χ2 =
10.84). It is only at the 95th percentile of the black population share (41%) that we
cannot reject the hypothesis that the black population share is equal to the share of black
voters. Given the sharp differences in policy preferences between blacks and non-blacks
that we documented in Section IV, it appears likely that the considerable gap between the
black population share and the fraction of the electorate that is black has a considerable
influence on policy-making. As demonstrated earlier, the gap tends to be smaller in years

26
with presidential elections. Using the same specification (3) with county-level data for
the presidential year 1996, we only find significant differences up to the 90th percentile of
the black population share, where the gap amounts to 3% (χ2 = 6.14).
Our work addresses differences between black and white voting tendencies
because whites and blacks belong to different groups: They have substantially different
political preferences, and they tend to consume different media products. However, for
our study, it is not necessary that race causes blacks and whites to belong to different
groups. In contrast to the approach taken here, there is a substantial literature which
assumes that race determines the likelihood of political participation (Bobo and Gilliam,
1990).15 Several papers maintain that a strong sense of “ethnic community” and “black
consciousness” influences turnout rates (Verba and Nie, 1972; Shingles, 1981). Studies
using data from the 1950s and 1960s generally find that blacks are more likely to
participate than whites when one controls for demographic differences. More recent
analyses for the late 1980s indicate that such differences have disappeared (Bobo and
Gilliam, 1990).
Our study of electoral acceleration contributes to this literature by emphasizing
that some of the differences in participation between blacks and whites may be
interpreted as stemming from differences in the fraction of the population that is black.
To our knowledge, this hypothesis has not been tested in previous studies. Rather than
15 Some studies identify race-specific institutional differences such as voter literacy tests, poll taxes (Filer, Kenny and Morton, 1991), and political resources in general (Wolfinger and Rosenstone, 1980) as reasons why turnout rates may differ between races. Others emphasize racial differences in socioeconomic status (Olsen, 1970; Verba and Nie, 1972).

27
interpreting declining rates of participation among blacks as stemming from changing
values and varying degrees of political empowerment, electoral acceleration suggests that
changes over time in the tendency to vote may reflect changes in the geographic
dispersion of a group. In fact, Cutler et al. (1999) document just such a change: Since
1970, segregation in the US has decreased considerably because blacks have moved into
previously all-white areas. The theory outlined here predicts that blacks who have
moved and the now less numerous minorities which are left behind are less likely to vote.
This and similar implications of electoral acceleration are interesting avenues for future
research.
More generally, we see the current paper as a first attempt to integrate the
political economy and industrial organization literatures to further our understanding of
political participation. Recent voting studies (Shachar and Nalebuff, 1999; Gerber and
Green, 2000) emphasize the importance of voter mobilization by political elites. While
there is little doubt that such mobilization efforts are successful, it is not obvious why
citizens should go to the polls if candidates call on them to do so. This paper offers an
information-based interpretation of voter mobilization. Citizens are more likely to turn
out if their search for political information is subsidized through campaign efforts. In
modern electoral contests, most campaign information is disseminated via mass media.
The current study is novel in that it documents how the structure of media markets leaves
an imprint on patterns of turnout.
Following Olson (1971) and Becker (1983), there has been much interest in
instances where small groups have a disproportionately large influence on policy

28
outcomes. Electoral acceleration provides an example for a mechanism which puts small
groups at a disadvantage. While the ability to solve problems of collective action
undoubtedly contributes to a group’s political effectiveness, our findings highlight the
importance of other determinants of political influence which run counter to the intuition
that small groups generally enjoy a relative competitive advantage.
VIII. Literature
Anderson, Simon P. and Stephen Coate (2000). Market Provision of Public Goods: The Case of Broadcasting. NBER Working Paper 7513.
Becker, Gary S. (1983). A Theory of Competition among Pressure Groups for Political Influence. The Quarterly Journal of Economics 98(3): 371-400.
Berry, Steven and Joel Waldfogel (2001). Do Mergers Increase Product Variety? Evidence from Radio Broadcasting. Quarterly Journal of Economics 116(3): 1009-1026.
Bobo, Lawrence and Franklin D. Gilliam (1990). Race, Sociopolitical Participation, and Black Empowerment. American Political Science Review 84(2): 377-93.
Cox, Gary W. and Michael C. Munger (1989). Closeness, Expenditures, and Turnout in the 1982 U.S. House Elections. American Political Science Review 83(1): 217-31.
Cutler, David M.; Edward L. Glaeser and Jacob L. Vigdor (1999). The Rise and Decline of the American Ghetto. Journal of Political Economy 107(3): 455-506.
Downs, Anthony (1957). An Economic Theory of Democracy. New York: Harper and Row.
Duncan, James H. and Thom Moon (1997). Duncan's American Radio. Cincinnati: Duncan's American Radio.
Filer, John E.; Lawrence W. Kenny and Rebecca B. Morton (1991). Voting Laws, Educational Policies, and Minority Turnout. Journal of Law and Economics 34(October): 371-93.
George, Lisa and Joel Waldfogel (2000). Who Benefits Whom in Daily Newspaper Markets. NBER Working Paper 7944.
Gerber, Alan S. and Donald P. Green (2000a). The Effect of a Nonpartisan Get-out-the-Vote Drive: An Experimental Study of Leafletting. Journal of Politics 62(3): 846-57.

29
Gerber, Alan S. and Donald P. Green (2000b). The Effects of Canvassing, Telephone Calls, and Direct Mail on Voter Turnout: A Field Experiment. American Political Science Review 94(3): 653-63.
Hotelling, Harold (1929). Stability in Competition. Economic Journal 39: 41-57.
Husted, Thomas A. and Lawrence W. Kenny (1997). The Effect of the Expansion of the Voting Franchise on the Size of Government. Journal of Political Economy 105(1): 54-82.
Lijphart, Arend (1997). Unequal Participation: Democracy's Unresolved Dilemma. American Political Science Review 91(1): 1-14.
Madison, James (1788). Paper No. 10. In: The Federalist: A Commentary on the Constitution of the United States. New York: Random House:
Matsusaka, John G. (1995). Explaining Voter Turnout Patterns: An Information Theory. Public Choice 84(1-2): 91-117.
Matsusaka, John G. and Filip Palda (1999). Voter Turnout: How Much Can We Explain? Public Choice 98(3-4): 431-446.
Mill, John Stuart (1859). On Liberty. New York: Macmillan.
Olsen, Marvin E. (1970). Social and Political Participation of Blacks. American Sociological Review 35: 682-97.
Olson, Mancur (1971). The Logic of Collective Action: Public Goods and the Theory of Groups. Cambridge, Mass.: Harvard University Press.
Palfrey, Thomas R. and Keith T. Poole (1987). The Relationship between Information, Ideology, and Voting Behavior. American Journal of Political Science 31(August): 511-30.
Palfrey, Thomas R. and Howard Rosenthal (1984). Participation and the Provision of Discrete Public Goods: A Strategic Analysis. Journal of Public Economics 24(2): 171-93.
Palfrey, Thomas R. and Howard Rosenthal (1985). Voter Participation and Strategic Uncertainty. American Political Science Review 79(1): 62-78.
Riker, William H. and Peter C. Ordeshook (1968). A Theory of the Calculus of Voting. American Political Science Review 62: 25-43.
Shachar, Ron and Barry Nalebuff (1999). Follow the Leader: Theory and Evidence on Political Participation. American Economic Review 89(3): 525-47.
Shingles, Richard D. (1981). Black Consciousness and Political Participation: The Missing Link. American Political Science Review 75: 76-91.
Siegelman, Peter and Joel Waldfogel (1998). Race and Radio: Preference Externalities, Minority Ownership, and the Provision of Programming to Minorities. Mimeo Wharton School, University of Pennsylvania.
Strömberg, David (1999a). Mass Media Competition, Political Competition, and Public Policy. Mimeo IIES: Stockholm University.
30
Strömberg, David (1999b). Radio's Impact on New Deal Spending. Mimeo IIES: Stockholm University.
Verba, Sydney and Norman H. Nie (1972). Participation in America. New York: Harper & Row.
Waldfogel, Joel (1999). Preference Externalities: An Empirical Study of Who Benefits Whom in Differentiated Product Markets. NBER Working Paper No. W7391.
Wielhouwer, Peter W. and Bard Lockerbie (1994). Party Contacting and Political Participation, 1952-1990. American Journal of Political Science 38(1): 211-29.
Wolfinger, Raymond E. and Steven J. Rosenstone (1980). Who Votes? New Haven: Yale University Press.

i
Table 1: Voter Turnout by Group
1994 1996 1998
Non-Black
% voting 53.7 64.2 51.5
N 80,956 71,149 70,481
Black
% voting 45.8 61.0 49.4
N 8,635 7,160 7,072
The source for the data are the 1994, 1996, and 1998 CPS, voting and registration modules. “Voting” is turnout in the November 1994, 1996, and 1998 elections.

ii
Table 2: Percent in Each Group, across Counties and States
Counties percentiles mean 5 10 25 50 75 90 95 Nonblack 91.4.5% 59.0% 69.9% 90.0% 98.3% 99.7% 99.9% 100.0% Black 8.6% 0.0% 0.1% 0.3% 1.7% 9.9% 30.1% 41.0% States mean 5 10 25 50 75 90 95 Nonblack 89.5% 69.9% 75.1% 85.4% 92.7% 97.6% 99.1% 99.2% Black
10.5%
0.8%
0.9%
2.4%
7.2%
14.6%
24.9%
30.1%
The source is the 1990 Census; unweighted averages across counties and states

iii
Table 3: Unconditional Differences in Policy Preferences between Blacks and Nonblacks: ”Are we spending too much, too little, or about the right amount on …”
Space
Program Environmen
t Health City
Problems Crime Drugs Education Race
Problems Black Coefficient (Std. Error)
0.716 (0.025)*
-0.208(0.024)*
-0.369(0.025)*
-0.493(0.025)*
-0.175
(0.025)* -0.258
(0.025)* -0.461
(0.025)* -1.552
(0.027)* Black-Nonblack (prob in %) ”too little” -9.7 7.8 12.9 18.9 5.8 9.3 16.5 55.8 “about right”
-17.4
-4.7
-9.4
-8.7
-4.0
-6.0
-11.5
-32.3
Defense Foreign Aid Welfare Highways Social
Security Mass
Transportation
Parks
Black Coefficient (Std. Error)
0.210
(0.022)* -0.204
(0.025)* -0.838
(0.022)* 0.158
(0.023)*
-0.531
(0.026)* 0.006
(0.023) -0.350
(0.024)* Black-Nonblack (prob in %) ”too little” -5.8 2.3 27.7 -6.0 20.0 -0.2 13.2 “about right”
-2.0
4.6
3.5
3.3
-15.0
0.1
-9.7
*significant at 1% level Coefficients are given for an ordered probit model where the dependent variable takes on the following values: 1=”too little”, 2=”about right”, 3=”too much”; robust standard errors in parentheses The row “Black (prob in %) “too little” presents the predicted difference in the probability between blacks and nonblacks that they would choose this category.
iv
Table 4: Do Blacks Vote More as their Population Share/Size Increases? Results for States and Counties in 1998
(1) (2) (3) (4) (5) (6) (7) (8) white black white black white black white black State Black Pct. -1.1125 0.8256 (0.3332)** (0.3396)* County Black Pct. -0.4347 0.8693 (0.1123)** (0.2372)** State Black Pop. (mil.) -0.1980 -0.0420 (0.0639)** (0.0997) State White Pop. (mil.) 0.0021 0.0006 (0.0005)** (0.0008) County Black Pop. (mil.) -0.1716 0.5950 (0.0960) (0.2109)** County White Pop. (mil.) 0.0522 -0.0513 (0.0143)** (0.0420) MSA dummy -0.1194 0.1205 -0.1478 0.0761 -0.1259 0.1189 -0.1685 -0.0360 (0.0317)** (0.0918) (0.0297)** (0.1180) (0.0228)** (0.0618) (0.0218)** (0.0668) Age 0.0593 0.0627 0.0594 0.0627 0.0589 0.0633 0.0592 0.0636 (0.0030)** (0.0049)** (0.0029)** (0.0048)** (0.0021)** (0.0053)** (0.0020)** (0.0052)** Age Squared -0.0003 -0.0004 -0.0003 -0.0004 -0.0003 -0.0004 -0.0003 -0.0004 (0.0000)** (0.0000)** (0.0000)** (0.0000)** (0.0000)** (0.0001)** (0.0000)** (0.0001)** Education: 0.0728 0.5101 0.0699 0.4898 0.0576 0.5053 0.0538 0.4929 1st, 2nd, 3rd Or 4th Grade (0.1538) (0.2307)* (0.1553) (0.2351)* (0.1398) (0.2577)* (0.1400) (0.2542) 5th Or 6th Grade 0.1777 0.5963 0.1720 0.5703 0.1633 0.5897 0.1530 0.5706 (0.1505) (0.2356)* (0.1528) (0.2395)* (0.1364) (0.2468)* (0.1370) (0.2436)* 7th Or 8th Grade 0.4217 0.9056 0.4227 0.8786 0.4150 0.8967 0.4191 0.8614 (0.1463)** (0.2066)** (0.1481)** (0.2086)** (0.1337)** (0.2304)** (0.1341)** (0.2255)** 9th Grade 0.4423 0.8872 0.4410 0.8562 0.4325 0.8679 0.4306 0.8206 (0.1485)** (0.1776)** (0.1502)** (0.1811)** (0.1332)** (0.2466)** (0.1335)** (0.2418)** 10th Grade 0.4979 0.8796 0.4960 0.8442 0.4895 0.8595 0.4884 0.8162 (0.1475)** (0.2120)** (0.1491)** (0.2139)** (0.1304)** (0.2412)** (0.1312)** (0.2352)** 11th Grade 0.5713 0.8511 0.5680 0.8242 0.5672 0.8295 0.5666 0.7766 (0.1507)** (0.1641)** (0.1518)** (0.1610)** (0.1346)** (0.2424)** (0.1353)** (0.2336)** 12th Grade No Diploma 0.7135 1.1465 0.7098 1.1056 0.7061 1.1150 0.6971 1.0465 (0.1495)** (0.2278)** (0.1516)** (0.2270)** (0.1397)** (0.2503)** (0.1407)** (0.2484)** High School Grad-Diploma Or Equiv 0.8878 1.2406 0.8886 1.1978 0.8867 1.2188 0.8894 1.1772 (GED) (0.1508)** (0.1899)** (0.1524)** (0.1959)** (0.1328)** (0.2339)** (0.1333)** (0.2277)**

v
Table 4, continued
Some College But No Degree 1.2050 1.4504 1.2032 1.4025 1.2072 1.4306 1.2061 1.3830 (0.1469)** (0.1980)** (0.1482)** (0.2037)** (0.1329)** (0.2382)** (0.1338)** (0.2314)** Associate Degree- 1.1740 1.4994 1.1774 1.4332 1.1783 1.4876 1.1815 1.4250 Occupational/Vocational (0.1496)** (0.1819)** (0.1511)** (0.1933)** (0.1329)** (0.2495)** (0.1337)** (0.2446)** Associate Deg.-Academic Program 1.3103 1.7510 1.3088 1.6749 1.3152 1.7410 1.3139 1.6664 (0.1521)** (0.2143)** (0.1526)** (0.2283)** (0.1344)** (0.2561)** (0.1355)** (0.2516)** Bachelor's Degree(ba,ab,bs) 1.4495 1.6909 1.4482 1.6410 1.4534 1.6690 1.4501 1.6181 (0.1516)** (0.1774)** (0.1532)** (0.1794)** (0.1351)** (0.2394)** (0.1360)** (0.2333)** Master's Degree 1.5914 1.8853 1.5875 1.8485 1.5894 1.8729 1.5856 1.8271 (MA, MS, MEng, MEd, MSW) (0.1518)** (0.2946)** (0.1529)** (0.2947)** (0.1354)** (0.2642)** (0.1359)** (0.2569)** Professional School Degree 1.5677 2.0730 1.5472 2.0348 1.5580 2.0759 1.5432 2.0240 (MD, DDS, DVM) (0.1511)** (0.2937)** (0.1519)** (0.2903)** (0.1423)** (0.3362)** (0.1430)** (0.3257)** Doctorate Degree (PhD, EdD) 1.4668 1.8297 1.4529 1.7633 1.4646 1.7973 1.4600 1.7566 (0.1507)** (0.2906)** (0.1512)** (0.2935)** (0.1418)** (0.3573)** (0.1423)** (0.3568)** Household income 0.0313 0.1589 0.0302 0.1585 0.0263 0.1490 0.0250 0.1534 5,000 to 7,499 (0.0411) (0.0615)** (0.0413) (0.0638)* (0.0450) (0.0745)* (0.0448) (0.0744)* 7,500 to 9,999 0.1463 0.1851 0.1471 0.1903 0.1406 0.1850 0.1413 0.1844 (0.0462)** (0.0893)* (0.0462)** (0.0884)* (0.0443)** (0.0848)* (0.0446)** (0.0855)* 10,000 to 12,499 0.2218 0.2333 0.2234 0.2476 0.2164 0.2513 0.2189 0.2487 (0.0421)** (0.0888)** (0.0421)** (0.0857)** (0.0426)** (0.0822)** (0.0427)** (0.0819)** 12,500 to 14,999 0.3062 0.2067 0.3066 0.2193 0.2982 0.2021 0.2997 0.2186 (0.0419)** (0.0633)** (0.0423)** (0.0599)** (0.0436)** (0.0830)* (0.0437)** (0.0810)** 15,000 to 19,999 0.3971 0.2580 0.3972 0.2816 0.3896 0.2813 0.3911 0.2941 (0.0387)** (0.0866)** (0.0385)** (0.0812)** (0.0403)** (0.0866)** (0.0405)** (0.0825)** 20,000 to 24,999 0.4032 0.2768 0.4030 0.2842 0.3955 0.2948 0.3951 0.2942 (0.0364)** (0.0817)** (0.0362)** (0.0819)** (0.0417)** (0.0809)** (0.0419)** (0.0813)** 25,000 to 29,999 0.4587 0.2418 0.4588 0.2449 0.4513 0.2505 0.4499 0.2584 (0.0413)** (0.0821)** (0.0412)** (0.0831)** (0.0392)** (0.0767)** (0.0392)** (0.0766)** 30,000 to 34,999 0.5101 0.4285 0.5107 0.4224 0.5003 0.4496 0.5016 0.4372 (0.0360)** (0.0871)** (0.0356)** (0.0846)** (0.0399)** (0.0859)** (0.0402)** (0.0868)** 35,000 to 39,999 0.5710 0.4339 0.5678 0.4320 0.5586 0.4417 0.5583 0.4470 (0.0467)** (0.1068)** (0.0470)** (0.1057)** (0.0404)** (0.0925)** (0.0406)** (0.0895)** 40,000 to 49,999 0.6294 0.3778 0.6292 0.3843 0.6187 0.3904 0.6189 0.3952 (0.0387)** (0.0895)** (0.0386)** (0.0912)** (0.0403)** (0.0843)** (0.0406)** (0.0851)** 50,000 to 59,999 0.7262 0.4390 0.7256 0.4370 0.7136 0.4614 0.7122 0.4312 (0.0373)** (0.1034)** (0.0373)** (0.1035)** (0.0397)** (0.0864)** (0.0397)** (0.0844)**

vi
Table 4, continued
60,000 to 74,999 0.7659 0.4407 0.7670 0.4610 0.7494 0.4531 0.7500 0.4589 (0.0405)** (0.1335)** (0.0407)** (0.1412)** (0.0422)** (0.1111)** (0.0424)** (0.1123)** 75,000 or More 0.7588 0.5976 0.7543 0.6055 0.7416 0.6441 0.7366 0.6400 (0.0483)** (0.0808)** (0.0470)** (0.0811)** (0.0423)** (0.0979)** (0.0416)** (0.0951)** Constant -3.1889 -3.7896 -3.2696 -3.5553 -3.2402 -3.8677 -3.2722 -3.5736 (0.1799)** (0.2245)** (0.1789)** (0.2870)** (0.1505)** (0.2653)** (0.1503)** (0.2646)** Observations 75003 7996 75003 7996 75003 7996 75003 7996
Probit estimates. Dependent variable is whether the individual voted in the 1998 November election. Standard errors in parentheses, clustered on state in columns (1)-(4) and on county in columns (5)-(8). * significant at 5% level; ** significant at 1% level. Omitted education category: less than 1st grade; omitted household income category: less than $5,000.

vii
Table 5: Do Blacks Vote More, Relative to Whites, in More Heavily Black States?
(1) (2) (3) (4) (5) (6) (7) (8) (9) 1994 1994 1994 1996 1996 1996 1998 1998 1998 Black x State Black Pct. 0.9112 0.9738 0.1207 -0.1027 1.1057 1.0328 (0.1591)** (0.1961)** (0.1755) (0.2162) (0.1675)** (0.2013)** Black x State Black Pop. 0.1642 0.0566 0.1424 0.1537 0.2421 0.1397 (millions) (0.0405)** (0.0460) (0.0452)** (0.0511)** (0.0451)** (0.0494)** Black x State White Pop. -0.0013 0.0002 -0.0009 -0.0011 -0.0020 -0.0006 (millions) (0.0004)** (0.0005) (0.0005)* (0.0006) (0.0004)** (0.0005) MSA dummy -0.1139 -0.1128 -0.1119 -0.0468 -0.0459 -0.0460 -0.1024 -0.1020 -0.1010 (0.0122)** (0.0122)** (0.0122)** (0.0142)** (0.0143)** (0.0143)** (0.0142)** (0.0143)** (0.0143)** Black x MSA Dummy 0.1337 0.1054 0.1125 0.1684 0.1591 0.1579 0.1495 0.1197 0.1303 (0.0402)** (0.0412)* (0.0413)** (0.0478)** (0.0490)** (0.0491)** (0.0501)** (0.0512)* (0.0513)* Personal Characteristics? -1.4869 -3.6302 -3.6281 -0.7577 -2.3130 -2.2930 -2.6524 -3.1345 -3.1302 Constant (0.2834)** (0.1229)** (0.1229)** (0.3523)* (0.2921)** (0.2950)** (0.3560)** (0.1464)** (0.1464)** 82999 82999 82999 71222 71222 71222 69638 69638 69638 Observations -0.1139 -0.1128 -0.1119 -0.0468 -0.0459 -0.0460 -0.1024 -0.1020 -0.1010 Notes: Probit models with robust standard errors in parentheses. Dependent variable is whether the individual voted. “Black” is an indicator for whether the individual is black All regressions include state fixed effects, race-specific education dummies, race-specific age terms, race-specific income dummies, and a race-specific MSA dummy. * significant at 5% level; ** significant at 1% level.
viii
Table 6: Do Statewide Races Change the Effect of County and State Black Shares on Turnout?
(1) (2) (3) (4) (5) (6) (7) (8) white black white black white black white black Statewide Race 0.0624 0.0602 0.0468 -0.0247 0.0598 0.0046 0.0557 0.0132 (0.0129)** (0.0472) (0.0161)** (0.0592) (0.0204)** (0.0802) (0.0101)** (0.0355) Statewide Race X County Black Share -0.0477 -0.3637 -0.1232 -0.5961 -0.3149 -0.7756 (0.0708) (0.1170)** (0.0783) (0.1412)** (0.1631) (0.2796)** Statewide Race X State Black Share 0.1977 0.8410 0.0728 0.6355 (0.1259) (0.3730)* (0.1772) (0.5903) State Race X State X County Black Share 1.3421 1.0933 (1.0792) (1.8235) Statewide Race x (County – State) Black -0.1341 -0.5945 Share (0.0762) (0.1394)** 1998 Dummy -0.0227 -0.0072 -0.0244 -0.0175 -0.0262 -0.0181 -0.0235 -0.0141 (0.0090)* (0.0359) (0.0088)** (0.0342) (0.0089)** (0.0343) (0.0089)** (0.0339) Personal Characteristics from Table 2? yes yes yes yes yes yes yes yes Constant -0.6909 0.1092 -0.6884 0.1130 -0.6889 0.1115 -0.6901 0.1139 (0.0344)** (0.0756) (0.0341)** (0.0751) (0.0341)** (0.0748) (0.0342)** (0.0752) Observations 98251 10972 98251 10972 98251 10972 98251 10972 R-squared 0.22 0.24 0.22 0.24 0.22 0.24 0.22 0.24
Notes: Dependent variable is whether the individual voted in the November election. Data for non-presidential-election years (1994 and 1998) are included. Standard errors in parentheses. Linear probability models with county fixed effects. Standard errors are clustered on year x county. * significant at 5% level; ** significant at 1% level.

ix
Table 7: Does the Presidential Election Change the Tendency to Vote More in Heavily Black States? (1) (2) (3) (4) white black white black Presidential Dummy * State Black Pct. 0.2082 -0.2235 0.1870 -0.2331 (0.0575)** (0.1091)* (0.0574)** (0.0325)** Statewide Race 0.0112 0.0413 -0.0070 0.0231 (0.0115) (0.0231) (0.0176) (0.0281) Statewide Race x State Black Pct. 0.1123 -0.0091 0.1972 0.1517 (0.0873) (0.1587) (0.1394) (0.2003) '96 Dummy 0.0757 0.1934 0.1004 0.1803 (0.0073)** (0.0196)** (0.0070)** (0.0081)** ‘98 Dummy -0.0456 0.0233 na na (0.0074)** (0.0173) Personal Characteristics from Table 2? yes yes yes yes State fixed effects yes yes yes yes State-specific time trend no no yes yes Constant -0.5481 -0.5734 -0.5377 -0.5757 (0.0269)** (0.0523)** (0.0256)** (0.0507)** Observations 203172 20687 203172 20687 R-squared 0.20 0.17 0.20 0.18
Notes: Linear probability models. Dependent variable is whether the individual voted in the November election. Data for 1994, 1996, and 1998 are included. Standard errors, clustered on year x state, in parentheses. * significant at 5% level; ** significant at 1% level.

x
Table 8: Do Black Media Induce Blacks to Vote (1998)?
(1) (2) (3) (4) (5) (6) (7) (8) (9) White Black MSA FE White Black MSA FE White Black MSA FE # Black Weeklies -0.0002 0.0075 0.0045 (0.0015) (0.0027)** (0.0005)*
*
0.0063 Black Dummy x # Black Weeklies (0.0035)
-0.0087 0.0250 # Black Radio Stations (0.0036)* (0.0057)*
*
-0.0069 0.0224 # Black-Owned & Targeted Radio Stations (0.0066) (0.0088)*
-0.0096 0.0264 # White-Owned Black-Targeted Radio Stations (0.0041)* (0.0089)**
0.0325 Black Dummy x # Black Radio Stations (0.0057)*
*
0.0281 Black x # Black Owned & Targeted Radio Stations (0.0089)**
0.0350 Black x # White-Owned, Black-Targeted Radio Stations
(0.0092)**
Personal Characteristics yes yes yes yes yes yes yes yes yes from Table 2? Constant -0.6182 -0.0878 -0.5364 -0.5688 -0.2261 -0.9153 -0.5691 -0.2272 -0.9322 (0.0409)** (0.1010) (0.1301)*
* (0.0516)*
* (0.0869)* (0.0534)*
* (0.0519)** (0.0868)** (0.0746)**
Observations 46420 5751 52171 39460 5133 44593 39460 5133 44593 R-squared 0.17 0.15 0.19 0.17 0.15 0.19 0.17 0.15 0.19
Notes: Dependent variable is whether the individual voted in the 1998 general election. All columns are linear probability models with standard errors clustered on MSA. Specifications pooling black and white data, in columns (3), (6) and (9), include race-specific education dummies. * significant at 5% level; ** significant at 1% level.

xi
Table 9: Does the Black Voting Tendency Change with Changes in the Number of Black- and White-Owned Black-Targeted Radio Stations? (1) (2) (3) (4) white black white black 1998 Dummy -0.0557 -0.0022 -0.0510 0.0084 (0.0050)** (0.0167) (0.0046)** (0.0157) # Black-Targeted Stations 0.0045 0.0147 (0.0030) (0.0096) # Black-Owned & Targeted Radio Stations 0.0118 0.0262 (0.0035)** (0.0113)* # White-Owned Black-Targeted Radio Stations -0.0039 0.0066 (0.0034) (0.0120) Personal Characteristics from Table 2? yes yes yes yes Constant -0.6496 -0.0569 -0.6445 -0.0594 (0.0329)** (0.0871) (0.0333)** (0.0837) Observations 82534 11165 82534 11165 R-squared 0.19 0.19 0.19 0.19
Notes: Dependent variable is whether the individual voted in the 1994 or 1998 general election. All regressions are linear probability models including MSA fixed effects, education and household income dummies, as well as age terms. Standard errors are clustered on year x MSA. * significant at 5% level; ** significant at 1% level.