elders limited
TRANSCRIPT
Elders Limited
1H21 Results Presentation
17 May 2021
Disclaimer and Important Information
Forward looking statements
This presentation is prepared for informational purposes only. It contains forward looking statements that are subject to risk factors associated with the agriculture industry many of which are beyond the control of Elders. Elders’ future financial results will be highly dependent on the outlook and prospect of the Australian farm sector, and the values and volume growth in internationally traded livestock and fibre. Financial performance for the operations is heavily reliant on, but not limited to, the following factors: weather and rainfall conditions; commodity prices and international trade relations. Whilst every endeavour has been made to ensure the reasonableness of forward-looking statements contained in this presentation, they do not constitute a representation and no reliance should be placed on those statements.
Non-IFRS information
This presentation refers to and discusses underlying profit to enable analysis of like-for-like performance between periods, excluding the impact of discontinued operations or events which are not related to ongoing operating performance. Underlying profit measures reported by the Company have been calculated in accordance with the FINSIA/AICD principles for the reporting of underlying profit. Underlying profit is non-IFRS financial information and has not been subject to review by the external auditors but is derived from audited accounts by removing the impact of discontinued operations and items not considered to be related to ongoing operating performance.
2
Agenda
3
Key Highlights
Financial Performance
Third Eight Point Plan Progress
Sustainability
Market Outlook
Appendix
Questions
3

4
Robust year to date across the business
1H21 Key Highlights
Safety
▪ 2 lost time injuries (LTI), compared to 1 last year, with target of zero
▪ LTI frequency rate at 0.8 compared to 2.2 last year
▪ 57 days lost, compared to 95 last year
▪ In 1H21 and to date, Elders has experienced minimal impact on its people, operational and financial performance as a result of COVID-19
▪ COVID safety protocols are embedded in the business
Financial Performance
▪ $73.8 million Underlying EBIT (+40%)
▪ $23.9 million Operating Cash Flow (-$3.5 million)
▪ 20.1% Return on Capital (ROC) improvement of 1.2%, mainly due to margin growth exceeding impact of capital growth
▪ 1.5x Leverage Ratio at the lower end of our targeted range of 1.5x-2.0x
▪ 42.9 cents YTD Earnings per Share (+38%)
▪ Elders will pay an interim dividend of $0.20 per share, 20% franked, compared to $0.09 on the pcp
▪ Elders did not access any government support such as JobKeeper during the half year ended 31 March 2021
Strategy
▪ On track to deliver first year of the third Eight Point Plan (EPP)
▪ Retail Products margin increased through higher sales in line with improved seasonal conditions and market growth, as well as benefits from additional backward integration throughput and improved pricing techniques
▪ Continued to grow our footprint through acquisition of Rural Products and Agency Services businesses and personnel
▪ Completed Service Design phase for Systems Modernisation program

Implementation of third Eight Point Plan
5
1H21 Operating Highlights
Operating Safely
▪ 2 lost time injuries (LTI), compared to 1 last year, with target of zero
▪ LTI frequency rate at 0.8 compared to 2.2 last year
▪ 57 days lost, compared to 95
▪ Inaugural safety week has been held and the continued development in systems, processes and keeping safety top of mind has benefitted the business with the injury severity reducing significantly
Sustainability
▪ Modern Slavery Statement and Ethical Contracting Framework launched to support responsible sourcing
▪ Action plan to full alignment with TCFD Recommendations on track, with analysis of climate change risks and opportunities underway
▪ Over $700,000 in sponsorships and donations to local communities, charities and supporting the agriculture industry
Efficiency & Growth
▪ Preserved and captured further gross margin through strategic initiatives
▪ Successful integration of AIRR and progressed maturity of Titan AG
▪ Maintained focus on footprint expansion through acquisitions of Rural Products and Agency businesses and personnel
▪ Continued growth in Financial Services offerings
Core Relationships
▪ Worked closely with industry and clients to ensure continuity of operations and agricultural supply chains during COVID-19
▪ Continued engagement with Rural RDCs, government and tertiary institutions to enhance our agricultural research, development and extension initiatives through the Thomas Elder Institute
Strong performance across our key metrics
6
1H21 Financial Performance: Summary
Financial Metric1H21
Result ($m)1H20
Result ($m)
Year-on-Year Change
$m %
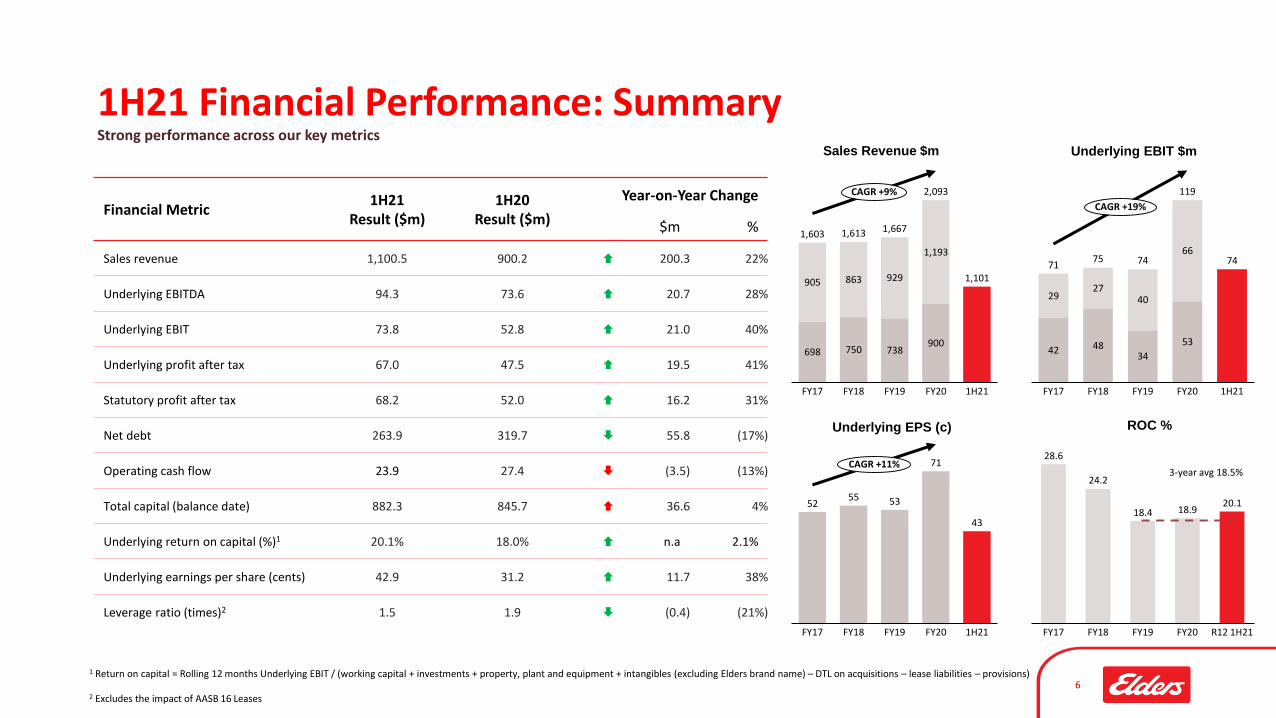
Sales revenue 1,100.5 900.2 200.3 22%
Underlying EBITDA 94.3 73.6 20.7 28%
Underlying EBIT 73.8 52.8 21.0 40%
Underlying profit after tax 67.0 47.5 19.5 41%
Statutory profit after tax 68.2 52.0 16.2 31%
Net debt 263.9 319.7 55.8 (17%)
Operating cash flow 23.9 27.4 (3.5) (13%)
Total capital (balance date) 882.3 845.7 36.6 4%
Underlying return on capital (%)1 20.1% 18.0% n.a 2.1%
Underlying earnings per share (cents) 42.9 31.2 11.7 38%
Leverage ratio (times)2 1.5 1.9 (0.4) (21%)
Underlying EPS (c)
Underlying EBIT $m
ROC %
Sales Revenue $m
1 Return on capital = Rolling 12 months Underlying EBIT / (working capital + investments + property, plant and equipment + intangibles (excluding Elders brand name) – DTL on acquisitions – lease liabilities – provisions)
2 Excludes the impact of AASB 16 Leases
5255 53
71
43
FY20FY18FY17 FY19 1H21
CAGR +11%28.6
24.2
18.4 18.920.1
FY17 R12 1H21FY18 FY19 FY20
42 4834
53
74
2927
40
66
FY20FY19FY17 FY18 1H21
7175 74
119
CAGR +19%
3-year avg 18.5%
698 750 738900
1,101905 863 929
1,193
FY17 FY19FY18 FY20
1,603
1H21
1,613 1,667
2,093CAGR +9%
47.5
67.0
18.0
11.9
6.25.2
1.8 2.92.8
16.5
1.4
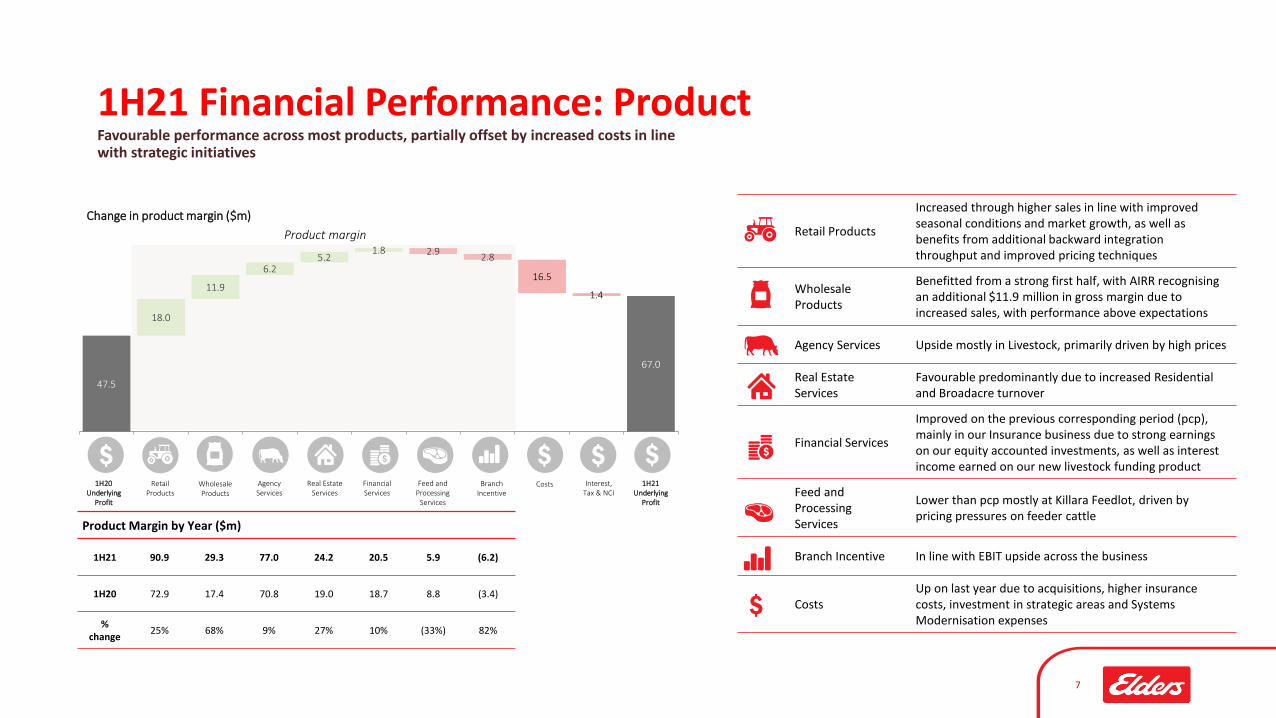
Favourable performance across most products, partially offset by increased costs in line with strategic initiatives
7
1H21 Financial Performance: Product
Change in product margin ($m)
RetailProducts
AgencyServices
Real Estate Services
Financial Services
Feed and Processing
Services
Costs Interest, Tax & NCI
1H20 Underlying
Profit
1H21 Underlying
Profit
BranchIncentive
Product margin
WholesaleProducts
Product Margin by Year ($m)
1H21 90.9 29.3 77.0 24.2 20.5 5.9 (6.2)
1H20 72.9 17.4 70.8 19.0 18.7 8.8 (3.4)
%change
25% 68% 9% 27% 10% (33%) 82%
Retail Products
Increased through higher sales in line with improved seasonal conditions and market growth, as well as benefits from additional backward integration throughput and improved pricing techniques
Wholesale Products
Benefitted from a strong first half, with AIRR recognising an additional $11.9 million in gross margin due to increased sales, with performance above expectations
Agency Services Upside mostly in Livestock, primarily driven by high prices
Real Estate Services
Favourable predominantly due to increased Residential and Broadacre turnover
Financial Services
Improved on the previous corresponding period (pcp), mainly in our Insurance business due to strong earnings on our equity accounted investments, as well as interest income earned on our new livestock funding product
Feed and Processing Services
Lower than pcp mostly at Killara Feedlot, driven by pricing pressures on feeder cattle
Branch Incentive In line with EBIT upside across the business
CostsUp on last year due to acquisitions, higher insurance costs, investment in strategic areas and Systems Modernisation expenses

47.5
67.0
6.73.7
4.16.3
4.3 0.55.1
0.710.4
1.4
Improvement across all areas with increased investment in strategic initiatives
1H21 Financial Performance: Geography
Wholesale Products
Benefitted from a strong first half, with AIRR contributing an additional $6.7 million of EBIT due to increased sales, with performance above expectations
New South WalesIncrease largely driven by strong Retail Products results, partially offset by feeder cattle price pressures at Killara Feedlot
Queensland and Northern Territory
Uplift across most products, including acquisition growth
Victoria and Riverina
Upside mainly resulting from increased Retail Products sales for AgChem and Fertiliser due to confidence in winter crop outlook
South AustraliaProfiting principally in Retail Products with both sales and margin increases, as well as additional earnings from the YP Ag acquisition
TasmaniaFavourable results from increased Retail Products margins, partially offset by lower cattle and sheep volumes
Western AustraliaUp across most products, with higher Retail Products sales, improved broadacre and residential turnover and strong livestock prices and volumes
Corporate and other costs
Increased due to higher insurance costs, investment in strategic areas and Systems Modernisation expenses
Underlying profit by geography by year ($m)
1H21 15.3 13.4 7.8 29.0 16.3 3.5 24.7 (0.4)
1H20 8.6 9.7 3.7 22.7 12.0 3.0 19.6 (1.1)
% change
81% 36% 114% 28% 36% 17% 26% 64%
NSW1 QLD & NT SA Corporate and other
costs
Interest, Tax & NCI
1H20 Underlying
Profit
1H21Underlying
Profit
ChinaWholesaleProducts
Underlying EBIT
1 New South Wales includes Killara Feedlot
VIC & RIV TAS WA
Change in underlying profit by geography ($m)
8
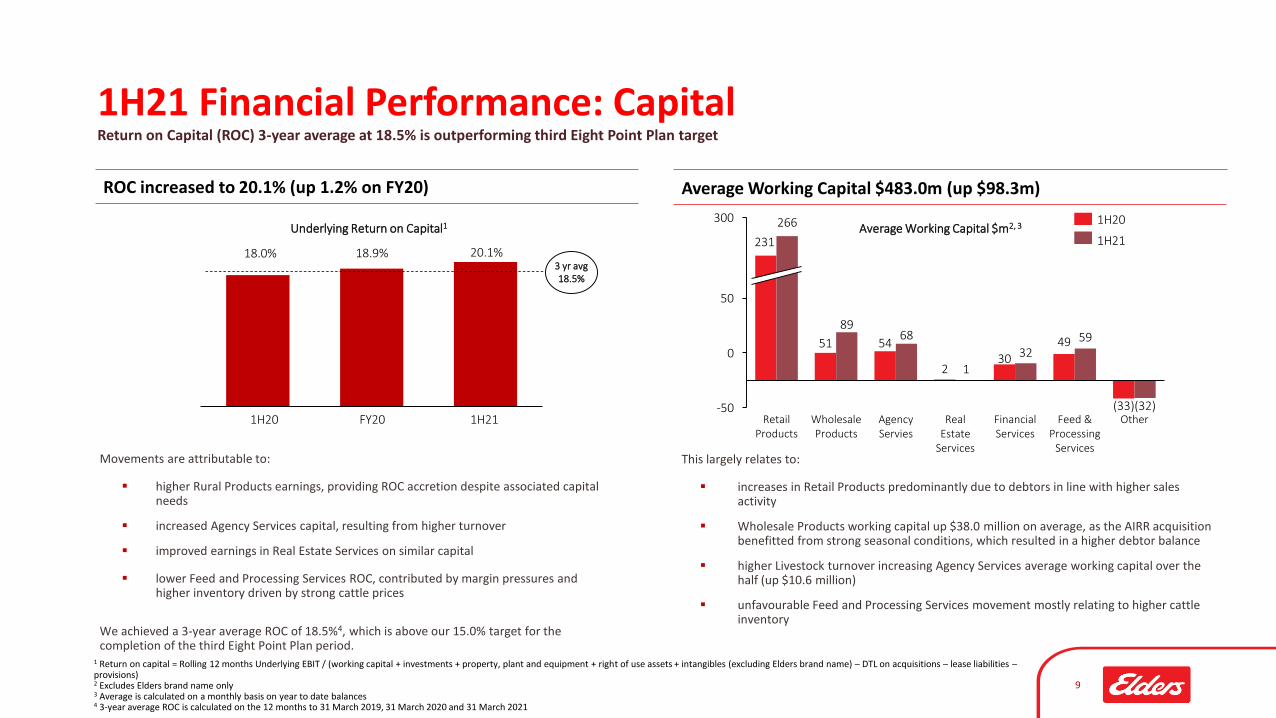
Movements are attributable to:
▪ higher Rural Products earnings, providing ROC accretion despite associated capital needs
▪ increased Agency Services capital, resulting from higher turnover
▪ improved earnings in Real Estate Services on similar capital
▪ lower Feed and Processing Services ROC, contributed by margin pressures and higher inventory driven by strong cattle prices
We achieved a 3-year average ROC of 18.5%4, which is above our 15.0% target for the completion of the third Eight Point Plan period.
Return on Capital (ROC) 3-year average at 18.5% is outperforming third Eight Point Plan target
9
1H21 Financial Performance: Capital
1 Return on capital = Rolling 12 months Underlying EBIT / (working capital + investments + property, plant and equipment + right of use assets + intangibles (excluding Elders brand name) – DTL on acquisitions – lease liabilities –provisions)2 Excludes Elders brand name only3 Average is calculated on a monthly basis on year to date balances4 3-year average ROC is calculated on the 12 months to 31 March 2019, 31 March 2020 and 31 March 2021
Underlying Return on Capital1
FY201H20 1H21
18.0% 18.9% 20.1%3 yr avg18.5%
ROC increased to 20.1% (up 1.2% on FY20) Average Working Capital $483.0m (up $98.3m)
231
51 54
230
49
(33)
266
8968
132
59
(32)-50
0
50
300
Real Estate
Services
Retail Products
Wholesale Products
Agency Servies
Financial Services
Feed & Processing
Services
Other
1H20Average Working Capital $m2, 3
This largely relates to:
▪ increases in Retail Products predominantly due to debtors in line with higher sales activity
▪ Wholesale Products working capital up $38.0 million on average, as the AIRR acquisition benefitted from strong seasonal conditions, which resulted in a higher debtor balance
▪ higher Livestock turnover increasing Agency Services average working capital over the half (up $10.6 million)
▪ unfavourable Feed and Processing Services movement mostly relating to higher cattle inventory
1H21
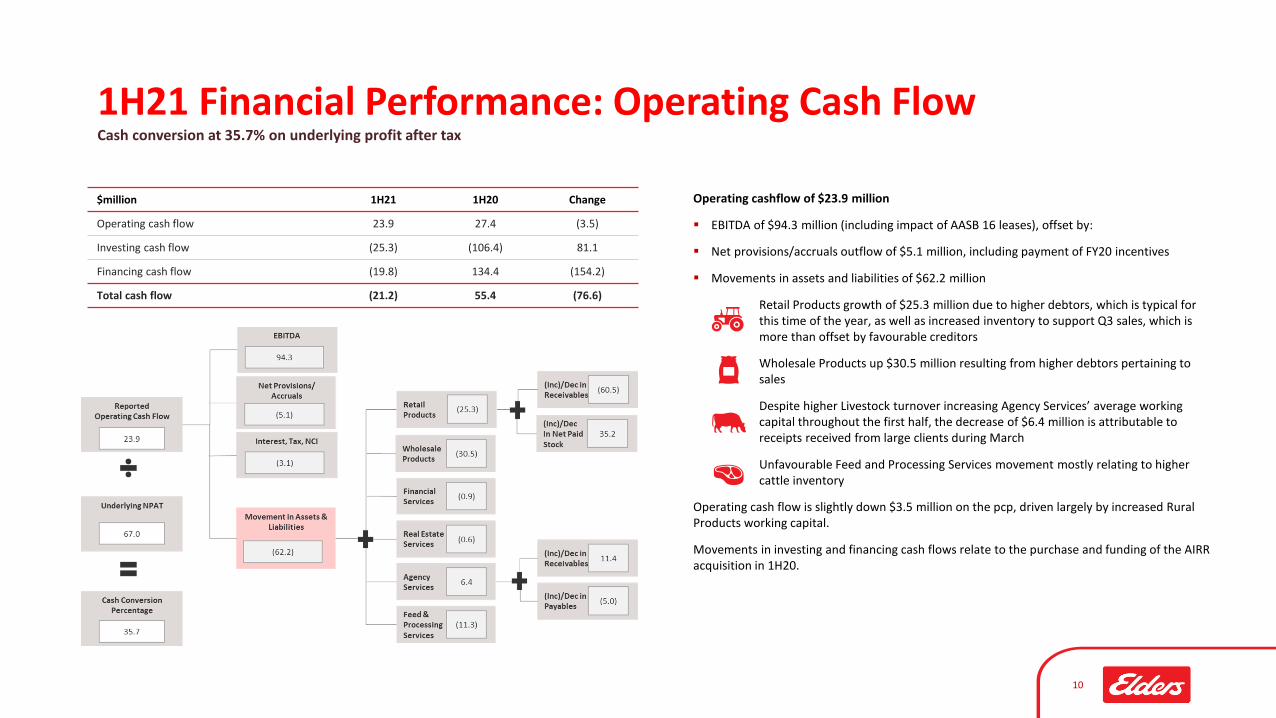
Cash conversion at 35.7% on underlying profit after tax
10
1H21 Financial Performance: Operating Cash Flow
Operating cashflow of $23.9 million
▪ EBITDA of $94.3 million (including impact of AASB 16 leases), offset by:
▪ Net provisions/accruals outflow of $5.1 million, including payment of FY20 incentives
▪ Movements in assets and liabilities of $62.2 million
▪ Retail Products growth of $25.3 million due to higher debtors, which is typical for this time of the year, as well as increased inventory to support Q3 sales, which is more than offset by favourable creditors
▪ Wholesale Products up $30.5 million resulting from higher debtors pertaining to sales
▪ Despite higher Livestock turnover increasing Agency Services’ average working capital throughout the first half, the decrease of $6.4 million is attributable to receipts received from large clients during March
▪ Unfavourable Feed and Processing Services movement mostly relating to higher cattle inventory
Operating cash flow is slightly down $3.5 million on the pcp, driven largely by increased Rural Products working capital.
Movements in investing and financing cash flows relate to the purchase and funding of the AIRR acquisition in 1H20.
$million 1H21 1H20 Change
Operating cash flow 23.9 27.4 (3.5)
Investing cash flow (25.3) (106.4) 81.1
Financing cash flow (19.8) 134.4 (154.2)
Total cash flow (21.2) 55.4 (76.6)

326.3 331.3
1H20 1H21
319.7
263.9
1H20 1H21
Decreased leases debt and less investing cash flow driving lower net debt at balance date
11
1H21 Financial Performance: Net Debt
1 Calculated pursuant to definitions in group syndicated facilities2 Excluding impact of AASB 16 Leases
Net debt, at balance date$m
Net debt, YTD average$m
Key Ratios – rolling 12 months2 1H21 1H20 Change
Leverage (average net debt to EBITDA) 1.5 1.9 (0.4)
Interest Cover (EBITDA to net interest) 27.4 15.1 12.2
Gearing (average net debt to closing equity)
30.8% 31.2% (0.6%)
Undrawn facilities at balance date were $236 million with significant headroom in our banking covenants:
▪ leverage is 0.2 (covenant < 3.5 times)
▪ interest cover is 29.3 (covenant > 3.5 times)
▪ net worth is $723.2 million (covenant > $250 million)
▪ Net debt at balance date is down $55.8 million to $263.9 million. This is mainly due to less debt relating to AASB 16 Leases, as well as lower investing cash flows, with the pcp including the acquisition of AIRR
▪ Conversely, average net debt is up $5.0 million to $331.3 million, relating to increases in the trade receivables facility in line with higher Retail Products debtors, offset by lower lease liabilities
▪ Excluding the impact of AASB 16 Leases all net debt ratios have improved on the pcp
Net Debt Financial Covenants1
12
Interim Dividend Tax Losses
▪ Elders’ Dividend Policy (Policy) was reinstated in FY17, providing for a payout ratio of up to 35% of underlying NPAT
▪ In light of the continued strong performance of the business, the policy has been revised (with effect from 1H21) to provide for a payout ratio of between 40%-60% of underlying NPAT
▪ The Company paid a final dividend of $0.13 per share for the period ended 30 September 2020
following an interim dividend of $0.09 per share, both 100% franked. The pay-out ratio for
FY20 was 31.4% (pre-tax)
▪ Elders will pay an interim dividend of $0.20 per share for the first half of FY21, 20% franked. This equates to a payout ratio of 45.8% of NPAT. The increase in the dividend from $0.13 to $0.20 more than offsets the post-tax impact of the reduction in franking percentage
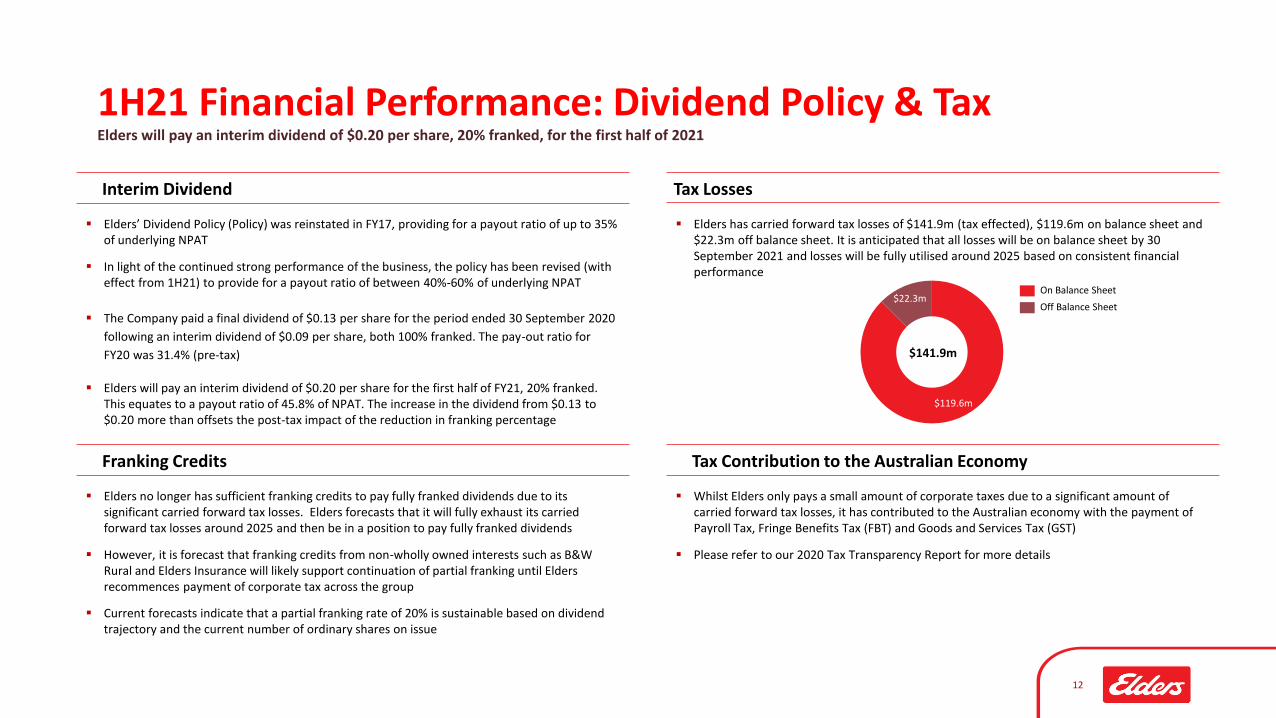
Elders will pay an interim dividend of $0.20 per share, 20% franked, for the first half of 2021
1H21 Financial Performance: Dividend Policy & Tax
Franking Credits
▪ Elders no longer has sufficient franking credits to pay fully franked dividends due to its significant carried forward tax losses. Elders forecasts that it will fully exhaust its carried forward tax losses around 2025 and then be in a position to pay fully franked dividends
▪ However, it is forecast that franking credits from non-wholly owned interests such as B&W Rural and Elders Insurance will likely support continuation of partial franking until Elders recommences payment of corporate tax across the group
▪ Current forecasts indicate that a partial franking rate of 20% is sustainable based on dividend trajectory and the current number of ordinary shares on issue
▪ Elders has carried forward tax losses of $141.9m (tax effected), $119.6m on balance sheet and $22.3m off balance sheet. It is anticipated that all losses will be on balance sheet by 30 September 2021 and losses will be fully utilised around 2025 based on consistent financial performance
Tax Contribution to the Australian Economy
▪ Whilst Elders only pays a small amount of corporate taxes due to a significant amount of carried forward tax losses, it has contributed to the Australian economy with the payment of Payroll Tax, Fringe Benefits Tax (FBT) and Goods and Services Tax (GST)
▪ Please refer to our 2020 Tax Transparency Report for more details
$119.6m
$22.3mOn Balance Sheet
Off Balance Sheet
$141.9m

EIGHT POINT PLNOUR 2023 AMBITION
OUR BUSINESS UNITS
OUR STRATEGIC PRIORITIES
OUR ENABLERS
OUR VALUES
1 2 3 4 5
6 7 8
Win market share across all products, services and geographies through client focus, effective sales and marketing and strategic acquisitions
Capture more gross margin in Rural Products through optimised pricing, backward integration and supply chain efficiency
Compelling shareholder returns5-10% EBIT and EPS growth through the cycles at 15% ROC
Industry leading sustainability outcomes across health and safety, community, environment and governance
Most trusted Agribusiness brandin rural and regional Australia
Strengthen and expand our service offerings, including Livestock and Wool Agency, Real Estate, Financial and Tech Services
Optimise our feed and processing businesses in Killara Feedlot and Elders Fine Foods
Develop a sustainability program that is authentic and industry leading
Systems Modernisation Program – invest in best of breed solutions to improve customer experience, drive process and administration efficiency and better accommodate change
Attract, retain and develop the best people and provide a safe and inclusive working environment
Maintain unflinching financial discipline and commitment to cost and capital efficiency
R U R A L
P R O D U C T S
A G E N C Y S E R V I C E S
R E A L E S T A T E F I N A N C I A L S E R V I C E S
F E E D & P R O C E S S I N G
I N T E G R I T YC U S T O M E R
F O C U S E D A C C O U N T A B I L I T Y T E A M W O R K I N N O V A T I O N
T E C H N I C A L S E R V I C E S
13
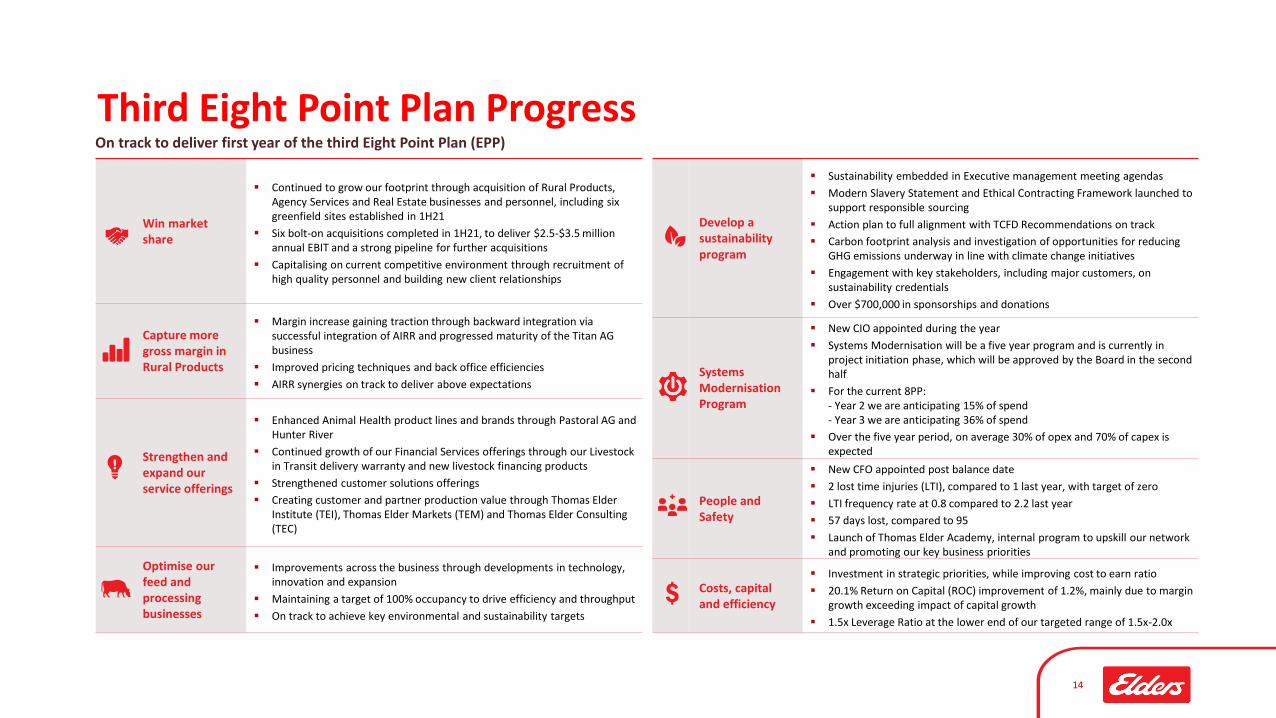
Develop a sustainability program
▪ Sustainability embedded in Executive management meeting agendas
▪ Modern Slavery Statement and Ethical Contracting Framework launched to support responsible sourcing
▪ Action plan to full alignment with TCFD Recommendations on track
▪ Carbon footprint analysis and investigation of opportunities for reducing GHG emissions underway in line with climate change initiatives
▪ Engagement with key stakeholders, including major customers, on sustainability credentials
▪ Over $700,000 in sponsorships and donations
Systems Modernisation Program
▪ New CIO appointed during the year
▪ Systems Modernisation will be a five year program and is currently in project initiation phase, which will be approved by the Board in the second half
▪ For the current 8PP:- Year 2 we are anticipating 15% of spend- Year 3 we are anticipating 36% of spend
▪ Over the five year period, on average 30% of opex and 70% of capex is expected
People and Safety
▪ New CFO appointed post balance date
▪ 2 lost time injuries (LTI), compared to 1 last year, with target of zero
▪ LTI frequency rate at 0.8 compared to 2.2 last year
▪ 57 days lost, compared to 95
▪ Launch of Thomas Elder Academy, internal program to upskill our network and promoting our key business priorities
Costs, capital and efficiency
▪ Investment in strategic priorities, while improving cost to earn ratio
▪ 20.1% Return on Capital (ROC) improvement of 1.2%, mainly due to margin growth exceeding impact of capital growth
▪ 1.5x Leverage Ratio at the lower end of our targeted range of 1.5x-2.0x
Third Eight Point Plan ProgressOn track to deliver first year of the third Eight Point Plan (EPP)
Win market share
▪ Continued to grow our footprint through acquisition of Rural Products, Agency Services and Real Estate businesses and personnel, including six greenfield sites established in 1H21
▪ Six bolt-on acquisitions completed in 1H21, to deliver $2.5-$3.5 million annual EBIT and a strong pipeline for further acquisitions
▪ Capitalising on current competitive environment through recruitment of high quality personnel and building new client relationships
Capture more gross margin in Rural Products
▪ Margin increase gaining traction through backward integration via successful integration of AIRR and progressed maturity of the Titan AG business
▪ Improved pricing techniques and back office efficiencies
▪ AIRR synergies on track to deliver above expectations
Strengthen and expand our service offerings
▪ Enhanced Animal Health product lines and brands through Pastoral AG and Hunter River
▪ Continued growth of our Financial Services offerings through our Livestock in Transit delivery warranty and new livestock financing products
▪ Strengthened customer solutions offerings
▪ Creating customer and partner production value through Thomas Elder Institute (TEI), Thomas Elder Markets (TEM) and Thomas Elder Consulting (TEC)
Optimise our feed and processing businesses
▪ Improvements across the business through developments in technology, innovation and expansion
▪ Maintaining a target of 100% occupancy to drive efficiency and throughput
▪ On track to achieve key environmental and sustainability targets
14

SustainabilityWe are committed to developing a sustainability program that is authentic and industry leading
15
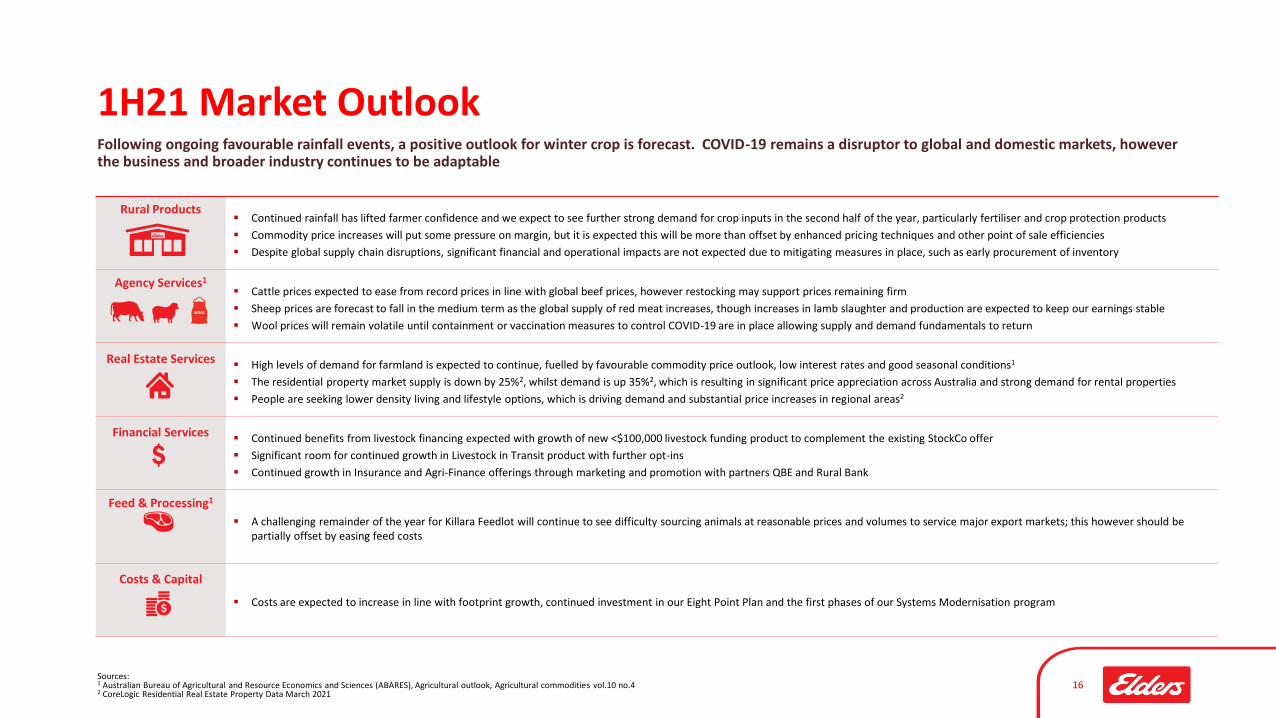
Following ongoing favourable rainfall events, a positive outlook for winter crop is forecast. COVID-19 remains a disruptor to global and domestic markets, however the business and broader industry continues to be adaptable
Sources:1 Australian Bureau of Agricultural and Resource Economics and Sciences (ABARES), Agricultural outlook, Agricultural commodities vol.10 no.42 CoreLogic Residential Real Estate Property Data March 2021
16
1H21 Market Outlook
Rural Products▪ Continued rainfall has lifted farmer confidence and we expect to see further strong demand for crop inputs in the second half of the year, particularly fertiliser and crop protection products
▪ Commodity price increases will put some pressure on margin, but it is expected this will be more than offset by enhanced pricing techniques and other point of sale efficiencies
▪ Despite global supply chain disruptions, significant financial and operational impacts are not expected due to mitigating measures in place, such as early procurement of inventory
Agency Services1
▪ Cattle prices expected to ease from record prices in line with global beef prices, however restocking may support prices remaining firm
▪ Sheep prices are forecast to fall in the medium term as the global supply of red meat increases, though increases in lamb slaughter and production are expected to keep our earnings stable
▪ Wool prices will remain volatile until containment or vaccination measures to control COVID-19 are in place allowing supply and demand fundamentals to return
Real Estate Services▪ High levels of demand for farmland is expected to continue, fuelled by favourable commodity price outlook, low interest rates and good seasonal conditions1
▪ The residential property market supply is down by 25%2, whilst demand is up 35%2, which is resulting in significant price appreciation across Australia and strong demand for rental properties
▪ People are seeking lower density living and lifestyle options, which is driving demand and substantial price increases in regional areas2
Financial Services▪ Continued benefits from livestock financing expected with growth of new <$100,000 livestock funding product to complement the existing StockCo offer
▪ Significant room for continued growth in Livestock in Transit product with further opt-ins
▪ Continued growth in Insurance and Agri-Finance offerings through marketing and promotion with partners QBE and Rural Bank
Feed & Processing1
▪ A challenging remainder of the year for Killara Feedlot will continue to see difficulty sourcing animals at reasonable prices and volumes to service major export markets; this however should be partially offset by easing feed costs
Costs & Capital
▪ Costs are expected to increase in line with footprint growth, continued investment in our Eight Point Plan and the first phases of our Systems Modernisation program

17
Appendix
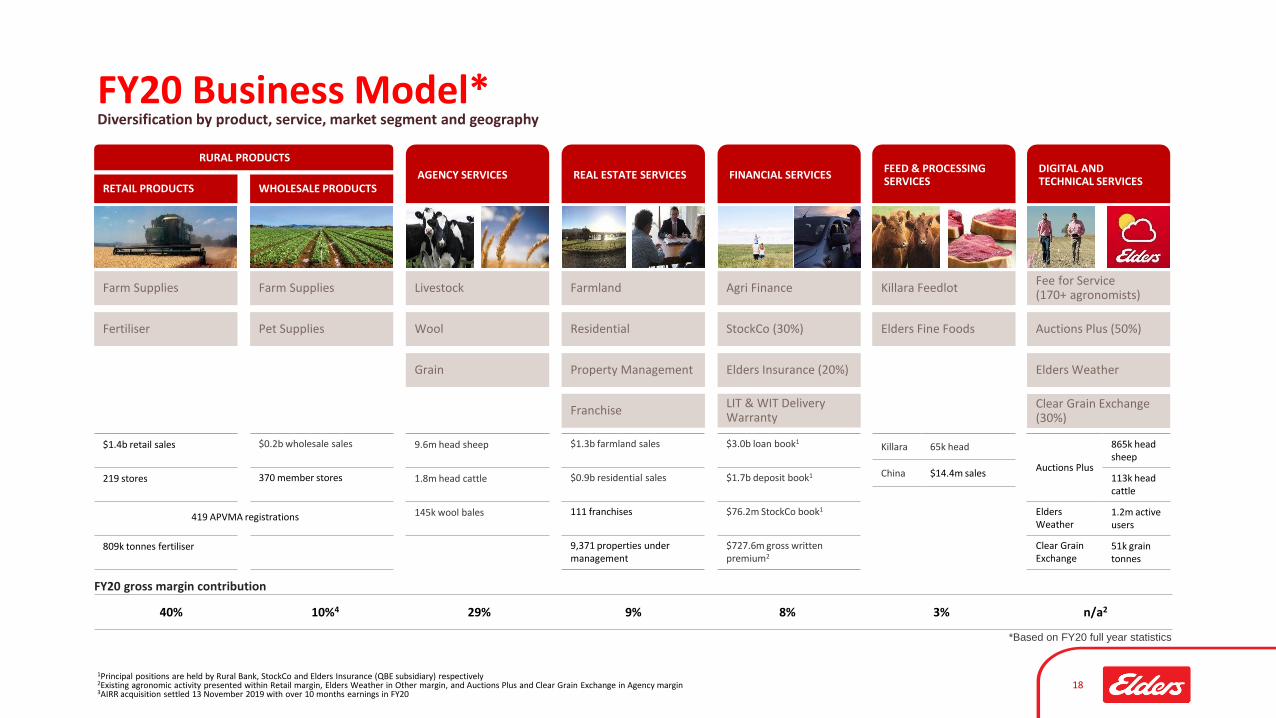
1Principal positions are held by Rural Bank, StockCo and Elders Insurance (QBE subsidiary) respectively2Existing agronomic activity presented within Retail margin, Elders Weather in Other margin, and Auctions Plus and Clear Grain Exchange in Agency margin3AIRR acquisition settled 13 November 2019 with over 10 months earnings in FY20
18
FY20 Business Model*Diversification by product, service, market segment and geography
RETAIL PRODUCTSAGENCY SERVICES REAL ESTATE SERVICES FINANCIAL SERVICES
Farm Supplies
Fertiliser
Livestock
Wool
Grain
Farmland
Residential
Property Management
Franchise
Agri Finance
StockCo (30%)
*Based on FY20 full year statistics
WHOLESALE PRODUCTS
Farm Supplies
Pet Supplies
Elders Insurance (20%)
LIT & WIT Delivery Warranty
40% 10%4 29% 9% 8% 3% n/a2
FY20 gross margin contribution
$1.4b retail sales
219 stores
809k tonnes fertiliser
9.6m head sheep
1.8m head cattle
145k wool bales
$1.3b farmland sales
$0.9b residential sales
111 franchises
9,371 properties under management
$3.0b loan book1
$1.7b deposit book1
$76.2m StockCo book1
$727.6m gross written premium2
$0.2b wholesale sales
370 member stores
RURAL PRODUCTS
419 APVMA registrations
FEED & PROCESSING SERVICES
Killara Feedlot
Elders Fine Foods
Killara 65k head
China $14.4m sales
DIGITAL AND TECHNICAL SERVICES
Fee for Service(170+ agronomists)
Auctions Plus (50%)
Elders Weather
Clear Grain Exchange (30%)
Auctions Plus
865k head sheep
113k head cattle
Elders Weather
1.2m active users
Clear Grain Exchange
51k grain tonnes
19
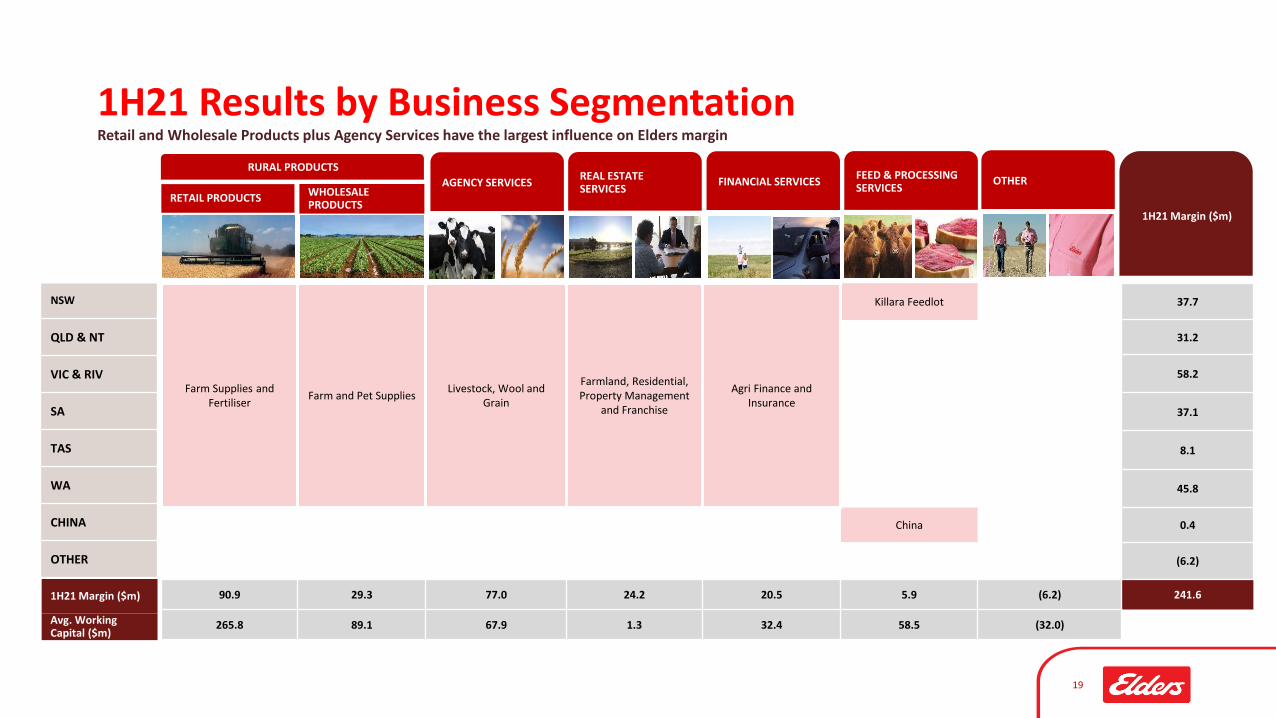
1H21 Results by Business SegmentationRetail and Wholesale Products plus Agency Services have the largest influence on Elders margin
NSW
QLD & NT
VIC & RIV
SA
TAS
WA
CHINA
OTHER
1H21 Margin ($m)
1H21 Margin ($m)
Avg. Working Capital ($m)
Farm Supplies and Fertiliser
Farm and Pet SuppliesLivestock, Wool and
Grain
Farmland, Residential, Property Management
and Franchise
Agri Finance and Insurance
Killara Feedlot 37.7
31.2
58.2
37.1
8.1
45.8
China 0.4
(6.2)
90.9 29.3 77.0 24.2 20.5 5.9 (6.2) 241.6
265.8 89.1 67.9 1.3 32.4 58.5 (32.0)
RETAIL PRODUCTS
AGENCY SERVICESREAL ESTATE SERVICES
FINANCIAL SERVICESWHOLESALE PRODUCTS
RURAL PRODUCTSFEED & PROCESSING SERVICES
OTHER
Based on FY20 Full year statistics
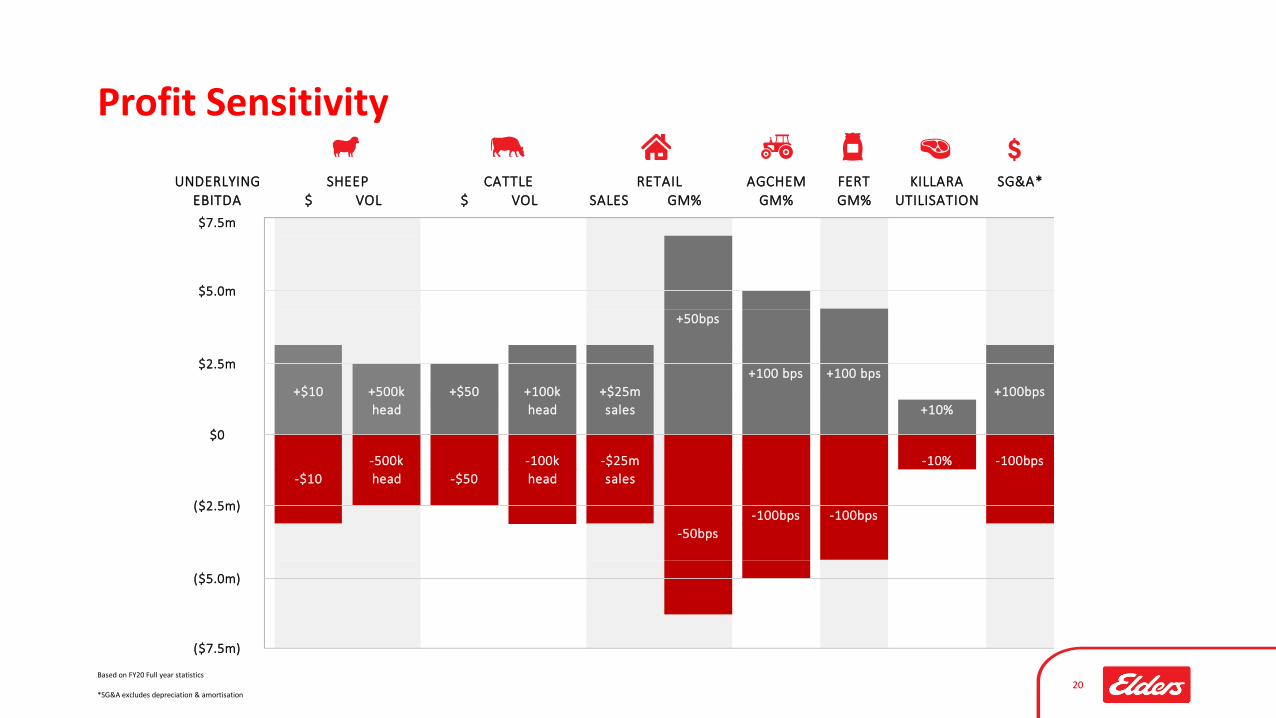
*SG&A excludes depreciation & amortisation20
Profit Sensitivity
UNDERLYING AGCHEM FERT KILLARA SG&A*EBITDA $ VOL $ VOL SALES GM% GM% GM% UTILISATION
+50bps
+100 bps +100 bps
+$10 +500k +$50 +100k +$25m +100bps
head head sales +10%
-500k -100k -$25m -10% -100bps
-$10 head -$50 head sales
-100bps -100bps
-50bps
$0
($2.5m)
($5.0m)
($7.5m)
RETAILCATTLESHEEP
$7.5m
$5.0m
$2.5m
21
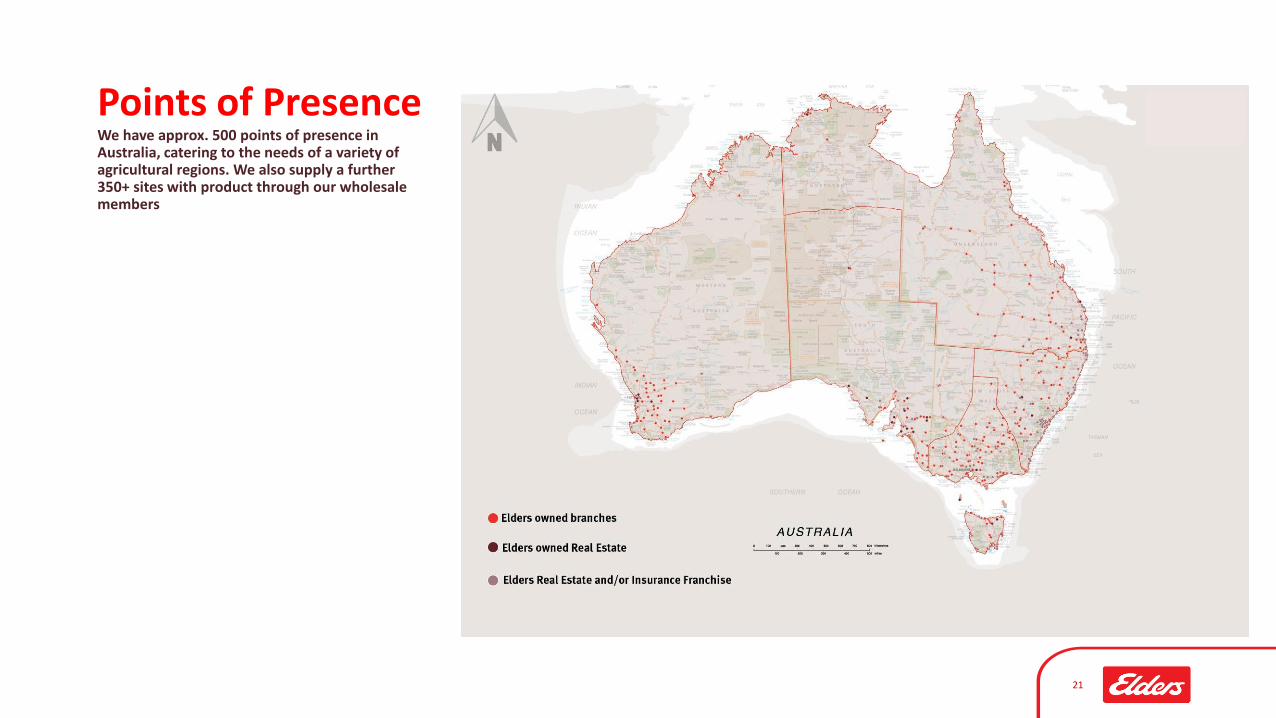
Points of PresenceWe have approx. 500 points of presence in Australia, catering to the needs of a variety of agricultural regions. We also supply a further 350+ sites with product through our wholesale members
22
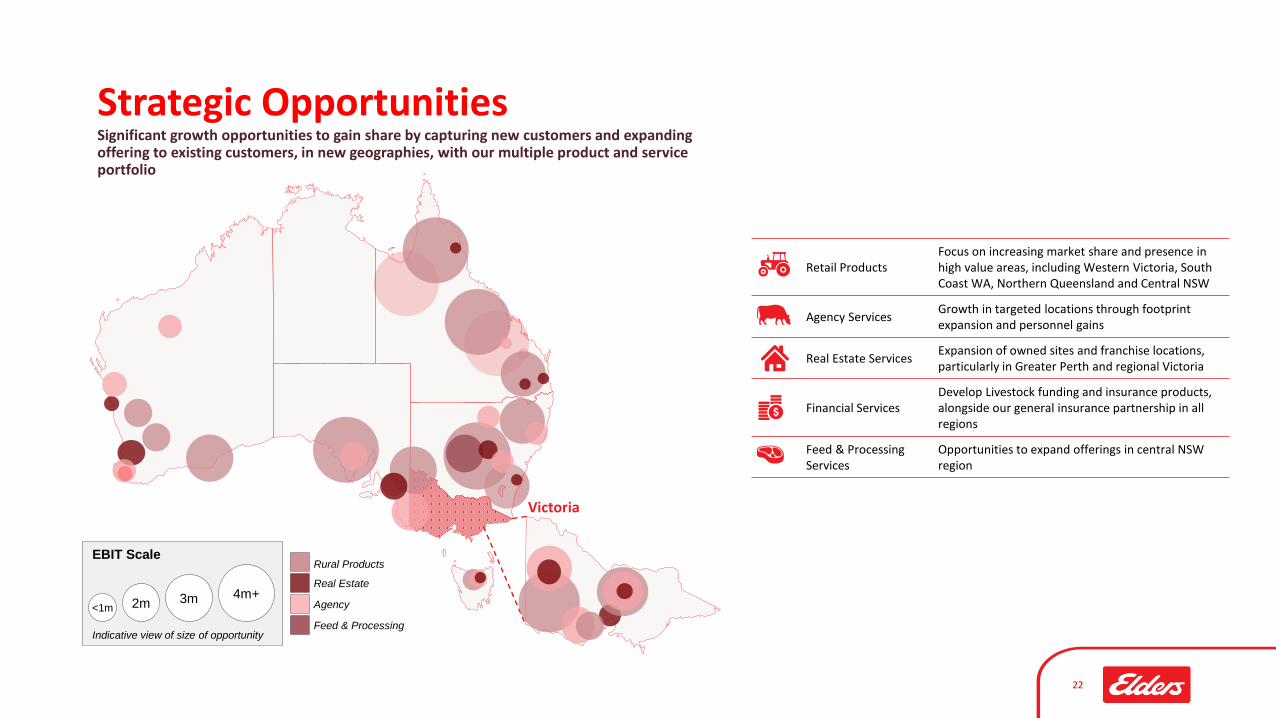
Strategic OpportunitiesSignificant growth opportunities to gain share by capturing new customers and expanding offering to existing customers, in new geographies, with our multiple product and service portfolio
Rural Products
Agency
Real Estate
Feed & Processing
EBIT Scale
Indicative view of size of opportunity
<1m 2m4m+3m
Victoria
Retail ProductsFocus on increasing market share and presence in high value areas, including Western Victoria, South Coast WA, Northern Queensland and Central NSW
Agency ServicesGrowth in targeted locations through footprint expansion and personnel gains
Real Estate ServicesExpansion of owned sites and franchise locations, particularly in Greater Perth and regional Victoria
Financial ServicesDevelop Livestock funding and insurance products, alongside our general insurance partnership in all regions
Feed & Processing Services
Opportunities to expand offerings in central NSW region
Source: ABARES Agricultural Overview, March quarter 202123
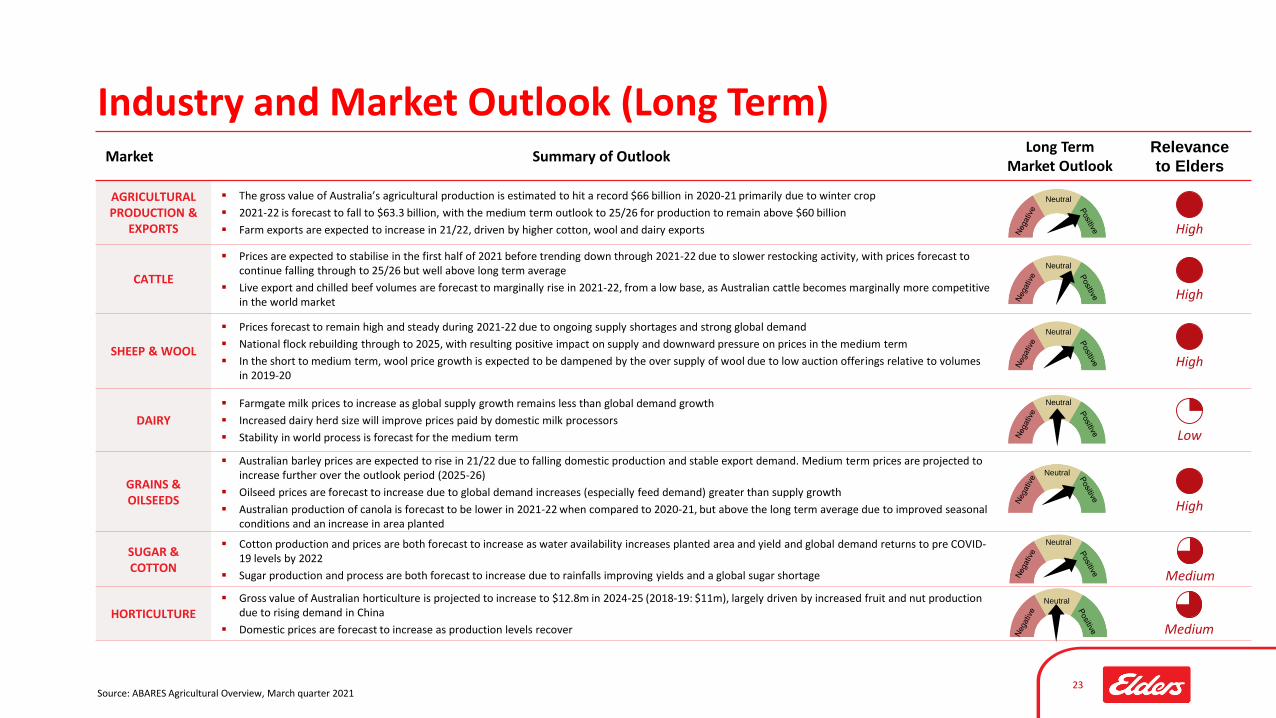
Industry and Market Outlook (Long Term)Market Summary of Outlook
Long Term Market Outlook
Relevance
to Elders
AGRICULTURAL PRODUCTION &
EXPORTS
▪ The gross value of Australia’s agricultural production is estimated to hit a record $66 billion in 2020-21 primarily due to winter crop
▪ 2021-22 is forecast to fall to $63.3 billion, with the medium term outlook to 25/26 for production to remain above $60 billion
▪ Farm exports are expected to increase in 21/22, driven by higher cotton, wool and dairy exports
CATTLE
▪ Prices are expected to stabilise in the first half of 2021 before trending down through 2021-22 due to slower restocking activity, with prices forecast to continue falling through to 25/26 but well above long term average
▪ Live export and chilled beef volumes are forecast to marginally rise in 2021-22, from a low base, as Australian cattle becomes marginally more competitive in the world market
SHEEP & WOOL
▪ Prices forecast to remain high and steady during 2021-22 due to ongoing supply shortages and strong global demand
▪ National flock rebuilding through to 2025, with resulting positive impact on supply and downward pressure on prices in the medium term
▪ In the short to medium term, wool price growth is expected to be dampened by the over supply of wool due to low auction offerings relative to volumes in 2019-20
DAIRY
▪ Farmgate milk prices to increase as global supply growth remains less than global demand growth
▪ Increased dairy herd size will improve prices paid by domestic milk processors
▪ Stability in world process is forecast for the medium term
GRAINS & OILSEEDS
▪ Australian barley prices are expected to rise in 21/22 due to falling domestic production and stable export demand. Medium term prices are projected to increase further over the outlook period (2025-26)
▪ Oilseed prices are forecast to increase due to global demand increases (especially feed demand) greater than supply growth
▪ Australian production of canola is forecast to be lower in 2021-22 when compared to 2020-21, but above the long term average due to improved seasonal conditions and an increase in area planted
SUGAR & COTTON
▪ Cotton production and prices are both forecast to increase as water availability increases planted area and yield and global demand returns to pre COVID-19 levels by 2022
▪ Sugar production and process are both forecast to increase due to rainfalls improving yields and a global sugar shortage
HORTICULTURE▪ Gross value of Australian horticulture is projected to increase to $12.8m in 2024-25 (2018-19: $11m), largely driven by increased fruit and nut production
due to rising demand in China
▪ Domestic prices are forecast to increase as production levels recover
Neutral
Neutral
Neutral
Neutral
Neutral
Neutral
Neutral
High
High
High
Low
High
Medium
Medium
24