ekg lab 2
TRANSCRIPT
EKG LAB
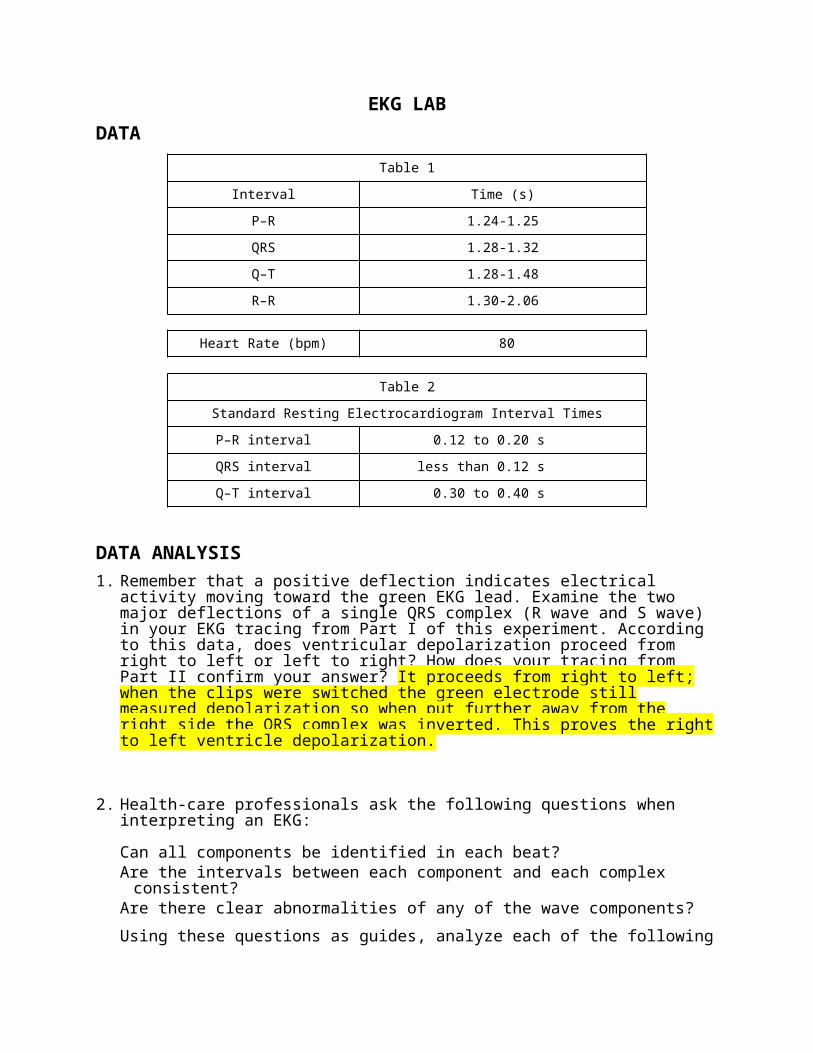
DATA
Table 1
Interval Time (s)
P–R 1.24-1.25
QRS 1.28-1.32
Q–T 1.28-1.48
R–R 1.30-2.06
Heart Rate (bpm) 80
Table 2
Standard Resting Electrocardiogram Interval Times
P–R interval 0.12 to 0.20 s
QRS interval less than 0.12 s
Q–T interval 0.30 to 0.40 s
DATA ANALYSIS
1. Remember that a positive deflection indicates electrical activity moving toward the green EKG lead. Examine the two major deflections of a single QRS complex (R wave and S wave) in your EKG tracing from Part I of this experiment. According to this data, does ventricular depolarization proceed from right to left or left to right? How does your tracing from Part II confirm your answer? It proceeds from right to left; when the clips were switched the green electrode still measured depolarization so when put further away from the right side the QRS complex was inverted. This proves the right to left ventricle depolarization.
2. Health-care professionals ask the following questions when interpreting an EKG:
Can all components be identified in each beat? Are the intervals between each component and each complex consistent? Are there clear abnormalities of any of the wave components?
Using these questions as guides, analyze each of the following three-beat EKG tracings and record your conclusions in Table 3 (indicate presence or absence of the P wave, and whether other intervals and/or shapes are normal or abnormal). The first analysis (a) is done for you.
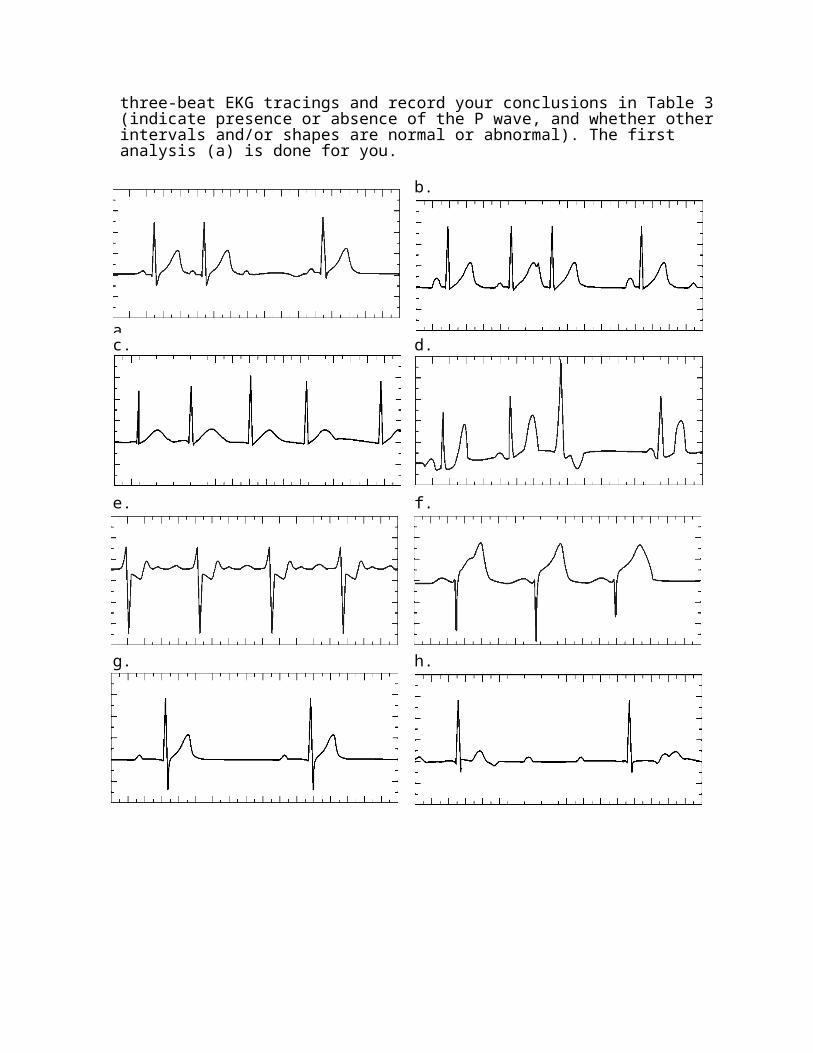
a.
b.
c. d.
e. f.
g. h.
Table 3

P Wave PR Interval QRS Interval QRS Shape T Wave Shape
ECG Beat Pres. Abs. Nml. Abs./Abn. Nml. Abs./Abn. Nml. Abn. Nml. Abs./Abn.
a
1 X X X X X
2 X X X X X
3 X X X X X
b
1 X X X X X
2 X X X X X
3 X X X X X
c
1 X X X X X
2 X X X X X
3 X X X X X
d
1 X X X X X
2 X X X X X
3 X X X X X
e
1 X X X X X
2 X X X X X
3 X X X X X
f
1 X X X X X
2 X X X X X
3 X X X X X
g
1 X X X X X
2 X X X X X
3 X X X X X
h
1 X X X X X
2 X X X X X
3 X X X X X