eiti – preparing for greater transparency in the mining ... - preparing for greater...
TRANSCRIPT

EITI – Preparing for Greater Transparency in the Mining
SectorRoger Gunson, Executive Manager
Regulatory Operations Mineral Resources Authority
23rd September 2015

Port Moresby
Achieved independence in 1975
Population of 7 million +, mainly of Melanesian culture
Official languages: English, Tok Pisin – over 850 language groups
Currency: Kina & Toea – derived from historic use of ‘shell money’ $USD1.00 = K0.3695
Mineral export receipts represent over 50% of GDP
During the 1970’s & 1980’s PNG hosted two of the worlds largest gold & copper mines: Panguna & Ok Tedi
It now hosts 2 world class gold & copper prospects: Frieda River & Wafi-Golpu
The PNG mining regulatory authority is the Mineral Resources Authority (MRA), based at Mining Haus in the capital Port Moresby
MRA is self-funded through production and alluvial gold export levies (0.25%), tenement rents and tenement administration fees

MINERAL RESOURCES AUTHORITY FUNCTIONS
• To advise the Minister on matters relating to mining, and the management, exploitation and development of PNG’s mineral resources
• To oversee the administration and enforcement of the Mining Act 1992, Mining (Safety) Act 1977, the Ok Tedi Acts and the Ok TediAgreement, the Mining (Bougainville Copper Agreement) Act 1967 and any other legislation relating to mining
• To negotiate mining development contracts as agent for the State
• To act as agent for the State in relation to any international agreement relating to mining
• On behalf of the State to administer and be responsible for the administration of any public investment programme relating to mining

ORGANISATION CHART
MINING ACT 1992
MINERAL RESOURCES AUTHORITYACT 2005
MINING (SAFETY) ACT 1977
REGISTRARTECHNICAL
ASSESSMENT BRANCH
Managing DirectorChairman Administrative Responsibility
CHIEF MINING WARDEN
MINES INSPECTORATE BRANCH
MINING ADVISORY COUNCIL

GOLD & COPPER: IN IT’S 31ST YEAR OF OPERATION, NOW 100% STATE OWNED &
LOCATED AT 2000M ON MT FUBILAN WHERE RAINFALL EXCEEDS 12M PA
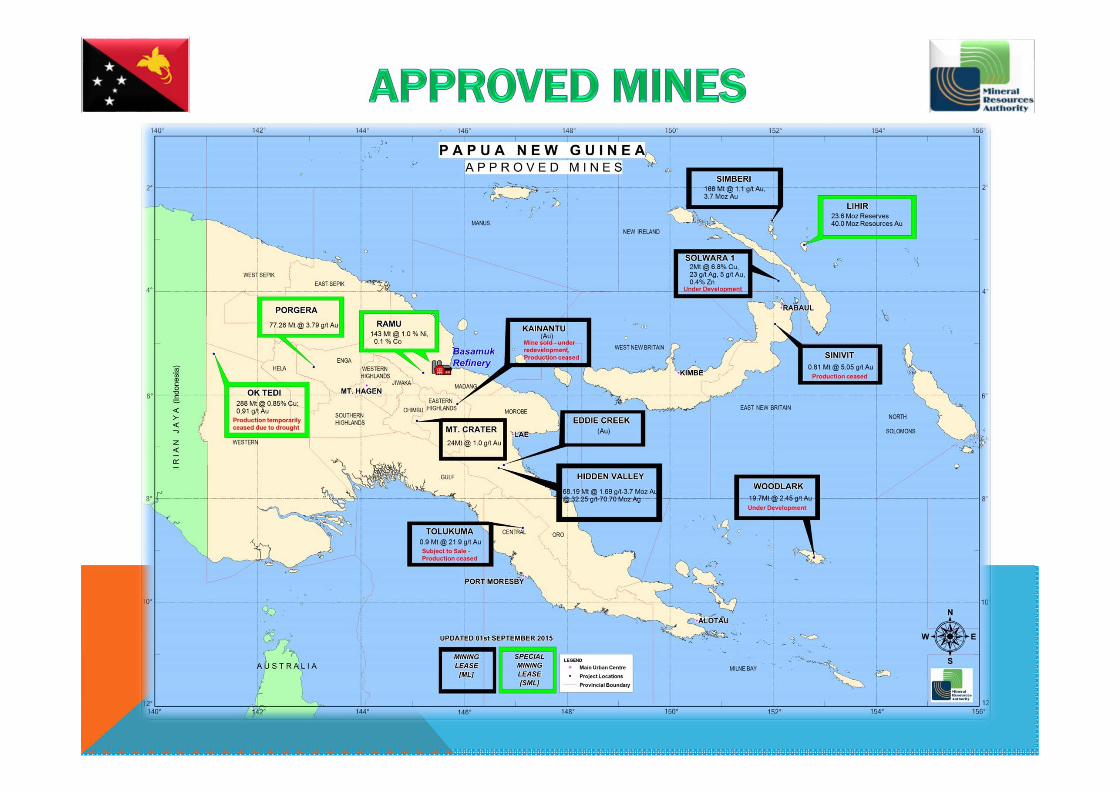
288 Mt @ 0.85% Cu & 0.91 g/t Au

• Currently producing Gold, Silver, Copper, Nickel & Cobalt
• Significant alluvial gold & silver deposits
• Hosts the world’s 1st offshore deep sea mine
• PNG is located within the Pacific ‘Rim of Fire’ with significant geothermal resources which are defined as a ‘mineral’
• Further world class discoveries of gold, copper & nickel
• New mineral discoveries of molybdenum, heavy mineral sands and coal.

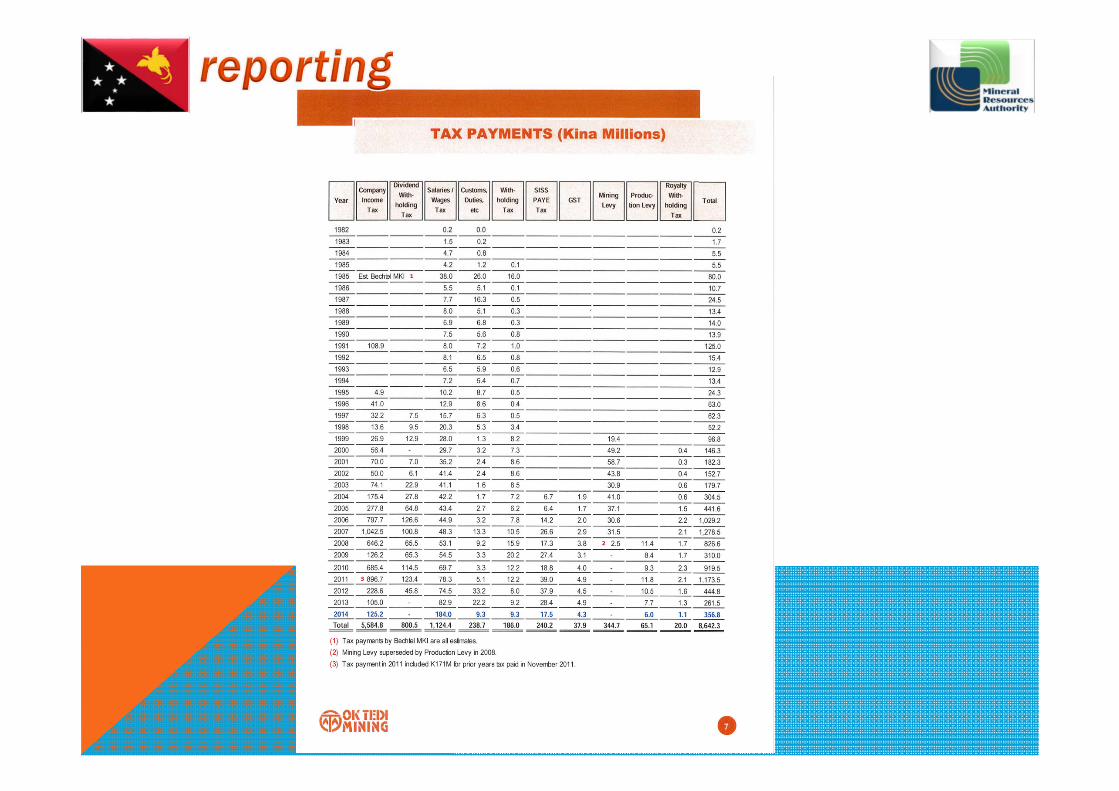
Mining Production Levy • 0.25% of assessable income or value of alluvial gold exports
Company (Income) Tax
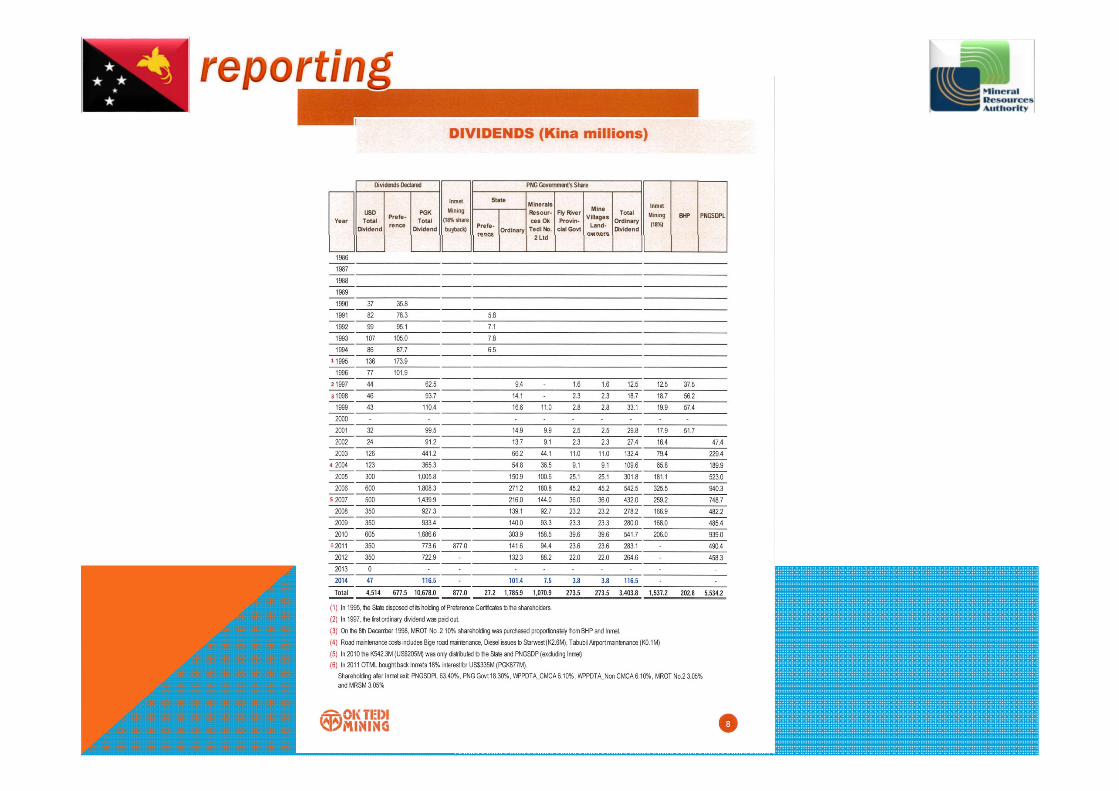
Dividend Withholding Tax •10 %
Royalty • 2% on net smelter returns• No additional profit or capital gains taxes• No restrictions on repatriation of profits
Special Mining Lease • May enjoy negotiated tax advantage during “investment recovery period”
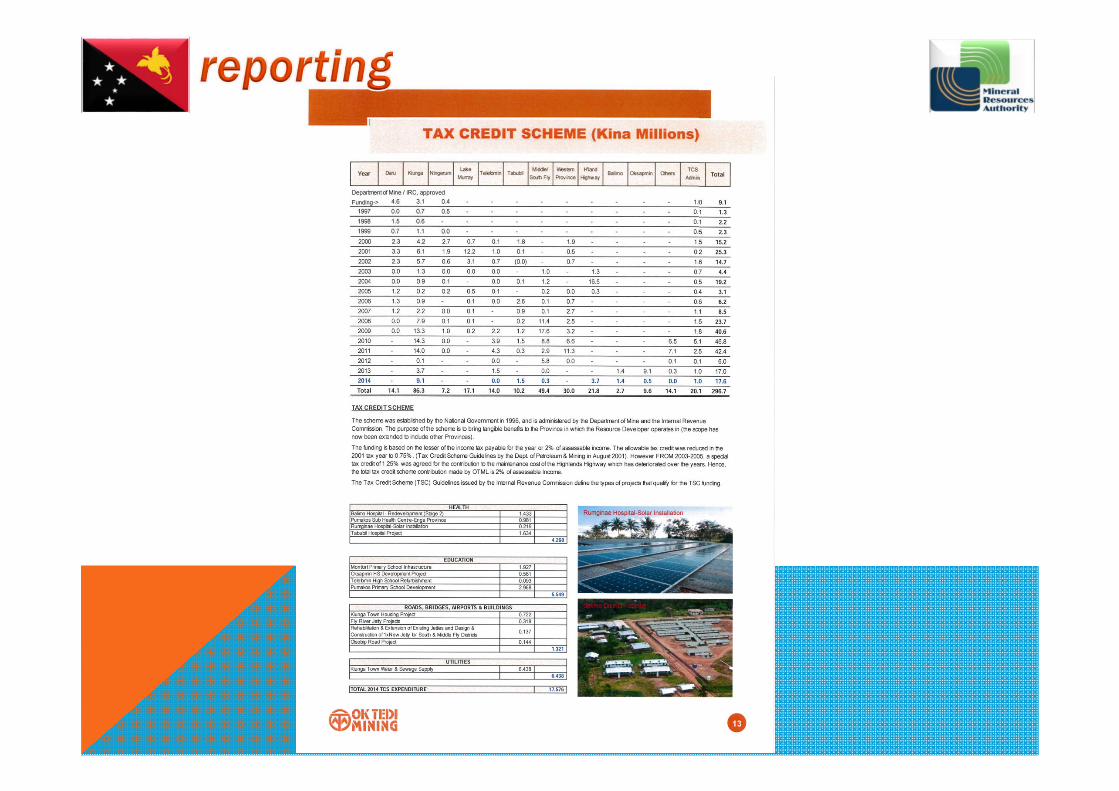
Tax Credit Scheme • Money spent on approved related projects = tax deduction
State Equity Participation
• The State has an option in all exploration licenses to take up to 30% equity in any PNG Mining development
• Equity payment based on ‘un-recouped sunk costs’
• 30 %

GOLD: WORLD’S 3RD LARGEST PRODUCER – LOCATED IN A VOLCANIC ISLAND CRATER & PART POWERED BY GEOTHERMAL ENERGY. OWNED
& OPERATED BY NEWCREST.
40m oz resource. 700,000 oz + pa.Hidden Valley mine & the advanced Wafi-Golpu deposit are owned/managed through the MorobeMining Joint Venture comprising Newcrest and Harmony Gold, South Africa.

M R A
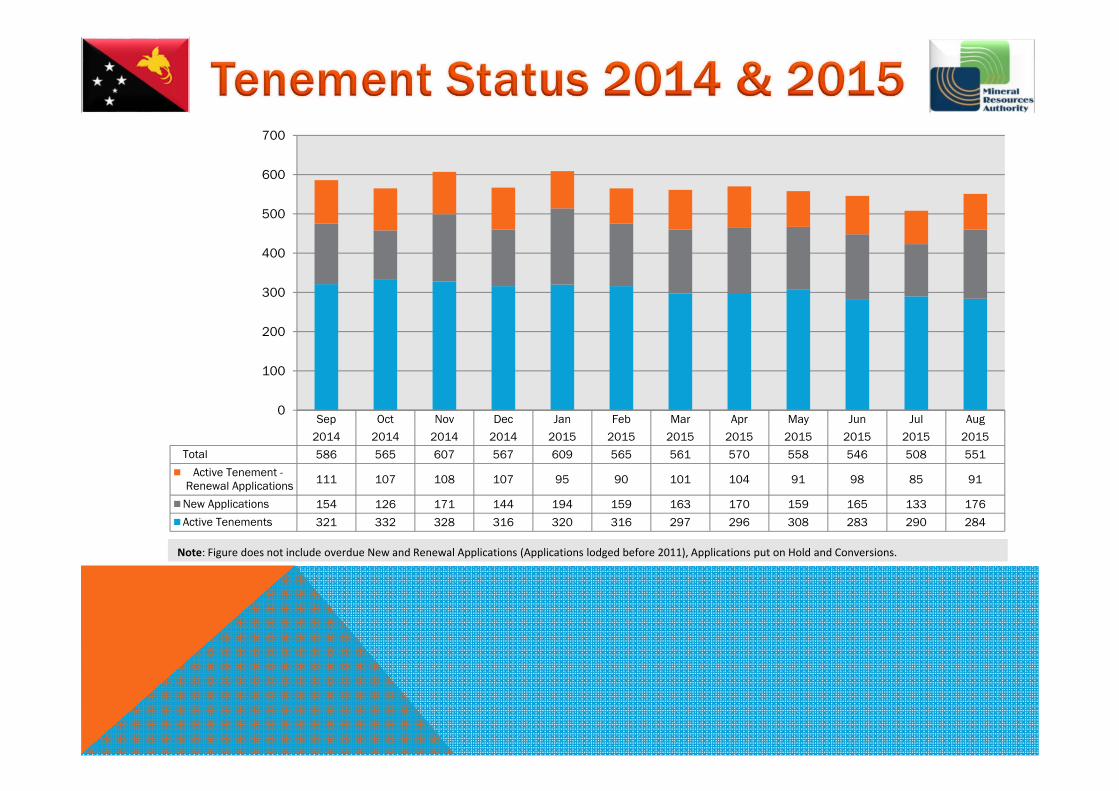
Sep Oct Nov Dec Jan Feb Mar Apr May Jun Jul Aug
2014 2014 2014 2014 2015 2015 2015 2015 2015 2015 2015 2015
Total 586 565 607 567 609 565 561 570 558 546 508 551
Active Tenement - Renewal Applications 111 107 108 107 95 90 101 104 91 98 85 91
New Applications 154 126 171 144 194 159 163 170 159 165 133 176
Active Tenements 321 332 328 316 320 316 297 296 308 283 290 284
0
100
200
300
400
500
600
700
Note: Figure does not include overdue New and Renewal Applications (Applications lodged before 2011), Applications put on Hold and Conversions.

CHINESE OWNED NICKEL & COBALT MINE & REFINERY – COMMENCED PRODUCTION IN DECEMBER 2012
143 Mt @ 1% Ni & 0.1% CoThe mine site is 125kms from the coastal refinery and is connected by a slurry pipeline. A deep Sea Tailings Placement system is used for mine waste.
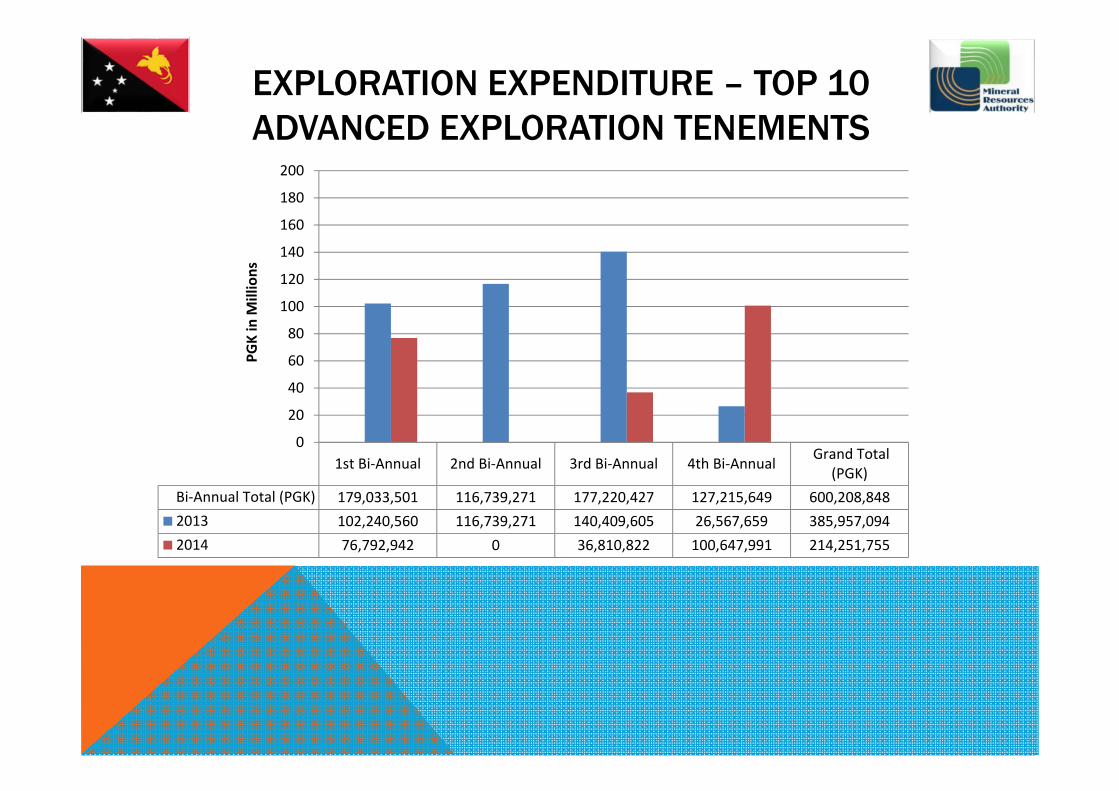
EXPLORATION EXPENDITURE – TOP 10 ADVANCED EXPLORATION TENEMENTS
1st Bi‐Annual 2nd Bi‐Annual 3rd Bi‐Annual 4th Bi‐Annual Grand Total(PGK)
Bi‐Annual Total (PGK) 179,033,501 116,739,271 177,220,427 127,215,649 600,208,8482013 102,240,560 116,739,271 140,409,605 26,567,659 385,957,0942014 76,792,942 0 36,810,822 100,647,991 214,251,755
0
20
40
60
80
100
120
140
160
180
200
PGK in M
illions

Several major new players have entered the PNG mining sector in the past 12 months. MRA has a focus on mineral diversification and geophysics studies:
• Pan Aust completed the acquisition of 80% of the Frieda River project from Glencore/Xstrata in late 2014.
• K92 completed its acquisition from Barrick Kainantu of the Kainantu underground gold & copper mine in February 2015
• Anglo American completed a joint venture/farm-in with Highlands Pacific to take its Star Mountains project into advanced exploration/feasibility
• Barrick announced on 26 May 2015 a strategic partnership with Chinese mining group Zijin Mining acquiring 50% of the Porgera mine
• Niugini Nickel commenced a feasibility study into the viability of direct exports from Wowo Gap
• Mayur Iron &Titan Metals are moving to feasibility on their Amazon Bay & Malaulaua heavy mineral sands deposits. Katana has completed feasibility on its Salamaua deposits.
• Waterford Coal have released a comprehensive report on the coal resources of PNG. Prospects in the Gulf Province are encouraging.


• Alluvial or artisanal mining is a very active sector in PNG with certain regulatory ‘reservations’ for citizens
• Estimates indicate over 100,000 actively mine within this sector
• Tenements for small scale miners may be held under an Alluvial Mining Lease (AML) or a Mining Lease (for alluvial purposes (ML))
• Commercial arrangements are secured through registered ‘Tribute Agreements’
• To further promote the sector, the Small Scale Mining Branch (SSMB), hosts and annual Alluvial Mining Convention & Trade Show in Lae
• MRA, in conjunction with the SSMB, has an aspirational goal to double alluvial production & revenue by 2020.


2011(Jan‐Dec) 2012(Jan‐Dec) 2013(Jan‐Dec) 2014(Jan‐Dec)Alluvial Gold (oz) 102,770 94,305 97,587 119,847
Alluvial Silver (oz) 36,105 53,208 44,647 48,983
0
20
40
60
80
100
120
140Oun
ces (oz) T
housan
dsAlluvial Au and Ag Exported ‐ 2011 to 2014
2011(Jan‐Dec)
2012(Jan‐Dec)
2013(Jan‐Dec)
2014(Jan‐Dec)
MRA Silver Value (PGK) 2,865,182 3,314,302 1,871,832 2,141,483
MRA Gold Value (PGK) 360,268,574 311,836,471 298,448,999 373,395,269
0
50
100
150
200
250
300
350
400
PGK in M
illions
Revenue From Export Of Alluvial Au and Ag ‐ 2011 to 2014

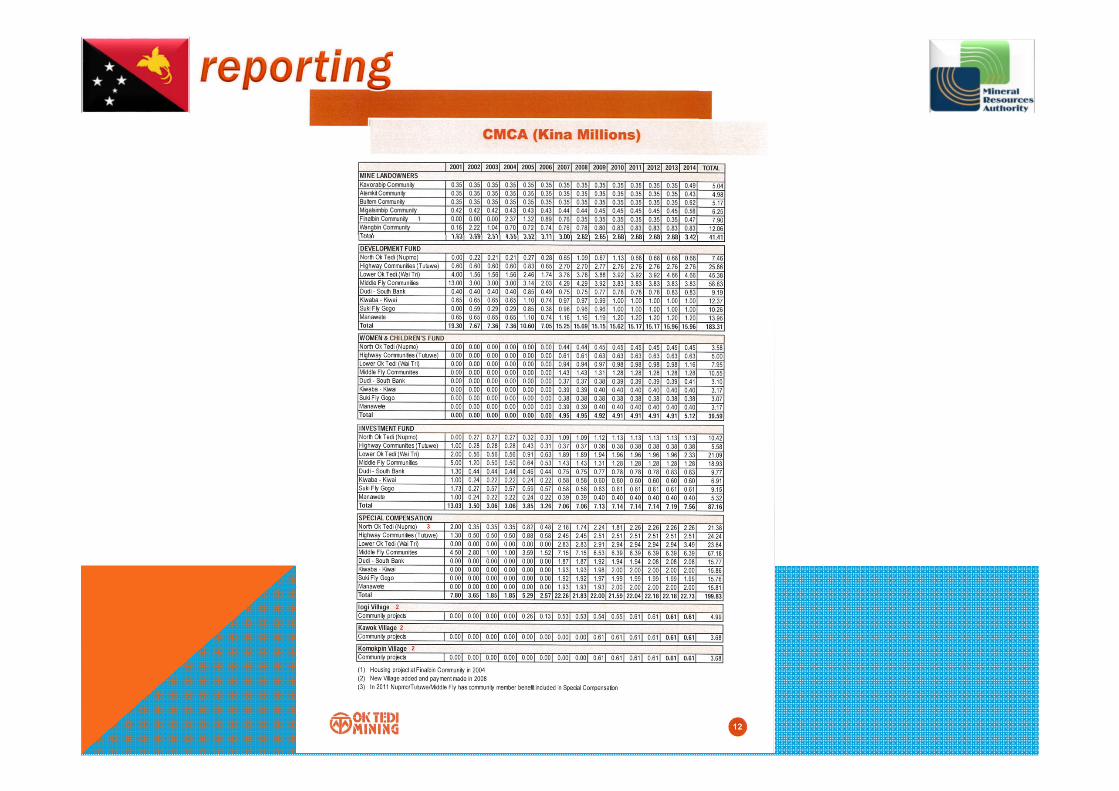
MEMORANDUM OF AGREEMENT/MINING DEVELOPMENT CONTRACT REQUIREMENTS
Developer:
• Community Development Fund
• Employment & Training
• Business Development Assistance
• Goods & Services Procurement
• Fiscal Receipts & Expenditure Reporting (EITI)
• Environmental & Sustainability Management
• Rehabilitation & Mine Closure
Government:
• Royalties & Benefit Distribution (EITI)
• Special Support Grants
• Tax Credit Scheme
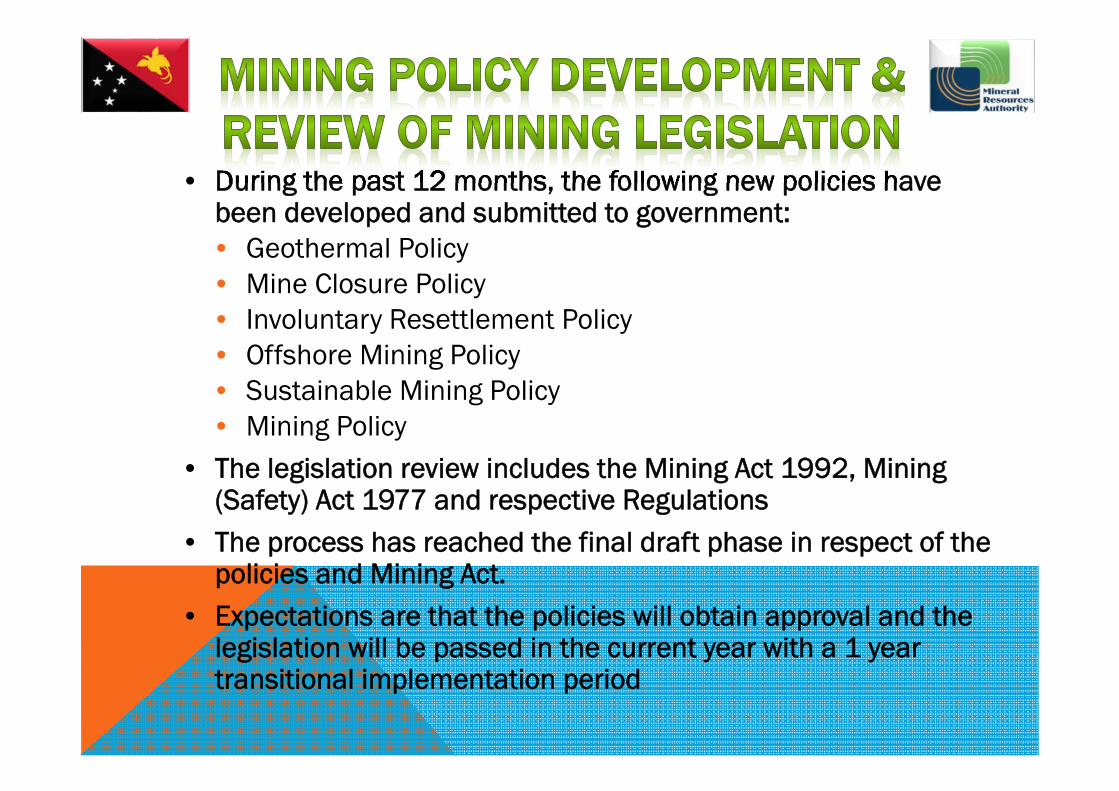
• During the past 12 months, the following new policies have been developed and submitted to government: • Geothermal Policy• Mine Closure Policy • Involuntary Resettlement Policy • Offshore Mining Policy • Sustainable Mining Policy • Mining Policy
• The legislation review includes the Mining Act 1992, Mining (Safety) Act 1977 and respective Regulations
• The process has reached the final draft phase in respect of the policies and Mining Act.
• Expectations are that the policies will obtain approval and the legislation will be passed in the current year with a 1 year transitional implementation period


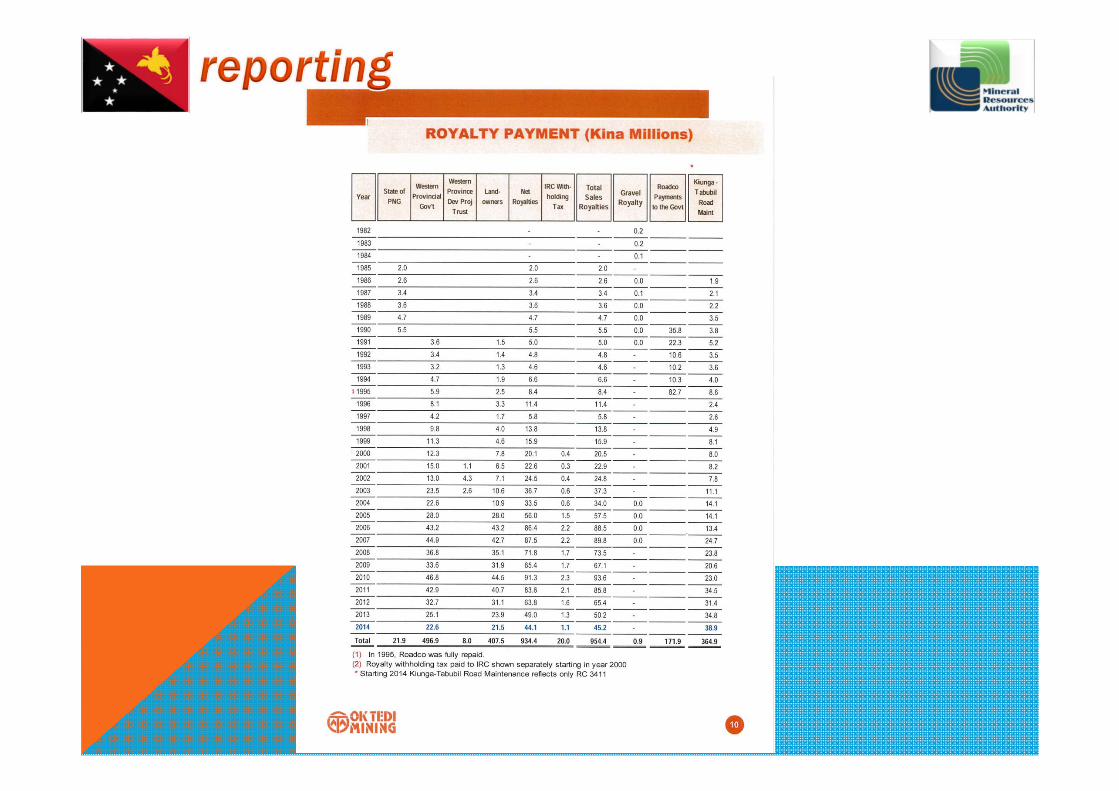
ROYALTY PAYMENTS
2% of FOB sales revenue and paid on a monthly basis directly to beneficiaries by mining companies
Paid on the basis of the distribution agreed to under Memoranda of Agreements for each project
Some MOAs have been reviewed hence distribution will change as soon as the revised agreements are signed
Beneficiaries are Landowners, Provincial, District and Local Level Governments

TABLE 1.1 MINING PRODUCTION AND ROYALTY SUMMARY
Mine Project Period Production Net Revenue for Royalty Royalties Paid
Gold (ounces) Silver (ounces) Copper (tonnes) PGK PGK
Ok Tedi Mining Limited 1986‐2014 11,692,554 25,776,754 4,297,190 34,772,088,976 661,542,031
Lihir 1997‐2014 11,406,766 23,286,067,706 465,598,347
Tolukuma 2003‐2014 426,456 1,016,237 721,009,635 14,420,193
Simberi 2008‐2014 364,470 1,021,944,942 20,438,899
Mt. Sinivit 2008‐2013 26,245 6,263 74,877,638 1,497,553
Hidden Valley 2009‐2014 782,000 6,116,342 2,232,394,033 44,647,881
Porgera 1990‐2010 16,876,041 3,034,909 315,101,039
Total 41,574,531 35,950,505 4,297,190 62,108,382,930 1,523,245,942
Ramu Nico Still on Ramp up stage ‐ not paying any royalties yet

PAYMENTS OF MINING ROYALTIES BY PROJECT
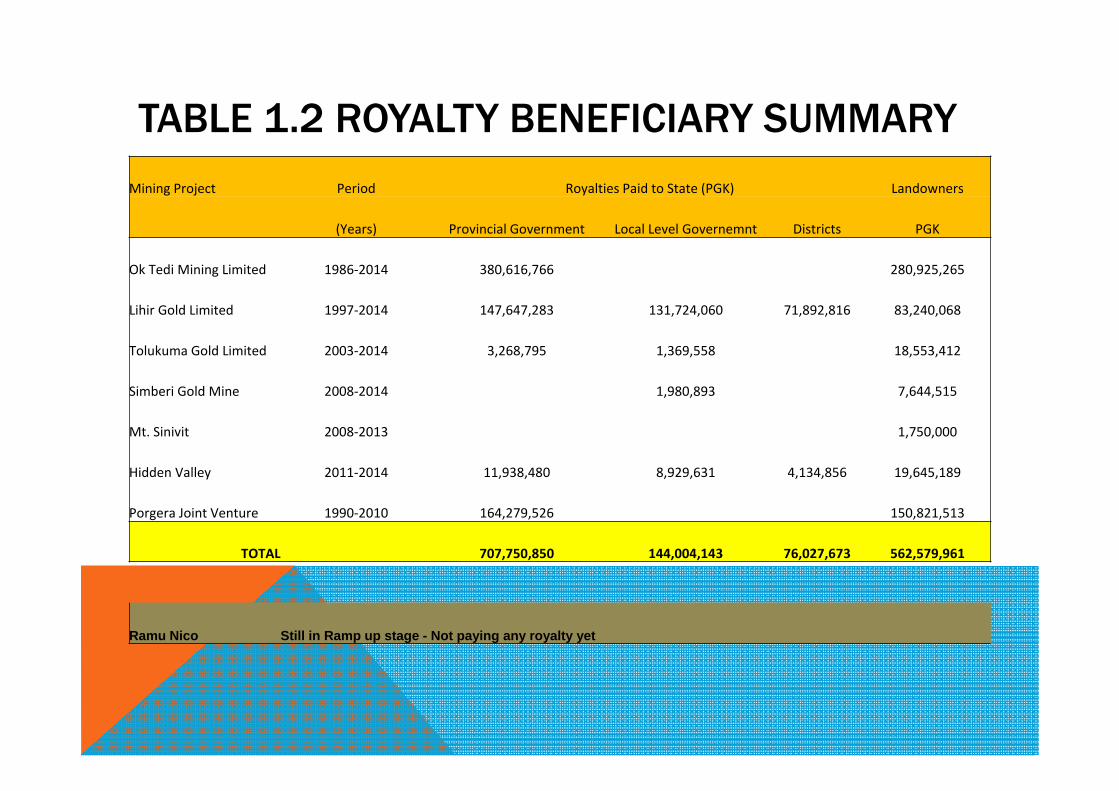
TABLE 1.2 ROYALTY BENEFICIARY SUMMARY
Mining Project Period Royalties Paid to State (PGK) Landowners
(Years) Provincial Government Local Level Governemnt Districts PGK
Ok Tedi Mining Limited 1986‐2014 380,616,766 280,925,265
Lihir Gold Limited 1997‐2014 147,647,283 131,724,060 71,892,816 83,240,068
Tolukuma Gold Limited 2003‐2014 3,268,795 1,369,558 18,553,412
Simberi Gold Mine 2008‐2014 1,980,893 7,644,515
Mt. Sinivit 2008‐2013 1,750,000
Hidden Valley 2011‐2014 11,938,480 8,929,631 4,134,856 19,645,189
Porgera Joint Venture 1990‐2010 164,279,526 150,821,513
TOTAL 707,750,850 144,004,143 76,027,673 562,579,961
Ramu Nico Still in Ramp up stage - Not paying any royalty yet
NOTES (IN RELATION TO TABLES 1.1 AND 1.2) 1. Figures in the above table are based on records contained in statutory reports received by MRA. There is some missing data which is not captured in the figures above, therefore these figures must not be taken as verified data.
2. The data needs verification with its respective mining company and possible audit.
3. The cumulative figures are reflective of figures from commencement of production for each of the mines to 2014, except for Tolukuma (2003 - 2014) and Porgera (1990 - 2010)
4. Mt Sinivit is still under care and maintenance thus its figures are reflective of years from 2008 - 2013 only.
5. Ramu Nico, is not yet paying any royalties as it is not at the required production capacity level.