effects of zeolites on the growth of cucumber and tomato
TRANSCRIPT
Bachelor project in the Horticultural Science programme 2007-04, 10 p (15 ECTS)
Effects of zeolites on the growth of cucumber and tomato seedlings
by
Lisa Rydenheim
Fakulteten för landskapsplanering, trädgårds- och jordbruksvetenskap
SLU-Alnarp
Effects of zeolites on the growth of cucumber and tomato seedlings
Lisa Rydenheim
Supervisor: Helena Karlén Examiner: Håkan Asp
Department of Horticulture Swedish University of Agriculture (SLU), Alnarp
Box 44 SE-230 53 Alnarp
2

Summary
Zeolites are a group of minerals, with a special structure giving them properties like ion-
exchange capacity and the ability to act as molecular sieves. Due to these properties zeolites
have a wide range of applications in various areas.
ZeoPro is a commercial product, based on natural zeolite minerals and developed as a plant
growth medium. It is claimed to improve plant performance, utilize nutrients more efficient
and reduce nutrient leaching to the environment. In this study the effect of ZeoPro on
cucumber and tomato seedlings was evaluated when 5%, 10% and 20% ZeoPro was mixed
into the growth medium. The results showed some increase in growth when ZeoPro was
added to the growth medium. In cucumber the growth increased with increasing amount of
ZeoPro, generating the largest plants with 20% ZeoPro and the smallest in the control group
without ZeoPro. In tomato, the largest plants were found in the 5% group closely followed by
the 10% and 20% groups. The plants in the control group, grown without addition of ZeoPro
were clearly smaller than the other groups.
Sammanfattning
Zeoliter är en grupp mineraler med speciell struktur vilken ger dem egenskaper som
jonbytarkapacitet och möjlighet till molekylsiktning. På grund av dessa egenskaper har
zeoliter ett stort antal skilda användningsområden.
ZeoPro är ett planteringsmedia baserad på naturliga zeoliter. Det sägs ge kraftfullare
plantutveckling, högeffektivt näringsutnyttjade och reducera näringsläckage till omgivningen.
I den här studien utvärderas effekten av ZeoPro på småplantor av gurka och tomat, när 5%,
10% och 20% ZeoPro blandades i växtsubstratet. Resultaten visade på en viss ökad tillväxt
vid tillsats av ZeoPro. På gurka ökade tillväxten med ökat innehåll av ZeoPro och gav störst
plantor vid 20% innehåll av ZeoPro och minst plantor i kontrollgruppen utan tillsats av
ZeoPro. I tomat fanns de största plantorna i 5%-gruppen tätt följda av 10%- och 20%-
grupperna. Plantorna i kontrollgruppen, utan tillsats av ZeoPro, var tydligt mindre än de andra
grupperna.
3

Acknowledgements
I would like to thank the persons that have contributed and helped me during this project. First
of all, my very supportive supervisor, Helena Karlén, for excellent supervising throughout this
project. Thanks also to Håkan Asp for valuable advice when writing the report, Jan-Eric
Englund for guidance in the statistical part of the project, Mats Kron at Bara Mineraler who
helped in the literature search and Lennart Bergström and Digitech Rental AB for sending me
the product, ZeoPro. Also a special thanks to Johannes Albertsson, ”the soil mixer”, for great
help in the snow blizzard. Finally I would like to thank the people who have helped me with
various practical details during the experimental work, Hartmut Schüssler, Karl-Johan
Bergstrand, Siri Caspersen and Margit Nothnagl.
4

Contents
INTRODUCTION................................................................................................................................................. 7 BACKGROUND OF ZEOLITES........................................................................................................................ 8
PHYSICAL AND CHEMICAL PROPERTIES ............................................................................................................... 8 OCCURRENCE...................................................................................................................................................... 9 APPLICATIONS .................................................................................................................................................. 10
History ......................................................................................................................................................... 10 Industry........................................................................................................................................................ 11 Protection of environment ........................................................................................................................... 12 Other applications ....................................................................................................................................... 12 Agriculture................................................................................................................................................... 12 Animal husbandry........................................................................................................................................ 13 Plant production.......................................................................................................................................... 13
ZEOPRO ............................................................................................................................................................ 15 AIM ...................................................................................................................................................................... 17 MATERIALS AND METHODS ....................................................................................................................... 17
EXPERIMENTAL DESIGN .................................................................................................................................... 17 IMPLEMENTATION ............................................................................................................................................. 17 GROWING CONDITIONS...................................................................................................................................... 18 MEASUREMENTS ............................................................................................................................................... 18 STATISTICAL ANALYSES.................................................................................................................................... 19
RESULTS ............................................................................................................................................................ 20 CUCUMBER ....................................................................................................................................................... 20
General appearance .................................................................................................................................... 20 Increase of plant height ............................................................................................................................... 20 Development of leaves ................................................................................................................................. 21 Final height ................................................................................................................................................. 22 Fresh weight ................................................................................................................................................ 23 Dry weight ................................................................................................................................................... 24 Leaf area...................................................................................................................................................... 25 Summary of results ...................................................................................................................................... 25
TOMATO............................................................................................................................................................ 26 General appearance .................................................................................................................................... 26 Increase of plant height ............................................................................................................................... 26 Development of leaves ................................................................................................................................. 27 Final height ................................................................................................................................................. 28 Fresh weight ................................................................................................................................................ 29 Dry weight ................................................................................................................................................... 30 Leaf area...................................................................................................................................................... 31 Summary of results ...................................................................................................................................... 31
DISCUSSION AND CONCLUSION................................................................................................................. 32 PROCESS OF THE PROJECT WORK ....................................................................................................................... 32 DISCUSSION OF RESULTS ................................................................................................................................... 32 FUTURE ASPECTS .............................................................................................................................................. 34
REFERENCES.................................................................................................................................................... 36 APPENDIX 1....................................................................................................................................................... 38
DEVELOPMENT OF CUCUMBER PLANTS ............................................................................................................. 38 APPENDIX 2....................................................................................................................................................... 39
DEVELOPMENT OF TOMATO PLANTS.................................................................................................................. 39 APPENDIX 3....................................................................................................................................................... 40
5

FINAL OBSERVATIONS FOR CUCUMBER ............................................................................................................. 40 APPENDIX 4....................................................................................................................................................... 41
FINAL OBSERVATIONS FOR TOMATO.................................................................................................................. 41
6
Introduction The topic of this report is zeolites and their application in horticulture. Zeolites are a group of
minerals built up by aluminosilicates. They have a rigid 3-dimentional, crystalline structure
consisting of a network of interconnected tunnels and cages. The structure gives zeolites
special properties like a high ion-exchange capacity and the ability to act as molecular sieves
(ZeoponiX, 2000). Due to these properties zeolites have a wide range of applications in
various areas. This report covers background information about zeolites, such as structure,
properties, occurrence and applications.
The results of a minor practical pre study will also be presented in this report. A commercial
product called ZeoPro, based on natural zeolite minerals and developed as a plant growth
medium, was used. It is claimed to improve plant performance, utilize nutrients more efficient
and reduce nutrient leaching to the environment (ZeoponiX, 2000).
The technology behind this product was first developed by the National Aeronautics and
Space Administration (NASA) and then further developed by the American company
ZeoponiX, Inc.. The distributor of ZeoPro in Sweden and Norway is DIGITECH Rental AB.
Several experiments with ZeoPro have been carried out in the U.S. for ZeoponiX, in turf,
floriculture and vegetable applications. In a Swedish investigation the influence of ZeoPro on
the development of spruce and fur seedlings have been evaluated (Söderberg, 2004).
The aim of this pre study was to investigate if ZeoPro effects the growth of cucumber and
tomato seedling if 5%, 10% or 20% of ZeoPro was mixed into the growth medium, which in
this case was a peat:sand mix. The three treatments were compared with a control with no
addition of ZeoPro. The growth was evaluated in several ways; height, leaf number, leaf area,
fresh weight and dry weight.
7
Background
Physical and chemical properties of Zeolites Zeolites are a group of hydrated aluminosilicates of the alkali and alkaline earth metals (GSA
Resources, 2000). They are crystalline minerals having an infinite, open, three-dimensional
structure (Mumpton, 1998). The silica and alumina anions, SiO44- and AlO4
5-, form a
tetrahedral framework, strongly bonded at all corners. This structure forms a network of
interconnected tunnels and cavities with an almost uniform diameter from about 3-12 Å (GSA
Resources, 2000). The open structure of zeolites makes it different from e.g. the tightly
packed framework structures of quartz and feldspar. Zeolite species with void volumes of
50% are known.
The presence of aluminium exchanging silicon results in a negative charge, which is
balanced by positively charged cations (Demir et. al., 2004). Most of the cations belong to the
alkaline earth metals like Na, Ca, K and in some cases Ba and Sr (Bengtsson, 1998).
Loosely bound molecular water is also present in the structure of all natural zeolites,
surrounding the exchangeable cations in the large pore spaces (Mumpton, 1985). Zeolites are
characterized by their ability to lose and absorb this water without damage to their crystal
structures (Mineral Gallery, 2005). This feature has given them its name. The name Zeolites,
which is Greek in origin, means “boiling stones” from zeo (to boil) and lithos (stone) and it
refers to the ability of water to be reversibly driven of (The MCS Zeolite Page 2005).
A special aspect of the zeolite structure is that it can act as a molecular sieve. A molecular
sieve is a material with selective adsorption properties capable of separating components in a
mixture on the basis of a difference in molecular size and shape (Anonymous, 2005). Under
normal conditions, the large cavities and entry channels of zeolites are filled with water
molecules. The water can be removed, usually by heating to 3000 to 4000ºC for a few hours.
Once this is done molecules having diameters small enough to fit through the entry channels
are readily adsorbed on the inner surface of the vacant cavities. Molecules too large to pass
through the entry channels are excluded, giving rise to the “molecular sieving” (Mumpton,
1985).
Another important property of zeolite is the ability to exchange cations. The alkali and
alkaline earth cations in the zeolites, that compensate the negative charge of the silicon-
aluminium oxygen framework, are able to exchange with other cations. Most natural zeolites
have a cation exchange capacity from 200-400 meq/100g (Mumpton, 1998). The smaller the
8
silicon to aluminium ratio in the zeolite framework, the greater the ion-exchange capacity.
This principle is not always kept however. Experiments have shown that ion-exchange
capacity not only depends on the Si/Al ratio, but also on ion-exchange form of the zeolite. For
example, some papers report that ion-exchange capacity was reduced by the presence of
potassium (Kalló & Sherry, 1988).
It is important to remember that the physical and chemical properties vary a lot between
different types of zeolites. Crystal structure and chemical composition account for the primary
differences. One difference which is particularly important is the composition of
exchangeable cations. Particle density, cation selectivity, molecular pore size and strength are
other properties that can differ depending on the zeolite in question. But variation does not
only occur between different types of zeolites but also in the physical and chemical properties
of zeolites in the same group. Source plays a large role in these variations (ZeoponiX, 2000).
Occurrence There are about 150 different zeolites of which approximately 60 are represented as naturally
occurring minerals (Thomasson, 1998). In nature, zeolites generally originate from a volcanic
glass precursor (Kalló & Sherry, 1988). They are often formed during a very low grade
metamorphism. Some form from just subtle amounts of heat and pressure and can just barely
be called metamorphic, while others are found in obviously metamorphic regimes (Mineral
Gallery, 2005). The most common natural zeolites are analcime, chabazite, clinoptilolite,
erionite, modenite, laumontite and phillipsite (Thomasson, 1998).
Natural zeolites mainly occur in three types of geological deposits. The first one is in
volcanic rocks. The second type as sediments. They can either be kilometre tick land-
sediments or deep-sea sediments, in the Atlantic sea and the Pacific Ocean. The third type of
deposits is in thermally active areas like in New Zeeland (Thomasson,1998).
Today only the sedimentary findings on land are profitable for mining. Deposits of natural
zeolites in sedimentary rocks have been found on all continents in more than 40 countries, for
example the US, Japan, Cuba, Russia, Hungary, Italy, Korea, Taiwan, Bulgaria, Mexico and
South Africa (Thomasson, 1998). The world stockpile of natural sedimentary zeolite-rich
rocks is great, probably billions of tons (Kalló & Sherry, 1988). The commercial use is still in
its infancy, but more than 300 000 tons of zeolite-rich tuff is mined each year (Mumpton,
1985). As expected, most of it is used in countries with own assets of sedimentary zeolites
(Thomasson, 1998).
9

Industry has mimicked some of the natural zeolites and formed many new synthetic zeolites
targeted towards very specific purposes (The MCS Zeolite Page 2005). Some of the most
common synthetic zeolites are zeolite A,X,Y and ZMS-5 (Demir et. al., 2004).
Applications
History Natural zeolites were first discovered and recognized as distinct mineralogical species by the
Swedish mineralogist, Freiherr Axel Fredrick Cronstedt in 1756 (Demir et. al., 2004). The
utilization of the mineral, however, was well established long before that. There are many
examples around the world were zeolite rock have been used for building material as long as
4000 years ago. The knowledge of zeolites intrinsic chemical reactivity, adsorptivity and
cation exchange properties have more recently been exploited by the 20th-century man (Kalló
& Sherry, 1988).
As early as in the mid-1800s chemists were investigating the cation-exchange and molecular
sieving properties of natural zeolites. The problem was that zeolites was sufficiently abundant
for experimental purposes, but not present in amounts that could support commercial
operations. The non-availability of natural zeolites prompted the chemists to turn to synthesis
as a mean of obtaining a steady supply of these materials. For example, R. M. Milton
synthesized a zeolite that was called Linde’s Type A zeolite, which today is one of the
mainstays of the worldwide molecular sieve business (Kalló & Sherry, 1988).
As the synthetic zeolite business increased in the late 1950s geologists discovered major
deposits of natural zeolites in near-surface sedimentary rock. It made it possible to use
relatively inexpensive surface-mining techniques. This opened up for low-cost applications
using the natural materials, in addition to those being developed for the dollar-a-pound
synthetic products. After these discoveries the Zeolite Appreciation Society began to grow
and efforts to exploit these natural recourses in various areas of agriculture and industrial
technology were made in many countries (Kalló & Sherry, 1988).
During the last 40-50 years zeolitic materials have obtained great application in industry,
agriculture and environment protection. Natural zeolites have received considerable attention
in both technical and popular press as this generation’s “wonder mineral” (Kalló & Sherry,
1988). Due to its wide range of application possibilities zeolites have been referred to as the
magic rock, la roca magica. The applications make use of one or more of the following
10

properties: cation exchange, adsorption and related molecular sieving, catalytic, dehydration
and rehydration and finally biological reactivity (Mumpton, 1999).
The oldest application of natural zeolites is as building material and it is still being used as
building stone and as lightweight aggregates and pozzolans in cement and concretes
(Mumpton, 1999).
Industry In industry, natural zeolites have a wide range of applications. They are used for drying and
purification of gaseous flows, including gases containing acidic substances. Their great
adsorption selectivity for H2O makes them excellent desiccants. They are for example used to
remove water and carbon dioxide from sour natural gas (Mumpton, 1999).
Enrichment of oxygen and nitrogen from air is also an important field. The zeolites possess
heightened adsorption capacity for molecular nitrogen compared with molecular oxygen. This
allows the production of air containing different and increased contents of nitrogen and
oxygen (Kalló & Sherry, 1988). Oxygen enriched air can be used in hospitals, in fishbreeding
and transportation, and in poorly ventilated restaurants (Mumpton, 1999).
Natural zeolites are also used as fillers in paper, rubbers and polymers.
Clinoptilolites may be used in the harnessing of solar energy. They desorbs water at heating
by the solar radiation (during the day) and release heat by adsorption of water vapour during
the (during the night) (Kalló & Sherry, 1988).
Encapsulation of gases is another interesting application. At elevated temperatures the
openings in the zeolites structure widens. When the temperature is decreased the gas
molecules are trapped and can be stored in the zeolites. This is an efficient method of gas
storage which has become more important with the development of new aircraft techniques
and the conquest of space (Kalló & Sherry, 1988).
Today mostly synthetic zeolites are used as catalysts. The two principal uses of synthetic
molecular sieves are the purification of gaseous hyrocarbons and the preparation of catalysts
for petroleum refining (Mumpton, 1999). 1.4 million tons of synthetic zeolites are produced
annually for catalyse, ion exchange and adsorption. The technically and economically most
important application for synthetic zeolites are the petrochemical industry to “crack” or break
down various raw materials to form specific chemicals like gasoline. More than 98% of the
world production of oil is cracked with zeolites (Thomasson, 1998).
11
Protection of environment Environmental protection becomes more and more important as the increasing amounts of
harmful matters pollute the air and waters of our planet. Natural zeolites have been found to
have many application possibilities in this field, as they are able to purify air and water media.
They are for example widely used for the purification of drinking, municipal and industrial
wastewaters (Kalló & Sherry, 1988).
Zeolites also have an important role in treatment of nuclear waste and fallout. They have
superior selectivity for certain radionuclides and are resistant to degradation by nuclear
radiation (Mumpton, 1999).
Because natural zeolites easily adsorb large cations they are effective in filtering agents to
remove lead, copper, cadmium and other toxic matters from the environment. It has been
shown that clinoptilolite adsorb heavy metals, decreasing the content in soil and plants (Kalló
& Sherry, 1988).
Other applications Numerous natural zeolite-containing products have come on the market in the U.S., Japan,
Hungary, Cuba and Germany. The most common is pet litters that take up water and odour-
causing NH3 from animal urine. The zeolites have the ability to exchange NH4+ from aqueous
solutions and thereby preventing the release of NH3 into the atmosphere.
Several deodorizing agents have also been marketed. They can remove malodours from
example shoes, garbage cans and refrigerators (Mumpton, 1999).
Large quantities of the synthetic zeolite, zeolite A, are used as ion exchangers in laundry
detergents to exchange magnesium and calcium ions from hard water with their own sodium
ions (NASAexplores, 2003).
Zeolites are sometimes used as paint components with anti-corrosive properties (Demir et.
al., 2004).
Some medical applications have also been developed for certain zeolites. Fore example as
effective filter media to remove NH4+ from the dialysate of kidney patients during
hemodialysis (Mumpton, 1999).
Agriculture All over the world agriculturists increase their efforts to expand crop and animal production.
More and more attention is being paid to various mineral materials as soil amendments and
12
dietary supplements in animal husbandry. The zeolite group is a group of minerals with
considerable potential in a wide variety of agricultural processes. They are fast becoming the
subject of serious investigations in dozens of agricultural laboratories worldwide (Mumpton,
1985).
Animal husbandry Many experiments have been carried out on the application of natural zeolites as dietary
supplements for several types of domestic animals. Despite the lack of statistical significance,
numerous studies strongly suggest that the addition of certain zeolites to the diets of swine,
poultry and ruminants result in improvements in growth and feed efficiency. In addition, the
occurrence of intestinal disease among young animals appears to be less when zeolites are a
part of the daily diet. The exact functions of zeolites in these phenomena are not well
understood (Mumpton, 1985).
Many studies have also reported noticeable decrease in excrement malodour when zeolites
are used as a dietary supplement. Similar results were noted when zeolites were added directly
to cattle feedlots. These effects are a result of zeolites high selectivity for the ammonium ion.
This suggests that not only can healthier and less odoriferous environments be achieved, but
that the nitrogen-retention ability of the manure can be important as well (Mumpton, 1985).
Plant production The high ion-exchange and retention ability of natural sedimentary zeolites (in particularly
clinoptilolites) as wells as their large adsorptive affinity for water has contributed to their
successful applications in plant growth.
The agrotechniques of today uses huge amounts of fertilizers and other chemical
preparations. These are intensely washed out by rain and irrigation water, and thereby
polluting the environment (Kalló & Sherry, 1988). Zeolites help to retain nutrients in the root
zone to be used by the plants when required. Consequently this leads to more effective use of
fertilizers by reducing their rates for the same yields, by prolonging their activity or finally by
producing higher yields (Demir et. al., 2004).
Especially clinoptilolite have a pronounced selectivity for cations, such as ammonium and
potassium. This has been exploited in the preparation of slow-release chemical fertilizers. For
example, Hershey et. al., (1980), showed that potassium-enriched clinoptilolite added to a
potting medium for chrysanthemums acted very similar to a slow-release fertilizer. The same
13

fresh-weight yield was achieved with a one-time addition of clinoptilolite as with a daily
irrigation of Hoagland’s solution, containing 238 ppm K, for three month.
In a greenhouse experiment with radishes, the addition of ammonium-exchanged
clinoptilolite resulted in increased root weight. The nitrogen uptake by the plant tops also
increased with the zeolite treatment compared with an ammonium sulphate control
(Mumpton, 1985).
Urea is one of the most commonly used nitrogen fertilizers. It is very soluble in water and
can be leached through the root zone. In addition, urea is converted into ammonium ions by a
microbial enzyme found in most soils. Soil bacteria then convert these ammonium ions into
readily leachable nitrate ions. Using zeolitic rock in fertilizer may prevent these nutrient
losses (Eberl, 1993). The rate of nitrogen release from zeolites is slowed in three ways: (1 ) by
containing urea in the rock pores and zeolite structures, thus preventing the leaching of urea
from the root zone; (2) by slowing down the conversion of urea by soil microbial enzymes,
thus delaying the formation of ammonium ions; and (3) by taking up ammonium ions into
exchange sites in the zeolite, thus protecting them from nitrifying bacteria (Bengtsson, 1998,
Eberl, 1993).
Considerable attention has been paid to so called zeoponic mixtures of NH4+- or K+-
exchanged natural zeolites and phosphate minerals e.g. apatit (Mumpton, 1999). Apatite is a
calcium phosphate, and by mixing it with a zeolite having exchangeable ions like ammonium,
phosphate (H2PO4-) can be released to plants. The approximate reaction in soil solution is as
follows: (P-rock) + (NH4-zeolite) → (Ca-zeolite) + (NH4+) + (H2PO4
-). The zeolite takes up
Ca2+ from the phosphate rock, thereby releasing both phosphate and ammonium ions.
Zeolites ability to retain moisture is also very important in plant growing. They may hold
water up to 60% of their weight due to the high porosity of the crystalline structure. Zeolites
assure a permanent water reservoir, providing prolonged moisture during dry periods. The
also promote a rapid re-wetting and improve the lateral spread of water into the root zone
during irrigation. This reduces the quantity of water needed for irrigation.
The porous structure of natural zeolites also helps to keep the soil well aerated. Unlike other
soil amendments (e.g. lime) zeolites does not eventually break down, but remains in the soil
to improve nutrient retention. This can significantly reduce costs of water and fertilizers over
time. (Demir et. al., 2004).
Another beneficial property of zeolites in plant growing is its ability to trap heavy metals in
the soil by ion-exchange and thereby preventing their uptake into the food chain. The origin
of the heavy metals is often municipal and industrial sewage sludge used as a nutrient source.
14
Research have also shown that addition of clinoptilolite to soils contaminated with radioactive
strontium (Sr90) resulted in a significantly decrease in plant uptake of strontium (Mumpton,
1985, Thomasson, 1998).
The high adsorption capacities and high ion-exchange capacities of many zeolites also
makes them effective carriers of herbicides, fungicides and pesticides (Mumpton, 1985).
ZeoPro The zeoponic systems mentioned above have been utilized by the National Aeronautics and
Space Administration (NASA). They have taken the zeolite-apatite reaction one step further
and prepared a substrate consisting of a specially cation-exchanged clinoptilolite and a
synthetic apatite containing essential trace nutrients for use as a plant-growth medium in
shuttle flights. This formulation may well be the preferred substrate for vegetable production
aboard future space missions and in commercial green houses (Mumpton, 1999).
A company called ZeoponiX, Inc. has further developed this technology and is marketing a
product called ZeoPro. DIGITECH Rental AB is the retailer of this product in Sweden and
Norway.
ZeoPro is a combination of growth medium/fertilizer/soil amendment. The product is
granular and includes a nutrient amended natural zeolite (clinoptilolite) and synthetic apatite.
It is loaded with N P K 0.1% – 0.1% – 0.6%. The specific properties of the product can be
seen in table 1.
The clinoptilolite has its origin in Arizona and is chosen for its desirable properties. It is
high in K low in Na to avoid toxic affects on the plants. It also has a high CEC and durable
particles.
The synthetic apatite contain calcium hydroxyl phosphate (Ca10(PO4)6(OH)2) plus some
micro and trace nutrient substitutions.
According to the company, ZeoponiX, Inc., ZeoPro could be used in numerous areas like
golf greens, sport fields, greenhouses, nurseries, pot plants, flower beds, lawns and vegetable
growing. It is claimed to improve the plant performance, utilize nutrients more efficient and
reduce nutrient leaching to the environment (ZeoponiX, 2000).
15

Tab 1. Properties of ZeoPro
Particle size 0,4-2,4mm
Volume 780-1050kg/m2
Specific Surface Area 40m2/g
CEC 1,65meq/g
Several experiments with ZeoPro and it precursors have been carried out in the U.S. for the
company ZeoponiX, Inc. on turf, floriculture and vegetable applications. Many of these
experiments have shown that different rates of zeoponic substrates with no supplemental
fertilization can produce plants similar in size and quality to conventionally produced plants
fertilized with nutrient solution. Summaries of the results are available on their webpage
(ZeoponiX, 2000). However, the details of these experiments are considered proprietary and
have not been released.
In a Swedish investigation done by Söderberg (2004), the effect of ZeoPro on spruce and fur
seedlings was evaluated. Two, five and ten % of ZeoPro were mixed with peat and compared
with a control group planted in pure peat. The four groups had the same conditions in terms of
light, water and fertilization. Measurements of shoot length, stem diameter and dry weight
was carried out every 3-4 weeks at totally 4 occasions.
The results showed that the plants grown in a mixture of ZeoPro and peat were larger than
the ones grown in pure peat. The plants grown with ZeoPro were approximately 3 weeks
earlier in development than the ones grown without ZeoPro. Söderberg believes that this
advantage probably is due to the fact that these plants had access to a larger amount of
nutrients than the ones grown in pure peat (Söderberg, 2004).
16

Aim
The aim of this pre study was to investigate if ZeoPro effects the growth of cucumber and
tomato seedlings when 5%, 10% or 20% is added to the substrate, compared to a control
grown in a mixture of peat and sand (3:1) without addition of ZeoPro. The growth will be
evaluated in several ways; height, leaf number, leaf area, fresh weight and dry weight.
Materials and Methods
Experimental design The study was carried out at SLU in Alnarp from the 6/2 to 13/3 2006. Two plant species
were used; cucumber (Cucumis sativus) and tomato (Lycopersicon lycopersicum). Plants of
each species were planted in a peat:sand (3:1, vol:vol) mixture with the addition of 0%, 5%;
10% or 20% (vol/vol) of ZeoPro.
In total, 32 cucumber plants and 32 tomato plants were used, which means four groups with
8 plants per group (table 2). The plants of the control group were planted in a mixture of 2/3
unfertilized, limed peat and 1/3 sand. The treatments were 5%, 10% and 20% of ZeoPro
added to the peat:sand mixture, used as a control.
Tab 2. Experimental setup
ZeoPro 0% 5% 10% 20% Cucumber 8 8 8 8 Tomato 8 8 8 8
Implementation The substrate used as a control was made by mixing 2/3 unfertilized, limed peat (75 litre) and
1/3 (37,5 litre) sand together with 0,29kg lime powder in a cement-mixer for 20 minutes. The
amount of lime was calculated to regulate the pH to between 5-5,8. The mixture was then
poured onto a plastic tarpaulin and used to fill 23, 1 litre pots. 10 of the pots were used for
cucumber, 12 for tomato and one for observation. The plan was to have 10 plants for each
group. Due to lower germination rate than expected, the group size had to be reduced to 8
plants.
17
25 litre of each mixture with ZeoPro was prepared. For the 5%-mixture, 1,25 litre ZeoPro
and 23,75 litre peat:sand was mixed in the cement-mixer for 4 minutes. The mixture was then
poured out and used to fill 23 pots. The mixing with 10% and 20% were carried out in the
same way, using 2,5 litres and 5 litres of ZeoPro respectively.
The pots were placed on trays with each group of plants on one tray. Every pot was then
given a number. The trays were placed on a bench in a greenhouse compartment and watered
thoroughly.
The seeds were bought from Olssons Frö AB and the name of the cultivars was; greenhouse
cucumber DRL 9471 F1 and tomato ‘Avengance’ F1. The cucumber seeds were soaked in
water for one hour before sowing. After sowing, the seeds were covered with a small amount
of peat:sand mixture and the pots were watered again.
Growing conditions The pots were kept in a greenhouse with a day and night temperature of 20°C and a relative
humidity of approximately 50% during the whole study. However, since the trial was carried
out during the winter the temperatures could differ depending on the outside weather.
In the first two weeks there was no need for irrigation. After that the plants were watered
once a week with 150ml of pure water per pot. No supplementary light from lamps was used.
Measurements The growth of the plants was evaluated once a week throughout the trial, in total five times
for cucumber and six times for tomato. The first time only plant emergence or not was noted.
During the rest of the study, plant height was measured and leaves counted (the cotyledons
were not included). For cucumber only leaves that were larger than 2 cm were counted.
At the end of the study, fresh weight, dry weight and leaf area were measured for each plant.
The plants were cut off at the soil surface and the fresh weight was immediately determined.
After that, the leaves were removed with a scissor (including the cotyledons). They were cut
into appropriate size and the leaf area was measured with an area meter (LI-COR, MODEL
LI-3100 AREA METER). Each plant was put in a paper bag and dried in an oven at 80ºC for
approximately 36 hours. After that the dry weight was measured.
18

Statistical analyses The values of all measurements were analyzed in Minitab. Mean and standard deviation was
calculated and Tukey simultaneous tests were carried out at a 5% level. Bars in the figures
marked with the same letter are not significantly different.
19

Results
Cucumber
General appearance The cucumber plants looked rather healthy at the end of the trial. The 20% and 10% groups
had started to develop ovaries in the leaf axils.
The 0% and 5% group showed no clear symptoms of deficiency. However, especially the
0% group was very small. They were probably stunted in growth due to nutrient deficiency.
Some deficiency symptoms were visible in the 20% and 10% group. Yellow and later dead
spots at the edge of the older leaves developed during the last week of the trial. This symptom
could indicate phosphorus or manganese deficiency (Caspersen, 2006, Asp, 2006)
Increase of plant height The height development of cucumber plants is shown in fig. 1. The 10% and 20% group
clearly grow faster from day 14 and forward and ends up at heights between 150-200 mm.
The plants belonging to 0% and 5% groups grew more slowly and the final heights were in
average less than 150 mm. The control plants grew faster than those belonging to the 5%
group until the last measurement, when the average height for the 5% group was higher.
0
50
100
150
200
250
14 21 28 35
Day
Hei
ght (
mm
) 0%5%10%20%
Fig 1. Average height for cucumber plants grown in a peat:sand mixture
with the addition of 0%, 5%, 10% and ZeoPro, measured once a week (n=8)
20

Development of leaves The average number of leaves per cucumber plant, counted at three occasions during the trial,
is shown in fig. 2. The figure shows that the 10% and 20% groups develop faster during the
whole trial. At the end of the trail the plants from both groups have in average 4 leaves.
The 0% and 5% groups initially develop quit similarly, but at the last measurement the 5%
group have more leaves than the 0% group. Most of the plants in the 0% group had 3 leaves
or less and the plants in the 5% group had between 3 and 4 leaves.
The development of leaves only shows the number of leaves and does not specify the size of
the leaves, except that they are more than 2 cm long. The measurements of the leaf area
(fig. 6) give a better picture of the actual size of the plants. However it does only show the
size at the end of the trial and not the development over time.
0
0,5
1
1,5
2
2,5
3
3,5
4
4,5
21 28 35
Day
Num
ber
o le
aves
0%5%10%20%
Fig 2. Average number of leaves on cucumber plants grown in a peat:sand mixture
with the addition 0%; 5%, 10% and 20% ZeoPro, counted once a week (n=8).
21
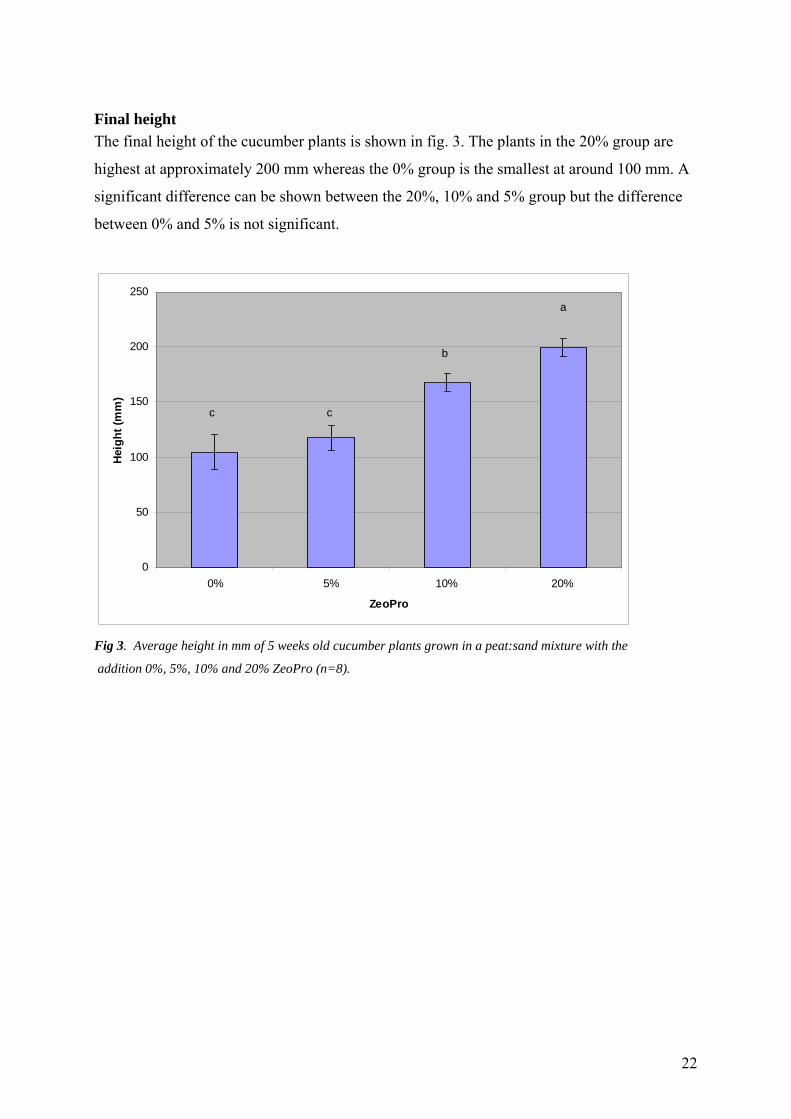
Final height The final height of the cucumber plants is shown in fig. 3. The plants in the 20% group are
highest at approximately 200 mm whereas the 0% group is the smallest at around 100 mm. A
significant difference can be shown between the 20%, 10% and 5% group but the difference
between 0% and 5% is not significant.
0
50
100
150
200
250
0% 5% 10% 20%
ZeoPro
Hei
ght (
mm
)
c c
b
a
Fig 3. Average height in mm of 5 weeks old cucumber plants grown in a peat:sand mixture with the
addition 0%, 5%, 10% and 20% ZeoPro (n=8).
22

Fresh weight The fresh weight of the cucumber plants are presented in fig. 4. The 10% and 20% groups
clearly have the highest fresh weights at approximately 9-10g per plant. In the 5% group the
fresh weight is approximately 5g and in the 0% it is about 3g. A significant difference can be
shown between all groups.
0
2
4
6
8
10
12
0% 5% 10% 20%
ZeoPro
Wei
ght (
g)
d
c
b
a
Fig 4. Average fresh weight in g of 5 weeks old cucumber plants grown in a peat:sand mixture with the
addition 0%, 5%, 10% and 20% ZeoPro (n=8).
23
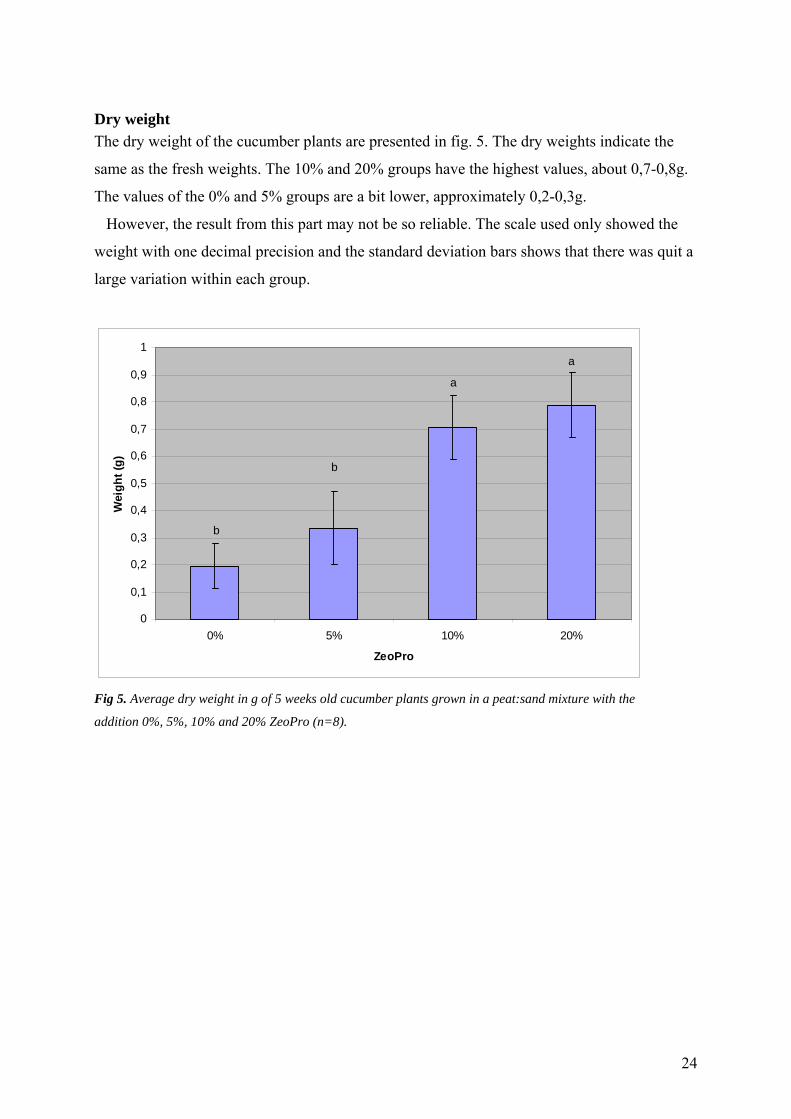
Dry weight The dry weight of the cucumber plants are presented in fig. 5. The dry weights indicate the
same as the fresh weights. The 10% and 20% groups have the highest values, about 0,7-0,8g.
The values of the 0% and 5% groups are a bit lower, approximately 0,2-0,3g.
However, the result from this part may not be so reliable. The scale used only showed the
weight with one decimal precision and the standard deviation bars shows that there was quit a
large variation within each group.
0
0,1
0,2
0,3
0,4
0,5
0,6
0,7
0,8
0,9
1
0% 5% 10% 20%
ZeoPro
Wei
ght (
g)
b
a
a
b
Fig 5. Average dry weight in g of 5 weeks old cucumber plants grown in a peat:sand mixture with the
addition 0%, 5%, 10% and 20% ZeoPro (n=8).
24

Leaf area The leaf area of the cucumber plants are presented in fig. 6. The leaf area also indicates that
the 10% and 20% groups have the largest plants. The area is measured to be around 300 cm2
for each of these two groups. For the 5% group the leaf area is approximately 200 cm2 and for
the 0% group it is about 100 cm2.
The leaf area also complements fig. 2 of the leaf development. That figure indicates that the
number of leaves in the 5% group were almost the same as in the 10% and 20% at the end of
the trial. Figure 6 however, shows that the average size of the leaves is smaller for the 5%
group compared with the 10% and 20% groups.
0
50
100
150
200
250
300
350
400
0% 5% 10% 20%
ZeoPro
Are
a (c
m3)
d
c
b
a
Fig 6. Average total leaf area in cm2 of 5 weeks old cucumber plants grown in a peat:sand mixture
with the addition 0%, 5%, 10% and 20% ZeoPro (n=8).
Summary of results All the results for the cucumber plants indicate that the groups with 10% and 20% added
ZeoPro have given the largest plants. The rate of development is faster and at the end of the
trial the average fresh weight and dry weight is higher and the leaf area is larger. At all
parameters, the values of the 20% group are consistently slightly higher than for the10%.
There is a small difference between the control group with no ZeoPro and the treatment
with 5% added ZeoPro. The growth rate is the same in the beginning, but at the end of the
trial the values for average fresh weight and dry weight is higher as well as the leaf area.
However, the difference is not as significant as between the 10% and 20% groups.
25
Tomato
General appearance The tomato plants did not look healthy at the end of the trail. Especially the control group
without ZeoPro (0%) was in very bad condition. They showed clear symptoms of
phosphorous deficiency with stunted growth, thin and slender stems and dark greenish purple
leaves coloured by anthocyanin. The other groups also showed some symptoms of
phosphorous deficiency, with the lower side of the leaves marbled in purple (Taiz & Zeiger,
2002, Caspersen, 2006). These symptoms started to occur at the forth time of observation.
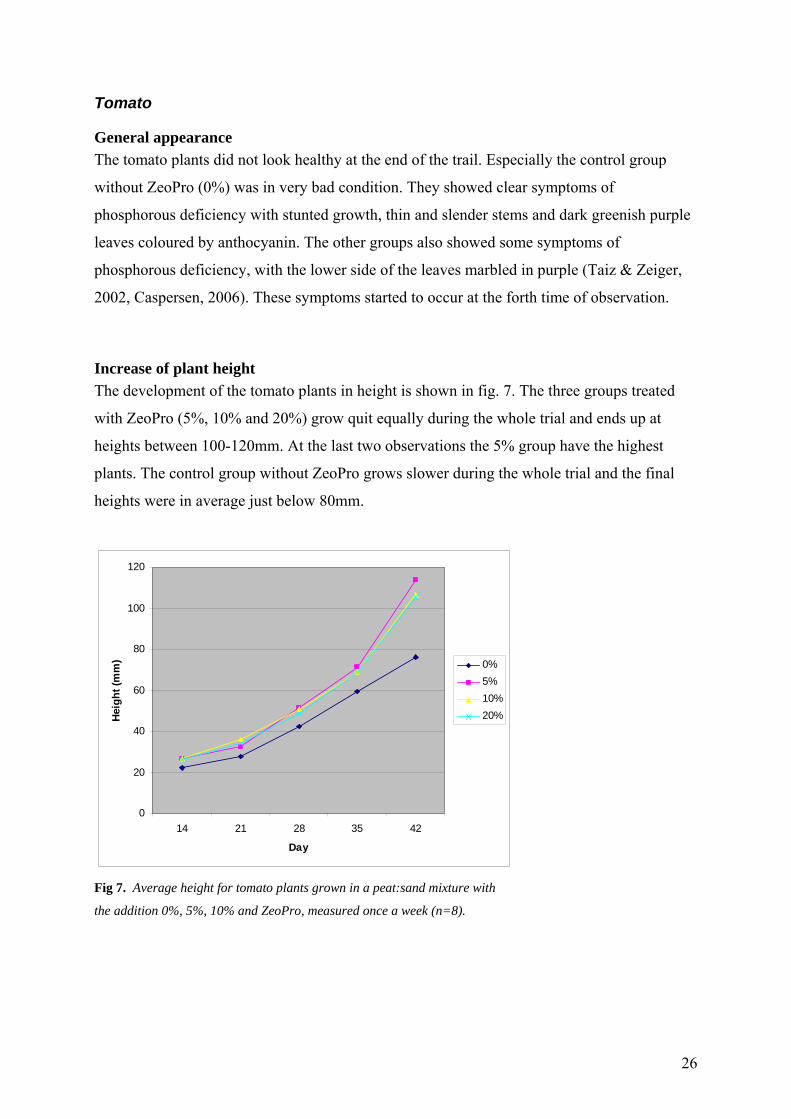
Increase of plant height The development of the tomato plants in height is shown in fig. 7. The three groups treated
with ZeoPro (5%, 10% and 20%) grow quit equally during the whole trial and ends up at
heights between 100-120mm. At the last two observations the 5% group have the highest
plants. The control group without ZeoPro grows slower during the whole trial and the final
heights were in average just below 80mm.
0
20
40
60
80
100
120
14 21 28 35 42
Day
Hei
ght (
mm
) 0%5%10%20%
Fig 7. Average height for tomato plants grown in a peat:sand mixture with
the addition 0%, 5%, 10% and ZeoPro, measured once a week (n=8).
26

Development of leaves The average number of leaves per tomato plant, counted at four occasions during the trial, is
shown in fig. 8. The 5% group has the most rapid development of leaves during the whole
trial. At the end, these plants have in average 6-7 leaves. The 10% and 20% group develops
very similar and ends up with 5-6 leaves. The 0% group has a clearly slower development and
has only in average 4 leaves at the end of the trail.
0
1
2
3
4
5
6
7
21 28 35 42
Day
Nr.
of le
aves 0%
5%10%20%
Fig 8. Average number of leaves on tomato plants grown in a peat:sand mixture
with the addition 0%; 5%, 10% and 20% ZeoPro, counted once a week (n=8).
27
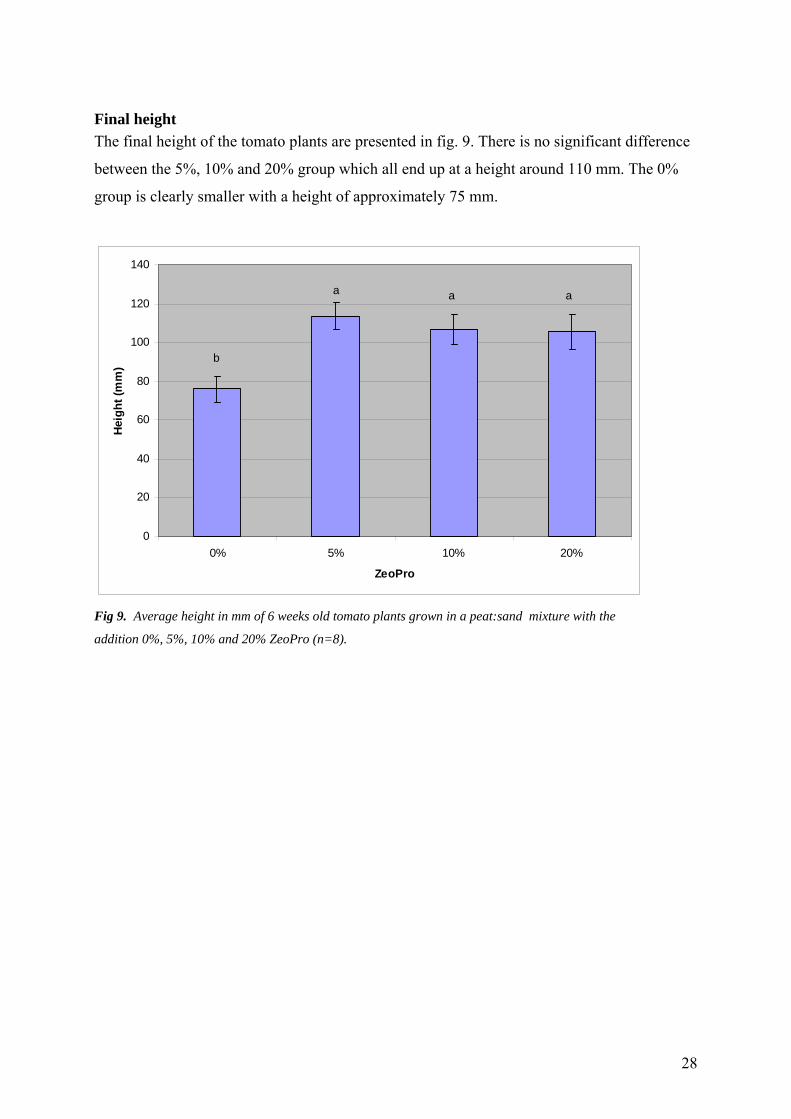
Final height The final height of the tomato plants are presented in fig. 9. There is no significant difference
between the 5%, 10% and 20% group which all end up at a height around 110 mm. The 0%
group is clearly smaller with a height of approximately 75 mm.
0
20
40
60
80
100
120
140
0% 5% 10% 20%
ZeoPro
Hei
ght (
mm
)
b
a a a
Fig 9. Average height in mm of 6 weeks old tomato plants grown in a peat:sand mixture with the
addition 0%, 5%, 10% and 20% ZeoPro (n=8).
28

Fresh weight The fresh weight of the tomato plants are presented in fig. 10. The highest fresh weights are
found in the 5% group. They have an average weight of approximately 5 g. The 10% and 20%
group follows just below and weighs about 4 g. The plants in the 0% group are clearly smaller
than the other groups and all weighs less than 2 g.
0
1
2
3
4
5
6
0% 5% 10% 20%
ZeoPro
Wei
ght (
g)
c
a
b b
Fig 10. Average fresh weight in g of 6 weeks old tomato plants grown in a peat:sand mixture with the
addition 0%, 5%, 10% and 20% ZeoPro (n=8).
29

Dry weight The dry weight of the tomato plants are presented in fig. 11. The dry weights indicate the
same as the fresh weights. The 5% group has the highest values and the 0% group clearly has
the lowest values.
However, the result from this part may not be so reliable. The scale used only showed the
weight with one decimal precision and the standard deviation lines shows that there was quit a
large variation within each group.
0
0,1
0,2
0,3
0,4
0,5
0,6
0% 5% 10% 20%
ZeoPro
Wei
ght (
g)
c
a
ab
b
Fig 11. Average dry weight in g of 6 weeks old tomato plants grown in a peat:sand mixture with the
addition 0%, 5%, 10% and 20% ZeoPro (n=8).
30
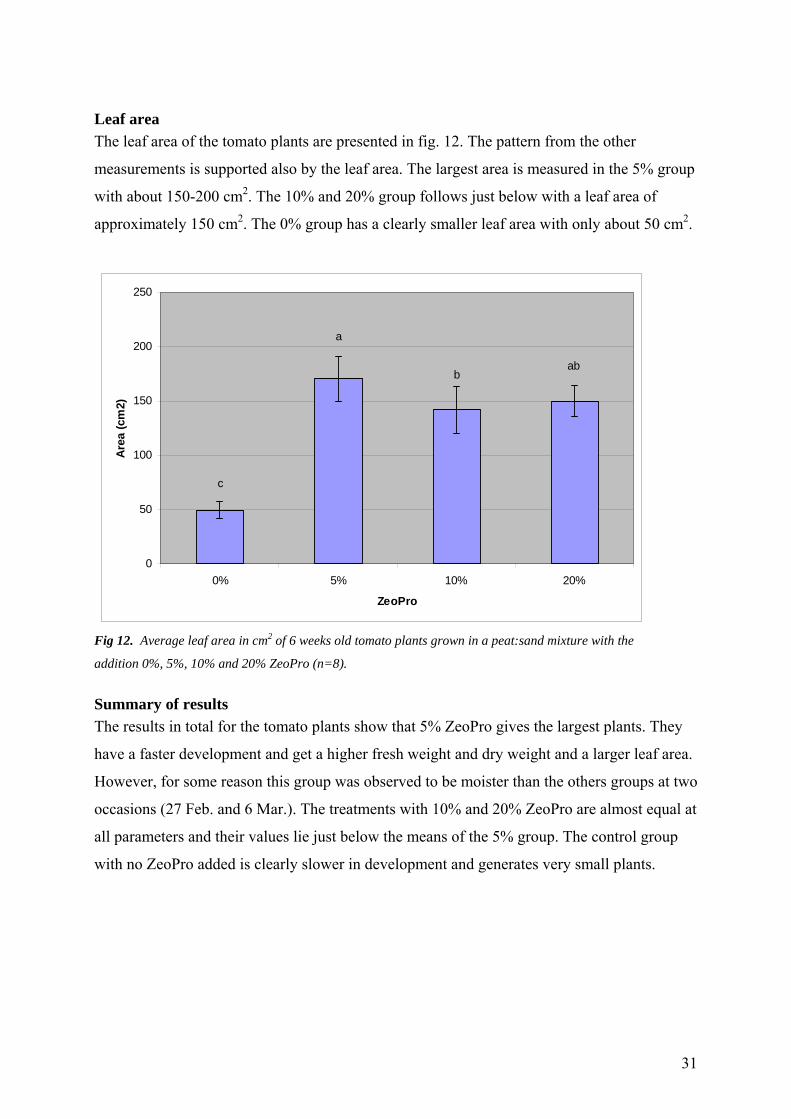
Leaf area The leaf area of the tomato plants are presented in fig. 12. The pattern from the other
measurements is supported also by the leaf area. The largest area is measured in the 5% group
with about 150-200 cm2. The 10% and 20% group follows just below with a leaf area of
approximately 150 cm2. The 0% group has a clearly smaller leaf area with only about 50 cm2.
0
50
100
150
200
250
0% 5% 10% 20%
ZeoPro
Are
a (c
m2)
c
a
b ab
Fig 12. Average leaf area in cm2 of 6 weeks old tomato plants grown in a peat:sand mixture with the
addition 0%, 5%, 10% and 20% ZeoPro (n=8).
Summary of results The results in total for the tomato plants show that 5% ZeoPro gives the largest plants. They
have a faster development and get a higher fresh weight and dry weight and a larger leaf area.
However, for some reason this group was observed to be moister than the others groups at two
occasions (27 Feb. and 6 Mar.). The treatments with 10% and 20% ZeoPro are almost equal at
all parameters and their values lie just below the means of the 5% group. The control group
with no ZeoPro added is clearly slower in development and generates very small plants.
31
Discussion and Conclusion
Process of the project work The aim of this bachelor project was to get a picture of zeolites and their application
possibilities primarily in horticulture. The small study conducted was an attempt to investigate
one of the commercial zeolite products, ZeoPro, claiming to benefit plant growing.
The design of the trial was not evident since only very few former studies done with this
product was available. Several experiments with ZeoPro have been carried out in the U.S. for
ZeoponiX in turf, floriculture and vegetable applications. However, the details of these
experiments are considered proprietary. Also, a small Swedish investigation on the influence
of ZeoPro on spruce and fur seedlings has been carried out. Hence the design of this trial was
elaborated through discussions with my supervisor considering the available facts.
Some limitations of the project, primarily in terms of time able to spend, affected the design
of the trial. The results had to be gained in only five weeks and therefore a fast growing crop
hade to be chosen. Furthermore, the season (winter) required greenhouse cultivation.
For me, an important part of this project was the process of learning how to design and carry
out an experiment. I had many valuable experiences during the work that I will be able to use
in the future.
Discussion of results The investigation of the effect of ZeoPro on cucumber and tomato plants showed some
increase in growth when ZeoPro was added to the growth medium. In cucumber the growth
increased with increasing amount of ZeoPro, generating the largest plants with 20% ZeoPro
and the smallest in the control group without ZeoPro.
In tomato, the largest plants were found in the 5% group closely followed by the 10% and
20% groups. The plants in the control group, grown without addition of ZeoPro were clearly
smaller than the other groups.
These results indicate that ZeoPro has an effect on the growth of cucumber and tomato
seedlings. The question is, why? The most important factor is probably that ZeoPro increased
the supply of nutrients to the plants. ZeoPro is loaded with N-P-K 0,1-0,-0,6, which is a small
amount but never the less can have an impact on the plants during this short culture (5 and 6
weeks).
32
ZeoPro’s ability to retain moisture could also have effected the growth of the plants
positively. ZeoPro might have prevented water to drain out from the pots and thereby giving
the plants access to more moisture for a longer time.
The structure of the substrate was also altered by the addition of ZeoPro. It might have
improved the aeration and created a better structure which could enhance root growth and
benefit the plant. However, the growth of the roots were not evaluated in this trial.
ZeoPro has in some cases been claimed to increase germination rates. That could not be
observed in this trial. Larger groups would be necessary to be able to distinguish a pattern.
Furthermore, genetic variation in the seeds and other external factors could contribute to
uneven germination.
There are also many error sources to consider when interpreting the results. First of all, the
water supply might have been uneven. All pots were watered thoroughly at the beginning of
the trial. However, the amount of water added was not measured and could have differed
between the pots. This may have given the plants different prerequisites during the first
weeks. For a short period during the trial a leaching high pressure nozzle in the ceiling of the
greenhouse might have affected the moisture in some of the pots.
As mentioned in the summary of the tomato results, the 5% group was observed to be
moister than the others groups at the third and fourth observation (27 Feb. and 6 Mar.). The
reason for this can not be easily explained as it was not positioned below the leaching nozzle.
The initial water supply might have been larger in this group which could have affected the
moisture content in a later stage.
Some small errors were also made when measuring the different parameters. First of all, the
results of the dry weight may not be so reliable. The scale used, only showed the weight with
one decimal precision and the standard deviation lines indicate that there was quit a large
variation within each group. Also the measurements of height can have small errors as it was
carried out with a ruler.
Another aspect to consider is that the pots were not randomly distributed on the bench. Each
treatment was placed on a tray and the trays were then put beside each other on the bench.
This can create different microclimatic conditions among the pots which can effect the plant
growth. However, considering the small surfaces used in this trial, microclimatic differences
are negligible. In a future study it would be appropriate to mix the pots from the different
treatments on the bench to be able to exclude differences in growth due to this kind of
external factors. It can be carried out by a random mix distribution or a block design
experiment.
33
In the experiments conducted for ZeoponiX, several results indicate that cultivation in
zeoponic substrates can achieve the same quality of plants as conventionally produced plants
fertilized with nutrient solution. Those results can not be supported by my study. None of the
treatments produced plants with a “standard” quality and all the plants seemed to suffer from
nutrient deficiency. To be able to evaluate this in a better way, a fourth treatment, with some
kind of fertilization, could have been included in the trial. That would have made it possible
to compare the effect of ZeoPro to another nutrient source. As the group with no added
ZeoPro generated plants with a very poor quality they were perhaps not the best to use as
control.
Furthermore, ZeoPro is claimed to act as slow-release fertilizer in a process combining
dissolution and ion exchange reactions. However, the long-term effect of a slow-release
fertilizer could not be explored in this short trial. A longer culture would be needed to
investigate that kind of processes. My study just presents an indication of the effect of
ZeoPro.
It is also hard to draw any conclusions about optimal ZeoPro content from this small pre
study. The cucumber seedlings seem to respond with increasing growth with increased
content of ZeoPro. The tomato seedlings on the other hand show the best results in the group
with 5% ZeoPro. However, this was probably due to excess water supply rather than a
response to the ZeoPro content. The content of ZeoPro recommended by ZeoponiX for potted
vegetables is 5%-10% (ZeoponiX, 2000)
Future aspects From my literature study I can conclude that zeolites have a large potential in many areas of
application including the horticultural sector. However, there are many aspects to be taken in
consideration when developing new products for the future. Physical and chemical properties
vary a lot between different types of zeolites and the appropriate mineral for each purpose has
to be chosen.
There will be need for lots of further studies trying to find the best application possibilities
for ZeoPro in horticultural production. Based on the experiences from my small trial some
suggestion for future approaches will be presented.
First of all, longer growing periods are necessary to be studied to be able to draw any
reliable conclusions. When it comes to vegetable crops a high yield is the major aim and it is
not automatically connected to increased growth. Hence, the yield would be the best
34
measurement of ZeoPro’s effectiveness. Crops with longer cultural programmes are also
needed to be able to see effect of ZeoPro as a slow-release fertilizer and be able to decide the
optimum concentration of ZeoPro in the substrate.
Furthermore, the design of an experiment can be altered in many ways. As mentioned
before, treatments comparing conventional fertilization and the effect of ZeoPro would be
interesting to look further into. An experiment combining two factors, amount of ZeoPro and
fertilization, could be carried out. The interaction between treatment and fertilizer would then
be investigated.
The subject of suitable substrate to mix ZeoPro with is another area which has not been
explored. In this trial and most of the other studies conducted, peat has been the main
substrate. Nevertheless, it would be interesting to examine other possibilities like for example
pumice stone or perlite.
To gain more knowledge about nutrient uptake, the level of nutrition in the plants could be
analysed at several occasions during a trial. However, since plants have to be destroyed in
order to carry out these analyses you loose the advantage of following the same plant during
the whole trail.
A great benefit in the future would be if ZeoPro can decrease leakage of nutrients to the
environment, which is a big problem both in field production and in greenhouse production
systems today. Zeolites are known to help retain the nutrients in the root zone. The use of
ZeoPro might lead to more effective use of fertilizers by reducing the rates for the same yield,
by prolonging their activity and finally by producing higher yields.
The economical aspects also have to be considered when evaluating the future utilisation of
ZeoPro. What can you gain from using this product? Is the increased production enough to
cover the cost of ZeoPro? It would probably be more profitable crops with longer cultural
programmes where the benefits of ZeoPro can be fully harnessed.
35

References Anonymous (2005), Introduction, Webpage, available at:
http://chemmac1.usc.edu/bruno/zeodat/Intro.html, Cited on: 2005-12-14 Bengtsson B. (1998), Användning av zeoliter som jordförbättringsmedel i växtodling,
Litterature study done for Bara Mineral AB, SLU Alnarp Sweden.
Caspersen S. (2006), Personal communication, Institution of plant science, SLU Alnarp
Demir H., Karaca M., Onus A. N., Polat E. (2004), Use of natural zeolite (clinoptilolite) in
agriculture. Journal of Fruit and Ornamental Plant research, Special ed. vol. 12, pp 183-189
Eberl D. D. (1993), Controlled-Release fertilizers Using Zeolites, U.S. department of the
Interior U.S Geological Survey
GSA Resources, Inc. (2000), Zeolites, Webpage, available at:
http://www.gsaresources.com/zeolite.htm, Cited on: 2006-01-16
Hershey G. A., Paul J. L., Carson R. M. (1980), HortScience 15, pp 87-89
Kalló D., Sherry H.S., eds, (1988), Occurrence, Properties and utilization of Natural
Zeolites, Akadémiai Kiadó, Budapest, ISBN 963 05 48623
Mineral Gallery (2005), The Zeolite Group, Webpage, available at:
http://mineral.galleries.com/minerals/silicate/zeolites.htm, Cited on: 2005-12-14
Mumpton F. A. (1985), Using Zeolites in Agriculture, Chapter VIII, pp. 127-158, In:
Innovative Biological Technologies for Lesser Developed Countries. Congress of the United
States, Office of Technology Assessment. Washington D.C.
Mumpton F.A. (1999), La roca magica: Uses of natural zeolites in agriculture and industry.
Proc. Natl. Acad. Sci. USA, vol. 96, pp 3463-3470
NASAexplores (2003), Zeolites: the Secret Ingredient, Webpage, available at:
www.nasaexplores.com, Cited on 2006-03-15
Söderberg A. (2004), ZeoPros påverkan på gran- och tallplantors utveckling, Ekologisk
skogsproduktion 10p, Mitthögskolan, Handledare: Jan Swartström, Mitthögskolan och Leif
Gulin, SCA
Taiz L., Zeiger E. (2002), Plant Physiology, Third Edition, Sinauer Associates, Inc.,
Sunderland, Massachusetts, p.73
The MCS Zeolite Page (2005), Zeolites, Webpage, available at: http://www.mall-
net.com/mcs/zeolite.html, Cited on: 2005-12-14
36

Thomasson R. (1998), Naturliga zeoliter som tillsatser till jord, Rapport 980527, Litterarure
study done for Bara Mineral AB, Lund, Sweden.
ZeoponiX, Inc and Boulder Innovative Technologies, Inc (2000), Zeolite, Webpage,
available at: http://www.zeoponix.com/, Cited on: 2006-01-13
37
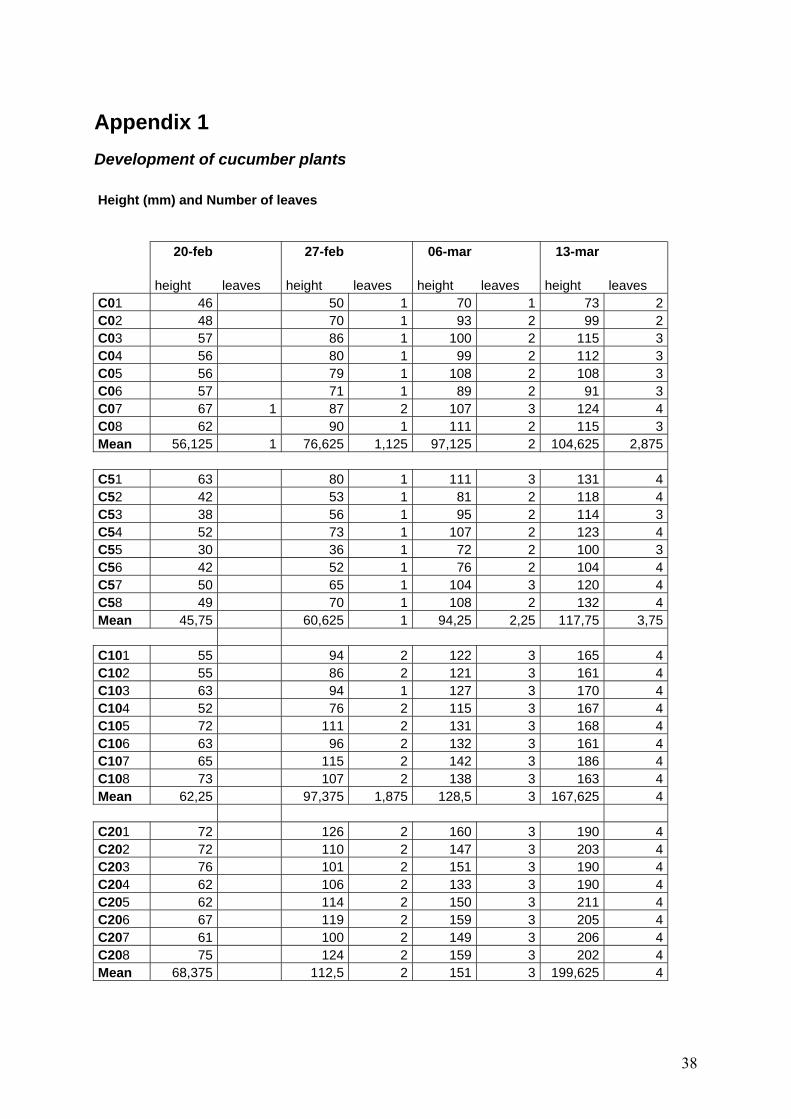
Appendix 1
Development of cucumber plants Height (mm) and Number of leaves 20-feb 27-feb 06-mar 13-mar height leaves height leaves height leaves height leaves C01 46 50 1 70 1 73 2C02 48 70 1 93 2 99 2C03 57 86 1 100 2 115 3C04 56 80 1 99 2 112 3C05 56 79 1 108 2 108 3C06 57 71 1 89 2 91 3C07 67 1 87 2 107 3 124 4C08 62 90 1 111 2 115 3Mean 56,125 1 76,625 1,125 97,125 2 104,625 2,875 C51 63 80 1 111 3 131 4C52 42 53 1 81 2 118 4C53 38 56 1 95 2 114 3C54 52 73 1 107 2 123 4C55 30 36 1 72 2 100 3C56 42 52 1 76 2 104 4C57 50 65 1 104 3 120 4C58 49 70 1 108 2 132 4Mean 45,75 60,625 1 94,25 2,25 117,75 3,75 C101 55 94 2 122 3 165 4C102 55 86 2 121 3 161 4C103 63 94 1 127 3 170 4C104 52 76 2 115 3 167 4C105 72 111 2 131 3 168 4C106 63 96 2 132 3 161 4C107 65 115 2 142 3 186 4C108 73 107 2 138 3 163 4Mean 62,25 97,375 1,875 128,5 3 167,625 4 C201 72 126 2 160 3 190 4C202 72 110 2 147 3 203 4C203 76 101 2 151 3 190 4C204 62 106 2 133 3 190 4C205 62 114 2 150 3 211 4C206 67 119 2 159 3 205 4C207 61 100 2 149 3 206 4C208 75 124 2 159 3 202 4Mean 68,375 112,5 2 151 3 199,625 4
38
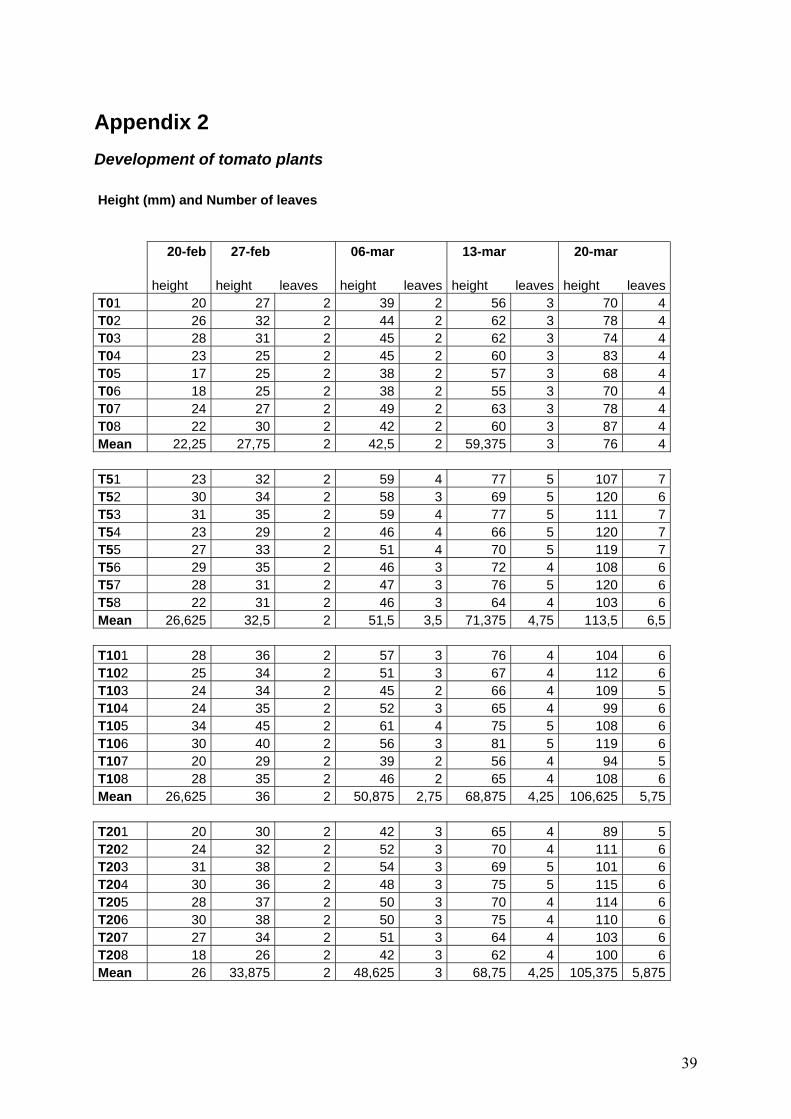
Appendix 2
Development of tomato plants Height (mm) and Number of leaves 20-feb 27-feb 06-mar 13-mar 20-mar height height leaves height leaves height leaves height leavesT01 20 27 2 39 2 56 3 70 4T02 26 32 2 44 2 62 3 78 4T03 28 31 2 45 2 62 3 74 4T04 23 25 2 45 2 60 3 83 4T05 17 25 2 38 2 57 3 68 4T06 18 25 2 38 2 55 3 70 4T07 24 27 2 49 2 63 3 78 4T08 22 30 2 42 2 60 3 87 4Mean 22,25 27,75 2 42,5 2 59,375 3 76 4 T51 23 32 2 59 4 77 5 107 7T52 30 34 2 58 3 69 5 120 6T53 31 35 2 59 4 77 5 111 7T54 23 29 2 46 4 66 5 120 7T55 27 33 2 51 4 70 5 119 7T56 29 35 2 46 3 72 4 108 6T57 28 31 2 47 3 76 5 120 6T58 22 31 2 46 3 64 4 103 6Mean 26,625 32,5 2 51,5 3,5 71,375 4,75 113,5 6,5 T101 28 36 2 57 3 76 4 104 6T102 25 34 2 51 3 67 4 112 6T103 24 34 2 45 2 66 4 109 5T104 24 35 2 52 3 65 4 99 6T105 34 45 2 61 4 75 5 108 6T106 30 40 2 56 3 81 5 119 6T107 20 29 2 39 2 56 4 94 5T108 28 35 2 46 2 65 4 108 6Mean 26,625 36 2 50,875 2,75 68,875 4,25 106,625 5,75 T201 20 30 2 42 3 65 4 89 5T202 24 32 2 52 3 70 4 111 6T203 31 38 2 54 3 69 5 101 6T204 30 36 2 48 3 75 5 115 6T205 28 37 2 50 3 70 4 114 6T206 30 38 2 50 3 75 4 110 6T207 27 34 2 51 3 64 4 103 6T208 18 26 2 42 3 62 4 100 6Mean 26 33,875 2 48,625 3 68,75 4,25 105,375 5,875
39

Appendix 3
Final observations for cucumber
13-mar
fresh weight (g) dry weight (g)
leaf area (cm2)
C01 2,1 0,05 67,2C02 2,9 0,13 93C03 3,3 0,3 105,3C04 3,2 0,25 105,3C05 3,2 0,2 99,7C06 2,6 0,13 84,4C07 3,4 0,27 110,6C08 3,2 0,23 104,6Mean 2,9875 0,195 96,2625 C51 6,6 0,5 231,7C52 5,4 0,23 197,7C53 5,3 0,29 195,6C54 5,3 0,27 187,4C55 4,2 0,2 142,8C56 4,4 0,21 147,2C57 6,1 0,49 221C58 6,6 0,49 230,2Mean 5,4875 0,335 194,2 C101 9 0,7 298,1C102 9,7 0,69 321,3C103 9,3 0,68 308,7C104 8,3 0,45 276,2C105 9 0,78 297C106 9,1 0,75 289,9C107 9,1 0,74 270,6C108 9,3 0,85 287,5Mean 9,1 0,705 293,6625 C201 9,8 0,7 330,3C202 9,8 0,64 331,1C203 9,7 0,83 331C204 9,6 0,75 316,2C205 9,7 0,55 300,5C206 10,2 0,6 323,1C207 10,4 0,69 324,1C208 11,8 0,91 360,4Mean 10,125 0,70875 327,0875
40
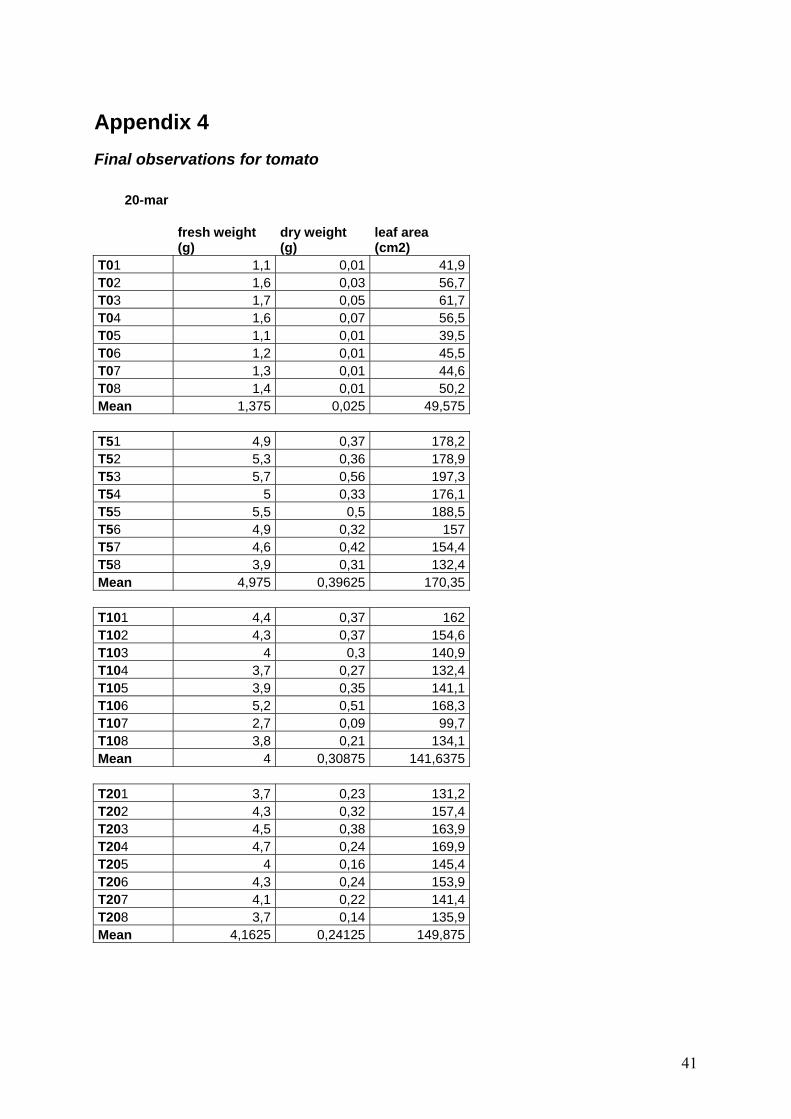
Appendix 4
Final observations for tomato
20-mar
fresh weight (g)
dry weight (g)
leaf area (cm2)
T01 1,1 0,01 41,9T02 1,6 0,03 56,7T03 1,7 0,05 61,7T04 1,6 0,07 56,5T05 1,1 0,01 39,5T06 1,2 0,01 45,5T07 1,3 0,01 44,6T08 1,4 0,01 50,2Mean 1,375 0,025 49,575 T51 4,9 0,37 178,2T52 5,3 0,36 178,9T53 5,7 0,56 197,3T54 5 0,33 176,1T55 5,5 0,5 188,5T56 4,9 0,32 157T57 4,6 0,42 154,4T58 3,9 0,31 132,4Mean 4,975 0,39625 170,35 T101 4,4 0,37 162T102 4,3 0,37 154,6T103 4 0,3 140,9T104 3,7 0,27 132,4T105 3,9 0,35 141,1T106 5,2 0,51 168,3T107 2,7 0,09 99,7T108 3,8 0,21 134,1Mean 4 0,30875 141,6375 T201 3,7 0,23 131,2T202 4,3 0,32 157,4T203 4,5 0,38 163,9T204 4,7 0,24 169,9T205 4 0,16 145,4T206 4,3 0,24 153,9T207 4,1 0,22 141,4T208 3,7 0,14 135,9Mean 4,1625 0,24125 149,875
41