effects of vibration on inertial wind-tunnel model ... · effects of vibration on inertial...
TRANSCRIPT

NASA Technical Memorandum 109083
Effects of Vibration on Inertial Wind-TunnelModel Attitude Measurement Devices
Clarence P. Young, Jr.
North Carolina State University, Raleigh, North Carolina
Ralph D. Buehrle
Langley Research Center, Hampton, Virginia
S. Balakrishna and W. Allen Kilgore
Vigyan, Inc., Hampton, Virginia
(NASA-TM-I09083) EFFECTS OF
VIBRATION ON INERTIAL WIND-TUNNEL
MODEL ATTITUDE MEASUREMENT DEVICES
(NASA. Langley Research Center}34 p
N95-I1466
Unclas
G3/09 0022325
July 1994
National Aeronautics and
Space Administration
Langley Research Center
Hampton, Virginia 23681-0001
https://ntrs.nasa.gov/search.jsp?R=19950005053 2018-07-15T06:36:02+00:00Z


Table of Contents
Page
Summary ................................... 1
Introduction .................................... 1
Symbols List ............. .... • ................. 2
Experimental Test Setup and Procedure ....................... 2
Instrumentation ................................ 2
Data Acquisition Systems ............................ 3
Test Procedure ................................ 4
Physics of Problem ................................ 4
Discussion of Test Results ............................ 5
First Order Correction Model ............................ 6
Correction to AOA Signal in Presence of Model Dynamics ............... 8
Model Vibration Effects on Drag Measurement
Concluding Remarks ..............................
References ....................................
Appendix A - Derivation of Equations for Accelerations Induced at the
AOA Inertial Device Due to Model Dynamics ........ .............
.................... 10
10
11
12

Table 1.
Figure 1.
Figure 2.
Figure 3.
Figure 4.
Figure 5.
Figure 6.
Figure 7.
Figure 8.
Figure 9.
List of Tables and Figures
Measured Natural Vibration Mode Parameters for Transport Model/Sting Configuration.
Schematic of test set-up for exciting model system in pitch and yaw planes.
Instrumentation for model AOA dynamic tests..
NTF model protection and shutdown system (MPSS).
AOA bias error due to model vibration induced centrifugal acceleration.
Yaw plane views of 10 and 14 Hz natural vibration modes for transport model.
Pitch plane views of 11 and 16 Hz natural vibration modes for transport model.
AOA response versus yawing moment for 10 and 14 Hz yaw vibration modes.
MPSS display illustrating AOA static and dynamic response with yaw moment (due to
14 Hz excitation) as a function of time.
AOA response versus pitching moment for 11 and 16 Hz pitch vibration modes.
Figure 10. Response of two AOA sensors located equidistance fore and aft of center of rotation for
the 14 Hz yaw mode.
Figure 11. Measured and estimated AOA error comparisons for 16.25 Hz model/balance pitch
mode versus pitching moment.
Figure 12. Measured and estimated AOA error comparisons for 14.2 Hz model/balance yaw mode
versus yawing moment.
Figure 13. Measured and estimated AOA error comparisons for 10 Hz yaw mode versus yawing
moment.
Figure 14. Measured and estimated AOA error comparisons for 11 Hz pitch mode versus pitching
moment.
Figure 15. First order correction for AOA signal in presence of model dynamics.
Figure 16. Schematic for making on-line corrections to AOA device output.
ii

SUMMARY
Results of an experimental study of a wind tunnel model inertial angle of attack sensor response
to a simulated dynamic environment are presented. The inertial device cannot distinguish between
the gravity vector and the centrifugal accelerations associated with wind tunnel model vibration
which results in a model attitude measurement bias error. Significant bias error in model attitude
measurement was found for the model system tested. The mbdel attitude bias error was found to be
vibration mode and amplitude dependent. A first order correction model was developed and used
for estimating attitude measurement bias error due to dynamic motion. A method for correcting
the output of the model attitude inertial sensor in the presence of model dynamics during on-line
wind tunnel operation is proposed.
INTRODUCTION
Measurement of model attitude or angle of attack (AOA) in modern wind tunnels is based on
the use of high accuracy servo accelerometers (see ref. 1). The tunnel flow is calibrated with respect
to the local gravity vector, while the model attitude sensor measures the gravity component due
to model attitude which is proportional to the angle of attack. For quasi-static conditions, this
technique provides a highly accurate measurement of model attitude based on the local gravity
vector. However, oscillatory motion(s) of the model and its onboard AOA device (during wind
tunnel tests) create centrifugal acceleration(s), which are sensed by the inertial device. The inertial
sensor cannot separate the gravity induced acceleration from the centrifugal acceleration. Most
wind tunnels use a cantilever arm (sting) to support the model. The model mounted at the end of
the sting experiences dynamic oscillations due to unsteady flow and induces angle of attack errors in
inertial attitude sensors. Further, the centrifugal acceleration also induces a drag force equal to the
product of the mass of model and the forward or longitudinal acceleration. The particular device(s)
used to measure wind tunnel model attitude at the NASA Langley Research Center (LaRC) are
described in reference 1. The problem of the inertial device sensitivity to model vibrations is alsodiscussed in reference 1.
The National Transonic Facility (see ref. 2) is located at NASA Langley Research Center and
has the capability for testing models at full scale Reynolds number and dynamic pressure up to
7000 psf. Severe model vibrations have been encountered on a number of models at high dynamic
pressures since the tunnel began operation. References 3 through 6 document studies of model and
model support vibrations in the facility. Although it was known that model vibrations were affecting
the accuracy of model attitude measurements while testing, the bias error in AOA measurement
has never been quantified for a model system from a structural dynamics point of view. In the
summer of 1993 an experiment was conducted at the NTF to study the onboard angle-of-attack
sensor response to a simulated dynamic environment using a transport model system as a test bed.
This study was conducted at the NTF, however, the AOA sensitivity problem is not unique to this
facility or to the LaRC. The problem exists anytime model attitude is being measured by this type
of inertial device in the presence of significant model system vibrations.
The objectives of this paper are: (1) to describe an experimental study that was conducted
to examine the effects of model system vibrations on the AOA device and (2) to propose a
mathematical model for estimating first order AOA bias error due to complex model vibrations.
Results of the study are presented, along with the derivation of a first order correction algorithm,
and approach to correcting AOA output during wind tunnel operation.

A/D
AOA
ax
az
Ai
Az
DAS
li
Faxial
FFT
g
Hz
in.
lb
MPSS
Mm
r
ri
Wm
Vz
OL
_2
W
SYMBOLS LIST
analog to digital
angle of attack
axial acceleration
acceleration in z (normal)direction
peak acceleration for the i th mode
peak acceleration in z (normal) direction
data acquisition system
frequency for i th mode
axial force
Fast Fourier Transform
gravitational constant
Hertz
inches
pounds
Model Protection and Shutdown System
mass of model
radius arm
rotational radius arm of i th mode
weight of model
velocity in normal direction
angle of attack
angular velocity
circular frequency
EXPERIMENTAL TEST SETUP AND PROCEDURE
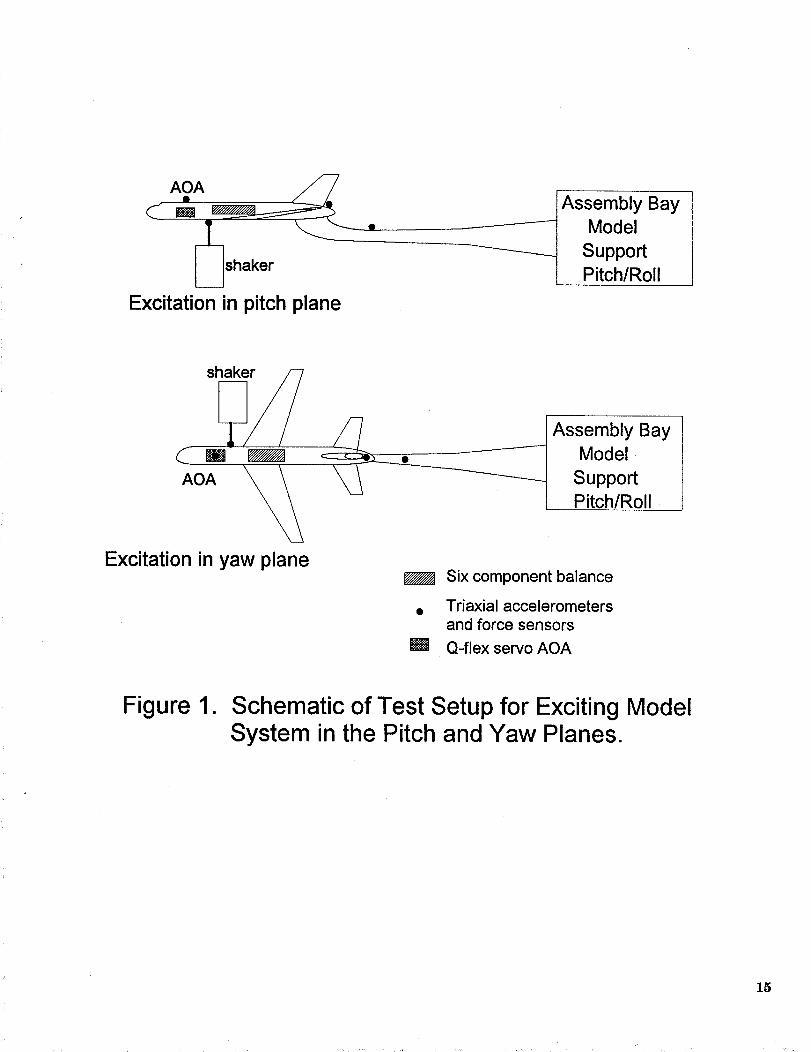
The test setup is shown schematically in figure 1. A transport model configuration was chosen
as the test bed. The basic approach was to measure the filtered and unfiltered output of the
AOA device in a simulated dynamic environment. Although it was known that an AOA bias error
was associated with model vibrations (see ref. 1), actual bias errors had not been investigated nor
quantified on a wind tunnel model test configuration.
Instrumentation
Accelerometers were installed at various locations on the model and sting (see fig. 1) to measure
dynamic response and natural mode characteristics. The mode shapes were acquired in order to

characterizethe rotational motion of the onboard AOA device which is required to understand the
problem physics and examine ways for correcting AOA bias error. An electrodynamic shaker was
used to excite the model and model support structure using band limited random, sine and swept
sine input. Two miniature accelerometers were installed on the face of the AOA package (located
inside the model) to measure pitch and yaw accelerations. However, one of the devices (pitch plane)
failed early in the test without producing useful data. A triax set of accelerometers located on the
fuselage upper surface was subsequently used to obtain off-axis accelerations at the AOA location.
The model was instrumented with an AOA Q-flex accelerometer package (see ref. 1) maintained
at a constant temperature of 165°F. The model system was installed in a model assembly bay at the
NTF as shown in figure 1. The mounting consisted of a rigidly supported cantilever (sting), that
is positioned by a pitch-roll-translation mechanism. The model was attached to the sting through
a six component strain gage balance.
An electrodynamic shaker was used to excite the model through a single point force linkage.
The model/model support sting were instrumented with accelerometers (see fig. 1), in order to
determine the triaxial accelerations on the total system. The excitation was applied in the pitch
and the yaw planes at the model fuselage hard points approximately 10 in. forward of the balance
moment center.
The instrumentation system used in the test, (shown schematically in figure 2), consisted of the
following: (1) A force gage and 11 accelerometers; (2) Hewlett Packard (HP) 3566A multi-channel
signal analyzer; (3) Electrodynamic shaker and power amplifier; (4) Stand alone laser based optical
model angle-of-attack detector; (5) Q-flex AOA device in the model with signal conditioner having
two outputs of 0-300 Hz bandwidth and 0-0.25 Hz bandwidth (filtered); (6) Six component strain
gage balance; and (7) The Model Protection and Shutdown System (MPSS) system (see fig. 3)
capable of on-line data analysis, recording and display.
Data Acquisition Systems
Dynamic and steady state data were acquired on the NTF Model Protection and Shutdown
System (MPSS) currently under development. The MPSS cabinet and CRT monitor are shown in
figure 3.
The MPSS, although designed primarily for model system protection against structural failure,
is a high speed, on-line, dynamic data acquisition and analysis system. The MPSS is a 24 channel
dynamic data acquisition system, with a sample rate of 4000 samples/sec per channel for 16 channels
.(dynamic data), with a frequency range of 1 to 256 Hertz (Hz), and 8 channels at 10 samples/sec
(tunnel process data). The system architecture consists of a Precision 6000 signal conditioning
and anti-aliasing filter system, Pentek Analog to Digital (A/D) and Digital Signal Processing
(DSP) boards, 2.5 Gbytes of disk storage, and is controlled by a SPARC 2 workstation. Features
include high speed Fast Fourier Transform (FFT) computation for 16 channels simultaneously in
10-20 milliseconds at 1 Hz resolution, and time domain graphics displays for up to six channels
simultaneously. Wind tunnel interlock and trip algorithms are programmed to protect the model
from dynamic overload and aeroelastic instability.
The filtered and unfiltered AOA signals along with the unfiltered six component balance signals
were acquired, recorded and analyzed by the MPSS. The MPSS was used to establish the load levels,
3

(e.g., yawing moment and pitching moment) for which AOA output signals were acquired for each
dynamic test condition. This test also provided an opportunity to demonstrate that the MPSS was
buffered sufficiently to assure that no interference with the AOA signal could occur due to MPSS
operation.
A Hewlett Packard Model 3566A multi-channel signal analyzer system was used to provide
the drive signal to the shaker and to capture time and frecluency domain data from the onboard
accelerometers. The same system was used to obtain frequency response function data to defne
the natural mode characteristics, i.e., mode shapes and frequencies. Digital voltmeters were used
to measure the dc signal (shift) from the onboard AOA during dynamic testing. The measured dc
shift was compared to the MPSS output display. A laser system was also used as a baseline to
measure model attitude.
Test Procedure
The model system was locked at or near zero degree angle of attack under static conditions.
Initially, the model and model/sting modes were identified using sine sweep and pseudo random
excitation of the model in the yaw and pitch planes using the shaker and HP signal analyzer
system. The single frequency forced response tests were conducted by controlling the shaker input
to provide a defined peak to peak pitch or yaw moment on the model force balance. The test
variables were yaw moment for vibration modes that had predominantly yaw motion, and pitch
moment for vibration modes that had predominantly pitch motion. The yaw and pitch moments
were monitored on the MPSS system. The AOA response data were tabulated as a function of
balance pitch or yaw moment for each of the vibration modes excited.
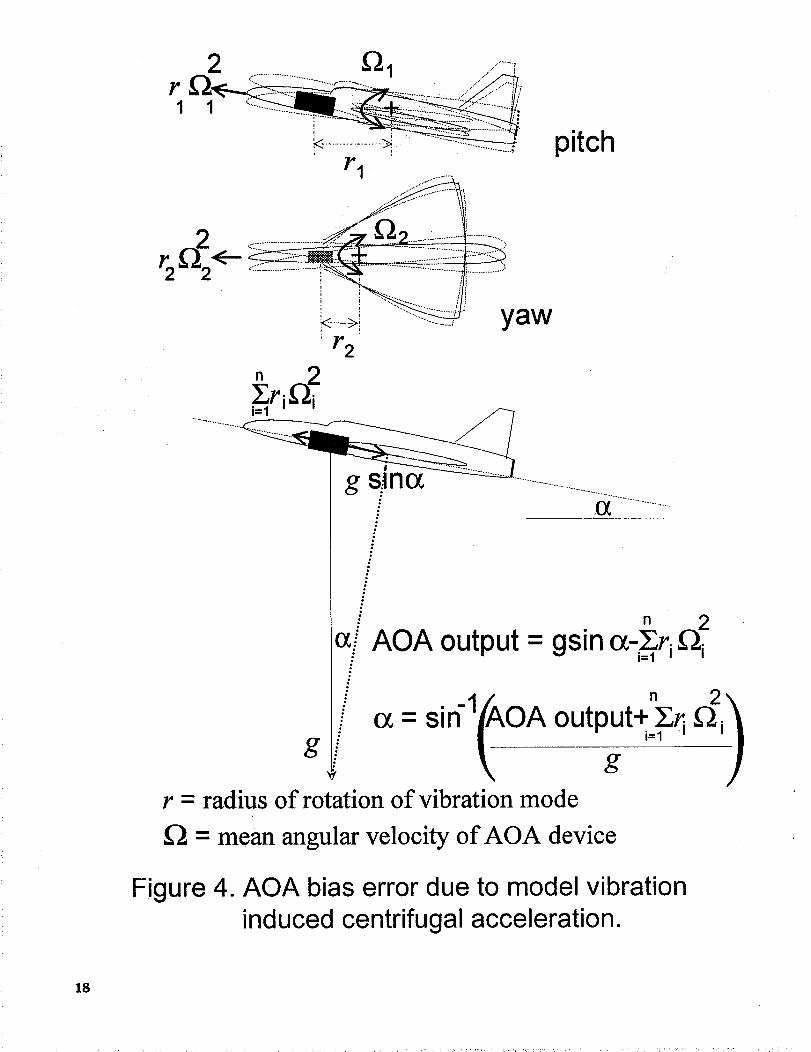
PHYSICS OF PROBLEM
The physics of the model motion is illustrated in figure 4. It is seen from the figure that
the centrifugal acceleration due to model dynamics affects the sensor measurement with respect
to the gravity vector. This is true for both pitch and yaw oscillations associated with different
modes of vibration. The centrifugal acceleration term r_ 2, is the product of the distance of the
AOA device accelerometer from the center of rotation, r, and the angular velocity squared, _2. The
output of the AOA device is given symbolically in figure 4 along with the equation for the corrected
angle of attack in terms of the r_ 2 contributions. The correction equation is the summation ofn
the contribution of each vibration mode (by superposition), i.e., the _ ri _2 contribution. Thei=l
equations characterizing the model vibration and resulting correction algorithm are derived in
Appendix A.
The approach to developing the correction algorithm given in Appendix A requires measure-
ment of the normal (pitch) and lateral (yaw) accelerations at the AOA device location or some
other location near the AOA sensor. The correction algorithm developed in the appendix was used
to predict the AOA bias error using data from the dynamic test. The results are discussed in the
next section.
4

DISCUSSION OF TEST RESULTS
The test results clearly show that AOA bias error can be significant and is due to centrifugal
(axial) acceleration associated with model vibration. The AOA bias error amplitude is vibration
amplitude and mode dependent, i.e., the contribution of each mode depends on the mode shape
(effective radius arm to AOA device measured from center of rotation) and the total amplitude of
motion at the AOA device location.
The vibration modes studied in this test are tabulated in table 1 and illustrated graphically in
figures 5 and 6. The mode shapes are shown as "stick" models, i.e., fuselage, wings and empennage
components are represented by lines. Initial testing focused on the 10 and 14 Hz modes in the yaw
plane. The measured AOA bias error output as a function of yaw moment is shown in figure 7 for
both the 10 and 14 Hz yaw vibration modes. The 14 Hz yaw mode was excited up to 12,000 in-lb.
peak to peak which is approximately 100% of the balance full scale design load. Note that the
variance of AOA bias error is quadratic in nature as can be seen from the mechanics of the motion
(see Appendix A). Note that a measured AOA bias error of approximately -0.15 degrees occurs
at about 12,000 in-lb. (peak to peak). The results obtained for exciting the 10 Hz mode are also
displayed in figure 7. The AOA bias error for this mode appears to be more sensitive to yaw
moment as 2000 in-lb. (peak to peak) corresponds to a bias of -0.125 degrees. Interestingly, for
the 10 Hz mode, the rotation of the model occurs around a point located on the empennage, see
figure 5.
The desired attitude measurement accuracy for aerodynamic testing is 0.01 degree. This level
is exceeded at about 3000 in-lb, peak to peak for the 14 Hz mode which is a relatively low level of
vibration, when compared with wind tunnel operational experience for large transport models. It
should be noted that operation at 50% or greater of full scale yaw moment dynamic load (although
not desirable) is not unusual for large transport models when testing at high dynamic pressures inthe NTF.
A time trace of the AOA response (static and dynamic) for the 14 Hz mode sinusoidal vibration
is given in figure 8. This figure is a snapshot of the MPSS display taken near the end of the variable
force, constant frequency (14 Hz) forced response test of the 14 Hz model/balance yaw mode. Also
shown on the figure is the balance yaw moment response and balance pitching moment response
(which is extremely low since little cross-coupling is present). Note that for the yaw moment peak
to peak amplitude of 12,000 in-lb., the AOA static output gives a value of -0.14 degrees which is
the mean value of the AOA dynamic signal (upper graph in the figure). Also from figure 8 it can be
seen that as the yaw moment amplitude begins to decrease, asymptotically, the AOA static value
begins to follow the moment decrease and approaches zero as the load (yaw moment) approaches
zero. These results clearly demonstrate a situation where the model pitch plane attitude is held
constant, but the AOA inertial sensor indicates a negative angle of attack due to the centrifugal
acceleration associated with model vibration in the yaw plane.
The measured AOA bias error for the pitch plane modes of 11 and 16.25 Hz as a function of
pitching moment is given in figure 9. The 16 Hz model/balance rotation mode was excited up to
15,000 in-lb, peak to peak which is about 60% of the full scale design value on the balance pitching
moment component. Note that a bias error of approximately -0.5 degrees is associated with this
amplitude. These data show that the AOA bias error is highly sensitive for this mode, and the
AOA accuracy criterion of .01 degree is exceeded at approximately 2,000 in-lb, peak to peak or
5
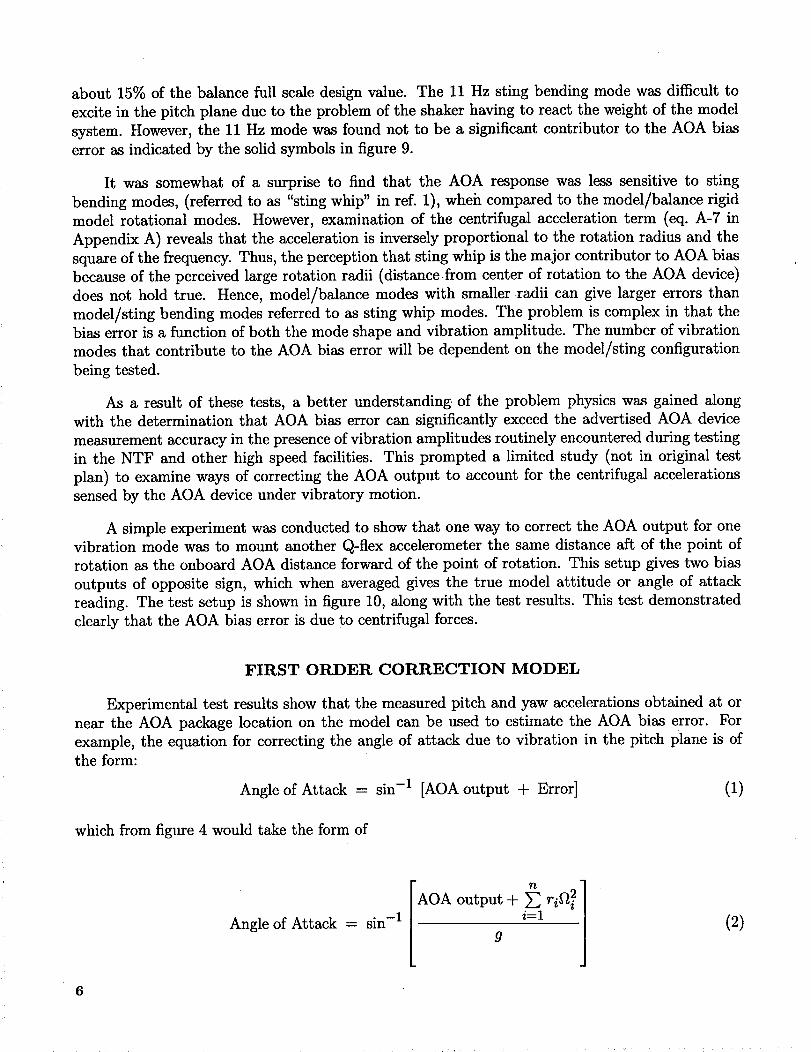
about 15% of the balancefull scaledesignvalue. The 11 Hz sting bending modewas difficult toexcite in the pitch plane dueto the problemof the shakerhaving to react the weight of the modelsystem. However,the 11Hz mode was found not to be a significant contributor to the AOA biaserror as indicated by the solid symbolsin figure 9.
It was somewhat of a surprise to find that the AOA responsewas lesssensitive to stingbending modes,(referredto as "sting whip" in ref. 1), wheh comparedto the model/balancerigidmodel rotational modes. However,examination of the centrifugal accelerationterm (eq. A-7 inAppendix A) revealsthat the accelerationis inverselyproportional to the rotation radius and thesquareof the frequency.Thus, the perceptionthat sting whip is the major contributor to AOA biasbecauseof the perceivedlargerotation radii (distancefrom centerof rotation to the AOA device)doesnot hold true. Hence, model/balancemodeswith smaller radii can give larger errors thanmodel/sting bending modesreferredto assting whip modes. The problem is complexin that thebias error is a function of both the modeshapeand vibration amplitude. The numberof vibrationmodesthat contribute to the AOA bias error will be dependenton the model/sting configurationbeing tested.
As a result of these tests, a better understanding of the problem physicswas gained alongwith the determination that AOA bias error can significantly exceedthe advertisedAOA devicemeasurementaccuracyin the presenceof vibration amplitudesroutinely encounteredduring testingin the NTF and other high speedfacilities. This prompted a limited study (not in original testplan) to examineways of correctingthe AOA output to account for the centrifugal accelerationssensedby the AOA deviceundervibratory motion.
A simpleexperimentwasconductedto showthat oneway to correct the AOA output for onevibration modewas to mount another Q-flex accelerometerthe samedistanceaft of the point ofrotation asthe onboard AOA distanceforward of the point of rotation. This setupgivestwo biasoutputs of opposite sign, which when averagedgivesthe true model attitude or angleof attackreading. The test setup is shownin figure 10, alongwith the test results. This test demonstratedclearly that the AOA bias error is due to centrifugal forces.
FIRST ORDER CORRECTION MODEL
Experimental test results show that the measured pitch and yaw accelerations obtained at or
near the AOA package location on the model can be used to estimate the AOA bias error. For
example, the equation for correcting the angle of attack due to vibration in the pitch plane is of
the form:
Angle of Attack -- sin -1 [AOA output + Error] (1)
which from figure 4 would take the form of
Angle of Attack = sin -1 A nOA output + _ ri_2 2
i=1
g(2)
6

wherethe AOA output is assumedto be in gravitational (g) units, r is the distance from the AOA
device accelerometer location to the center of rotation, and _ is the mean angular velocity of the
AOA device. Equation (2) is applicable for n degrees of freedom (i.e., n vibration modes). From
Appendix A, for the model vibrating at one frequency in the pitch plane, equation (2) can be
written as:
Angle of Attack -- sin -1
4A 2 •"AOA output +
g(3)
where Az is the peak acceleration in the pitch direction, w is the natural frequency (radians) of the
oscillation and r is the same as in equation (2).
Using equation (3) the estimated correction or error term can be calculated using measured
Ay and Az accelerations and different radius arms associated with the different vibration modes in
pitch and yaw. For the 14 Hz and 16 Hz model/balance yaw and pitch modes the radius arm was
taken to be 9.13 in., whereas for the 10 Hz sting yaw mode, the radius was taken to be 29.5 in. The
11 Hz pitch sting bending mode has a radius arm that is much higher at about 59.03 in. These
radii choices were verified by modal animation studies. Thus, the AOA error as seen by the inertial
sensor can be estimated by using measured lateral and pitch accelerations on the AOA device,
associated vibration mode frequencies, and rotation radii.
Utilizing equation A-7 and knowing the radii and frequencies associated with the modes of
vibration studied for this test, the estimated AOA error was calculated and compared to measured
values. These comparisons are shown in figures 11 through 14. Note in figure 11 that the estimated
error for the 16 Hz mode agrees very well with the measured error. The error estimates for the
14 Hz mode shown in figure 12 do not agree as well. However, the measured accelerations used
for these calculations likely had additional contributions due to rolling motion as well as yawing
motion since the reference accelerometers were mounted on top of the fuselage instead of at or on
the AOA device which is located near the model centerline. Close observation of the 14 Hz mode
(see fig. 5) shows that the rolling mode is a yaw-roll coupled mode with rolling motion amplitudes
increasing at higher yaw moment load amplitudes. For this mode the calculated error is lower than
the measured error by only about 0.02 ° at full scale yaw moment (_12,000 in-lbs., peak to peak).
For the 10 Hz yaw sting mode, the comparison between estimated and measured AOA error is given
in figure 13. The agreement between measured and estimated AOA error is extremely good up to
about 1750 in-lbs, yaw moment (peak to peak) with a slight over prediction of the order of 0.01
degrees at a yaw moment of about 2000 in-lbs. (peak to peak). The comparison between estimated
and measured error for the 11 Hz pitch sting mode is given in figure 14. Agreement is good, but
as previously mentioned, the AOA response to the 11 Hz mode is small.
The estimated corrections given in figures 11 through 14 were based on using spectral analysis
data from the triaxial accelerometers. No effort was made to refine the spectral data analysis or
to refine the rotation radii measurements. The intent was to demonstrate that good first order
estimates of AOA bias error can be obtained from modal testing and dynamic calibration which
offers the potential to greatly reduce the uncertainty of the model attitude measurement in a
dynamic environment.
7

CORRECTION TO AOA SIGNAL IN PRESENCE
OF MODEL DYNAMICS
The model oscillations in NTF, and other wind tunnels as well, are usually complex and
unstationary in nature with multiple vibration modes participation. The AOA device, which is
rigidly attached to the model, undergoes the same oscillations. Each oscillatory mode is caused by
spring-mass characteristics of multiple degrees of freedom of the model, balance, sting, and model
support• The AOA centrifugal acceleration is a complex mix of accelerations associated with all
the contributing modes of motion of the model in the Y-Z plane. Each mode has its own frequencyand associated radius characteristics.
The experimental work described in this paper suggests a .method of estimating the angle
of attack correction due to centrifugal forces acting on the device. A biaxial acceleration sensor
sensitive to Y (lateral) and Z (normal) body axes needs to be mounted in or on the AOA device.
This sensor will measure the motions of the AOA device package in the Y-Z plane. The lateral
components of the motion can be determined by a real time spectral analysis of the signals with
predetermined radii for the contributing vibration modes. This spectra can be determined either
off-line or on-line using MPSS or a stand alone system. Hypothetical spectra of accelerometers
mounted on the AOA devices are shown in figure 15 with four vibration modes shown in Y and Z
body axes. From prior modal testing, the radii ri associated with each mode frequency, wi needs
to be established so that the corrections can be made to the angle of attack output.
Let A1 to A4 be peak accelerations associated with each mode in 'g' units and rl to r4 be
radius arms associated with each mode. For each mode wi, the magnitude of acceleration is Ai,
i.e., A1 to A4, then
• -1o_ -- sin
A 4 4 A.2
OAoutput + _ _i=l "
g
where g is the gravitational constant, wi is the natural frequency in radian/sec.
wi -- 2_rfi in equation (4) gives
(4)
Substituting
• -1o_ _ sin
AOA output + Ei=1
g(5)
where fi is in Hertz.
The magnitudes of fi and A i are measured at each test point during wind tunnel testing
whereas ri is known a priori and assumed to stay constant. Measurement of fi and Ai can be
performed on MPSS or on a stand alone system coupled with the wind tunnel data acquisition
system. The true angle of attack can then be estimated for each test point• Note that the AOA
8

output is assumed to be in 'g' units, if not the above expression needs to be adjusted for proper
units. Further, the error and angle of attack are in radians and have to be put in required units.
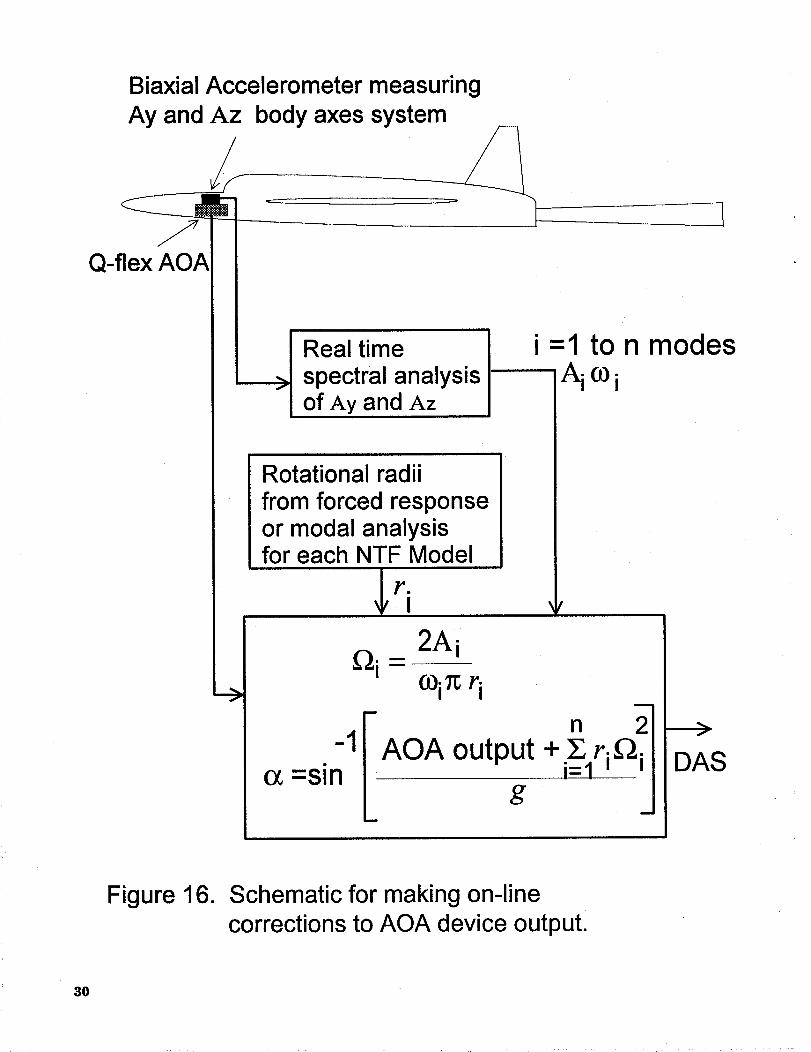
A method for acquiring the necessary spectra data and making estimated corrections to the
AOA output is shown in the block diagram of figure 16. By knowing the ri value for the ith
vibration mode, and the acceleration spectra which give the average angular velocity _i for each
of the vibration modes, the equation shown on the figure fo_ a would be used to correct the AOA.
The corrected AOA output could be transmitted to the wind tunnel data acquisition system either
on-line or in a post-test manner. Note from the equation shown on figure 15, that the contribution
of all the participating modes up to the nth must be summed to get the AOA correction value(s).
This summation includes the vibration contributions due to both pitch and yaw motion. The
number of modes that contribute significantly to the AOA bias error must be determined by pre-
test experimental/analytical dynamic studies.
The magnitudes of the accelerations and/or velocities associated with the ith mode of vibration
would be obtained via spectral analysis as previously indicated on figure 15. In figure 15, the peak
value is obtained from the spectra at each test point during a polar (angle of attack sweep). The
algorithm shown in figure 16 assumes that a high-speed, dynamic data acquisition and processing
system is available and interconnected to the wind tunnel data acquisition system.
A primary issue in developing and implementing such a method is the importance of get-
ting instantaneous values of the AOA and accelerometers output over the actual wind tunnel
aerodynamic data acquisition time, which for the NTF is nominally one (1) second. Obtaining
sufficient samples to capture the peak values over a 1 second period becomes a data acquisition
accuracy issue, since the process may be non-stationary, (variable amplitude, multiple/varying fre-
quencies). The application of assumed stationary analysis principles becomes questionable and will
require some research to determine if, in fact, the AOA output can be corrected with a sufficient
degree of accuracy, within the wind tunnel operational constraints. Any proposed on-line correction
method(s) to the onboard AOA inertial device will need verification testing both in a controlled
laboratory environment and during actual wind tunnel tests.
MODEL VIBRATION EFFECTS ON DRAG MEASUREMENT
The centrifugal acceleration not only affects the inertial AOA device but can, if amplitudes
are sufficiently high, affect the desired axial force or drag measurement accuracy. It is anticipated
that for most models the axial centrifugal forces will be small or insignificant. However, the need
to correct axial force measurements needs to be considered.
If the case should arise, the axial acceleration measurement would be required where the
inertial force is given by:
Faxial ----Mm ax (6)
where Mm is the model mass and ax is the axial acceleration. Since multiple vibration modes can
occur and may be contributing, the equation for correcting the drag measurement is given by
n
DRAG FORCEcorr. = DRAG(meas. ) + Wm E axii=l
(7)
where Wm is the weight of the model and acceleration is measured in g units, summed for n
vibration modes. Corrections to drag measurement on-line or in a post-processing mode could be
done in the same manner as the AOA correction.
CONCLUDING REMARKS
Servo accelerometer sensors are excellent devices and are widely used for onboard angle of
attack measurements in wind tunnels. However, when these devices are used in wind tunnel model
systems in which significant structural dynamic response is present, AOA bias errors are introduced
due to centrifugal accelerations associated with model vibration. This AOA bias error can be
difficult to estimate and correct. An experimental study of this problem using a transport model
as a testbed is presented in this paper. Significant AOA sensor bias error was found to be present
when the model was subjected to variable force, sine testing at different natural frequencies of the
system. The magnitude of the AOA bias error was found to be vibration mode and amplitude
dependent. A first order AOA correction model was developed which uses biaxial accelerometers at
the AOA sensor location to determine the centrifugal accelerations needed for computing the AOA
bias error. Good correlation was obtained between the estimated bias error, (using the correction
model), and measured bias error. An approach for making corrections to the AOA output, on-line
during tunnel operation or in a post-processing mode, is proposed. Implementation of the proposed
approach, however, raises data acquisition and processing issues associated with multiple vibration
modes participation and the very short aerodynamic data acquisition time on point (N1 sec) during
an actual test in the NTF. Corrections for axial force (drag) bias if needed, can be accomplished
using a similar approach. On-line or post-processing AOA correction algorithm applications for the
inertial AOA devices will likely require dynamic calibration of each model to establish the modal
parameters, i.e., frequencies and radius arms for the contributing modes. Further work needs to
be done to develop efficient methods for dynamic calibration and AOA data correction schemes.
Model attitude measurement error due to model dynamics is not unique to the National Transonic
Facility. It is important that wind tunnel facility managers, test conductors, and research engineers
be aware of this potential problem. Finally, this study clearly establishes the need for examining
other methods for measuring model attitude such as optical or laser, which may be less sensitive
to model system dynamics.
10

REFERENCES
1. Finley,T., and Tcheng,P.: Model Attitude Measurementsat NASA Langley ResearchCenter.AIAA-92-0763, 1992.
2. Fuller, D. E.: Guide to Usersof the National TransonicFacility. NASA TM-83124,July 1981.
3. Strganac,T. W.: A Study of the AeroelasticStability for the Model Support Systemof theNational TransonicFacility. AIAA-88-2033, 1988.
4. Whitlow, W., Jr.; Bennet, Robert M.; and Strganac, T. W.: Analysis of Vibrationsof the National Transonic Facility Model Support System Using a 3-D Aeroelastic Code.AIAA-89-2207, 1989.
5. Young, C. P., Jr.; Popernack,T. G.; Gloss, B. B.: National Transonic Facility Model andModel Support Vibration Problems. AIAA-90-1416, 1990.
6. Buehrle, R. D.; Young, C. P., Jr.; Balakrishna, S.; and Kilgore, W. A.: Experimental Studyof Dynamic Interaction BetweenModel Support Structure and a High SpeedResearchModelin the National TransonicFacility. AIAA-94-1623, 1994.
11

APPENDIX A
DERIVATION OF EQUATIONS FOR ACCELERATIONS INDUCED
AT THE AOA INERTIAL DEVICE DUE TO MODEL DYNAMICS
by
S. Balakrishna
The physics of the model motion is illustrated in figure 4. If az is the measured normal
acceleration due to pitch vibratory oscillation of the model at one resonant frequency, then the
lateral displacement of the model is obtained from the following:
az = Az sin wt (A-l)
Vz = f azdt = --Azcoswt (A-2)J O3
Xz = vz dt - w2 sinwt (A-3)
where Az is the measured peak value of acceleration in 'g units', w = 27r f, where f is the mode
frequency in Hertz. The displacement due to oscillatory acceleration, Xz is one half of peak to
peak value, since Az refers to peak acceleration. The total displacement per full cycle of motion is
therefore 4Xz. This motion, though not uniform, can be treated as an averaged value to arrive at
the centrifugal accelerations on the sensor. If the oscillatory motion is around a known center of
rotation with a radius arm of r, then the angular displacement per cycle of oscillation is
angular motion/cycle = A____z 4 sinwt dt dt - 4Xz rad/cycle (A-4)r f
0
angular velocity _ --4Xz w
r 2r rad/sec (A-5)
The centrifugal acceleration is given by
r_2=r z w2_r
(A-6)
Utilizing equations (A-l) and (A-3) and substituting for Xz in equation (A-6) the expression for
the centrifugal acceleration becomes
r_2_ 4A2 (A-7)w27r2r
Note from equation (A-7) that the acceleration is inversely proportional to the radius arm r
and oscillation frequency squared, and a direct function of acceleration amplitude squared. The
same type of analysis is valid for oscillations in yaw or the body Y axis. Both accelerations are
assumed to act along the body X-axis (longitudinal direction) of the model. The AOA package is
12

assumed to be mounted on the X-axis of the model. When the model is at a finite angle of attack,
the forces acting on the AOA sensor are g sina due to attitude and r_ 2 due to model vibration
as illustrated in the vector diagram given in figure 4. If multiple radii r i exist, each associated
with a lateral acceleration Ai (either Y or Z direction), the forward centrifugal acceleration can ben
considered as the scalar sum of accelerations along the X-axis, _ ri_ 2.i=l
13

Table 1
Measured Natural Vibration Mode Parameters
for Transport Model/Sting Configuration
Mode No. Frequency Damping Mode Description
(Hz) (%)
1 10.28 1.01
2 11.22 1.78
3 14.35 0.463
4 16.47 0.594 Model Pitch on Balance
Sting Bending (Yaw Plane)
Sting Bending (Pitch Plane)Model Yaw/Roll on Balance
14
AOA
_-_shaker
Excitation in pitch plane
Assembly BayModel
SupportPitch/Roll
AOA
Excitation in yaw plane
m
Assembly BayModel
SupportPitch/Roll
Six component balance
Triaxial accelerometers
and force sensors
Q-flex servo AOA
Figure 1. Schematic of Test Setup for Exciting ModelSystem in the Pitch and Yaw Planes.
15

AOA
6 balancechannels
Shaker_-]
Laser
AOA signals
Ay and AzAccelerometer
Signals
MPSS
24 ch, 4 kHz samplingFFT, Real-Time Display
Record and Replay
Digital I
Voltmeter I
J
W
Assembly BayModel
SupportPitch/Roll
Six component balance
Triaxial accelerometers
and force sensors
Q-flex servo AOA
Shaker Signal
Laser Signal
LaserAttitude
Display
l 12 Accelerometers
HP Multi-Channel
Signal Analyzer
Figure 2" Instrumentation for Model AOA Dynamic Tests
16

17
2 _ 1 ...............7
__.;_ ........."......N " .............-
.... •........... \
...--" -t
_>i........_..' yaw
pitch
1.2
n 2
" n 2
o_/AOA output = gsin a-,_r i_ig
:' sin-' / a : OA output 11
g
r = radius of rotation of vibration mode
_'2 = mean angular velocity of AOA device
Figure 4. AOA bias error due to model vibrationinduced centrifugal acceleration.
18

Sting
\
\\
\ •
10 Hz
14 Hz
\\
//
,,(
×
Figure 5. Yaw plane views of 10 and 14 Hz natural vibration modes for transport model.
(Deformed shape _, Undeformed shape ....... )
19

Sting
Model
\
11 Hz
/_
X
/
16 Hz
Figure 6. Pitch plane views of 11 and 16 Hz natural vibration modes fo_-transport model.
(Deformed shape _. Undeformed shape ...... .)
20

6O(D(DL_
O_dO
--(3
JO_
0
<(0<(
°°°° 0 .................,
-o.o25 0....0
-0.050
-0.075
-0.100
-0.125
-0.150
0
lOHz
"k
0',.
- I I I I
0 2000 4000 6000 8000
Yawing moment(peek
X,,..O
'...%
XX.k
'h0
I
t
'\
1 4 H z"_)I
10000 12000
to peek), in-lbs
Figure • AOA response versus yawing
moment for 10 and 14 Hz yawvibration modes•
21

"awl1 to uo{_oun-I e se (uo{_e_loX=l ZH 17_ o_ enc]) _uewo_ Mekq_{t_ esuodse8 o{weu_(] pu_ o{_e_S VOV 6u{_eJ},Snlll _elds{c] SSd_ - "9 eJn6{-I
............................................................................................................................................................ OO'_L-
............................................................................................................................................................... 04_"WSI-
..............................................................................................................................................................' -'-- _ - ...... "''_ ............. - " _ :;v-_"_' " v'r;'Vv \' _, _' V b'V :/v'/ v_ _''t"'/V_./_"v_'tV _'_'
............................................................................................................................................................. O0 "L"03 _'_
............................................................................................................................................................. • 3 '_-_ _
................................................................................................................................................................... 0'_
,(X} '_009-
..<
.00 "I_{XE
................................................................................. _: ....................................................................... o_ '_- _
........................................................... .I_2._."_ ............................................................................................... 90"0- ¢'_ 0
..,,v_.._- _-- _ _,,_._v._- _2_" "_" - - L_'O-
_.;_._:_; ,_A_-_'_'_" ................................................................ ----_O}
....................................................................................................................................................................•oo_g
.......................... ........................................................................................................................................ 05 "0
..................................................................................................................................................................... kt'O
: - ._ "O-
_D,t_'O- _ C_
.I rio
_-,g_'O

co®(DK_
CD(D
-O
CL
O
<0<
0,0 q
1
-0.1 -
-0.2
-0.5 -
-0.4 -
-0.5 -
0
Pitching
mz'.....,
O'...
"...,.,.
'.....
O,.,
%,..,.,.
""O
'x.
x..
© -,..
16Hz
k
I I I I
5000 6000 9000 12000
moment(peak to peak),
15000
in-lbs
F gure 9" AOA response versusmoment for 1 1 and 16vibration modes.
pitchingHz pitch
23

o 00
o -Q
o--
• o 8 --".........."o ©" o_ o° 8_
............ o o ......... _ o
• o 8 o
oo _ °o....... _ 8 o
, , .,. , , o 7I _ 0 CY_
_) 0 u-) 0 t.O 0t.O 0 u_ 0 c
o--
c_ K _-. o o o ,--. ,--. cqo o o d o c5 o o o o
i i i >_
saaJ6ap '_nd_no VOV
--Oq)
-b_
© 000 L
©
O9 (--L_ ©0 009
(- (1)© c-oo
<_
0 o
0 ©
0
(DO9C0£L09©
Q!
• °
0W--
©L_
0_
hE
©-O0
E
(i)>,
S-1-
.q-
-0
C- ©0 _C
©k__ k__
0 0
-_ c-
80©
-0 0
0-<-4-© 0

....'
.....<9.13 in -.;>" __
biaxia, Ay-Az .Az ............................................/ /acceleration sensor '_' ......... ......... / /
Qflex ...........center of k
AOA " rotation ___--
co®®
cy_(D
--(D
O__1_o
O
<o<
-0.1
0 Measured• Estimated
":;t::...
--.[].,
t I
16.25Hz
r=9.15in
x,... "._X
"x.._,...
• ..... .,.'. x.
'...
'"'... 'I
'.....
from Az
".. m
0-0.4 I i I I
0 5000 6000 9000 12000 15000
Pitching moment(peak to peak), in-lbs
Figure11 Measured and estimated AOA error
comparisons for 16.25Hz model/balance
pitch mode versus pitching moment
25 ¸

biaxial Ay-Azacceleration sensor centerof /_AY,_ r°tat.i°n
' i
Qflex i . ,3AOA b- 9.13 m_
(D
®L
C_®
-O
O_
O
0
0.00
-0.05
-0.10
-0.15 -
_::;:::::,,,,'-,,_;:_ ..........I I I
....._:[[[["O 14,2Hz
.....O.....",.....O r-9.15in
.............Q......................•
""-... "h.
'"h........,..
",.. 'L.
'' 0
_k.
"k
o
0 Measured• Estimated from Ay
I I-0.20 i I0 5000 6000 9000 12000 15000
Yawing moment(peak to peGk), in-lbs
Figure12 Me<ssured @nd estim@ted AOA errorcompGrisons for 14.2 Hz model/balGnceyGw mode versus yGwing moment
26

biaxial Ay-Azacceleration sensor
QflexAOA
c0@®
(1)--0
c)__
0
<(o<(
0.00
-0.05
-0.10
-0.15
Yawing
• A
...............211>... I _ I
::::::::::::::::::::::10. 0 Hz
....<J r-29 52in
<;2::£_......•,.....,,...
.......•O".... ",...
',\ ,....
•.. ..
_\ x..
_ _..\
..: \
-\ "_.:.
\,0
O Measured• Estimated from Ay
I I I I
500 1000 1500 2000 2500
moment(peak to peak), in-lbs
Figure15" Measured andcomparisons for 10yawing moment
estimated AOA
Hz yaw mode
error
versus
27

0 -_-s
O_ 0(9 -s
AOA output, degrees
I I I I0 0 0 0
ho -_ -_ 0
0 O] 0 Cn
0
_00 -
000
ho0
o
0
I I I
O0
Fn_00 (]),---i-. 6-')
9_@ _(-
_-O_@(Do_
O
93:>N
I I
O
bO1IlL_w
/_
f_
/i
II 7-' ii
_Do.r.oN _
I
/\
_ 0
"_",....\ .
"... i

peak value
Azin g's
A1 A 2
4 frequency
peak value
Ay
in g's
A 4
44 frequency
On-line Spectra of Biaxial Accelerometers Mounted on AOA Device Package
r. = radius arm associated with each modeI
CO.= 2/1;fiI
4 2
Total AOAerro r i_rif_i
-1C_ = sin
__ 4 2-AOA output + E ri_i=1
g
Figure 15. First order correction for AOA signal inpresence of model dynamics.
29
Q-flex AOA
Biaxial Accelerometer measuring
Ay and Az body axes system
Real timespectral analysisof Ay and Az
--->
Rotational radii
from forced responseor modal analysisfor each NTF Model
I
o_=sin 1
i=1 to n modesA i o) i
2Ai_i =
coi_ r i
n 2
AOA output + i_trig
DAS
Figure 16. Schematic for making on-line
corrections to AOA device output.
3O


Form ApprovedREPORT DOCUMENTATION PAGE OMB No. 0704-0188
Publioreporting burdenforthiscobction ofinformationis estimatedto averageI hourper response,indudingthe timefor reviewinginstructions,searchingexistingdatasoumes,gatheringand maintainingthe dataneeded,and completingandreviewingthe collectionof information.Sendcomments regardingthisburdenestimateor anyotheraspectof this(..ollestianof information,iooludingsuggestionsfor reducingthisburden,toWashingtonHeadquartersServices,Directore4efor InformationOperationsand Repods, 1215JeffersonDavisHighway,Suite 1204,Arlington,VA 22202-4302, and tothe Officoof Managementand Budge4,PaperworkReductionProject(0704-0188),Washington,DC 20503.
1. AGENCY USE ONLY (Leave blank) 12. REPORT DATE 13. REPORT TYPE AND DATES COVERED
I July1994 I Technical Memorandum4. TITLE AND SUBTITLE 5. FUNDING NUMBERS
Effects of Vibration on Inertial Wind-Tunnel Model Attitude Measurement WU 505-59-54-01Devices
6. AUTHOR(S)
Clarence P. Young, Jr., Ralph D. Buehrle, S. Balakrishna,and W. Allen Kilgore
7. PERFORMING ORGANIZATION NAME(S) AND ADDRESS(ES)
NASA Langley Research CenterHampton, VA 23681-0001
9. SPONSORING/MONITORING AGENCY NAME(S) AND ADDRESS(ES)
National Aeronautics and Space AdministrationWashington, DC 20646-0001
8. PERFORMING ORGANIZATIONREPORT NUMBER
10. SPONSORING / MONITORINGAGENCY REPORT NUMBER
NASA TM-109083
11. SUPPLEMENTARYNOTES
Young: North Carolina State University, Raleigh, NC; Buehrle: Langley Research Center, Hampton, VA;Balakrishna and Kilgore: ViGYAN, Inc., Hampton, VA
12a. DISTRIBUTION / AVAILABILITY STATEMENT
Unclassified - Unlimited
Subject Category 09
12b. DISTRIBUTION CODE
13. ABSTRACT (Maximum 200 words)
Results of an experimental study of a wind tunnel model inertial angle-of-attack sensor response to a simulateddynamic environment are presented. The inertial device cannot distinguishbetween the gravity vector and thecentrifugal accelerations associated with wind tunnel model vibrationwhich results in a model attitudemeasurement bias error, Significant bias error in model attitude measurement was found for the model systemtested. The model attitude bias error was found to be vibration mode and amplitude dependent. A first ordercorrection model was developed and used for estimating attitude measurement bias error due to dynamicmotion. A method for correcting the output of the model attitude inertial sensor in the presence of model
dynamics during on-line wind tunnel operation is proposed.
14. SUBJECT TERMS
Wind tunnel model vibrations; Model attitude bias error;Inertial angle of attack sensors; Angle of attack correctionalgorithm
17. SECURITY CLASSIFICATIONOF REPORT
Unclassified
18. SECURITY CLASSIFICATIONOF THIS PAGE
Unclassified
NSN 7540-01-280-5500
19. SECURITY CLASSIFICATIONOF ABSTRACT
Unclassified
15. NUMBER OF PAGES
33
16. PRICE CODE
A03
20. UMITATION OF ABSTRACT
Standard Form298 (Rev. 2-89)PrescribedloyANSIStd. Z3_18298-102