effectiveness of motivational interviewing, health
TRANSCRIPT

RESEARCH ARTICLE Open Access
Effectiveness of motivational interviewing,health education and brief advice in apopulation of smokers who are not readyto quitMajid Bani-Yaghoub1*, Abdellatif Elhomani2 and Delwyn Catley3,4
Abstract
Background: Motivational Interviewing (MI), Brief Advice (BA) and Health Education (HE) are established smokingcessation induction methods for smokers with low desire to quit. Although randomized controlled trials (RCT’s)have been frequently used to assess these interventions the temporal efficacy and effectiveness of these interventionshave been poorly elaborated. The present work endeavors to fill the gap by considering the full range of possiblemotivational outcomes for all of the participants.
Methods: As a two-step process, Markov Chain (MC) and Ordinary Differential Equation (ODE) models weresuccessively employed to examine the temporal efficacy and effectiveness of these interventions by computing thegradual movements of participants from an initial stage of unmotivated smoker to stages of increased motivation toquit and cessation. Specifically, in our re-analysis of data from the RCT we examined the proportion ofparticipants in 4 stages of readiness to quit (unmotivated, undecided, motivated, former smokers) over6 months, across treatment groups [MI (n = 87), BA (n = 43) and HE (n = 91)].
Results: Although HE had greater efficacy compared to MI and BA (i.e., the highest smoking cessation rates), ithad lower effectiveness at certain time points. This was due to the fact that HE had the greatest proportion ofmotivated smokers who quit smoking but simultaneously a large proportion of the motivated smokers becameunmotivated to quit. The effectiveness of HE dropped substantially in weeks 3–12 and remained below the effectivenessof BA from week 12 onward. The 2-year ODE model projections show that the prevalence of motivated smokers in HEgroup may fall below 5%. The prevalence of HE former smokers can reach an equilibrium of 26%, where the prevalenceof both BA and MI former smokers exceeds this equilibrium.
Conclusions: The methodology proposed in this paper strongly benefits from the capabilities of both MCand ODE modeling approaches, in the event of low observations over the time. Particularly, the temporalpopulation sizes are first estimated by the MC model. Then they are used to parametrize the ODE modeland predict future values. The methodology enabes us to determine and compare the temporal efficacyand effectiveness of smoking cessation interventions, yielding predictive and analytic insights related totemporal characteristics and capabilities of these interventions during the study period and beyond.
Trial registration: Testing Counseling Styles to Motivate Smokers to Quit, NCT01188018, (July 4, 2012). Thisstudy is registered at www.clinicaltrials.gov NCT01188018.
Keywords: Smoking cessation, Markov chain model, Motivational interviewing, Brief advice, Healtheducation, Efficacy, Effectiveness
* Correspondence: [email protected] of Mathematics and Statistics, University of Missouri–KansasCity, 5100 Rockhill Road, Kansas City, MO 64110-2499, USAFull list of author information is available at the end of the article
© The Author(s). 2018 Open Access This article is distributed under the terms of the Creative Commons Attribution 4.0International License (http://creativecommons.org/licenses/by/4.0/), which permits unrestricted use, distribution, andreproduction in any medium, provided you give appropriate credit to the original author(s) and the source, provide a link tothe Creative Commons license, and indicate if changes were made. The Creative Commons Public Domain Dedication waiver(http://creativecommons.org/publicdomain/zero/1.0/) applies to the data made available in this article, unless otherwise stated.
Bani-Yaghoub et al. BMC Medical Research Methodology (2018) 18:52 https://doi.org/10.1186/s12874-018-0511-0

BackgroundTraditional methods of evaluating smoking cessationtreatments often involve conducting randomized trialsand assessing one of the outcomes (i.e., quit attempts,motivation, and cessation) at a particular point intime, such as the middle or the end of the follow-upperiod [1–3].Statistical analyses such as the Pearson chi-square test
and logistic regression are useful for studying the effectsof smoking cessation interventions at a particular timepoint [4, 5]. These approaches appear to be suitablewhen the smoking cessation is viewed as a unidirectionalproblem. However smoking cessation is a process thattakes place over time, not a single event occurring at acertain time [6]. Therefore, analysis of smoking cessationdata requires alternative approaches that are beyond thescope of single time-point methodologies. Smoking ces-sation is increasingly recognized as a process of changesubject to fluctuations in motivation, attempts to quit,periods of abstinence, and often relapse [7, 8]. Applyingsingle time-point methods discounts this time-varyingnature of smoking cessation. To tackle this issue, re-searchers have proposed the use of generalized estimat-ing equations models (GEE) and generalized linearmixed-effects models (GLMM) [9]. GLMM estimatesthe probability that an individual would be either an ab-stinent or a smoker at a given time point, allowing dif-ferent partialities of abstinence among individuals. GEEprovides estimates for the population average and thecovariate effects, which can be interpreted as in normallogistic regression models. As mentioned in [10], GEEand GLMM are efforts to go beyond “time naïve” evalu-ations of outcomes. However, these two techniques areintrinsically unidirectional. In other words, they measureabstinence (or smoking) across time from smoking atbaseline. Alternatively, Markov Chain (MC) models (alsoknown as transition models) offer a means to concur-rently examine transitions in both directions from ab-stinent to smoking and vice versa [10]. These modelsoffer the ability to recognize factors that may work indifferent directions over time. Identifying factors that areassociated with cessation and those with relapse will en-able researchers to propose more effective interventionsfor both smoking cessation and relapse prevention.MC models have been widely employed to study vari-
ous time-varying clinical situations including smokingcessation [10–12]. It has been previously demonstrated[10] that MC models can use information in randomizedsmoking cessation trials that the GEE and GLMM donot exploit, and consequently they can provide add-itional outcomes. These outcomes include informationabout the dynamics associated with relapse to smokingamong those who are temporarily abstinent as well asthe reasons connected with abstinence. In addition, MC
models deliver knowledge about transitions between ab-stinence and relapse in both directions. Other studieshave combined Markov modeling with the transitionmodels such as GEE or GLMM [10, 12].To assess the efficacy and the effectiveness of smoking
cessation induction methods, we propose a new method-ology that consists of two steps. First, a multi-stage MCmodel [11, 12] is employed to describe the process ofsmoking cessation, in which individuals move through aseries of stages (i.e., unmotivated, indecisive, motivatedand former smoker) in continuous time. Then the out-comes of the fitted MC model are used to parametrize asystem of Ordinary Differential Equations (ODE) and topredict and compare the behaviors of individuals partici-pating in different interventions.Several interventions are currently available [7, 13].
However, Motivational Interviewing (MI) is the onlyintervention recommended for unmotivated smokers bythe U.S. Clinical Practice Guidelines [7]. For clarity, MIis defined as a collaborative, person-centered form ofcounseling to elicit and strengthen motivation forchange [14]. The existing evidence suggests the effect ofMI on smoking cessation is likely to be modest [15]. Par-ticularly, meta-analyses have indicated that MI-based in-terventions have modest positive effects on smokingcessation compared to the other interventions such asBrief Advice (BA) [16–18]. In addition, significant defi-ciencies have been noted in the evidence base [7, 16, 17].This includes the inadequate evidence of intervention fi-delity, the insufficient research comparing MI to alterna-tive interventions of equal intensity, the lack of focus oninitial motivation to quit and absence of studies focusingon motivation and quit attempts as outcomes [16, 17].The present study focuses on the secondary analysis of
a randomized trial to address the limitation of MI re-search. We carried out the secondary analysis by com-paring the efficacy and effectiveness of MI with those ofBA and the other intervention known as Health Educa-tion (HE) [19]. BA was considered to imitate the usualcare based on the recommendations of the ClinicalPractice Guideline [7]. In the original study [20], the par-ticipants in BA group met with a counselor for approxi-mately 5 min and they were asked about the commonsmoking related symptoms and provided with clear andpersonalized advice to quit. The participants in HEgroup were provided health education and matched induration with MI intervention. This method ofmotivating HE participants was according to a robust ra-tionale for quitting covering the relevant risks of smok-ing, benefits of quitting, and addressing the barricades toquitting [7].The purpose of the present study was to go beyond
the single time-point methods to examine the perform-ance of MI relative to BA and HE for inducing quit
Bani-Yaghoub et al. BMC Medical Research Methodology (2018) 18:52 Page 2 of 10

attempts among low motivated smokers. Specifically, usingthe available data and a two-step MC-ODE modeling tech-nique, we measured the temporal changes in the 7-daypoint-prevalence smoking abstinence and motivational be-haviors and compared the efficacy and effectiveness of MIrelative to BA and HE. Furthermore, the asymptotic dy-namics of quit motivations and smoking abstinence wereinvestigated through the ODE model predictions.
MethodsOverviewTo study the treatment effects of HE, MI and BA, weconsidered both probabilistic and deterministic model-ing approaches. First, using the self-assessment data[20], the participants of each group were divided intosubgroups of unmotivated, indecisive, motivated andformer smokers, represented by stages 1–4, respectively.Then a multi-stage MC model [11, 12] was fitted to thedata of all 4 stages. Temporal variations in the preva-lence of each stage were used to determine the temporaleffectiveness and efficacy [21–23] of each intervention.Then an ODE model was specified and used to predictthe prevalence of each subgroup for 2 years.
DataParticipants with missing data were not considered in thisstudy (i.e., 15.6, 14.71 and 10.8% of participants in BA, MIand HE groups respectively were excluded). Excludingthose with missing data, there was a total of 43, 87 and 91participants in BA, MI and HE groups, respectively. Usingthe following scheme, each group was divided into foursubgroups: unmotivated (Stage 1); indecisive (Stage 2);motivated (Stage 3); and former smokers (Stage 4). To de-termine if an individual was in Stages 1–3, we used the re-sponses to the item “How motivated are you to quitsmoking?” for weeks 0, 12 and 26. Each individual wasconsidered in Stage 1 if the answer was 0–3; Stage 2 if theanswer was 4–7; and Stage 3 if the answer was 8–10. Todetermine if an individual was in Stage 4, we used the re-sponse to the item “Have you smoked at least part of acigarette in the past 7 days?” Regardless of the answer tothe first question, an individual was considered in Stage 4if the answer to the last question was “No”. Hence, Stage 4represents the 7-day point-prevalence smoking abstinence.See Additional file 1: Table S1 for a summary of the ob-served number of transitions between the stages. Notethat there were two cases in each of MI and HE groups,which were excluded from the data due to relapse. Par-ticularly, relapses occurring from Stage 4 to other stageswere not considered in the MC modeling.
The MC modelIn our randomized trial, the participants were allsmokers at enrollment (t = 0) and had two follow-ups
with time intervals of 13 weeks. Let Sit be the smokingstage of the ith participant at time t, which takes values1–4 if the stage of smoker is “unmotivated”, “indecisive”,“motivated” and “former”, respectively. This has beenshown in Fig. 1, which is a compartmental diagram ofquit progression among the smokers with transition ratedij, from the stage i to stage j. The first-order continuoustime MC model has two main assumptions [24]:
(1) The Markov property: The future status of smokerdepends only on the present and not on the pasthistory of observations, i.e. Pr(Sit| Sit − 1, Sit − 2, ,Si0) = Pr(Sit | Sit − 1 ).
(2) The stationary transition process: The transitionprobabilities do not change over time, i.e. Pr(Sit = k|Sit − 1 = l) = Pr(Siu = k| Siu − 1 = l ) = qlk for any u ≠ t.
Then the MC model associated with Fig. 1 is describedby the transition intensity matrix Q = [qlk] which is givenby
Q ¼− q12 þ q13 þ q14ð Þ q12 q13 q14
q21 − q21 þ q23 þ q24ð Þ q23 q24q31 q32 − q31 þ q32 þ q34ð Þ q340 0 0 0
2664
3775:
ð1ÞNote that each row of Q sums to 0; therefore, the
diagonal entry qrr has been replaced with the sum qll ¼ −P4k¼1;l≠k qlk . The last row is related to Stage 4, former
smoker, which is an “absorbing” state. As mentioned earl-ier, the two relapse cases were excluded from the data.The MC model was fitted to the data to compute the
efficacy and effectiveness of the interventions and tocompare the movement patterns of participants betweenthe Stages 1–4. Specifically, we used the “MSM Rpackage” [11, 12] to compute the maximum likelihoodestimates and the transition intensity matrix. Thetransition probability matrix P(t) = [plk] is a time varyingmatrix, whose entry plk is the probability of being inStage k at a future time t + u, given the Stage at time u isl, i.e. plk = Pr(Sit + u = k|Siu = 1). Then P(t) is calculatedusing the Kolmogorov relationship P(t) = Exp(tQ), whereQ is the transition intensity matrix [24]. Using the fittedMC model, the prevalence of each subgroup wascalculated for the time interval [0, 26].
Efficacy versus effectivenessEfficacy and effectiveness are both important measuresfor evaluating smoking cessation interventions (see forexample [21–23]). Nevertheless, the distinction betweenthese two measures is often poorly understood [21, 25].The efficacy can be defined as the performance of anintervention regardless of any potential side effects,
Bani-Yaghoub et al. BMC Medical Research Methodology (2018) 18:52 Page 3 of 10

whereas the effectiveness takes into account the negativeside effects such as loss of motivation or confidence toquit smoking. We used the following formula to evaluatethe relative efficacy of HE, BA and MI
σ tð Þ ¼ F tð ÞFmax
;
ð2Þwhere F(t) is the prevalence of former smokers attime t and Fmax is the maximum prevalence offormer smokers in all three intervention groups. Toevaluate the relative effectiveness, we applied a pen-alty according to the increases and decreases in theprevalence of unmotivated and motivated smokers,respectively. In particular, the effectiveness at time twas calculated by
ρ tð Þ ¼ ΔF tð Þ−α ΔU tð Þ−ΔM tð Þð Þð ÞNmax
;
ð3Þwhere α ∈ (0, 1) is the penalty; Nmax is the maximumvalue of the numerator among the three interventions;and ΔU(t) and ΔM(t) are the change in prevalence ofunmotivated and motivated smokers at time t,respectively.
The ODE modelTo further analyze the dynamics of quit progression weemployed an ODE modeling approach. In particular, weformulated the movement of participants using the fol-lowing ODE model
U0tð Þ ¼ d21I tð Þ þ d31M tð Þ− d12 þ d13 þ d14ð ÞU tð Þ
I0tð Þ ¼ − d23 þ d24 þ d21ð ÞI tð Þ þ d32M tð Þ þ d12U tð Þ
M0tð Þ ¼ d23I tð Þ− d34 þ d32 þ d31ð ÞM tð Þ þ d13U tð Þ
ð4Þwhere U(t), I(t) and M(t) are the proportions of unmoti-vated, indecisive and motivated smokers, respectively. As
shown in Fig. 1, the parameter dij, denotes the rate oftransition from stage i to stage j, with i, j = 1, …, 4; i ≠ j.Since the total population size is constant, the propor-tion of former smokers F(t) is obtained by solving system(4) and using
F tð Þ ¼ 100− U tð Þ þ I tð Þ þM tð Þð Þ:ð5Þ
When the system (4) is not under-determined, it onlyhas the trivial equilibrium
U�; I�;M�; F�ð Þ ¼ 0; 0; 0; 100ð Þ;ð6Þ
which is globally stable. When the system is under-determined there are infinitely many equilibria and thestability of the trivial equilibrium (6) is lost (see theAdditional file 1, for more details).The average prevalence of each subgroup was calcu-
lated using the formula
Pavg ¼ 1T
Z T
0P tð Þdt;
ð7ÞTo estimate the parameters dij of system (4), the
Matlab program “fmincon.m” from the optimizationtoolbox was used. The main idea is to minimize the leastsquares error between a solution of the ODE model (4)and the set of data points [26, 27]. Here, the prevalencedata generated from the MC model was employed to es-timate the parameter values of the ODE model (4) foreach group of BA, HE and MI participants. Note thatthe program “fminsearch.m” may give rise to negativeparameter values, which are not realistic. This was pre-vented by using “fmincon.m” and setting the lowerbounds of the parameters equal to zero. After estimatingthe parameter values, the specified ODE model was usedto predict the dynamics of quit progression over 2 years
Fig. 1 The compartmental diagram of quit progression among smokers who are not ready to quit. The self-assessment data was used to determinethe stages of smokers. The arrows show the possible transitions between the stages. Note that the last stage is the 7-day point-prevalence smokingabstinence, which is an absorbing state. The parameters d_ij, denote the rate of transition from stage i to stage j with i,j = 1,…,4;i≠ j
Bani-Yaghoub et al. BMC Medical Research Methodology (2018) 18:52 Page 4 of 10

and to determine the asymptotic behavior of the ODEmodel.
ResultsDescriptive statisticsFor BA, MI and HE, the dataset consisted of 86, 177 and184 transitions between stages 1–4, respectively (seeAdditional file 1 (part A)). The temporal changes in theprevalence of each stage are summarized in Table 1. Thechanges at week 26 with respect to week 0 shows thatHE had the highest increase in the prevalence of formersmokers. Nevertheless, instead of assessing a single out-come at the end of the follow-up period, the proposedMC-ODE modeling estimates the weekly changes in theprevalence of all stages during the entire follow-upperiod. This can reveal the dynamics and possible down-sides of each intervention during weeks 0 to 26.
Analysis of the MC modelTable 2 summarizes the average sojourn time (i.e.,average duration of one-time occupancy of a stage),standard error (SE) and 95% confidence intervals relatedto each intervention. In all three groups, the confidenceintervals are wide, which is a limitation of thepresent study. This could be due to small groupsizes [MI (n = 87), HE (n = 91) and BA (n = 43)]. As-suming shorter sojourn time in MI group, the move-ments of MI participants between the stages (i.e.,unmotivated, indecisive, and motivated) could bemore frequent than the movements in BA and HEgroups. Nonetheless, this is only a speculation and
additional data with larger group sizes is needed toconfirm this result.The estimated transition intensity matrices Q are
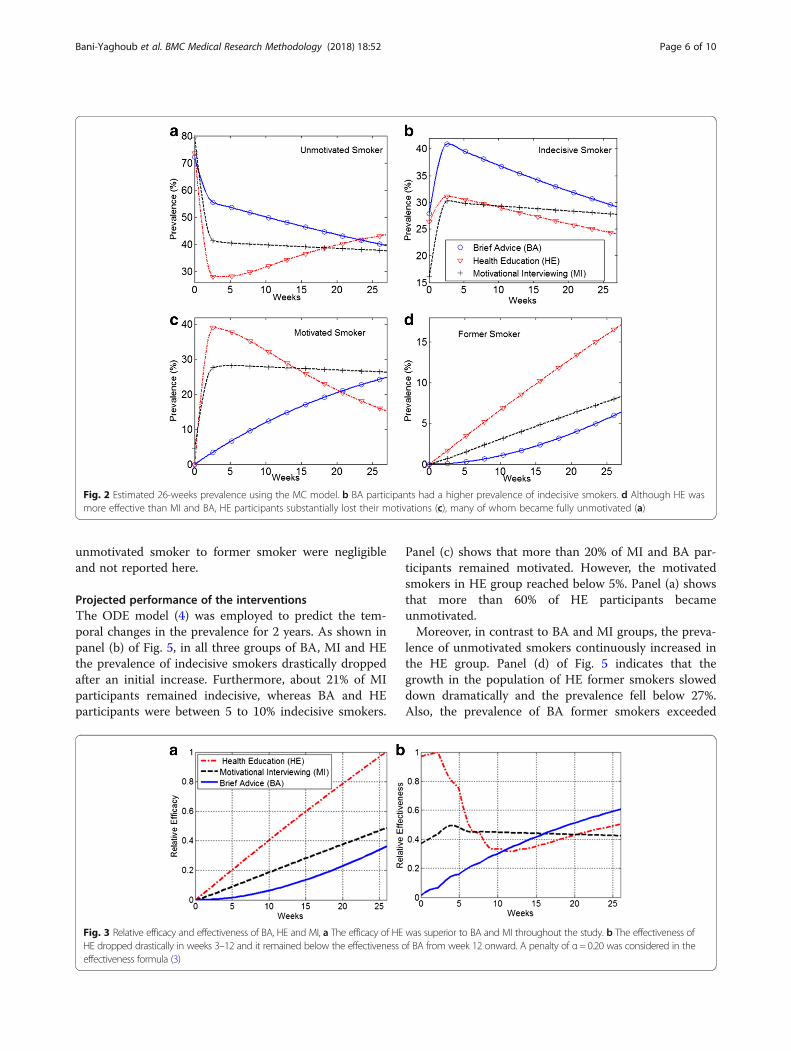
provided in Table A2 of the Additional file 1. Thesematrices were used to calculate the estimated26-weeks prevalence of unmotivated, indecisive, mo-tivated and former smokers in each group. In par-ticular, as shown in panel (b) of Fig. 2, BAparticipants had a higher prevalence of indecisivesmokers. Panel (c) shows that the prevalence of mo-tivated smokers sharply declined in HE group. Thedecline was accompanied with an incline in theprevalence of unmotivated smokers in HE group (seepanel (a)). Nevertheless, as shown in panel (d), HEparticipants had constantly higher prevalence offormer smokers.Using the formulas (2) and (3) the relative efficacy and
effectiveness of all three interventions were calculated.We applied a penalty of α = 0.20 in the effectiveness for-mula. As shown in panel (a) of Fig. 3 the efficacy of HEwas superior to BA and MI throughout the weeks 0–26.Nevertheless, panel (b) shows that the effectiveness ofHE dropped drastically in weeks 3–12 and it remainedbelow the effectiveness of BA from week 12 onward.Fig. 4 represents the estimated transition probabilities
into the final stage (Former Smoker). As shown in panel(a) the indecisive smokers in HE group had a muchhigher probability to quit. Panel (b) shows that the moti-vated smokers in the MI group had a higher transitionprobability. However, in the HE group, the motivatedsmokers had slightly higher probabilities to quit fromthe 17th week onward. The transition probabilities from
Table 1 Summary of the observed data in stages ofunmotivated, indecisive, motivated and former smokers
Week Unmotivated Indecisive Motivated Former
Brief Advice (n = 43)
0 31(72.1%) 12(27.9%) 0(0%) 0(0%)
12 20(46.5%) 16(37.2%) 7(16.3%) 0(0%)
26 18(41.9%) 12(27.9%) 10(23.3%) 3(7.0%)
0→ 26 −13(−30.2%) 0(0%) 10(23.3%) 3(7.0%)
Motivational Interviewing (n = 87)
0 69(79.3%) 14(16.1%) 4(4.6%) 0(0%)
12 36(40.9%) 23(26.1%) 27(30.7%) 2(2.3%)
26 32(36.4%) 27(30.7%) 22(25.0%) 7(7.9%)
0→ 26 −37(− 42.9%) 13(14.6%) 18(20.4%) 7(7.9%)
Health Education (n = 91)
0 67(73.6%) 24(26.4%) 0(0%) 0(0%)
12 30(33.0%) 22(24.2%) 33(36.3%) 6(6.6%)
26 23(25.3%) 31(34.1%) 21(23.1%) 16(17.6%)
0→ 26 −44(−48.3%) 7(7.7%) 21(23.1%) 16(17.6%)
Note: The symbol 26→ 0 denotes the changes between weeks 0 and 26
Table 2 Average sojourn time (excursion time), standard error(SE), and 95% lower and upper bounds associated with the MCmodel. For motivational interviewing, the sojourn time wasmuch shorter than the other two interventions
Estimates SE Lower Upper
Motivational Interviewing (MI)
unmotivated 2.1041 2.7413 0.1637 27.0420
indecisive 0.4441 1.0043 0.0053 37.3495
motivated 0.4704 1.1268 0.0044 51.4695
Health Education (HE)
unmotivated 15.883 2.3698 11.8558 21.2784
indecisive 9.6538 4.2429 4.0793 22.8459
motivated 7.7423 2.7391 3.8702 15.4884
Brief Advice (BA)
unmotivated 10.4213 2.6934 6.2796 17.2948
indecisive 8.3947 2.6351 4.5375 15.5309
motivated 24.1047 14.0375 7.6984 75.4752
Note: The confidence intervals were calculated by simulating 1000 randomvectors from the asymptotic multivariate normal distribution implied by themaximum likelihood estimates of the log transition intensities
Bani-Yaghoub et al. BMC Medical Research Methodology (2018) 18:52 Page 5 of 10
unmotivated smoker to former smoker were negligibleand not reported here.
Projected performance of the interventionsThe ODE model (4) was employed to predict the tem-poral changes in the prevalence for 2 years. As shown inpanel (b) of Fig. 5, in all three groups of BA, MI and HEthe prevalence of indecisive smokers drastically droppedafter an initial increase. Furthermore, about 21% of MIparticipants remained indecisive, whereas BA and HEparticipants were between 5 to 10% indecisive smokers.
Panel (c) shows that more than 20% of MI and BA par-ticipants remained motivated. However, the motivatedsmokers in HE group reached below 5%. Panel (a) showsthat more than 60% of HE participants becameunmotivated.Moreover, in contrast to BA and MI groups, the preva-
lence of unmotivated smokers continuously increased inthe HE group. Panel (d) of Fig. 5 indicates that thegrowth in the population of HE former smokers sloweddown dramatically and the prevalence fell below 27%.Also, the prevalence of BA former smokers exceeded
Fig. 2 Estimated 26-weeks prevalence using the MC model. b BA participants had a higher prevalence of indecisive smokers. d Although HE wasmore effective than MI and BA, HE participants substantially lost their motivations (c), many of whom became fully unmotivated (a)
Fig. 3 Relative efficacy and effectiveness of BA, HE and MI, a The efficacy of HE was superior to BA and MI throughout the study. b The effectiveness ofHE dropped drastically in weeks 3–12 and it remained below the effectiveness of BA from week 12 onward. A penalty of α= 0.20 was considered in theeffectiveness formula (3)
Bani-Yaghoub et al. BMC Medical Research Methodology (2018) 18:52 Page 6 of 10

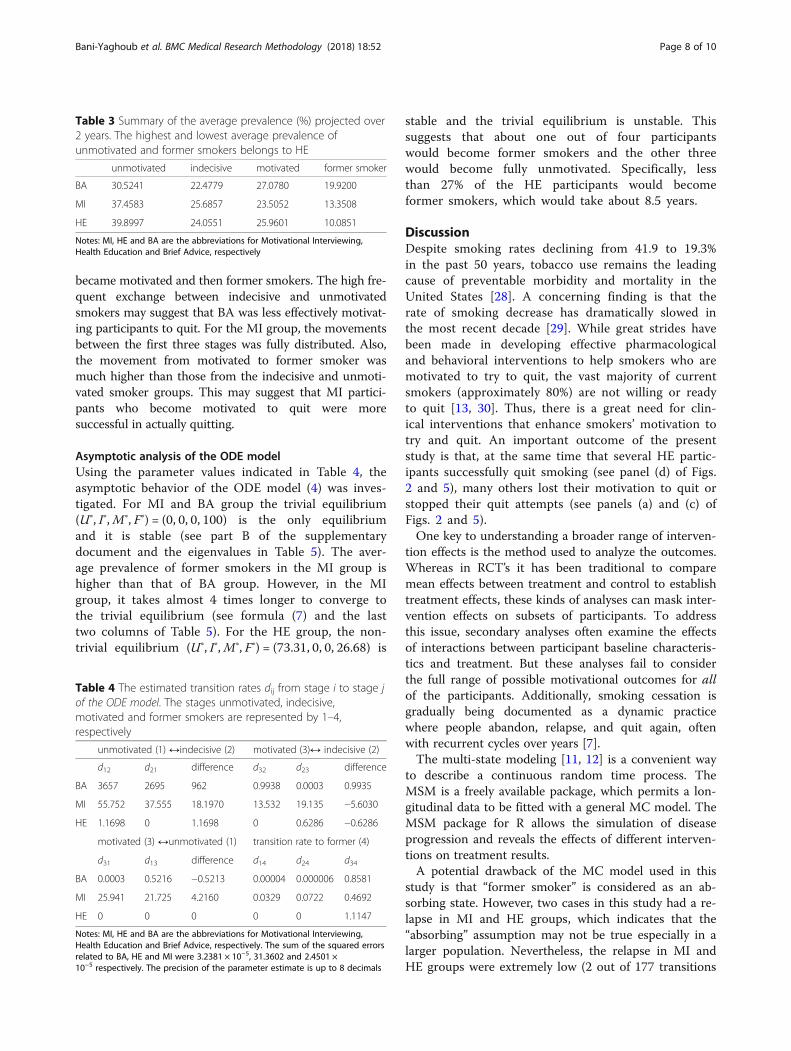
45%. Table 3 provides a summary of the average preva-lence in each stage projected over 2 years. The averagevalues were calculated using formula (7). The averageprevalence of former smokers was higher in BA group.The HE group had the highest average prevalence of un-motivated smokers. The average prevalence of indecisiveand motivated smokers was in the range of 22–27% inall three groups.Table 4 represents the estimated transition rates dij
from stage i to stage j associated with the ODE model
(4). For the HE group, the movements were either frommotivated to former smoker or motivated to indecisiveand thereafter to unmotivated smoker (all other rates ofmovement are negligible). This may suggest the polariz-ing effect of HE, where the participants either quitsmoking or became highly unmotivated. For the BAgroup, there was a huge exchange between stages 2 and1 (indecisive and unmotivated smokers). The rates ofmovement from these two stages to the last stage werevery small. Instead, from these two stages the individuals
Fig. 4 Estimated transition probabilities into the final stage (Former Smoker). a Indecisive smokers in HE group had a higher probability to quit.b The motivated smokers in the MI group had an overall higher transition probability until week 17
Fig. 5 Prevalence of smoker populations projected over 2 years. a The prevalence of unmotivated HE participants kept growing andexceeded 60%. b There was a sharp decline in the prevalence of indecisive smokers in all three groups. c The motivated smokers in HEgroup reached below 5%. d The prevalence of BA former smokers exceeded 45%
Bani-Yaghoub et al. BMC Medical Research Methodology (2018) 18:52 Page 7 of 10
became motivated and then former smokers. The high fre-quent exchange between indecisive and unmotivatedsmokers may suggest that BA was less effectively motivat-ing participants to quit. For the MI group, the movementsbetween the first three stages was fully distributed. Also,the movement from motivated to former smoker wasmuch higher than those from the indecisive and unmoti-vated smoker groups. This may suggest that MI partici-pants who become motivated to quit were moresuccessful in actually quitting.
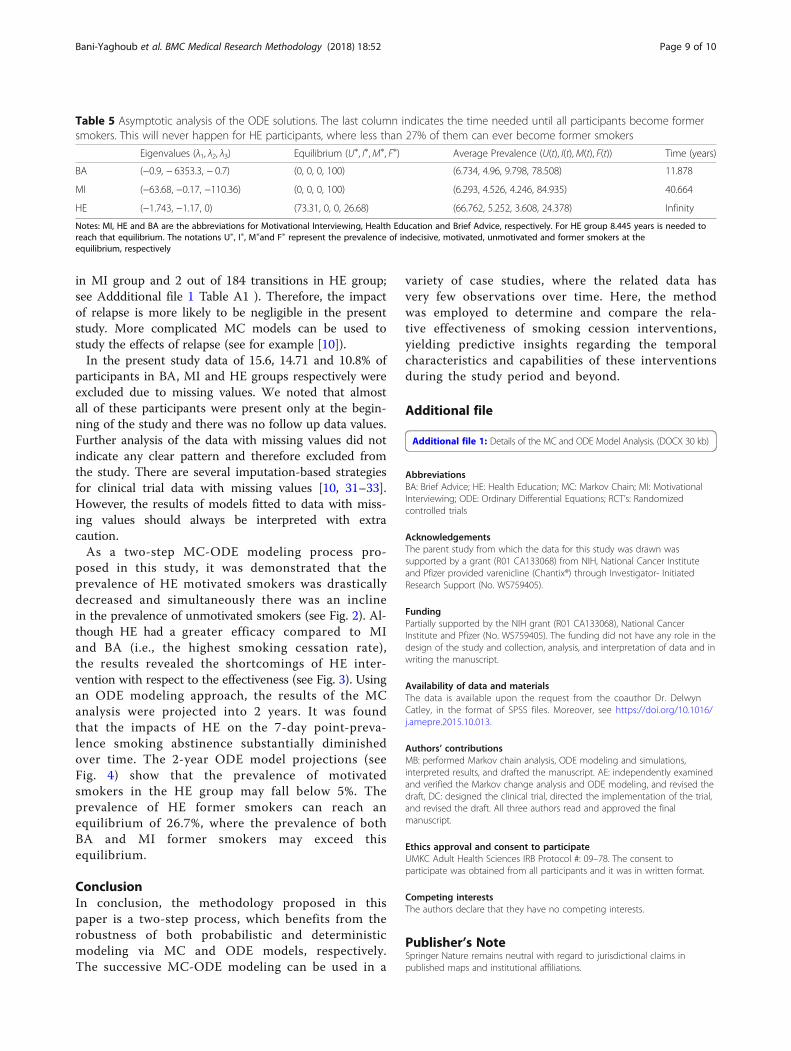
Asymptotic analysis of the ODE modelUsing the parameter values indicated in Table 4, theasymptotic behavior of the ODE model (4) was inves-tigated. For MI and BA group the trivial equilibrium(U∗, I∗,M∗, F∗) = (0, 0, 0, 100) is the only equilibriumand it is stable (see part B of the supplementarydocument and the eigenvalues in Table 5). The aver-age prevalence of former smokers in the MI group ishigher than that of BA group. However, in the MIgroup, it takes almost 4 times longer to converge tothe trivial equilibrium (see formula (7) and the lasttwo columns of Table 5). For the HE group, the non-trivial equilibrium (U∗, I∗,M∗, F∗) = (73.31, 0, 0, 26.68) is
stable and the trivial equilibrium is unstable. Thissuggests that about one out of four participantswould become former smokers and the other threewould become fully unmotivated. Specifically, lessthan 27% of the HE participants would becomeformer smokers, which would take about 8.5 years.
DiscussionDespite smoking rates declining from 41.9 to 19.3%in the past 50 years, tobacco use remains the leadingcause of preventable morbidity and mortality in theUnited States [28]. A concerning finding is that therate of smoking decrease has dramatically slowed inthe most recent decade [29]. While great strides havebeen made in developing effective pharmacologicaland behavioral interventions to help smokers who aremotivated to try to quit, the vast majority of currentsmokers (approximately 80%) are not willing or readyto quit [13, 30]. Thus, there is a great need for clin-ical interventions that enhance smokers’ motivation totry and quit. An important outcome of the presentstudy is that, at the same time that several HE partic-ipants successfully quit smoking (see panel (d) of Figs.2 and 5), many others lost their motivation to quit orstopped their quit attempts (see panels (a) and (c) ofFigs. 2 and 5).One key to understanding a broader range of interven-
tion effects is the method used to analyze the outcomes.Whereas in RCT’s it has been traditional to comparemean effects between treatment and control to establishtreatment effects, these kinds of analyses can mask inter-vention effects on subsets of participants. To addressthis issue, secondary analyses often examine the effectsof interactions between participant baseline characteris-tics and treatment. But these analyses fail to considerthe full range of possible motivational outcomes for allof the participants. Additionally, smoking cessation isgradually being documented as a dynamic practicewhere people abandon, relapse, and quit again, oftenwith recurrent cycles over years [7].The multi-state modeling [11, 12] is a convenient way
to describe a continuous random time process. TheMSM is a freely available package, which permits a lon-gitudinal data to be fitted with a general MC model. TheMSM package for R allows the simulation of diseaseprogression and reveals the effects of different interven-tions on treatment results.A potential drawback of the MC model used in this
study is that “former smoker” is considered as an ab-sorbing state. However, two cases in this study had a re-lapse in MI and HE groups, which indicates that the“absorbing” assumption may not be true especially in alarger population. Nevertheless, the relapse in MI andHE groups were extremely low (2 out of 177 transitions
Table 3 Summary of the average prevalence (%) projected over2 years. The highest and lowest average prevalence ofunmotivated and former smokers belongs to HE
unmotivated indecisive motivated former smoker
BA 30.5241 22.4779 27.0780 19.9200
MI 37.4583 25.6857 23.5052 13.3508
HE 39.8997 24.0551 25.9601 10.0851
Notes: MI, HE and BA are the abbreviations for Motivational Interviewing,Health Education and Brief Advice, respectively
Table 4 The estimated transition rates dij from stage i to stage jof the ODE model. The stages unmotivated, indecisive,motivated and former smokers are represented by 1–4,respectively
unmotivated (1) ↔indecisive (2) motivated (3)↔ indecisive (2)
d12 d21 difference d32 d23 difference
BA 3657 2695 962 0.9938 0.0003 0.9935
MI 55.752 37.555 18.1970 13.532 19.135 −5.6030
HE 1.1698 0 1.1698 0 0.6286 −0.6286
motivated (3) ↔unmotivated (1) transition rate to former (4)
d31 d13 difference d14 d24 d34
BA 0.0003 0.5216 −0.5213 0.00004 0.000006 0.8581
MI 25.941 21.725 4.2160 0.0329 0.0722 0.4692
HE 0 0 0 0 0 1.1147
Notes: MI, HE and BA are the abbreviations for Motivational Interviewing,Health Education and Brief Advice, respectively. The sum of the squared errorsrelated to BA, HE and MI were 3.2381 × 10⁻⁵, 31.3602 and 2.4501 ×10⁻⁵ respectively. The precision of the parameter estimate is up to 8 decimals
Bani-Yaghoub et al. BMC Medical Research Methodology (2018) 18:52 Page 8 of 10
in MI group and 2 out of 184 transitions in HE group;see Addditional file 1 Table A1 ). Therefore, the impactof relapse is more likely to be negligible in the presentstudy. More complicated MC models can be used tostudy the effects of relapse (see for example [10]).In the present study data of 15.6, 14.71 and 10.8% of
participants in BA, MI and HE groups respectively wereexcluded due to missing values. We noted that almostall of these participants were present only at the begin-ning of the study and there was no follow up data values.Further analysis of the data with missing values did notindicate any clear pattern and therefore excluded fromthe study. There are several imputation-based strategiesfor clinical trial data with missing values [10, 31–33].However, the results of models fitted to data with miss-ing values should always be interpreted with extracaution.As a two-step MC-ODE modeling process pro-
posed in this study, it was demonstrated that theprevalence of HE motivated smokers was drasticallydecreased and simultaneously there was an inclinein the prevalence of unmotivated smokers (see Fig. 2). Al-though HE had a greater efficacy compared to MIand BA (i.e., the highest smoking cessation rate),the results revealed the shortcomings of HE inter-vention with respect to the effectiveness (see Fig. 3). Usingan ODE modeling approach, the results of the MCanalysis were projected into 2 years. It was foundthat the impacts of HE on the 7-day point-preva-lence smoking abstinence substantially diminishedover time. The 2-year ODE model projections (seeFig. 4) show that the prevalence of motivatedsmokers in the HE group may fall below 5%. Theprevalence of HE former smokers can reach anequilibrium of 26.7%, where the prevalence of bothBA and MI former smokers may exceed thisequilibrium.
ConclusionIn conclusion, the methodology proposed in thispaper is a two-step process, which benefits from therobustness of both probabilistic and deterministicmodeling via MC and ODE models, respectively.The successive MC-ODE modeling can be used in a
variety of case studies, where the related data hasvery few observations over time. Here, the methodwas employed to determine and compare the rela-tive effectiveness of smoking cession interventions,yielding predictive insights regarding the temporalcharacteristics and capabilities of these interventionsduring the study period and beyond.
Additional file
Additional file 1: Details of the MC and ODE Model Analysis. (DOCX 30 kb)
AbbreviationsBA: Brief Advice; HE: Health Education; MC: Markov Chain; MI: MotivationalInterviewing; ODE: Ordinary Differential Equations; RCT’s: Randomizedcontrolled trials
AcknowledgementsThe parent study from which the data for this study was drawn wassupported by a grant (R01 CA133068) from NIH, National Cancer Instituteand Pfizer provided varenicline (Chantix®) through Investigator- InitiatedResearch Support (No. WS759405).
FundingPartially supported by the NIH grant (R01 CA133068), National CancerInstitute and Pfizer (No. WS759405). The funding did not have any role in thedesign of the study and collection, analysis, and interpretation of data and inwriting the manuscript.
Availability of data and materialsThe data is available upon the request from the coauthor Dr. DelwynCatley, in the format of SPSS files. Moreover, see https://doi.org/10.1016/j.amepre.2015.10.013.
Authors’ contributionsMB: performed Markov chain analysis, ODE modeling and simulations,interpreted results, and drafted the manuscript. AE: independently examinedand verified the Markov change analysis and ODE modeling, and revised thedraft, DC: designed the clinical trial, directed the implementation of the trial,and revised the draft. All three authors read and approved the finalmanuscript.
Ethics approval and consent to participateUMKC Adult Health Sciences IRB Protocol #: 09–78. The consent toparticipate was obtained from all participants and it was in written format.
Competing interestsThe authors declare that they have no competing interests.
Publisher’s NoteSpringer Nature remains neutral with regard to jurisdictional claims inpublished maps and institutional affiliations.
Table 5 Asymptotic analysis of the ODE solutions. The last column indicates the time needed until all participants become formersmokers. This will never happen for HE participants, where less than 27% of them can ever become former smokers
Eigenvalues (λ1, λ2, λ3) Equilibrium (U∗, I∗,M∗, F∗) Average Prevalence (U(t), I(t),M(t), F(t)) Time (years)
BA (−0.9, − 6353.3, − 0.7) (0, 0, 0, 100) (6.734, 4.96, 9.798, 78.508) 11.878
MI (−63.68, −0.17, −110.36) (0, 0, 0, 100) (6.293, 4.526, 4.246, 84.935) 40.664
HE (−1.743, −1.17, 0) (73.31, 0, 0, 26.68) (66.762, 5.252, 3.608, 24.378) Infinity
Notes: MI, HE and BA are the abbreviations for Motivational Interviewing, Health Education and Brief Advice, respectively. For HE group 8.445 years is needed toreach that equilibrium. The notations U∗, I∗, M∗and F∗ represent the prevalence of indecisive, motivated, unmotivated and former smokers at theequilibrium, respectively
Bani-Yaghoub et al. BMC Medical Research Methodology (2018) 18:52 Page 9 of 10
Author details1Department of Mathematics and Statistics, University of Missouri–KansasCity, 5100 Rockhill Road, Kansas City, MO 64110-2499, USA. 2School ofMedicine, Creighton University, 2500 California Plaza, Omaha, NE 68178, USA.3Department of Pediatrics, Center for Children’s Healthy Lifestyles & Nutrition,2401 Gillham Road, Kansas City, MO 64108, USA. 4Children’s Mercy Hospitalsand Clinics, University of Missouri-Kansas City School of Medicine, 2401Gillham Road, Kansas City, MO 64108, USA.
Received: 26 April 2017 Accepted: 21 May 2018
References1. Kaptchuk TJ. The double-blind, randomized, placebo-controlled trial: Gold
standard or golden calf? J Clinical Epidemiol. 2001;54(6):541–9.2. Grossman J, Mackenzie FJ. The randomized controlled trial: gold standard,
or merely standard? Perspect Biol Med. 2005;48(4):516–34.3. Ioannidis JPA, Evans SJW, Gøtzsche PC, O'Neill R, Altman DG, Schulz K.
Better reporting of harms in randomized trials: an extension of theCONSORT statement. Ann Intern Med. 2004;141(10):781–8.
4. Ioannidis JP, Contopoulos-Ioannidis DG. Reporting of safety data fromrandomised trials [letter]. Lancet. 1998;352:1752–3.
5. Ioannidis JP, Lau J. Completeness of safety reporting in randomized trials:an evaluation of 7 medical areas. JAMA. 2001;285:437–43.
6. Baker TB, Mermelstein R, Collins LM, Piper ME, Jorenby DE, Smith SS, FioreMC. New methods for tobacco dependence treatment research. Ann BehavMed. 2011;41(2):192–207. https://doi.org/10.1007/s12160=010=9252-y.
7. Fiore MC, Jaen CR, Baker TB, et al. Treating Tobacco Use and Dependence:2008 Update Clinical Practice Guideline. Rockville: Department of Healthand Human Services. Public Health Service; 2008.
8. Prochaska JO, DiClemente CC. Stages and processes of self-change ofsmoking: toward an integrative model of change. J Consult Clin Psychol.1983;51:390–5.
9. Diggle P, Liang KY, Zeger SL. Analysis of longitudinal data. 2nd ed. NewYork: Oxford University Press; 2002.
10. Yeh H-W, Ellerbeck EF, Mahnken JD. Simultaneous evaluation of abstinenceand relapse using a Markov chain model in smokers enrolled in a two-yearrandomized trial. BMC Med Res Methodol. 2012;12:95. Web. 10 Apr. 2017
11. Jackson CH. Multi-state models for panel data: the msm package for R.J Stat Softw. 2011;38(8):1–29. URL http://www.jstatsoft.org/v38/i08/
12. Jackson CH, Sharples LD, Thompson SG, Duffy SW, Couto E. MultistateMarkov models for disease progression with classification error. J Royal StatSoc Series D. 2003;52(2):193–209.
13. Shiffman S, Brockwell SE, Pillitteri JL, Gitchell JG. Use of smoking-cessationtreatments in the United States. Am J Prev Med. 2008;34:102–11.
14. Miller WR, Rollnick S. Ten things that motivational interviewing is not. BehavCogn Psychother. 2009;37:129–40.
15. Velicer WF, Fava JL, Prochaska JO, Abrams DB, Emmons KM, Pierce JP.Distribution of smokers by stage in three representative samples. Prev Med.1995;24(4):401–11.
16. Lai DT, Cahill K, Qin Y, Tang JL. Motivational interviewing for smokingcessation. Cochrane Database Syst Rev. 2010;(1):CD006936. https://doi.org/10.1002/14651858.
17. Heckman CJ, Egleston BL, Hofmann MT. Efficacy of motivationalinterviewing for smoking cessation: a systematic review and meta-analysis.Tob Control. 2010;19:410–6.
18. Lundahl BW, Kunz C, Brownell C, Tollefson D, Burke BL. A meta-analysis ofmotivational interviewing: twenty-five years of empirical studies. Res SocialWork Prac. 2010;20:137–60.
19. Catley D, Goggin K, Harris KJ, et al. A randomized trial of motivationalinterviewing: cessation induction among smokers with low desire to quitAmerican. J Prev Med. 2016;50(5):573–83. https://doi.org/10.1016/j.amepre.2015.10.013.
20. Catley D, Harris KJ, Goggin K, Richter K, Williams K, Patten C, et al.Motivational interviewing for encouraging quit attempts amongunmotivated smokers: study protocol of a randomized, controlled, efficacytrial. BMC Public Health. 2012;12:456.
21. Barreto M. Efficacy, effectiveness, and the evaluation of public healthinterventions. J Epidemiol Community Health. 2005;59(5):345–6.
22. Prochaska JO, Evers KE, Prochaska JM, Van Marter D, Johnson JL. Efficacyand effectiveness trials: examples from smoking cessation and bullyingprevention. J Health Psychol. 2007;12(1):170–8.
23. Polańska K, Hanke W, Sobala W, Lowe JB. Efficacy and effectiveness of thesmoking cessation program for pregnant women. Int J Occup Med EnvironHealth. 2004;17(3):369–77.
24. Cox DR, Miller HD. The theory of stochastic processes. London: Chapmanand Hall; 1965.
25. Singal AG, Higgins PD, Waljee AK. A primer on effectiveness and efficacytrials. Clinical and Translational Gastroenterology. 2014;5:e45. https://doi.org/10.1038/ctg.2013.13.
26. Perko L. Differential Equations and Dynamical Systems, 3rd edn. New York:Springer, 2001.
27. Ross J, Pagendam D, Pollett P. On parameter estimation in populationmodels ii: multi-dimensional processes and transient dynamics. Theor PopBiol. 2009;75:123–32.
28. Centers for Disease Control and Prevention. Smoking-Attributable Mortality,Years of Potential Life Lost, and Productivity Losses—United States, 2000–2004. Morb Mortal Wkly Rep. 2008;57(45):1226–8. [accessed 2012 Jun 7]
29. King B, Dube SH, Kaufmann R, Shaw L, Pechacek T. Vital Signs: CurrentCigarette Smoking Among Adults Aged ≥18 Years— United States, 2005–2010Morb Mortal Wkly Rep 2011;60(35):1207-1212.
30. Centers for Disease Control and Prevention. Quitting Smoking AmongAdults—United States, 2001–2010. Morb Mortal Wkly Rep. 2011;60(44):1513–9.
31. Dempster AP, Laird NM, Rubin DB. Maximum likelihood from incompletedata via the EM algorithm. J Royal Stat Soc B. 1977;39:1–38.
32. Hall SM, Delucchi KL, Velicer WF, Kahler CW, Ranger-Moore J, Hedeker D,Tsoh JY, Niaura R. Statistical analysis of randomized trials in tobaccotreatment: longitudinal designs with dichomotous outcome. Nicotine TobRes. 2001;3:193–202.
33. Yang X, Li J, Shoptaw S. Imputation-based strategies for clinical triallongitudinal data with nonignorable missing values. Stat Med. 2008;27:2826–49.
Bani-Yaghoub et al. BMC Medical Research Methodology (2018) 18:52 Page 10 of 10