effect of food deprivation on oxygen consumption and body composition of growth-enhanced ¾
TRANSCRIPT
Ž .Aquaculture 188 2000 47–63www.elsevier.nlrlocateraqua-online
Effect of food deprivation on oxygen consumptionand body composition of growth-enhanced
ž /transgenic Atlantic salmon Salmo salar
J.T. Cook a,b,), A.M. Sutterlin a, M.A. McNiven b
a AquaBounty Farms, Souris, PEI, Canada C0A 2B0b Atlantic Veterinary College, UniÕersity of Prince Edward Island, Charlottetown, PEI, Canada C1A 4P3
Received 14 July 1999; received in revised form 3 November 1999; accepted 18 January 2000
Abstract
The influence of food deprivation on the rate of oxygen consumption and the rate ofmobilizationrutilization of energy reserves in F generation growth-enhanced transgenic Atlantic2
salmon were compared relative to their non-transgenic counterparts, over a pre-smolt weightinterval of 8 to 55 g.
Throughout most of the 8 weeks of food deprivation, transgenic fish exhibited a greater rate ofoxygen consumption compared to control salmon, but also exhibited a more rapid decline inoxygen consumption as starvation progressed. Consequently, depending on initial weight andlength of food deprivation, the rate of oxygen consumption of transgenic fish declined to where itequaled or was less than the oxygen consumption of control fish. Transgenic fish depleted bodyprotein, dry matter, lipid and energy at a faster rate than did the controls. Additionally, in bothgroups, lipid was catabolized faster than was protein.
Although transgenic fish demonstrated the ability to reduce their metabolic rate duringstarvation, as also observed in the non-genetically modified control salmon, their persistence inmaintaining a higher metabolic rate, combined with their lower initial endogenous energyreserves, suggests that the likelihood of growth-enhanced transgenic salmon achieving maximumgrowth or even surviving outside intensive culture conditions may be lower than that ofnon-transgenic salmon. q 2000 Elsevier Science B.V. All rights reserved.
Keywords: Transgenic; Atlantic salmon; Oxygen consumption; Body composition; Starvation; Growth hor-mone
) Corresponding author. AquaBounty Farms, Fortune RRa4, Souris, PEI, Canada C0A 2B0. Tel.: q1-902-687-2600; fax: q1-902-687-3800.
Ž .E-mail address: todd [email protected] J.T. Cook .–
0044-8486r00r$ - see front matter q2000 Elsevier Science B.V. All rights reserved.Ž .PII: S0044-8486 00 00333-1

( )J.T. Cook et al.rAquaculture 188 2000 47–6348
1. Introduction
In addition to the regulatory requirements relating to food and health issues, a numberof environmental concerns must be addressed before transgenic technology can entercommercial production. Although commercial implementation of this technology will
Ž .likely employ reproductively incapable fish female triploids , there remains someŽ .concern that such fish will should they escape pose a threat to natural populations
through competition for food, space andror perhaps by becoming direct predators. Amore basic understanding of the bioenergetics associated with life-history related events,such as food deprivation, of growth-enhanced transgenic fish is required to better assessthe relative fitness of such fish outside of an intensive culture system.
Fish undergo natural periods of food deprivation throughout a normal life cycle andhave consequently evolved the capability to endure prolonged food shortages. Energyexpenditure can be reduced during such periods possibly by reducing activity, reflectedby lower oxygen consumption. However, extensive body energy reserves may be lost asthe fish metabolize their own tissues to meet critical energy requirements. The probabil-ity and extent of ecological impacts is in part dependent upon the fitness of transgenic
Žindividuals to cope with changes in food abundance. Enhanced growth rates under.hatchery conditions exhibited by growth-enhanced transgenic Atlantic salmon relative
to non-genetically modified salmon are largely a function of their larger daily feedŽ . Ž .intake Cook, 1999; Cook et al., 2000a . Abrahams and Sutterlin 1999, in press tested
the hypothesis that transgenic salmon exhibiting greater appetite would subject them-selves to greater risks of predation to secure food. This study demonstrated thattransgenic Atlantic salmon spent significantly longer periods than control fish feeding inthe presence of a predator and consumed more feed at that location. Transgenic Atlanticsalmon have also been found to exhibit higher metabolic rates than controls under
Ž .simulated aquaculture conditions Stevens et al., 1998 . The following experimentemploying extended periods of food deprivation was conducted to determine if the
Žhigher metabolic rates in feeding and growing transgenic fish Stevens et al., 1998;.Cook, 1999 , relative to control fish, would persist in the absence of food and result in a
more rapid depletion of body energy reserves resulting in tissue breakdown andeventually death. Details on the growing conditions of the experimental fish prior to
Ž .onset of food deprivation can be found in Cook et al. 2000a .
2. Materials and methods
2.1. Experimental fish
The experimental transgenic fish as well as the non-genetically modified control fishŽ .were Atlantic salmon Salmo salar bred from Saint John River stock, New Brunswick,
Canada, and reared at AquaBounty Farms in Prince Edward Island, a government-in-spected hatchery designed with the required containment measures to prevent the escapeof genetically modified organisms into the natural environment.
Ž . ŽIn fall 1989, the growth hormone GH transgene was microinjected approximately6 .10 copies per egg through the micropyle into the cytoplasm of fertilized, non-water-
( )J.T. Cook et al.rAquaculture 188 2000 47–63 49
Ž .activated salmon eggs Shears et al., 1992 . Milt from one of the fast growing transgenicŽ .males arising from the injected eggs P — Parental generation , which sexually matured1
in the fall of 1991, was crossed with a non-transgenic female. A fast growing, transgenicŽ .female F resulting from this mating was crossed with a non-transgenic male in the fall1
of 1996 resulting in the F transgenic fish used in the present study. Also in the fall of2
1996, pooled non-transgenic milt and eggs from the same Saint John River stock wereused to generate non-transgenic control fish.
Transgenic and control embryos and alevins were incubated separately in flow-throughHeath incubators. To facilitate having transgenic and control fish of approximately thesame weight at the start of the experiment, the lot of eggs giving rise to the transgenic
Ž . Ž .fish were incubated at a lower water temperature 48C relative to control eggs 78C .Consequently, time at first feeding was approximately 17 days greater for the transgenicfry than for control fry.
Ž .In 1996 the above progeny resulting from the cross between a transgenic female F1
and a non-transgenic male exhibited a bimodal size distribution at the fingerling stage inŽJune, a phenomenon not usually seen until the first autumn of growth Thorpe, 1977;
.Thorpe et al., 1980 . Consequently, the two modes could be separated into two groupsbased on fork length above and below 8.0 cm, with 50% of total population in eachmode, which is typical of Mendelian segregation of an allelic insert on a singlechromosome. This separation was later confirmed by the exclusive presence of thetransgene in the upper modal as revealed using polymerase chain reaction. The trans-genic fish used in the present experiment were taken from the upper modal group fromthe 1996 spawning.
Well water was used at all stages of the experiment with properties as follows:hardness as CaCO was 150 mgrl, pH 7.6, and salinity 4‰; water temperature was3
Ž .maintained at 12.6"0.038C S.E.M. and lighting within the hatchery mimicked thenatural photoperiod.
2.2. Protocol
The oxygen consumption and body composition of food-deprived juvenile transgenicand control salmon, at weight increments over a weight range of approximately 8–55 g,were evaluated using the following methods. Six hundred and sixty transgenic salmon,average weight 9.42"0.09 g, were randomly distributed to 12 tanks for a total of 55fish per tank. Six hundred and sixty control salmon, average weight 6.62"0.05 g, wererandomly assigned to 12 additional tanks for a total of 55 fish per tank. The fish wereacclimated for 3 weeks in the experimental tanks. Fish were fed to satiation three times
Ž .per day on a commercial feed of the following analyzed on a dry matter basiscomposition: 92.40% dry matter, 55.69% protein, 18.57% lipid and 8.17% ash. Meanweights at the start of the experiment were 13.72"0.21 and 6.98"0.07 g fortransgenic and control fish, respectively. Fish in three transgenic and three control tankswere fasted for 24 h prior to the first oxygen consumption measurement. A non-invasiveprotocol was developed whereby the fish rearing tanks were temporarily converted tometabolic respiration chambers.

( )J.T. Cook et al.rAquaculture 188 2000 47–6350
2.3. Respirometer design
Prior to entering the respirometer, incoming water was heated to approximately 138C,stripped of excess nitrogen using oxygen injectors, run through a packed column withupwelling air to remove excess oxygen, and finally cooled by approximately 0.58C toprevent bubble formation on the tank surfaces. Employing a single pass, flow-throughsystem, water entered the 92-l tanks at the periphery and circulated towards the centerdrain.
At the start of the experiment and every 2 weeks thereafter, the rearing tanks wereconverted to flow-through respiration chambers and the oxygen consumption of thecontained fish were measured. In each respirometer, a rubber stopper was placed in theexternal standpipe, to cause the water level to rise above the tank upper rim. A foamgasket on the rim of the tank allowed for the Plexiglas cover to be sealed airtight.Clamps were placed around the tank edge and any air remaining inside the respirometerwas bled out. Water exited at a higher point on the external standpipe resulting in aslightly positive pressure in the sealed tank. Water flow rates to each individual tank
Žwere individually adjusted to facilitate a decline in oxygen concentration due to fish.respiration to approximately 60% water saturation, a level well above the critical
Ž .concentration limiting oxygen uptake Stevens et al., 1998 . Oxygen levels wereŽmeasured using an Oxyguard Handy Mark 4 oxygen sensor Point Four Systems, Port
.Moody, British Columbia, Canada . The entire process of converting a growth tank intoa respiration chamber generally took less than 5 min with minimal stress to the fish.Each respirometer contained a small submersible pump to maintain a slow circularcurrent. After each tank was sealed, an acclimation period of approximately 24 h
Ž .commenced before the first oxygen consumption measurements Brett and Zala, 1975 .Ž .Water flow rates to each tank and dissolved oxygen concentrations DO in the inflow
and outflow water were measured every 4 h over a 24-h period and the means were usedto calculate the rate of oxygen consumption. The respiration tanks were unsealed afterthe last oxygen measurements were taken and the fish biomass measured.
Ž .Dissolved oxygen readings measured to the nearest "0.05 mg O rl , water flow2
rate and the number of fish were used to calculate the oxygen consumption rate of a fishof known weight, according to the following equation:
w xD O =Vw y BOD=VwŽ .Ž . blanktank2 fishtankV sO 2 N
Ž . w xwhere V is the routine oxygen consumption rate mg O rh , D O is the DOO 2 22
Ž . w xconcentration change from the inflowing water supply mg O rl , O and the2 2 infloww x Ž .outflowing drain water, O , Vw is the flow rate lrh , N is the number of fish in2 outflow
Ž .the tank, and BOD is the biological oxygen demand mg O rl of a tank without fish.2
To control for microbial oxygen consumption, oxygen measurements were madeconcurrently on ‘blank’ tanks. These tanks normally had fish in them and therefore wererepresentative as containing the same film of microbial flora that would result fromnutrient enrichment associated with daily fish feeding and fish defecation. The oxygenconsumption rate by the ‘blank’ tank was subtracted from the calculated fish oxygenconsumption to obtain a true representation of the fish’s metabolism.

( )J.T. Cook et al.rAquaculture 188 2000 47–63 51
As fasting progressed, oxygen consumption rates were measured every 2 weeks untilthe fish lost approximately 15% of their initial wet body weight. Subsequent to eachoxygen measurement, subsamples of five fish per tank were euthanized for analysis ofbody composition and gross energy content.
The fish remaining in the nine tanks of transgenic and control fish continued to be fedto satiation three times per day. At approximately 10 g wet weight intervals, fish in threetanks from each of the transgenic and control groups were fasted and oxygen consump-tion rates and body composition measured according to the above protocol. As the
Ž .transgenic fish had a significantly higher growth rate Cook, 1999 , the time at whichcontrol fish of comparable size to transgenic fish were deprived of food was consider-ably delayed. This procedure continued until the oxygen consumption and body compo-sition of fish in the 12 tanks of transgenics and the 12 tanks of controls were beingmonitored under conditions of food deprivation.
2.4. Fish carcass preparation and chemical analysis
Frozen whole fish were autoclaved for 20 min at 1208C, homogenized with a knownvolume of distilled water, lyophilized, then equilibrated to room humidity, weighed, andfurther homogenized to a fine powder. Samples were analyzed for dry matter, protein
Ž Ž .and ash using standard methods Association of Official Analytical Chemists AOAC ,. Ž1990 and for gross energy using an isoperibolic calorimeter No. 1261, Parr Instru-
.ments, Moline, IL . Lipid extraction and quantification were carried out using theŽ . Ž .methodologies of Bligh and Dyer 1959 and Kates 1972 . All chemical analyses were
done in duplicate and averaged.A Student’s t-test was used to reveal the significance of difference in oxygen
consumption rate and body composition between transgenic and control fish over arange of body weights. The relationship between wet body weight, duration of food
Ždeprivation and the rate of oxygen consumption or changes in body composition dry.matter, protein, lipid, ash and energy was demonstrated by multiple regression analysis,
using 95% as the critical level for significance. A test for common slope was used tocompare coefficients in regression equations for transgenic fish and control fish.
3. Results
3.1. Oxygen consumption
The relationship between body weight and time of starvation for transgenic andŽ .control fish is shown in Table 1. The oxygen consumption mg O rweight of fish of2
transgenic and control fish, in relation to initial body weight and duration of starvationŽ .Fig. 1 , was best described by multiple regression with initial body weight and
Ž .starvation time as independent variables Table 2 . Initial weight represents the weightof the fish at zero time of starvation. The rates of oxygen consumption of bothtransgenic and control fish declined as starvation progressed, to levels significantlyŽ .P-0.05 lower than those of fish of comparable size that had not been deprived of
Ž .food i.e. zero time . Transgenic fish had significantly higher rates of oxygen consump-Ž . Ž .tion than control fish of comparable body weights initially zero time starvation and
( )J.T. Cook et al.rAquaculture 188 2000 47–6352
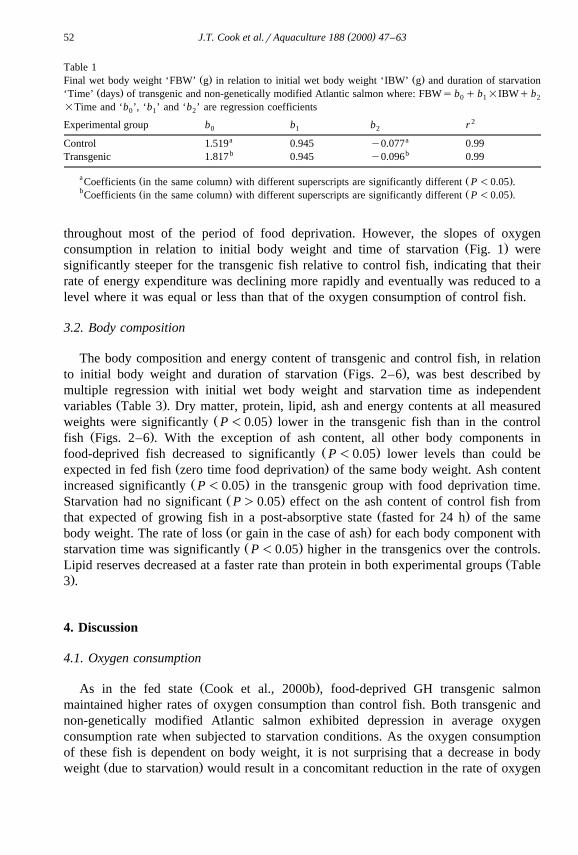
Table 1Ž . Ž .Final wet body weight ‘FBW’ g in relation to initial wet body weight ‘IBW’ g and duration of starvation
Ž .‘Time’ days of transgenic and non-genetically modified Atlantic salmon where: FBWs b q b =IBWq b0 1 2
=Time and ‘b ’, ‘b ’ and ‘b ’ are regression coefficients0 1 2
2Experimental group b b b r0 1 2
a aControl 1.519 0.945 y0.077 0.99b bTransgenic 1.817 0.945 y0.096 0.99
a Ž . Ž .Coefficients in the same column with different superscripts are significantly different P -0.05 .b Ž . Ž .Coefficients in the same column with different superscripts are significantly different P -0.05 .
throughout most of the period of food deprivation. However, the slopes of oxygenŽ .consumption in relation to initial body weight and time of starvation Fig. 1 were
significantly steeper for the transgenic fish relative to control fish, indicating that theirrate of energy expenditure was declining more rapidly and eventually was reduced to alevel where it was equal or less than that of the oxygen consumption of control fish.
3.2. Body composition
The body composition and energy content of transgenic and control fish, in relationŽ .to initial body weight and duration of starvation Figs. 2–6 , was best described by
multiple regression with initial wet body weight and starvation time as independentŽ .variables Table 3 . Dry matter, protein, lipid, ash and energy contents at all measured
Ž .weights were significantly P-0.05 lower in the transgenic fish than in the controlŽ .fish Figs. 2–6 . With the exception of ash content, all other body components in
Ž .food-deprived fish decreased to significantly P-0.05 lower levels than could beŽ .expected in fed fish zero time food deprivation of the same body weight. Ash content
Ž .increased significantly P-0.05 in the transgenic group with food deprivation time.Ž .Starvation had no significant P)0.05 effect on the ash content of control fish from
Ž .that expected of growing fish in a post-absorptive state fasted for 24 h of the sameŽ .body weight. The rate of loss or gain in the case of ash for each body component with
Ž .starvation time was significantly P-0.05 higher in the transgenics over the controls.ŽLipid reserves decreased at a faster rate than protein in both experimental groups Table
.3 .
4. Discussion
4.1. Oxygen consumption
Ž .As in the fed state Cook et al., 2000b , food-deprived GH transgenic salmonmaintained higher rates of oxygen consumption than control fish. Both transgenic andnon-genetically modified Atlantic salmon exhibited depression in average oxygenconsumption rate when subjected to starvation conditions. As the oxygen consumptionof these fish is dependent on body weight, it is not surprising that a decrease in body
Ž .weight due to starvation would result in a concomitant reduction in the rate of oxygen

( )J.T. Cook et al.rAquaculture 188 2000 47–63 53
Ž . Ž .w xFig. 1. Oxygen consumption rate mg O rh in relation to initial body weight g day s0 and duration of2Ž . Ž . Ž .starvation days of transgenic Atlantic salmon open triangles and controls solid circles . Data is presented
Ž . )with fitted multiple regression mesh plane and the symbol ‘ ’ depicting axis interception by regressionplane.

( )J.T. Cook et al.rAquaculture 188 2000 47–6354
Table 2Ž . Ž .Oxygen consumption rate ‘Y ’ mgrh in relation to initial wet body weight ‘BW’ g and duration of
Ž .starvation ‘Time’ days of transgenic and non-genetically modified Atlantic salmon where: Y s b q b =BW0 1
qb =Time and ‘b ’, ‘b ’ and ‘b ’ are regression coefficients2 0 1 2
2Experimental group b b b r0 1 2
Control 0.814 0.111 y0.031 0.97Transgenic 2.423 0.193 y0.122 0.82
Ž .Regression coefficients in the same column between the two experimental groups are significantly differentŽ .P -0.05 .
consumption. However, in both experimental groups, the subsequent level of oxygenconsumption was lower than observed in fish of comparable body weight measured in apost-absorptive state. The transgenic fish, although maintaining higher oxygen consump-tion than control fish at most measured body weights, displayed a more rapid decline inoxygen consumption over the period when food was withheld. The elevated oxygenconsumption observed in the food-deprived transgenic salmon relative to control fish is
Ž .probably not entirely due to their greater activity as Stevens et al. 1998 also recordedhigher metabolic rates under conditions of controlled swimming.
A commonly observed response by fish during periods of food shortage is ametabolic depression, as reflected by lower oxygen consumption rates. Mehner and
Ž .Wieser 1994 reported that the average rate of oxygen consumption in small perchŽ . Ž .Perca fluÕiatilis 3–4 g decreased when subjected to 14 days without food. Similar
Ž .declines in oxygen consumption have been observed in juvenile plaice 30–60 gŽ . Ž . Ž . Ž .Jobling, 1980 and African catfish Clarias lazera 1–97 g Hogendoorn, 1983 .Determining the degree to which this response is adaptational or obligatory involvesconsideration of a number of factors. A decline in oxygen consumption may be aconsequence of lower activity by the fish in an ‘‘attempt’’ to conserve body energyreserves during periods of food shortage. However, a minimum of locomotor activityŽ .foraging behavior must be maintained as a trade-off to ensure location and capture of
Ž .prey should it become available. Hogendoorn 1983 noted that the metabolic expendi-Ž .ture of African catfish corrected for body weight decreased with length of food
deprivation, probably reflecting a decrease in fish activity. There may be a homoeostaticmechanism involving a ‘‘set point’’ that assesses stored energy reserves, the likely‘‘historic duration’’ of the food shortage, and determines what energy might be allocatedto activity. Because transgenic fish had an initial lower body energy content than controlfish and a higher oxygen consumption rate, this energy ‘‘set point’’ would have been
Ž .reached first by the transgenic fish irrespective of the influence of the transgene andmay explain why their rate of oxygen consumption declined more rapidly than that ofcontrol fish during the period of food deprivation.
4.2. Body composition
During food deprivation the two major body constituents, lipid and protein, havedifferential rates of mobilization with lipid initially being exploited as the main energy
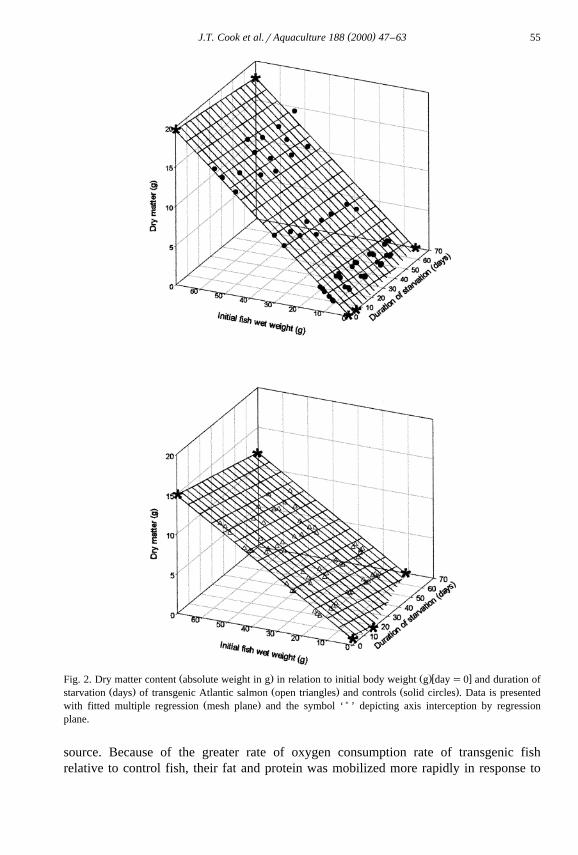
( )J.T. Cook et al.rAquaculture 188 2000 47–63 55
Ž . Ž .w xFig. 2. Dry matter content absolute weight in g in relation to initial body weight g day s0 and duration ofŽ . Ž . Ž .starvation days of transgenic Atlantic salmon open triangles and controls solid circles . Data is presented
Ž . )with fitted multiple regression mesh plane and the symbol ‘ ’ depicting axis interception by regressionplane.
source. Because of the greater rate of oxygen consumption rate of transgenic fishrelative to control fish, their fat and protein was mobilized more rapidly in response to
( )J.T. Cook et al.rAquaculture 188 2000 47–6356
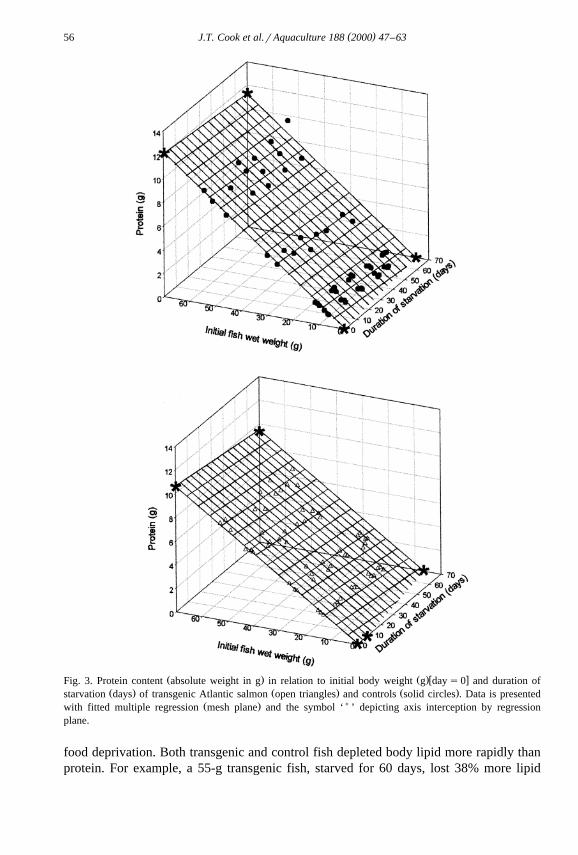
Ž . Ž .w xFig. 3. Protein content absolute weight in g in relation to initial body weight g day s0 and duration ofŽ . Ž . Ž .starvation days of transgenic Atlantic salmon open triangles and controls solid circles . Data is presented
Ž . )with fitted multiple regression mesh plane and the symbol ‘ ’ depicting axis interception by regressionplane.
food deprivation. Both transgenic and control fish depleted body lipid more rapidly thanprotein. For example, a 55-g transgenic fish, starved for 60 days, lost 38% more lipid

( )J.T. Cook et al.rAquaculture 188 2000 47–63 57
Ž . Ž .w xFig. 4. Lipid content absolute weight in g in relation to initial body weight g day s0 and duration ofŽ . Ž . Ž .starvation days of transgenic Atlantic salmon open triangles and controls solid circles . Data is presented
Ž . )with fitted multiple regression mesh plane and the symbol ‘ ’ depicting axis interception by regressionplane.
Ž .on a weight basis than protein; a similar size control fish lost 16% more lipid thanprotein. Consequently, when the weight of depleted lipid and protein for each experi-
( )J.T. Cook et al.rAquaculture 188 2000 47–6358
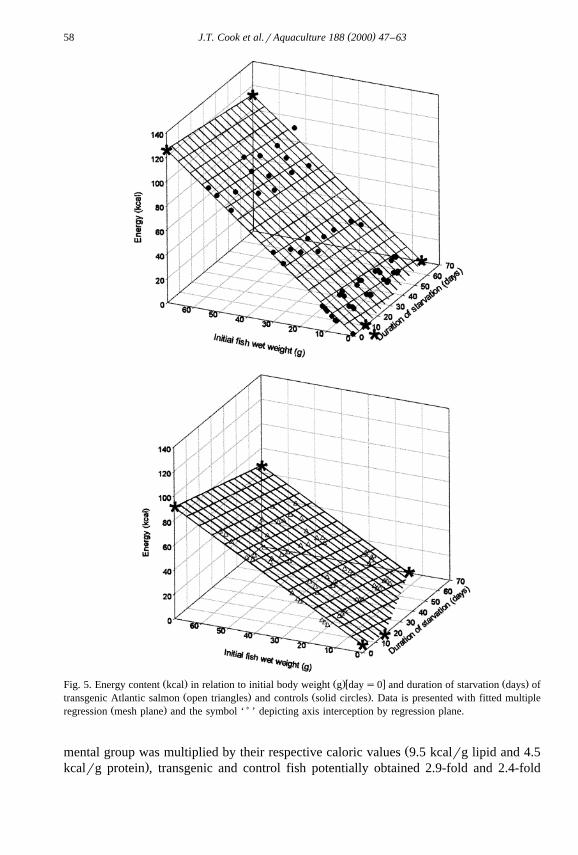
Ž . Ž .w x Ž .Fig. 5. Energy content kcal in relation to initial body weight g day s0 and duration of starvation days ofŽ . Ž .transgenic Atlantic salmon open triangles and controls solid circles . Data is presented with fitted multiple
Ž . )regression mesh plane and the symbol ‘ ’ depicting axis interception by regression plane.
Žmental group was multiplied by their respective caloric values 9.5 kcalrg lipid and 4.5.kcalrg protein , transgenic and control fish potentially obtained 2.9-fold and 2.4-fold
( )J.T. Cook et al.rAquaculture 188 2000 47–63 59
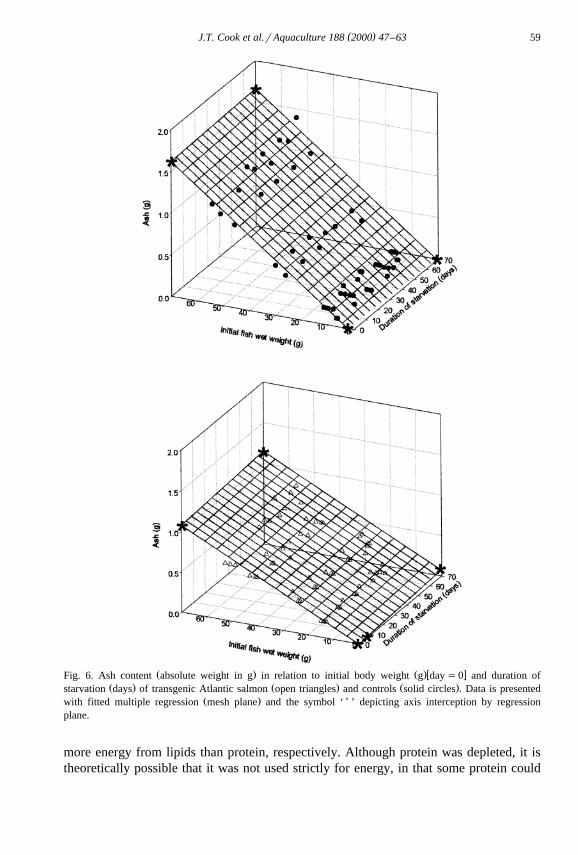
Ž . Ž .w xFig. 6. Ash content absolute weight in g in relation to initial body weight g day s0 and duration ofŽ . Ž . Ž .starvation days of transgenic Atlantic salmon open triangles and controls solid circles . Data is presented
Ž . )with fitted multiple regression mesh plane and the symbol ‘ ’ depicting axis interception by regressionplane.
more energy from lipids than protein, respectively. Although protein was depleted, it istheoretically possible that it was not used strictly for energy, in that some protein could
( )J.T. Cook et al.rAquaculture 188 2000 47–6360
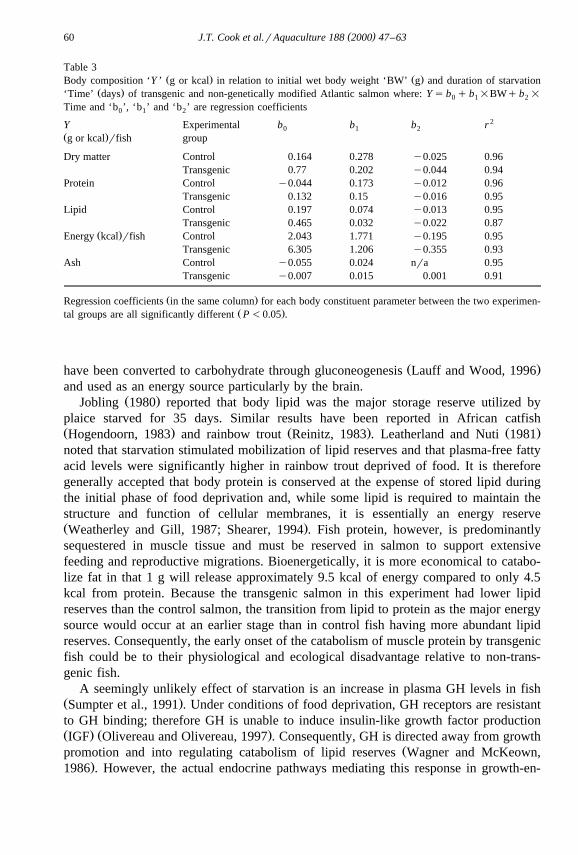
Table 3Ž . Ž .Body composition ‘Y ’ g or kcal in relation to initial wet body weight ‘BW’ g and duration of starvation
Ž .‘Time’ days of transgenic and non-genetically modified Atlantic salmon where: Y s b q b =BWq b =0 1 2
Time and ‘b ’, ‘b ’ and ‘b ’ are regression coefficients0 1 2
2Y Experimental b b b r0 1 2Ž .g or kcal rfish group
Dry matter Control 0.164 0.278 y0.025 0.96Transgenic 0.77 0.202 y0.044 0.94
Protein Control y0.044 0.173 y0.012 0.96Transgenic 0.132 0.15 y0.016 0.95
Lipid Control 0.197 0.074 y0.013 0.95Transgenic 0.465 0.032 y0.022 0.87
Ž .Energy kcal rfish Control 2.043 1.771 y0.195 0.95Transgenic 6.305 1.206 y0.355 0.93
Ash Control y0.055 0.024 nra 0.95Transgenic y0.007 0.015 0.001 0.91
Ž .Regression coefficients in the same column for each body constituent parameter between the two experimen-Ž .tal groups are all significantly different P -0.05 .
Ž .have been converted to carbohydrate through gluconeogenesis Lauff and Wood, 1996and used as an energy source particularly by the brain.
Ž .Jobling 1980 reported that body lipid was the major storage reserve utilized byplaice starved for 35 days. Similar results have been reported in African catfishŽ . Ž . Ž .Hogendoorn, 1983 and rainbow trout Reinitz, 1983 . Leatherland and Nuti 1981noted that starvation stimulated mobilization of lipid reserves and that plasma-free fattyacid levels were significantly higher in rainbow trout deprived of food. It is thereforegenerally accepted that body protein is conserved at the expense of stored lipid duringthe initial phase of food deprivation and, while some lipid is required to maintain thestructure and function of cellular membranes, it is essentially an energy reserveŽ .Weatherley and Gill, 1987; Shearer, 1994 . Fish protein, however, is predominantlysequestered in muscle tissue and must be reserved in salmon to support extensivefeeding and reproductive migrations. Bioenergetically, it is more economical to catabo-lize fat in that 1 g will release approximately 9.5 kcal of energy compared to only 4.5kcal from protein. Because the transgenic salmon in this experiment had lower lipidreserves than the control salmon, the transition from lipid to protein as the major energysource would occur at an earlier stage than in control fish having more abundant lipidreserves. Consequently, the early onset of the catabolism of muscle protein by transgenicfish could be to their physiological and ecological disadvantage relative to non-trans-genic fish.
A seemingly unlikely effect of starvation is an increase in plasma GH levels in fishŽ .Sumpter et al., 1991 . Under conditions of food deprivation, GH receptors are resistantto GH binding; therefore GH is unable to induce insulin-like growth factor productionŽ . Ž .IGF Olivereau and Olivereau, 1997 . Consequently, GH is directed away from growth
Žpromotion and into regulating catabolism of lipid reserves Wagner and McKeown,.1986 . However, the actual endocrine pathways mediating this response in growth-en-

( )J.T. Cook et al.rAquaculture 188 2000 47–63 61
Ž .hanced transgenic fish remain unclear. Although Hew et al. 1995 demonstrated thatwhile novel mRNA is being transcribed in a number of non-pituitary tissues in
Ž .transgenic fish, Du et al. 1992 reported that plasma GH levels in growing transgenicŽ .Atlantic salmon were not significantly higher than in controls. Devlin et al. 1994 ,
however, found GH levels in growing transgenic coho salmon to be 40-fold higher thanthose measured in their non-genetically altered counterparts. If the transgenic fish in thepresent study had elevated GH levels or greater rates of GH production compared tocontrol fish before being subjected to food deprivation, persistently high GH levelsduring deprivation could account for their higher rate of lipid catabolism.
The absolute ash content significantly increased with time of starvation in thetransgenic fish. This would be plausible if values were expressed as a percent of drymatter rather than as an absolute weight as was used in this experiment. However, it ishighly unlikely that food-deprived transgenic fish absorbed enough minerals from thesurrounding water to effect a significant rise of body ash. There is typically only 2% ash
Ž .per unit wet body weight in salmonids Shearer, 1994 and non-representative fishsamples likely account for this discrepancy.
During low winter temperatures, when food is scarce, and when transgenic salmonare also likely to have elevated metabolic rates compared to non-genetically modifiedsalmon, starvation might be so severe as to effect the probability of survival. Theparticular transgene construct used in the current study employs an antifreeze promotergene that normally drives the expression of an antifreeze gene to produce antifreeze
Ž .peptides which aid fish in resisting low water temperatures Fletcher et al., 1985 .Although entirely speculative, it is possible the antifreeze promoter may be responsiblefor producing GH in transgenic fish, particularly during the winter, resulting in a
Ž .disproportionate influence altered temperature coefficient on growth and metabolism.Under hatchery conditions where optimum to maximum rations are provided, there is
little need for fish to mobilize endogenous energy reserves. Although fed to satiationthree times per day prior to the onset of food deprivation, the transgenic fish had lowerfat reserves compared to the control fish, and in a natural environment, transgenicsalmon would likely have had even lower lipid stores than those observed under cultureconditions. Throughout the summer, when water temperatures are at their highest,juvenile salmon in fresh water territorially compete for forage consisting of aquatic and
Ž . Ž .terrestrial insects Scott and Scott, 1988 . Brett et al. 1969 found that fish reared atŽ .high temperatures )208C , where the maintenance energy requirement was highest,
were unable to consume enough energy to accumulate body lipid, and it is possible thatGH transgenic fish may be unable to secure sufficient food to meet their metabolic
Žrequirements at such elevated temperatures. Additionally, Abrahams and Sutterlin 1999,.in press demonstrated that juvenile transgenic salmon are more active than regular
salmon and, in an ‘‘attempt to satisfy’’ their enhanced appetite, are ‘‘willing to assume’’Ž .risk greater exposure to predators in order to obtain food.
There have been a plethora of studies on possible negative impacts of geneticintrogression or direct competition by selectively bred hatchery fish on wild populations.Based on the results of this study, transgenesis, combined with techniques of sterilityinduction, might provide aquaculturists with the means to circumvent the intermediarystages of potentially damaging fitness.

( )J.T. Cook et al.rAquaculture 188 2000 47–6362
5. Conclusion
The inability to secure enough food to meet basic energy requirements is a commonrisk even to poikilotherms which are noted for their tolerance to withstand extendedperiods of food deprivation. The metabolic response of fish to prolonged periods of fooddeprivation will significantly influence the prospects of survival. Although transgenicfish demonstrated the ability to reduce their rate of oxygen consumption duringstarvation as observed in the non-transgenic salmon, their persistence in maintaining ahigher metabolic and carcass depletion rate, combined with their lower endogenousenergy reserves, suggests that the probability of growth-enhanced transgenic salmonachieving maximum growth or even survival outside intensive culture conditions may belower than that of non-genetically modified salmon.
Acknowledgements
Ž .This study was supported by the National Research Council of Canada IRAP ; inaddition, financial support was provided by ArF Protein Canada, the parent company ofAquaBounty Farms. I would also thank Lisa Hynes and Leah Poirier who aided in datacollection and care of fish. The assistance of Drs. Gavin Richardson and Don Stevens inreviewing this manuscript prior to submission is appreciated.
References
Abrahams, M.V., Sutterlin, A., 1999. The foraging and anti-predator behaviour of growth enhanced transgenicAtlantic salmon. J. Anim. Behav., in press.
Ž .Association of Official Analytical Chemists AOAC , 1990. Official Methods of Analysis. 15th edn. AOAC,Arlington, VA.
Bligh, E.G., Dyer, W.J., 1959. A rapid method of total lipid extraction and purification. Can. J. Biochem.Physiol. 37, 911–917.
Brett, J.R., Zala, C.A., 1975. Daily pattern of nitrogen excretion and oxygen consumption of sockeye salmonŽ .Oncorhynchus nerka under controlled conditions. J. Fish. Res. Board Can. 32, 2479–2486.
Brett, J.R., Shelbourn, J.E., Shoop, C.T., 1969. Growth rate and body composition of fingerling sockeyeŽ .salmon Oncorhynchus nerka in relation to temperature and ration size. J. Fish. Res. Board Can. 26,
2363–2394.Ž .Cook, J.T., 1999. Bioenergetics of growth hormone transgenic Atlantic salmon Salmo salar reared under
simulated aquaculture conditions. MSc Thesis, Atlantic Veterinary College, University of Prince EdwardIsland, Canada, 138 pp.
Cook, J.T., McNiven, M.A., Richardson, G.F., Sutterlin, A.M., 2000a. Growth rate, body composition andŽ .feed digestibilityrconversion of growth enhanced transgenic Atlantic salmon Salmo salar . Aquaculture.
Cook, J.T., McNiven, M.A., Sutterlin, A.M., 2000b. Metabolic rate of presmolt growth enhanced transgenicŽ .Atlantic salmon Salmo salar . Aquaculture.
Devlin, R.H., Yesaki, T.Y., Blabi, C.A., Donaldson, E.M., Swanson, P., Chan, W.K., 1994. Extraordinarysalmon growth. Nature 371, 209–210.
Du, S.J., Gong, Z., Fletcher, G.L., Shears, M.A., King, M.J., Idler, D.R., Hew, C.L., 1992. Growthenhancement in transgenic Atlantic salmon by the use of an ‘‘all fish’’ chimeric growth hormone geneconstruct. BiorTechnology 10, 176–181.
( )J.T. Cook et al.rAquaculture 188 2000 47–63 63
Fletcher, G.L., Hew, C.L., Li, X., Haya, K., Kao, M.H., 1985. Year-round presence of high levels of plasmaŽ .antifreeze peptides in a temperate fish, ocean pout Macrozoarces americanus . Can. J. Zool. 63,
488–493.Hew, C.L., Fletcher, G.L., Davis, P.L., 1995. Transgenic salmon: tailoring the genome for food production. J.
Ž .Fish Biol. 47 Supplement A , 1–19.Ž .Hogendoorn, H., 1983. Growth and production of the African catfish, Clarias lazera C. and V. : III.
Bioenergetic relations of body weight and feeding level. Aquaculture 35, 1–17.Jobling, M., 1980. Effects of starvation on proximate chemical composition and energy utilization of plaice,
Pleuronectes platessa L. J. Fish Biol. 17, 325–334.Ž .Kates, M., 1972. Lipid extraction procedures. In: Work, T.S., Work, E. Eds. , Techniques of Lipidology.
North-Holland, Amsterdam, pp. 350–351.Lauff, R.F., Wood, C.M., 1996. Respiratory gas exchange, nitrogenous waste excretion, and fuel usage during
Ž .starvation in juvenile rainbow trout, Oncorhynchus mykiss. J. Comp. Physiol. 165 B , 542–551.Leatherland, J.F., Nuti, R.N., 1981. Effects of bovine growth hormone on plasma FFA concentrations and
liver, muscle and carcass lipid content in rainbow trout, Salmo gairdneri Richardson. J. Fish Biol. 19,487–498.
ŽMehner, T., Wieser, W., 1994. Energetics and metabolic correlates of starvation in juvenile perch Perca.fluÕiatilis . J. Fish Biol. 45, 325–333.
Olivereau, M., Olivereau, J.M., 1997. Long-term starvation in the European eel: effects and responses ofŽ . Ž .pituitary growth hormone- GH and somatolactin- SL secreting cells. Fish Physiol. Biochem. 17, 261–269.
Reinitz, G., 1983. Relative effect of age, diet, and feeding rate on the body composition of young rainbowŽ .trout Salmo gairdneri . Aquaculture 35, 19–27.
Scott, W.B., Scott, M.G., 1988. Atlantic fishes of Canada. Can. Bull. Fish. Aquat. Sci. 219, 731 pp.Shearer, K.D., 1994. Factors affecting the proximate composition of cultured fishes with emphasis on
salmonids. Aquaculture 119, 63–88.Shears, M.A., King, M.J., Goddard, S.V., Fletcher, G.L., 1992. Gene transfer in salmonids by injection
Ž .through the micropyle. In: Hew, C.L., Fletcher, G.L. Eds. , Transgenic Fish. World Scientific, Singapore,pp. 44–60.
Stevens, E.D., Sutterlin, A., Cook, T., 1998. Respiratory metabolism and swimming performance in growthhormone transgenic Atlantic salmon. Can. J. Fish. Aquat. Sci. 55, 2028–2035.
Sumpter, J.P., Le Bail, P.Y., Pickering, A.D., Pottinger, T.G., Carragher, J.F., 1991. The effect of starvationon growth and plasma growth hormone concentrations of rainbow trout, Oncorhynchus mykiss. Gen.Comp. Endocrinol. 83, 94–102.
Ž .Thorpe, J.E., 1977. Bimodal distribution of length of juvenile Atlantic salmon Salmo salar L. under artificialrearing conditions. J. Fish Biol. 11, 175–184.
Thorpe, J.E., Morgan, R.I.G., Ottaway, E.M., Miles, M.S., 1980. Time of divergence of growth groupsbetween potential 1q and 2q smolts among sibling Atlantic salmon. J. Fish Biol. 17, 13–21.
Wagner, G.F., McKeown, B.A., 1986. Development of a salmon growth hormone radioimmunoassay. Gen.Comp. Endocrinol. 62, 452–458.
Weatherley, A.H., Gill, H.S., 1987. The Biology of Fish Growth. Academic Press, London, 443 pp.