edexcel gcse geography b - newcollege.leicester.sch.uk€¦ · edexcel gcse geography b ... with...
TRANSCRIPT

Edexcel GCSE Geography B
Practical support to help you deliver this Edexcel
specification
Edexcel GCSE Geography B offers an issues-based approach to content and assessment, with the content split by global and UK scale. As with all GCSEs,
teaching takes 120 guided learning hours over two years. This document provides a topic guide for teaching Topic 5: The UK’s evolving human landscape, and can be adapted by centres to fit their own contexts and teaching styles. It has been
produced as an example approach and is not intended to be prescriptive. The topic guides indicate resources that you can use to support your teaching. These are only
suggestions and you are encouraged to use a wide range of resources to suit the needs of your own students.
The advised teaching time for Topic 5 is approximately 16 guided learning hours. This requires some blending together of the detailed content. In the guidance below,
suggestions are made about contextualisation or stretch challenges that may be suitable for more able students, as well as expected lesson outcomes for those less
able. Please note that these are suggestions only and not specific syllabus requirements.
The two- and three-year course planners suggest appropriate times to introduce this material. For example, in centres studying over three years, it is suggested that
centres following the integrated approach cover the content for EQ1 in the second part of the summer term of Year 9 and EQ2 content in the summer term of Year 10.
If following the three-year linear approach, the content for this topic should be covered in the later part of the autumn term in Year 10 and continued into the spring term of Year 10. If centres are doing the two-year course and following the
integrated approach, Topic 5 could be taught in the spring term of Year 10. The two-year linear approach also suggests that this topic should be taught in the spring term
of Year 10. This will allow for related fieldwork to be carried out in the summer term.
Enquiry question 1 is broken down into five one-hour sections, and Enquiry question 2 into 11 one-hour sections. Each begins with a quick overview of the breadth of the
enquiry question, followed by a more detailed explanation of the key concepts and processes, examples of teaching strategies, guidance on integrating geographical skills, and a summary of the key terminology required. The structure is suggestive,
not prescriptive.
Synoptic linkages and case study nesting
It is suggested that you select a case study that complements the located
examples in Topic 4. For example, if you study London as your chosen major city, you could use the River Thames as a located example in the river processes and
pressures sub-topic in Key idea 4.7b: the interaction of physical and human processes causing river flooding on one named river. There are synoptic linkages to develop and make with Topic 2 and Topic 3 in
Component 1 while teaching this topic, for example:

2 © Pearson Education Ltd 2016. Copying permitted for purchasing institution only. This material is not copyright free.
Key idea 2.1b: how countries at different levels of development have
differences in demographic data. Key idea 2.5b: where concepts such as globalisation and TNCs and FDI overlap
with themes in this topic. In Topic 3 Key idea 3.2b: why urban economies are different in developed and
developing and emerging countries. Key idea 3.3: how cities change over time and how this is reflected in changing
land use, can be revisited in this topic.
Key idea 3.4b: looking at city structure and urban zones.

© Pearson Education Ltd 2016. Copying permitted for purchasing institution only. This material is not copyright free. 3
Topic Booklet for Component 2, Topic 5: The UK’s evolving human landscape
Introduction
Quick overview
This topic starts with an overview of the changing and varied human landscape of the UK. This is followed by a more detailed case study of a dynamic UK city. These key ideas are studied around two enquiry questions:
EQ1: Why are places and people changing in the UK?
EQ2: How is one major UK city changing?
The aim of this topic guide is to gain an overview of the changes to the UK’s
population, economic activities and settlements over the last 30 years. This is followed by a detailed case study of one major city in the UK and its accessible rural areas. A major city is defined as a city with a population of at least 200,000
inhabitants. Links can be made with themes studied in Component 1: in Topic 2, Development dynamics and in Topic 3, Challenges of an urbanising world.
Things to bear in mind:
1) The right level of detail of the overview content. The population dynamics and the changing economy topics have gone, but students are required to know
about: the issues and variation of the UK’s population in terms of density, age
structure and economic activity between urban and rural areas and how
government policies are trying to address these how the UK has been affected by national and international migration
the changes to the UK’s economic sectors the role of globalisation, free trade policies, privatisation, FDI and TNCs.
Note that content covered in this overview section for EQ1 will not be assessed with any extended writing questions of 8 marks. Content for EQ1 will be
limited to questions of up to 4 marks.
2) The depth needed for the case study of one major UK city. Students will need
to have a thorough knowledge of one major UK city: its location, structure, the changes it has experienced as a result of migration and industrial change
and its relationship with nearby rural settlements. 3) The content covered in this topic will form the theoretical basis of the human
environment fieldwork in Topic 6: investigating dynamic urban areas or investigating changing rural areas. It is suggested that centres start to
consider the fieldwork tasks for Topic 6 during this topic, to help contextualise the ideas, and that time is taken to explore and devise the geographical
investigation enquiry questions, to cover how and where data could be collected and to go out and collect the data.

4 © Pearson Education Ltd 2016. Copying permitted for purchasing institution only. This material is not copyright free.
Enquiry Question 1: Why are places and people
changing in the UK? Teaching approach over 5 hours
Lesson 1 (1hr) The differences between rural and urban areas of the UK
Lesson 2 (1hr) The role of government policies and strategies in rural and urban
settlements in the UK
Lesson 3 (1hr) How and why is the UK’s population changing?
Lesson 4 (1hr) The changing UK economy
Lesson 5 (1hr) The UK and the global economy
Lesson 1: The differences between rural and urban areas of
the UK
Overview
The first lesson could tackle the first part of Key idea 5.1a so that students know the main characteristics and differences between urban core and rural settlements, in
terms of population density and structure and economic activities. • More able students could explore the differences between urban areas, especially
how London the primate city differs to other urban areas and also how rural areas can differ.
• Less able students should know the major urban areas and that these are densely populated areas with more economically active people living in them, and where there are more job opportunities, and how this contrasts with sparsely populated
rural areas, which have a more ageing population and fewer job opportunities.
Key concepts and processes
Students need to know: where the main urban areas in the UK are, for example Greater London, West
Midlands (Birmingham), Greater Manchester, Central Clydesdale (Glasgow)
Merseyside, Leeds that conurbations have high population densities, at over 600 people per km2
that within the urban core areas, the population is more youthful than in the rural areas in the UK, with higher numbers of economically active people living there
how this is linked to there being more economic activities, especially in services
and manufacturing, and that therefore there are more employment opportunities in the urban cores.
Students should know that large parts of the south west, south and central Wales, northern England, Scotland and Northern Ireland are predominantly rural, with low
population densities of less than 90 people per km2. In contrast, rural areas have a
© Pearson Education Ltd 2016. Copying permitted for purchasing institution only. This material is not copyright free. 5
more ageing population, where many retired people have moved in and young people have left because of a lack of employment opportunities. The rural economy
is characterised by more primary industries in farming, forestry and fishing, many of which had encountered challenges and decline in recent years, and a seasonal
service industry linked to tourism. Many rural areas close to urban cores have become commuter settlements, where people live in the rural settlement but commute for work to nearby urban areas. This has created issues of declining
services and an increase in house prices.
The integrated skill of the use and interpretation of UK population pyramids from different time periods will help students gain a good understanding of the key concepts. The ONS website is a good port of call for census data and information on
the UK population.
Guidance on teaching
The 2011 map on page 4 of the ONS website could be used, alongside an atlas, to identify the major urban areas. Students could label copies of the map with the main
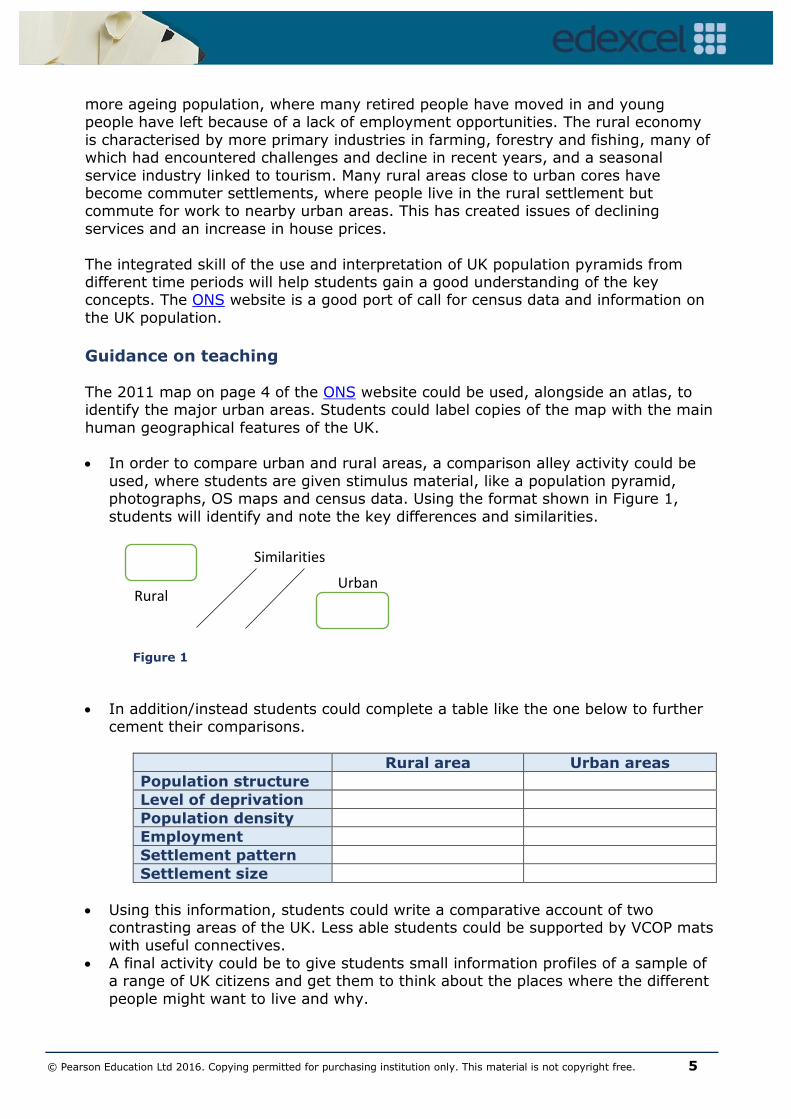
human geographical features of the UK. In order to compare urban and rural areas, a comparison alley activity could be
used, where students are given stimulus material, like a population pyramid, photographs, OS maps and census data. Using the format shown in Figure 1,
students will identify and note the key differences and similarities.
Figure 1
In addition/instead students could complete a table like the one below to further cement their comparisons.
Rural area Urban areas
Population structure
Level of deprivation
Population density
Employment
Settlement pattern
Settlement size
Using this information, students could write a comparative account of two contrasting areas of the UK. Less able students could be supported by VCOP mats with useful connectives.
A final activity could be to give students small information profiles of a sample of a range of UK citizens and get them to think about the places where the different
people might want to live and why.
Urban aread Rural
Similarities

6 © Pearson Education Ltd 2016. Copying permitted for purchasing institution only. This material is not copyright free.
Lesson 2: The role of government policies and strategies in urban and
rural settlements in the UK
Overview
The second lesson could tackle the rest of Key idea 5.1a in looking at how the UK and EU government policies have attempted to reduce the differences between the urban core and rural settlements.
More able students could dig deeper into some of the policies and evaluate their effectiveness.
Less able students should know that there are differences in wealth in urban and rural areas and that various government policies have been used to try and address this imbalance.
Key concepts and processes
Students will need to have an understanding of the different levels of government that exist within the UK (such as local, regional and national),
and of some of the different departments and schemes that work to address regional disparity across the UK. These include DEFRA, the Regional Growth Fund, Natural England, LFASS (Less Favoured Area Support Scheme),
Enterprise Zones and transport schemes such as the proposed HS2. Students will need to understand how the UK has been affected by EU
policies in urban areas, especially EU Regional Policy, and how this may change in the future.
A good source of information on this is: http://ec.europa.eu/regional_policy/en/policy/themes/urban-development/
It might be a good idea to look at a couple of examples of EU projects funded by EU grants, perhaps one that may be local to the students and one that is
linked to the major city in their case study. Students could also look at how rural areas have been affected by the CAP
and reforms of CAP.
Guidance on teaching
Students will need to establish where in the UK are the areas most in need of government assistance. A good source of data and graphics on this is: http://webarchive.nationalarchives.gov.uk/20160105160709/http://www.ons
.gov.uk/ons/dcp171778_388340.pdf
The map on page 4 here is taken from this site. Students will need to use the population density map from lesson 1 to help them interpret this map and to establish that the wealthier areas are where the major urban cores are
located, especially London, and the poorer regions are predominantly rural areas such as Wales and Northumberland.
Following this you could have a short discussion on the reasons why this pattern exists, to generate a list of reasons why incomes in rural areas are
low. These will include: accessibility in peripheral areas, lack of employment

© Pearson Education Ltd 2016. Copying permitted for purchasing institution only. This material is not copyright free. 7
opportunities, depopulation, distance from markets and investors and challenging physical landscapes.
Government policy in the UK activity
This could be a card-sort exercise to produce a hierarchy of levels of government, to include the role of each level in improving low-income areas. In order to understand the strategies used to address the inequalities
between urban and rural, a market-place exercise could be set up, where various government schemes are outlined around the room and students go
round and find information on at least three schemes. They could be given a table like the one below.
Name of scheme
Where has it been implemented?
What were the aims of the
scheme?
How does it
work?
How effective has
it been?
Example schemes: Bridgewater in the south west benefited from RGF grants to open a
Mulberry factory. Details of this can found on: https://www.gov.uk/government/uploads/system/uploads/attachment_data/file/321133/bis-14-886-_regional_-growth-fund-information-
leaflet.pdf Teesside’s enterprise zone. Details of this can be found at:
http://www.middlesbrough.gov.uk/index.aspx?articleid=2873 Developing eco-friendly products for a low carbon economy in Beacon.
For homework, students could find out more about one of their schemes.
Websites
There are various government websites for teachers to dip into and select information for use within this lesson. http://webarchive.nationalarchives.gov.uk/20160105160709/http://www.ons
.gov.uk/ons/dcp171778_388340.pdf https://www.gov.uk/government/how-government-works
https://www.gov.uk/government/organisations/department-for-environment-food-rural-affairs https://www.mygov.scot/less-favoured-areas-support-scheme-lfass/
https://www.gov.uk/government/policies/regional-growth-fund http://ec.europa.eu/regional_policy/en/funding/erdf/
http://ec.europa.eu/agriculture/cap-post-2013/
8 © Pearson Education Ltd 2016. Copying permitted for purchasing institution only. This material is not copyright free.
Lesson 3: How and why is the UK’s population changing?
Overview
The third lesson should focus on Key idea 5.2a: how and why the UK’s population size, structure and distribution have been affected by internal migration and
international migration over the last 50 years. Look at how the UK and EU immigration policies have contributed to increasing ethnic and cultural diversity.
More able students could be given source material to find out whether this is just a UK trend.
Less able students should know about different types of migration, how these have changed in recent years and how they have affected the UK’s population.
Key concepts and processes
Students will need to be familiar with different types of migration, such as
internal migration, international migration (including emigration and immigration), and the types of migrant, i.e. economic, social, political. An
understanding of net migration will also be needed. A study of census data (integrated skill 2) will reveal that the UK has experienced an increase in the number of people who were born outside the UK. There has been a steady
increase in net migration in the UK in the last 25 years.
Further study of census data will reveal that many of the new arrivals into the UK over the last 50 years are people from New Commonwealth countries
such India and Pakistan, and EU countries such as Poland, Ireland and Germany.
It is also worth pointing out that people have also left the UK for other places including Australia, the USA and Spain.
Within the UK, one major trend over the last 50 years has been counter-urbanisation as a result of the net decrease in population of the major urban
areas like London and the net increase in population of more rural areas like the south west.
A quick look at the UK’s migration policies and the UK’s membership of the EU for the last 43 years has meant that since 1987 free movement of people
across Europe has led to increasing ethnic diversity within the UK.
Guidance on teaching The lesson could start with a migration classification exercise, exploring why people move.
See SAMs (1) Paper 2 Q5 for an example of a graph which could be used to show the population change in the different regions of the UK.
In order for students to analyse census data an information sheet could be
prepared with a series of graphs and maps, and tables of data from ONS. This could be given to students with a question sheet to draw out the main

© Pearson Education Ltd 2016. Copying permitted for purchasing institution only. This material is not copyright free. 9
trends. It will be important that the following graph is used to show the changes in migration in the UK over the last 40 years. Students could
generate a list of questions that could be asked from, for example, the graph found here. They could then question each other on this.
Students could be given information on the UK’s points-based system to do a short ‘passport-control’ exercise. Profiles of several contrasting potential
immigrants are given and students have to decide ‘who’s allowed in?’ according to the current UK policy.
For homework, students could tackle how migration has affected the population geography of the UK in terms of numbers, ages and diversity.
Students could make a poster or infographic to highlight/celebrate this.
Websites
http://webarchive.nationalarchives.gov.uk/20160105160709/http://www.ons
.gov.uk/ons/rel/migration1/migration-statistics-quarterly-report/february-2014/sty-ltim.html
The DataShine website reveals the length of residency in the UK:
http://datashine.org.uk/#table=QS803EW&col=QS803EW0003&ramp=YlOrR
d&layers=BTTT&zoom=14&lon=-2.6338&lat=53.5409
For a look at internal migration: http://www.ons.gov.uk/peoplepopulationandcommunity/populationandmigrat
ion/migrationwithintheuk/bulletins/internalmigrationbylocalauthoritiesinenglandandwales/2015-06-25
For a look at the UK’s points-based system: http://www.bbc.co.uk/news/uk-
politics-29594642
For a look at the UK’s ethnic diversity: http://www.ons.gov.uk/peoplepopulationandcommunity/culturalidentity/ethni
city/articles/ethnicityandnationalidentityinenglandandwales/2012-12-11
Lesson 4: The changing UK economy
Overview
The fourth lesson should focus on Key idea 5.2b by looking at how the decline in
primary and secondary sectors and the rise of tertiary sectors in urban and rural areas has altered economic and employment structure in contrasting regions of the
UK. More able students could explore the links with the economic changes in other
parts of the world and decide whether globalisation has been good or bad for
Britain. Less able students should understand that the UK economy has undergone a
change to a service-based economy.

10 © Pearson Education Ltd 2016. Copying permitted for purchasing institution only. This material is not copyright free.
Key concepts and processes Students will need to understand and be able to define and classify the different types of industries: primary, secondary, tertiary and quaternary.
They will need to know how the relative importance of these sectors has changed over the last 50 years in terms of jobs and wealth creation. A quick
look at how this fits with the Clark Fisher Model will show that throughout the later part of the 20th century, jobs in primary industries, especially mining and agriculture, have declined and now make up only a small amount of
employment in the UK. Reasons for this have included exhaustion of finite resources like coal, and a move away from the fossil fuels that cause high
CO2 emissions and mechanisation, which has made farming less labour-intensive and more efficient. Likewise, there has been a similar decline in secondary employment and output throughout the latter part of the 20th
century, as a result of the global shift in manufacturing to NICs.
In the same time period there has been a significant increase in the number of people working in service industries such as finance, and the contribution of the service sector to the UK economy has increased. Most recently, in the
last 20 years there has been the arrival and small growth in the quaternary sector. Industries like R&D in high technology are increasingly employing
more people and contributing to the UK economy. There may be opportunities to revisit content covered in Component 1, Topic
2: Development dynamics, to make comparisons with the economic structures of other countries such as China and India, in the context of
globalisation and the role of direct foreign investment and TNCs, which follows in the next lesson.
It will be necessary to contrast two regions of the UK in terms of their changing economy. For example, you could contrast the change around
London’s Docklands (from manufacturing to a centre of international finance) with the decline of the steel industry in Middlesbrough. Students do not need
to know examples, but using examples will help to make the contrast clearer.
Guidance on teaching You could start the lesson by doing a ‘When I grow up I want to be…’ activity, getting students to think about the type of work/job they would like to do
after completing their education. Consider what type of salary and working conditions they envisage this would involve and where in the world this job would be. After this you could define and classify a range of jobs from the
different economic sectors. A short class survey could list all the jobs done by parents, grandparents and
great-grandparents. Students could then try to classify these jobs and then analyse their results to see if there are any trends. This could be compared with the UK data.
Students could be given some data on the amount of people working in
different kinds of employment in the UK (e.g. agriculture, industry,
© Pearson Education Ltd 2016. Copying permitted for purchasing institution only. This material is not copyright free. 11
manufacturing) during different decades, and asked to use the data to create a graph.
There is an opportunity here to discuss and evaluate the best types of graphs
to use for this sort of data. Students will then be able to describe the changes that have occurred and compare these with the class survey. They could also compare with other countries, especially the emerging country
they studied in Topic 2.
It will be necessary to study the economies and employment structures of two contrasting regions of the UK, such as the north east and the south east. A good source of data for this is the ‘nomis’ website:
https://www.nomisweb.co.uk/reports/lmp/gor/contents.aspx, where you can find up-to-date data on the labour market from across the UK.
Websites
For economic data: https://www.cia.gov/library/publications/the-world-
factbook/geos/uk.html https://www.nomisweb.co.uk/reports/lmp/gor/contents.aspx
Lesson 5: The UK and the global economy
Overview
This lesson should focus on Key idea 5.2c on how globalisation, free trade and
privatisation have increased foreign direct investment and the role of TNCs in the UK economy. More able students could consider whether globalisation has been a good thing
for the UK. Less able students should understand the reasons why TNCs locate in the UK and
the role they play in the UK economy.
Key concepts and processes
There is an opportunity here to revisit and go over some of the key terms and concepts covered in Component 1, Topic 2: Development dynamics around
globalisation, FDI and TNCs. This can then be used to study how improvements in transport and communications, free-trade agreements and the removal of taxes and
tariffs and privatisation have led to a large rise of FDI in the UK. Students will need to understand how FDI can take the form of companies locating operations in the
UK, such as Nissan locating a car-assembly plant in the north east, or companies investing in or buying and taking over once British-owned businesses. An example of this could be the French-owned EDF investing in British nuclear power stations, or
British Airways / Iberia operating as a single carrier (IAG).
A study of the graph found here (labelled ‘UK Inward FDI stock – Major Source Countries’) shows the scale and countries involved in FDI in UK. Integrated skill 3 – use of Eurostat to investigate FDI will also reveal the main trends
in FDI within the EU.

12 © Pearson Education Ltd 2016. Copying permitted for purchasing institution only. This material is not copyright free.
It will be necessary to explore why FDI has increased in the UK in recent years. Reasons will include the pull of London as a global centre for finance, free-trade
deals with many countries across the world, membership of the EU and free trade across the EU member states, and government policies that have seen many
industries privatised and incentives offered to foreign investors. Finally, students will need to look at how the UK economy has been affected by
TNCs. It will be important to take a balanced view on this, in that TNCs create jobs and employment, often in areas that need employment, and they are able to inject
the capital investment for large-scale projects like building new nuclear power stations, which cost billions of pounds and often provide innovation in the form of new technology and business strategies. On the other hand, over-reliance on TNCs
can mean insecurity for the UK economy, in that economic problems overseas can affect operations in the UK. Also, TNCs often drive out local business because they
are able to out-compete them due to their advantage of scale.
Guidance on teaching
Globalisation activity – students could study a selection of foreign companies, for example Nissan, Tata Steel, AstraZeneka. Give students company profiles to study and give them headings so they can make their own fact files.
A silent debate could be used to discuss the influence of FDI in the UK. In groups,
students are given different-coloured pens to silently comment and respond to a discussion question about whether FDI is positive or negative for the UK economy. Students could use the points that arise from this to complete an exam-style
question on this.
Websites A good government resource on UK Inward Investment: https://www.gov.uk/government/publications/ukti-inward-investment-report-2014-to-2015/ukti-inward-investment-report-2014-to-2015-online-viewing
Eurostat resources: http://ec.europa.eu/eurostat/statistics-
explained/index.php/File:Foreign_direct_investment,_EU,_2010-13_(1)_(billion_EUR)_YB15.png

© Pearson Education Ltd 2016. Copying permitted for purchasing institution only. This material is not copyright free. 13
Key vocabulary for EQ1
Urban/Rural Economic Social
Urban core Conurbation Urban fringe
Rural Periphery
Population density Age structure Disparity
Accessibility Marginal area
Least favoured areas Decentralisation
Common Agricultural Policy Regional development
funds Counter-urbanisation
Economic activity Economic structure Employment structure
Enterprise zones Primary industry
Secondary industry Tertiary industry
Quaternary industry Deindustrialisation Region
Globalisation Free trade
Privatisation Foreign direct investment (FDI)
Transnational Corporation (TNC)
Global shift Transport infrastructure Subsidies
Grants Regional development
Tax incentives
Migration Immigration Net migration
Ethnicity Society
Cultural diversity Population distribution Population change
Depopulation
Enquiry question 2: How is one major UK city
changing? Teaching approach over 11 hours
Lesson 1 (1hr) Where is the major city located and how is it connected to the
wider world? What is it like?
Lesson 2 (1hr) How has the major city changed in recent years?
Lesson 3 (1hr) Why are there inequalities in the major city?
Lesson 4 (1hr) What are the challenges facing parts of the major city?

14 © Pearson Education Ltd 2016. Copying permitted for purchasing institution only. This material is not copyright free.
Lesson 5 (1hr) Why are some areas of the major city experiencing growth and
prosperity?
Lesson 6 (1hr) What strategies have been used to regenerate and rebrand the
major city?
Lesson 7 (1hr) How can quality of life in the major city be improved?
Lesson 8 (1hr) How is the major city connected to its local rural settlements?
Lesson 9 (1hr) How have local rural settlements changed?
Lesson 10 (1hr) What are the challenges faced by local rural areas?
Lesson 11 (1hr) How can quality of life in local rural areas be improved?
Lesson 1: Where is the major city located and how is it connected to
the wider world?
Overview
The first lesson could tackle Key idea 5.3a and b, so that students gain the context of where the city is sited and situated and how it is connected in a national, regional
and global context. Also, students must know the city’s structure in terms of its functions and variations in building age and density, land use and environmental quality.
More able students could start to appreciate that traditional urban patterns are changing as a result of some of the things they have studied in the overview
content. They can then assess whether the city conforms to any of the expected urban models.
Less able students should be able to describe the site and situation of the city and
the different land-use zones found there.
Key concepts and processes
It is suggested that the lesson should begin with an introduction of the major city, perhaps with some images and information about the city. The terms and concepts of site and situation will need to be covered. ‘Site’ refers to the location on which the
city is built. Factors determining the site of the city could be flatland, fertile land, proximity to water sources, a coastal harbour and nearby mountains. ‘Situation’
refers to the location of the city relative to its surroundings and other places. Factors to consider are accessibility and connections to other places and proximity to raw materials. Students should be able to analyse a range of different types of maps and
atlases to establish the specific details of the site and situation of their major city study.
The concept of connectivity could be explored by getting students to think about how cities are connected to other parts of the world. These should include transport and
communications, proximity to other places and the presence of global organisations (especially TNCs) in the city.

© Pearson Education Ltd 2016. Copying permitted for purchasing institution only. This material is not copyright free. 15
Functions of the city and the different land-use zones need to be established in this lesson. Students will need to be familiar with the different urban land-use zones,
namely the CBD, inner city, inner suburbs, outer suburbs and the rural-urban fringe. Students need to be able to identify these different zones by studying the variations
in building age and density, land use and environmental quality. Should this be the city you are using to carry out the human fieldwork, there could
be opportunities here to introduce the fieldwork and start to devise enquiry questions about the city.
Guidance on teaching
Site and situation exercise. Students will need OS maps of the city, an atlas, and
ideally Google Earth and other digital maps, in order to make statements about the site and situation of their case-study city. This could be done as a group exercise on two large pieces of paper, to which students will add factors. Once all
factors have been agreed and exhausted, students write up their own descriptions.
Land-use zones could be identified by means of a virtual field trip. If access to ICT is possible, a transect of the different land-use zones could be set up on Google Earth. Students would travel along the transect points, describing the
different characteristics of the buildings and features in each zone. A base map of the case-study city will be useful.
Homework could involve students being given some co-ordinates to look up in two contrasting areas of the case-study city and devising enquiry questions that
could be investigated for fieldwork.
Lesson 2: How has the major city changed in recent years?
Overview
In the second lesson you could tackle the Key idea 5.4a by studying the causes of
national and international migration that influence growth and character of the different parts of the city in terms of age structure, ethnicity, housing, services and culture.
More able students could discuss whether their city study has been changed more by national or international migration.
Less able students should know how and why the population has changed in the different parts of the city.
Key concepts and processes
Much of this lesson will revolve around census data for the major city being studied. A good source of data will be the ONS Neighbourhood Statistic website: https://www.neighbourhood.statistics.gov.uk/dissemination/
You can download the most recent census data for your city and use this to gather
data on population size, ethnicity, immigration (people born outside the UK) and various deprivation indicators on health, housing, education and qualifications. The focus of the lesson should be on change, so data will be needed that shows how the

16 © Pearson Education Ltd 2016. Copying permitted for purchasing institution only. This material is not copyright free.
population has changed over the last 30 years. These can be seen on the ONS interactive content:
http://webarchive.nationalarchives.gov.uk/20160105160709/http://www.ons.gov.uk/ons/interactive/index.html
It will be necessary to explain the changes. Population growth may be the result of reurbanisation and/or international immigration, because of the pull factors of job
opportunities and better education and health facilities.
It is suggested that students understand the concept of a choropleth map. It is likely that they will have used many choropleth maps whilst studying Geography, but they will need to have a deeper, critical understanding of how these are constructed and
when they should be used. Using the selected census data, students could construct their own choropleth maps, devising a suitable key and shading system. On final
analysis, students should be able to identify some trends from their choropleth maps (or from one the teacher made earlier!). Linking back to concepts from lesson 1, it is likely that students will find that higher numbers of ethnic minorities and people born
outside the UK will live in the inner city areas, where levels of deprivation are higher. The outer suburban areas are most likely to have more white British people living
there and are much less deprived.
There are strong links to the urban fieldwork tasks here, and students should be encouraged during this lesson to explore further the sort of enquiry questions, the types of sample areas and the data and methods that could be collected on a field
trip.
Guidance on teaching A ‘living graph’ activity could be done to show the population changes in the main
city area. This would involve outlining the experiences of different residents of
one street over several generations, plotted onto a population-change graph of the city.
Students could be given census data from selected wards from the major city area to construct a choropleth map. Different groups could use different
indicators, for example, one could show density of ethnicities, deprivation, people born outside the UK, and employment type.
Using the student maps or teacher-prepared maps, students will need to identify and analyse the main trends.
For homework, students could be given a photo of an urban fieldwork location
and asked to devise a method for measuring environmental quality and
comparing it with other areas.
A great resource to show how cities have developed over time is: http://maps.cdrc.ac.uk/#/geodemographics/oac11/default/BTTTFTT/12/-2.2013/53.4350/

© Pearson Education Ltd 2016. Copying permitted for purchasing institution only. This material is not copyright free. 17
Lesson 3: Where are the inequalities in the major city?
Overview
The third lesson should focus on Key idea 5.4b by exploring the reasons for different levels of inequality in employment and services, education and health in different
parts of the city. More able students could start to think more widely about the issues caused by
having wide disparities within one city, and what can be done to narrow this
disparity, linking this with the causes of deprivation. Less able students should know where the most and least deprived areas of the
major city are, and should be able to give reasons for this.
Key concepts and processes
This lesson should focus on the question ‘what makes a good quality of life for people living in the major city, and how does this vary?’ Once students have discussed what
they think makes a good quality of life, they should be asked to consider what deprivation is, what it means, and what are the best indicators of deprivation. This
might reveal smaller, higher density housing, poor educational qualifications, fewer professional workers, higher levels of unemployment. After this they be should be introduced to the concept of the Index of Multiple Deprivation (IMD). Integrated skill
(4). The IMD is explained well in the following government document: https://www.gov.uk/government/uploads/system/uploads/attachment_data/file/464
431/English_Index_of_Multiple_Deprivation_2015_-_Infographic.pdf
This explains how this is the official measure of deprivation for small areas and how it is a composite index using the following measures: income, employment, education, health, crime, housing, living environment.
Students should be able to locate their major city from the UK map of Multiple Deprivation and start to discover how deprived their major city is.
Students need to consider whether the level of deprivation will be same across the major city. If not, where might there be variations? In order to make comparisons
between small areas, the students will need to be familiar with the IMD explorer: http://dclgapps.communities.gov.uk/imd/idmap.html This will enable students to study the variations in deprivation in their major city.
They could identify two contrasting areas and describe the differences, and try to link this back to their choropleth maps from the previous lesson.
Students should be asked to consider why such inequalities exist. Reasons should include cheaper poor-quality housing in the inner city for immigrants and ethnic
minorities who also want to live closer to the CDB to be close to employment opportunities and services and may not have private transport. Poorer educational
achievement by children who may have English as a second language may mean fewer skills to gain high-paid employment, so they have to remain in the poorer parts of the inner city, where downward spirals of deprivation may exist.
Once again, there are strong links to the urban fieldwork tasks here, and students
should be encouraged during this lesson to explore further the sort of enquiry questions, the types of sample areas and the data and methods that could be collected on a field trip.
18 © Pearson Education Ltd 2016. Copying permitted for purchasing institution only. This material is not copyright free.
Guidance on teaching
Working in pairs or groups, students could cover the table with ‘jot thoughts’, by
writing ideas on sticky notes on what makes a good quality of life. The group will
then decide on the top nine ideas and rank them into a diamond rank.
Students then need to explore and discuss what deprivation means. A photo stimulus could be used to let students discuss this in groups, perhaps using talking chips, where each student is given two tokens to state two ideas about
what they think deprivation means.
If you have access to ICT, students could use IMD explorer and neighbourhood statistics to identify contrasting areas of deprivation in the major city. If there is
no ICT access, the teacher should produce data sheets and maps. In groups, students could try to list reasons for deprivation and perhaps share
these with the whole class through a ‘stand and share’ exercise. Once a list has been produced, students could be challenged to see if they can order them into a
cycle of deprivation.
Lesson 4: What are the challenges facing parts of the major city?
Overview
This should focus on Key idea 5.5a: how parts of the city have experienced decline (de-industrialisation, de-population), de-centralisation (out-of-town shopping
centres, retail and business parks), e-commerce, developments in transport. More able students could use a variety of sources, including historical maps and
sources, to investigate whether areas that had previously declined have changed
since.
Less able students should know where and why parts of the inner city and CBD
have declined in the major city.
Key concepts and processes This lesson should focus on how certain parts of the city have experienced decline in recent years. Students should look at how the inner city of the major city has
experienced decline as a result of de-industrialisation because of the global shift in manufacturing and the resulting de-centralisation and out-migration of wealthier
people to suburbs on the edge of the city and to nearby commuter settlements. Students should have an understanding of this from the earlier parts of this topic when they studied the UK economy in Key idea 5.2. The effects of this decline have
been abandoned factories, population decline, unemployment and environmental and social decline. Links should then be made to how this is a contributing factor to the
high levels of deprivation in this area. Students should also study how there has been some decline and challenges within
the CBD as a result of de-centralisation of retail, leisure and business to out-of-town sites. Reasons for this decline include the need for more space for larger retail units
and businesses, cheaper rents, a better environment and proximity to main transport

© Pearson Education Ltd 2016. Copying permitted for purchasing institution only. This material is not copyright free. 19
routes. A recent challenge faced by the high street in the CBD is many shops closing or downsizing in response to changing shopping habits and the rise of e-commerce,
as more people shop on the internet and in low-cost stores.
There may have been new transport developments within the major city, for example the tram metro link in Manchester. Often when there are new transport developments, economic activity is drawn to any new developments, displacing
activities from other parts and causing decline.
It will be necessary to use OS maps to help study these concepts and to identify the different land uses. Historical maps may be necessary if your major city has undergone recent regeneration.
Guidance on teaching
An OS map activity to identify areas of the city (CBD, inner city), where students
list evidence from maps, photographs and census data from the selected declining zones.
Using historical maps and/or photos, a spot-the-difference activity could be set up
to draw out the major changes that the city has undergone.
A card-sort exercise with events that have affected the different zones. Students sort cards into chronological order and locate them on a large map of the city.
Students consolidate this information by completing a table like the one below.
Map evidence
Photographic evidence
Census data
evidence
Reason for decline
Inner city
CBD
Lesson 5: Why are some areas of the major city experiencing growth?
Overview
This lesson should focus on Key idea 5.5b: how parts of the city have experienced
economic and population growth (sprawl on the rural-urban fringe, financial and business services, investment by trans-national corporations, gentrification/studentification, culture and leisure).
More able students could use a range of different sources of information to demonstrate urban sprawl, gentrification and studentification for a variety of
reasons. They could then discuss ‘who is most responsible for the growth of the city’.
Less able students should know where the rural-urban fringe is located and how and why there have been many new developments in recent years here and in other parts of the city where newcomers have moved in and improved the area.

20 © Pearson Education Ltd 2016. Copying permitted for purchasing institution only. This material is not copyright free.
Key concepts and processes
Students could use aerial photographs and OS maps to identify the location of the rural-urban fringe and the different land uses there. Development of this area has
created jobs and drawn people to live there, increasing the population.
Students should be familiar with the growth of service industries, especially finance and banking. They should look for evidence of this in their major city study.
Students will know how TNCs can affect an area from EQ1. They need to know of some of the global corporations located in their major city study, as well as the
reasons why they have located there and the impact they have had on the major city, e.g. AstraZeneca in Manchester.
The process of gentrification needs to be understood and identified in the major city study: wealthier people move into run-down low-cost areas, often in the inner city,
and renovate housing, drawing more aspirational people into the area, causing growth of that area, but often displacing the poorest people and problems into other
areas. Most large cities have universities and often experience growth as a result, firstly
because of the presence of students and secondly if highly skilled graduates remain in the city. Many university cities are now seeing the development of good-quality
student accommodation and services, and the growth and prosperity of these areas.
Guidance on teaching
It might be useful to have access to ICT for this lesson, so that students can
access digital maps and other digital resources. Alternatively, they could use an OS map and/or aerial photographs. In groups, they could identify the different
land uses at the rural-urban fringe. A close look on Street View (Google Maps) would allow students to analyse the age and quality of any developments in this area.
Students could contrast two areas, one from the rural-urban fringe and the other
from a declining inner-city area, and carry out environmental surveys and analyse demographic and economic data on the two areas. (Students could refer back to
the homework they may have done on this, and/or refer to the fieldwork here.) Analysis of property websites could allow students to compare residential areas
further.
Newspaper articles/websites showing new developments could be researched and students could be given the task of designing a promotional web page enticing people and investors into these parts of the city.

© Pearson Education Ltd 2016. Copying permitted for purchasing institution only. This material is not copyright free. 21
Lesson 6: What strategies have been used to regenerate and rebrand
the major city?
Overview
This lesson should focus on Key idea 5.6a: how regeneration strategies of the city
have positive and negative impacts on people (increased population, environmental quality and economic opportunities).
More able students could compare different regeneration schemes and evaluate their effectiveness.
Less able students should know of the positive and negative impacts one
regeneration scheme has had on the major city.
Key concepts and processes
Once the concepts of urban regeneration and rebranding have been established,
much will depend on the local case study and the regeneration strategies that have occurred there.
Regeneration is the process whereby areas that were once in decline start to grow and prosper again, often as result of redevelopment projects or gentrification.
Rebranding involves the creation of a new name, term, or image for a place. An urban area might be regenerated by an Urban Development Corporation (UDC), such as the London Docklands UDC, which transformed a run-down post-industrial area by
rebranding it, attracting investment from financial organisations and new housing into what is now a thriving area known as Canary Wharf.
It will be important to include an evaluation of the strategies. Students should weigh up the positives, negatives and alternatives for the different groups of people living
and working in the major city. There is a range of groups to consider: children, families, young economically active, retired, males, females, wealthy, poor, local,
newcomers.
Guidance on teaching
Students could set up and carry out a ‘key term taboo’ exercise. The key terms
associated with this lesson could be written on cards. Students then write underneath each key term, three words that they would use to define it. These
are put together so that groups can play ‘taboo’: a student describes the key term without using the words on the cards, and the rest of the group have to
guess the term.
A Positive/Minus/Interesting exercise could be done for a redevelopment scheme
in the major city, considering the views of different groups of people living in the city – a critical look at a redevelopment scheme in the major city, along the
following lines:
Children Young adults
Families Retired people
Positive

22 © Pearson Education Ltd 2016. Copying permitted for purchasing institution only. This material is not copyright free.
Interesting
Minus
This could lead on to a piece of extended writing using a PEEL writing frame.
Lesson 7: How can quality of life in the major city be improved?
Overview
This lesson should focus on Key idea 5.6b: the strategies aimed at making urban living more sustainable and improving quality of life in the city (recycling,
employment, green spaces, transport, affordable and energy-efficient housing). More able students could discuss whether sustainable lifestyles benefit all groups
in the city. Less able students should be able to discuss and evaluate a suitable sustainable
scheme for their city case study.
Key concepts and processes This lesson could start with a discussion on whether urban living is sustainable. Students should be familiar with the concept of sustainability from Component 1
Topic 3 Key idea 3.7. Remember that sustainable schemes should be long-term and do not negatively affect people, the economy and the environment.
The concept of carbon or ecological footprints could be introduced to demonstrate how much energy is consumed in urban areas. There are many websites that do
this; a good one is the WWF: http://assets.wwf.org.uk/downloads/city_footprint2.pdf
These discussions need to revolve around the major city case study. It may be necessary to look at some examples of sustainable schemes from around the world
in order for students to understand what is possible. These might include: London Congestion charge recycling and public transport in York
low-carbon living in BedZED, London.
Once the local problems have been established (i.e. a need to improve public transport, reduce waste, increase the use of renewable energy), suggestions on strategies for tackling these issues need to be made and developed. Students should
consider what citizens can do, what local government and national governments can do, and the the role of the EU. Clearly any schemes already in place within the major
city should be used.
Guidance on teaching Students could work in groups of up to four to produce ideas about ‘what is urban
sustainability?’ using a centre piece strategy: students sit around a table; each student has a blank sheet of paper and there is an extra sheet in the middle of
the table. Students take turns to say and write an idea on their paper and swap it
© Pearson Education Ltd 2016. Copying permitted for purchasing institution only. This material is not copyright free. 23
with the one in the middle. Ideas will build up on all the sheets, and students will end up with a list of ideas from the group.
A three-way Venn diagram could be used to sort students’ ideas into
social/economic/environment categories. Students could then see which of their ideas fall into the centre overlap.
A discussion on ‘is urban life sustainable?’, using talking chips, perhaps using some stimulus material, should draw out the main problems.
A look at some headlines and articles from the local press and websites could
draw out the main issues in the major city.
Using an information sheet with examples of urban sustainable schemes from
around the UK, students devise a sustainable scheme (which could be based on a real issue) for a bid for local funds.
Websites
http://pollutionfree.files.wordpress.com/2009/09/footprints1.jpg
http://assets.wwf.org.uk/downloads/city_footprint2.pdf
Lesson 8: How is the major city connected to its local rural settlements?
Overview
This lesson should focus on Key idea 5.7a: the city and accessible rural areas are interdependent (flows of goods, services and labour), which leads to economic, social
and environmental costs and benefits for both. More able students could debate ‘Does the city depend on its nearby rural areas
more than the rural areas depend on their neighbouring city? Less able students should understand what people and things move between the
city and nearby rural areas and the effects of this.
Key concepts and processes It is advised that you use accessible rural areas connected to the major city study for the case study. A good way of identifying these is to use interactive digital maps
produced by the CDRS: http://maps.cdrc.ac.uk/#/geodemographics/oac11/default/BTTTFTT/10/-2.4703/53.6319/
The main concept to be covered in this lesson is the two-way flows between urban
and rural areas of people (labour), and goods and services (money). People move from rural areas for employment, education and lifestyle reasons into urban areas,
but there is a counter-movement from urban areas into rural areas of people who want a more peaceful lifestyle. In terms of services, rural residents use urban services such as hospitals and universities, and urban residents travel to and use the
24 © Pearson Education Ltd 2016. Copying permitted for purchasing institution only. This material is not copyright free.
rural landscape for recreation. Much of the food consumed in urban areas comes from rural areas, but rural residents use urban areas to obtain consumer goods.
Costs and benefits
Rural residents can commute to urban areas and earn higher wages, but continue to enjoy a better quality of life in a rural area. Rural residents can also benefit from using centralised services such as hospitals. On the downside there has been
increased pressure on the rural-urban fringe and increased house prices in rural areas often push out locals.
If you are doing the ‘changing rural areas’ fieldwork in Topic 6, this would be a good time to introduce this and get students starting to think about the sort of
geographical investigative enquiry questions that could be asked and places to investigate.
Guidance on teaching
A ‘bidding wars’ game could be set up, where one group of students lists as many
things as possible that a city area gets from its nearby rural areas, while another group lists the benefits that the rural areas get from the urban area.
Students could complete a flow diagram by being given a series of statements about rural and urban areas to show the flows and transfers of people, money
and services. Students could complete a table like the one below, showing the effects of the
urban and rural flows.
Economic costs Social costs Environmental
costs
Rural
Urban
Students could complete a forcefield analysis, showing the flows from urban to rural on the left and from rural to urban on the right. Bigger and fatter lines are
drawn to show the extent of the force. An assessment could then be made about whether the forces going one way outweigh those going the other way.
Using the information in the flow diagram, students could answer the 4-mark
question in the SAMs (1) Paper 2 Question Q6(e). Students could peer-assess
using the mark scheme and give feedback and improve their answer.
Lesson 9: How have local rural settlements changed?
Overview
This lesson should focus on Key idea 5.7b: why a rural area has experienced economic and social changes (counter-urbanisation, pressure on housing, increased
leisure and recreation and population change) due to its links with the city. More able students could examine whether counter-urbanised areas provide
everything their new residents need.
Less able students should understand how a rural area has changed.

© Pearson Education Ltd 2016. Copying permitted for purchasing institution only. This material is not copyright free. 25
Key concepts and processes
One of the key themes of this lesson is the process of counter-urbanisation and how certain accessible rural areas have experienced growth in recent years as large
number of commuters have moved in, causing a rise in house prices. It will be necessary to use census data and maps so show how these changes have occurred.
Reasons for this are partly as a result of population change and the UK’s ageing population, many of whom are moving into accessible rural areas. Other changes could be changes in services. There has been a decline in some
essential services, e.g. post offices, petrol stations, banks, but a rise in leisure-related services.
Another issue to be explored is the rise of weekday ghost villages, where commuters
are away working in nearby urban areas, leaving the rural areas desolate during the week, but overrun at the weekend.
If doing the rural fieldwork option, it is advised you use the issues raised in the lesson to get students devising enquiry questions and data-collection methods, and
finding suitable sites to investigate.
Guidance on teaching
You could start with this cartoon (page 8) and get students to interpret the
message and the issues being represented. Students will need to study a variety of sources including census data, maps,
newspaper articles and house price data to identify trends and issues.
Using information provided by the teacher, students could produce a timeline of events to help explain the changes to the rural area being studied.
Lesson 10: What are the challenges faced by local rural areas?
Overview
This lesson should focus on Key idea 5.8a: the challenges of availability and
affordability of housing, decline in primary employment, provision of healthcare and education, and how they affect quality of life (IMD) for some rural groups (elderly
and young people). More able students could contrast different local rural areas to appreciate the
variations that exist in rural areas.
Less able students should understand that there is poverty in rural areas, what has caused this and how different groups are affected by it.
Key concepts and processes
From the previous two lessons, students should by now be familiar with the concept of why house prises have been rising in some rural areas. Perhaps you could spend more time exploring why this is an issue and challenge for people living in rural
areas, especially in terms of young people not being able to afford to buy a house and stay in the area. Many are force to move out of the area, leaving an ageing
population and a depleted workforce behind.

26 © Pearson Education Ltd 2016. Copying permitted for purchasing institution only. This material is not copyright free.
Linking back to EQ1, students need to be reminded of the decline in primary industry
and the pressure this creates on employment in rural areas. As with rising house prices, students should have an understanding of the decline in services in rural
areas at this point. Time should be spent exploring why this is a challenge for people living in rural areas.
Using the IMD, students can investigate the impact these challenges are having on the rural areas they have been studying. Students need an appreciation that there
are high levels of deprivation in some rural areas and that the challenges covered in the lesson reduce the quality of life for people living there.
If doing the ‘changing rural settlements’ fieldwork option Investigating how and why deprivation varies within rural areas in the UK, it will be important during this lesson
to cover how and where qualitative and quantitative fieldwork data should be collected.
Guidance on teaching
Produce a class word cloud of the issues/problems facing rural areas. You could
use the following website http://www.wordle.net
Students could select one issue to investigate and develop. They should try to
find out why the issue has occurred and the effect it is having on the different groups of people living in the area. Students could then exchange the key points
of their issues with a partner and other people in their group. Access to ICT would help students identify contrasting rural areas using the IMD
explorer: http://dclgapps.communities.gov.uk/imd/idmap.html
Introduce different characters from a rural-based radio soap opera like The Archers. Students then devise a script for a radio soap opera that highlights the challenges facing rural areas.
Lesson 11: How can quality of life in local rural areas be improved?
Overview
This lesson should focus on Key idea 5.8b: new income and economic opportunities are created by rural diversification (farm shops, accommodation, leisure activities)
and tourism projects, but these may have environmental impacts. More able students could judge whether life in rural areas is getting better or
worse.
Less able students should understand and know how rural areas can be improved through diversification and tourism projects.

© Pearson Education Ltd 2016. Copying permitted for purchasing institution only. This material is not copyright free. 27
Key concepts and processes
One key concept that students need to understand is that of farm diversification. This is a result of cheap imported food and pressure from supermarkets to keep food
prices down – many farmers can no longer make a living solely from producing food, so have been forced to find alternative ways of making money from their land. Some
have continued to farm alongside other businesses, for example farm shops and converting outbuildings into holiday lets; a good example is of this Low Sizergh Barn in Cumbria. Others have turned their farms into completely different businesses like
Holmescales in Kendal, where a farm has been converted into a corporate activity centre. Links could be made back to the role of the EU’s Common Agricultural Policy.
Other rural schemes such as the Eden Project and National Park schemes could also
be used to look how new opportunities have arisen in some rural areas. It will be important to evaluate all schemes studied and to focus especially on the environmental impact of any rural scheme studied.
Examples must be local to the major city.
The integrated skill of using OS maps to identify different land-use types will be necessary here.
Guidance on teaching Two rural schemes could be critically evaluated by using a De Bono’s ‘thinking hats’ exercise:
White hat
- facts and
information
Yellow hat
- good
points
Black hat - bad
points
Red hat - feelings
and emotions of people
involved)
Green hat - creative thinking:
what are the alternatives?
Blue hat - reflection: what else is
needed before a
conclusion is made?
Scheme 1
Scheme 2
This could lead to a piece of extended writing to evaluate the effectiveness of rural schemes using the PEEL framework:
Point – key idea identified Explanation – development of the point
Evidence – facts and figures to support the point Links – to the question or to other points.

28 © Pearson Education Ltd 2016. Copying permitted for purchasing institution only. This material is not copyright free.
Key vocabulary for EQ2
Urban/Rural Economic Social
Site
Situation Connectivity CBD
Inner city Suburbs
Rural-urban fringe Urban function Urban structure
Building age Housing density
Land-use zones Environmental quality
Pollution Green open spaces Quality of life
Services Urban growth
Urban zones Inequality Deprivation
Index of multiple deprivation
Urban decline Decentralisation Deindustrialisation
Depopulation Out-of-town shopping
centres Factory outlet shopping Retail park
Business park By-pass
Urban sprawl Natural environment Greenfield sites
Counter-urbanisation Urban sprawl
Suburbanisation Gentrification Leisure developments
Suburbanisation Reurbanisation
Rebranding Environmental impact
Economic investment
Employment Unemployment Employment change
e-Commerce Transport infrastructure
Primary employment Secondary employment Employment structure
Land ownership change Diversification
Tourism Development project
Job creation Multiplier effect Financial sector
Planning department Regeneration
Redevelopment TNCs Sustainability
Recycling Job creation
Public transport Park and ride Affordable housing
Energy-efficient housing Emission zone
Congestion charging Bicycle hire and lanes Green buildings
Accessible rural area Interdependence
Benefits Flow of goods/products Flow of services
Flows of labour/works Farming uncertainty
Land value change Commuting Housing supply
Leisure and recreation needs
Socio-economic background
Migration
Healthcare system Education system Car ownership
Housing affordability Housing availability
Healthcare provision Elderly population group Young population group
Young adult population group
Crime rate