lesson4greenhousegases climate and change edexcel gcse geography b
TRANSCRIPT

2.2a The Earths climate appears to be changing as a result of human activity,
and future climates are uncertain
To recognise and understand that human activities produce greenhouse gases
Specification Statement- What challenges might our future climate present us
with?

What is the message?

Name as many Greenhouse gases as you can:
• In order, Earth's most abundant greenhouse gases are:
b) water vapour c) carbon dioxide d) methane e) nitrous oxide f) ozone g) CFCs
• When these gases are ranked by their contribution to the greenhouse effect, the most important are:
2) water vapour, which contributes 36–72%
3) carbon dioxide, which contributes 9–26%
4) methane, which contributes 4–9%
5) ozone, which contributes 3–7%
How much does each contribute?


• Greenhouse gases greatly affect the temperature of the Earth; without them, Earth's surface would be on average about 33°C (59°F) colder than at present
• Human life would therefore not be possible

• Water vapour is the most abundant of the greenhouse gases, and is the dominant contributor to the natural greenhouse effect.
• Human activity has little direct impact on the concentration of water vapour in the atmosphere; however, changes in its concentration are an indirect result of climate feedbacks related to the warming of the atmosphere.
• As temperatures rise, more water evaporates from ground sources - rivers, oceans, etc. Because the air is warmer, the relative humidity can also be higher, leading to more water vapour in the atmosphere.
• Higher concentrations of water vapour are able to absorb more thermal infrared radiation from the Earth, further warming the atmosphere. The warmer atmosphere can then hold more water vapour, and the cycle continues.
• This is cycle is considered a positive feedback loop. However, uncertainty exists in both the extent and importance of this feedback loop. As water vapour increases in the atmosphere, more of it will also condense into clouds, which reflect incoming solar radiation away from the Earth's surface thereby becoming a cooling force.
Water Vapour

Carbon dioxide (CO2),
• Carbon dioxide is released into the atmosphere through both natural and human processes. Natural production and absorption of carbon dioxide is primarily through the biosphere and the oceans via the carbon cycle.
• Human activities such as fuel burning (coal, oil, natural gas, and wood), deforestation, cement production, and changes in land use have altered the natural carbon cycle by increasing the concentration of carbon dioxide in the atmosphere.
• Carbon dioxide was the first greenhouse gas found to be increasing in atmospheric concentration with conclusive measurements made in the last half of the 20th century.
• Carbon dioxide levels as a component of the atmosphere have increased nearly 30 percent beginning from the late 18th century to the present time, and is now at approximately 370 parts per million (ppm) and rising.
• Prior to industrialization, carbon dioxide levels fluctuated near 280ppm, with seasonal variations as vegetation drew down carbon dioxide in the spring and summer for photosynthesis, releasing it in the fall and winter through decomposition.

Methane (CH4)
• Which comes from both natural and human sources, is an extremely powerful warming agent - even more effective than carbon dioxide - however its lifetime in the atmosphere is brief, only about 12 years.
• In nature, methane is released through biological processes in low oxygen environments, such as swamplands.
• Human activities, including growing rice, raising cattle, using natural gas and coal mining, are increasingly adding to the level of methane in the atmosphere.
• As is sending waste to landfill sites• Since the beginning of the 19th century, methane levels have
risen 150 percent, though the pattern of methane emissions is highly irregular and, since 1990, has levelled off for reasons that are unclear.

Nitrous Oxide
• Otherwise known as "laughing gas," is a long-lived warming gas, persisting in the atmosphere for approximately 120 years.
• It is produced naturally from a wide variety of biological sources in both soil and water, particularly microbial action in wet tropical forests.
• Human-related sources of nitrous oxide include agricultural soil management, animal manure management, sewage treatment, combustion of fossil fuel, and the production of a variety of acids.
• It is also important to account for the various interactions between natural processes and human influences in the nitrogen cycle, since human impacts can significantly enhance the natural processes that lead to N2O formation.
• For example, fertilizer use and nitrogen-loaded runoff into waterways can enhance nitrous oxide emissions from natural sources.
• Concentrations of nitrous oxide began to rise at the beginning of the industrial revolution, although emissions have been somewhat difficult to quantify on a global scale, primarily because it is one of the least studied greenhouse gases to date.

Ozone • Ozone is a highly reactive molecule composed of three atoms of
oxygen. • Ozone concentrations vary by both geographic location and
altitude. • At lower levels in the trophosphere, ozone exerts a warming
force upon the atmosphere, primarily due to human processes. • Automobile emissions, industrial pollution, and the burning
of vegetation increase the levels of carbon and nitrogen molecules which - when reacting to sunlight - produce ozone, an important contributor to smog.
• Levels of ozone have nearly doubled since the 1800s, and have increased nearly 30 percent since the industrial revolution.
• In the stratosphere, a decrease in ozone concentration exerts a cooling force upon the atmosphere.
• Much of the decline in this stratospheric ozone can be attributed to the destructive action of CFCs.
• As ozone continues to contribute both the warming and cooling of the atmosphere, its role in the overall enhancement of the greenhouse effect will continue to be difficult to determine.

Halocarbons• Compounds of human origins used primarily as cooling
agents, propellants, and cleaning solvents in a broad range of applications.
• The most familiar type of halocarbons are the chlorofluorocarbons (CFCs); however, since it was discovered that they destroy stratospheric ozone, they are continuing to be phased out under the terms of the Montreal Protocol.
• Although levels of CFCs are declining, their long atmospheric lifetimes assure that they will continue to contribute to the greenhouse effect for some time.
• Another set of synthesized halocarbon compounds - created as substitutes to replace CFCs - are called HFCs (hydrofluorcarbons).
• While they are also greenhouse gases, they are less stable in the atmosphere and therefore have a shorter lifetime and less of an impact as a greenhouse gas.
• Also, at lower altitudes, halocarbons function as a warming gas; however, in the upper atmosphere, they exert a cooling impact through their interaction with ozone. Therefore, the ultimate impact of halocarbons on the greenhouse effect is highly uncertain.

Task Summarise the information about greenhouse gases into
a mind map, START OFF LIKE THIS-
GREENHOUSEGASES
METHANE
CARBON DIOXIDE
OZONE
NITRIOUS OXIDE HALOCARBONS
WATER VAPOUR
CFCs
HFCs
Released by swamps
Escapes from landfill


Summarise the main causes of GHG emissions detailed in the pie chart
• Describe the differences between the main source of emissions for the 3 main GHG

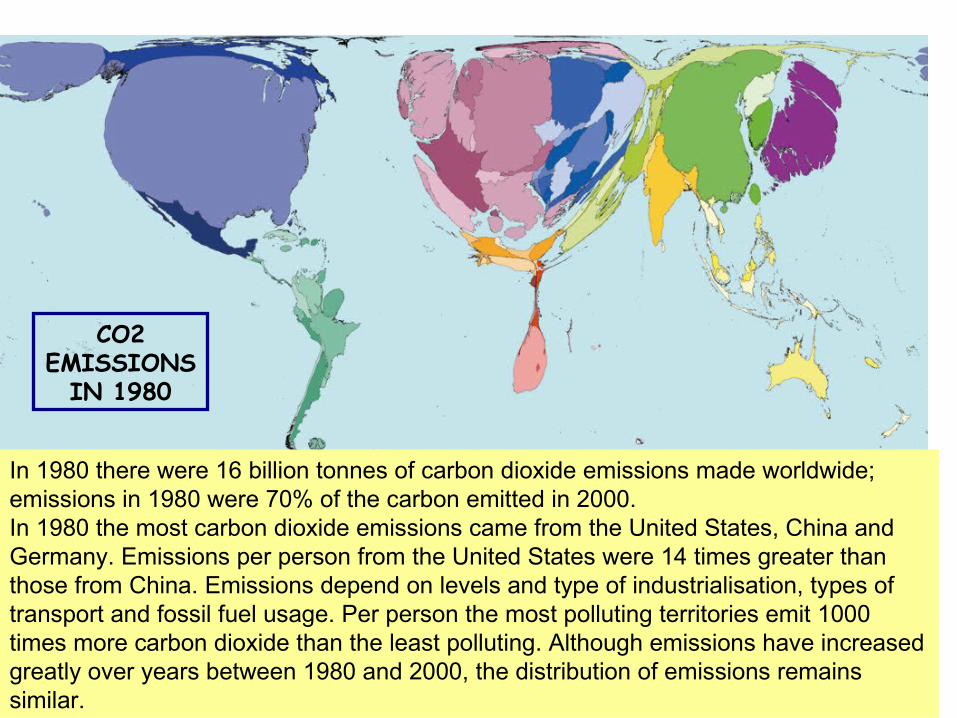
In 1980 there were 16 billion tonnes of carbon dioxide emissions made worldwide; emissions in 1980 were 70% of the carbon emitted in 2000.In 1980 the most carbon dioxide emissions came from the United States, China and Germany. Emissions per person from the United States were 14 times greater than those from China. Emissions depend on levels and type of industrialisation, types of transport and fossil fuel usage. Per person the most polluting territories emit 1000 times more carbon dioxide than the least polluting. Although emissions have increased greatly over years between 1980 and 2000, the distribution of emissions remains similar.
CO2 EMISSIONS
IN 1980

Carbon dioxide causes roughly 60% of the ‘enhanced greenhouse effect’ or global warming resulting from certain gases emitted by human activities. In 2000 there were almost 23 billion tonnes of carbon dioxide emitted worldwide. Of this, 28% came from North American territories; 0.09% came from Central African territories. Emissions of carbon dioxide vary hugely between places, due to differences in lifestyle and ways of producing energy. Whilst people living in 66 territories emitted less than 1 tonne per person in 2000; more than 10 tonnes per person were emitted by people living in the highest polluting 21 territories that year
CO2 EMISSIONS
IN 2000

Between 1980 and 2000, 72% of territories increased their emissions of carbon dioxide, totalling 6.6 billion tonnes a year. Other territories reduced their emissions by 1.9 billion tonnes a year.The biggest increases in carbon dioxide emissions over this period were in China, the United States and India. 42% of the world population live in these 3 territories, they caused 45% of the world increases. The per person increase in emissions from the United States was over 3 times larger than China’s, and over 4 times India’s.The largest increases in carbon dioxide emissions per person living there were in Qatar, then Bahrain.
CO2 EMISSIONS INCREASED 1980-2000

Between 1980 and 2000, roughly 58 territories decreased their annual carbon dioxide emissions. Together these territories reduced annual emissions by 1.9 billion tonnes; carbon emission increases from other territories were 3.5 times greater than this decrease.Almost half of the decrease was in territories formerly in the Union of Soviet Socialist Republics, followed by Germany at 15%, Poland at 8%, and France at 6%. Decline in industrial production and factory closure contributed to some decreases. Nevertheless, the Russian Federation emitted the third largest quantity of carbon dioxide in 2000.
CO2 EMISSIONS DECREASED 1980-2000
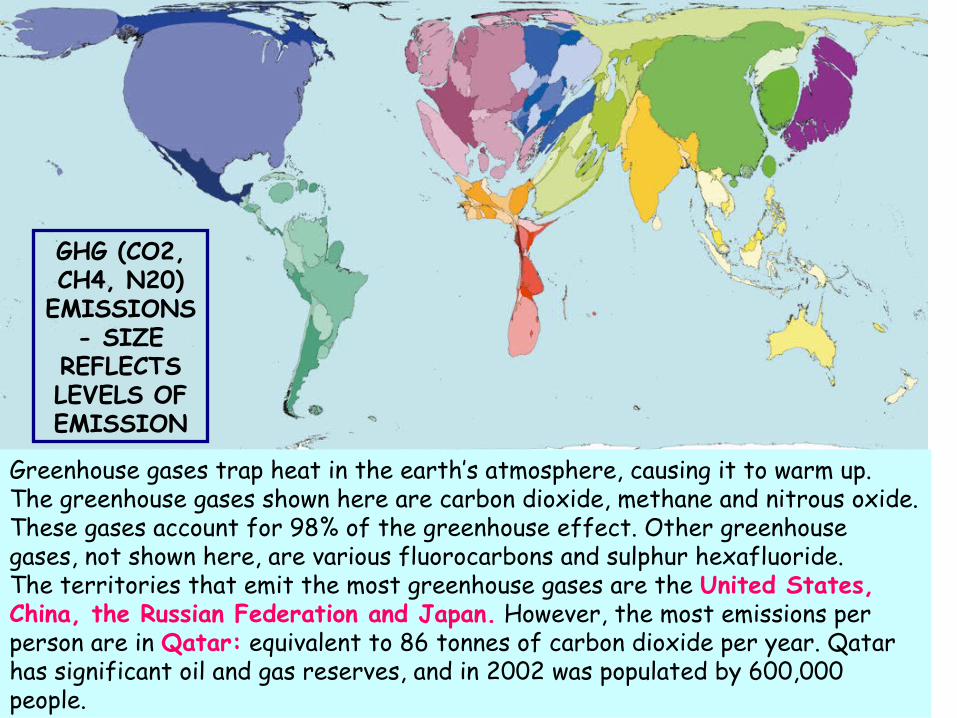
Greenhouse gases trap heat in the earth’s atmosphere, causing it to warm up. The greenhouse gases shown here are carbon dioxide, methane and nitrous oxide. These gases account for 98% of the greenhouse effect. Other greenhouse gases, not shown here, are various fluorocarbons and sulphur hexafluoride.The territories that emit the most greenhouse gases are the United States, China, the Russian Federation and Japan. However, the most emissions per person are in Qatar: equivalent to 86 tonnes of carbon dioxide per year. Qatar has significant oil and gas reserves, and in 2002 was populated by 600,000 people.
GHG (CO2, CH4, N20)
EMISSIONS- SIZE
REFLECTS LEVELS OF EMISSION

The main agricultural contributions to greenhouse gases are methane and nitrous oxide. Methane is produced by animals and their manure. Nitrous oxide is emitted from soil, particularly when nitrogen fertilizers are used. Each gas has a different potency, so weight alone does not indicate its effect. By weight, methane has 21 times and nitrous oxide 310 times the greenhouse effect of carbon dioxide.South America is the region with the highest carbon dioxide equivalent emissions of agricultural methane and nitrous oxide per person. The territory with the highest emissions per person is New Zealand, at the equivalent of 9.7 tonnes of carbon dioxide in 2002.
Methane and Nitrous Oxide EMISSIONS

Sulphur dioxide is released when fossil fuels containing sulphur are burned, the amount released is shown here. It is also emitted by volcanoes and forest fires. Sulphur dioxide is harmful to plants, animals and buildings. Sulphurous smog from coal fires can be fatal. When dissolved in atmospheric water sulphur dioxide becomes sulphuric acid, causing acid rain. Acid rain can damage forest and water-based ecosystems.In 2002, 97 million tonnes of sulphur dioxide were emitted by burning fuel worldwide. The highest emissions when expressed per person were in Bulgaria, the lowest were in the Democratic Republic of Congo.
Sulphur DioxideEMISSIONS
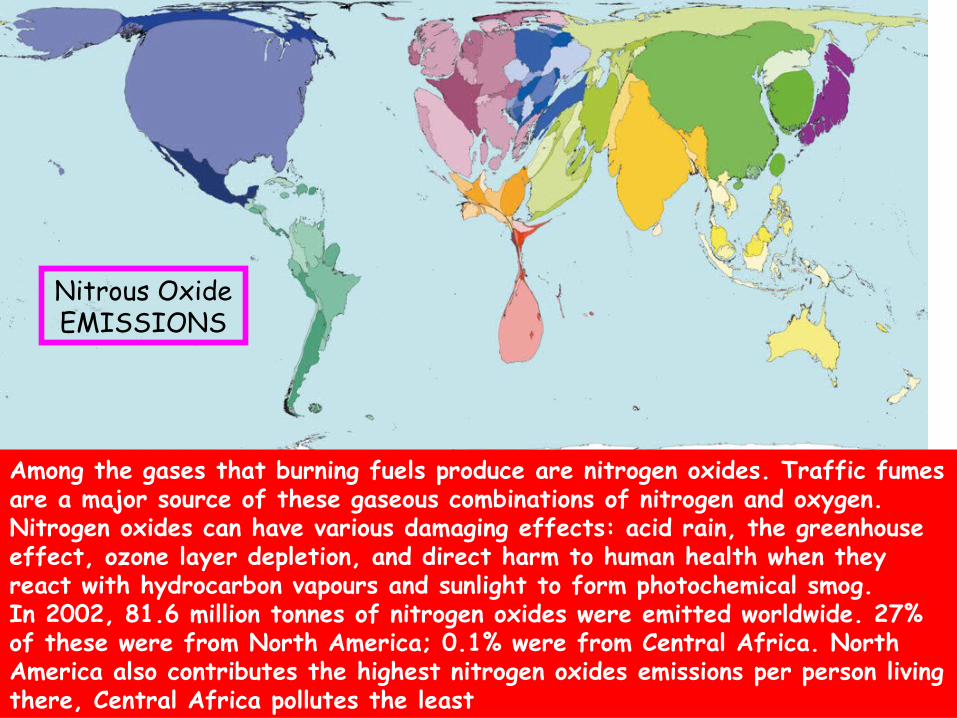
Among the gases that burning fuels produce are nitrogen oxides. Traffic fumes are a major source of these gaseous combinations of nitrogen and oxygen. Nitrogen oxides can have various damaging effects: acid rain, the greenhouse effect, ozone layer depletion, and direct harm to human health when they react with hydrocarbon vapours and sunlight to form photochemical smog.In 2002, 81.6 million tonnes of nitrogen oxides were emitted worldwide. 27% of these were from North America; 0.1% were from Central Africa. North America also contributes the highest nitrogen oxides emissions per person living there, Central Africa pollutes the least
Nitrous Oxide EMISSIONS

Chlorofluorocarbons, often abbreviated to CFCs, have two major negative environmental effects: they deplete the ozone layer and contribute to global warming. These chemicals have been used in industry, including refrigerators and dry cleaning. The Montreal Protocol, operative since 1989, was designed to phase out ozone-depleting substances. This map shows the estimated 110 thousand tonnes of CFCs emitted in 2002.The CFC map shows not where CFCs are produced, but where there are the most which have not been accounted for and presumably safely dealt with.
GHG (CFC) EMISSIONS-
SIZE REFLECTS LEVELS OF
UNACCOUNTED FOR
EMISSIONS

This map shows estimated carbon damage due to emissions. Carbon damage is estimated by the World Bank as being US$20 per tonne of carbon dioxide emitted. Another way to show carbon damage would be to show the variable costs incurred due to varying effects of carbon emissions. Carbon damage could also be measured in non-economic terms.One problem in showing carbon damage is that we do not yet know the precise form, distribution and severity of the damage from global warming. This map shows what a uniform financial fee for carbon emissions would be: 25% would be paid by the United States, 18% by China, and 11% by Western Europe.
CO2 EMISSIONS
DAMAGE
Task
• Which countries are the biggest contributors to CO2 emissions?• What about the other GHG? Sulphur dioxide, nitrous Oxide,
methane, ozone, halocarbons, etc • Which countries are being most damaged? Why?• Overall which countries are the biggest contributors to excess
GHG emissions?

Future scenarios
• Use the text book to draw a line graph showing the relationship between greenhouse gas emissions and global warming gas levels
• Annotate your graph to highlight the differing predictions that exist
• Try to explain why it is hard to predict future warming levels and levels of CO2 emissions