population change revision - edexcel geography gcse
DESCRIPTION
Notes for the Edexcel Geography GCSE regarding Population Change. This involves the One Child Policy from China and the Three or More Policy Singapore, two important case studies. Many other notes are provided too.TRANSCRIPT
Population Change RevisionBy Diane Stetcu
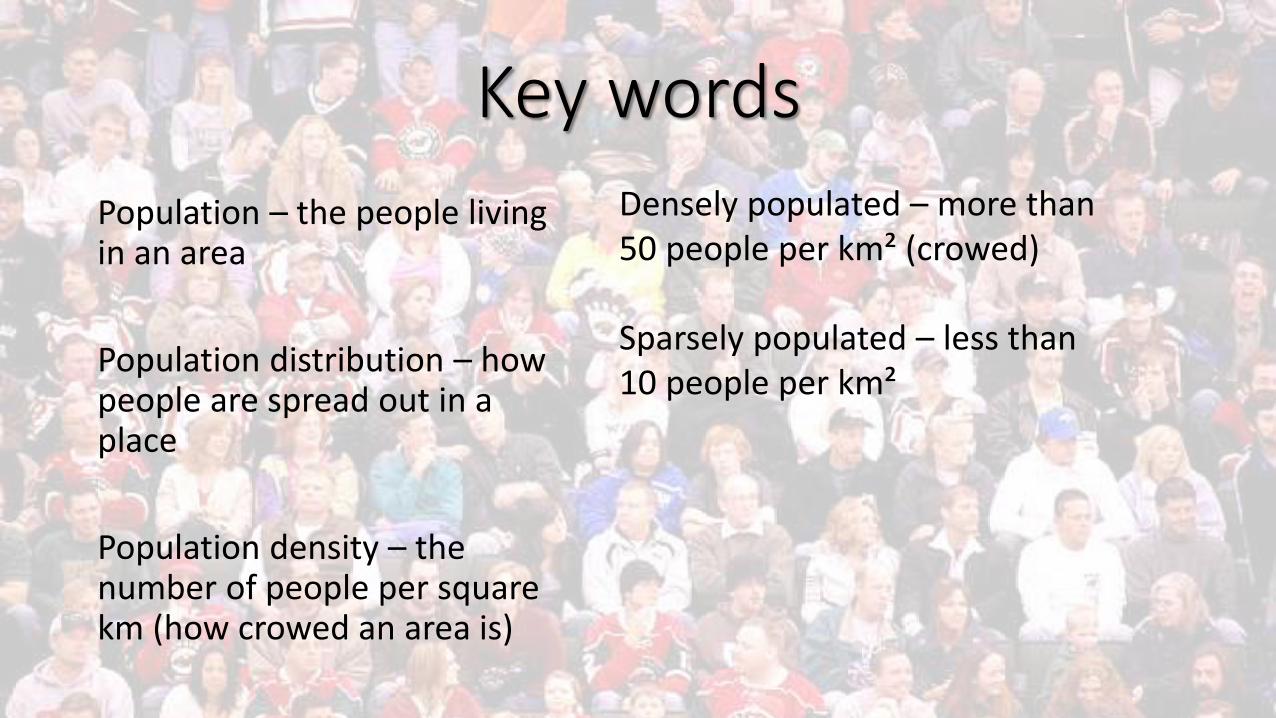
Key words
Population – the people living in an area
Population distribution – how people are spread out in a place
Population density – the number of people per square km (how crowed an area is)
Densely populated – more than 50 people per km² (crowed)
Sparsely populated – less than 10 people per km²
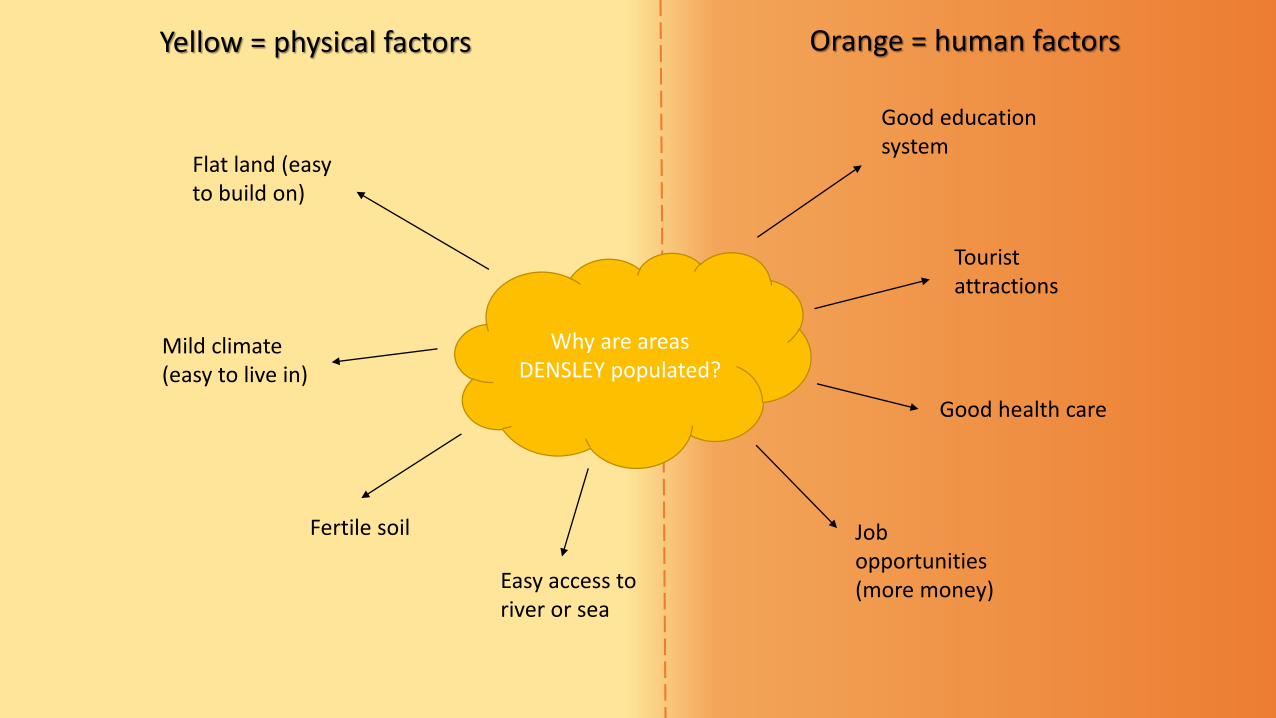
Why are areas DENSLEY populated?
Flat land (easy to build on)
Mild climate (easy to live in)
Fertile soil
Good education system
Tourist attractions
Good health care
Job opportunities (more money)Easy access to
river or sea
Yellow = physical factors Orange = human factors
So, why are areas sparsely
populated?
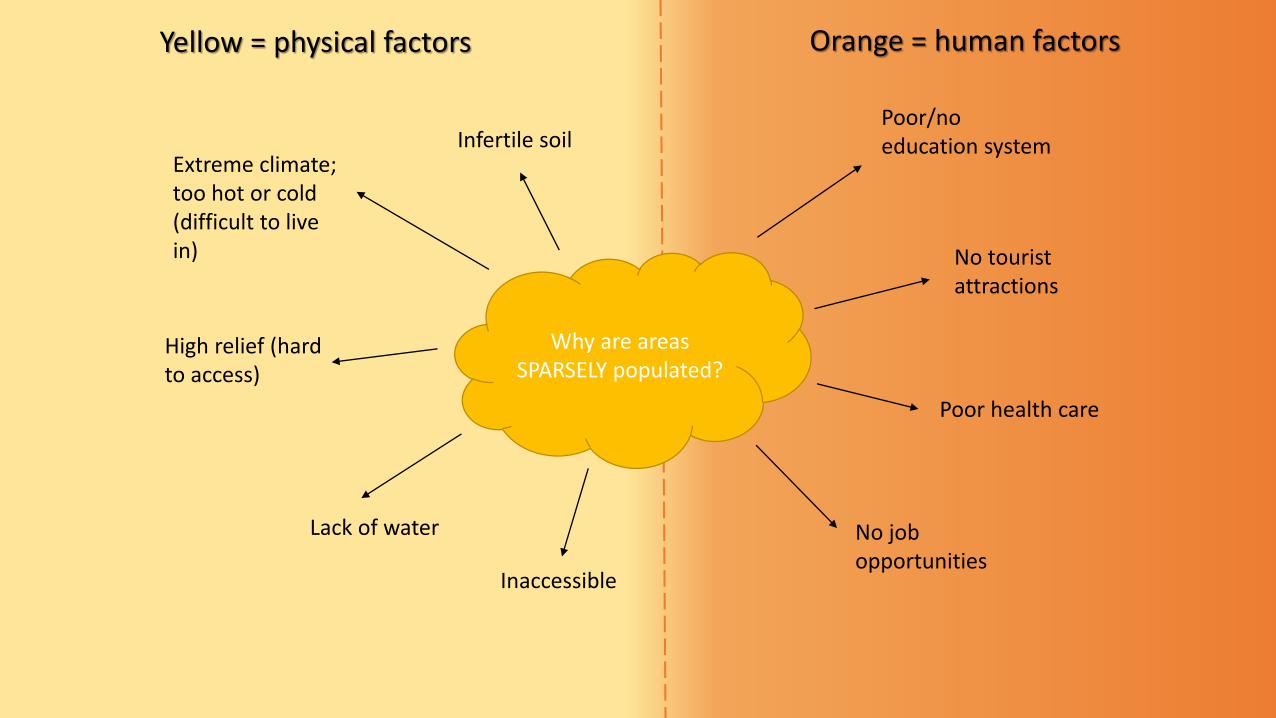
Why are areas SPARSELY populated?
Extreme climate; too hot or cold (difficult to live in)
High relief (hard to access)
Lack of water
Poor/no education system
No tourist attractions
Poor health care
No job opportunities
Inaccessible
Yellow = physical factors Orange = human factors
Infertile soil
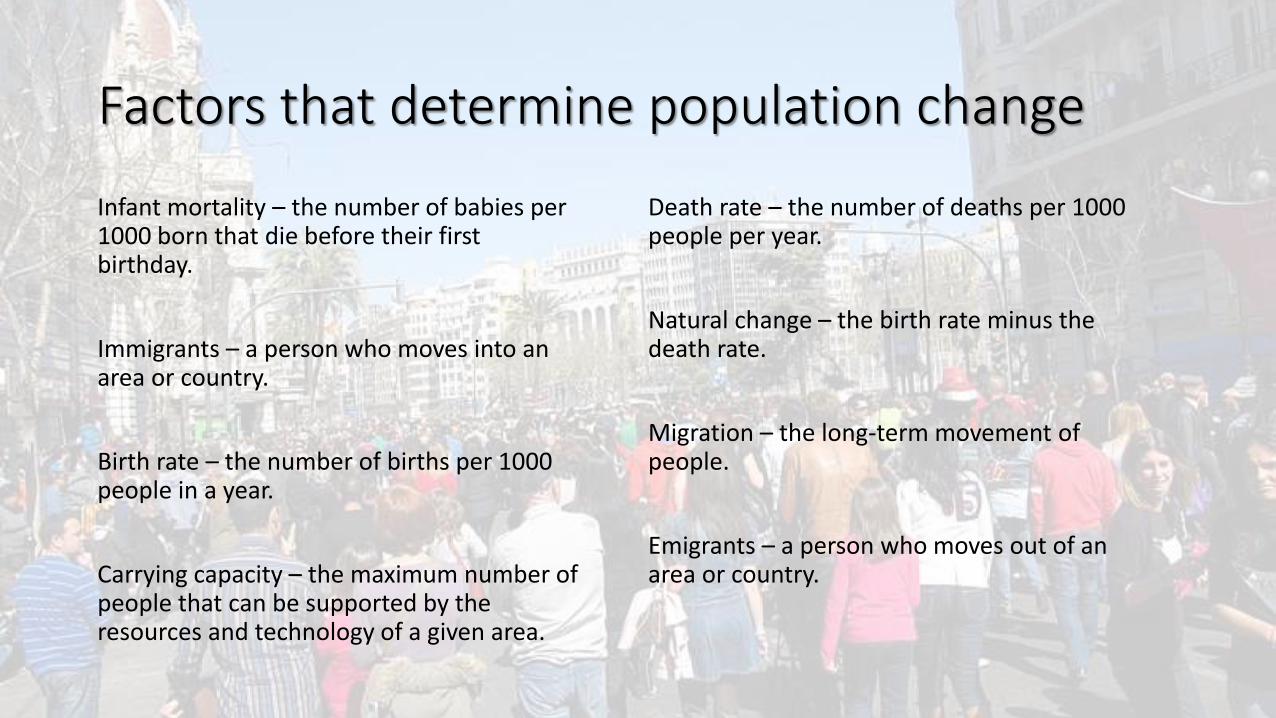
Factors that determine population change
Infant mortality – the number of babies per 1000 born that die before their first birthday.
Immigrants – a person who moves into an area or country.
Birth rate – the number of births per 1000 people in a year.
Carrying capacity – the maximum number of people that can be supported by the resources and technology of a given area.
Death rate – the number of deaths per 1000 people per year.
Natural change – the birth rate minus the death rate.
Migration – the long-term movement of people.
Emigrants – a person who moves out of an area or country.
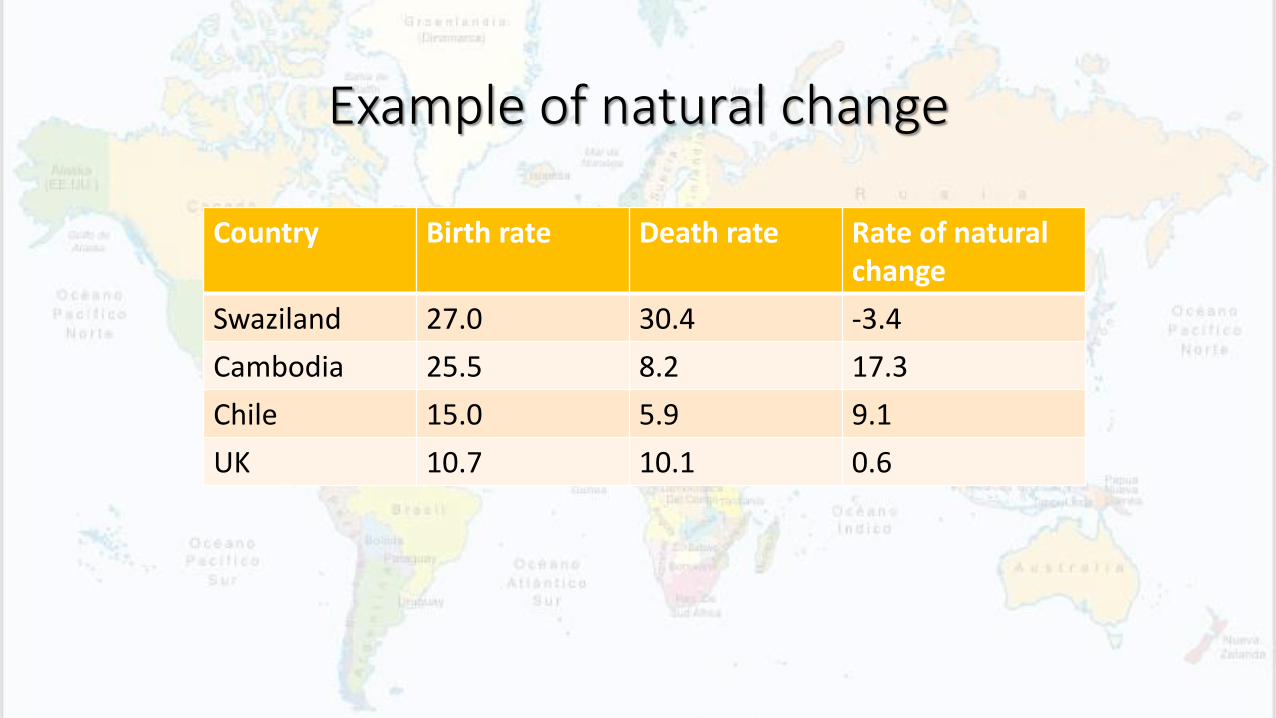
Example of natural change
Country Birth rate Death rate Rate of natural change
Swaziland 27.0 30.4 -3.4
Cambodia 25.5 8.2 17.3
Chile 15.0 5.9 9.1
UK 10.7 10.1 0.6
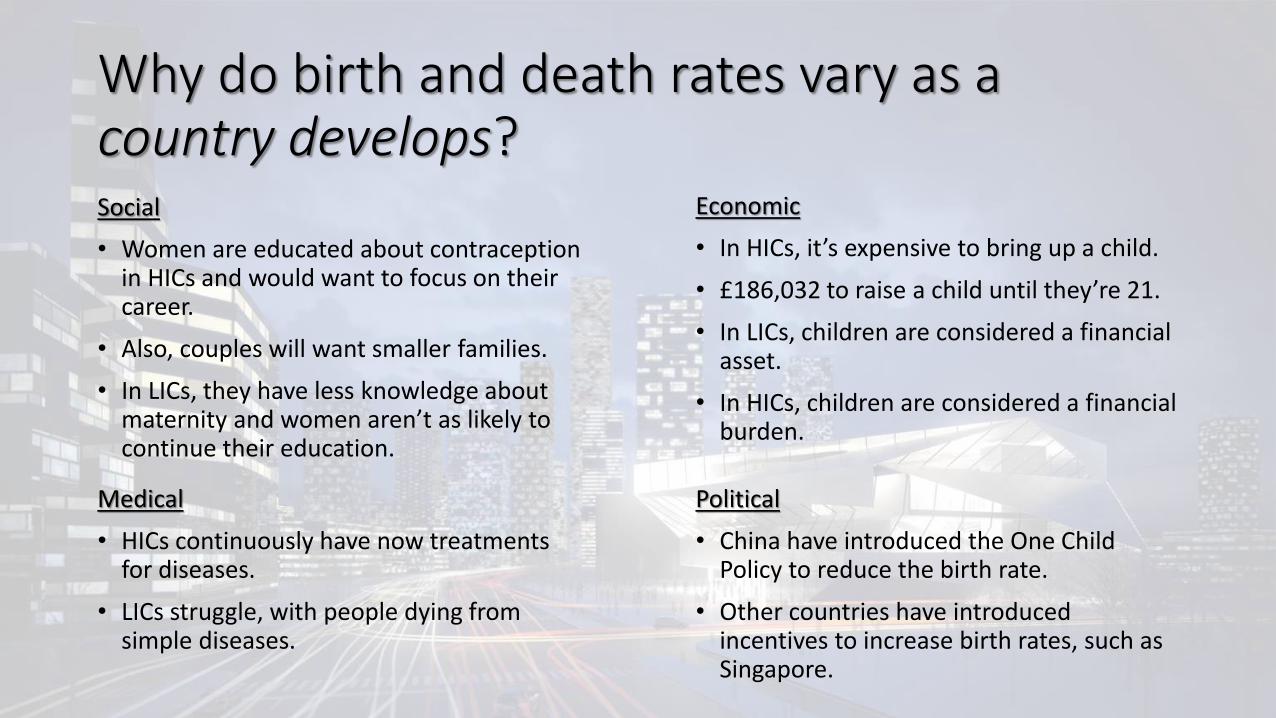
Why do birth and death rates vary as a country develops?Social
• Women are educated about contraception in HICs and would want to focus on their career.
• Also, couples will want smaller families.
• In LICs, they have less knowledge about maternity and women aren’t as likely to continue their education.
Economic
• In HICs, it’s expensive to bring up a child.
• £186,032 to raise a child until they’re 21.
• In LICs, children are considered a financial asset.
• In HICs, children are considered a financial burden.
Medical
• HICs continuously have now treatments for diseases.
• LICs struggle, with people dying from simple diseases.
Political
• China have introduced the One Child Policy to reduce the birth rate.
• Other countries have introduced incentives to increase birth rates, such as Singapore.
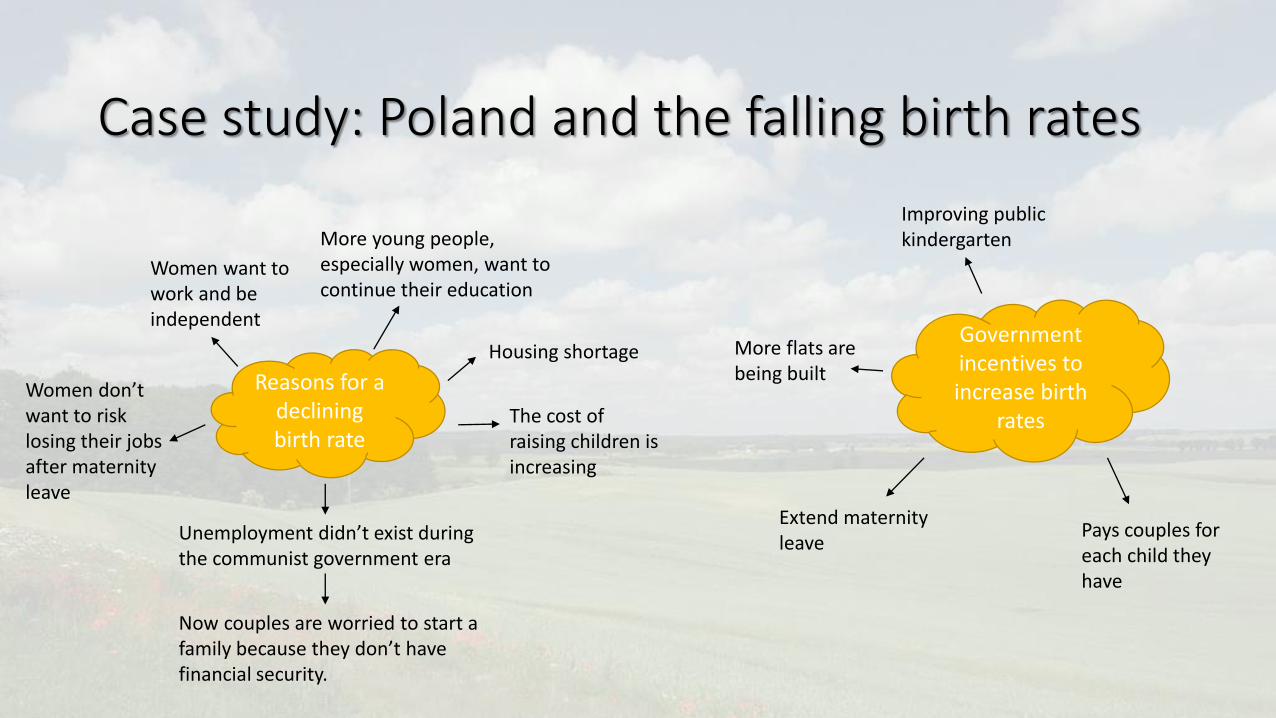
Case study: Poland and the falling birth rates
Reasons for a declining birth rate
More young people, especially women, want to continue their education
Women want to work and be independent
Housing shortage
The cost of raising children is increasing
Unemployment didn’t exist during the communist government era
Women don’t want to risk losing their jobs after maternity leave
Now couples are worried to start a family because they don’t have financial security.
Government incentives to increase birth
rates
Improving public kindergarten
More flats are being built
Extend maternity leave
Pays couples for each child they have
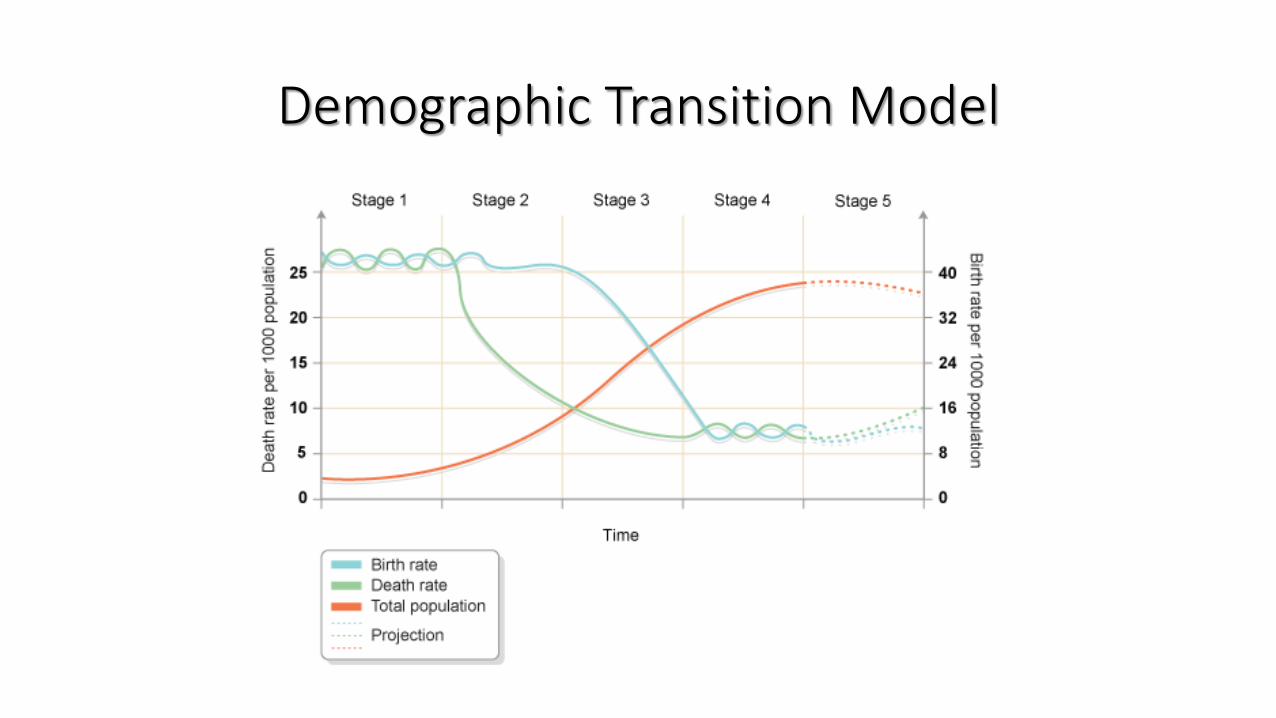
Demographic Transition Model
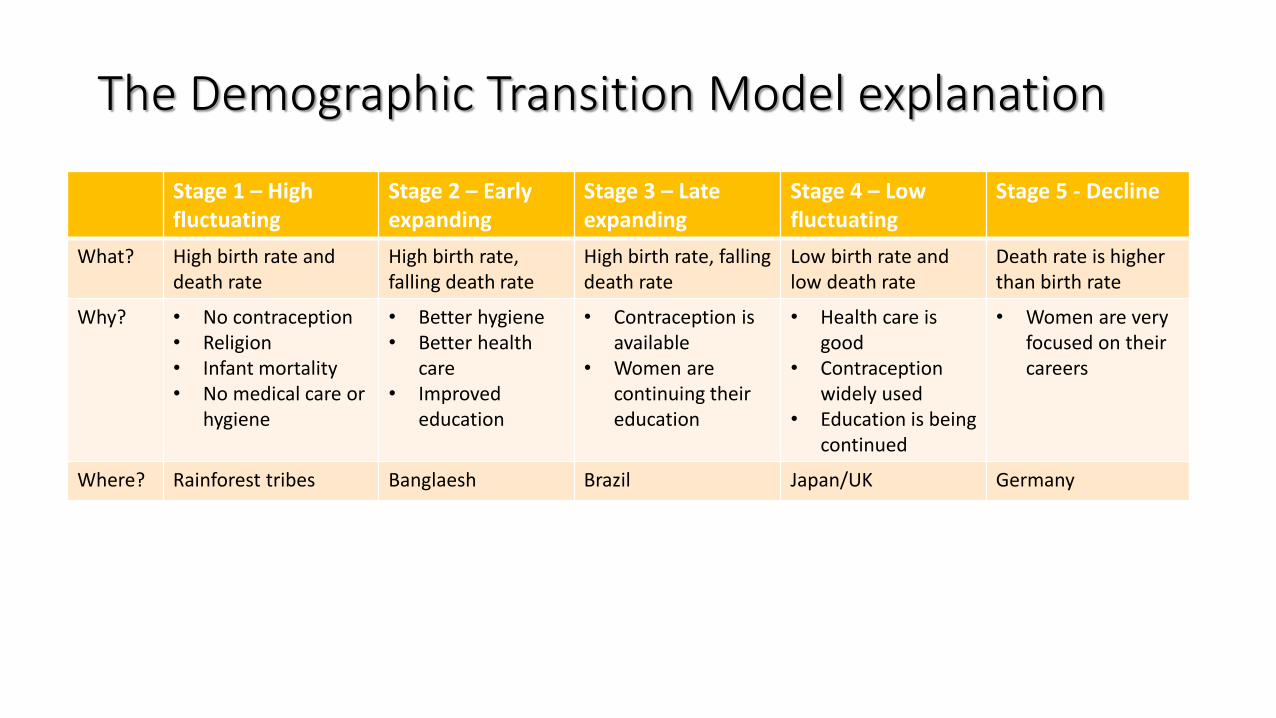
The Demographic Transition Model explanation
Stage 1 – High fluctuating
Stage 2 – Early expanding
Stage 3 – Late expanding
Stage 4 – Low fluctuating
Stage 5 - Decline
What? High birth rate and death rate
High birth rate, falling death rate
High birth rate, falling death rate
Low birth rate and low death rate
Death rate is higherthan birth rate
Why? • No contraception• Religion• Infant mortality• No medical care or
hygiene
• Better hygiene• Better health
care• Improved
education
• Contraception is available
• Women are continuing their education
• Health care is good
• Contraception widely used
• Education is being continued
• Women are very focused on their careers
Where? Rainforest tribes Banglaesh Brazil Japan/UK Germany
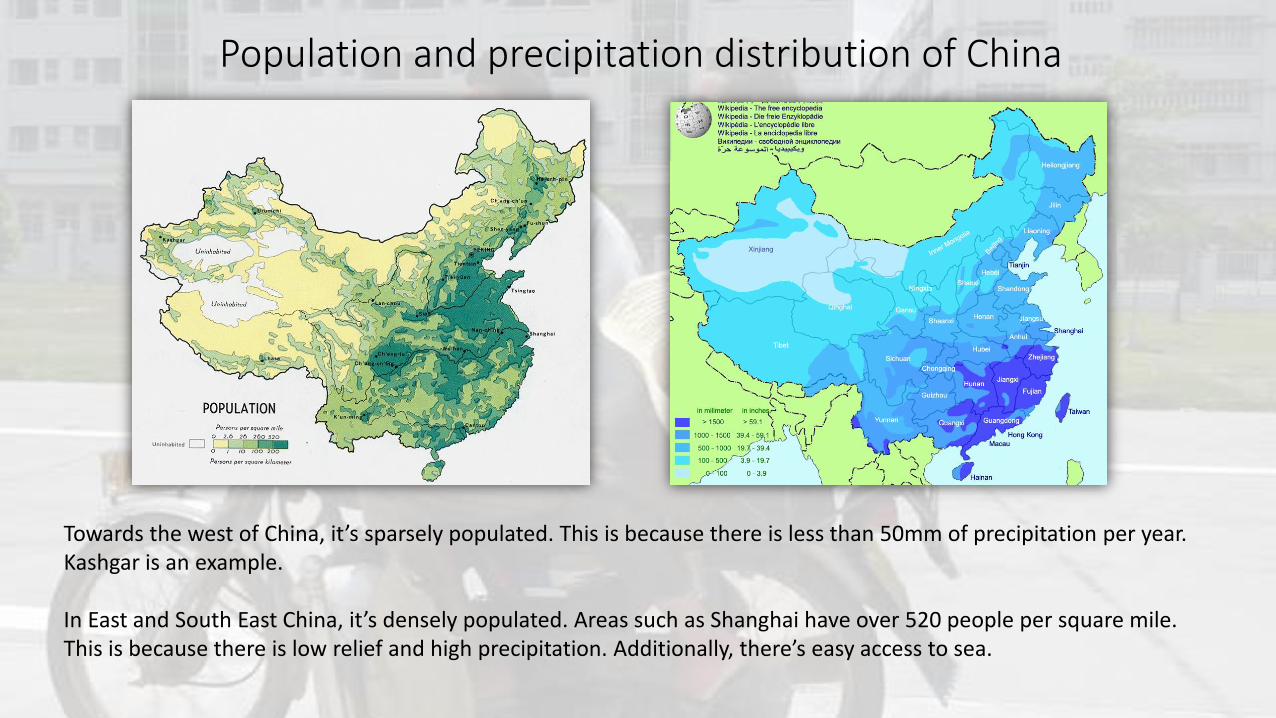
Population and precipitation distribution of China
Towards the west of China, it’s sparsely populated. This is because there is less than 50mm of precipitation per year. Kashgar is an example.
In East and South East China, it’s densely populated. Areas such as Shanghai have over 520 people per square mile. This is because there is low relief and high precipitation. Additionally, there’s easy access to sea.
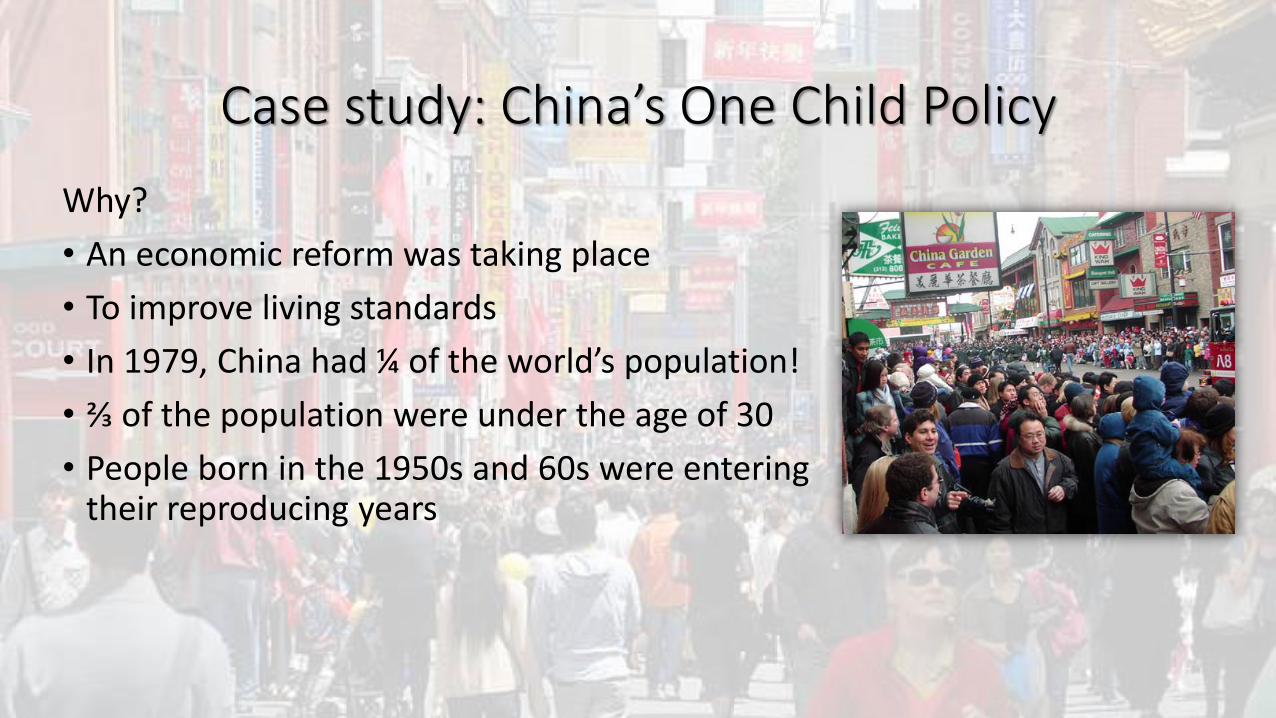
Case study: China’s One Child Policy
Why?
• An economic reform was taking place
• To improve living standards
• In 1979, China had ¼ of the world’s population!
• ⅔ of the population were under the age of 30
• People born in the 1950s and 60s were entering their reproducing years
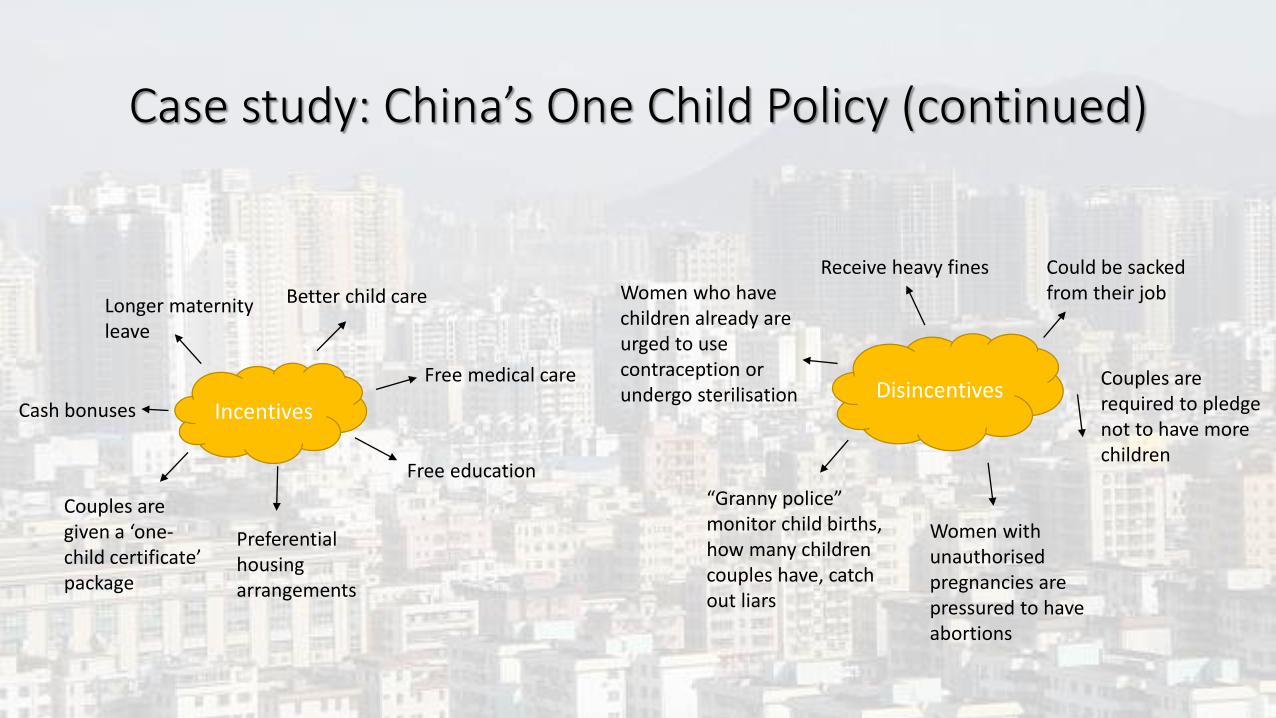
Case study: China’s One Child Policy (continued)
IncentivesDisincentives
Free education
Cash bonuses
Couples are given a ‘one-child certificate’ package
Preferential housing arrangements
Better child care
Free medical care
Longer maternity leave
Receive heavy fines Could be sacked from their job
Couples are required to pledge not to have more children
Women who have children already are urged to use contraception or undergo sterilisation
“Granny police” monitor child births, how many children couples have, catch out liars
Women with unauthorised pregnancies are pressured to have abortions
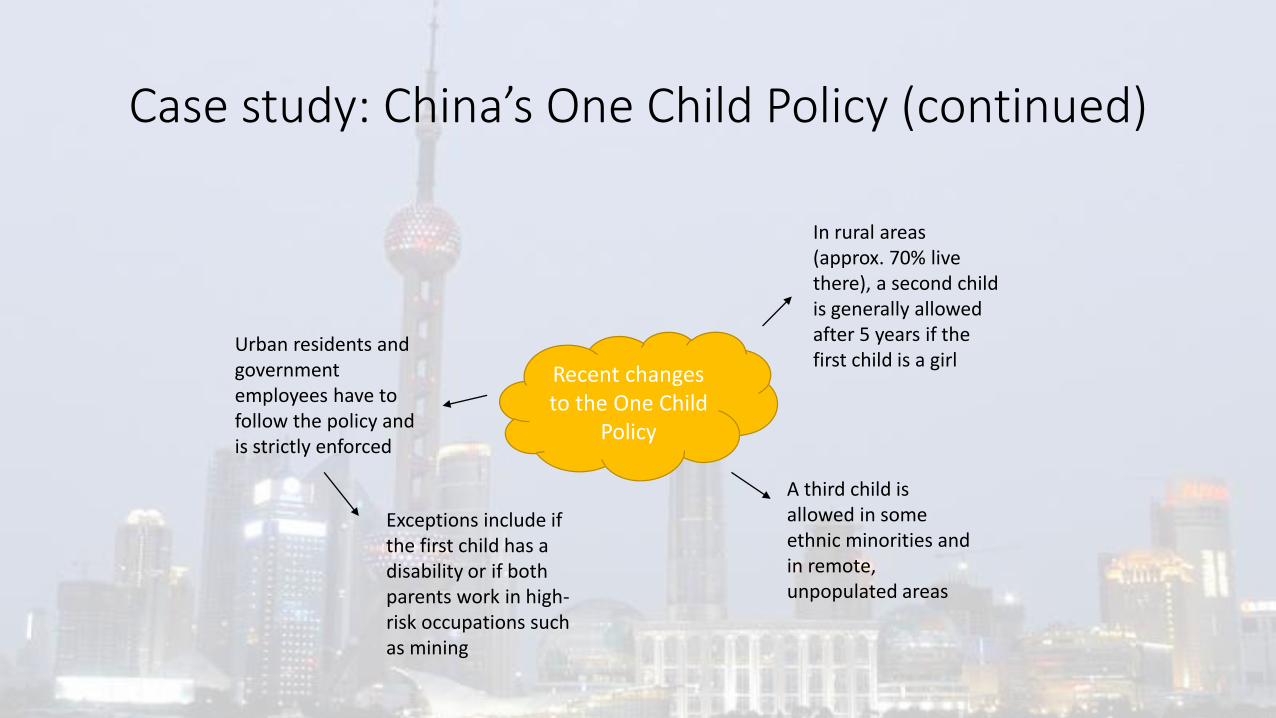
Case study: China’s One Child Policy (continued)
Recent changes to the One Child
Policy
In rural areas (approx. 70% live there), a second child is generally allowed after 5 years if the first child is a girl
A third child is allowed in some ethnic minorities and in remote, unpopulated areas
Urban residents and government employees have to follow the policy and is strictly enforced
Exceptions include if the first child has a disability or if both parents work in high-risk occupations such as mining
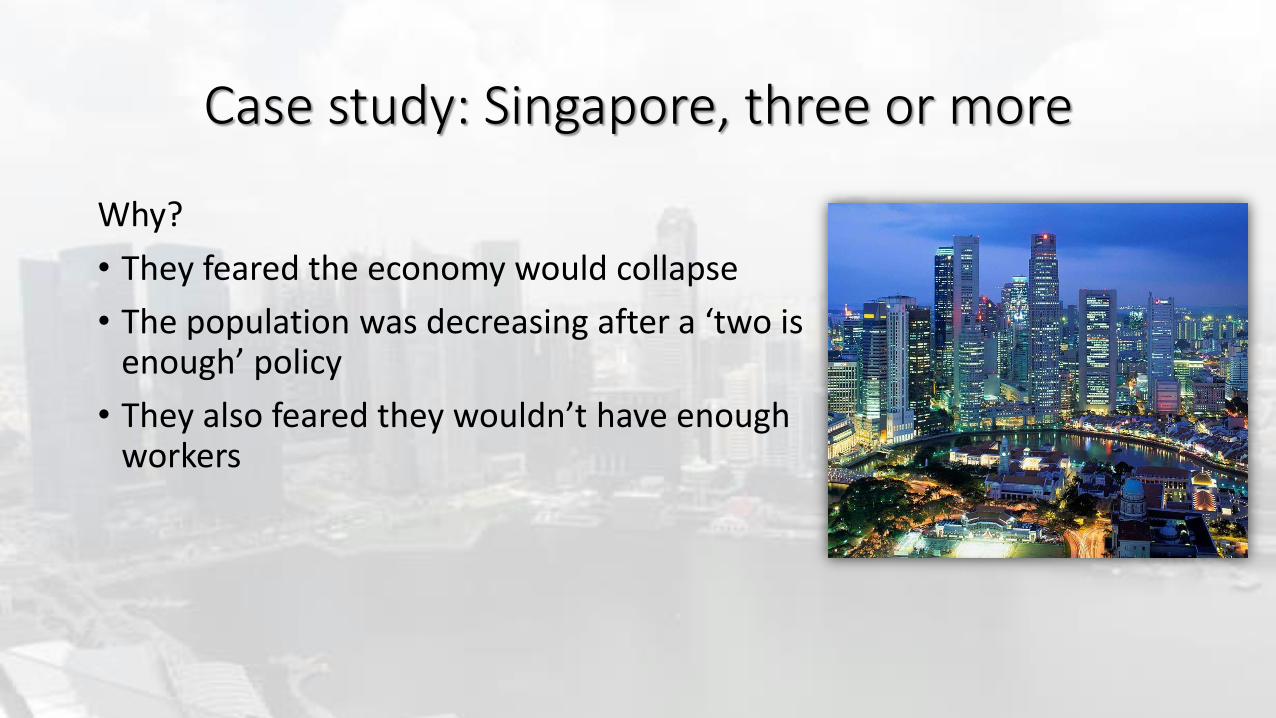
Case study: Singapore, three or more
Why?
• They feared the economy would collapse
• The population was decreasing after a ‘two is enough’ policy
• They also feared they wouldn’t have enough workers
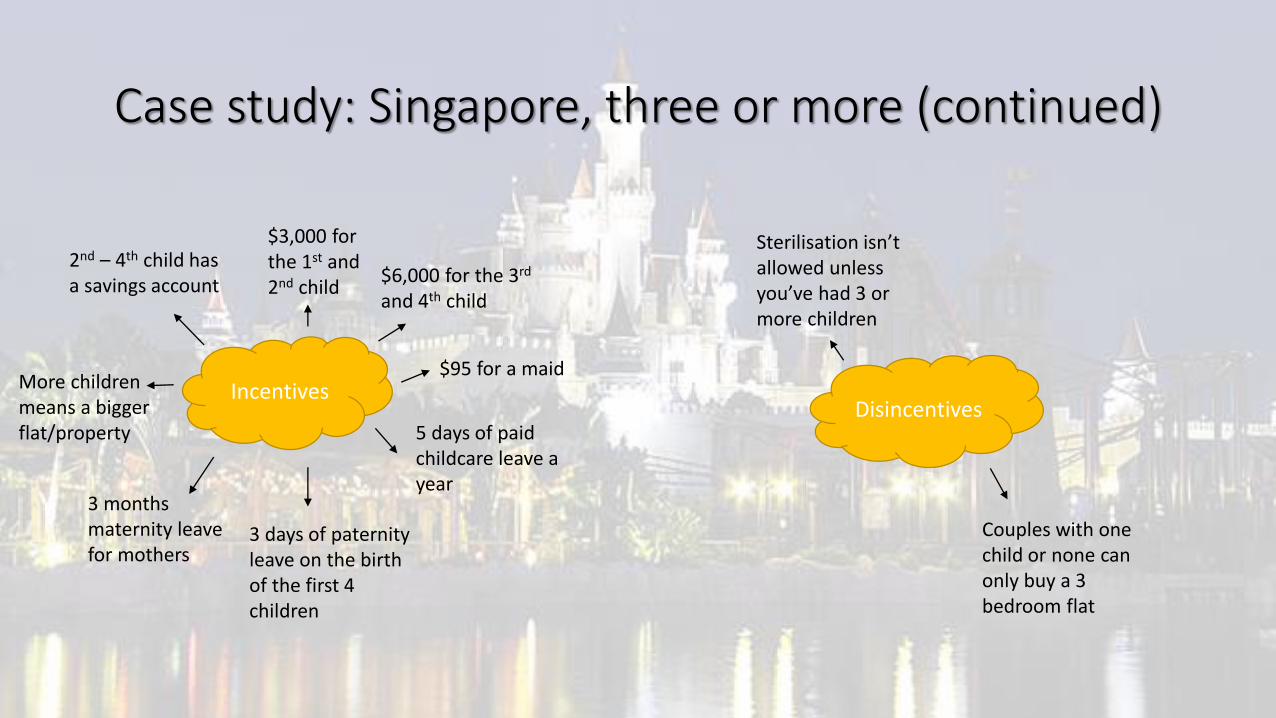
Case study: Singapore, three or more (continued)
IncentivesDisincentives
3 months maternity leave for mothers
3 days of paternity leave on the birth of the first 4 children
5 days of paid childcare leave a year
More children means a bigger flat/property
$95 for a maid
$6,000 for the 3rd
and 4th child
$3,000 for the 1st and 2nd child
2nd – 4th child has a savings account
Sterilisation isn’t allowed unless you’ve had 3 or more children
Couples with one child or none can only buy a 3 bedroom flat
Case study: Ageing population in Japan
Disadvantages
• Workforce: businesses are struggling to recruit. Many pensioners are having to continue to work. A solution is to encourage migrant labour.
• Pensions: the Prime Minister has introduced reforms which includes the retirement age being increased from 60 to 65 by 2030 and higher pension contributions from employers, employees and the government.
• Health care: Many pensioners are living in nursing homes or care homes now. This is putting pressure on the health budget, more than half goes towards caring for the elderly.
• In 2006, incentives were introduced to promote independent living at home. A health insurance scheme for over 75s were introduced in 2007. It has been nicknamed the ‘hurry up and die’ scheme.
• To shorten hospital admissions, a fee a hospital receives after 100 days goes up.
• One care home has hundreds on the waiting list, not enough staff work there for everyone to be admitted.
Case study: Ageing population in Japan (continued)
Advantages
• The greying yen: the elderly saved money. Now, Japanese pensioners are spending; buying luxury goods, travelling and indulging their taste for expensive food. This benefits their economy.
• In the past, their saved money would go to their children to help look after them at an old age.
• Now, children are doing less of the caring.
• Technology: Japan has a range of gadgets to support the ageing population. It allows young relatives to keep in touch with their elderly relatives.
• This includes an online kettle that automatically sends emails to up to three people when it’s switched on.
• Also, internet-linked sensors that can be attached to fridge doors and bathroom mats.
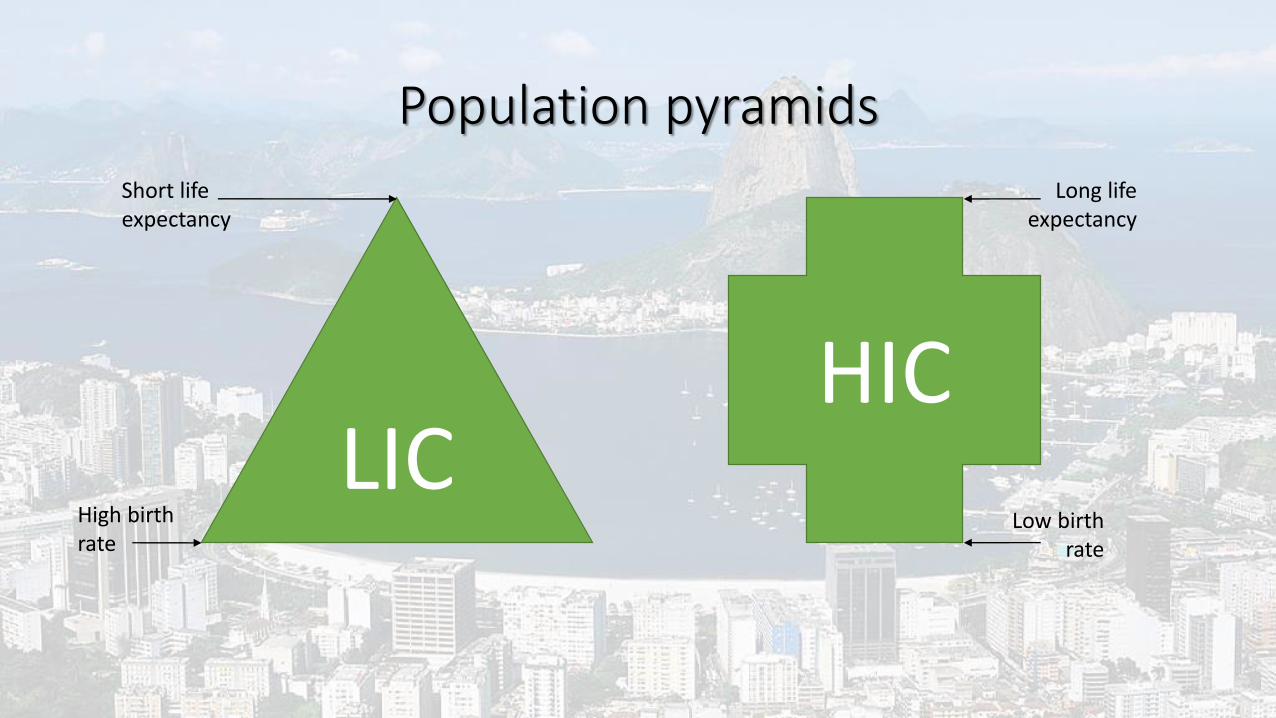
Population pyramids
LICHIC
Short life expectancy
High birth rate
Long life expectancy
Low birth rate
Key wordsLife expectancy – the average number of years a person is expected to live
Dependent population – the people aged under 15 and over 65 that are relying on the rest of the population to work and pay taxes to ensure a good quality of life (health care, education, etc.)
Economically Active Population – people aged 15-65 who are of working age
Economic Dependency Ratio –the % of people working compared to those people who are not. A high % of people working is good for the economy.