eden alternative data statistical report summary of eden alternative the texas long term care...
TRANSCRIPT

Eden Alternative Data
From 1999 to 2005
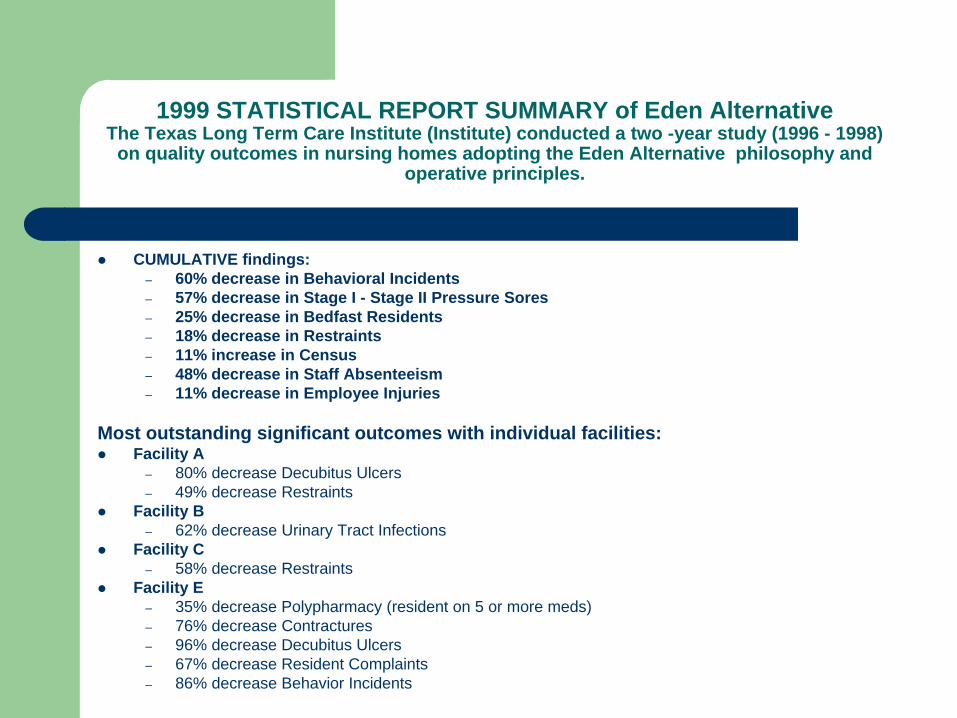
1999 STATISTICAL REPORT SUMMARY of Eden Alternative The Texas Long Term Care Institute (Institute) conducted a two -year study (1996 - 1998)
on quality outcomes in nursing homes adopting the Eden Alternative philosophy and operative principles.
CUMULATIVE findings:– 60% decrease in Behavioral Incidents– 57% decrease in Stage I - Stage II Pressure Sores– 25% decrease in Bedfast Residents– 18% decrease in Restraints– 11% increase in Census– 48% decrease in Staff Absenteeism– 11% decrease in Employee Injuries
Most outstanding significant outcomes with individual facilities:Facility A
– 80% decrease Decubitus Ulcers– 49% decrease Restraints
Facility B– 62% decrease Urinary Tract Infections
Facility C– 58% decrease Restraints
Facility E– 35% decrease Polypharmacy (resident on 5 or more meds)– 76% decrease Contractures– 96% decrease Decubitus Ulcers– 67% decrease Resident Complaints– 86% decrease Behavior Incidents
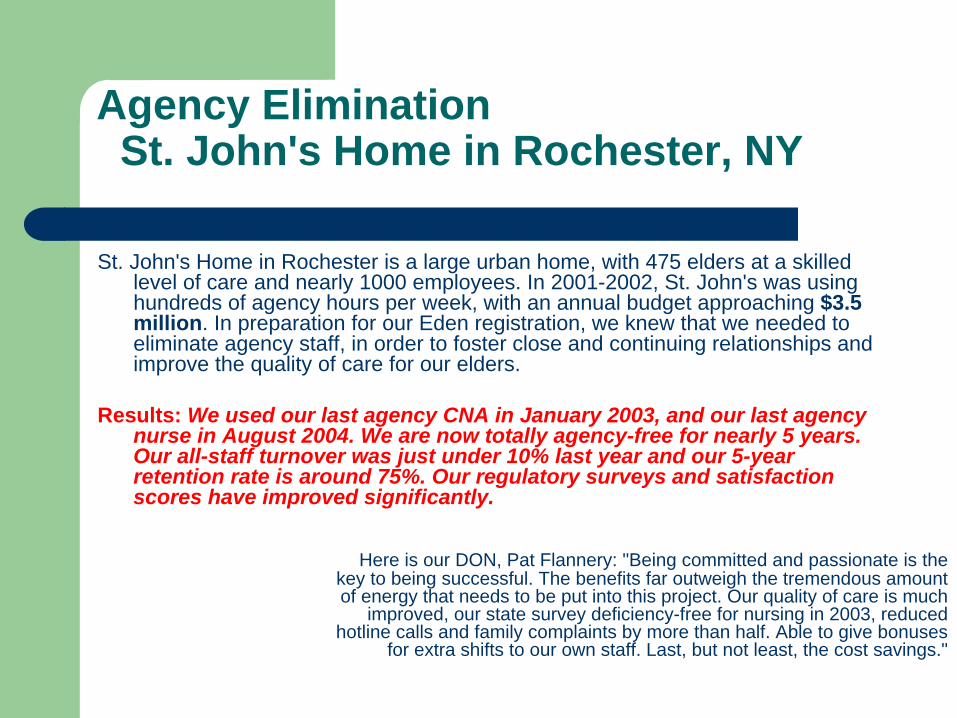
Agency Elimination St. John's Home in Rochester, NY
St. John's Home in Rochester is a large urban home, with 475 elders at a skilled level of care and nearly 1000 employees. In 2001-2002, St. John's was using hundreds of agency hours per week, with an annual budget approaching $3.5 million. In preparation for our Eden registration, we knew that we needed to eliminate agency staff, in order to foster close and continuing relationships and improve the quality of care for our elders.
Results: We used our last agency CNA in January 2003, and our last agency nurse in August 2004. We are now totally agency-free for nearly 5 years. Our all-staff turnover was just under 10% last year and our 5-year retention rate is around 75%. Our regulatory surveys and satisfaction scores have improved significantly.
Here is our DON, Pat Flannery: "Being committed and passionate is the key to being successful. The benefits far outweigh the tremendous amount of energy that needs to be put into this project. Our quality of care is much
improved, our state survey deficiency-free for nursing in 2003, reduced hotline calls and family complaints by more than half. Able to give bonuses
for extra shifts to our own staff. Last, but not least, the cost savings."
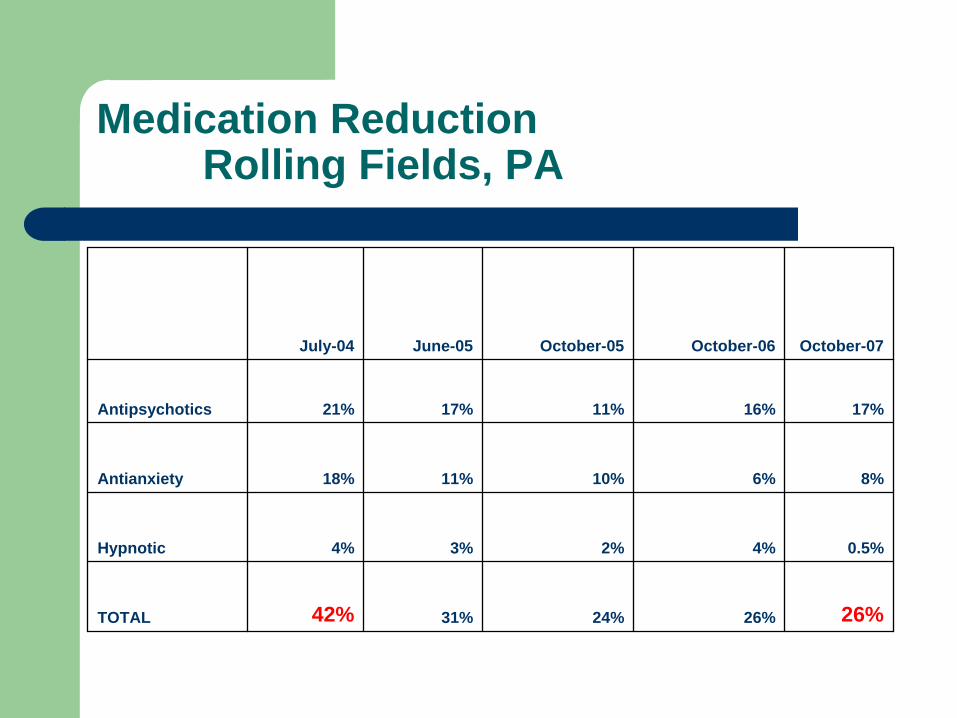
Medication Reduction Rolling Fields, PA
July-04 June-05 October-05 October-06 October-07
Antipsychotics 21% 17% 11% 16% 17%
Antianxiety 18% 11% 10% 6% 8%
Hypnotic 4% 3% 2% 4% 0.5%
TOTAL 42% 31% 24% 26% 26%
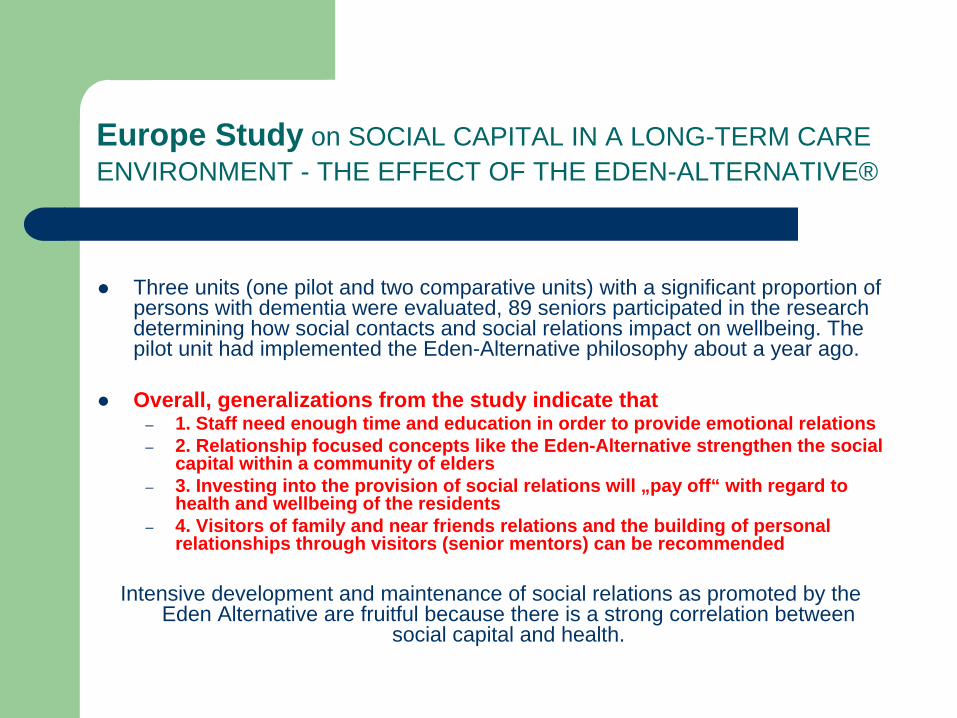
Europe Study on SOCIAL CAPITAL IN A LONG-TERM CARE ENVIRONMENT - THE EFFECT OF THE EDEN-ALTERNATIVE®
Three units (one pilot and two comparative units) with a significant proportion of persons with dementia were evaluated, 89 seniors participated in the research determining how social contacts and social relations impact on wellbeing. The pilot unit had implemented the Eden-Alternative philosophy about a year ago.
Overall, generalizations from the study indicate that – 1. Staff need enough time and education in order to provide emotional relations – 2. Relationship focused concepts like the Eden-Alternative strengthen the social
capital within a community of elders – 3. Investing into the provision of social relations will „pay off“ with regard to
health and wellbeing of the residents – 4. Visitors of family and near friends relations and the building of personal
relationships through visitors (senior mentors) can be recommended
Intensive development and maintenance of social relations as promoted by the Eden Alternative are fruitful because there is a strong correlation between
social capital and health.

Medication Reduction - 2004Spectrum Health

Data ContinueSpectrum Health

Data ContinueSpectrum Health
Summary
Physician orders written for use of alternative therapiesMedical Staff approval of alternative therapiesDecrease in medicationsDecrease in behaviors of elders with use of alternatives
Spectrum Health

Michigan Registered Homes- 2004 Reductions in staff turnover rates
Lapeer CMCF began their Eden journey in 2000 and became a Registered Eden Home in 2001. They have reported a 75 % decrease in staff turnover as well as dramatic decreases in absenteeism.
• 75% decrease in staff turnover 60% decrease in absenteeism
Oak Crest Manor of Holland, began their Eden journey in 2000 and became a Registered Eden Home in 2001, reports a
– decrease in staff turnover from 104% to 42% over a 1 ½ year period of time. Agency use for the same period of time dropped from $60,435.oo in the year of 2000 to $247.00 from January 2002 to present!
• Outside agency use: 2000 $61,000, 2001 $54,000, 2002 $ 250 • Staff Turnover 2000 104%, 2001 119%, 2002 42%

LakeLand Specialty Hospital, MI - 2001
Lakeland Specialty Hospital began their Eden journey in 1999 and became a Registered Eden Home in 2001, reports decrease turnover rates of 87.26% in 1999 to 32.58% in 2001. • Turnover C.N.A. 1998: 87.26% 2002: 22% • Family Satisfaction 1999: 86% 2002: 92%•Federal/State Citations 1999: 13 2001: 7
Indicators 1999 2001Prevalence of Falls 6.3% 14% Prevalence of Weight loss 11% 5% Prevalence of Bedfast 15% 14% Prevalence of Depression 19% 9% Prevalence of Psycotropic Meds 15% 7%
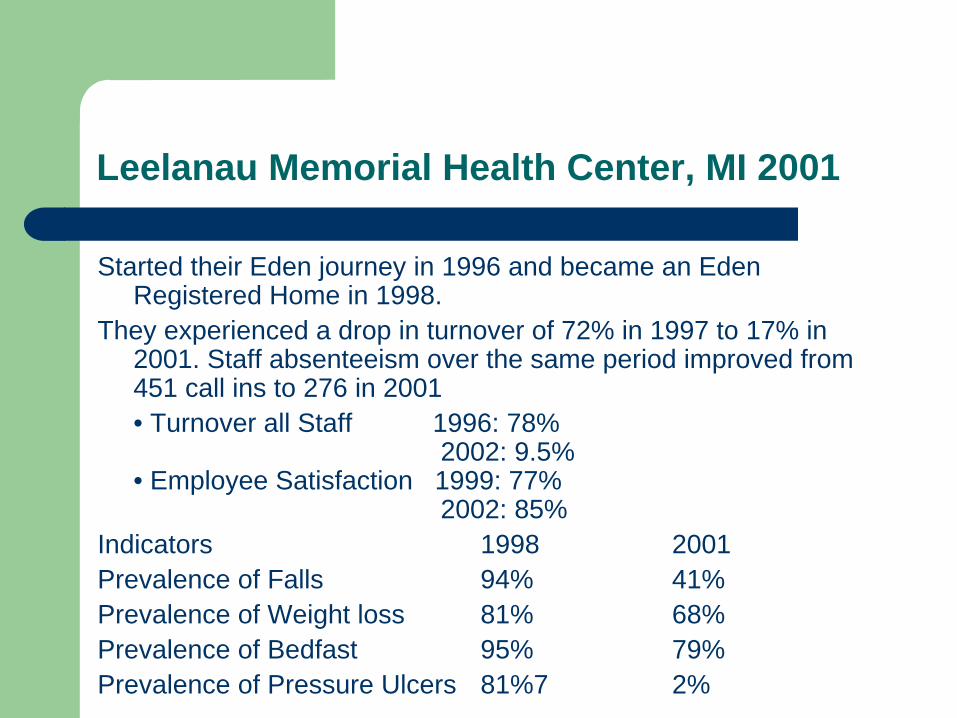
Leelanau Memorial Health Center, MI 2001
Started their Eden journey in 1996 and became an Eden Registered Home in 1998.
They experienced a drop in turnover of 72% in 1997 to 17% in 2001. Staff absenteeism over the same period improved from 451 call ins to 276 in 2001• Turnover all Staff 1996: 78%
2002: 9.5% • Employee Satisfaction 1999: 77%
2002: 85%Indicators 1998 2001 Prevalence of Falls 94% 41%Prevalence of Weight loss 81% 68%Prevalence of Bedfast 95% 79% Prevalence of Pressure Ulcers 81%7 2%
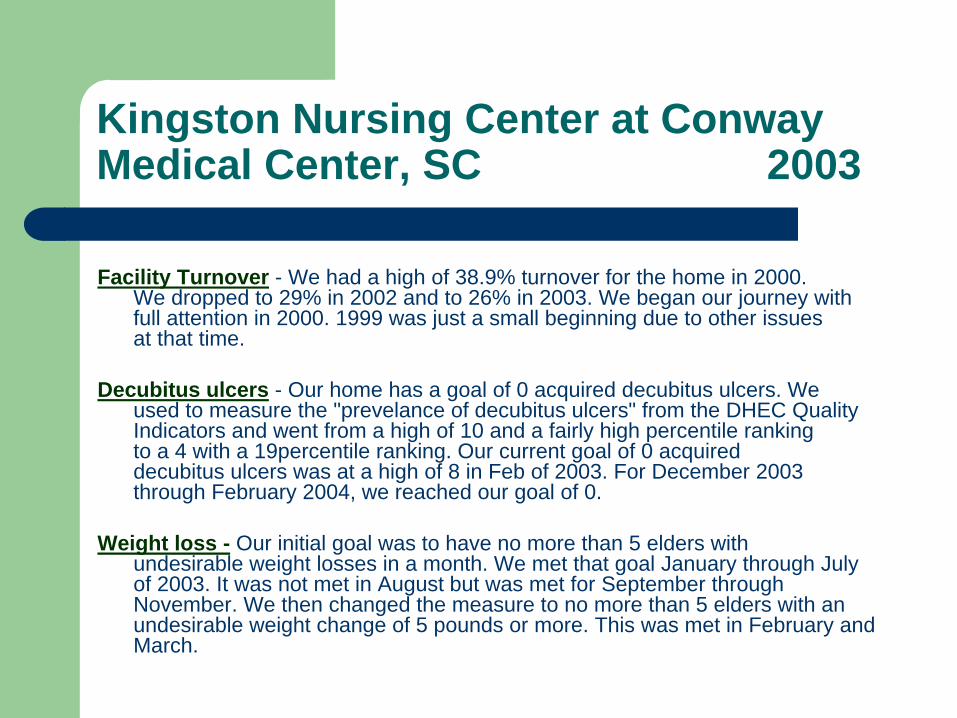
Kingston Nursing Center at Conway Medical Center, SC 2003
Facility Turnover - We had a high of 38.9% turnover for the home in 2000. We dropped to 29% in 2002 and to 26% in 2003. We began our journey with full attention in 2000. 1999 was just a small beginning due to other issues at that time.
Decubitus ulcers - Our home has a goal of 0 acquired decubitus ulcers. We used to measure the "prevelance of decubitus ulcers" from the DHEC Quality Indicators and went from a high of 10 and a fairly high percentile ranking to a 4 with a 19percentile ranking. Our current goal of 0 acquired decubitus ulcers was at a high of 8 in Feb of 2003. For December 2003 through February 2004, we reached our goal of 0.
Weight loss - Our initial goal was to have no more than 5 elders with undesirable weight losses in a month. We met that goal January through July of 2003. It was not met in August but was met for September through November. We then changed the measure to no more than 5 elders with an undesirable weight change of 5 pounds or more. This was met in February and March.

Independent Study - 2004
A total of 276 (138 Eden and 138 Non-Eden) homes were collected. Not all states were represented, a total of 38 states have Eden homes listed on the Nursing Home Compare Website. The range of deficiencies was from zero to 84.Table 1Comparisons of number and scope of Eden and Non-Eden deficiencies
Eden Non-Eden____________ ____________
Variable M SD M SD t p
Actual number 6.54 6.22 9.26 7.51 -3.23 .001
Potential harm .82 1.61 1.16 1.83 -1.94 .054
Minimal harm 5.28 5.26 7.17 7.21 -2.92 .004
Actual harm .36 .90 .80 2.51 -2.27 .024
Immediate Jeopardy .08 .62 .12 .54 - .62 .536

Independent Study….cont
Comparisons of type of Eden and Non-Eden deficiencies
Eden Non-Eden____________ ________
Variable M SD M SD t pMistreatment .44 .77 76 1.48 -2.61 .009
Quality of Care 2.10 2.68 2.85 3.50 -2.36 .019
Resident Assessment .61 1.94 .75 1.06 -1.20 .232
Resident Rights .76 1.11 1.20 1.68 -2.99 .003
Dietary/Nutrition .60 .89 .78 1.11 -1.74 .083
Pharmacy .62 .98 .70 .99 - .73 .466
Environmental 1.12 1.38 1.52 1.96 -2.34 .020
Administrative .31 .66 .69 1.35 -3.48 .001
Independent Study…cont
Summary
The Eden Alternative homes had significantly less actual deficiencies meaning that the total number of deficiencies of Eden homes was less than Non-Eden homes. This is good news for homes on their Eden journey and supports the statement of Dr. William Thomas that “State regulators have actually been very supportive of the Eden Alternative” (Thomas, 1996, p.7). As far as the scope of the deficiencies, Eden homes had significantly fewer Minimal harm and Actual harm deficiencies. The majority of deficiencies entered for the research fell within the minimal to actual harm range.
The Eden Alternative strives to create a social model of care. This is why the type of deficiencies is the most interesting result of the research. Eden homes had significantly less Mistreatment, Quality of Care, Resident Rights, Environmental, and Administrative deficiencies. Often Nursing Homes are viewed as bad places to be with substandard qualities of care, neglect, and abuse. While this is a stereotype there are real concerns with the number of elderly people on the rise and the number of direct care staff decreasing. Mistreatment, Quality of Care, and Resident Rights deficiencies encompass the stereotypes that affect the opinions of the public. The results of the research show that Eden homes may uphold the quality of life and quality of care more than Non-Eden homes.
By Molly Olsen
Quality Initiative Grant Award Program Preliminary Report on Year One of Data Collected to Measure
Objective to Decrease Staff Turnover Submitted by
Marcia J. Lane, MPH Office for the Study of Aging
Arnold School of Public Health University of South Carolina
This preliminary report reviews the average turnover percentages for CNA’s, RN’s, and LPN’s in 33 facilities receiving Quality Initiative Grant Awards issued September 2002 and have reported data on a regular basis. The results in this report combine nursing facilities as a group based on the type of grant award (QI; New Eden; Eden Expansion).The measurable objective being reported is:By April 30, 2005, a 25 % decrease in staff turnover will be observed.
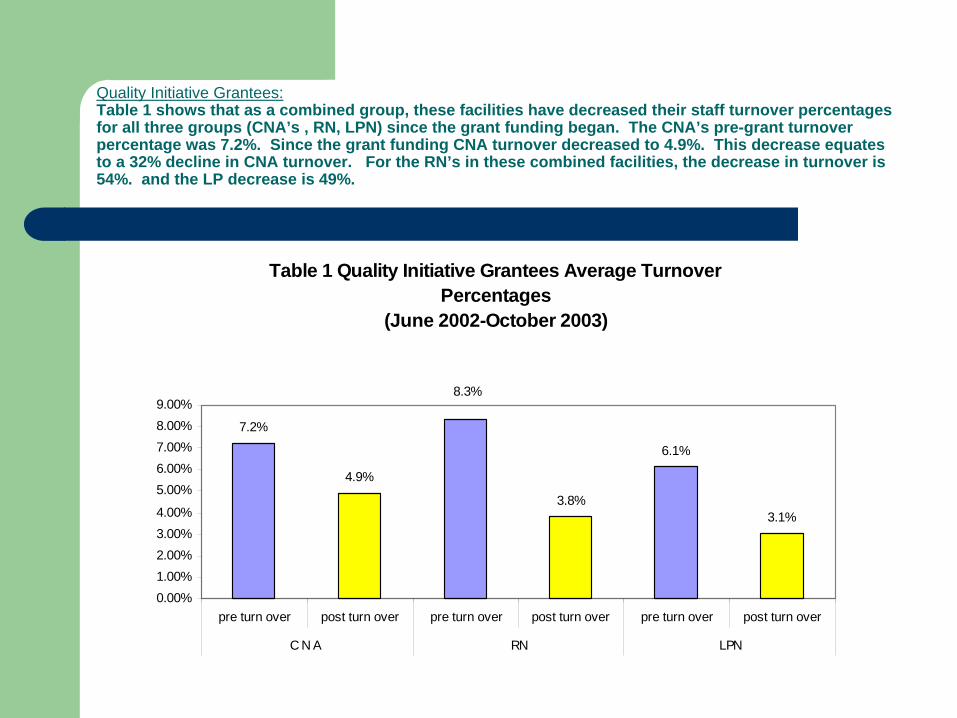
Quality Initiative Grantees: Table 1 shows that as a combined group, these facilities have decreased their staff turnover percentages for all three groups (CNA’s , RN, LPN) since the grant funding began. The CNA’s pre-grant turnover percentage was 7.2%. Since the grant funding CNA turnover decreased to 4.9%. This decrease equates to a 32% decline in CNA turnover. For the RN’s in these combined facilities, the decrease in turnover is 54%. and the LP decrease is 49%.
Table 1 Quality Initiative Grantees Average Turnover Percentages
(June 2002-October 2003)
7.2%
4.9%
3.8%
6.1%
3.1%
8.3%
0.00%1.00%2.00%3.00%4.00%
5.00%6.00%7.00%8.00%9.00%
pre turn over post turn over pre turn over post turn over pre turn over post turn over
C N A RN LPN

New Eden Grantees: Table 2 shows that as a combined group, these facilities have decreased their staff turnover percentages forall CNA’s and LPN’s since the grant funding began. The CNA’s pre-grant turnover percentage was 5.8%. Since the grant funding CNA turnover decreased to 4.1%. This decrease equates to a 29% decline in CANturnover. For the LPN’s in these combined facilities the decrease in turnover is 13 %. The RN’s in thisparticular group of nursing facilities showed a 6% increase in turnover. Usually facilities report a low
number of RN’s, so a small number of nurses leaving will create a high turnover.
Table 2 New Eden Grantees Average Turnover Percentages(June 2002 - October 2003)
5.8%
4.1%
6.4% 6.8%
4.0%3.5%
0.0%1.0%2.0%3.0%4.0%5.0%6.0%7.0%8.0%
pre turn over post turn over pre turn over post turn over pre turn over post turn over
C N A RN LPN

Eden Expansion Grantees Table 3 shows that as a combined group, these facilities have decreased their staff turnover percentages for all three groups (CNA’s , RN, LPN) since the grant funding began. The CNA’s pre-grant turnover percentage was 3.6%. Since the grant funding CNA turnover decreased to 3.0%. This decrease equates to a 17% decline in CNA turnover. For the RN’s in these combined facilities the decrease in turnover is 18%. and the LPN decrease is 17%.
Table 3 Eden Expansion Grantees Average Turnover Percentages
(June 2002 - October 2003)
3.6%3.0% 3.3%
2.3%1.9%
4.0%
0.0%
1.0%
2.0%
3.0%
4.0%
5.0%
pre turn over post turn over pre turn over post turn over pre turn over post turn over
C N A RN LPN
Summary from SC Report
The overall progress made by the facilities receiving grants to improve quality of life based on the measurable objective to reduce staff turnover is positive. The QI grantees, as a group, show the largest decrease in average turnover percentages at year one.
The New Eden grantees, as a group, show a decrease in average turnover for CNA’s and LPN’s, although not as high as the QI grantees. The RN increase in average turnover percentage is based on small numbers and may not reflect what is occurring in each individual facility but may be the result of a single turnover.
The Eden Expansion grantees, as a group, show a decrease in the average turnover percentage for CNA’s, RN’s, and LPN’s, however none of the decreases are at the objective level of 25%.
Although this is a preliminary report for the first year of data collected, it appears that the nursing facilities as a group are moving toward reaching the staff turnover objective.
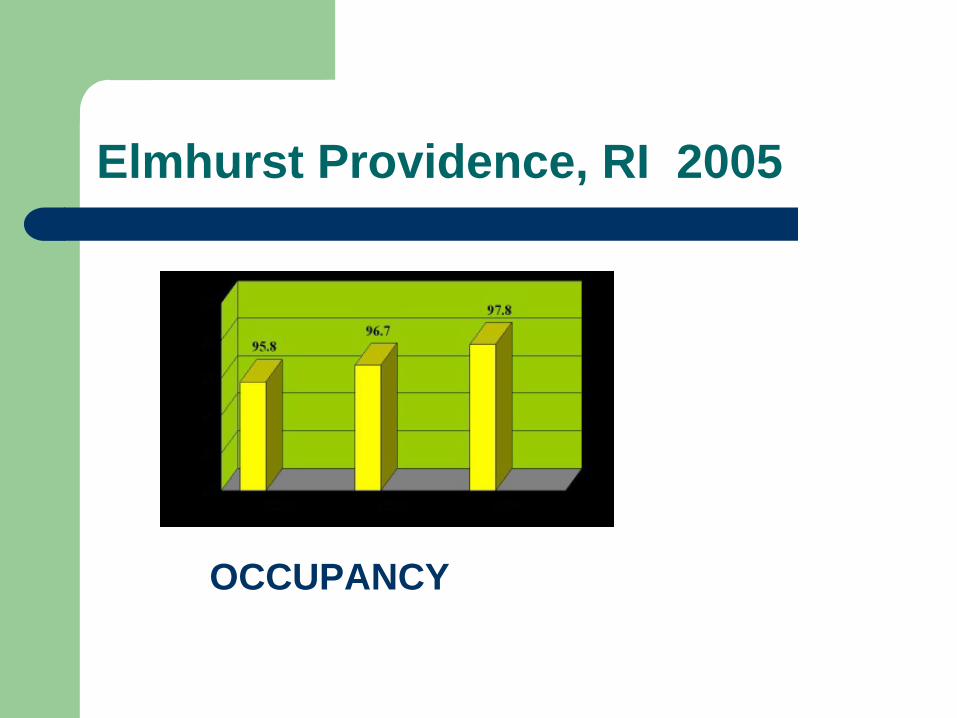
Elmhurst Providence, RI 2005
OCCUPANCY

Elmhurst…. cont
Discharge to Hospital

Elmhurst…. cont
Deaths

Summary
Measurement by Joe Angelelli
Rick has been sharing his positive results with other members of the long-term community in Rhode Island, and folks there seem genuinely interested in making culture change the norm rather than the exception in that state. The results they have achieved speak for themselves:
Summary – Outcomes From Home that Implemented Eden Principles
Decreased need for antidepressant and psychotropic prescriptionsDecrease in average # of medications per ElderDecreased drug costReduced incidents of pressure soresReduced incidents of incontinenceDecrease in Irritability ScoresDecreased number of skin tearsIncreased CensusIncreased Revenue and Net Operating IncomeDecrease in staff absenteeism