economic impact of gm crops on agriculture production and indian economy
TRANSCRIPT

1

2
Economic Impact of GM Crops on Agriculture
Production and Indian Economy
Avinash C SPG12AGR4001
SEMINAR -II

3
Introduction
Flow of Presentation
Status of GM Crops In India and World
Economic Impact on production and Indian Economy
GM crops-Pros and Cons
Some of Issue and Fact
GM crops Development Objectives
Case studies
Conclusion

4
Introduction
World Health Organization
GMOs as “Organisms in which the genetic material
(DNA) has been altered in a way that does not occur
naturally”. This is usually done by inserting genes of
related or unrelated species into an organism's DNA in an
attempt to transfer, or stop expression of, a specific trait.

5
Creating GM Plants Eg-IR maize
6

7
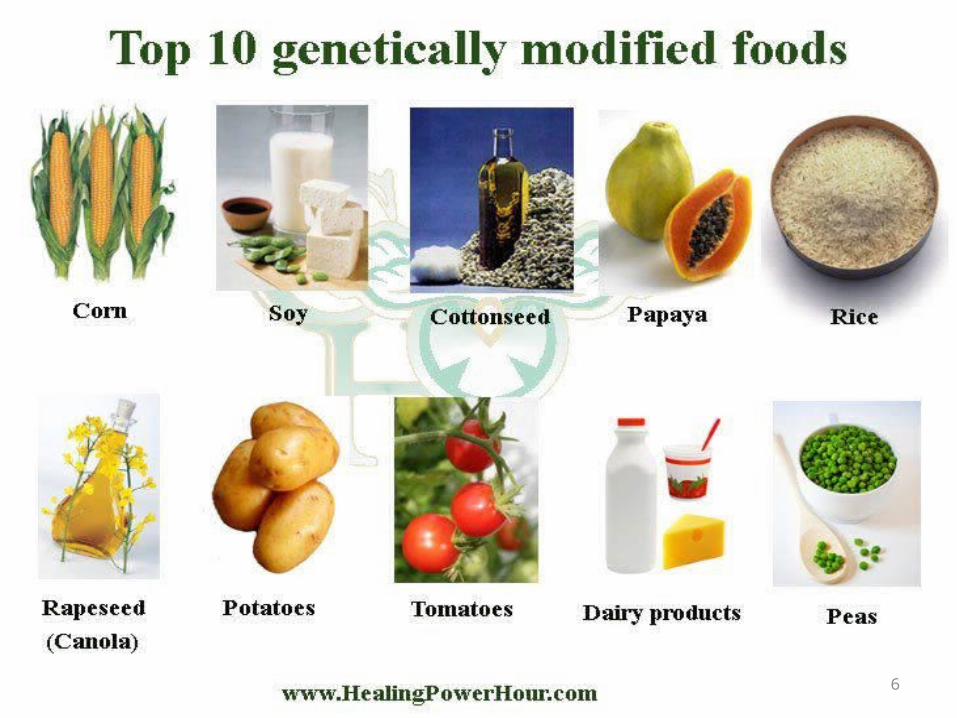
First crop introduced was Flavr Savr tomato in USA in 1995
So far 20 crops approved for commercial cultivation in different countries
Only four crops being marketed commercially I.e., corn, cotton, soybean and canola
Commercial production initiated for papaya, squash, rice and alfalfa in USA and other countries, Others are approved but not yet being Marketed
Major countries include USA, Canada, Japan, China, India, Brazil, EU, Argentina, South Africa

8
Transgenic Crops:Development Objectives
Integrated pest management (IPM)
Herbicide tolerance (HT)
Nutritional enhancements
Product quality improvement
Increase in yield
Stress tolerance (ST)
Plant based pharmaceuticals

9
Status of GM Crops In India and World

10
GLOBAL
Source: FAO Stat and ISAAA, 2013

11
79.1
USA
40.3
Brazil Argentenia India
24.4 11.80 10.8
Canada
TOP 5 COUNTRIESBY HECTRAGEMillions of biotech crop hectares planted
1996 2013
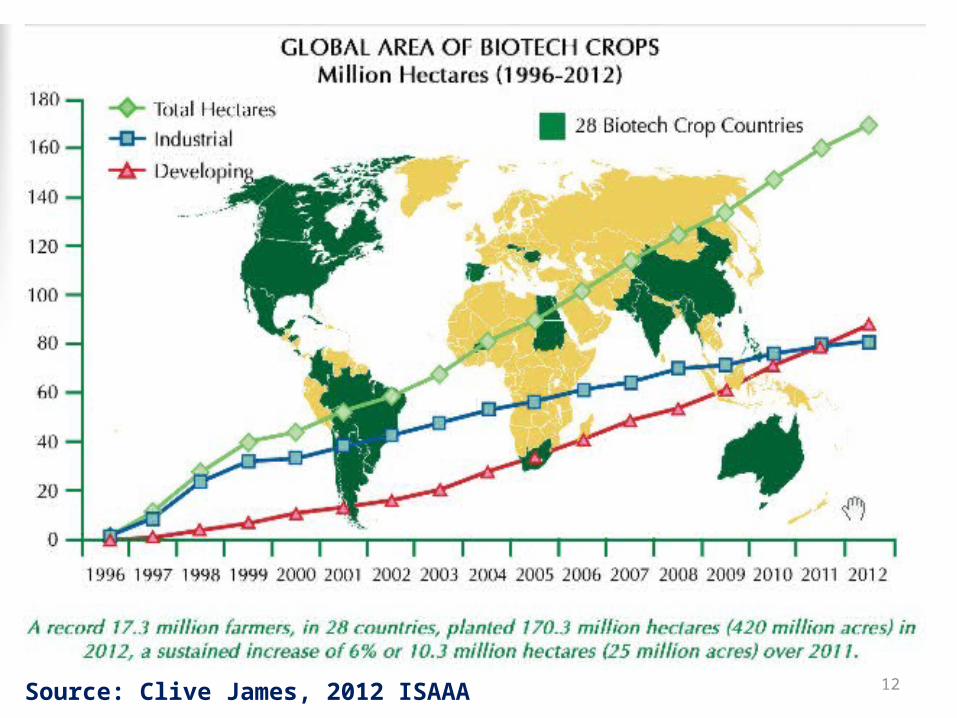
12Source: Clive James, 2012 ISAAA
13
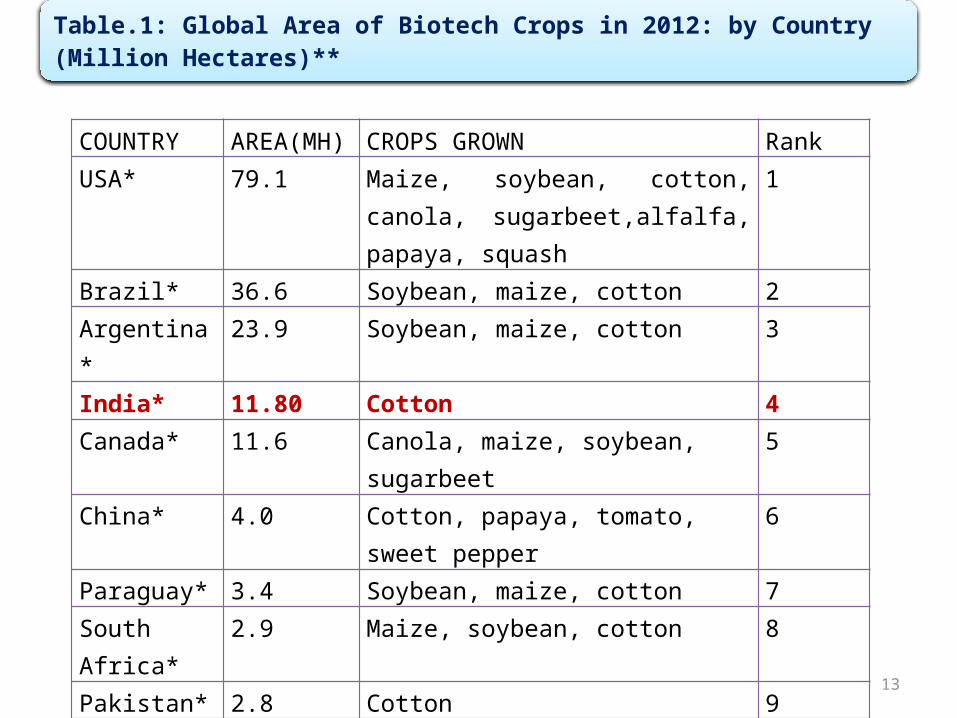
COUNTRY AREA(MH) CROPS GROWN RankUSA* 79.1 Maize, soybean, cotton, canola,
sugarbeet,alfalfa, papaya, squash1
Brazil* 36.6 Soybean, maize, cotton 2Argentina* 23.9 Soybean, maize, cotton 3
India* 11.80 Cotton 4Canada* 11.6 Canola, maize, soybean, sugarbeet 5China* 4.0 Cotton, papaya, tomato,
sweet pepper6
Paraguay* 3.4 Soybean, maize, cotton 7South Africa* 2.9 Maize, soybean, cotton 8Pakistan* 2.8 Cotton 9Uruguay* 1.4 Soybean, maize 10Bolivia* 1.0 Soybean 11Philippines* 0.8 Maize 12
Table.1: Global Area of Biotech Crops in 2012: by Country (Million Hectares)**

14
Australia* 0.7 Cotton, canola 13Burkina Faso* 0.3 Cotton 14Myanmar* 0.3 Cotton 15Mexico* 0.2 Cotton, soybean 16Spain* 0.1 Maize 17Chile* <0.1 Maize, soybean, canola 18Colombia <0.1 Cotton 19Honduras <0.1 Maize 20Sudan <0.1 Cotton 21Portugal <0.1 Maize 22Czech Republic <0.1 Maize 23Cuba <0.1 Maize 24Egypt <0.1 Maize 25Costa Rica <0.1 Cotton, soybean 26Romania <0.1 Maize 27Slovakia <0.1 Maize 28total 170.3
* 18 biotech mega-countries growing 50,000 hectares, or more, of biotech crops** Rounded off to the nearest hundred thousand Source: Clive James, 2012.ISAAA
Contd…

15
Global Area of Biotech Crops,1996to 2011: By Crop(Million Ha)
Source: Clive James, 2012 ISAAA

16
26 MARCH 2002 – A LANDMARK
Govt. of India approved Mahyco’s Bt-cotton
for control of bollworms
India’s first transgenic crop
17
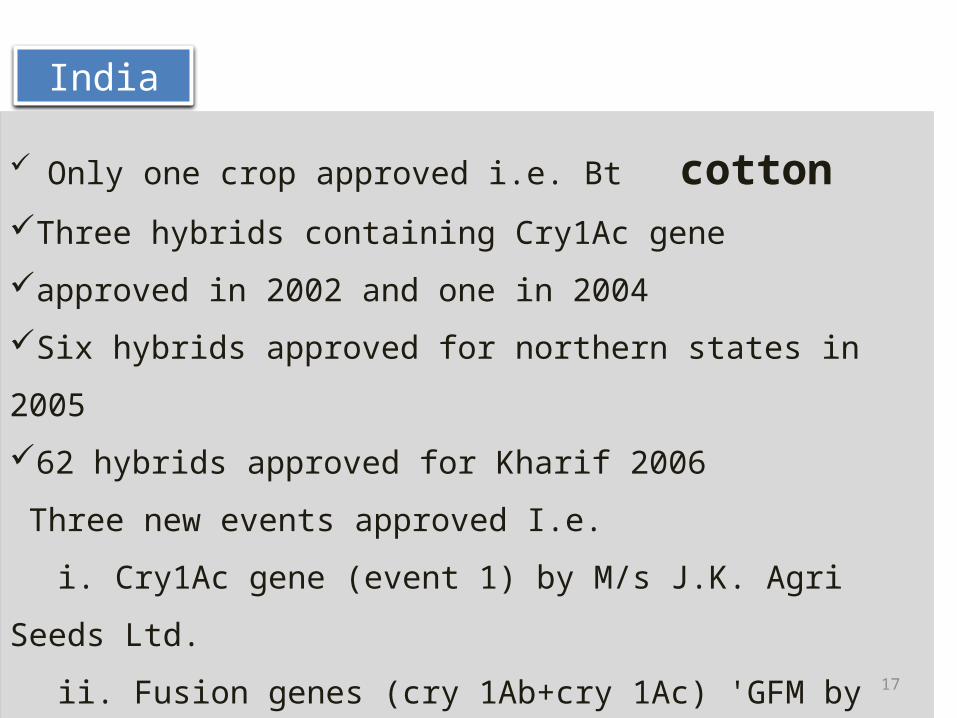
India
Only one crop approved i.e. Bt cottonThree hybrids containing Cry1Ac gene
approved in 2002 and one in 2004
Six hybrids approved for northern states in 2005
62 hybrids approved for Kharif 2006
Three new events approved I.e.
i. Cry1Ac gene (event 1) by M/s J.K. Agri Seeds Ltd.
ii. Fusion genes (cry 1Ab+cry 1Ac) 'GFM by M/s Nath Seeds
iii. Stacked genes cry1Ac and cry1Ab by M/s MAHYCO

18
Adoption of single and multiple gene Bt cotton hybrid 2002 to 2010-11
Source: Compiled by ISAAA, 2010-11

19
Bt-COTTON IN INDIATable . 2: Rapid adoption from 2002 To 2012 (in Million)
YearTotal
cotton area in hectares
Bt-cotton area in hectares
% of cotton area occupied by Bt-cotton
2002 8.73 0.03 0.3
2003 7.67 0.09 1.2
2004 7.63 0.55 7.3
2005 8.92 1.27 14.2
2006 9.16 3.80 41.5
2007 9.40 6.20 66.0
2008 9.27 7.60 82.0
2009 9.64 8.40 87.0
2010 10.94 9.20 92.0
2011 11.80 10.08 93.0
2012 11.80 11.00 94.75
2013 11.80 11.20 94.91
CAGR (%) 4.06 63.86
Source: www.GEAC.com

20
BT Cotton yield of Major cultivating state India
Source: ECONOMY SURVEY, 2011-12

21
Source: ECONOMY SURVEY, 2011-12

22
Do we need Bt- Brinjal
Brinjal is the poor men vegetable
India is the centre of origin of Brinjal.
Brinjal is susceptible to fruit and shoot borer (Leucinodes orbanalis) and Helicoverpa armigera.
These insect damage leads to 50 to 70% yield loss ($ 221millons)

23
BT-BRINJAL
1. No study as to safety of Bt-Brinjal for
environment was made.
2. Bt- toxin(16-17mg/kg) is unsafe and harmful for
mammalian consumption.
3. Bt Brinjal produces protein in the vegetable that
induce resistance to antibiotics.

24
Economic Impact on production and Indian Economy

25
Table.3: Major impact on yield
Source: Carl E. Pray ,2009

26
Table.4; Increased crop productivity
crop
1996-2011 additional production
(million tonnes)
2011 additional production
(million tonnes)
Soybeans 110.2 12.74
Maize 195.0 34.54
Cotton 15.85 2.48
Canola 6.55 0.44
Sugar beet 0.45 0.13
Source:Graham Brookes and Peter Barfoot 2013
Note: GM HT sugar beet only in the US and Canada since 2008
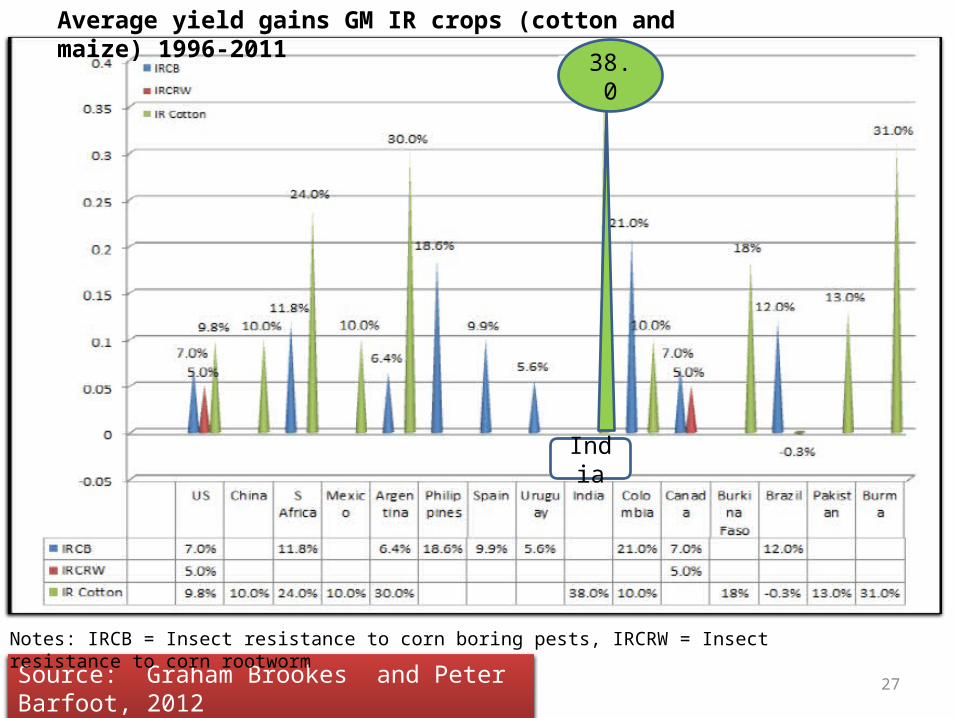
27Source: Graham Brookes and Peter Barfoot, 2012
Average yield gains GM IR crops (cotton and maize) 1996-2011
Notes: IRCB = Insect resistance to corn boring pests, IRCRW = Insect resistance to corn rootworm
India
38.0

28
Export and import of cotton in India, 2001-2010
Source:

29
2002-03 2004-05 2006-07
Bt Conventional Bt Conventional Bt Conventional
Insecticides (kg/acre) 2.07*** 4.17 2.05*** 4.19 1.22* 1.55
Yield (Kg/acre) 658.82*** 490.86 742.94*** 550.52 841.65*** 589.93
Net revenue (Rs/acre)
5294.22** 3132.99 4921.83*** 2152.08 7120.82*** 4181.26
Table.5: Comparison of insecticide use, yields, and net revenues between Bt andconventional cotton plots in India
*, **, *** Mean values are different from those of conventional cotton in the same year at a 10%, 5%, and 1% significance level, respectively
Arjunan Subramanian and Matin Qaim, 2008

30
Particulars Argentina China India Mexico South Africa
Yield 33 19 34 11 65
Revenue 34 23 33 9 65
Pesticide cost
-47 -67 -41 -77 -58
Seed Cost 530 95 17 165 89
Profit 31 340 69 12 299
Table.6: Performance advantage of IR over conventional cotton expressedas a percentage.
Source: Terri Raney, Science direct,2006

31
GM HT soybeans
GM HT maize
GM HT cotton
GM HT canola
GM IR maize
GM IR cotton
Total
US 10,422 1,402.9 804 149.2 4,778.9 2,232.7 19,789.7Argentina 7,815 46 28.6 n/a 226.8 67.9 8,184.3Brazil 2,868 n/a n/a n/a n/a 65.5 2,933.5Paraguay 459 n/a n/a n/a n/a n/a 459Canada 103.5 42 n/a 1,289 208.5 n/a 1,643South Africa 3.8 5.2 0.2 n/a 354.9 19.3 383.4China n/a n/a n/a n/a n/a 6,740.8 6,740.8India n/a n/a n/a n/a n/a 3,220.73 3,220.73Australia n/a n/a 5.2 n/a n/a 190.6 195.8Mexico 8.8 n/a 10.3 n/a n/a 65.9 85Philippines n/a 11.4 n/a n/a 33.2 n/a 44.6Romania 92.7 n/a n/a n/a n/a n/a 92.7Uruguay 42.4 n/a n/a n/a 2.7 n/a 45.1Spain n/a n/a n/a n/a 60.0 n/a 60Other EU n/a n/a n/a n/a 8.6 n/a 8.6Colombia n/a n/a n/a n/a n/a 12.6 12.6
n/a = not applicable.
Table 7. GM crop farm income benefits in selected countries, 1996-2007 ($ million).
Source: Graham Brookes and Peter Barfoot, 2012

32
YearsCost Saving
(Net after cost of technology:
$/ha)
Net Increase in Gross margin
Increase in farm Income at a national level ($
millions)
Increase in national farm income as % of
farm level value of national production
2002 -12.42 82.66 3.69 0.26
2003 -16.2 209.85 20.98 0.47
2004 -13.56 193.36 96.68 1.86
2005 -22.25 255.96 332.74 5.26
2006 3.52 221.02 839.89 14.04
2007 26.41 356.85 2093.97 22.84
2008 24.28 256.73 1.790.16 24.27
2009 22.19 211.17 1754.96 23.47
2010 23.10 265.80 2498.53 24.26
2011 23.65 299.56 3220.73 22.05
Table.8:Farm level income impact of using GM IR cotton in India 2002-2010
Source: Graham Brookes and Peter Barfoot, 2012

33
Country Area of
trait ('000
ha)
Yield
assumptio
n %
change
Base yield
(tonnes/ha
)
Farm level
price
($/tonne)
Cost of
technology
($/ha)
Impact on
costs, net
of cost of
technology
($/ha)
Change
in farm
income
($/ha)
Change in
farm income
at national
level
('000 $)
Production
impact
('000
tonnes)
US 2,585.2 +10 0.93 1,202 -46.95 -5.77 +106.02 +274,078 +240.4
China 3,800 +10 1.18 807.4 -48.07 +152.48 +248.08 +942,695 +449.9
South Africa
9.9 +24 0.692 1,172.0 -49.43 -31.23 +163.42 +1,617.8 +1.6
Australia 55.3 0 1.91 1,458 -251.3 +212.0 +212.09 +11,734.3 0
Mexico 60.0 +9.28 1.18 1088.7 -70.41 +20.49 +139.71 +8,382.1 +6.6
Argentina 162.3 +30 0.418 1,455 -37.85 -21.17 +161.31 +26,180.8 +20.3
India 5,868 +50 0.43 1,536.9 -55.29 -8.86 +321.57 +1,886,986 +1,261.6
Colombia 20.0 +9.28 0.95 1,900 -70.41 +20.49 +187.99 +3,749.8 +1.8
Brazil 358 +6.23 1.32 1,316.6 -43.94 +71.21 +135.54 +48,524 +29.4
Table.9: GM IR cotton, 2011.
Source: Graham Brookes and Peter Barfoot, 2012

34
Economic impacts of GM crops on farmers
Suitability of the crop for local conditions
Climate
Pest and disease prevalence
Cost of weed management
Subsidies and incentives offered by governments or
corporations
Cost of seed
Availability of markets for the crop.

35
GM crops-Pros
Improved resistance to pests and diseases.
Improved resistance to Herbicide
Production of more nutritious staple crops
Contribute to food security ,sustainability
Contributing to the alleviation of poverty and hunger
Increased crop productivity
Stability of production
Economic and social benefits

36
GM CROPS- CONS
Human health
Environmental hazards
Effects on Non-Target organisms andplants

37
HUMAN HEALTH Allergen and toxin
Antibiotic resistance
Unknown effects on human health
GM CROPS- CONS

38
ENVIRONMENTAL HAZARDS
Growing of GM crops may lead to
monoculture
The creation of pest or herbicide
resistant GM crops could result in
superbugs or super weeds

39
EFFECTS ON NON-TARGET ORGANISMS

40
Some of Issue and Fact that Everyone should know

41
GM contamination is a very serious risk for farmers and the nation. According to a survey by ASSOCHAM, the demand for organic food in India is estimated to be growing annually at 40%.Moreover, India is also ideally placed to meet the growing global demand for organic produce. Already India is the largest producer of organic cotton.
GM contamination is unacceptable to many countries. The discovery in May 2013 of GM wheat growing in US farms, years after field trials ended, has deeply worried wheat farmers. They recall the huge losses to US rice farmers and exporters when GM contamination of US long grain rice was detected in Europe in 2006. Protracted litigation forced Bayer CropScience to pay $ 750 million compensation.
Bt contamination of Indian organic cotton has been detected in Europe. Indian farmers do not have the financial capacity to litigate against large corporations.

42
Do GM crops increase yield?
Has cotton yield increased in India due to Bt cotton?
Have GM crops increased global food security?

43
44
To Feed a growing global population that may touch 9 billion by 2050.. The
world already produces enough food for 13 billion people, so the problem is not
of food production but of access to it by the poor.
The world’s largest GM crop adopters are USA, Brazil and Argentina. They
account for 76% of all land under GM. In the US, the percentage of food insecure
has risen from 12% in 1995 to 15% of the population in 2011.
In Brazil, the rate at which hunger is reducing has decreased. In Argentina
hunger has not decreased after the introduction of GM crops. In Paraguay,
where nearly 65% of the land is under GM, hunger has increased from 12.6% in
2004-06 to 25.5% in 2010-12.
45
46
Case Study-1
Inequality and GM Crops: A Case–Study of Bt Cotton in India
Stephen Morse, Richard Bennett, and Yousouf Ismael
AgBioForum, 2007

47
Table. 10 : Production and cost statistics for Bt and non–Bt plots of adopters and non–adopters.
Bt plots of adopters Non–Bt plots of non–adopters
2002 2003 2002 2003
Mean SD Mean SD Mean SD Mean SD
Yield (quintiles/acre) 7.67 3.16 8.16 2.94 4.15 2.53 4.49 2.69
Revenue (Rp/acre) 17,259 8,094 18,900 7,503 8,576 5,756 9,592 5,973
Cost (Rs/Acre)
Seed 1,423 617 1,356 373 417 112 415 137
Total fertilizer 876 591 976 850 892 592 967 731
Bollworm insecticide 487 798 314 330 517 491 450 474
Irrigation 55 74 90 157 30 54 45 74
Total labour 2,033 1,093 2,116 1,337 1,723 1,099 1,815 1,240
Total costs 4,736 2,074 4,852 2,589 3,622 1,948 3,636 2,303Gross margin (Rp/acre) 12,523 7,749 14,048 7,672 4,954 5,662 5,956 6,172
Sample size 38 51 45 50

48
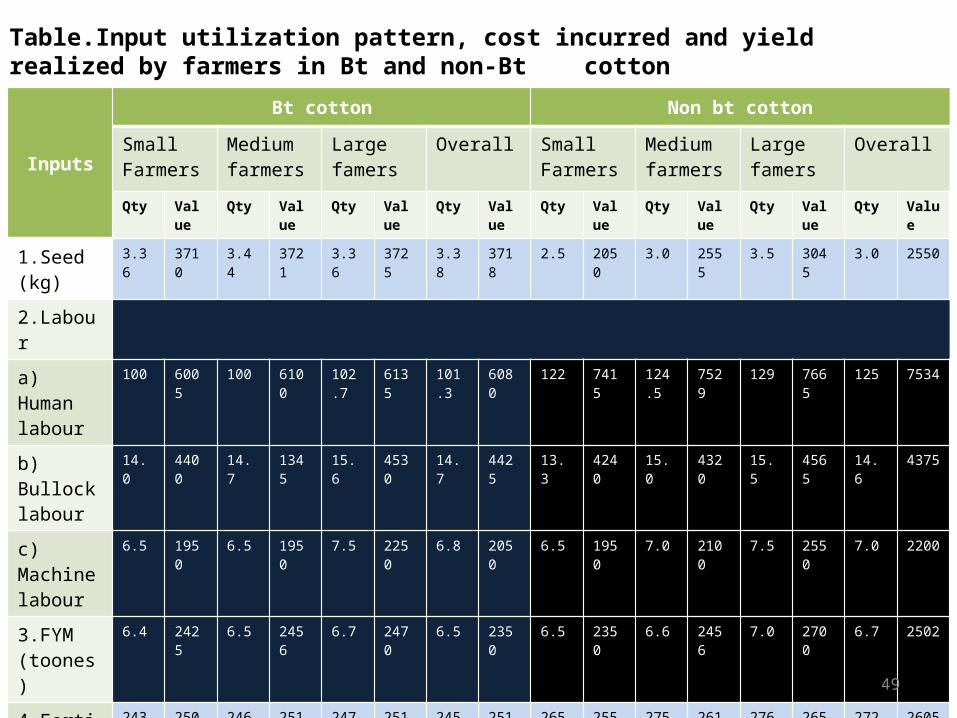
Case Study-2
Socio-Economic Impact of Bt Cotton — A
Case Study of Karnataka
V.R. Kiresur and Manjunath Ichangi
49
Inputs
Bt cotton Non bt cotton
Small Farmers
Medium farmers
Large famers
Overall Small Farmers
Medium farmers
Large famers
Overall
Qty Value Qty Value Qty Value Qty Value Qty Value Qty Value Qty Value Qty Value
1.Seed (kg) 3.36 3710 3.44 3721 3.36 3725 3.38 3718 2.5 2050 3.0 2555 3.5 3045 3.0 2550
2.Labour
a) Human labour
100 6005 100 6100 102.7 6135 101.3 6080 122 7415 124.5 7529 129 7665 125 7534
b) Bullock labour
14.0 4400 14.7 1345 15.6 4530 14.7 4425 13.3 4240 15.0 4320 15.5 4565 14.6 4375
c) Machine labour
6.5 1950 6.5 1950 7.5 2250 6.8 2050 6.5 1950 7.0 2100 7.5 2550 7.0 2200
3.FYM (toones)
6.4 2425 6.5 2456 6.7 2470 6.5 2350 6.5 2350 6.6 2456 7.0 2700 6.7 2502
4.Fertilizer (Kg)
243 2506 246 2515 247.8 2510 245.8 2510 265 2555 275 2610 276 2650 272 2605
5.PPC (Rs) - 4350 - 4412 - 4422 - 4394 - 6340 - 6377 - 6390 - 6369
Table.Input utilization pattern, cost incurred and yield realized by farmers in Bt and non-Bt cotton

50
Contd…
Inputs
Bt cotton Non bt cotton
Small Farmers
Medium farmers
Large famers Overall Small
FarmersMedium farmers
Large famers Overall
Qty Value Qty Value Qty Value Qty Value Qty Value Qty Value Qty Value Qty Value
6.Yield(quintal) 23.6 24 24.5 24 17.8 18.5 19 18.4
Gross returns(Rs) 66080 67200 68600 67284 49480 51800 53200 5193`
Net Returns(Rs) 30014 3080 31035 30618 11797 11912 11854 12189
Net returns per rupee of investment 1.83 1.84 1.82 1.83 1.31 1.33 1.28 1.31
Additional cost over non-Bt(Rs) -1617 -2495 -3781 -2631
Additional returns over non-Bt (Rs) 16600 15400 15400 15791
Additional net returns from Bt (Rs) 18217 17895 19181 18429

51
CONCLUSION

52