economic impact analysis of terrorism events: recent
TRANSCRIPT

JOINT TRANSPORT RESEARCH CENTRE
Discussion Paper No. 2008-22November 2008
Economic Impact Analysis of Terrorism Events:
Recent Methodological Advances and Findings
Peter GORDON, James E. MOORE and Harry W. RICHARDSON
Center for Risk and Economic Analysis for Terrorist Events (CREATE)
University of Southern California, Los Angeles, USA


Gordon et al. — Discussion Paper 2008-22 — © OECD/ITF, 2008 1
JOINT TRANSPORT RESEARCH CENTRE
Discussion Paper No. 2008-22
Prepared for the OECD/ITF Round Table of 11-12 December 2008 on
Security, Risk Perception and Cost-Benefit Analysis
ECONOMIC IMPACT ANALYSIS OF TERRORISM EVENTS: RECENT METHODOLOGICAL ADVANCES AND FINDINGS
Peter GORDON James E. MOORE II
and Harry W. RICHARDSON*
Center for Risk and Economic Analysis of Terrorist Events (CREATE)
University of Southern California Los Angeles, Ca.
USA
November 2008
The views expressed in this paper are the authors’, and do not necessarily represent the opinions of either the University of Southern California or the International Transport Forum.

2 Gordon et al. — Discussion Paper 2008-22 — © OECD/ITF, 2008
TABLE OF CONTENTS
ABSTRACT ................................................................................................................. 3
1. INTRODUCTION .................................................................................................. 4
2. OPERATIONAL MODELS .................................................................................... 5
3. APPLYING TWO OPERATIONAL ECONOMIC IMPACT MODELS TO SIMULATIONS OF A HYPOTHETICAL ATTACKS .............................................. 7
4.TRANSNIEMO ....................................................................................................... 11
REFERENCES ......................................................................................................... 14
Los Angeles, November 2008

Gordon et al. — Discussion Paper 2008-22 — © OECD/ITF, 2008 3
ABSTRACT
National security is a basic responsibility of national governments, but it is also intangible. What can economic analysis contribute? Benefit-cost analysis has rarely been applied because of the ambiguous and commons nature of the benefits. Our group at the University of Southern California’s Center for Risk and Economic Analysis of Terrorism (CREATE) has worked to elaborate and apply economic impact analysis to describe the expected losses from various hypothetical terrorist attacks. Our innovation has been to add a spatial dimension to operational inter-industry models. Plausible terrorist attack scenarios must include geographic detail. First, there is no generic national seaport, airport or similar targets. Second, most political decision makers represent geographic areas and have a keen interest in their local constituencies. Third, aggregation over spatial units may net out conditions where areas and sectors lose but others gain, especially if locations outside the impact area take over the functions that have been lost elsewhere. Fourth, by considering the spatial economy, interactions between places that rely on available infrastructure can be analyzed. This paper describes our modeling approaches (a metropolitan region model and two national models) as well as several of the results that we have developed. Our models are not formal cost-benefit analyses, but they demonstrate large business interruption costs from these events, implying that the results provide a rationale for expenditures on the benefits of protection and mitigation. We will also discuss important directions in which models such as ours could become the basis of some type of cost-benefit analysis. *The authors would like to thank Ji Young Park and Qisheng Pan for their outstanding assistance.

4 Gordon et al. — Discussion Paper 2008-22 — © OECD/ITF, 2008
1. INTRODUCTION
The U.S. did not suffer enduring economic losses from the attacks of September 11, 2001. Estimates of GDP losses range from $22 to $34 billion; estimates of structure losses range from $27 billion to $95 billion.1 But the former have to be qualified by the fact that the nation was in a mild recession in 2001, making the identification of terrorism-induced GDP losses difficult. U.S. GDP in 2001 was more than $10 trillion, indicating that the estimated losses were smaller than might have been feared. Significant impacts on government expenditures came later via the wars waged in Afghanistan and Iraq and the increased budgets for homeland security measures. Furthermore, enough time has elapsed since 2001 to ease any fears of a long-term productivity and/or output shock. The economic downturn of 2007-2008 is explained by credit market contractions, the mortgage crisis and commodity price increases that probably have nothing to do with the events of 2001. However, proper risk management and contingency planning require efforts to understand the nature of any future attacks better. After all, through most of the Cold War, planners and policymakers developed scenarios to simulate the losses from hypothetical nuclear attacks. The threats of transnational terrorism are different. First, there have been relatively few annual average fatalities from terrorist attacks. (Sandler et al, 2008). Therefore, application of traditional cost-benefit analysis is probably inappropriate. Even if all fatalities could be averted, the benefits (the monetary value of deaths avoided using conventional statistical measures of the value of a life) are very small compared to the costs of achieving these benefits. Second, there is an uncountable number of global targets that terrorists consider attacking. It is impossible to protect them all. These observations clarify the research challenge. The two realities cited make it important for homeland defense and national security decision makers to identify targets that are the most critical and harden these as much as possible. But how can these key targets be identified? The task involves two research challenges. First, specify plausible attack scenarios. Given the capabilities of terrorists, which attacks could they plausibly execute? Second, estimate the economic losses from such attacks. Our interest is in the latter, but we rely on the work of other experts colleagues for the former. In our work on a possible “dirty” bomb attack (i.e. a radiological device) on the twin ports of Los Angeles and Long Beach, we relied on the work of Rossoff and von Winterfeldt (2007),
1 Sources summarized in Appendix Table A1.
Gordon et al. — Discussion Paper 2008-22 — © OECD/ITF, 2008 5
who examined 36 possible attack scenarios and reduced these to the two most plausible. We used their scenario information to apply the Southern California Planning Model (version 2 is discussed in what follows, SCPM) and the National Interstate Economic Model (NIEMO) to estimate plausible business interruption losses by industry and by place in the greater Los Angeles metropolitan area and beyond. This discussion, elaborated in Section 3, which highlights one of several examples that we present in order to establish the point that spatially detailed information is essential. We discuss several applications of both of our models, starting with an application of the models to the same hypothetical attack. We also introduce a third model currently being developed, TransNIEMO, which integrates features of each approach. It adds an interregional highway model to NIEMO, allowing us to trace the economic impacts of various hypothetical shipment disruptions anywhere on the national highway network, one which includes thousands of major bridges. Credible cost-benefit analysis of protecting key bridges or tunnels requires a model that integrates the economy with the highway network.
2. OPERATIONAL MODELS2
a. The Southern California Planning Model (SCPM)
Inter-industry models, based on the transactions flows between intermediate suppliers and end producers, are widely used to measure regional economic impacts. They trace all economic impacts, including those of intra- and interregional shipments, usually at a high level of sectoral disaggregation. They are usually demand-driven, although there are some supply-driven applications.
The input-output model component of both models discussed in this paper is from the Minnesota Planning Group’s well-known IMPLAN model, which has a high degree of sectoral disaggregation (over 500 sectors). To make these data compatible with data from other sources, we aggregated them to 47 sectors, which we label the USC sectors. The second basic model component of SCPM is spatial; it allocates sectoral impacts across more than 3,000 small geographic zones (Traffic Analysis Zones, TAZs) throughout Southern California (the five-county region of greater Los Angeles). The key capability of the model is to allocate the indirect and induced impacts generated by the input-output model spatially to these TAZs. The direct impacts are always the final demand changes at the site of the attack (in this case, at the ports); the indirect effects trace the inter-industry linkages with other sectors, either forwards or backwards (locally, regionally, nationally and internationally); and the induced effects measure the secondary consumption impacts associated with the reduced spending of workers in both the direct and indirect sectors. To estimate the latter, we use a journey-to-work matrix that shows all the commuting flows between residential zones and workplace zones to trace wages earned back to the home, and then we use a journey-to-services matrix to trace retail and personal service purchases from the home to retail and
2 Parts of the next two sections are drawn from Richardson, et al. (2008).

6 Gordon et al. — Discussion Paper 2008-22 — © OECD/ITF, 2008
service establishments. This follows the logic first proposed by Ira Lowry (1964) and elaborated by Garin (1966). The journey-to-services matrix includes any trip associated with a home-based transaction other than the sale of labor to an employer. This includes retail trips and other service transaction trips, but excludes non-transaction-based trips such as trips to visit friends and relatives.
SCPM endogenizes traffic flows. It uses TAZs for traffic nodes. This feature of the model is important, because many types of terrorist attack are likely to induce changes in supply, including infrastructure capacity losses that will contribute to reductions in network level service and increases in travel delays.
Because traffic flows are endogenous, any change in economic activity that affects the travel behavior of individuals or the movement of freight will influence how the transportation network is used, and these impacts will work themselves out as a change from one network equilibrium to another. This means that the model has the important capability to estimate losses from concurrent attacks against shipping, infrastructure and productive capacity.
Treating the transportation network and its capabilities explicitly endogenizes the otherwise exogenous travel behavior of households and intraregional freight flows, achieving consistency across network costs and origin-destination requirements. The model makes explicit distance-decay (i.e. the decline in the number of trips with increasing distance) and congestion functions (the build-up of traffic congestion and delay costs as particular routes attract more traffic when other parts of the network are disrupted).
This capability allows us to determine the geographical location of indirect and induced economic losses; essentially, we are endogenizing route and destination choice. This also enables us to allocate indirect and induced economic losses over TAZs in response to port-related direct losses in trade, employment and transportation accessibility more accurately. See Cho et al. (2001) for a technical summary of an earlier version of this model).
A flow chart of the model is shown in Figure 1.
b. NIEMO (the National Interstate Economic Model)
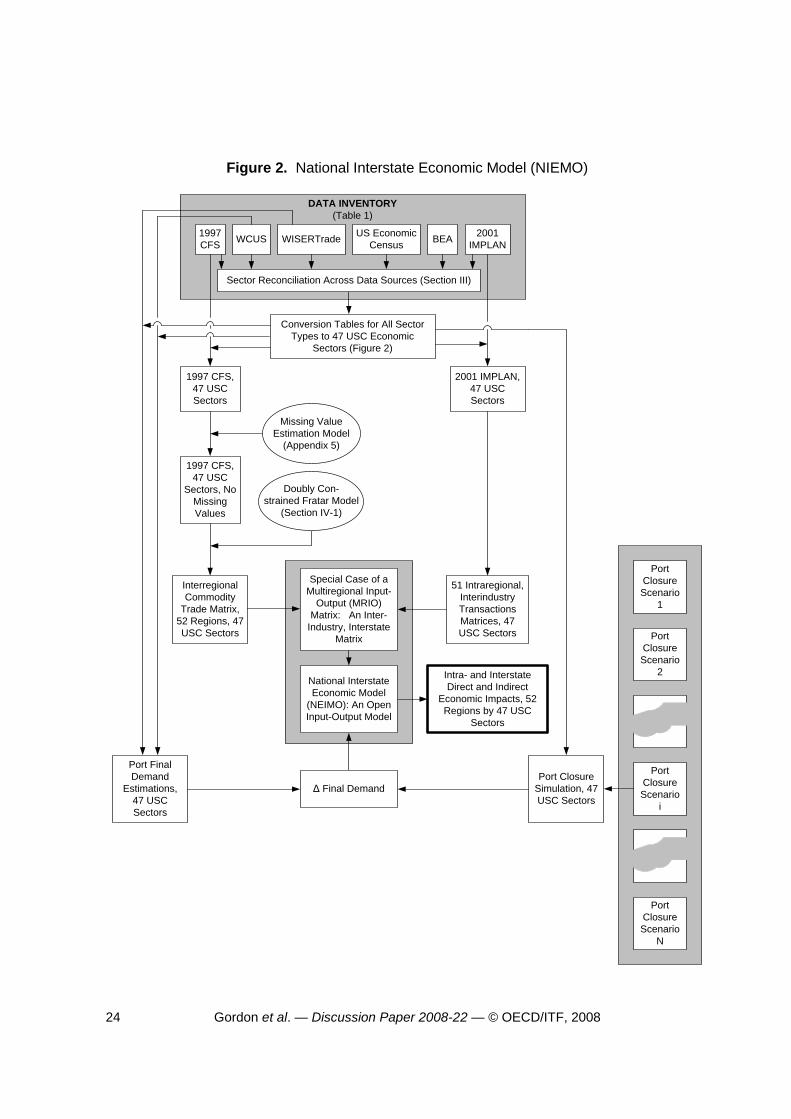
In pursuing our research goal of creating operational models with sectoral and spatial detail, the choice of approaches involved difficult trade-offs. The use of linear economic models is justified by various factors, including the richness of the detailed results achieved at relatively low cost. NIEMO, for example, includes approximately 6-million multipliers. The principal insight that drives our research is that, with some effort, it is possible to integrate data from MIG, Inc.’s IMPLAN state-level input-output (IO) models with commodity flow (interstate shipments) data from the Department of Transportation’s Commodity Flow Survey (and some other sources) for all individual States. The details of how NIEMO was constructed can be found in Park et al (2007). Essentially the model is an operational version of the Chenery-Moses multi-regional input-output model (MRIO) that involves the 50 U.S. states (plus the District of Columbia) and the 47 USC sectors. A flow chart of this model is shown in Figure 2. And just as there are demand-driven and supply-driven, input-output models, we have developed demand-driven and supply driven versions of NIEMO. In each case, the supply-driven approach is most plausibly applied for the case of short-run disruptions.

Gordon et al. — Discussion Paper 2008-22 — © OECD/ITF, 2008 7
The interruption of purchasing by firms will have short term multiplier effects and the interruption of sales can also have short-term multiplier effects. Interrupting port services can cause both kinds of problems. Interrupted export opportunities suggest the application of the demand-side model. The case of interrupted imports is less clear because some are for final users while some are supplies to intermediate users.
3. APPLYING TWO OPERATIONAL ECONOMIC IMPACT MODELS TO SIMULATIONS OF A HYPOTHETICAL ATTACKS
a. The Los Angeles/Long Beach Harbors
There are two adjacent ports in Southern California. Though administered separately, we treat them as one. The Los Angeles/Long Beach ports’ role in the local and national economy is widely recognized. In a metropolitan region of more than 16.4 million people with a labor force of almost 7.5 million, the twin ports account for 111 million tons of seaborne trade, and are the fifth largest port complex in the world after Hong Kong, Singapore, Shanghai and Shenzen. Directly and indirectly, the two Los Angeles ports employ 600,000 workers, accounting for more than seven percent of the region’s labor force. In terms of containerized traffic, the two ports rank first and second nationally. Their combined import and export trade flows of $300 billion (2004 data) is equivalent to about 30 percent of the greater Los Angeles area gross regional product. Reflecting trends in the national economy, imports are much larger than exports. About one-half of the imports and two-thirds of the exports are to and from outside the region. The ports fulfill a national function; any loss of transshipment capabilities at these sites would have profound impacts both locally and nationally.
Such impacts would be much wider than a short-term deprivation of imported purchases by consumers or deferred export sales by producers. The supply chains for imported raw materials and intermediate inputs are would be interrupted and, as a result, the productive capacity of firms both inside and outside the region is reduced.
In the first application discussed, we assume that both export and import flows currently using local seaport facilities would terminate for as long as the ports were out of service. We have not yet modeled port diversion, but plan to do so in future research probably beginning with a survey of fleet operators.
We have applied SCPM to explorations of simultaneous radiological bomb attacks on the twin ports of Los Angeles and Long Beach. These could either be brought in by containers or planted within the country very close to the port perimeter, assuming that the terrorists have access to suitable radioactive material within the United States. The extent of the disruption would depend on the size of the bombs. Following Rossoff and von Winterfeldt (2007), we assumed the explosion of two small RDDs (radiological dispersal devices), each of them containing 5lbs of high explosive, more or less simultaneously at the two ports. The attack would require the closure of both ports on health even more than on security grounds. When

8 Gordon et al. — Discussion Paper 2008-22 — © OECD/ITF, 2008
the ports might reopen would be a policy rather than a technical decision, but without the transportation access the reopening would have minimal consequences
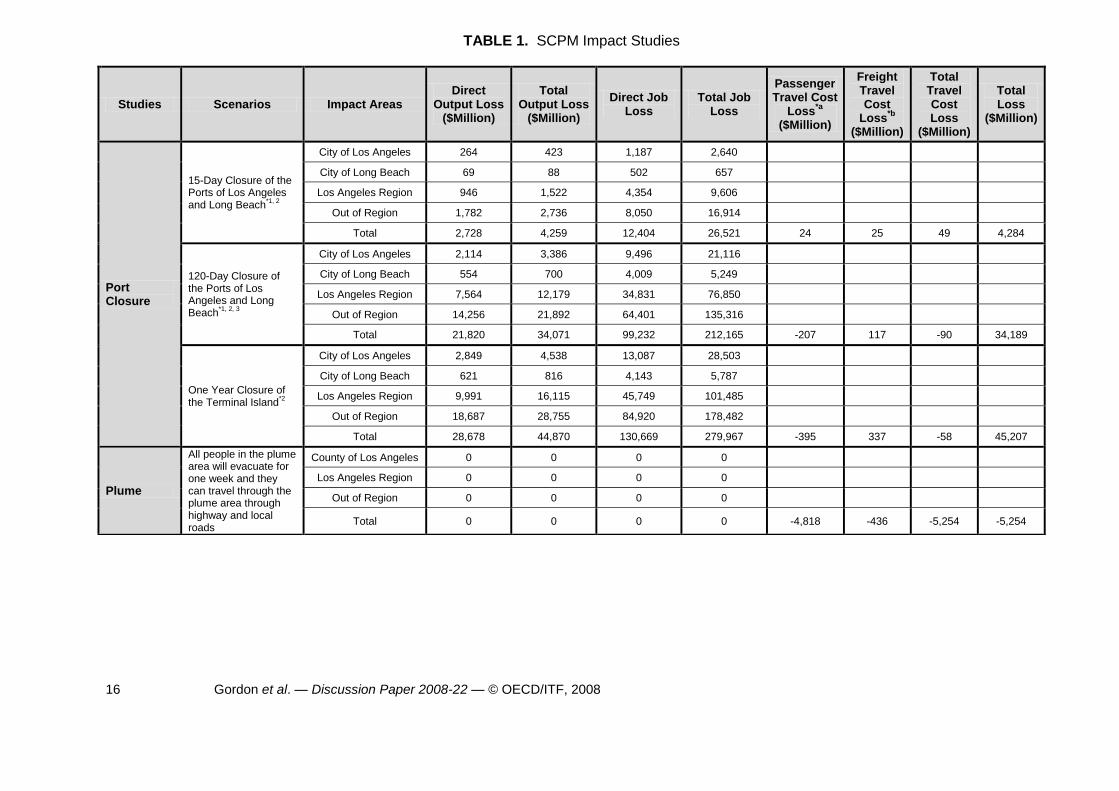
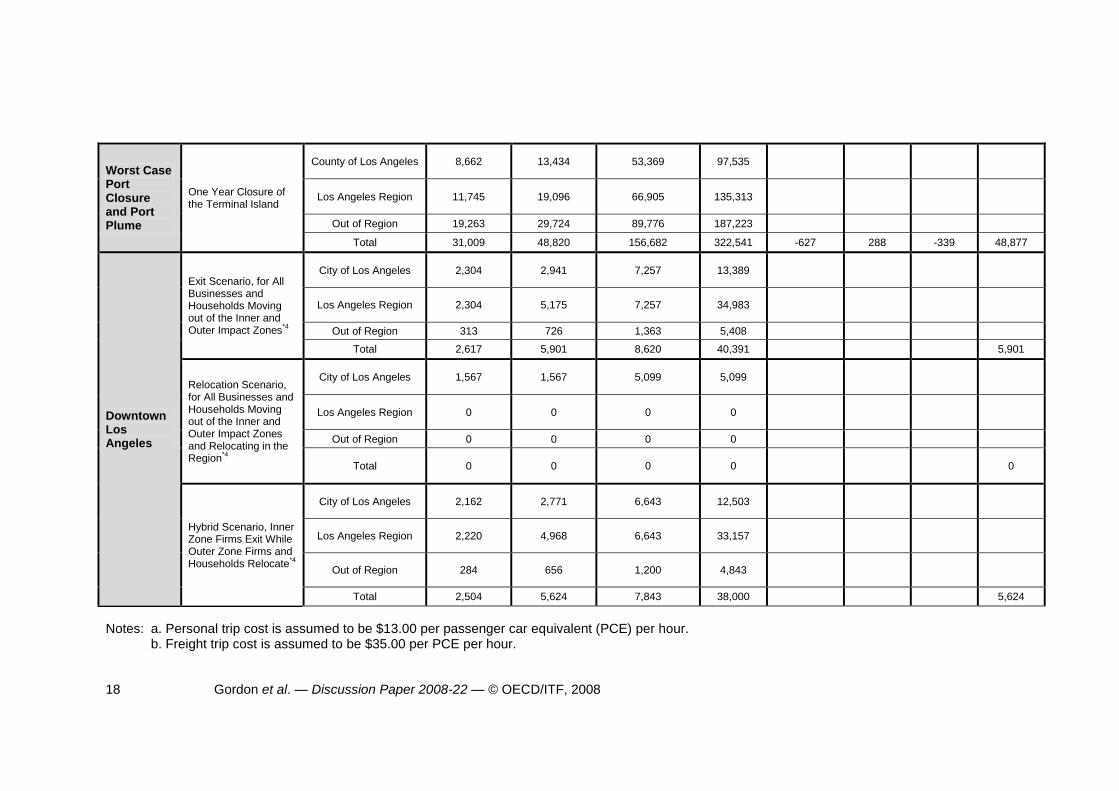
Although we estimated that the closure of the Los Angeles and Long Beach Ports for anywhere from 15 to 120 days (for the latter case we combined the radiological bomb attacks with conventional bombs blowing up three key access bridges/overpasses), Panel B of Table 1 shows the range of possible losses for various scenarios involving the plume of radioactive effects. Panel C is a summary of worst-case effects from port closure and plume effects. It could cost the U.S. economy almost $49 billion – or more than 322,500 person-years of employment. Recall that SCPM actually reports results in much greater detail, to the level of census tracts or traffic analysis zones if required.
b. Plume Effects of the Harbor Attack
SCPM also made it possible to measure the economic impacts of plume effects in terms of household disruption, business losses and the decline in real estate values. This part of the simulation is discussed separately because it illustrates the complexity (and the benefits) of estimating traffic impacts simultaneously with economic impacts. The numbers shown are somewhat speculative, but our best estimate is a $4 billion loss in output and close to a decline of 42,600 person-years of employment. Blast damage would be limited, with deaths and serious injuries within a range of perhaps 50 meters and with moderate damage to physical infrastructure, except at ground zero. The outer evacuation zone would include all areas with exposure > 1 REM. We assume a hypothetical radiation plume, a long narrow ellipse 4 kilometers long and more than 200 meters wide with an inner and more contaminated zone of about 100 meters radius (an area of 0.03 km2); there are standard formulae for converting releases of Curies of radiation to plume areas and shapes, subject to wind direction and other climatic conditions. In the ports case, the wind usually comes in from the South West, so the plume would not affect Los Angeles International Airport or other strategic locations except for the ports themselves. The critical early phase of exposure lasts about 4 days (EPA guidelines); the time frame for intermediate and later phases is variable and subjective, and could range from weeks to years. We assume a one-week evacuation in the Outer Zone. With respect to the Outer Zone, this may be conservative because some firms and households may only slowly return with a lag after given permission to return. Health factors may dictate an immediate evacuation, but because the health effects are long-term, the decision to allow a return will be determined more by political than scientific considerations.
The more speculative economic impact consequences of a radiological bomb attack relate to the radiation plume. They depend on many variables: the size of the bomb, the amount of the radioactive release, the wind direction and prevailing climatic conditions, and the downwind population and business densities. Moreover, much depends on the public policy reaction, for example, whether to mandate an evacuation, and, if so, when to allow people to come back; or whether to proceed in a more measured if less cautious manner. Given these uncertainties, we report here only our best estimate of the maximum economic impacts of the plume to compare with the economic effects of the interruption of trade to and from the ports. By maximum, we mean under a reasonable set of assumptions. Net input-output effects are very modest because shopping and services consumption shifts to other locations outside the plume area. Specifically, we assume in the first year after the

Gordon et al. — Discussion Paper 2008-22 — © OECD/ITF, 2008 9
attack a 25 percent drop in residential property values, a 25 percent reduction in retail trade, and a 10 percent fall in other business activities, and also that these businesses leave the region. An alternative assumption is that the businesses might relocate elsewhere in the region in which case the impacts would be primarily redistributional from a spatial perspective and the net effects would be minimal. As for travel behavior, we assume that driving through the plume area, with attendant advice about rolled-up windows, the use of air conditioning and regular car washing, will be permitted rather than the more extreme measure of closing entry and exit roads, especially the freeways. However, there are network effects as the average length of personal trips increase as plume area residents are forced to shop and access services outside their neighborhoods. Although there are fewer total trips, longer trips and more congestion results in significantly higher network costs. Our calculations of the additional network costs yield an estimate of $1.63 billion, based on a personal trip imputed cost of $13 per hour and a freight trip cost of $35 per PCE (Passenger Car Equivalent, based on the convention that one truck is the equivalent of 2.25 cars). Based on the U.S. Census of 2000, there were 401,147 persons living in the 30 TAZs of the impact area. The evacuated population would be 377,442. Table 1 (Panel B) summarizes the input-output consequences of reduced economic activity and lower property values in the outer plume area. The total output loss is more than $4.1 billion, of which only a small part, about $167 million, is associated with the decline in property values. Two-thirds of the losses take place within Los Angeles County and almost one-quarter leak outside the region. In terms of employment, the total job losses are 44,555 person-years of employment. c. Plume effects of an attack on the Los Angeles CBD To further illustrate our approach and for comparison, we have also undertaken another study of a radiological bomb attack, in this case on a prominent downtown Los Angeles office building. A radiological bomb attack on downtown Los Angeles might be a $6 billion event. If a similar attack were mounted in more CBD-oriented metropolitan areas (such as New York, Chicago or San Francisco), the economic impacts would be much larger. An attack on downtown would much less damaging than a similar attack on the ports because the economic disruptions resulting from closure of America’s largest port complex (in terms of $ of trade) would be far greater than a disruption to Los Angeles’ modest financial and office sector.
An important difference between an attack on the ports and an attack on downtown is that the critical public policy reactions might vary significantly in the two cases. In the ports case, there would be more economic pressure for the ports to reopen quickly and it would be feasible to put the port workers and/or the military back to handling trade (with protective clothing and equipment if necessary). In the downtown case, there are public spaces and more of the general public involved, and this might imply much more caution in allowing activities to resume sooner rather than later, especially in the inner plume zone.

10 Gordon et al. — Discussion Paper 2008-22 — © OECD/ITF, 2008
d. NIEMO simulation of an attack on the Los Angeles/Long Beach harbors. We have not applied NIEMO to precisely same attack on the Los Angeles and Long Beach Ports discussed previously. But Table 2 shows results from the simulation of a slightly different scenario. The point that we want to make is that the sub-metropolitan results available from SCPM can be derived along with relevant state-by-state impact information. NIEMO applications to studies of this type are made possible by detailed (sector-specific and monthly) waterborne trade information from WISERTrade for each major seaport.
The loss of export opportunities lends itself to demand-multiplier analysis. Interrupted seaport export opportunities, then, are the final demand changes that are processed by NIEMO. And we chose to be conservative and avoided also using a supply multiplier for the loss of imports. So only direct effects of import losses are included. Combining these, we see that total damage resulting one-month closure of the three largest U.S. Seaports compare to the costs of an LA/LB closure in approximate importance of their size. NIEMO’s information on the effects on the other states showed, in each instance, that the impacts where in approximate proportion to the size of the state and its nearness to the port that was affected. e. Other model applications
Table 3 summarizes some of the other NIEMO applications. We include results from our study of a hypothetical terrorist attack on other major seaports as well as on U.S. theme parks. The seaports study (Park, et al., 2007) was carried out in the same way as the NIEMO application to Los Angeles-Long Beach described in the previous section. As before, multiplier effects are applied to the interrupted export opportunities while only the direct effects of lost import opportunities are included. Again, state-level impacts were roughly in proportion to the size of the state as well as its distance from the attack. Congressional representatives from anywhere can use these results for an estimate of how a distant port supports their local economy – and thereby assess their constituents’ willingness to support its protection or reconstruction. NIEMO is also useful for assessing the value of a variety of targets. Theme parks attract a national and an international clientele. They may also attract the attention of terrorists for the reason that terror can be a psychological as much as an economic weapon. For this application, we identified 13 major parks (including two clusters of parks) that may be tempting targets in light of their size and prominence. We gathered information on the number of annual visitors as well as the average length of stay and the nature and size of expenditures for each visit. We tested park closure for one month followed by 30 percent operations for the next six months followed by slow recovery to full operations by the eighteenth month after the attack. This schedule of reduced visits defined the direct effects that were used for runs of NIEMO. Various scenarios were studied. Were there impacts only on the theme park that was attacked? Or were there psychological spillover effects that affected visits to other major parks? And for each scenario, were there substitutions by visitors to, for example, the major national parks? Total losses were sensitive to these assumptions. Results are shown in Table 3.

Gordon et al. — Discussion Paper 2008-22 — © OECD/ITF, 2008 11
4.TRANSNIEMO
Work in progress involves adding a representation of the national highway network to NIEMO. We call this TransNIEMO. Whereas the endogenization of interstate trade flows is an important step, it is equally important to consider the media over which trade flows occur. In discussions of possible terrorist targets, it is clear that these lifelines include important targets. All of this is all the more important in an era of dispersed settlement, increased container shipping and distribution centers.
The application of TransNIEMO involves three major steps:
i. Use NIEMO to estimate baseline interstate trade flows and allocate the portion using the highway network to shortest path routes.
ii. Estimate increased costs due to re-routings on the modeled highway network
system prompted by specific losses of network links, and iii. Conduct state-by-state economic impact analysis by applying NIEMO again, to
capture effects of decreased household consumption, resulting from price increase of products shipped via second-best routes.
The core idea of TransNIEMO involves the estimation of increased costs on the highway network system for a plausible scenario, e.g., destruction of a bridge. Figure 3 shows the framework for developing the model. The first major step in developing this model is to allocate commodity trade flows to the highway network, which accommodates approximately 73 percent of total trade flows. The National Highway Planning Network (NHPN) has about 452,000 miles of roads, of which the Freight Analysis Framework (FAF) contains 245,500 miles. This includes 46,380 miles of Interstate Highways, 162,000 miles of National Highway System (NHS) roads, 35,000 miles of other national roads, and 2,125 miles of urban streets and rural minor arterials and many bridges and tunnels. However, rail, air, and water networks cannot be ignored, and we plan to address integrating the other modes in future research.
Not surprisingly, combining the FHWA FAF network with NIEMO to create TransNIEMO involved many data manipulation and management challenges, because the FAF network seems to have been compiled from multiple sources. In addition, modeling transportation flows on a national network connecting urban centers includes requirements not associated with metropolitan level models. In particular, the national network is very complex. Economic space must be represented in a more aggregate way, making procedures for allocating freight demand to physical facilities much less obvious than in the metropolitan case. Our group has invested considerable attention in identifying meaningful, computationally tractable means of representing the details of the national economy in a way that articulates with the national highway network.

12 Gordon et al. — Discussion Paper 2008-22 — © OECD/ITF, 2008
We have, to date, made good progress and expect TransNIEMO to be operational very soon. We expect to apply it to the determination of the economic losses associated with the loss of any major highway link. This approach can also be the basis for assessing the value of any particular link, should a cost-benefit analysis rather than an impact study be necessary.
5. OTHER STUDIES Our group undertook studies of two other terrorist issues that rely much less on our modeling methodologies. One is an attack on the airline system. One of the studies monitored the repercussions of the 9/11 attack. The loss estimates were large. When compared to the estimated costs of countermeasure deployment, it appears that the deployment is justified for a wide range of probabilities of attack. Using airport-level data to study the impact of the September 11th terrorist attacks on domestic air travel in the United States, the estimates are similar to those made by Ito and Lee (2005), who used nationally aggregated data in previous work. The study also found that 9/11 may have had more adverse impacts on large airports than on small airports. This could be the result of 9/11’s various impacts (including its impact on risk perceptions and security procedures) being relatively severe in the case of large airports. It is also possible, however, that this result was the result of changing trends in the market for air travel. There was no evidence that east coast airports were more adversely affected than west coast airports, and it is possible that a companion study of international air travel would reveal somewhat different, perhaps stronger, results. The second study used IMPLAN’s national input-output model. A national model is preferred because the state-by-state airline revenue losses are difficult to estimate in light of the geographically dispersed nature of airline carriers and related infrastructure and vendors. In this case, the research considered the effects of a ground-based rocket attack on a single airplane. The scenario examined a seven-day shut-down of the entire U.S. air transportation system, followed by a two-year period of recovery, using the post-9/11 experience of the system as a basis for analysis. The overall loss estimates for the two years range from $214 billion to $420 billion. There have been two other precursor attempts to model a disruption of the U.S. air transport system. Balvanyos and Lave (2005) estimated consumer surplus losses from an air travel shut down and reported that the estimated loss would be up to $2 billion per day. Santos and Haimes (2004) have published results from an input-output impact simulation of a 10-percent air transport system shutdown ($12 billion of direct effects). These authors derived input-output multipliers of 1.2 (Type I) and 3.6 (Type II) for the U.S. to estimated a range of total losses from $14.2 billion to $43 billion for the year. Although our numbers are much higher, all the studies tend to justify that protective investments are justified, unless the probability of attack is perceived as very low. Our research group also undertook two companion studies of the possible effects of border closure associated with a pandemic avian flu outbreak. This could be either a natural event or a planned terrorist attack. Such an attack might lead to an extreme response, border closure. This would include no international migration, no international travel and no commodity trade (apart from oil imports) for a full year. The economic costs are very high, about $2.1 trillion, and the impacts vary from state to state (Gordon et al., 2008). Interestingly, the magnitude of estimated costs is close to the cited median dollar value of expected loss of life (386,000 deaths according to Murray et al., 2006). However, a problem
Gordon et al. — Discussion Paper 2008-22 — © OECD/ITF, 2008 13
with this type of research is how can we model extreme events? Most available models focus on perturbations at the margin. Yet, policy makers are compelled to think about events beyond the margin. For example, work by RAND researchers on the effects of nuclear attack makes use of “scenario analysis” and “strategic gaming” exercises that rely fundamentally on expert judgment (Meade and Molander, 2007; see also Carter, et al., 2007). The second study (Rose et al., 2008), using a macroeconomic model (the REMI model) predicted a reduction in GDP of as much as $1.4 trillion measured in 2006 dollars, or about 10.5 percent of GDP (Rose et al., 2008). Employment losses were predicted to be over 22 million, or more than 12 percent below base levels. The authors suggested that these estimates might be upper bounded, and that inclusion of several aspects of resilience, such as input substitution and domestic excess capacity, might reduce them.
6. CONCLUSIONS
This paper sums up some of the research that our economic modeling team at CREATE has been working on for the past three years. The research is both methodological and substantive. The methodological innovation is to emphasize the spatial dimensions of the economy. This requires trade flows and the networks over which they flow be recognized in the models. The substantive approach is to consider the business interruption consequences of bomb attacks, both radiological and conventional, at the twin ports of Los Angeles-Long Beach. The economic impacts are very substantial. Although the potential loss of life from terrorist attacks attracts more attention and, no doubt, would have serious psychological effects, the business interruption impacts are large enough to persuade terrorists that economic targets are as “productive” as human targets.
How can our modeling approaches support standard benefit-cost analysis? We introduced our approach by noting that it is comparatively simple to apply and that its findings could aid policy makers concerned with hardening vital facilities. We can also indicate that our models emphasize network effects and are, therefore, a prerequisite to cost-benefit analysis. The marginal value of any facility is only known once the system-wide losses of its removal are known. But system-wide losses can only be estimated once adaptations and substitutions have been examined. This is the value of TransNIEMO and explains our high hopes for its widespread application.
Our position is that, both, plausible terrorist attack scenarios and the proper models to use must include geographic detail. There are several reasons for this. First, there is no such thing as a generic national seaport or airport or other similar target. Second, most political decision makers represent geographic areas and have a keen interest in these constituencies. Third, aggregation over spatial units may net out important distinctions because there may be situations where there are areas and sectors with losses but others with gains, especially if locations outside the impact area take on the functions that have been lost. Fourth, by considering the spatial economy, interactions between places that rely heavily on the available infrastructure, including major seaports and airports, can be analyzed.

14 Gordon et al. — Discussion Paper 2008-22 — © OECD/ITF, 2008
REFERENCES
Balvanyos, T. and L. B. Lave (2005) “The Economic Implications of Terrorist Attack on Commercial Aviation in the USA,” report to the Center for Risk and Economic Analysis of Terrorism (CREATE), University of Southern California, Los Angeles. Carter, A.B., M.M. May and W.J. Perry (2007) “The Day After: Action Following a Nuclear Blast in a U.S. City” Washington Quarterly, 30: 19-32. Cho, S., P. Gordon, J. E. Moore, II, H. W. Richardson, M. Shinozuka, and S. E. Chang (2001) "Integrating Transportation Network and Regional Economic Models to Estimate the Costs of a Large Urban Earthquake," Journal of Regional Science, 41 (1): 39-65. Garin, R.A. (1966) “A Matrix Formulation of the Lowry Model for Intrametropolitan Activity Allocation” Journal of the American Institute of Planners 32: 361-364.
Gordon, P, J.E. Moore, II, J.Y. Park, and H.W. Richardson (2007), “The Economic Impacts of a Terrorist Attack on the U.S. Commercial Aviation System”, Risk Analysis 27:505-512. Gordon, P, J.E. Moore, II, J.Y. Park and H.W. Richardson (forthcoming) in “The Economic Impacts of Border Closures: A State-by-State Analysis” in H.W. Richardson, P. Gordon and J.E Moore II Global Business and the Terrorist Threat. Cheltenham, UK, Northampton, MA, USA: Edward Elgar. Ito, H. and D. Lee (2005) “Assessing the Impact of the September 11 Terrorist Attacks on U.S. Airline Demand” International Journal of the Economics of Business, 57:75-95. Lowry, I.S. (1964) A Model of Metropolis Report RM 4125-RC. Santa Monica: Rand. Meade, C. and R.C. Molander (2007) Considering the Effects of a Catastrophic Terrorist Attack. Santa Monica, CA: Rand, Center for Terrorism and Risk Policy. Murray, C.L., A.D. Lopez, B. Chin, D. Feehan and K.H. Hill (2006), “Estimation of potential global pandemic influenza mortality on the basis of vital registry data from the 1918-20 pandemic: a quantitative analysis,” The Lancet, 368, 2211-18. Park, J., P. Gordon, J. E. Moore, II, and H. W. Richardson (2007) “Simulating the State-by-State Effects of Terrorist Attacks on Three Major U.S. Ports: Applying NIEMO” in H.W. Richardson, P. Gordon, and J. E. Moore, II (eds.). The Economic Consequences of Terrorism, Cheltenham, UK, Northampton, MA, USA: Edward Elgar, 208-234. Richardson, H.W., P. Gordon, J. E. Moore, II, S. Kim, J. Park, and Q. Pan (2007) “Tourism and Terrorism : the National and Interregional Economic Impacts of Attacks on Major U.S. Theme Parks” in H.W. Richardson, P. Gordon, and J. E. Moore, II (eds.). The Economic

Gordon et al. — Discussion Paper 2008-22 — © OECD/ITF, 2008 15
Consequences of Terrorism, Cheltenham, UK, Northampton, MA, USA: Edward Elgar, 235-253. Richardson, H.W., P. Gordon, J. E. Moor, II, J. Park and Q. Pan (2008) “The Economic Impacts of Alternative Terrorist Attacks on the Twin Ports of Los Angeles and Long Beach” in J. M. Quigley and L. A. Rosenthal (eds.) Risking House and Home: Disasters, Cities, and Public Policy, Berkeley, California: Berkeley Public Policy Press, 173-19 Rose, A., R.B. G. Asay, D. Wei and B. Leung (forthcoming) “Macroeconomic Impacts of Shutting down the U.S. Borders in Response to a Security or Health Threat” in H.W. Richardson, P. Gordon and J.E Moore II Global Business and the Terrorist Threat. Cheltenham, UK, Northampton, MA, USA: Edward Elgar. Rossoff H. and D. von Winterfeldt (2007) “A risk and economic analysis of dirty bomb attacks on the ports of Los Angeles and Long Beach” Risk Analysis 27 (3): 533-554. Sandler, T., D.G. Arce and W. Enders (2008) Terrorism Copenhagen Consensus 2008 Challenge Paper.
Santos, J. R. and Y.Y. Haimes (2004) “Modeling the Demand Reduction Input-Output (I-O) Inoperability Due to Terrorism of Interconnected Infrastructures” Risk Analysis, 24:6, 1437-1451.
16 Gordon et al. — Discussion Paper 2008-22 — © OECD/ITF, 2008
TABLE 1. SCPM Impact Studies
Studies Scenarios Impact Areas Direct
Output Loss ($Million)
Total Output Loss
($Million)
Direct Job Loss
Total Job Loss
Passenger Travel Cost
Loss*a
($Million)
Freight Travel Cost
Loss*b
($Million)
Total Travel Cost Loss
($Million)
Total Loss
($Million)
Port Closure
15-Day Closure of the Ports of Los Angeles and Long Beach
*1, 2
City of Los Angeles 264 423 1,187 2,640
City of Long Beach 69 88 502 657
Los Angeles Region 946 1,522 4,354 9,606
Out of Region 1,782 2,736 8,050 16,914
Total 2,728 4,259 12,404 26,521 24 25 49 4,284
120-Day Closure of the Ports of Los Angeles and Long Beach
*1, 2, 3
City of Los Angeles 2,114 3,386 9,496 21,116
City of Long Beach 554 700 4,009 5,249
Los Angeles Region 7,564 12,179 34,831 76,850
Out of Region 14,256 21,892 64,401 135,316
Total 21,820 34,071 99,232 212,165 -207 117 -90 34,189
One Year Closure of the Terminal Island
*2
City of Los Angeles 2,849 4,538 13,087 28,503
City of Long Beach 621 816 4,143 5,787
Los Angeles Region 9,991 16,115 45,749 101,485
Out of Region 18,687 28,755 84,920 178,482
Total 28,678 44,870 130,669 279,967 -395 337 -58 45,207
Plume
All people in the plume area will evacuate for one week and they can travel through the plume area through highway and local roads
County of Los Angeles 0 0 0 0
Los Angeles Region 0 0 0 0
Out of Region 0 0 0 0
Total 0 0 0 0 -4,818 -436 -5,254 -5,254

Gordon et al. — Discussion Paper 2008-22 — © OECD/ITF, 2008 17
All businesses in the plume area are shut down for a week.
County of Los Angeles 0 0 0 0
Los Angeles Region 0 0 0 0
Out of Region 0 0 0 0
Total 0 0 0 0 -3,970 -923 -4,893 -4,893
Property values in this area drop by 25% for a year, then come back to their original values
County of Los Angeles 86 118 1,163 1,498
Los Angeles Region 86 138 1,163 1,702
Out of Region 19 29 168 278
Total 104 167 1,332 1,981 104 -2 101 269
Retail business drops by 25% for one year, due to customers not wanting to drive into these areas, then come back to their original levels
County of Los Angeles 0 0 0 0
Los Angeles Region 0 0 0 0
Out of Region 0 0 0 0
Total 0 0 0 0 68 21 89 89
The impact area lost 25% Retail and 10% other businesses. The impacted businesses are gone rather than relocated to other part of the region.
County of Los Angeles 1,755 2,519 21,156 29,000
Los Angeles Region 1,755 2,981 21,156 33,828
Out of Region 576 970 4,856 8,741
Total 2,331 3,950 26,013 42,574 -232 -50 -281 3,669
The impact area lost 25% Retail and 10% other businesses. They will be relocated to the area with maximum attractiveness to the origin and also within 30 minute travel time from the origin
County of Los Angeles 0 0 0 0
Los Angeles Region 0 0 0 0
Out of Region 0 0 0 0
Total 0 0 0 0 -290 -38 -328 -328
18 Gordon et al. — Discussion Paper 2008-22 — © OECD/ITF, 2008
Notes: a. Personal trip cost is assumed to be $13.00 per passenger car equivalent (PCE) per hour. b. Freight trip cost is assumed to be $35.00 per PCE per hour.
Worst Case Port Closure and Port Plume
One Year Closure of the Terminal Island
County of Los Angeles 8,662 13,434 53,369 97,535
Los Angeles Region 11,745 19,096 66,905 135,313
Out of Region 19,263 29,724 89,776 187,223
Total 31,009 48,820 156,682 322,541 -627 288 -339 48,877
Downtown Los Angeles
Exit Scenario, for All Businesses and Households Moving out of the Inner and Outer Impact Zones
*4
City of Los Angeles 2,304 2,941 7,257 13,389
Los Angeles Region 2,304 5,175 7,257 34,983
Out of Region 313 726 1,363 5,408
Total 2,617 5,901 8,620 40,391 5,901
Relocation Scenario, for All Businesses and Households Moving out of the Inner and Outer Impact Zones and Relocating in the Region
*4
City of Los Angeles 1,567 1,567 5,099 5,099
Los Angeles Region 0 0 0 0
Out of Region 0 0 0 0
Total 0 0 0 0 0
Hybrid Scenario, Inner Zone Firms Exit While Outer Zone Firms and Households Relocate
*4
City of Los Angeles 2,162 2,771 6,643 12,503
Los Angeles Region 2,220 4,968 6,643 33,157
Out of Region 284 656 1,200 4,843
Total 2,504 5,624 7,843 38,000 5,624
Gordon et al. — Discussion Paper 2008-22 — © OECD/ITF, 2008 19
Citations: Port Closure
1. H. W. Richardson, P. Gordon, J. E. Moore, J. Park and Q. Pan (2008), “The economic impacts of alternative terrorist attacks on the twin ports of Los Angeles – Long Beach,” in J. M. Quigley, and L. A. Rosenthal, eds., Risking House and Home: Disasters, Cities, Public Policy, Berkeley, California: Berkeley Public Policy Press.
2. Gordon, P., J. Moore, H. W. Richardson, and Q. Pan (2006) “The costs of a terrorist attack on Terminal Island at the twin ports of Los Angeles
and Long Beach, ” in J. Haveman and H. Schatz, eds., Protecting the Nation’s Seaports: Balancing Security and Cost, Public Policy Institute of California.
3. Gordon, P., J. Moore, H. W. Richardson, and Q. Pan, (2005) “The economic impacts of a terrorist attack on the twin ports of Los Angeles –
Long Beach,” in H. W. Richardson, P. Gordon, and J. E. Moore, eds., The Economic Impacts of Terrorist Attacks, Cheltenham, UK: Edward Elgar Publishing.
Downtown LA 4. Pan, Q., Gordon, P., J. Moore, and H. W. Richardson (2008) “Economic impacts of terrorist attacks and natural disasters: Case studies of
Los Angeles and Houston,” in Daniel Z. Sui and Susan L. Cutter (ed.) Geospatial Technologies and Homeland Security: Research Frontiers and Challenges, Springer.
5. Pan. Q. , H. W. Richardson, P. Gordon, and J. Moore (2007) “The Economic Impacts of a Terrorist Attack on the Downtown Los Angeles
Financial District,” Spatial Economic Analysis (submitted and under review)

20 Gordon et al. — Discussion Paper 2008-22 — © OECD/ITF, 2008
TABLE 2: Sum of Intra- and Interstate Impacts Associated with a 120-day Shutdown of the Ports of Los Angeles and Long Beach ($M)
Location Impacts Interstate Impacts Calculated via NIEMO
Southern CA 4,874.58 AL 106.35 IN 209.76 NE 99.9 RI 19.14 Rest of CA 5,545.64 AK 12.17 IA 142.25 NV 51.6 SC 66.12 Direct Impact: Exports: 16,233.20 AZ 211.83 KS 126.21 NH 28.48 SD 26.52 Direct Impact: Imports 56,107.13 AR 100.69 KY 115.05 NJ 167. TN 132.92
US Total 89,817.26 CO 123.88 LA 307.54 NM 26.1 TX 1,546.39 Rest of World 492.02 CT 63.28 ME 21.25 NY 216.38 UT 125.31
World Total 90,309.29 DE 20.04 MD 45.09 NC 130.76 VM 9.51 DC 2.47 MA 86.01 ND 19.22 VA 66.99 FL 123.19 MI 216.96 OH 303.19 WA 313.64 GA 102.26 MN 133.34 OK 106.47 WV 41.75 HI 21.31 MS 57.91 OR 198.81 WI 208.17 ID 48.57 MO 141.71 PA 243.81 WY 25.71 IL 279.47 MT 64.21

Gordon et al. — Discussion Paper 2008-22 — © OECD/ITF, 2008 21
TABLE 3. NIEMO Impact Studies
Source of Economic Impact
Targets
Total Economic Impacts ($M)
Base-year, Duration, and Model
Supply-side (or Imports)
Demand-side (or Exports)
Total Direct
Impacts Indirect Impacts
Direct Impacts
Indirect Impacts
Sea Ports Shut
Down1,2
LA / LB, 14,222 0 4,115 4,921 23,258 2001, one-month, and demand-
driven NIEMO
Houston 3,219 0 3,141 3,690 10,050
NY / NW 6,700 0 4,694 5,430 16,824
Theme Parks Shut
Down3
Cluster A (FL)
14,185 10,736 24,921
2004, 18 months, and
demand-driven NIEMO
Cluster B (CA)
13,470 10,146 23,616
NV 11,944 8,991 20,935
FL (i) 11,884 8,974 20,858
CA (i) 11,933 9,006 20,939
OH (i) 11,886 8,988 20,874
OH (ii) 11,871 8,975 20,846
NJ (i) 11,866 8,949 20,815
CA (ii) 11,899 8,981 20,880
NJ (ii) 11,851 8,939 20,790
PA 11,836 8,941 20,777
VA 11,818 8,929 20,747
IL 11,839 8,942 20,782
Citations:
1. Park, J.Y., P. Gordon, J. E. Moore II, and H. W. Richardson, L. Wang, 2007, "Simulating The State-by-State Effects of Terrorist Attacks on Three Major U.S. Ports: Applying NIEMO (National Interstate Economic Model)"p.208-234, in H.W. Richardson, P. Gordon and J.E. Moore II, eds., The Economic Costs and Consequences of Terrorism. Cheltenham: Edward Elgar.
2. Park, J.Y., 2008, "The Economic Impacts of a Dirty- Bomb Attack on the Los Angeles and
Long Beach Port: Applying Supply-driven NIEMO," Journal of Homeland Security and Emergency Management, 5 (1), Article 21.
3. Richardson, H. W., P. Gordon, J. E. Moore, II, S.J. Kim, J.Y. Park, and Q. Pan, 2007, "Tourism
and Terrorism: The National and Interregional Economic Impacts of Attacks on Major U.S. Theme Parks," p.235-253, in H.W. Richardson, P. Gordon and J.E. Moore II, eds., The Economic Costs and Consequences of Terrorism. Cheltenham: Edward Elgar.

22 Gordon et al. — Discussion Paper 2008-22 — © OECD/ITF, 2008
Facility Changes (Highway expansion or bridge shutdown)
Business Interruptions (Loss of Productions or Trading) ($ or
Jobs)
Scenario 1
2 n
Updated Networks Links
∆ Household Consumptions ($)
∆ Final Demand ($ or Jobs)
Closed I-O Model Open I-O Model
I-O Model
Direct Impact ($, Jobs, zone)
Indirect Impact ($, Jobs)
Total Impact
Induced Impact ($, Jobs)
Personal Trip ODs by Trip Purpose
Trip Attractions and
Productions Travel Cost Matrix
Calibrated Doubly-Constrained Gravity Model
H-W Trip OD
Personal Trip ODs
H-S Trip OD
JSW Trip OD
Induced Impact by TAZ
Direct Impact by TAZ
Indirect Impact by TAZ
Intra-regional Freight by Sector by Zone
Spatial Impact Allocation
Employment by Sector by Zone
Updated Freight Productions and Attractions Inter-regional Freight Attractions and
Productions by Sector by Zone
Calibrated Singly-Constrained Gravity Model
New Freight OD
H-O Trip OD W-O Trip OD O-O Trip OD
Integrated User Equilibrium Assignment Model (Assign Personal Trips and Freight Trips Together)
Regional Highway System Network Links
∆ Network Links (add or remove links, geometric or attribute
change of existing links, e.g. location,
length, speed, capacity, etc.)
Transactions Table from Regional Input-Output Model
Figure 1. Southern California Planning Model (SCPM) 2005 Flow Chart

Gordon et al. — Discussion Paper 2008-22 — © OECD/ITF, 2008 23
Figure 1 Notes:
1. Baseline is established when all the changes (∆network, ∆final demand, and ∆ Household Consumptions) are zero
2. Initial travel cost matrix is established by loading empty personal and freight trip ODs to road network
3. User equilibrium is approached by multiple loops until the changes of objective function values become flat.
4. H-O, W-O, O-O, H-W, H-S are home-other, work-other, other-other, home-work, and home-shop trip matrix.
5. JSW is journal-shop-to-work trip matrix.
6. Inter-regional freight attractions and productions are inbound and outbound freight trips at major freight generators (ports, airports, rail yards, warehouse/distribution nodes, and highway entry-exit points).
Please see “Assembled and processed freight shipment data by developing a GIS-Based origin-destination matrix for Southern California freight flows,” “Freight Data Assembling and Modeling: Methodologies and Practice,” and “Estimating Freight Flows for Metropolitan Area Highway Networks Using Secondary Data Sources” for details about inter-regional freight data collection and processing.
24 Gordon et al. — Discussion Paper 2008-22 — © OECD/ITF, 2008
Figure 2. National Interstate Economic Model (NIEMO)
DATA INVENTORY
(Table 1)
1997
CFSWCUS WISERTrade
US Economic
Census
Conversion Tables for All Sector
Types to 47 USC Economic
Sectors (Figure 2)
BEA2001
IMPLAN
1997 CFS,
47 USC
Sectors
2001 IMPLAN,
47 USC
Sectors
Sector Reconciliation Across Data Sources (Section III)
1997 CFS,
47 USC
Sectors, No
Missing
Values
Interregional
Commodity
Trade Matrix,
52 Regions, 47
USC Sectors
51 Intraregional,
Interindustry
Transactions
Matrices, 47
USC Sectors
Special Case of a
Multiregional Input-
Output (MRIO)
Matrix: An Inter-
Industry, Interstate
Matrix
National Interstate
Economic Model
(NEIMO): An Open
Input-Output Model
Port Final
Demand
Estimations,
47 USC
Sectors
Port Closure
Simulation, 47
USC Sectors
Intra- and Interstate
Direct and Indirect
Economic Impacts, 52
Regions by 47 USC
Sectors
Port
Closure
Scenario
i
Port
Closure
Scenario
2
Port
Closure
Scenario
1
Port
Closure
Scenario
N
Δ Final Demand
Doubly Con-
strained Fratar Model
(Section IV-1)
Missing Value
Estimation Model
(Appendix 5)

Gordon et al. — Discussion Paper 2008-22 — © OECD/ITF, 2008 25
Figure 3. TransNIEMO: NIEMO Plus the Road Network
Bridge
disruption
Scenario
i
Bridge
disruption
Scenario
2
Bridge
disruption
Scenario
1
Bridge
disruption
Scenario
N
DATA INVENTORY
Freight cost by
USC sector
FAF2
network
U.S. Census:
employment
Selecting I,U,S ¹
routes
Centroid points
of MSA &
remainder
Selecting
Intersection nodes
from the selected
routes
Scenario based region
specific model: A
price-type Input-
Output model
Total increased shipping cost by 47 USC sector
Network centroids: Reselection of intersection nodes
within buffer miles and 10% sampling from the
reselected intersection nodes
Estimating every shortest path between network
centroids of regions ²
Calculating increased shipping volumn on alternative
highways by 47 USC sector
Δ Final Demand
Demand-driven National Interstate
Economic Model (NEIMO): An Open
Multiregional Input-Output Model
Buffer miles boundary
surrounding the centroid
points
Distributing O-D value on the shortest paths
Annual rate at which cost
accumulated by sector:
Intra- and Interstate Direct
and Indirect Economic
Impacts, 52 Regions by 47
USC Sector
O-D data
Estimating
Freight O-D
of Truck
mode based
on NIEMO

26
TABLE A1: Estimates of the Costs of the 9/11 Attack
Notes:
1. GDP is only used in the total estimate when it would not double count other costs. Some articles do not contain a total cost as they only examined specific aspects of the economy. Individual costs do not necessarily add up to total costs as some studies are incomplete.
2. It is unclear how the NYC Partnership and Chamber of Commerce counts different types of costs. 3. The NY State Senate Finance Committee uses the estimated amount of compensation claims for potential earnings. This article is also used twice:
once for national losses and once for New York City losses. For the capital costs they used figures calculated by the NY Governor and State Division of the Budget and the New York City Mayor’s Office.
4. The NY Governor and State Division of the Budget count $3 billion as losses from 9/11 that is actually part of a separate economic stimulus package, according to the GAO study, "Impact of Terrorist Attacks on the World Trade Center."
Assembled by Philip Partyka-Hall.
Total Costs (billions) Capital Losses
Job Losses
Loss of Life
Airlines Losses
Disability Travel GDP
1/
GCP Other Costs
Total
New York City
Bram et al. (2002) 21.6 3.6-6.4 7.8 33-36
Chernick & Haughwout (2006) 30 11.5 0.897
Ito & Lee (2005) 1.1
Looney (2002) 27.2 27.2
NY Governor and State Division of the Budget2 (2001) 33.8 20.2 54
NY State Ways and Means Committee (2002) 11 16 27
NY State Senate Finance Committee3 (2002) 33 15.145 4-6 4.6 0.341 57.1-59.1
NYC Office of the Comptroller (2002) 21.8 8.7 0.944 52.3-64.3 0.943 82.8-94.8
NYC Partnership and Chamber of Commerce4
(2002) 44 10 0.75-1.0 7-11 7.6 83
United States
DeVol et al. (2002) 1.1 175 176.1
NY State Senate Finance Committee3 (2002) 424.4 639.3 639.3