ancient and recent demographic events influence
TRANSCRIPT

ANCIENT AND RECENT DEMOGRAPHIC EVENTS
INFLUENCE MITOCHONDRIAL DNA DIVERSITY
IN AN IMMIGRANT BASQUE POPULATION
by
Michael Christopher Davis
A thesis
submitted in partial fulfillment
of the requirements for the degree of
Master of Science in Biology
Boise State University
December 2010

© 2010
Michael Christopher Davis
ALL RIGHTS RESERVED
BOISE STATE UNIVERSITY GRADUATE COLLEGE
DEFENSE COMMITTEE AND FINAL READING APPROVALS
of the thesis submitted by
Michael C. Davis
Thesis Title: Ancient and Recent Demographic Events Influence Mitochondrial DNA
Diversity in an Immigrant Basque Population Date of Final Oral Examination: 22 October 2010
The following individuals read and discussed the thesis submitted by student Michael Christopher Davis, and they also evaluated his presentation and response to questions during the final oral examination. They found that the student passed the final oral examination, and that the thesis was satisfactory for a master’s degree and ready for any final modifications that they explicitly required.
Greg Hampikian, Ph.D. Co-Chair, Supervisory Committee Stephen J. Novak, Ph.D. Co-Chair, Supervisory Committee James F. Smith, Ph.D. Member, Supervisory Committee Troy T. Rohn, Ph.D. Member, Supervisory Committee The final reading approval of the thesis was granted by Greg Hampikian, Ph.D., and Stephen J. Novak, Ph.D., Co-Chairs of the Supervisory Committee. The thesis was approved for the Graduate College by John R. Pelton, Ph.D., Dean of the Graduate College.
v
DEDICATION
To the memory of Dr. Adriel Johnson (1957-2010), my undergraduate advisor and
professor of Biology at the University of Alabama in Huntsville. His life of service,
teaching, and research was (and remains) an example for us all.

vi
ACKNOWLEDGMENTS
First, I must thank my advisors, Dr. Greg Hampikian and Dr. Stephen Novak, for
their many hours of teaching, guidance, and encouragement. I have been enriched, both
intellectually and personally, by our conversations. To my committee members, Dr.
James Smith and Dr. Troy Rohn, I am grateful for your comments, assistance, and
instruction.
I am grateful to the individuals of the Basque community, for their participation in,
and enthusiasm for, this research. Thanks to the many volunteers who helped with swab
collection and lab work, especially Dawn Engle and Katherine Kindy. I am especially
thankful to Jason Besecker—for all his work in the early stages of the project. I thank my
fellow graduate students, for their advice, assistance, and moral support. I am grateful to
Laura Bond, for helping me to properly apply and interpret the statistical tests in my
analyses. For answering a question regarding comparisons of genetic diversity, I thank
Dr. Masatoshi Nei, professor at The Pennsylvania State University.
To the administrative assistants Diane Smith and Beth Gee, and the excellent staff
of the BSU Biology Department, thanks for all your service.
I am indebted to Thomas Krawzak, for providing material support, thoughtful
conversations, and encouragement; and to Howard Jones, for his friendship and
heartening exhortations. Thanks to the members of the Grace and Boise Churches of
Christ, for providing a loving community that embraces both faith and scholarship. I
thank my family for fostering in me a love of truth and an appreciation of nature. Thanks
vii
to the friendly “Gernika Evolution Group”; the discussions and fellowship at Bar Gernika
were extremely helpful, both intellectually and emotionally. To all others who helped me
along the way—thank you!
This thesis was supported in part by the US Department of Defense contract
W81XWH-07-1-000, and by funds from Boise State University.
viii
ABSTRACT
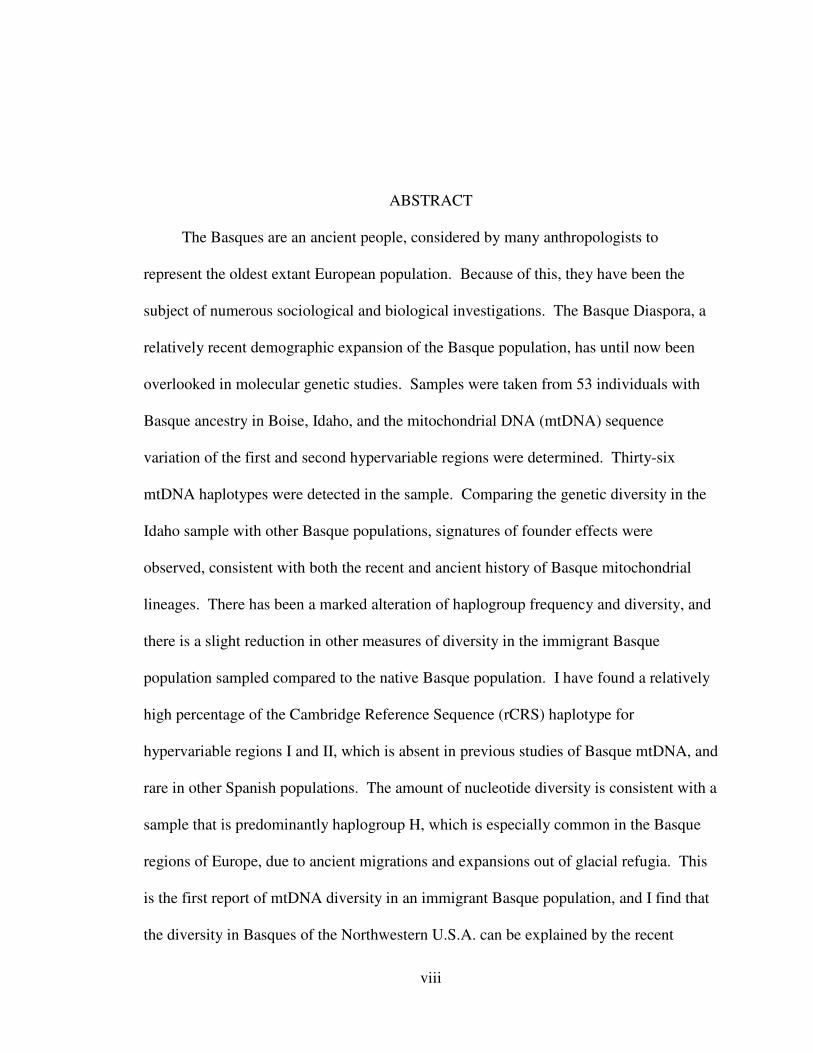
The Basques are an ancient people, considered by many anthropologists to
represent the oldest extant European population. Because of this, they have been the
subject of numerous sociological and biological investigations. The Basque Diaspora, a
relatively recent demographic expansion of the Basque population, has until now been
overlooked in molecular genetic studies. Samples were taken from 53 individuals with
Basque ancestry in Boise, Idaho, and the mitochondrial DNA (mtDNA) sequence
variation of the first and second hypervariable regions were determined. Thirty-six
mtDNA haplotypes were detected in the sample. Comparing the genetic diversity in the
Idaho sample with other Basque populations, signatures of founder effects were
observed, consistent with both the recent and ancient history of Basque mitochondrial
lineages. There has been a marked alteration of haplogroup frequency and diversity, and
there is a slight reduction in other measures of diversity in the immigrant Basque
population sampled compared to the native Basque population. I have found a relatively
high percentage of the Cambridge Reference Sequence (rCRS) haplotype for
hypervariable regions I and II, which is absent in previous studies of Basque mtDNA, and
rare in other Spanish populations. The amount of nucleotide diversity is consistent with a
sample that is predominantly haplogroup H, which is especially common in the Basque
regions of Europe, due to ancient migrations and expansions out of glacial refugia. This
is the first report of mtDNA diversity in an immigrant Basque population, and I find that
the diversity in Basques of the Northwestern U.S.A. can be explained by the recent

ix
history of migration, as well as the phylogeography and diversity of the major European
haplogroups.

x
TABLE OF CONTENTS
ACKNOWLEDGEMENTS .......................................................................................... vi
ABSTRACT ............................................................................................................... viii
LIST OF TABLES ........................................................................................................ xii
LIST OF FIGURES ...................................................................................................... xiii
INTRODUCTION ........................................................................................................ 1
SUBJECTS AND METHODS ..................................................................................... 6
Participants ........................................................................................................ 6
DNA Extraction and Sequencing ...................................................................... 6
Genetic Data Analysis....................................................................................... 8
RESULTS ............................................................................................................... 13
mtDNA Diversity in Immigrant and European Basques .................................. 13
Haplotype Networks ......................................................................................... 16
Genetic Differentiation Between Immigrant and Source Populations .............. 16
DISCUSSION .............................................................................................................. 18
mtDNA Diversity in NW Basques: Evidence for Founder Effects .................. 18
Co-Ancestry in Immigrant and Source Basque Populations............................. 22
Haplogroup Distribution in Basque Populations .............................................. 23
NW Basques and Other European Immigrant Populations............................... 24
Conclusions ....................................................................................................... 27

xi
Literature Cited ............................................................................................................. 29
Appendix ............................................................................................................... 63
The Questionnaire Distributed to Study Volunteers to Determine Mode of
Basque Ancestry

xii
LIST OF TABLES
Table 1 HVS-1 sequence diversity in the NW Basque
and other populations ............................................................................ 42
Table 2 HVS-1 plus HVS-2 sequence diversity in the NW Basque
and other populations ............................................................................ 44
xiii
LIST OF FIGURES
Figure 1 Map of Western U.S.A. and the Basque Country ................................. 45
Figure 2 HVS-1 Polymorphic Sites ..................................................................... 47
Figure 3 HVS-1 and HVS-2 Polymorphic Sites .................................................. 49
Figure 4 Pairwise Mismatch Distributions .......................................................... 51
Figure 5 Histogram of Haplogroup Frequencies ................................................. 53
Figure 6 Median-joining Network of HVS-1 haplotypes .................................... 55
Figure 7 Median-joining Network of HVS-1 plus HVS-2 haplotypes ................ 57
Figure 8 NJ Tree of population genetic distances ............................................... 59
Figure 9 Principal Components Analysis based on Haplogroup Distribution .... 61

v
INTRODUCTION
Migration and colonization events have genetic consequences (Dobzhansky and
Wright 1943; Slatkin 1985). Colonization events can lead to an alteration and/or
reduction in genetic diversity (i.e., genetic drift) through founder effects or genetic
bottlenecks (Nei et al. 1975). Alternatively, sufficient gene flow (via immigration) can
counter the force of genetic drift (Novak and Mack 2005). These consequences are
influenced by several factors: the level and structure of genetic diversity within and
among native populations, founder population size, and the number of discrete
migration/colonization events that have occurred (Novak 2010). The demography of
Homo sapiens has been characterized by recent population growth and multiple
expansions out of Africa (Jobling et al. 2004) and colonization events of various
magnitudes (Ramachandran et al. 2005; Richards et al. 2000). The genetic signatures of
ancient migrations have been studied with phylogeographic analyses—studies of the
patterns of genetic diversity and differentiation within and between major populations,
and the geographic distribution of genetic lineages (Avise 2000). The genetic
consequences of relatively recent migrations and colonization have been studied in
cultural and religious population isolates (Adams et al. 2008; Puffenberger 2003), island
communities (Santos et al. 2003), the forced migration of African slaves (Salas et al.
2004), and the European colonization of the Americas (Bedoya et al. 2006; Salas et al.
2008). The Basque are an ethnic group inhabiting northeastern Spain and southwestern
France, and are considered by some researchers to have the greatest degree of genetic
6
continuity with the “original” Europeans, Paleolithic hunter-gatherers (Bertranpetit et al.
1995; Douglass and Bilbao 1975; Iriondo et al. 2003; Richards et al. 2000). One of the
most distinguishing characteristics of the Basque is their language (Euskara), a non-Indo-
European isolate that has resisted classification. Although once hypothesized to be
related to ancient Egyptian (Chambers 1844), and now considered by some to be
connected with Caucasian languages, Euskara is not currently considered a member of
any extant language family (Arnaiz-Villena et al. 1999). Since language families tend to
group along with ethnic categories (Cavalli-Sforza and Cavalli-Sforza 1995), it was
natural to propose a genetic discontinuity for the Basques, given such a unique language.
Studies of Basque genetic diversity began with observations of extreme frequencies of
specific blood types in Basque populations both in Europe and in America (Boyd and
Boyd 1937; Etcheverry 1945). Basque populations are characterized by the relatively
high frequency of Rh-negative blood types, among the highest in Europe (Boyd and Boyd
1937; Chalmers et al. 1949), and a relatively low frequency of type B blood (Alberdi et
al. 1957; Nijenhuis 1956). Because of these features, the Basque became one of the most
thoroughly studied populations in Europe, hypothesized to be a genetically isolated
remnant of an ancient population (Calafell and Bertranpetit 1994; Cavalli-Sforza 1988).
The results of numerous studies based on protein polymorphisms (Calderon et al. 1998;
Comas et al. 1998; Manzano et al. 1996) and molecular genetic markers (Alonso and
Armour 1998; Calderon et al. 2003; de Pancorbo et al. 2001; Iriondo et al. 1997; Zlojutro
et al. 2006) have demonstrated that the Basque are indeed genetic outliers, yet only in the
context of the European gene pool: more related to neighboring Europeans than other
world populations (Garagnani et al. 2009; Laayouni et al. 2010; Li et al. 2008). Although

7
the evidence does not support genetic isolation, there is evidence for an ancient
(Paleolithic) origin of the Basque ancestors. Recent mitochondrial DNA (mtDNA)
studies indicate that certain Basque lineages (in haplogroup U8a) have their origin in the
Upper Paleolithic, approximately 30,000 years BP, with evidence for a subsequent re-
expansion approximately 12,000 years BP (Gonzalez et al. 2006). Other lineages that
reach their highest density in the Basque region (haplogroups H1, H3) also date from the
latter period (Achilli et al. 2004). These findings, as well as the clinal distribution of H
subhaplogroups across Europe, provide support for the hypothesis that the ancestral
Basque population(s) originated from populations expanding their range from glacial
refugia (Achilli et al. 2004). Although a recent study based on entire mtDNA sequences
questions the Franco-Cantabrian refugia hypothesis (Garcia et al. 2010), there is in fact
supportive evidence from studies of other species. Genetic evidence for post-glacial
expansions from Iberian refugia has been reported for species across multiple taxa,
including: plants (Grivet and Petit 2002), mammals (Melo-Ferreira et al. 2007; Michaux
et al. 2003), birds (Griswold and Baker 2002), reptiles (Guicking et al. 2008), and
amphibians (Rowe et al. 2006). In addition, there is evidence for multiple refugia within
Iberia and other regions of Northwestern Europe (Vialatte et al. 2008), and the situation
for many species is certainly more complex than a large-scale expansion from a single
refugium (Gomez and Lunt 2007). It is likely that future molecular investigations will
reveal additional complexity in human post-glacial phylogeography. Whether or not
ancestral Basque populations emerged from single or multiple refugia, these results have
dispelled theories of Basque origins linking them to modern Africans or Asians, Ancient
Egyptians, or Neanderthals (Chambers 1844; Izagirre et al. 2001; Kurlansky 1999).
8
There is a long history of Basque immigration to the Americas: cod fishing
settlements in 16th century Newfoundland (Lehuenen 1984), cattle ranches in 17th and
18th century South America, and sheep herding in the 19th century American West
(Douglass and Bilbao 1975). Southwest Idaho, U.S.A. (including the cities of Boise,
Mountain Home, Gooding, and Shoshone) is famous for its large Basque community,
comprised primarily of migrants from the province of Bizkaia (Viscaya), Spain (Edlefsen
1948). According to Edlefsen (1948), approximately 90% of Southwest Idaho Basques
trace their origins to this part of the Basque country. Within Bizkaia, it is the region
roughly circumscribed by the cities of Gernika, Lekeitio, and Ondarroa (Figure 1), that
contributed about 85% of all Bizkaian emigrants to the U.S.A., according to a 1917
survey by Silen (Douglass and Bilbao 1975). In 2000, there were 6,637 individuals (0.51
% of population) in Idaho who identified themselves as Basque in the census (Census
2000), giving Idaho the highest per capita Basque population of any state. The immigrant
Basques of the Northwestern U.S.A. are thus an ideal study population for assessing the
genetic consequences of immigration from a well-defined source population. It is worth
noting that in 1945 one of the earliest published accounts of Basque blood type
frequencies was made by Etcheverry, a physician in Argentina (Etcheverry 1945). Only
two other studies have been published on the genetics of American Basque populations:
another paper by Etcheverry (Etcheverry 1947), and a blood typing paper of two Basque
populations in Idaho by Laughlin et al. (1956). The Idaho study was based upon the
dissertation research of Margery Gray (Gray 1955).
Mitochondrial DNA has been used in numerous studies to explore the level and
structure of genetic variation within human populations, and to shed light on the
9
complexities of human evolution (Achilli et al. 2004; Richards et al. 2000; Torroni et al.
2001). Mitochondrial DNA has the advantage of being non-recombining, always
inherited through the maternal lineage, and containing non-coding “hypervariable”
regions that accumulate mutations at an approximately ten-fold rate (on average)
compared to coding regions (Brown et al. 1979; Stoneking 1994; Upholt and Dawid
1977). In addition, since the early 1990s, numerous studies on human mtDNA have been
carried out, and the literature and data on human mtDNA is sizable (Parson and Dür
2007; Torroni et al. 2006). However, despite several studies of mtDNA variation in
European Basque populations (Alfonso-Sanchez et al. 2008; Bertranpetit et al. 1995;
Corte-Real et al. 1996; Gonzalez et al. 2006; Richard et al. 2007), no mtDNA research
has previously been conducted on an immigrant population from the Basque Diaspora.
The presence of a substantial population of Basque immigrants in the Northwestern
U.S.A. allows specific hypotheses associated with the genetic consequences of migration
and colonization events to be tested (Nei et al. 1975). In this study, I have: determined
the sequence diversity for mtDNA hypervariable segments 1 and 2 (HVS-1 and HVS-2)
in a representative sample of NW Basques; compared the diversity of NW Basques to
that of Basques living within the historical Basque regions in Spain and France; and,
determined the magnitude of founder effects in the NW Basque. I have also examined
previously published genetic data in other American immigrant populations (and their
putative European sources), and noted a trend in the relationships between immigration
histories and founder effects.

10
SUBJECTS AND METHODS
Participants
Subjects for this study were selected from among volunteers using a protocol modeled
after Bertranpetit et al. (1995). Subjects were recruited from Basque cultural events held
in Boise, Idaho. I administered a questionnaire to determine each volunteer’s place of
birth, the place of birth of their mother and maternal grandmother, and the surnames in
each volunteer’s maternal lineages (see Appendix). The surname data were used to select
subjects that were maternally unrelated for at least two generations. Buccal swabs and
completed questionnaires were collected from volunteers who had identified themselves
as Basque. To be included in this study, each subject was required to have been born in
the U.S.A., and to have Basque maiden names going back at least two generations. Since
all volunteers were either born or had immediate family in Idaho, Nevada, Oregon, and
California, the sample was designated as Northwestern U.S.A. Basques (hereafter
referred to as NW Basques). The use of human subjects for this study was approved by
the Institutional Review Board of Boise State University, and the confidentiality of
personal information for each volunteer was assured (no personal identifying information
will be published). Based on these criteria, 53 subjects who met the study criteria were
included in this analysis.
DNA Extraction and Sequencing
DNA was extracted from each buccal swab using the QIAamp DNA Mini Kit (Qiagen).
Mitochondrial DNA hypervariable regions HVS-1 and HVS-2 were amplified using
11
published primers (Wilson et al. 1995) purchased from Integrated DNA Technologies.
Dye-labeled primer sequencing was carried out on the PCR products using the Thermo
Sequenase Cycle Sequencing Kit (USB) according to the manufacturer’s protocol, and
fragments were examined with the LI-COR 4300 DNA Analyzer (LI-COR Biosciences).
To confirm sequence accuracy, every sample was sequenced at least twice, either using
both strands of the PCR product (forward and reverse sequencing primers) or by re-
sequencing with the same primer. All polymorphisms were confirmed by at least double-
coverage of the sequencing data. Sequence analysis of gel-based data was carried out on
E-Seq software (for reading gel images and sequence editing) and AlignIR software (for
pairwise alignment against the reference sequence), both from LI-COR Biosciences.
Multiple sequence alignments (for data analysis, see below) were performed using
Clustal X as implemented in MEGA 4.1 (Kumar et al. 2008). Polymorphisms were
determined by comparing experimental data with the revised Cambridge Reference
Sequence (rCRS) (Andrews et al. 1999). Note that the rCRS has recently (2009) been
annotated in the NCBI nucleotide database as the GenBank “reference sequence.” The
rCRS, used for a reference in population and forensic studies, is listed in the NCBI
nucleotide database as NC_012920.1 (formerly it was listed as the “alternative Refseq”
AC_000021.2). Previously, the mitochondrial sequence represented in the NCBI
reference sequence (Refseq) database for the human genome project was accession
number NC_001807, a mitochondrial genome from a Yoruba (African) individual. For
this study, the definition of the first and second hypervariable segments (HVS-1 and
HVS-2) were defined as nucleotide positions 16024-16383 and 66-370, respectively,
following Alfonso-Sanchez et al. (2008).

12
Genetic Data Analysis
Genetic Diversity
The sequences obtained from each subject were used to infer haplogroup
membership by the neighbor-joining method of Behar et al. (2007), which was shown to
correctly predict the haplogroup for a European dataset 97% of the time. The level of
mtDNA diversity within the NW Basque population was estimated by counting the
number of haplotypes (k), the number of polymorphic sites (S), and calculating the
haplotype (h), nucleotide (π), and haplogroup diversity over the aligned control region
sequence data. These parameters were calculated using Arlequin 3.1 (Excoffier et al.
2005), and are the standard intrapopulation diversity measures for haplotypic sequence
data (Nei 1987). Haplotype and haplogroup diversity are computed as Nei (1987) defines
“gene diversity,” representing the probability of randomly picking two sequences from
non-identical haplogroups (or haplotypes) in a sample set. Likewise, nucleotide diversity
is the probability that a randomly chosen nucleotide site on two randomly chosen
sequences will be different (Nei and Kumar 2000).
We characterized nucleotide diversity using several estimates of θ: a measure of
expected genetic diversity based on the formula θ = 2Nfeµ, where Nfe is the female
effective population size and µ is the mutation rate (Helgason et al. 2000). The mean
number of pairwise differences between sequences within a population is given by θπ,
which is the estimator for θ given the infinite-sites model of nucleotide evolution (Tajima
1983). The statistics θs and θk are additional estimators: θs is based on the number of
polymorphic sites found in the set of sample sequences, and θk is based on the number of
observed haplotypes (Watterson 1974).

13
Genetic Distances Between Populations
Arlequin was used to compute pairwise genetic distance values within and between
populations, and generate pairwise mismatch distributions. A principal components
analysis (PCA) was performed on the haplogroup frequency data, using SAS version 9.0
software, SAS System for Windows (SAS Institute). The results of the PCA were
visualized on a biplot of the first two principal components. For admixed populations
(with Amerindian and African maternal contributions), only frequencies of European-
specific haplogroups were taken into account. Where haplogroup data was given for sub-
haplogroups (such as, U1, U2, U3, etc.), those frequencies were combined to give the
frequency of the entire haplogroup. A neighbor-joining (NJ) tree was generated with the
program MEGA 4.1, using the pairwise distance matrix of Reynold’s linearized FST
(coancestry coefficients). This measure is determined by comparing frequencies of
shared haplotypes (Reynolds et al. 1983).
Genetic Signatures of Population History
The signatures of demographic history for the NW Basques were evaluated using
three techniques: quantitative test statistics, mismatch distributions, and time to the most
recent common ancestor (TMRCA). Tajima’s D (TD) and Fu’s Fs are used to detect
either the signature of selection, or in the case of neutral molecular markers, the signature
of recent population expansion (Fu and Li 1993). Both tests assume that population
expansion will produce an excess of rare singleton mutations. Tajima’s D compares the
average number of pairwise differences versus the number of segregating sites, while Fs
tests this relationship using the distribution of haplotypes (Fu and Li 1993). Both
14
statistics were calculated in Arlequin 3.1 with 1000 random permutations. The pairwise
mismatch distributions calculated in Arlequin were compared to the expected
distributions (given the sequence length and number of segregating sites) for expanding
and stationary populations (Schneider and Excoffier 1999). The distributions of all
Basque populations were compared with each other; and Harpending’s raggedness
statistic (rg) was calculated along with the 95% confidence interval in DnaSP 5.0
(Librado and Rozas 2009), to check for significant deviations from the expected
distributions.
Haplotype Networks
Haplotype networks for HVS-1 alone, and the combined HVS-1 and HVS-2 regions,
were constructed with Network 4.5 (Fluxus Engineering, http://fluxus-engineering.com)
(Bandelt et al. 1999). To generate reduced-median networks, the reduction threshold was
set to 2.0, the “frequency >1 criterion” was inactivated, and the relatively slowly
mutating sites (73, 263, 16208, and 16318) were given a three-fold greater weighting than
the other substitution sites. The mutation hotspots (“speedy sites”) that are known to
confound phylogenetic analyses (Bandelt et al. 2002) were ignored in constructing the
network. Each distinct haplotype is represented by a node in the network, and the
mutation sites separating them are indicated on the connecting edges. Node size is
proportional to the number of individuals sharing the haplotype. The HVS-1 haplotype
network includes data from the French Basque region (Richard et al. 2007), Spanish
Basque (Alfonso-Sanchez et al. 2008), and the NW Basque (this study). The Spanish
Basque sample was differentiated by province of sample origin: Bizkaia or Gipuzkoa,

15
based on supplemental data from Alfonso-Sanchez et al. (2008); therefore, this sample
will be referred to as the “BG Basque.” For the TMRCA analysis, the centrally located
and most common haplotype (263G) was set as the ancestral node, and all haplotype
nodes for a given population were selected as descendants. The rho statistic was
calculated, and was converted to an estimate of the age of the network (given an
estimated mutation rate of 1 base in the two hypervariable regions per 20,000 yrs)
(Saillard et al. 2000). The degree of divergence from the ancestral node is a time
estimate that is affected by changes in effective population size, which is expected to be
reduced following a population bottleneck (Nei et al. 1975).
C-stretch length variability and common indels such as 315.1C were observed but
not scored, because of the difficulty in sequencing through C-stretch regions, which do
not contain an intervening thymine (Bendall and Sykes 1995; Butler 2005). Since
misalignment errors have been reported because of highly variable C-stretch lengths (Yao
et al. 2009), it seemed prudent to ignore a small amount of data rather than risk systemic
errors in the analysis. Thus, for all diversity calculations and interpopulation
comparisons, HVS-2 positions 305-315 were ignored.
Besides searching the European mitochondrial population database (EMPOP, Parson
and Dür [2007]), the following reference populations were used for comparative
analyses: the Old Order Amish of Ohio and Indiana (van der Walt et al. 2005), the
Acadians and Channel Islanders of the Gaspe peninsula, Québec (Moreau et al. 2009),
three Spanish Basque populations (Alfonso-Sanchez et al. 2008; Bertranpetit et al. 1995;
Corte-Real et al. 1996), the Catalonians, English, and Swedes (Torroni et al. 2001), the
Ibiza Islanders (Picornell et al. 2005), the French (Dubut et al. 2004), French Basques
16
(Richard et al. 2007), the Portuguese (Pereira et al. 2004), Russians (Malyarchuk et al.
2002), Austrians and North American Hispanics (Budowle et al. 1999), Germans
(Richards et al. 2000), Brazilians (Alves-Silva et al. 2000), Non-Basque Spanish (Alvarez
et al. 2007), Cubans (Mendizabal et al. 2008), Puerto Ricans (Martinez-Cruzado et al.
2001), the Welsh (Piercy et al. 1993), Galicians (Salas et al. 1998), Albanians (Bosch et
al. 2006), Tuscans (Francalacci et al. 1996), Icelanders (Helgason et al. 2000), Svanetian
Georgians (Alfonso-Sanchez et al. 2006), and Angolans (Plaza et al. 2004). Although
genetic diversity statistics have been published for most of these populations, all values
were re-calculated from the sequence data in Arlequin, since C-stretch indels were
ignored for this analysis.

17
RESULTS
I analyzed fifty-three samples that met the criteria for inclusion in the NW
Basque study. There were approximately equal numbers of maternally unrelated male
and female subjects, and the average age was 49.6 years. Of the 53 subjects, 38 (71.7%)
could trace their maternal lineages to Spain. Of those 38, twenty could specify their
grandmother’s place of birth as Bizkaia, where historically most Basques of SW Idaho
trace their ancestry (Figure 1). Of the 20 with Bizkaian maternal origins, eleven reported
a birthplace for their grandmother that was in the region of NE Bizkaia. Two individuals
could trace their lineage back to the French Basque region, one from “France,” and three
could trace their maternal line to California and no further. The number of individuals
with Bizkaian ancestry is lower than in previous studies focusing on Basques in Idaho
(Arrizabalaga 1986; Edlefsen 1948; Laughlin et al. 1956); however, it must be noted that
an Idaho birthplace was not a requirement for inclusion in this study.
mtDNA Diversity in Immigrant and European Basques
Among the 53 individuals analyzed in this study, 23 distinct HVS-1 region (359 bp)
haplotypes were observed, with 29 different polymorphic sites (Figure 2). Of these, 19
individuals (35.8%) shared a haplotype identical to the rCRS. Fifty percent of the NW
Basque HVS-1 haplotypes were private (private haplotypes are defined as not being
previously reported in EMPOP nor in the literature search for this paper); the other fifty

18
percent were observed at varying frequencies in several European populations (based on
EMPOP and literature cited in the discussion). Transversions (compared to the reference
sequence) accounted for 3 of the 29 polymorphic sites (10.3%).
Considering both hypervariable regions (665 bp), I observed a total of 36 distinct
lineages (haplotypes), characterized by 54 polymorphic sites (Figure 3). As with HVS-1
alone, fifty percent of haplotypes were private. A relatively high percentage of
individuals (four out of 53, or 7.5%) have the rCRS haplotype.
The NW Basque population has lower nucleotide and haplogroup diversity than
native Basque, native European, and other European-derived populations (considering
only European-specific mtDNA lineages) (Tables 1 and 2). The populations with the
lowest diversity measures generally are the Basque and other Iberian populations.
Considering only HVS-1, four out of the five populations with the lowest diversity (in
terms of haplotype and nucleotide diversity, and θS and θk) are Basque, the exception
being the Acadians of the Gaspe peninsula, Québec—a population that had relatively few
initial settlers, and has experienced serial founder events (Moreau et al. 2009).
When considering both HVS-1 and HVS-2, the number of distinct haplotypes
increases for all populations, and there is less of a difference between populations in
terms of haplotype diversity (h) (Table 2). Although the two Basque populations listed
here have lower diversity indices than the other populations, the NW Basques do not
have significantly different values of h or π than the BG Basque population (Z-test for
comparison of means, per Nei and Kumar (2000). The estimator θπ also shows the NW
Basques have the lowest diversity.
19
All European populations, and all European-derived American populations, have
significantly negative values of both TD and Fs (Tables 1 and 2). The only population in
this analysis that has a value not significantly different from zero (p < 0.05) is the
Angolan population (Tables 1 and 2). There is a trend of slightly less negative values for
relatively isolated populations such as the Basques, Icelanders, and the Svanetian
Georgians. This trend may exist because greater isolation means an increased probability
for the genetic diversity of a population to be influenced by genetic drift—which would
result in a loss of low-frequency polymorphisms.
The distributions of pairwise mismatches were calculated for the NW Basque and
various Spanish Basque populations, for HVS-1 alone, and HVS-1 and HVS-2 combined
(Figure 4). The mean of the mismatch distribution is equivalent to the average pairwise
difference between sequences (estimated by θπ). Note that the pairwise mismatch
distribution for the NW Basques for HVS-1 and HVS-2 exhibited a distinctly ragged
appearance.
Haplogroup H is present at a much higher frequency in the NW Basque (~80%) than
the Spanish Basque or other Iberian populations (Figure 5). In addition, there has been a
loss in the NW Basques of some of the lower-frequency haplogroups, specifically V, I,
W, and X. While there is no significant difference in nucleotide or haplotype frequencies
between native Basque (BG Basque and French Basque) and NW Basque, the differences
in haplogroup frequencies are statistically significant. The haplogroup (gene) diversities
are as follows: for the NW Basque 0.3591 ± 0.0185, for the BG Basque 0.6797 ± 0.0126,
and for the French Basque 0.6210 ± 0.0151. An exact test of population differentiation in
Arlequin found significant differentiation between each population, p < 0.05.
20
Haplotype Networks
We used haplotype networks to show the relationship between haplotypes based on single
nucleotide differences. The HVS-1 network shows that a few common haplotypes are
shared between all the Basque populations (Figure 6). The Bizkaian and Gipuzkoan
populations have four of the most divergent haplotypes, in terms of mutational distance
from the central, common (and presumably ancestral) haplotype. The network for the
combined HVS-1 and HVS-2 regions (Figure 7) has considerably more resolution, as
expected with more sequence data. The majority of haplotypes along the longest
branches (most divergent) are found in the BG Basque individuals. Even with speedy
sites removed, the rCRS haplotype is only detected in the NW Basque population.
The mutational distance from the inferred ancestral haplotype is given by the rho
statistic. For the BG Basque network, rho = 1.1927 ± 0.40179 (sd), and for the NW
Basques, rho = 0.7381 ± 0.38095 (sd). With an estimated mutation rate of one site per
sequence per 20,000 years, the age of the BG Basque network is 23,854 yr BP (± 8036
yr, SD), and the age of the NW Basque network is 14,762 yr BP (± 7619 yr, SD). This
measure is not expected to correlate with the time of immigration to North America, but
rather illustrates a decrease in effective population size consistent with a genetic
bottleneck due to founder effects.
Genetic Differentiation Between Immigrant and Source Populations
The NJ tree based on Reynolds’ genetic distance (also called the co-ancestry
coefficient, Reynolds et al. [1983]) placed the NW Basques, the BG Basques, and non-
Basque Spanish into one cluster (Figure 8).

21
The relationship between multiple immigrant and source populations, based upon
frequencies of Caucasian-specific haplogroups, was visualized with a Principal
Components Analysis (Figure 9). PC1 and PC2 account for 79.4% of the variability in
these data. The immigrant populations most separated from the continental European
populations are the Amish, the NW Basque, the Gaspe Acadians, and Puerto Ricans.
Other immigrant populations overlap with the European group (Brazil, Argentina, and
Cuba). The Spanish (BG Basque) and French Basque populations are positioned near
each other in ordination space.
22
DISCUSSION
This is the first DNA study of an immigrant Basque population. My results almost
double the number of Basque control region (HVS-1 and HVS-2) sequences published,
and represent the first analysis of the genetic consequences of the Basque Diaspora.
Consistent with theoretical predictions for populations experiencing genetic drift via
founder events or population bottlenecks (Nei et al. 1975; Novak and Mack 2005), I have
observed both a reduction in mtDNA haplogroup diversity and an alteration of haplotype
and haplogroup frequencies in the NW Basques, compared with values previously
reported for Spanish and French Basque populations (i.e., the putative source
populations). In addition, I have compared the extent of the founder effect in the NW
Basques with other European immigrant populations. These results demonstrate that the
founder effects in the NW Basques are similar in magnitude (in terms of changes in
haplogroup frequencies) to those of the Acadians of Gaspe, and the Amish of Ohio and
Indiana (Moreau et al. 2009; van der Walt et al. 2005).
mtDNA Diversity in NW Basques: Evidence for Founder Effects
An interesting and distinguishing feature of the NW Basques is the relatively large
proportion of individuals matching the rCRS control-region haplotypes (Figure 2). For
HVS-1 only, the proportion observed (35.8 %) is higher than that reported for Bizkaian
and Gipuzkoan Basques (27.3%), which was said to be the highest percentage of the
rCRS HVS-1 haplotype ever reported (Alfonso-Sanchez et al. 2008). Betranpetit et al.

23
(1995) found 20% of their Gipuzkoan Basque samples shared this haplotype. In a study
of HVS-1 diversity in French populations, a relatively high proportion (27.2%) of French
Basques had the rCRS haplotypes (Richard et al. 2007). An immigrant population with
an unusually high proportion of this haplotype are the Acadians of Gaspe, with 33.3% of
the sampled population (n=99) matching the HVS-1 rCRS (Moreau et al. 2009).
When one considers both hypervariable regions, the observed frequency of the rCRS
haplotype is exceptionally high in the NW Basque. For HVS-1 and HVS-2 combined,
the rCRS haplotype was detected in four of 53 (7.5%) individuals analyzed in this study
(Figure 3). The combined rCRS haplotype is rare in most European populations (0.25%
of all sequences in the EMPOP database), and has never been reported in a Basque
population. However, the absence of this haplotype in native Basques should be regarded
as provisional, because fewer studies have been published using both HVS-1 and HVS-2,
compared with HVS-1 alone (to date only Alfonso-Sanchez et al. (2008) have published
Basque HVS-2 data). Unfortunately, HVS-2 sequence data is lacking for the French
Basques. At present, EMPOP does not contain any sequences from French populations,
although updates are planned which will include French data (W. Parson, personal
communication).
Overall, the frequency of the rCRS haplotypes are consistent with founder effects,
which usually result in the loss of rare haplotypes, but can result in an increase in the
frequency of intermediate or even rare haplotypes (Moreau et al. 2009). Increased
sampling on a microgeographic scale may also reveal European subpopulations which
have a higher proportion of the rCRS control region haplotype. Such “microgeographic”

24
or “regional” sampling has already been shown to capture variation that is not seen when
current national borders are used as proxies for populations (Dubut et al. 2004).
Of the 36 HVS-1 and HVS-2 haplotypes detected in the NW Basque population, 18
(50%) are private haplotypes, which is almost identical to the proportion (50.9%) found
in the BG Basque sample (Alfonso-Sanchez et al. 2008). These numbers for private
haplotypes should not be surprising (even in populations with relatively low nucleotide
diversity), given the fact that almost all estimates of haplotype diversity for mtDNA
control-region sequences are considered to be underestimates (Helgason et al. 2003;
Pereira et al. 2004). The fact that similar haplotype diversity is seen in the immigrant
Basque population can be explained by both the undersampled diversity in the source
population, and the relatively long history of Basque migration to North America, which
occurred in several waves throughout most of the 19th and 20th centuries (which would
result in increased gene flow between American and Basque populations).
Considering only HVS-1, 179 out of the 189 individuals (94.7%) carry either the
most common haplotype, or a sequence that is one mutational step removed from the
most common haplotype (the rCRS, see Figure 6). A similar pattern is seen in the
combined HVS-1, HVS-2 network. Despite the fact that only 7 out of the 30 haplotypes
in the network are shared, the majority of individuals (89.8%) are one or two mutational
steps from the two most common haplotypes (263G and 263G, 73G).
The fact that most Basque maternal lineages are so closely related may be the result
of two factors—each relating to diversity in the native Basque range. First is the high
proportion of haplogroup H and H subhaplogroups in both Spanish Basque and French
Basque populations (Alfonso-Sanchez et al. 2008; Richard et al. 2007), which would

25
result in a sampling of more recently diverged control-region lineages, compared to a
sample containing all the common European haplogroups (for example, see the haplotype
networks in Herrnstadt et al. (2002)). Secondly, the cultural and reproductive isolation of
Basques: only recently has there been limited migration within and between Spanish and
French Basque regions (possibly due to the importance of familial ties for land
ownership, see Calderón et al. (1993)). Related to this isolation, the Spanish Basque
regions (especially Gipuzkoa) have had until recently some of the highest rates of
consanguinity in Europe (Alfonso-Sanchez et al. 2001). Both of these factors will tend to
decrease the female effective population size, lowering the number of divergent mtDNA
lineages expected in that population.
Despite the relatively low female effective population size of all the Basque
populations studied thus far with mtDNA, the signature of demographic expansion can
still be detected in these populations (based on the neutrality statistics Tajima’s D and
Fu’s Fs), see Tables 1 and 2.
For immigrant populations, an increase in the frequency of pairwise mismatches of
zero or one difference is generally an indicator of a genetic bottleneck. For HVS-1 data
alone, the NW Basque show this pattern (Figure 4A), and this is concordant with the
much greater disparity in nucleotide diversity between the NW Basques and Spanish
Basques (Table 1). When HVS-2 is included in the analysis, the classes are virtually
identical; the difference being that the entire distribution is shifted toward smaller values,
with the NW Basque curve showing a multi-modal and somewhat more “ragged”
distribution (Figure 4B). However, when testing Harpending’s raggedness coefficient
(rg) using the coalescent simulation in DnaSP 5.0 (10,000 replicates), the results were

26
non-significant (rg = 0.0181, p = 0.06). Thus, a model of population growth cannot be
rejected. Despite the non-significant results of the rg simulation, the multi-modal
appearance of the distribution is qualitatively similar to distributions seen in empirical
studies (across a variety of species) of populations that have undergone either recent
bottlenecks or admixtures (Melton et al. 2010; Taylor and Keller 2007; Weber et al.
2004).
Co-Ancestry in Immigrant and Source Basque Populations
Despite its usefulness in population genetics, the hypervariable region of mtDNA has
long been known to be an unreliable marker for resolving intra-specific phylogenies in
humans (Templeton et al. 1992). Indeed, when phylogenetic trees (e.g., maximum
parsimony, maximum likelihood, or NJ trees) were constructed using HVS-1 and HVS-2
nucleotide data, no clear patterns among populations could be discerned (data not
shown). Conversely, when genetic distances are assessed with a measure based on
shared haplotypes (Reynolds’ distance), a more accurate assessment of recent genetic co-
ancestry can be made (for population-level comparisons) (Reynolds et al. 1983). This
and similar distance measures (such as Slatkin’s linearized FST) are the most appropriate
measures when comparing recent immigrant and source human populations using
control-region mtDNA data. These measures based on short-term genetic distance take
into account genetic drift, and are based on frequencies of haplotypes and their
distribution among populations, rather than the evolutionary relationships between
haplotypes. Thus, although founder effects have altered haplogroup and haplotype
frequencies, the NW and BG Basque populations retain more similarity to each other than
to the other European populations considered (Figure 8). The pattern of shared lineages
27
is independently validated by the historical record of Basque immigration (Bieter and
Bieter 2000; Douglass and Bilbao 1975).
Haplogroup distribution in Basque populations
Mitochondrial DNA haplotype and nucleotide diversity in NW Basques has clearly been
influenced by recent demographic events. This diversity has also been influenced by the
diversity and geographic structure of European haplogroups, which have in turn been
shaped by ancient demographic events (Achilli et al. 2004; Richards et al. 2000). The
Basques are believed to be descended from some of the earliest human colonists of
Europe, and their ancestors appear to have persisted within glacial refugia, remaining
relatively isolated from other European populations for much of their history. Certain
mtDNA haplogroups found in high frequency in the Basques (but distributed throughout
much of Europe) are believed to have originated approximately 15,000 - 30,000 BP,
during the Upper Paleolithic. For instance, among European populations, haplogroups
H1, H3, and H5a are most prevalent in the Franco-Cantabrian area, which includes the
Spanish and French Basque regions (Achilli et al. 2004; Alvarez-Iglesias et al. 2009). In
the Iberian peninsula, haplogroup H and its subgroups have comparable haplotype
diversity, but lower nucleotide diversity, than other European haplogroups (Alvarez-
Iglesias et al. 2009). Any population that is enriched for Iberian H lineages should
exhibit this same pattern in haplotype and nucleotide diversity. This pattern seems to
hold for both the native BG Basque and immigrant NW Basque populations: both
populations have the lowest diversity (π and θπ) of the populations listed in Table 4. The
nucleotide diversity values of the NW Basque are almost identical to those reported for

28
Iberian populations when only haplogroup H individuals are considered (Alvarez-Iglesias
et al. 2009). Thus, both the level and distribution of diversity within the mitochondrial
haplogroups in the putative source population appear to play an important role in shaping
the diversity of the immigrant NW Basque population.
NW Basques and Other European Immigrant Populations
The results for the NW Basque are consistent with founder effects that have been
documented in other immigrant populations. Perhaps the best example for comparison
involves the inhabitants of the Gaspe peninsula (Québec), which can be partitioned into
several groups with differing European ancestries, including the Acadians and Channel
Islanders. The Gaspe Channel Islanders derive from settlers who migrated from the
English Channel Islands, while the Acadians trace their roots to France. Compared to the
English Loyalists and other English-speaking groups, the French Acadians in Québec
started with a smaller founding population, and experienced a shorter period of
immigration from France (due to the subsequent British Conquest, Moreau et al. 2009).
The result of dissimilar demographic histories can be seen in the relative positions of the
Gaspe sub-populations in ordination space, relative to the pooled population data (Figure
9). Moreau et al. (2009) also find evidence for founder effects in the loss of rare
haplotypes and decreased genetic diversity.
Evidence for a founder effect can also be seen for Puerto Rican and U.S. Hispanic
populations (Figure 9). That a founder effect is seen in the Puerto Rican population may
seem counter-intuitive, because it has a long immigration history, and a relatively large
population. However, because the first settlers were almost exclusively Spanish males,

29
and the subsequent Spanish immigrant population was relatively small (compared to
Native American or African slaves), founder effects are believed to have contributed to
its current distribution of haplogroup frequencies (Juan et al. 2005; Martinez-Cruzado et
al. 2001). The same arguments can be made regarding the founder effect seen in the
haplogroup distribution for North American Hispanics, which have a similar PC value as
the Puerto Ricans (Figure 9). In addition, it is known that Hispanic populations in
different regions of the US have different sources of maternal lineages—differing in the
proportion of European versus Amerindian and African mtDNA (Merriwether et al.
1997). In general, although Hispanic populations are relatively large (compared to
specific ethnic sub-populations such as Basques or Acadians), the European component
of their mtDNA ancestry is comparatively small. Thus, it appears that just those
American populations that have experienced serial founder effects (Acadians), multiple
founder effects with relative isolation (Amish), and/or founding from relatively small
European source populations (Acadians, NW Basques, and Puerto Ricans) are those that
show the greatest differentiation between immigrant and source haplogroup profiles.
Some European-derived immigrant populations do not show such obvious founder
effects (such as in Argentina, Brazil, and Cuba) (Figure 9). This is most likely due to the
fact that these populations are descended from multiple sources and/or have been founded
by larger populations closer in haplogroup composition to their European source
populations. For many species, large founder populations and multiple introductions
have been shown to reduce or counter genetic founder effects (Novak and Mack 2005).
Kin-structured migration (KSM) is a migration pattern seen in many immigrant
groups, and is theorized to effect the genetics of populations by increasing variance

30
between source and migrant pools, and decreasing the effective size of immigrant
populations (Fix 2004). Historical studies of European migrations have found evidence
for KSM: Ostergren studied the records from 19th-century Sweden, and found kinship
networks in the migration patterns both within Sweden and in emigrants to America
(Ostergren 1982). Despite this and other studies documenting KSM in humans
(Gonzalez-Martin and Toja 2002; Williams-Blangero 1989), the genetic consequences of
KSM are not often addressed. However, this may change with increasing numbers of
studies of immigrant and isolated populations. In discussing the lower genetic diversity
of the Acadians compared with other Gaspesians, Moreau et al. mentions the fact that the
Acadian settler groups included extended families (Moreau et al. 2009). Kin-structured
migration was addressed in a recent investigation of North American Mennonite
congregations (Melton et al. 2010). Their results show that the genetic pattern of
population subdivision correlates with the known histories of kin-structured fission and
fusion. Anecdotal evidence suggests an important role for KSM in Basque migrations
(McCall 1968). For example, half of the Basque migrants to Idaho during the period
1897-1902 reported having relatives or acquaintances already in Idaho, and Basque
families often reported that half of their children were in America at one time or another
(Bieter and Bieter 2000; Douglass and Bilbao 1975). Thus, chain migration is a likely
scenario for the NW Basque population, and may have influenced founder effects in this
population; unfortunately, the mtDNA data alone cannot be used to rigorously test for
kin-structured migration.

31
Conclusions
By several measures of mtDNA diversity, I have shown that the NW Basque population
has been influenced by both recent migrations and ancient demographic events. In
addition, this is the first study comparing mtDNA diversity in an immigrant Basque
population with the diversity previously reported in the native Basque region. I have
found evidence to suggest that the NW Basque have experienced founder
effects/population bottlenecks in association with immigration to the U.S.A. This finding
should be further evaluated through the analysis of other immigrant Basque populations
in North and South America. Furthermore, immigrant Basques in the American
Northwest and elsewhere should be examined explicitly to assess the genetic
consequences of kin-structured migration using more appropriate genetic markers (e.g.,
microsatellite DNA).
The historical and genetic links between the NW Basque and Spanish (especially
Bizkaian and Gipuzkoan) Basque populations may prove fruitful in future studies of the
genetic basis of disease, as has been the case with other populations experiencing founder
effects, such as certain French Canadian (Québécois) and Amish populations (Ebermann
et al. 2009; van der Walt et al. 2005). Although no increased incidence of genetic disease
has been reported in American Basques, it is known that European Basque populations
experience an increased incidence of certain specific forms of Alzheimer’s and
Parkinson’s disease (Alvarez-Alvarez et al. 2003; Gonzalez-Fernandez et al. 2007;
Simon-Sanchez et al. 2006). Moreover, comparisons of populations with similar genetic
backgrounds in different environments are useful systems for determining genetic versus
environmental factors in disease. Thus, despite recent papers that focus on the lack of

32
genetic distinctiveness of Basque populations (Laayouni et al. 2010), or cast doubts on
the appropriateness of using the Basque as a population isolate for medical genetics
studies (Garagnani et al. 2009), it is evident that the well-studied genetic traits of Basque
populations, and the relative ease of verifying Basque ancestry (using surnames), make
the Basque an ideal subject for migration studies. Clearly, the Basque continue to serve
as an excellent model system for addressing numerous questions in human population
genetics and microevolution.

33
LITERATURE CITED
Achilli A, Rengo C, Magri C, Battaglia V, Olivieri A, Scozzari R, Cruciani F, Zeviani M,
Briem E, Carelli V, Moral P, Dugoujon J-M, Roostalu U, Loogväli E-L, Kivisild T, Bandelt H-J, Richards M, Villems R, Santachiara-Benerecetti AS, Semino O, and Torroni A. 2004. The molecular dissection of mtDNA haplogroup H confirms that the Franco-Cantabrian glacial refuge was a major source for the European gene pool. Am J Hum Genet 75(5):910-918.
Adams SM, Bosch E, Balaresque PL, Ballereau SJ, Lee AC, Arroyo E, Lopez-Parra AM, Aler M, Grifo MS, Brion M, Carracedo A, Lavinha J, Martinez-Jarreta B, Quintana-Murci L, Picornell A, Ramon M, Skorecki K, Behar DM, Calafell F, and Jobling MA. 2008. The genetic legacy of religious diversity and intolerance: paternal lineages of Christians, Jews, and Muslims in the Iberian Peninsula. Am J Hum Genet 83(6):725-736.
Alberdi F, Allison AC, Blumberg BS, Ikin EW, and Mourant AE. 1957. The Blood Groups of The Spanish Basques. J R ANTHROPOL INST G 87(2):217.
Alfonso-Sanchez MA, Cardoso S, Martinez-Bouzas C, Pena JA, Herrera RJ, Castro A, Fernandez-Fernandez I, and De Pancorbo MM. 2008. Mitochondrial DNA haplogroup diversity in Basques: a reassessment based on HVI and HVII polymorphisms. Am J Hum Biol 20(2):154-164.
Alfonso-Sanchez MA, Martinez-Bouzas C, Castro A, Pena JA, Fernandez-Fernandez I, Herrera RJ, and de Pancorbo MM. 2006. Sequence polymorphisms of the mtDNA control region in a human isolate: the Georgians from Swanetia. J Hum Genet 51(5):429-439.
Alfonso-Sanchez MA, Pena JA, Aresti U, and Calderon R. 2001. An insight into recent consanguinity within the Basque area in Spain. Effects of autochthony, industrialization and demographic changes. Ann Hum Biol 28(5):505-521.
Alonso S, and Armour JA. 1998. MS205 minisatellite diversity in Basques: evidence for a pre-Neolithic component. Genome Res 8(12):1289-1298.

34
Alvarez-Alvarez M, Galdos L, Fernandez-Martinez M, Gomez-Busto F, Garcia-Centeno V, Arias-Arias C, Sanchez-Salazar C, Rodriguez-Martinez AB, Zarranz JJ, and de Pancorbo MM. 2003. 5-Hydroxytryptamine 6 receptor (5-HT(6)) receptor and apolipoprotein E (ApoE) polymorphisms in patients with Alzheimer's disease in the Basque Country. Neurosci Lett 339(1):85-87.
Alvarez-Iglesias V, Mosquera-Miguel A, Cerezo M, Quintans B, Zarrabeitia MT, Cusco I, Lareu MV, Garcia O, Perez-Jurado L, Carracedo A, and Salas A. 2009. New population and phylogenetic features of the internal variation within mitochondrial DNA macro-haplogroup R0. PLoS One 4(4):e5112.
Alvarez JC, Johnson DL, Lorente JA, Martinez-Espin E, Martinez-Gonzalez LJ, Allard M, Wilson MR, and Budowle B. 2007. Characterization of human control region sequences for Spanish individuals in a forensic mtDNA data set. Leg Med (Tokyo) 9(6):293-304.
Alves-Silva J, da Silva Santos M, Guimaraes PE, Ferreira AC, Bandelt HJ, Pena SD, and Prado VF. 2000. The ancestry of Brazilian mtDNA lineages. Am J Hum Genet 67(2):444-461.
Andrews RM, Kubacka I, Chinnery PF, Lightowlers RN, Turnbull DM, and Howell N. 1999. Reanalysis and revision of the Cambridge reference sequence for human mitochondrial DNA. Nat Genet 23(2):147.
Arnaiz-Villena A, Martinez-Laso J, and Alonso-Garcia J. 1999. Iberia: population genetics, anthropology, and linguistics. Hum Biol 71(5):725-743.
Arrizabalaga M-P. 1986. A Statistical Study of Basque Immigration Into California, Nevada, Idaho, and Wyoming Between 1900 and 1910 [Masters thesis]. Reno, Nevada: University of Nevada Reno.
Avise J. 2000. Phylogeography: the history and formation of species. Harvard: Harvard University Press. 447 p.
Bandelt HJ, Forster P, and Röhl A. 1999. Median-joining networks for inferring intraspecific phylogenies. Molecular Biology and Evolution 16(1):37-48.
Bandelt HJ, Quintana-Murci L, Salas A, and Macaulay V. 2002. The fingerprint of phantom mutations in mitochondrial DNA data. Am J Hum Genet 71(5):1150-1160.

35
Bedoya G, Montoya P, Garcia J, Soto I, Bourgeois S, Carvajal L, Labuda D, Alvarez V, Ospina J, Hedrick PW, and Ruiz-Linares A. 2006. Admixture dynamics in Hispanics: a shift in the nuclear genetic ancestry of a South American population isolate. PNAS 103(19):7234-7239.
Behar DM, Rosset S, Blue-Smith J, Balanovsky O, Tzur S, Comas D, Mitchell RJ, Quintana-Murci L, Tyler-Smith C, and Wells RS. 2007. The Genographic Project public participation mitochondrial DNA database. PLoS Genet 3(6):e104.
Bendall K, and Sykes B. 1995. Length heteroplasmy in the first hypervariable segment of the human mtDNA control region. American Journal of Human Genetics 57:224-226.
Bertranpetit J, Sala J, Calafell F, Underhill PA, Moral P, and Comas D. 1995. Human mitochondrial DNA variation and the origin of Basques. Ann Hum Genet 59(Pt 1):63-81.
Bieter J, and Bieter M. 2000. An enduring legacy: the story of Basques in Idaho. Reno, NV: University of Nevada Press. 191 p.
Bosch E, Calafell F, Gonzalez-Neira A, Flaiz C, Mateu E, Scheil HG, Huckenbeck W, Efremovska L, Mikerezi I, Xirotiris N, Grasa C, Schmidt H, and Comas D. 2006. Paternal and maternal lineages in the Balkans show a homogeneous landscape over linguistic barriers, except for the isolated Aromuns. Annals of Human Genetics 70(Pt 4):459 - 487.
Boyd WC, and Boyd LG. 1937. New data on blood groups and other inherited factors in Europe and Egypt. Am J Phys Anthropol 23(1):49-70.
Brown WM, George M, Jr., and Wilson AC. 1979. Rapid evolution of animal mitochondrial DNA. Proc Natl Acad Sci U S A 76(4):1967-1971.
Budowle B, Wilson MR, DiZinno JA, Stauffer C, Fasano MA, Holland MM, and Monson KL. 1999. Mitochondrial DNA regions HVI and HVII population data. Forensic Sci Int 103(1):23-35.
Bush WS, Crawford DC, Alexander C, George AL, Jr., Roden DM, and Ritchie MD. 2009. Genetic variation in the rhythmonome: ethnic variation and haplotype structure in candidate genes for arrhythmias. Pharmacogenomics 10(6):1043-1053.
36
Butler J. 2005. Forensic DNA Typing: Biology, Technology, and Genetics of STR markers: Academic Press.
Calafell F, and Bertranpetit J. 1994. Principal component analysis of gene frequencies and the origin of Basques. Am J Phys Anthropol 93(2):201-215.
Calderon R, Carrion M, Perez-Miranda A, Pena JA, Dugoujon JM, and Crouau-Roy B. 2003. Allele variation of DYS19 and Y-Alu insertion (YAP) polymorphisms in Basques: an insight into the peopling of Europe and the Mediterranean region. Hum Biol 75(1):117-127.
Calderon R, Pena JA, Morales B, and Guevara JI. 1993. Inbreeding patterns in the Basque Country (Alava Province, 1831-1980). Hum Biol 65(5):743-770.
Calderon R, Vidales C, Pena JA, Perez-Miranda A, and Dugoujon JM. 1998. Immunoglobulin allotypes (GM and KM) in Basques from Spain: approach to the origin of the Basque population. Hum Biol 70(4):667-698.
Cavalli-Sforza L. 1988. The Basque population and ancient migrations in Europe. Munibe (Antropologia y Arqueologia) Supplemento 6:129-137.
Cavalli-Sforza L, and Cavalli-Sforza F. 1995. The Great Human Diasporas: The History of Diversity and Evolution. Cambridge, Mass.: Perseus.
Census. 2000. U.S. Census. Bureau of the Census.
Chalmers JN, Ikin EW, and Mourant AE. 1949. The ABO, MN and Rh blood groups of the Basque people. Am J Phys Anthropol 7(4):529-544.
Chambers R. 1844. Vestiges of the Natural History of Creation. London: John Churchhill.
Comas D, Mateu E, Calafell F, Perez-Lezaun A, Bosch E, Martinez-Arias R, and Bertranpetit J. 1998. HLA class I and class II DNA typing and the origin of Basques. Tissue Antigens 51(1):30-40.
Corte-Real HB, Macaulay VA, Richards MB, Hariti G, Issad MS, Cambon-Thomsen A, Papiha S, Bertranpetit J, and Sykes BC. 1996. Genetic diversity in the Iberian
37
Peninsula determined from mitochondrial sequence analysis. Ann Hum Genet 60(Pt 4):331-350.
de Pancorbo MM, Lopez-Martinez M, Martinez-Bouzas C, Castro A, Fernandez-Fernandez I, de Mayolo GA, de Mayolo AA, de Mayolo PA, Rowold DJ, and Herrera RJ. 2001. The Basques according to polymorphic Alu insertions. Hum Genet 109(2):224-233.
Dobzhansky T, and Wright S. 1943. Genetics of natural populations. X. Dispersion rates in Drosophila pseudoobscura. Genetics 28(4):304-340.
Douglass WA, and Bilbao J. 1975. Amerikanuak: Basques in the New World. Reno: University of Nevada Press. 536 p.
Dubut V, Chollet L, Murail P, Cartault F, Beraud-Colomb E, Serre M, and Mogentale-Profizi N. 2004. mtDNA polymorphisms in five French groups: importance of regional sampling. Eur J Hum Genet 12(4):293-300.
Ebermann I, Koenekoop RK, Lopez I, Bou-Khzam L, Pigeon R, and Bolz HJ. 2009. An USH2A founder mutation is the major cause of Usher syndrome type 2 in Canadians of French origin and confirms common roots of Quebecois and Acadians. Eur J Hum Genet 17(1):80-84.
Edlefsen J. 1948. A Sociological Study of the Basques of Southwest Idaho [PhD Thesis]. Pullman, Washington: State College of Washington.
Etcheverry MA. 1945. El factor rhesus: su genética e importancia clınical. El Dıá Médico 17:1237-1251.
Etcheverry MA. 1947. El factor rhesus en personas de ascendencia Iberia residentes en la Argentina. Sem Med Buenos Aires 54:505.
Excoffier L, Laval G, and Schneider S. 2005. Arlequin (version 3.0): An integrated software package for population genetics data analysis. Evol Bioinform Online 1:47-50.
Fix AG. 2004. Kin-structured migration: causes and consequences. Am J Hum Biol 16(4):387-394.

38
Francalacci P, Bertranpetit J, Calafell F, and Underhill PA. 1996. Sequence diversity of the control region of mitochondrial DNA in Tuscany and its implications for the peopling of Europe. Am J Phys Anthropol 100(4):443-460.
Fu YX, and Li WH. 1993. Statistical Tests of Neutrality of Mutations. Genetics 133(3):693-709.
Garagnani P, Laayouni H, Gonzalez-Neira A, Sikora M, Luiselli D, Bertranpetit J, and Calafell F. 2009. Isolated populations as treasure troves in genetic epidemiology: the case of the Basques. Eur J Hum Genet.
Garcia O, Fregel R, Larruga JM, Alvarez V, Yurrebaso I, Cabrera VM, and Gonzalez AM. 2010. Using mitochondrial DNA to test the hypothesis of a European post-glacial human recolonization from the Franco-Cantabrian refuge. Heredity in press.
Gomez A, and Lunt DH. 2007. Refugia within refugia: patterns of phylogenetic concordance in the Iberian Penninsula. In: Weiss S, and Ferrand, Nuno, editor. Phylogeography of Southern European Refugia: Evolutionary Perspectives on the Origins and Conservation of European Biodiversity. Dordrecht, The Netherlands: Springer. p 377.
Gonzalez-Fernandez MC, Lezcano E, Ross OA, Gomez-Esteban JC, Gomez-Busto F, Velasco F, Alvarez-Alvarez M, Rodriguez-Martinez MB, Ciordia R, Zarranz JJ, Farrer MJ, Mata IF, and de Pancorbo MM. 2007. Lrrk2-associated parkinsonism is a major cause of disease in Northern Spain. Parkinsonism Relat Disord 13(8):509-515.
Gonzalez-Martin A, and Toja D. 2002. Inbreeding, isonymy, and kin-structured migration in the principality of Andorra. Hum Biol 74(4):587-600.
Gonzalez AM, Garcia O, Larruga JM, and Cabrera VM. 2006. The mitochondrial lineage U8a reveals a Paleolithic settlement in the Basque country. BMC Genomics 7:124.
Gray MP. 1955. A Population and Family Study of Basques Living in Shoshone and Boise, Idaho. [Ph.D.]: University of Oregon.
Griswold CK, and Baker AJ. 2002. Time to the most recent common ancestor and divergence times of populations of common chaffinches (Fringilla coelebs) in

39
Europe and North Africa: insights into Pleistocene refugia and current levels of migration. Evolution 56(1):143-153.
Grivet D, and Petit RJ. 2002. Phylogeography of the common ivy (Hedera sp.) in Europe: genetic differentiation through space and time. Mol Ecol 11(8):1351-1362.
Guicking D, Joger U, and Wink M. 2008. Molecular phylogeography of the viperine snake Natrix maura (Serpentes: Colubridae): Evidence for strong intraspecific differentiation. Organisms Diversity & Evolution 8(2):130.
Helgason A, Nicholson G, Stefansson K, and Donnelly P. 2003. A reassessment of genetic diversity in Icelanders: strong evidence from multiple loci for relative homogeneity caused by genetic drift. Ann Hum Genet 67(Pt 4):281-297.
Helgason A, Sigureth ardottir S, Gulcher JR, Ward R, and Stefansson K. 2000. mtDNA and the origin of the Icelanders: deciphering signals of recent population history. Am J Hum Genet 66(3):999-1016.
Herrnstadt C, Elson JL, Fahy E, Preston G, Turnbull DM, Anderson C, Ghosh SS, Olefsky JM, Beal MF, Davis RE, and Howell N. 2002. Reduced-Median-Network Analysis of Complete Mitochondrial DNA Coding-Region Sequences for the Major African, Asian, and European Haplogroups. The American Journal of Human Genetics 70(5):1152-1171.
Iriondo M, Barbero MC, Izagirre N, and Manzano C. 1997. Data on six short-tandem repeat polymorphisms in an autochthonous Basque population. Hum Hered 47(3):131-137.
Iriondo M, Barbero MC, and Manzano C. 2003. DNA polymorphisms detect ancient barriers to gene flow in Basques. Am J Phys Anthropol 122(1):73-84.
Izagirre N, Alonso S, and Concepcion de la R. 2001. DNA analysis and the evolutionary history of the Basque population: a review. J Anthropol Res 57(3):325.
Jobling MA, Hurles M, and Tyler-Smith C. 2004. Human evolutionary genetics: origins, peoples, and disease: Abingdon and New York , Garland Science.
Juan CM-C, Gladys T-L, Jorge V-V, Michelle YR-V, Jennifer S, Magda L-E, Alicia R-C, Rebecca R-T, Iris YN-M, Enid G-S, Héctor YC-G, and Patricia V-R. 2005.
40
Reconstructing the population history of Puerto Rico by means of mtDNA phylogeographic analysis. Am J Phys Anthropol 128(1):131-155.
Kumar S, Nei M, Dudley J, and Tamura K. 2008. MEGA: a biologist-centric software for evolutionary analysis of DNA and protein sequences. Brief Bioinform 9(4):299-306.
Kurlansky M. 1999. The Basque History of the World: Walker Publishing Company.
Laayouni H, Calafell F, and Bertranpetit J. 2010. A genome-wide survey does not show the genetic distinctiveness of Basques. Hum Genet 127(4):455-458.
Laughlin WS, Gray MP, and Hopkins CE. 1956. Blood group genetics of the Basques of Idaho. Acta Genet Stat Med 6(4):536-548.
Lehuenen J. 1984. The Role of the Basque, Breton and Norman cod fishermen in the discovery of North America from the XVIth to the end of the XVIIIth Century. Arctic 37(4).
Li JZ, Absher DM, Tang H, Southwick AM, Castro AM, Ramachandran S, Cann HM, Barsh GS, Feldman M, and Cavalli-Sforza LL. 2008. Worldwide Human Relationships Inferred from Genome-Wide Patterns of Variation. Science 319:1100 - 1103.
Librado P, and Rozas J. 2009. DnaSP v5: a software for comprehensive analysis of DNA polymorphism data. Bioinformatics 25(11):1451-1452.
Malyarchuk B, nbsp, A, Grzybowski T, Derenko M, nbsp, V, Czarny J, Wozniak M, and Miscicka-Sliwka D. 2002. Mitochondrial DNA variability in Poles and Russians. Annals of Human Genetics 66(04):261-283.
Manzano C, Aguirre AI, Iriondo M, Martin M, Osaba L, and de la Rua C. 1996. Genetic polymorphisms of the Basques from Gipuzkoa: genetic heterogeneity of the Basque population. Ann Hum Biol 23(4):285-296.
Martinez-Cruzado JC, Toro-Labrador G, Ho-Fung V, Estevez-Montero MA, Lobaina-Manzanet A, Padovani-Claudio DA, Sanchez-Cruz H, Ortiz-Bermudez P, and Sanchez-Crespo A. 2001. Mitochondrial DNA analysis reveals substantial Native American ancestry in Puerto Rico. Hum Biol 73(4):491 - 511.

41
McCall GE. 1968. Basque-Americans and a sequential theory of migration and adaptation [Masters]. San Francisco: San Francisco State College. 86 p.
Melo-Ferreira J, Boursot P, Randi E, Kryukov A, Suchentrunk F, Ferrand N, and Alves PC. 2007. The rise and fall of the mountain hare (Lepus timidus) during Pleistocene glaciations: expansion and retreat with hybridization in the Iberian Peninsula. Mol Ecol 16(3):605-618.
Melton PE, Mosher MJ, Rubicz R, Zlojutro M, and Crawford MH. 2010. Mitochondrial DNA diversity in Mennonite communities from the Midwestern United States. in press.
Mendizabal I, Sandoval K, Berniell-Lee G, Calafell F, Salas A, Martinez-Fuentes A, and Comas D. 2008. Genetic origin, admixture, and asymmetry in maternal and paternal human lineages in Cuba. BMC Evol Biol 8:213.
Merriwether DA, Huston S, Iyengar S, Hamman R, Norris JM, Shetterly SM, Kamboh MI, and Ferrell RE. 1997. Mitochondrial versus nuclear admixture estimates demonstrate a past history of directional mating. Am J Phys Anthropol 102(2):153-159.
Michaux JR, Magnanou E, Paradis E, Nieberding C, and Libois R. 2003. Mitochondrial phylogeography of the Woodmouse (Apodemus sylvaticus) in the Western Palearctic region. Mol Ecol 12(3):685-697.
Moreau C, Vezina H, Yotova V, Hamon R, de Knijff P, Sinnett D, and Labuda D. 2009. Genetic heterogeneity in regional populations of Quebec-Parental lineages in the Gaspe Peninsula. Am J Phys Anthropol 139(4):512-522.
Nei M. 1987. Molecular Evolutionary Genetics: Columbia University Press. 512 p.
Nei M, and Kumar S. 2000. Molecular Evolution and Phylogenetics. New York: Oxford University Press. 333 p.
Nei M, Maruyama T, and Chakraborty R. 1975. The bottleneck effect and genetic variability in populations. Evolution 29(1):1.
Nijenhuis LE. 1956. Blood group frequencies in French Basques. Acta Genet Stat Med 6(4):531-535.

42
Novak SJ. 2010. Geographic Origin and Introduction Dynamics. In: Rejmanek M, and Simberloff D, editors. Encylopedia of Biological Invasions. Berkeley: University of California Press. p in press.
Novak SJ, and Mack RN. 2005. Genetic bottlenecks in alien plant species: infuence of mating systems and introduction dynamics. In: Sax DF, Stachowicz JJ, and Gaines SD, editors. Species Invasions: Insights into Ecology, Evolution, and Biogeography. Sunderland, MA: Sinauer Associates. p 201-228.
Ostergren R. 1982. Kinship Networks and Migration: A Nineteenth-Century Swedish Example. Social Science History 6(3):293-320.
Parson W, and Dür A. 2007. EMPOP--A forensic mtDNA database. Forensic Science International: Genetics 1(2):88.
Pereira L, Cunha C, and Amorim A. 2004. Predicting sampling saturation of mtDNA haplotypes: an application to an enlarged Portuguese database. Int J Legal Med 118(3):132-136.
Picornell A, Gomez-Barbeito L, Tomas C, Castro JA, and Ramon MM. 2005. Mitochondrial DNA HVRI variation in Balearic populations. Am J Phys Anthropol 128(1):119-130.
Piercy R, Sullivan KM, Benson N, and Gill P. 1993. The application of mitochondrial DNA typing to the study of white Caucasian genetic identification. International Journal of Legal Medicine 106(2):85-90.
Plaza S, Salas A, Calafell F, Corte-Real F, Bertranpetit J, Carracedo Á, and Comas D. 2004. Insights into the western Bantu dispersal: mtDNA lineage analysis in Angola. Human Genetics 115(5):439.
Puffenberger EG. 2003. Genetic heritage of the Old Order Mennonites of southeastern Pennsylvania. Am J Med Genet C Semin Med Genet 121C(1):18-31.
Ramachandran S, Deshpande O, Roseman CC, Rosenberg NA, Feldman MW, and Cavalli-Sforza LL. 2005. Support from the relationship of genetic and geographic distance in human populations for a serial founder effect originating in Africa. PNAS 102(44):15942-15947.

43
Reynolds J, Weir BS, and Cockerham CC. 1983. Estimation of the coancestry coefficient: basis for a short-term genetic distance. Genetics 105(3):767-779.
Richard C, Pennarun E, Kivisild T, Tambets K, Tolk HV, Metspalu E, Reidla M, Chevalier S, Giraudet S, Lauc LB, Pericic M, Rudan P, Claustres M, Journel H, Dorval I, Muller C, Villems R, Chaventre A, and Moisan JP. 2007. An mtDNA perspective of French genetic variation. Ann Hum Biol 34(1):68-79.
Richards M, Macaulay V, Hickey E, Vega E, Sykes B, Guida V, Rengo C, Sellitto D, Cruciani F, Kivisild T, Villems R, Thomas M, Rychkov S, Rychkov O, Rychkov Y, Golge M, Dimitrov D, Hill E, Bradley D, Romano V, Cali F, Vona G, Demaine A, Papiha S, Triantaphyllidis C, Stefanescu G, Hatina J, Belledi M, Di Rienzo A, Novelletto A, Oppenheim A, Norby S, Al-Zaheri N, Santachiara-Benerecetti S, Scozari R, Torroni A, and Bandelt HJ. 2000. Tracing European founder lineages in the Near Eastern mtDNA pool. Am J Hum Genet 67(5):1251-1276.
Rowe G, Harris DJ, and Beebee TJ. 2006. Lusitania revisited: a phylogeographic analysis of the natterjack toad Bufo calamita across its entire biogeographical range. Mol Phylogenet Evol 39(2):335-346.
Saillard J, Forster P, Lynnerup N, Bandelt HJ, and Norby S. 2000. mtDNA variation among Greenland Eskimos: the edge of the Beringian expansion. Am J Hum Genet 67(3):718-726.
Salas A, Acosta A, Alvarez-Iglesias V, Cerezo M, Phillips C, Lareu MV, and Carracedo A. 2008. The mtDNA ancestry of admixed Colombian populations. Am J Hum Biol 20(5):584-591.
Salas A, Comas D, Lareu MV, Bertranpetit J, and Carracedo A. 1998. mtDNA analysis of the Galician population: a genetic edge of European variation. Eur J Hum Genet 6(4):365-375.
Salas A, Richards M, Lareu M-V, Scozzari R, Coppa A, Torroni A, Macaulay V, and Carracedo Á. 2004. The African Diaspora: Mitochondrial DNA and the Atlantic Slave Trade. Am J Hum Genet 74(3):454.
Santos C, Lima M, Montiel R, Angles N, Pires L, Abade A, and Ma PA. 2003. Genetic Structure and Origin of Peopling in The Azores Islands (Portugal): The View from mtDNA. Ann Hum Genet 67(5):433-456.

44
Schneider S, and Excoffier L. 1999. Estimation of past demographic parameters from the distribution of pairwise differences when the mutation rates vary among sites: application to human mitochondrial DNA. Genetics 152(3):1079-1089.
Simon-Sanchez J, Marti-Masso JF, Sanchez-Mut JV, Paisan-Ruiz C, Martinez-Gil A, Ruiz-Martinez J, Saenz A, Singleton AB, Lopez de Munain A, and Perez-Tur J. 2006. Parkinson's disease due to the R1441G mutation in Dardarin: a founder effect in the Basques. Mov Disord 21(11):1954-1959.
Slatkin M. 1985. Gene flow in natural populations. Ann Rev Ecol Syst 16:393-430.
Stoneking M. 1994. Mitochondrial DNA and human evolution. J Bioenerg Biomembr 26(3):251-259.
Tajima F. 1983. Evolutionary relationship of DNA sequence in Finte populations. Genetics 105(2):437-460.
Taylor DR, and Keller SR. 2007. Historical range expansion determines the phylogenetic diversity introduced during contemporary species invasion. Evolution 61(2):334-345.
Templeton AR, Hedges SB, Kumar S, Tamura K, and Stoneking M. 1992. Human Origins and Analysis of Mitochondrial DNA Sequences. Science 255(5045):737.
Torroni A, Achilli A, Macaulay V, Richards M, and Bandelt HJ. 2006. Harvesting the fruit of the human mtDNA tree. Trends Genet 22(6):339-345.
Torroni A, Bandelt HJ, Macaulay V, Richards M, Cruciani F, Rengo C, Martinez-Cabrera V, Villems R, Kivisild T, Metspalu E, Parik J, Tolk HV, Tambets K, Forster P, Karger B, Francalacci P, Rudan P, Janicijevic B, Rickards O, Savontaus ML, Huoponen K, Laitinen V, Koivumaki S, Sykes B, Hickey E, Novelletto A, Moral P, Sellitto D, Coppa A, Al-Zaheri N, Santachiara-Benerecetti AS, Semino O, and Scozzari R. 2001. A signal, from human mtDNA, of postglacial recolonization in Europe. Am J Hum Genet 69(4):844-852.
Upholt WB, and Dawid IB. 1977. Mapping of mitochondrial DNA of individual sheep and goats: rapid evolution in the D loop region. Cell 11(3):571-583.
45
van der Walt JM, Scott WK, Slifer S, Gaskell PC, Martin ER, Welsh-Bohmer K, Creason M, Crunk A, Fuzzell D, McFarland L, Kroner CC, Jackson CE, Haines JL, and Pericak-Vance MA. 2005. Maternal lineages and Alzheimer disease risk in the Old Order Amish. Hum Genet 118(1):115-122.
Vialatte A, Guiller A, Bellido A, and Madec L. 2008. Phylogeography and historical demography of the Lusitanian snail Elona quimperiana reveal survival in unexpected separate glacial refugia. BMC Evol Biol 8:339.
Watterson GA. 1974. The Sampling Theory of Selectively Neutral Alleles. Advances in Applied Probability 6(3):463.
Weber DS, Stewart BS, and Lehman N. 2004. Genetic consequences of a severe population bottleneck in the Guadalupe fur seal (Arctocephalus townsendi). J Hered 95(2):144-153.
Williams-Blangero S. 1989. Phenotypic consequences of nonrandom migration in the Jirels of Nepal. Am J Phys Anthropol 80(1):115-125.
Wilson MR, Polanskey D, Butler J, DiZinno JA, Replogle J, and Budowle B. 1995. Extraction, PCR amplification and sequencing of mitochondrial DNA from human hair shafts. Biotechniques 18(4):662-669.
Yao YG, Salas A, Logan I, and Bandelt HJ. 2009. mtDNA data mining in GenBank needs surveying. Am J Hum Genet 85(6):929-933; author reply 933.
Zlojutro M, Roy R, Palikij J, and Crawford MH. 2006. Autosomal STR variation in a Basque population: Vizcaya Province. Hum Biol 78(5):599-618.
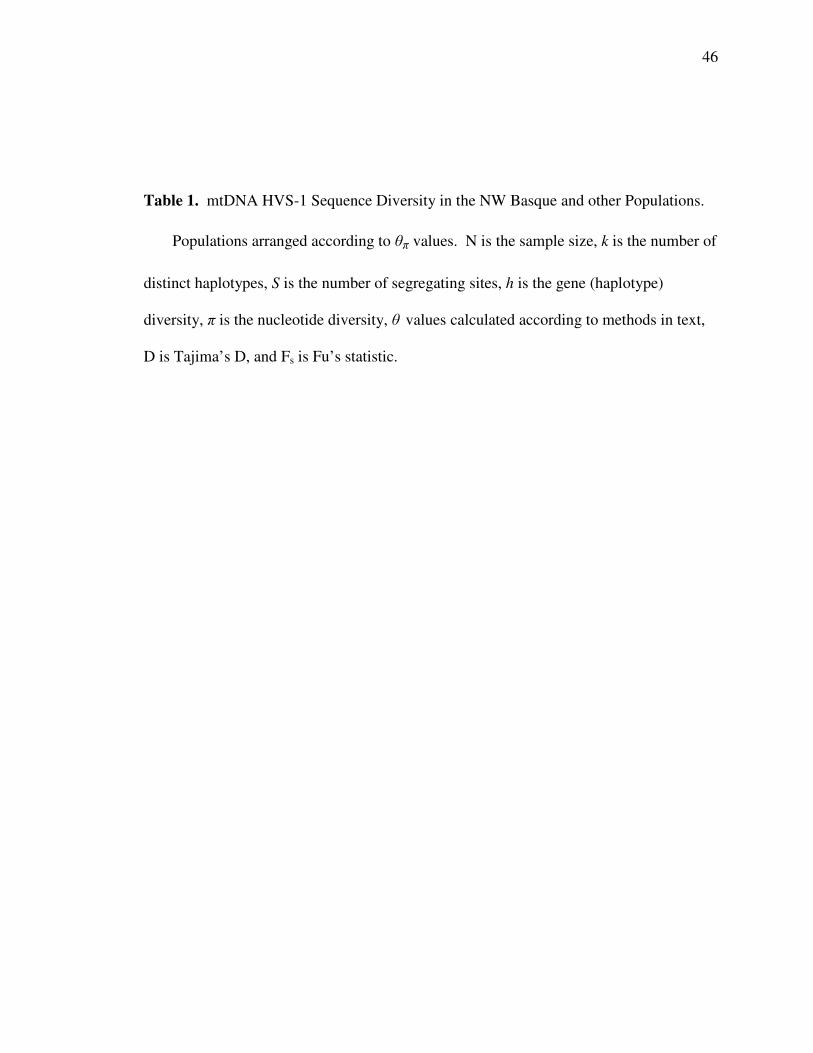
46
Table 1. mtDNA HVS-1 Sequence Diversity in the NW Basque and other Populations.
Populations arranged according to θπ values. N is the sample size, k is the number of
distinct haplotypes, S is the number of segregating sites, h is the gene (haplotype)
diversity, π is the nucleotide diversity, θ values calculated according to methods in text,
D is Tajima’s D, and Fs is Fu’s statistic.

47
Sam
ple
N
k
S
h ±
sd
π ±
sd
θπ ±
sd
θs
± s
d
θ
k (9
5% C
I)
D
Fs
NW
Ba
squ
es
53
23
29
0.84
9 ±
0.0
42
0.00
6 ±
0.0
04
2.34
± 1
.44
6.39
± 2
.07
14.
9 (8
.6 –
25.
6)
–2.
09
–17
.65
Aca
dian
s (G
aspe
) 10
1 31
34
0.
877
± 0
.028
0.
010
± 0
.006
2.
83 ±
1.6
6 6.
55 ±
1.9
1 1
4.9
(9.5
– 2
2.9)
–
1.75
–
21.3
9
BA
Bas
que
61
34
41
0.92
6 ±
0.0
27
0.01
1 ±
0.0
06
2.91
± 1
.55
8.33
± 2
.54
30.
9 (1
8.7
– 51
.1)
–2.
25
–26
.48
Gal
icia
n 92
48
57
0.
898
± 0
.029
0.
012
± 0
.007
3.
17 ±
1.6
5 10
.41
± 2
.89
39.
8 (2
6.3
– 60
.2)
–2.
32
–26
.38
G B
asqu
e 45
27
34
0.
949
± 0
.021
0.
013
± 0
.007
3.
51 ±
1.8
2 6.
63 ±
2.2
0 2
7.6
(15.
4 –
49.6
) –
1.81
–
21.1
5
BG
Bas
que
55
27
34
0.91
4 ±
0.0
29
0.01
3 ±
0.0
07
3.58
± 2
.05
6.78
± 2
.16
20.
3 (1
1.9
– 34
.5)
–1.
97
–17
.64
Fre
nch
Bas
que
81
33
50
0.90
9 ±
0.0
24
0.01
3 ±
0.0
08
3.66
± 2
.07
9.26
± 2
.66
20.
3 (1
2.8
– 31
.8)
–2.
15
–22
.21
Wel
sh
92
45
54
0.92
6 ±
0.0
21
0.01
4 ±
0.0
08
3.85
± 2
.16
9.62
± 2
.69
34.
2 (2
2.5
– 51
.8)
–2.
08
–25
.99
Cha
n.Is
land
ers
(Gas
pe)
76
43
50
0.97
7 ±
0.0
07
0.01
5 ±
0.0
08
4.07
± 2
.28
10.2
0 ±
2.9
3 4
0.2
(25.
5 –
63.4
) –
1.97
–
25.9
0
Cub
an C
auc.
53
35
41
0.
978
± 0
.009
0.
015
± 0
.009
4.
16 ±
2.1
0 9.
03 ±
2.8
0 4
3.8
(25.
3 –
76.7
) –
1.82
–
25.8
3
Alb
ania
n 42
29
44
0.
966
± 0
.018
0.
015
± 0
.009
4.
24 ±
2.3
8 9.
30 ±
2.9
9 4
0.1
(21.
7 –
75.9
) –
2.10
–
23.3
7
Rus
sian
12
4 85
76
0.
980
± 0
.007
0.
016
± 0
.009
4.
28 ±
2.3
7 14
.09
± 3
.61
117
.9 (
81.2
– 1
72.9
) –
2.22
–
25.7
0
Arg
enti
nean
Cau
c.
58
41
45
0.98
1 ±
0.0
08
0.01
6 ±
0.0
09
4.36
± 2
.42
9.72
± 2
.94
61.
0 (3
5.6
– 10
6.4)
–
1.86
–
25.7
7
And
alus
ia
49
37
45
0.96
4 ±
0.0
19
0.01
7 ±
0.0
09
4.67
± 2
.33
9.42
± 2
.94
67.
1 (3
6.7
– 12
6.3)
–
2.00
–
25.6
5
Cat
alon
ia
46
28
40
0.91
8 ±
0.0
35
0.01
7 ±
0.0
10
4.74
± 2
.62
8.19
± 2
.63
29.
4 (1
6.6
– 52
.7)
–1.
77
–17
.59
Spa
in
295
176
104
0.97
4 ±
0.0
06
0.01
4 ±
0.0
08
4.78
± 2
.59
16.2
9 ±
3.6
3 1
83.0
(14
4.1
– 23
2.7)
–
2.15
–
25.0
8
Ger
man
y 13
9 77
67
0.
965
± 0
.009
0.
018
± 0
.010
5.
03 ±
2.7
2 11
.44
± 2
.94
70.
2 (4
9.9
– 98
.9)
–2.
03
–25
.36
Tus
cany
49
39
58
0.
967
± 0
.019
0.
019
± 0
.010
5.
15 ±
2.8
2 12
.11
± 3
.69
86.
4 (4
6.0
– 16
9.0)
–
2.09
–
25.5
0
Por
tuga
l 24
1 14
2 93
0.
959
± 0
.010
0.
019
± 0
.010
5.
34 ±
2.8
6 15
.02
± 3
.47
144
.2 (
110.
9 –
187.
9)
–2.
12
–24
.99
Icel
and
394
124
73
0.97
8 ±
0.0
02
0.02
0 ±
0.0
10
5.35
± 2
.86
10.6
8 ±
2.4
0 6
1.9
(49.
2 –
77.5
) –
1.72
–
24.7
5
Geo
rgia
ns
47
36
44
0.98
3 ±
0.0
09
0.02
0 ±
0.0
12
5.49
± 2
.98
9.51
± 2
.99
68.
6 (3
6.9
– 13
1.9)
–
1.50
–
25.4
0
Ang
olan
44
37
58
0.
992
± 0
.007
0.
038
± 0
.020
10
.55
± 5.
44
12.8
7 ±
3.9
8 1
07.0
(52
.7 –
230
.2)
–0.
90*
–22
.32
*
not s
igni
fica
ntly
dif
fere
nt f
rom
zer
o

48
Tab
le 2
. m
tDN
A H
VS
-1 a
nd H
VS
-2 c
ombi
ned
sequ
ence
div
ersi
ty i
n th
e N
W B
asqu
e an
d ot
her
Pop
ulat
ions
. S
ee T
able
1 c
apti
on f
or k
ey to
sy
mbo
ls a
nd a
bbre
viat
ions
.
Sam
ple
N
K
S
h ±
sd
π ±
sd
θπ ±
sd
θs ±
sd
θ
k (9
5% C
I)
D
FS
NW
Ba
squ
es
53
32
45
0.95
8 ±
0.0
15
0.00
8 ±
0.0
04
3.87
± 2
.19
9.92
± 3
.04
33
.2 (
19.4
– 5
7.3)
–2
.16
–25.
92
BG
Bas
que
55
31
46
0.95
6 ±
0.0
15
0.01
0 ±
0.0
05
5.07
± 2
.77
10.0
5 ±
3.05
28.6
(16
.9 –
48.
6)
–1.8
3 –2
0.22
G
erm
any
99
69
74
0.97
7 ±
0.0
09
0.01
1 ±
0.0
06
5.37
± 2
.89
14.3
2 ±
3.80
99.7
(65
.6 –
153
.1)
–2.1
4 –2
5.52
Fre
nch
50
44
66
0.99
0 ±
0.0
08
0.01
2 ±
0.0
07
6.03
± 3
.24
14.7
3 ±
4.39
171.
9 (8
2.7
– 38
3.7)
–2
.20
–25.
40
Por
tuga
l 24
1 16
8 12
6 0.
977
± 0
.006
0.
014
± 0
.007
6.
68 ±
3.5
0 20
.63
± 4.
63
24
4.7
(185
.9 –
323
.8)
–2.1
9 –2
4.81
Ic
elan
d 33
8 13
1 96
0.
981
± 0
.003
0.
014
± 0
.007
6.
72 ±
3.5
2 14
.53
± 3.
21
78
.0 (
61.8
– 9
8.2)
–1
.74
–24.
62
Bal
kans
24
3 15
4 11
9 0.
989
± 0
.003
0.
014
± 0
.007
6.
80 ±
3.5
6 19
.45
± 4.
38
17
9.7
(137
.9 –
235
.0)
–2.1
1 –2
4.77
B
ritis
h 10
0 87
93
0.
994
± 0
.003
0.
014
± 0
.008
6.
99 ±
3.6
7 17
.96
± 4.
67
31
5.9
(186
.3 –
557
.9)
–2.1
4 –2
5.10
S
pain
29
4 20
7 14
2 0.
985
± 0
.004
0.
014
± 0
.008
7.
05 ±
3.6
7 22
.05
± 4.
79
30
9.9
(241
.1 –
400
.3)
–2.1
8 –2
4.61
Tus
cany
49
47
75
0.
998
± 0
.005
0.
017
± 0
.009
8.
09 ±
4.2
4 16
.82
± 4.
99
55
5.9
(192
.6 –
183
2.1)
–2
.01
–25.
02
Geo
rgia
ns
47
42
63
0.99
5 ±
0.0
05
0.01
7 ±
0.0
09
8.33
± 4
.36
14.0
4 ±
4.25
185.
8 (8
5.1
– 44
0.2)
–1
.67
–25.
00
Ang
ola
44
36
72
0.98
9 ±
0.0
08
0.03
3 ±
0.0
16
15.8
2 ±
7.99
16
.55
± 5.
01
90
.2 (
45.6
– 1
87.4
) –0
.70*
–16.
17
* no
t sig
nifi
cant
ly d
iffe
rent
fro
m z
ero

49
Figure 1. Map of Basque regions of Europe and major Basque settlements of the
Western United States.
The Basque regions of Europe (A), and important cities of Basque settlement in the
Western United States (B), based on the presence of Basque Centers (those registered
with NABO, the North American Basque Organizations). Boise, Idaho, is indicated with
an asterisk. The three provinces of Bizkaia, Gipuzkoa, and Araba (Vizcaya, Guipúzcoa,
and Álava in Spanish), together make up the autonomous Spanish Basque Region. The
French Basque region, opposite the French-Spanish border (dotted line), is in the
department Pyrénées-Atlantiques. The majority of original Basque settlers into SW
Idaho were from the region in Bizkaia approximately encircled by the cities of Gernika,
Lekeitio, and Ondarroa.

50

51
Figure 2. NW Basque Polymorphic sites for HVS-1.
Top row: rCRS. Numbers refer to position of nucleotide in rCRS. Rows refer to
haplotypes seen in the NW Basque samples. Dot indicates identity with rCRS. N =
number of individuals sharing each haplotype. Last column: inferred haplogroup
membership using Behar’s NJ method (Behar et al. 2007).
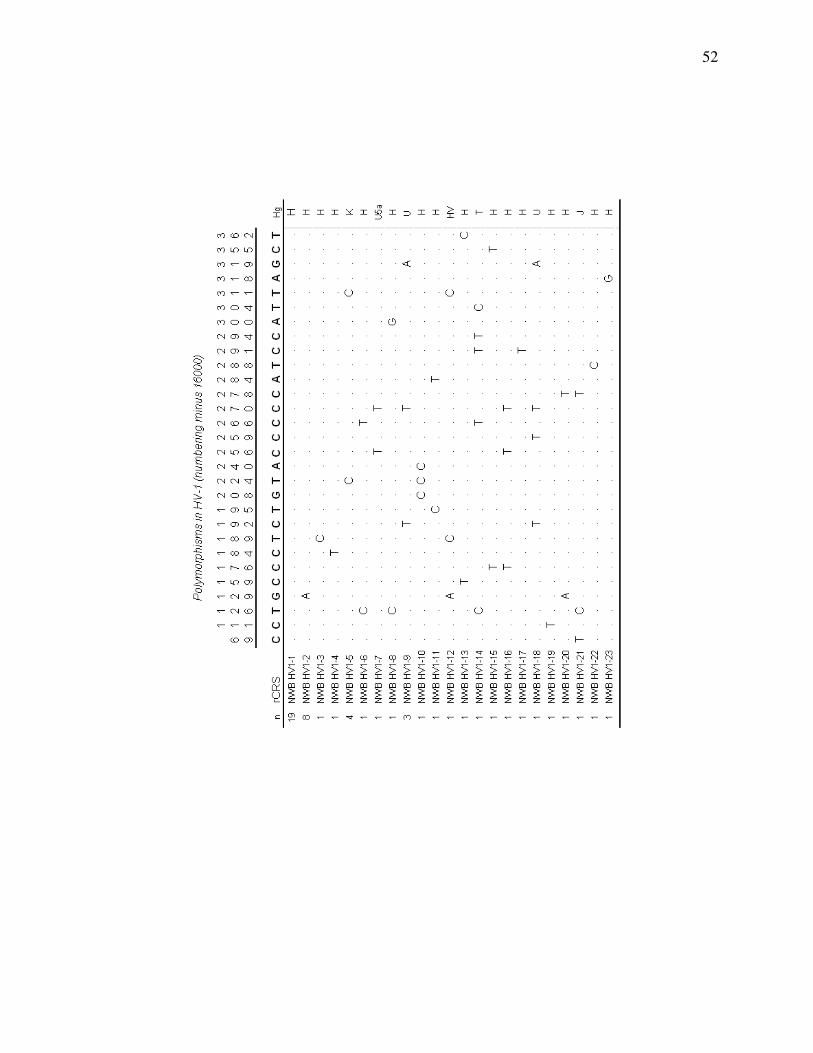
52

53
Figure 3. NW Basque Polymorphic sites for HVS-1 and HVS-2.
See legend for Figure 2. Number of individuals with matching haplotypes show for
(1) the BG Basque (Alfonso-Sanchez et al. 2008)and (2) the European mtDNA database
(Bush et al. 2009; Parson and Dür 2007).
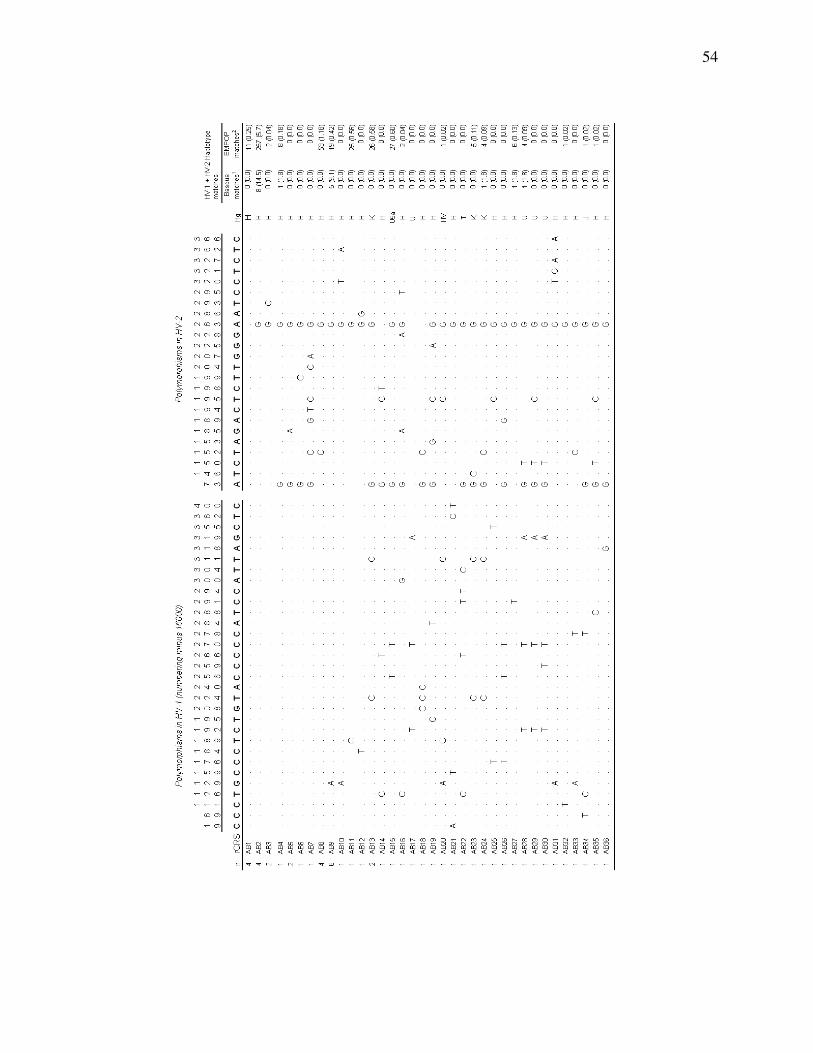
54

55
Figure 4. Pairwise mismatch distributions for HVS-1 and combined control region.
Mismatch distributions of Basque populations based on HVS-1 data (A), and
combined HVS-1 and HVS-2 data (B). Population data are for: NW Basque (this study),
G Basque (Gipuzkoan Basques, Bertranpetit et al. [1995]), BA Basque (Bizkaian and
Alavan Basques, Corte-Real et al. [1996]), BG Basque (Bizkaian and Gipuzkoan
Basques, Alfonso-Sanchez et al. [2008]).
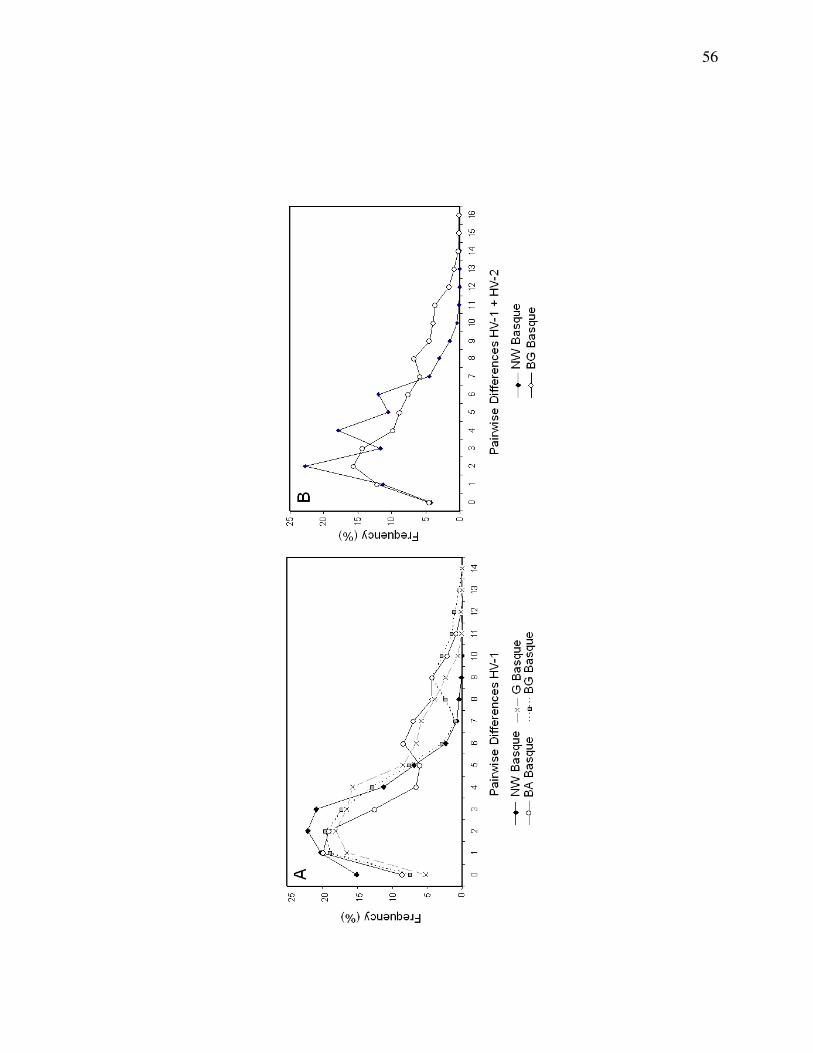
56

57
Figure 5. mtDNA haplogroup distributions in Basque and Iberian populations.
For the major European mtDNA haplogroups, in addition to others of low frequency
(OTH), the relative frequency for each population is given. See Subjects and Methods
section for sources of published data for each population.

58

59
Figure 6. Median-joining network of HVS-1 haplotypes.
Haplotype network with speedy sites ignored (see Subjects and Methods section for
details). Node size is proportional to frequency of haplotypes, the smallest nodes
represent haplotypes carried by one individual. Edges connecting the circles represent
single nucleotide mutational steps. Lineages from different Basque regions are colored
according to the key. The rCRS haplotype is indicated by an asterisk (*).

60

61
Figure 7. Median-joining network of HVS-1 plus HVS-2 (control region) haplotypes.
See legend for Figure 6.
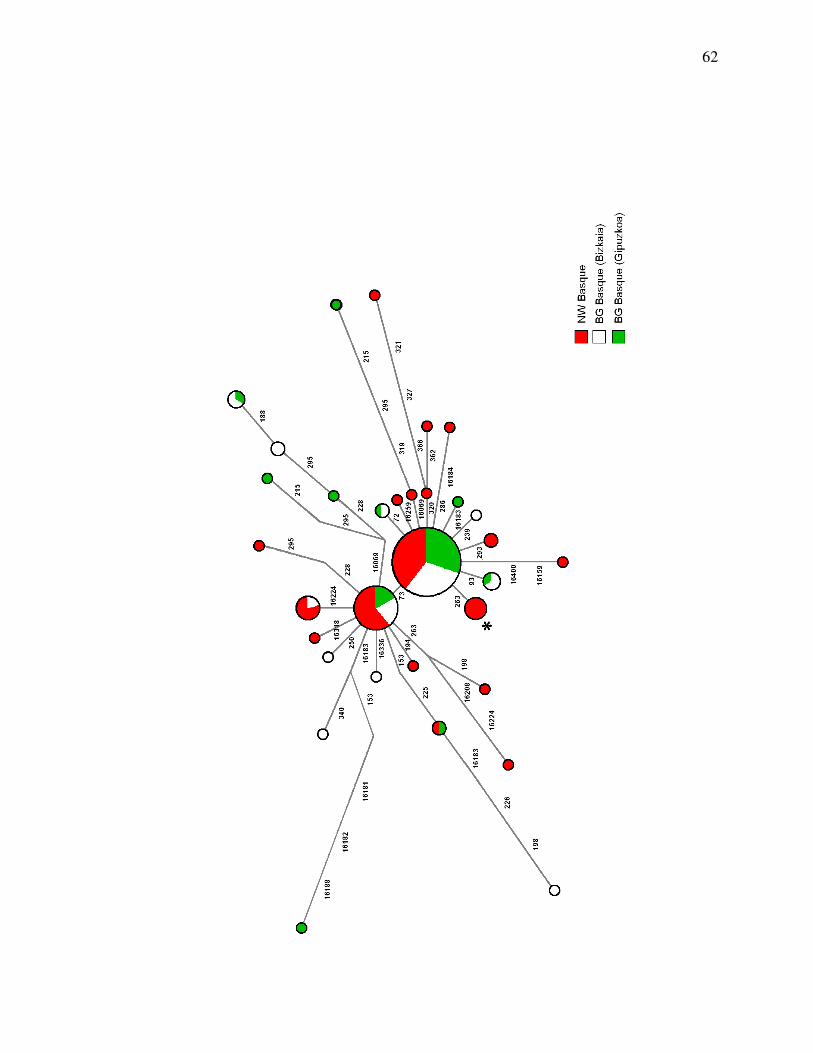
62
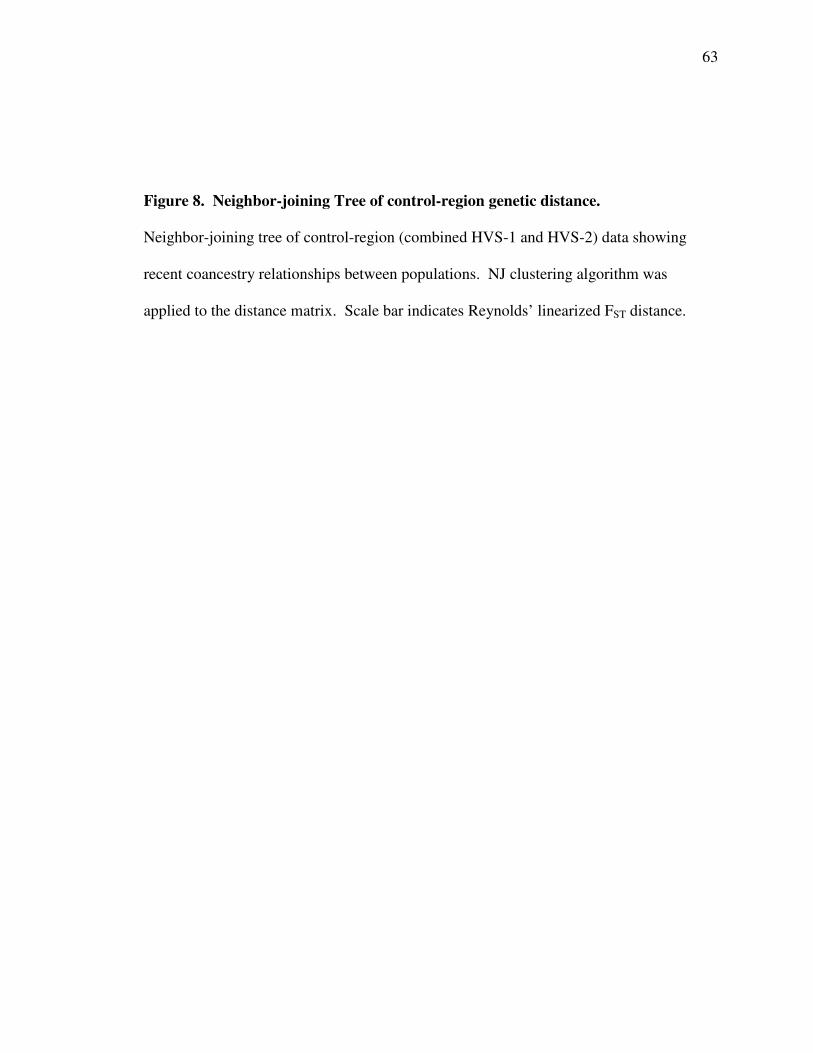
63
Figure 8. Neighbor-joining Tree of control-region genetic distance.
Neighbor-joining tree of control-region (combined HVS-1 and HVS-2) data showing
recent coancestry relationships between populations. NJ clustering algorithm was
applied to the distance matrix. Scale bar indicates Reynolds’ linearized FST distance.

64

65
Figure 9. Principal components analysis (PCA) of European and European-derived
populations based on haplogroup distribution.
PCA based on frequencies of major European haplogroups. Abbreviations of American
populations are shown in boxes. Basque populations are indicated by fillled (NW
Basque) or open (French and Spanish Basque) squares. Native European populations are
indicated by open circles, and immigrant populations are indicated with filled circles.
Percentage variation accounted for by each PC is shown. Population abbreviations:
AMH: Amish. ACD: Acadian (Gaspe). NWB: NW Basque. CAT: Catalonian. IBZ:
Ibiza Islanders. SWD: Swedish. GSP: All Gaspesians. CHL: Channel Islanders
(Gaspe). FRA: French. POR: Portuguese. RUS: Russians. AUS: Austrians. GER:
Germans. BRZ: Brazilians. AZR: Azores Islanders. NSP: Northern Spanish (non-
Basque). CUB: Cubans. ENG: English. ARG: Caucasian Argentinians. FRB: French
Basque. BGB: Spanish (Bizkaia, Gipuzkoa) Basque. HSP: North American Hispanics.
PRC: Puerto Ricans.

66

67
APPENDIX
The Questionnaire Distributed to Study Volunteers to Determine Mode of Basque
Ancestry

68
Idaho DNA Study Survey
Swab Collection Data: For Research Purposes Only
A random number will be associated with your sample.
No Identifying Information will be published.
For this research project, we are requesting demographic information. Due to the make-up of Idaho’s population, the combined answers to these questions may make an individual person identifiable. We will make every effort to protect participants’ confidentiality. However, if you are uncomfortable answering any of these questions, you may leave them blank. 1. Sex: Male Female 2. Age: 3. Your self-identified Ethnic Background: African-American Asian Caucasian Hispanic Native American Basque Other __________________________ 4. Your place of Birth (POB): United States � City, State
____________________________________________________________
Other � Country ______________________
How long have you lived in Idaho? ______________________________
5. Your Mother’s POB: City, U.S. State or Country __________________________________________________________________
6. Her Mother’s POB: City, U.S. State or Country __________________________________________________________________
7. Her Father’s POB: City, U.S. State or Country ____________________________________________________________

69
8. Your Father’s POB: City, U.S. State or Country
_________________________________________________________________ 9. His Mother’s POB: City, U.S. State or Country _________________________________________________________________ 10. His Father’s POB: City, U.S. State or Country _________________________________________________________________ If Basque:
11. Mother’s Maiden name:___________________ 12. Mother’s Mother’s Maiden name: ____________________________________________ 13. Father’s surname: ________________________ 14. Father’s father’s surname: _________________ Any other Basque surnames in family? ________________________________ By answering and returning this questionnaire, as well as providing a cheek swab, you consent to have the information you provide used for research purposes only, with the understanding that you may contact the researchers at Boise State University and withdraw from the study at any time. No identifying information will be published, and the information collected will be stored in a secure location, and will only be accessed by researchers for the purposes of this study. I am 18 yrs old or older, and I give consent that my questionnaire and cheek swab
(DNA) be used for research purposes.
Signature _______________________________________________________________
Date ______________________________