economic forecasting for the surat basin and sme responses · economic forecasting for the surat...
TRANSCRIPT
Economic forecasting for the Surat Basin and SME responses
LAND AND WATER
Research Team: Dr. Tom Measham | Dr. David Fleming| Dr. Andrea Walton
16 December 2016
Section 1:Economic forecastingFocus on projecting indirect employment
Economic forecasting for the Surat Basin and SME responses2 |
Forecasts indirect jobs 2014-2034
• Started with estimates for Direct jobs supplied by Energy Skills QLD
• Estimated indirect jobs based on previous GISERA research• Robust multipliers derived for the period 2006-2011 based on Census
• These are the most reliable estimates available because they are specific to CSG industry in QLD
• Numbers in Surat adjusted for FIFO-DIDO• A total of 10 plausible scenarios were selected, considering :• a) No changes to direct employment (Business as usual)• b) Reduced direct employment (Slow down)• c) Reduced multipliers for a) and b)
Economic forecasting for the Surat Basin and SME responses3 |
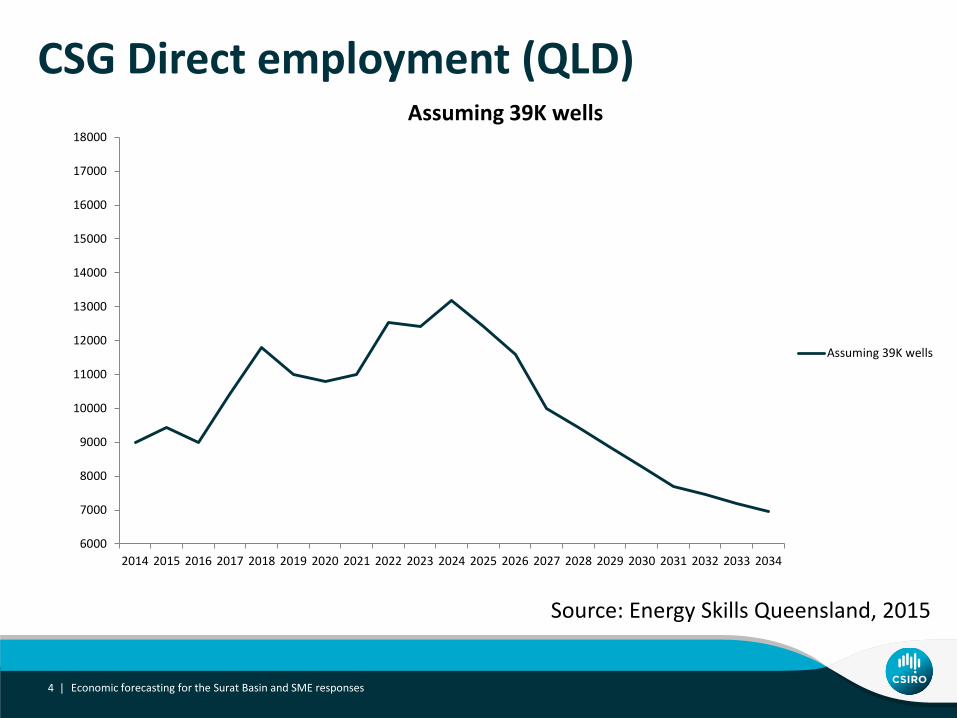
CSG Direct employment (QLD)
Economic forecasting for the Surat Basin and SME responses4 |
6000
7000
8000
9000
10000
11000
12000
13000
14000
15000
16000
17000
18000
2014 2015 2016 2017 2018 2019 2020 2021 2022 2023 2024 2025 2026 2027 2028 2029 2030 2031 2032 2033 2034
Assuming 39K wells
Assuming 39K wells
Source: Energy Skills Queensland, 2015
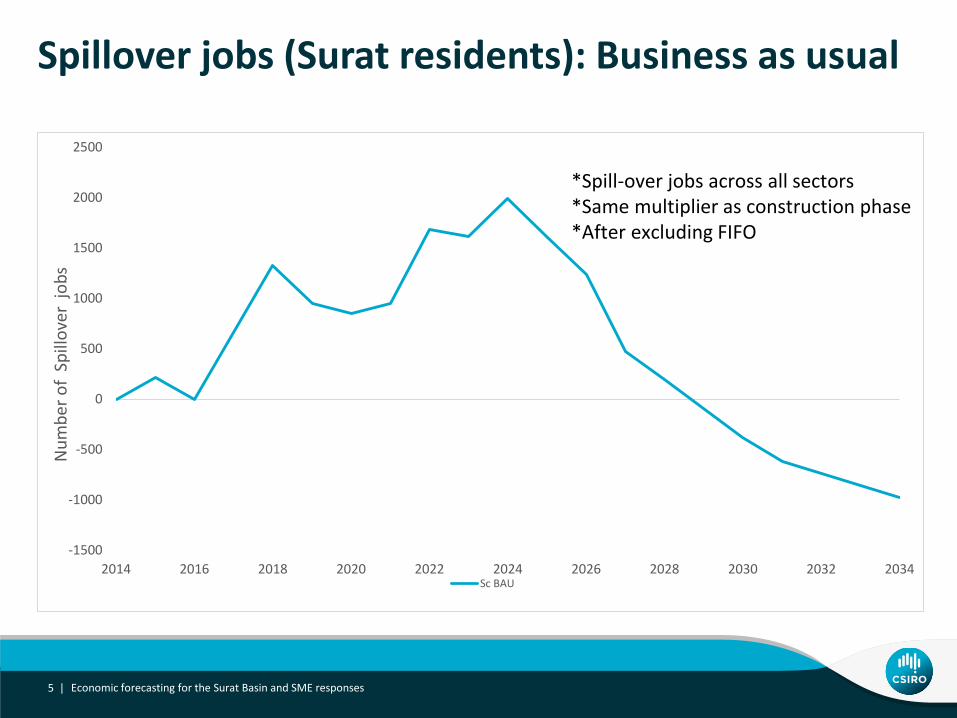
Spillover jobs (Surat residents): Business as usual
Economic forecasting for the Surat Basin and SME responses5 |
-1500
-1000
-500
0
500
1000
1500
2000
2500
2014 2016 2018 2020 2022 2024 2026 2028 2030 2032 2034
Num
ber o
f Sp
illov
erjo
bs
Sc BAU
*Spill-over jobs across all sectors*Same multiplier as construction phase*After excluding FIFO
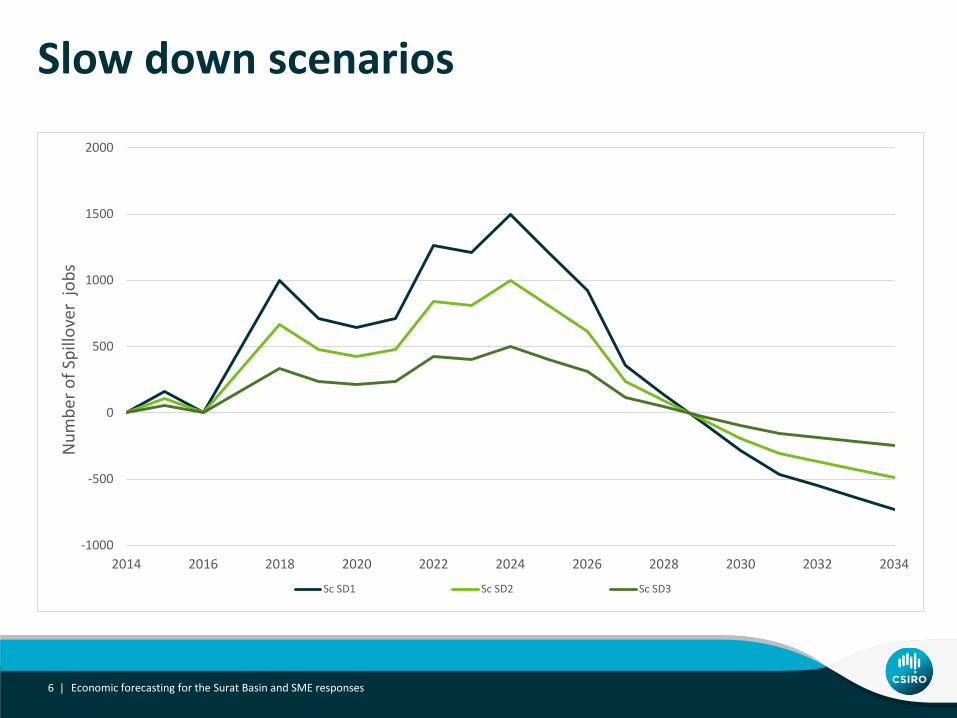
Slow down scenarios
Economic forecasting for the Surat Basin and SME responses6 |
-1000
-500
0
500
1000
1500
2000
2014 2016 2018 2020 2022 2024 2026 2028 2030 2032 2034
Num
ber o
f Spi
llove
rjo
bs
Sc SD1 Sc SD2 Sc SD3
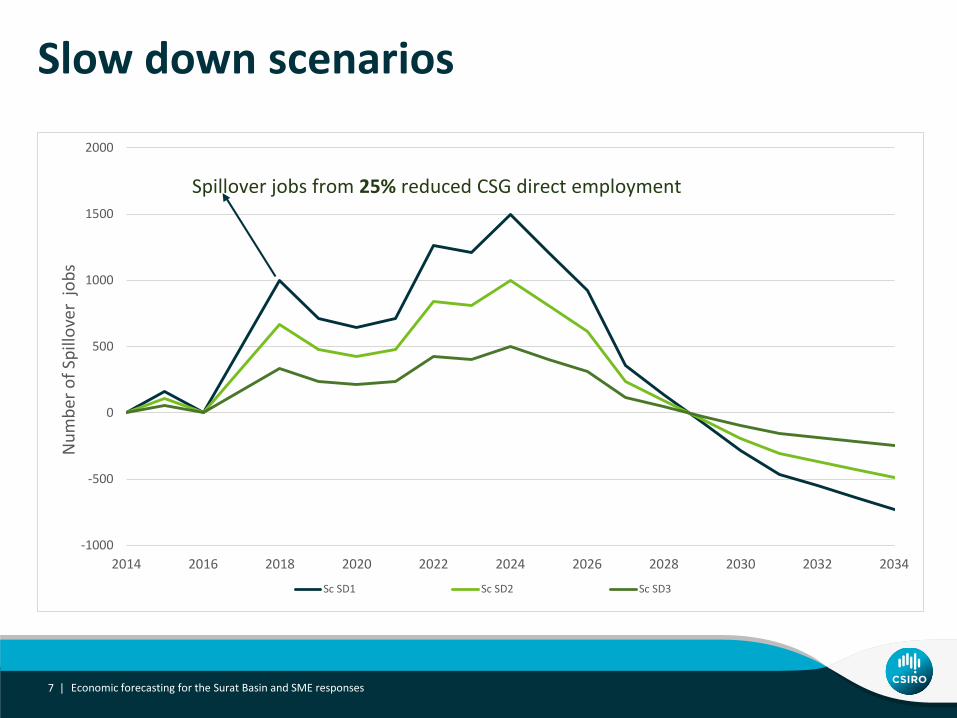
Slow down scenarios
Economic forecasting for the Surat Basin and SME responses7 |
-1000
-500
0
500
1000
1500
2000
2014 2016 2018 2020 2022 2024 2026 2028 2030 2032 2034
Num
ber o
f Spi
llove
rjo
bs
Sc SD1 Sc SD2 Sc SD3
Spillover jobs from 25% reduced CSG direct employment

Slow down scenarios
Economic forecasting for the Surat Basin and SME responses8 |
-1000
-500
0
500
1000
1500
2000
2014 2016 2018 2020 2022 2024 2026 2028 2030 2032 2034
Num
ber o
f Spi
llove
rjo
bs
Sc SD1 Sc SD2 Sc SD3
Spillover jobs from 50% reduced CSG direct employment
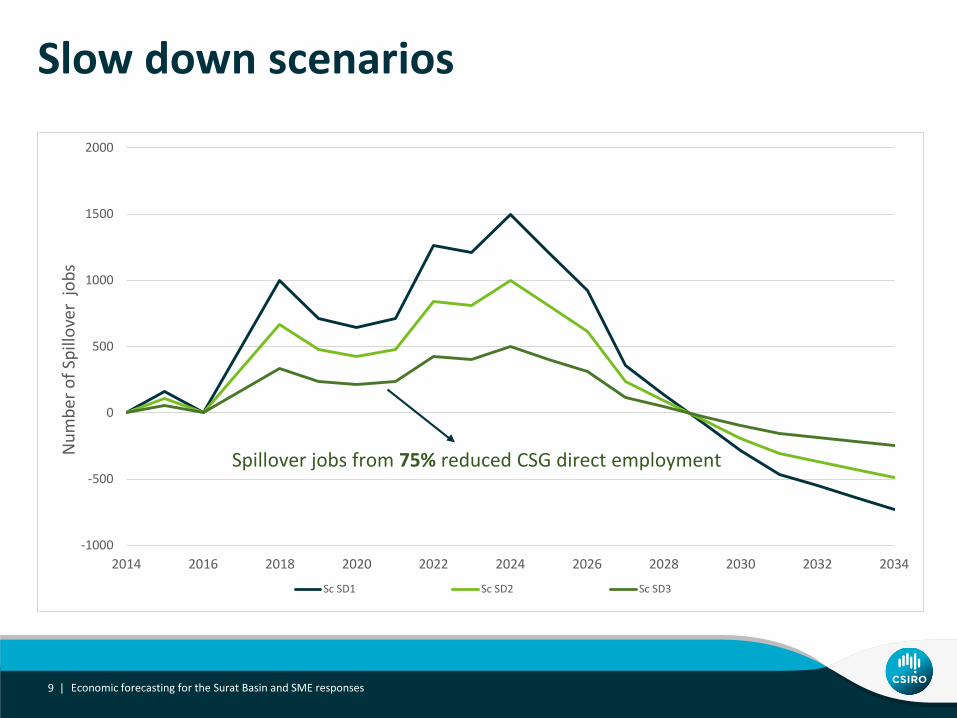
Slow down scenarios
Economic forecasting for the Surat Basin and SME responses9 |
-1000
-500
0
500
1000
1500
2000
2014 2016 2018 2020 2022 2024 2026 2028 2030 2032 2034
Num
ber o
f Spi
llove
rjo
bs
Sc SD1 Sc SD2 Sc SD3
Spillover jobs from 75% reduced CSG direct employment
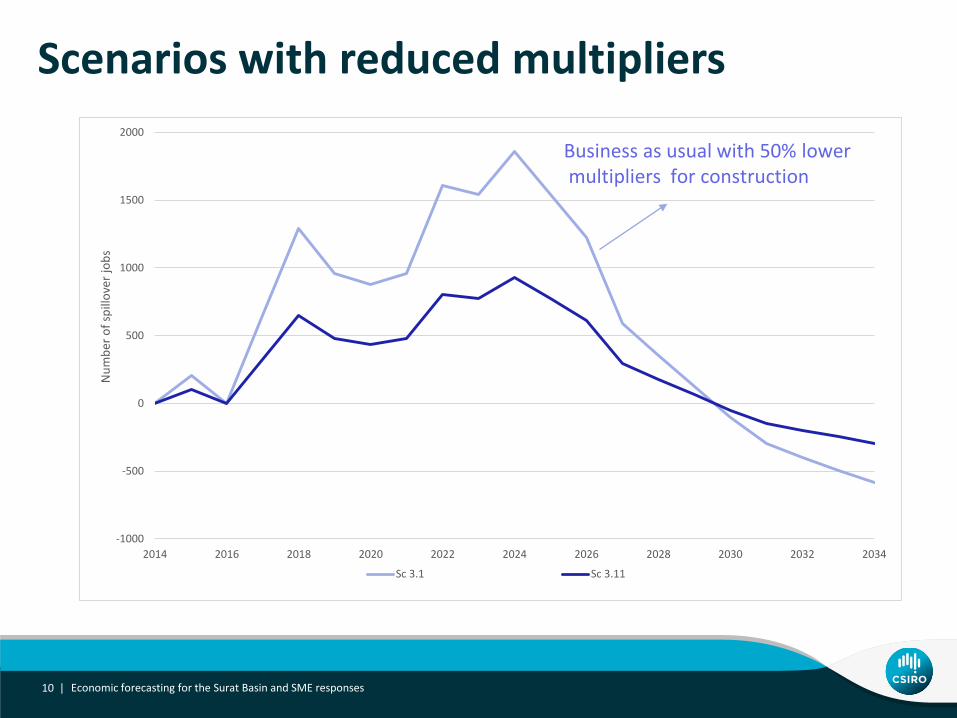
Scenarios with reduced multipliers
Economic forecasting for the Surat Basin and SME responses10 |
-1000
-500
0
500
1000
1500
2000
2014 2016 2018 2020 2022 2024 2026 2028 2030 2032 2034
Num
ber o
f spi
llove
rjob
s
Sc 3.1 Sc 3.11
Business as usual with 50% lowermultipliers for construction
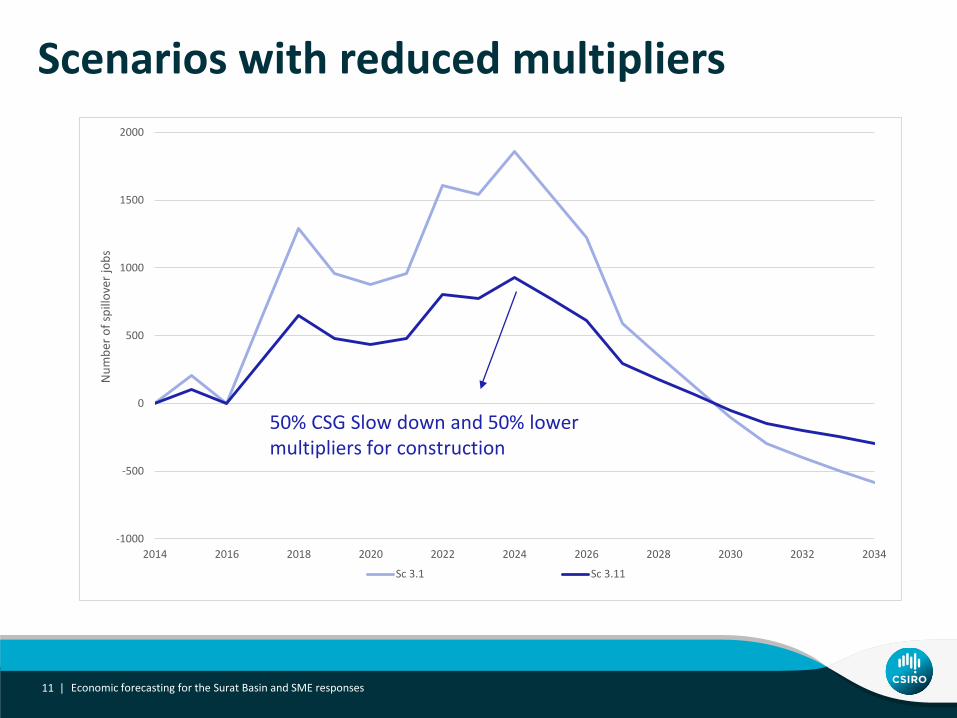
Scenarios with reduced multipliers
Economic forecasting for the Surat Basin and SME responses11 |
-1000
-500
0
500
1000
1500
2000
2014 2016 2018 2020 2022 2024 2026 2028 2030 2032 2034
Num
ber o
f spi
llove
rjob
s
Sc 3.1 Sc 3.11
50% CSG Slow down and 50% lower multipliers for construction
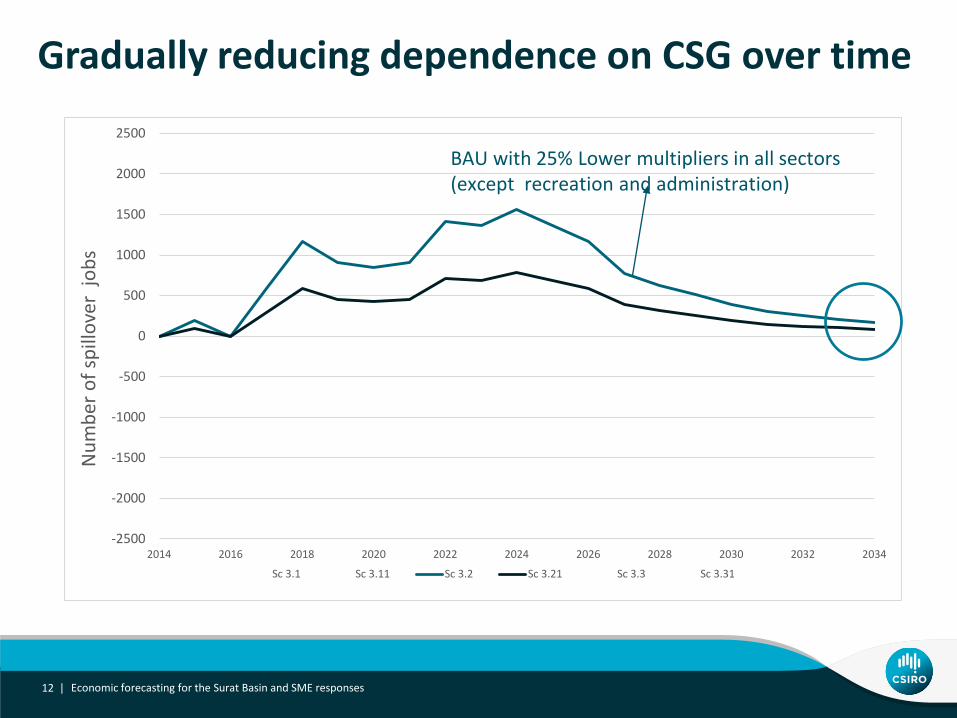
Gradually reducing dependence on CSG over time
Economic forecasting for the Surat Basin and SME responses12 |
-2500
-2000
-1500
-1000
-500
0
500
1000
1500
2000
2500
2014 2016 2018 2020 2022 2024 2026 2028 2030 2032 2034
Num
ber o
f spi
llove
rjo
bs
Sc 3.1 Sc 3.11 Sc 3.2 Sc 3.21 Sc 3.3 Sc 3.31
BAU with 25% Lower multipliers in all sectors (except recreation and administration)
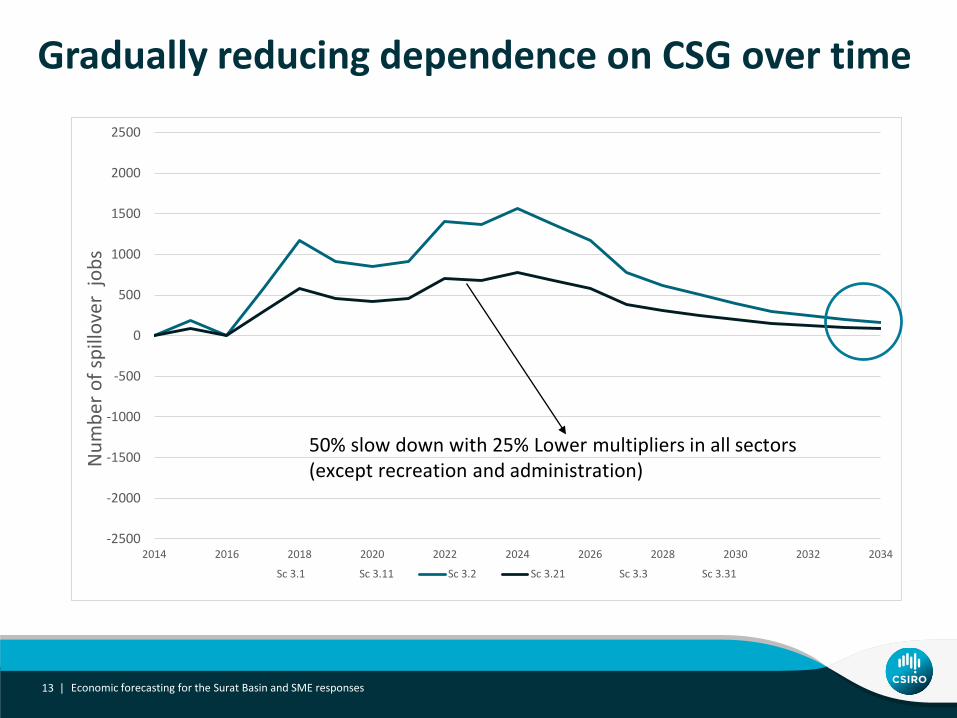
Gradually reducing dependence on CSG over time
Economic forecasting for the Surat Basin and SME responses13 |
-2500
-2000
-1500
-1000
-500
0
500
1000
1500
2000
2500
2014 2016 2018 2020 2022 2024 2026 2028 2030 2032 2034
Num
ber o
f spi
llove
rjo
bs
Sc 3.1 Sc 3.11 Sc 3.2 Sc 3.21 Sc 3.3 Sc 3.31
50% slow down with 25% Lower multipliers in all sectors(except recreation and administration)
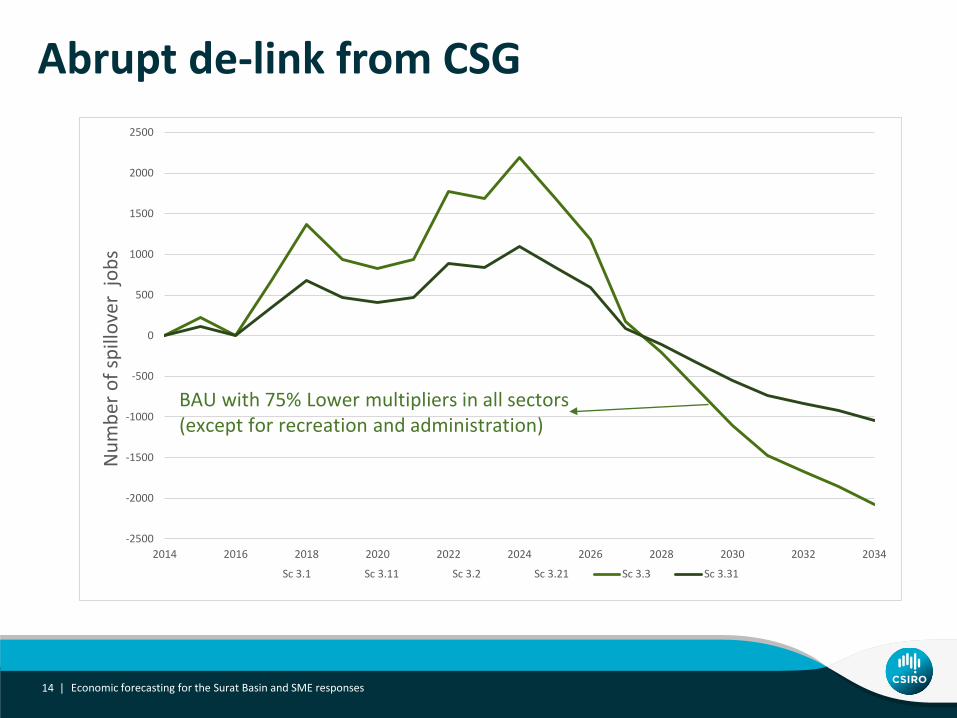
Abrupt de-link from CSG
Economic forecasting for the Surat Basin and SME responses14 |
-2500
-2000
-1500
-1000
-500
0
500
1000
1500
2000
2500
2014 2016 2018 2020 2022 2024 2026 2028 2030 2032 2034
Num
ber o
f spi
llove
rjo
bs
Sc 3.1 Sc 3.11 Sc 3.2 Sc 3.21 Sc 3.3 Sc 3.31
BAU with 75% Lower multipliers in all sectors(except for recreation and administration)
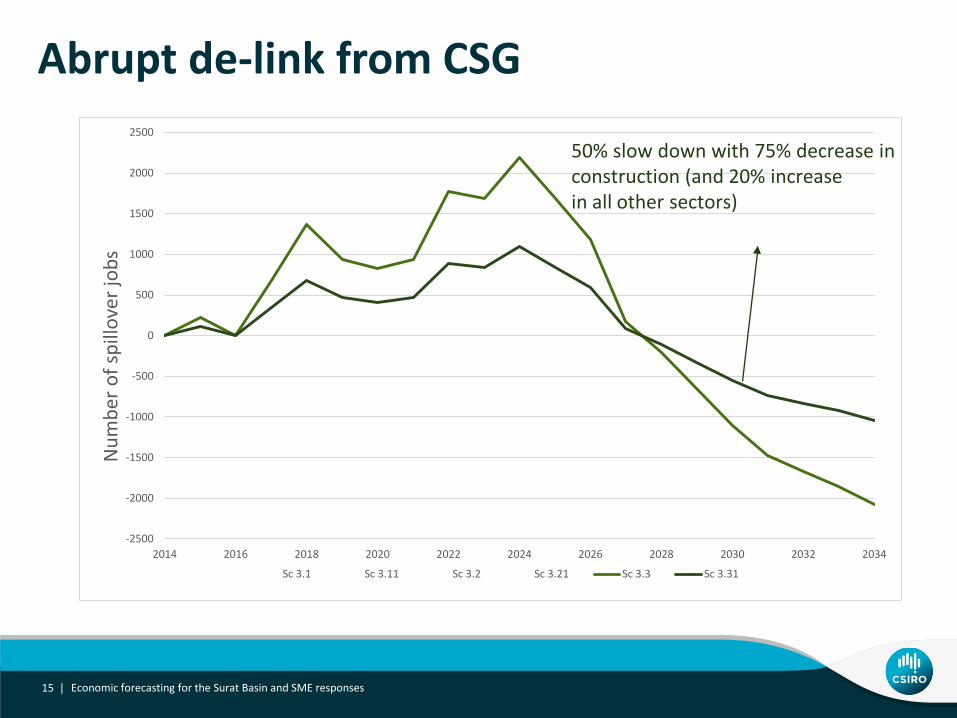
Abrupt de-link from CSG
Economic forecasting for the Surat Basin and SME responses15 |
-2500
-2000
-1500
-1000
-500
0
500
1000
1500
2000
2500
2014 2016 2018 2020 2022 2024 2026 2028 2030 2032 2034
Num
ber o
f spi
llove
rjob
s
Sc 3.1 Sc 3.11 Sc 3.2 Sc 3.21 Sc 3.3 Sc 3.31
50% slow down with 75% decrease inconstruction (and 20% increase in all other sectors)

All scenarios alongside
Economic forecasting for the Surat Basin and SME responses16 |
-2500
-2000
-1500
-1000
-500
0
500
1000
1500
2000
2500
2014 2016 2018 2020 2022 2024 2026 2028 2030 2032 2034
Num
ber o
f spi
llove
rjob
s
Sc BAU Sc SD1 Sc SD2 Sc SD3 Sc 3.1
Sc 3.11 Sc 3.2 Sc 3.21 Sc 3.3 Sc 3.31
Becoming less dependent on CSG sector over time is forecast to result in reduced job losses in other sectors in the future
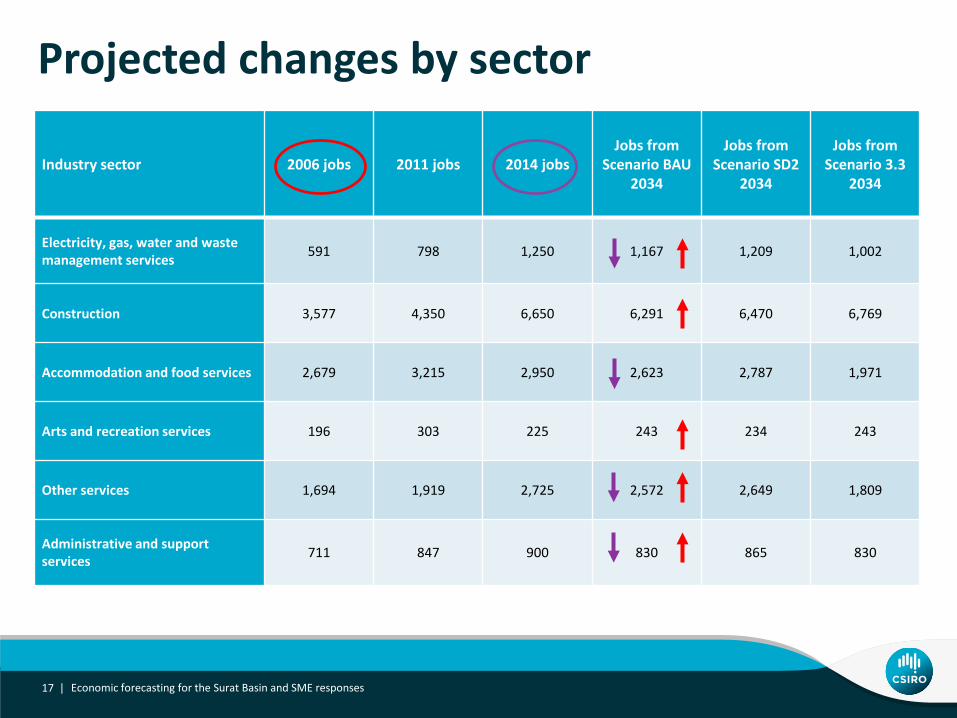
Projected changes by sector
Economic forecasting for the Surat Basin and SME responses17 |
Industry sector 2006 jobs 2011 jobs 2014 jobsJobs from
Scenario BAU 2034
Jobs from Scenario SD2
2034
Jobs from Scenario 3.3
2034
Electricity, gas, water and waste management services 591 798 1,250 1,167 1,209 1,002
Construction 3,577 4,350 6,650 6,291 6,470 6,769
Accommodation and food services 2,679 3,215 2,950 2,623 2,787 1,971
Arts and recreation services 196 303 225 243 234 243
Other services 1,694 1,919 2,725 2,572 2,649 1,809
Administrative and support services 711 847 900 830 865 830
Observations
• Direct industry jobs are forecast to rise and fall• For indirect jobs (spillovers): • Some sectors are more strongly linked to the CSG industry than others• Therefore some sectors are more affected by change in CSG than others
• Most scenarios have:• a general upward trend from 2014 to 2024• a general downward trend from 2024 to 2034
Economic forecasting for the Surat Basin and SME responses18 |
Section 2:Implications for local businesses
Based on interviews with small to medium enterprises
Economic forecasting for the Surat Basin and SME responses19 |

10 Lesson Learned
1. Look after core customers
- throughout the busy times
2. Be diversified• Think carefully about putting
all your eggs in one basket. • Keep a broad base of
customers. • Look for new markets with any
new capacity developed
20 Economic forecasting for the Surat Basin and SME responses
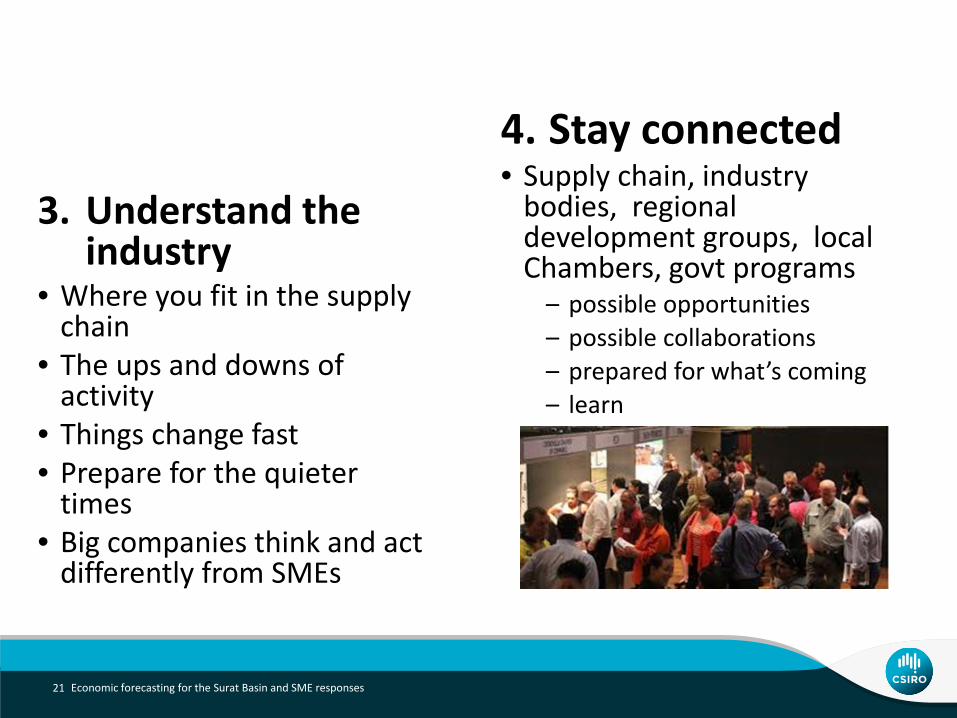
3. Understand the industry
• Where you fit in the supply chain
• The ups and downs of activity
• Things change fast• Prepare for the quieter
times• Big companies think and act
differently from SMEs
4. Stay connected• Supply chain, industry
bodies, regional development groups, local Chambers, govt programs
– possible opportunities– possible collaborations– prepared for what’s coming– learn
21 Economic forecasting for the Surat Basin and SME responses
5. Keep a close eye on your business
• Manage your costs for project type work,
• Understand your contracts,• Beware of possible risks
– Bed debts during slow downs– External economic factors
6. Be careful not to overcapitalise
7. Seek business advice early
• Outside advisor, business mentor, accountant
• Tough decisions may be needed• You may not want to know what
you're hearing
8. Seek out reliable information
• Be wary of spin
22 Economic forecasting for the Surat Basin and SME responses
9. Personal considerations
• How involved do you want to be?
• Boom times and quieter times can be stressful.
• Consider exiting when you can
10.Take opportunities to learn and grow with the CSG industry
• Position yourself for the next increase in economic activity
23 Economic forecasting for the Surat Basin and SME responses
What could have helped
• Smoother transition into operations• Some signals as to when construction finishes• As much local content in operations as
possible• Clarify the IT systems and platforms• Not putting wasted investment into
compliance training• Don’t overstate benefits: accurate
information is most useful• Correction misinformation wherever possible• Steps to avoid a housing bubble
24 Economic forecasting for the Surat Basin and SME responses
Conclusion
• Forecasting economics is like forecasting the weather• Forecasts are projections based on best available info (not predictions)
• The research considered a range of plausible scenarios• In 2034, most scenarios indicate:• lower indirect jobs compared to 2014• higher indirect jobs compared with 2006
• Oscillating periods of increase and decrease are likely• Lessons learned from the construction phase are highly relevant
for local businesses during the operations phase
Economic forecasting for the Surat Basin and SME responses25 |

LAND AND WATERDr. Andrea Waltone [email protected]
LAND AND WATERDr. Tom Meashame [email protected]
CSIRO MINERAL RESOURCES