ecological importance of mineral licks in the tuchodi watershed, north-central british columbia
TRANSCRIPT

ECOLOGICAL IMPORTANCE OF MINERAL LICKS IN THE TUCHODI WATERSHED, NORTH-CENTRAL BRITISH
COLUMBIA
Katherine L. Parker and Jeremy B. Ayotte Natural Resources and Environmental Studies
University of Northern British Columbia Prince George, British Columbia V2N 4Z9
MK-2001-2002-77, MK-2002-2003-09, MK-2003-2004-12
Prepared for: Muskwa-Kechika Advisory Board
Muskwa-Kechika Trust Fund
July 2004
J. Ayotte

Muskwa-Kechika Licks
2
TABLE OF CONTENTS: EXECUTIVE SUMMARY ......................................................................................................... 3
INTRODUCTION....................................................................................................................... 4
PROJECT OBJECTIVES............................................................................................................ 6
STUDY AREA............................................................................................................................ 7
ACTIVITIES/TECHNIQUES/FINDINGS: ................................................................................ 9
Behavioural Observations of Animal Use................................................................................ 9
Wet Licks:............................................................................................................................ 11
Dry Licks ............................................................................................................................. 14
Data from Remote Cameras at Dry Licks .............................................................................. 18
Soil Samples at Licks ............................................................................................................. 23
Forage Samples / Ungulate Diets ........................................................................................... 31
Interactions between Animals Using Licks and Human Use of the Area.............................. 36
CONCLUSIONS ....................................................................................................................... 37
Recommendations for Future Research ................................................................................. 38
ACKNOWLEDGEMENTS....................................................................................................... 40
LITERATURE CITED.............................................................................................................. 41
Muskwa-Kechika Licks
3
EXECUTIVE SUMMARY Mineral licks are site-specific, special habitat features that may be critical to maintaining
the health of ungulate populations in the Muskwa-Kechika Management Area (MKMA). Licks can be used to compensate for mineral deficiencies or imbalances, and potentially to decrease the influence of digestive disorders and toxic plant compounds. Ecological implications are that licks influence population densities and structures. Given that mineral licks are small, localized niches, but nonetheless critical in the life histories of elk (Cervus elaphus), moose (Alces alces), Stone’s sheep (Ovis dalli stonei), and mountain goats (Oreamnos americanus), it is important to determine when and why these particular niches are needed. In addition to biophysical mapping and wildlife surveys, the value of site-specific wildlife features should be quantified if effective mapping of habitat capability is to occur. Given that licks, wintering areas, and calving areas are likely the most important limiting habitat factors in the health and survival of ungulates in the MKMA (and that most research efforts have been directed towards the latter two factors), quantifying the temporal use of licks is important to the overall goal of conserving wildlife habitats.
Our research compared seasonal patterns of lick use with the composition of lick soils and forage to assess the importance of licks to four ungulate species. Behavioural observations of elk, moose, Stone’s sheep, and mountain goats were conducted at two wet licks and three dry licks in the Tuchodi watershed, north-central British Columbia. We used three indices of lick use (numbers of animals at the lick, lengths of visits, and time spent licking per visit) to estimate peak periods of licking activity. Soils sampled at each lick were analyzed for buffering capacity and extracted with solutions at low pH, characteristic of the ungulate digestive tract, to quantify elements that are potentially available to animals. The elemental composition of forage samples also was determined to estimate dietary intake of elements.
Male and female elk showed high use of wet licks in late May following green-up of vegetation at low elevations. Numbers of female elk at licks were also high in late June, coinciding with high lactation demands. Lick activity by moose was similar between sexes, but peaked later in mid-July, potentially influenced by other properties of forage such as plant defense compounds. The timing of use at the dry licks by Stone’s sheep and mountain goats was variable with two periods of high use common to both species: early July (possibly related to forage change) and early August (potentially related to lactation demands). Elk spent a higher proportion of time licking during visits to wet licks than moose, and at dry licks, mountain goats spent more time licking than Stone’s sheep.
Soils at both wet and dry licks contained higher carbonate levels than control sites, suggesting that lick soils may be used to help neutralize the pH of the rumen to minimize digestive disorders associated with spring forage change. Sodium was higher than control sites in all dry lick soils, and in some soil and water samples from wet licks. Because dietary sodium levels from forage analyses were below nutritional requirements, intake of sodium at licks may help meet demands. Magnesium was high in inflow water at wet licks and in soil at dry licks. Magnesium in lick soils could supplement diets when elemental content of the forage appears to just meet requirements and when high concentrations of potassium in spring forage reduce the absorption of magnesium by the animal. Our data indicate that licks have multiple functions across species and types of licks. This research comprised the majority of Jeremy Ayotte’s Master of Science thesis at the University of Northern British Columbia (Ayotte 2004).

Muskwa-Kechika Licks
4
INTRODUCTION Licks are used by all North American ungulate species (Jones and Hanson 1985). Licks
may occur in areas where concentrations of solutes tend to collect: near groundwater springs, around roots of trees, or on bluffs bordering streams (Jones and Hanson 1985). In the Tuchodi Lakes study area in north-central British Columbia (BC), there are two visually distinct types of licks: wet and dry. Wet licks are usually associated with groundwater springs and develop into muddy clearings used mainly by elk (Cervus elaphus) and moose (Alces alces; Williams 1962, Knight and Mudge 1967, Chamberlain et al. 1977, Fraser and Hristienko 1981) (Fig. 1). Dry licks can be found above valley bottoms on steep rocky banks alongside riverbeds, and are used mainly by Stone’s sheep (Ovis dalli stonei) and mountain goats (Oreamnos americanus; Hebert and Cowan 1971, Heimer 1973, Singer 1978, Watts and Schemnitz 1985) (Fig. 2). Licks are thought to have a profound impact on the distributions and movements of individuals within populations (Heimer 1973, Watts and Schemnitz 1985). In order to incorporate these small habitat features into landscape-level management plans, attempts should be made to estimate when and why ungulate species use them.
This study focuses on the use of licks by four ungulate species (elk, moose, Stone’s sheep, mountain goats). These species, with a ruminant digestive system, are able to survive on low-quality, high-fiber plants associated with long north-temperate winters. The transition from a reduced metabolic state on a diet of low quality winter forage, to increased physiological demands of lactation, growth, and/or weight regain in spring/early summer, must be efficient to take advantage of the short period of lush spring growth. Potential physiological constraints during this transition period involve the chemical properties of spring forage that reduce the digestive efficiency of the rumen and impair the absorption and retention of elements. Therefore, ruminants may use licks not only as sources of inorganic supplements deficient in the diet, but also to mitigate against digestive disorders and elemental imbalances associated with the change from high-fiber winter forage to lush spring growth.
Several lick studies have concluded that the use of licks indicates a dietary deficiency of a particular element that exists in unusually high concentrations in lick material (Chamberlain et al. 1977, Klaus and Schmid 1998). There has been a long-held view that sodium is the element in lick material that both attracts and benefits ungulates (Stockstad 1950, Williams 1962, Knight and Mudge 1967). This point of view is based on the critical role of sodium in body fluid volume and osmolarity regulation (Hellgren and Pitts 1997), known seasonal sodium deficiencies in many forage plants (Staaland et al. 1980, Reisenhoover and Peterson 1986, Ohlson and Staaland 2001), and the strong attraction to sodium shown by several ungulate species in cafeteria-style selection experiments (Stockstad 1950, Williams 1962, Fraser and Hristienko 1981).
There are, however, equally viable physiological rationales for the importance of other elements such as magnesium (Heimer 1988) that broaden perspectives on the use of licks by ungulates. The supposition that the use of licks is attributable solely to sodium is refuted by results from numerous analyses of lick soils that have shown compositions of a variety of elements with no single element in high concentrations among licks even within the same area (Stockstad 1950, Williams 1962, Chamberlain et al. 1977, Dormaar and Walker 1996). Controlled manipulations of elemental intake by captive ungulates using appropriate response variables (e.g., weight gain, milk production) may determine the likelihood of these potential deficiencies, and subsequently, further define the physiological role of lick use.

Muskwa-Kechika Licks
5
Figure 1. Example of typical wet lick (Grizzly lick) in the Tuchodi watershed.
Figure 2. Example of typical dry lick (Standard lick) in the Tuchodi watershed.
K. Parker
J. Ayotte

Muskwa-Kechika Licks
6
Two sources of physiological stress associated with adapting to lush spring forage are: (1) extremely high potassium levels that may impair the retention of other elements, and (2) decreased fiber and increased readily fermentable carbohydrates and proteins causing intestinal acidosis that may reduce appetite and efficient rumen function (Kreulen 1985, Klaus and Schmid 1998). Early season vegetation contains high concentrations of potassium that elevate the osmotic pressure of the digestive tract, interfere with fecal water absorption, and lead to potentially harmful electrolyte losses (Weeks and Kirkpatrick 1976). Wet, unformed feces from ungulates in spring often result from a diet of succulent new growth, and may be responsible for loss of physiologically important elements such as sodium and magnesium (Hebert and Cowan 1971, Heimer 1988). To capitalize on the increase in readily fermentable carbohydrates and soluble proteins in spring forage, ruminants must adapt to this reduction in dietary fiber. A decrease in dietary fiber reduces the secretion of saliva that helps to buffer the rumen environment against pH fluctuations with sodium bicarbonate (Church 1975). Without the buffering role of saliva, the increase in acids from rapid fermentation of high protein and sugar levels in spring forage can cause various intestinal ailments such as acidosis, which reduces appetite and weight gain (Kreulen 1985, Klaus and Schmid 1998). Clays and carbonates ingested from lick soils may facilitate this transition to spring forage (Kreulen 1985, Klaus and Schmid 1998).
Therefore, licks may function as sources of: (1) nutritionally important elements that are deficient in forage plants, (2) nutritional elements that become deficient during the transition to spring forage change, (3) clays and carbonates to buffer against intestinal disorders associated with spring forage change, and/or (4) combinations of the above.
PROJECT OBJECTIVES The goals of this study were to use behavioural observations, remote photography, and
chemical analyses to define the wildlife use and properties of wet and dry licks. Specific objectives were: (1) To quantify seasonal attendance at licks by elk, moose, Stone’s sheep and moose (e.g., lick use may vary depending on timing of spring green-up); (2) To compare lick use between sexes (e.g., elemental demands may be highest during lactation); (3) To determine which chemical components are relatively abundant at licks (e.g., animals may be attracted to licks for chemical properties other than sodium); and (4) To compare lick use with chemical composition of lick soils and available forage, and with documented animal requirements (e.g., animals may use licks to meet requirements for specific elements that can not be met with forage alone).
We assumed that if periods of peak use at licks coincided with known periods of elevated physiological demands, if forage content of specific elements was less than requirements, if those elements were in greater concentration in lick soils than control sites, and/or if lick soils contained buffering/binding compounds that might help accommodate spring green-up and plant
Muskwa-Kechika Licks
7
defense compounds, functions of licks would be clarified. This information is useful in providing supporting evidence for why ungulates use mineral licks in the Tuchodi watershed.
STUDY AREA This study was conducted in the Tuchodi watershed of Northern Rocky Mountains
Provincial Park in north-central British Columbia (58°10’N 124°30’W). Northern Rocky Mountains is the largest protected area (635,900 ha) in the Muskwa-Kechika Management Area, and includes portions of the Eastern Muskwa Ranges, the Muskwa Foothills, and the Muskwa Plateau. The Tuchodi River passes through Tuchodi Lakes, extending from the Ranges through the Foothills, and is surrounded by boreal white and black spruce (Picea glauca and P. mariana) at low elevations; spruce, willow (Salix), and birch (Betula glandulosa) in the subalpine; and alpine tundra. The area is known for its high density and diversity of large mammal species, and extensive areas of high-capability ungulate habitat, particularly for Stone’s sheep, mountain goats, moose and elk. There is also significant potential for outdoor/wilderness tourism opportunities because of very high recreational values (Fort Nelson LRMP 1997). Access is by air, riverboat, or horseback. Currently, there are relatively high public and commercial use levels in the Tuchodi watershed relative to other areas in the Muskwa-Kechika Management Area, with projected high increases in future commercial activities (as per the Muskwa-Kechika Recreation Management Plan, http://srmwww.gov.bc.ca/rmd/lrmp/mk/recreation.html).
The Tuchodi system was chosen for study because it has both wet and dry licks interspersed along the river/lakes, the licks are used by at least four species of ungulates, and they can be accessed periodically and relatively easily with minimal disturbance to animals. We selected six licks for study over a 55-km distance from the upper Tuchodi River to the mouth of Childers Creek on the lower Tuchodi River (Fig. 3). Each of these was known to have historic ungulate use with well-used trails (Ross Peck, pers. comm.). The three wet licks were Childers (200 m x 50 m), Dead dog (50 m x 30 m), and Grizzly (~200 m x 100 m), which were all associated with stream confluences near the Tuchodi River downstream from the Tuchodi Lakes. The three dry licks included Lac-a-nookie, Standard, and Upriver. Lac-a-nookie and Standard licks were composed of steep gravelly hoodoo formations, rising ~60 m above streambeds and extending for ~350 m. Upriver lick on an inside curve of the Tuchodi River extended ~250 m along the river shore and ~60 m upslope into the forest.

8
Muskw
a-Kechika Licks
Figure 3. Six licks studied in the Tuchodi River watershed of Northern Rocky Mountains Provincial Park, Muskwa-Kechika Management Area of north-central British Columbia, May – August 2002.

Muskwa-Kechika Licks
9
ACTIVITIES/TECHNIQUES/FINDINGS:
Behavioural Observations of Animal Use Two, two-person teams worked in the study area in the Tuchodi watershed from May
– August 2002. One team made observations at two wet licks, Childers and Dead Dog, approximately 8 km apart and within 300 m of the Tuchodi River (Grizzly lick was not used for behavioural observations). Elevated blinds were constructed at each lick (see Fig. 4). The Childers lick blind was built 5 m off the ground between two trees within a few metres of the edge of the lick. This facilitated a clear view of the lick area from a position generally downwind of the main trails entering the lick. The Dead Dog lick blind was a free-standing platform 3 m off the ground set back from the edge of the lick in a stand of young spruce trees. This blind was well camouflaged downwind from lick activities with a clear view of the entire lick area. Following completion of fieldwork in late July, both blinds were dismantled.
Figure 4. Typical blind built for observations of wet lick.
The other team observed animals at the three dry licks: Lac-a-nookie, Standard, and Upriver. The dry licks were each associated with vantage points that were suitable for behavioural observations, across the Tuchodi River or Upper Lake from the licks, using 8x30 binoculars and 20-45 variable spotting scopes (Fig. 5). Both teams conducted ~3 consecutive days of observations at each lick every 10 days.
A. Anderson J. Ayotte

Muskwa-Kechika Licks
10
Figure 5. Typical observations of a dry lick.
Observations were conducted over 6-hr shifts (Table 1). Starting times of shifts (5-11 am, 11 am-5 pm, 5 pm-11 pm) were varied to spread observation efforts within the constraints of daylight. During each shift, one observer conducted scan samples of the lick every 15 minutes to record the species, sex, and location of every animal. These data were used to determine the highest number of animals observed in the lick at one scan during a shift. Consequently, we counted the number of animals present 24 times during a 6-hr observation shift, and used the highest of all of these numbers on a given day as an index of the relative use of the lick, compared across the season. More than 500 scans were obtained from each of the two wet licks, and between 350 and 500 scans from each dry lick (Table 1). We also used the scan data to quantify spatial use of the lick for subsequent soil sampling. Notes were taken on any recognizable individuals to monitor the frequency of their visits. During each shift, another observer collected focal animal data on random individuals as they entered the lick. This consisted of continuous behavioural sampling of one animal for its entire duration of time at the lick. Focal data were used to document use of the lick in terms of the duration of time spent at licks and the proportion of that time spent licking. Behaviours included licking, standing, bedding, and out-of-sight. After a focal animal left the lick, attempts were made to sample an individual from another species, sex, or age group. During each shift, notes were collected on weather (rain, wind, cloud cover) and any noticeable observer-caused effects on the behaviour of animals.
J. Ayotte

Muskwa-Kechika Licks
11
Table 1. Observation shifts at 5 licks in the Tuchodi watershed, summer 2002.
Lick
5-11 am shifts
11 am – 5 pmshifts
5-11 pm shifts
Number of scans
Number of focal animals
Childers 7 6 7 500 148 Dead Dog 7 6 8 525 152 Lac-a-nookie 7 8 5 500 22 Standard 6 7 5 450 16 Upriver 6 4 4 350 20 Total 33 31 29 2325 358
Wet Licks: We observed use of wet licks (Childers and Dead dog) by elk and moose during 41
shifts over 246 hours. Observations were made between 14 May and 19 July 2002.
Female elk visited Childers and Dead Dog licks in much higher numbers than any other group. Increases in use occurred in late May / early June, with a peak during the third week of June (Fig. 6). Male elk were observed in lower numbers, and use was less variable across the season without the mid-June peak. The highest number of elk (both sexes) observed at one time was 42 at Childers lick on 1 June, but this was not recorded during the ‘official’ scan samples taken every 15 minutes. Therefore, the average number of scanned visits during this time was much lower. The longest lick visits and the greatest time spent licking per visit occurred in late May or early June. Female elk spent a greater percentage of time actually licking (58%) when they were at the lick than male elk (49%, Table 2). The first elk calves were observed on 19 June at Childers and on 18 July at Dead dog licks.
Table 2. Length of lick visits, time licking, and proportion of time licking per visit ( X ± SE) by elk and moose at wet licks in the Tuchodi watershed. Data were combined across May – August 2002, with observer-affected and incomplete visits removed. Incomplete visits were those for which an individual was not observed from the time it entered the lick until it left the lick.
Species/sex Focal animals observed (n)
Length of visit (min)
Time spent licking (min)
Proportion licking
female elk 147 16.8 ± 1.5 11.5 ± 1.2 0.58 ± 0.02
male elk 49 21.8 ± 4.4 14.6 ± 3.6 0.49 ± 0.04
female moose 33 26.1 ± 3.5 10.4 ± 1.5 0.41 ± 0.04
male moose 11 37.7 ± 5.7 6.5 ± 1.8 0.40 ± 0.08

Muskwa-Kechika Licks
12
The highest number of female moose seen in one scan peaked in early July (Fig. 6). Trends for male moose were difficult to define because of low numbers for analyses, but also appeared highest in early July. The highest number of elk (both sexes) observed at one scan was 6 at Childers lick on 4 July. From the data on observations of individual moose, females spent shorter lengths of time at licks per visit than males (Table 2). The first moose calves were observed on 13 June at Childers and on 8 July at Dead dog licks.
Dead dog lick
May 20 Jun 03 Jun 17 Jul 01 Jul 15
0
2
4
6
8
10
12
14
16
18
20Childers lick
May 20 Jun 03 Jun 17 Jul 01 Jul 15
Hig
hest
# a
nim
als
at o
ne s
can
0
2
4
6
8
10
12
14
16
18
20Elk femaleElk male
Dead dog lick
Date
May 20 Jun 03 Jun 17 Jul 01 Jul 15
0.0
0.5
1.0
1.5
2.0
2.5
3.0
3.5
Childers lick
May 20 Jun 03 Jun 17 Jul 01 Jul 15
Hig
hest
# a
nim
als
at o
ne s
can
0.0
0.5
1.0
1.5
2.0
2.5
3.0
3.5
Moose femaleMoose male
Elk
Moose
Figure 6. Attendance by elk and moose at two wet licks in the Tuchodi watershed, 2002. Attendance data (as indexed by the highest number of individuals observed in one scan) were averaged ( X ± SE) over consecutive days of observation.

Muskwa-Kechika Licks
13
Rainfall patterns may have reduced attendance numbers at wet licks, although there was considerable variation in attendance patterns (Fig. 7). No animals were observed during two of 11 observation shifts conducted at wet licks in the rain. In comparison, only 1 of 30 shifts conducted without rain documented no animal use.
May 20 Jun 03 Jun 17 Jul 01 Jul 15 0
10
20
30
May 20 Jun 03 Jun 17 Jul 01 Jul 15 0
10
20
30
Rain daysAttendance
Atte
ndan
ce (h
ighe
st n
umbe
r of i
ndiv
idua
ls re
cord
ed a
t one
sca
n)
Date
Elk
Moose
Figure 7. Daily attendance by elk and moose as indexed by the highest number of individuals observed at one scan, in relation to precipitation recorded by observers at each of two wet licks (Childers and Dead dog) in the Tuchodi watershed, 2002.

Muskwa-Kechika Licks
14
Comparing the two ungulate species at wet licks, elk used licks more intensively than moose, based on records of the proportion of time spent licking (Table 2). This suggests that some aspect of elk physiology or forage composition may result in elk having a stronger appetite for wet lick soil than moose. Elk have been classified as mixed-feeders compared to a more concentrate-browser such as moose (Bubenik 1982). The digestive adaptability of elk that allows them to make extensive changes in forage species over the summer (Nelson and Leege 1982) may require inorganic supplements from wet licks to maintain the proper digestive environment for rumen microbes to function efficiently. We suspect that, because there was an increase in use of licks by both male and female elk at the end of May when forage species were beginning to green-up quickly in the Tuchodi valley, elk may be using licks for mineral supplements during that transition to new spring forage. The peak in lick use by female elk in mid-June occurred approximately three weeks after calving (late May). At this time lactation demands are highest (Robbins et al. 1981), and females probably use licks to supplement the additional requirements associated with milk production. Our data on moose did not show a peak in use at the end of May, which would correspond with forage green-up, although we did not observe as many moose as elk (and this may have affected our trends in attendance). Instead, moose use of licks appeared to increase later in the summer. We suggest that moose consume lick soil with relatively high clay content to help bind the plant defense compounds in their browse species, thereby improving digestive efficiency. Tannins and other secondary plant compounds are typically high in the browse consumed by moose (Bryant and Kuropat 1980), and would have greatest impacts on the animal when food intake increases during the summer.
Dry Licks We conducted 312 hours of observations of Stone’s sheep and mountain goats at
three dry licks (Lac-a-nookie, Standard, Upriver) during 52 observation shifts between 29 May and 12 August 2002.
Attendance at dry licks by mountain goats and Stone’s sheep was low across many time periods (Fig. 8). Because accurate sex identification was difficult from distant observation points, we conducted our analyses only by species groups. The durations of lick visits by focal animals are probably underestimated because many animals were recorded as out-of-sight behind the hoodoo-like formations at Lac-a-nookie and Standard licks. If a focal animal was out of sight for more than 30 minutes, observations of that animal were usually terminated. Nonetheless, even with these constraints, Stone’s sheep and mountain goats spent longer times at dry licks (Table 3) than did elk and moose at wet licks (Table 2).
Both Stone’s sheep and mountain goats showed variable increases in attendance at licks in early July. For Stone’s sheep, highest average attendance occurred later in early August (Fig. 8) when the longest times spent licking (46.7 ± 9.5 min) also were documented. The largest group (15 individuals) recorded at one scan was at Upriver lick in early July. Stone’s sheep lambs were first seen at Upriver lick on 25 June, at Standard lick on 28 June and at Lac-a-nookie lick on 29 June. Mountain goats also showed another peak in use in early August (Fig. 8). The largest number of goats recorded at any one time was 19 at Upriver lick on 6 July. We observed the first mountain goat kids at Standard lick on 19 June and at Upriver lick on 25 June.

Muskwa-Kechika Licks
15
3 dry licks combined
Date
May 20 Jun 03 Jun 17 Jul 01 Jul 15 Jul 29 Aug 12
Atte
ndan
ce (h
ighe
st #
at o
ne s
can)
0
2
4
6
8
10
12Stone's sheep
3 dry licks combined
Date
May 20 Jun 03 Jun 17 Jul 01 Jul 15 Jul 29 Aug 12
Atte
ndan
ce (h
ighe
st #
at o
ne s
can)
0
2
4
6
8
10
12
14
Mountain goats
Figure 8. Attendance by Stone’s sheep and mountain goats at two dry licks in the Tuchodi watershed, 2002. Attendance data (as indexed by the highest number of individuals observed in one scan) were averaged ( X ± SE) over consecutive days of observation.

Muskwa-Kechika Licks
16
Table 3. Length of lick visits, time licking, and proportion of time licking per visit ( X ± SE) by Stone’s sheep and mountain goats at dry licks in the Tuchodi watershed. Data were combined across May – August 2002.
Species/sex Focal animals observed (n)
Length of visit (min)
Time spent licking (min)
Proportion licking
female sheep 15 110.4 ± 26.2 24.1 ± 5.5 0.44 ± 0.08
male sheep 17 119.1 ± 20.8 27.7 ± 6.4 0.41 ± 0.06
female goats 10 110.7 ± 30.3 54.0 ± 18.6 0.56 ± 0.08
male goats 6 64.2 ± 30.6 34.0 ± 21.1 0.50 ± 0.12
The effects of rainfall on numbers of Stone’s sheep and mountain goats using dry licks were not obvious (Fig. 9). No animals were observed during 6 of 15 shifts conducted in the rain, in comparison to 5 of 37 shifts conducted without rain.
Comparing the two ungulate species at dry licks, mountain goats used licks more intensively than Stone’s sheep, based on records of the proportion of time spent licking (Table 3). As with our comparison between elk and moose, a stronger appetite for lick soil suggests that some aspect of mountain goat physiology or forage composition increases this appetite compared to Stone’s sheep. Mountain goats forage on a wider variety of plants than Stone’s sheep (Shackleton 1999). Throughout the spring and summer, we observed several mountain goats with signs of scouring (diarrhea) on their back legs. These observations imply that mountain goats may be particularly sensitive to the osmotic imbalance in the digestive tract that is thought to be associated with forage change, and therefore, goats may benefit more from inorganic supplements at licks to buffer against such ailments and maintain their adaptability to a wide range of forages.
The first peak period of lick use in July for both Stone’s sheep and mountain goats could partially reflect physiological stress brought on by the late greening of alpine forage in comparison to vegetation at lower elevations. It is unlikely though that even with the late green-up of forage in the alpine, the August peak in lick use was related to forage change. We suggest rather that this second peak in attendance at licks may be due to females that minimized traveling to the dry licks to reduce the threat of predation on their young and that may be suffering from deficiencies in nutritional elements associated with lactation. This is supported by our observations of the largest groups of females with young of the year on 6-7 August. Animals traveled a minimum of 3 km over 700 m elevation change from their alpine foraging habitats to the dry licks on valley bottoms. Predators were never visually observed at any of the dry licks, but remote trail cameras photographed three black bears (one in May and two in June) and a wolf (in June) on the trails to the dry licks; and an abandoned wolf den was found within 50 m of the top of one of the licks.

Muskwa-Kechika Licks
17
May 20 Jun 03 Jun 17 Jul 01 Jul 15 Jul 29 Aug 12 0
5
10
15
20
Rain daysAttendance
Date
May 20 Jun 03 Jun 17 Jul 01 Jul 15 Jul 29 Aug 12
Atte
ndan
ce (h
ighe
st n
umbe
r of i
ndiv
idua
ls re
cord
ed a
t one
sca
n)
0
5
10
15
20
Stone's sheep
Mountain goats
Figure 9. Daily attendance by Stone’s sheep and mountain goats as indexed by the highest number of individuals observed at one scan, in relation to precipitation recorded by observers at each of three licks (Upriver, Standard, and Lac-a-nookie) in the Tuchodi watershed, 2002.
Muskwa-Kechika Licks
18
Data from Remote Cameras at Dry Licks Because of observational difficulties from distant viewpoints to the dry licks, remote
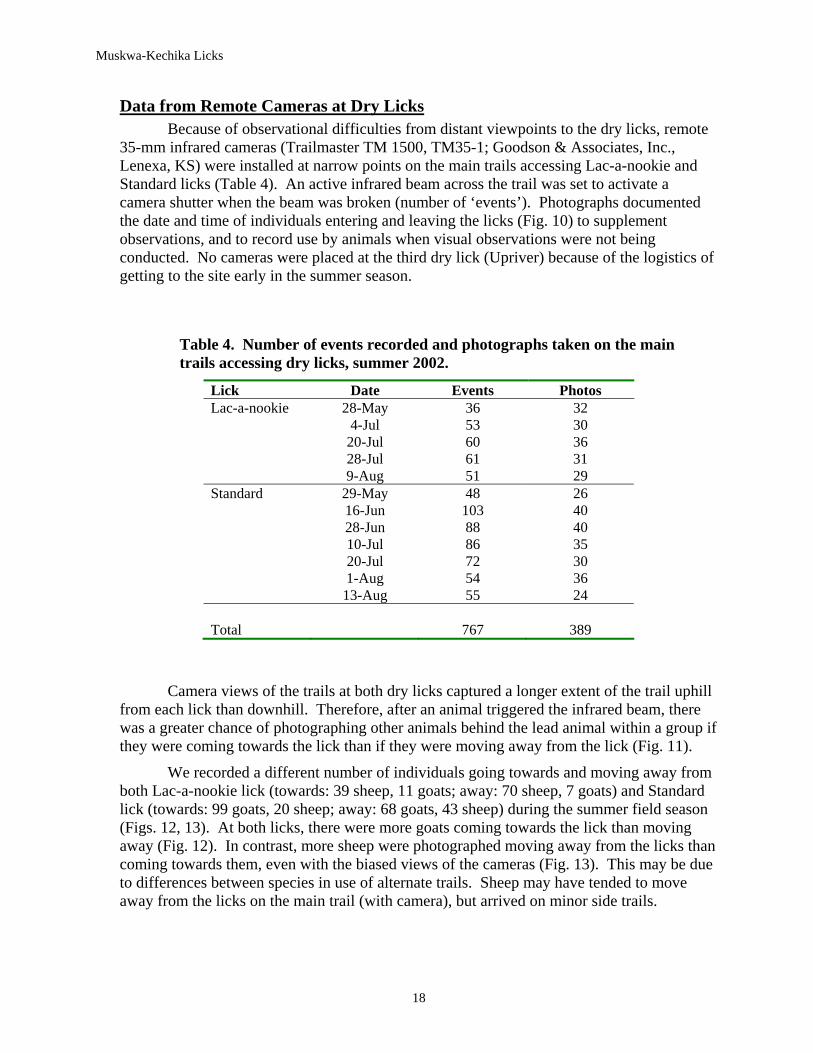
35-mm infrared cameras (Trailmaster TM 1500, TM35-1; Goodson & Associates, Inc., Lenexa, KS) were installed at narrow points on the main trails accessing Lac-a-nookie and Standard licks (Table 4). An active infrared beam across the trail was set to activate a camera shutter when the beam was broken (number of ‘events’). Photographs documented the date and time of individuals entering and leaving the licks (Fig. 10) to supplement observations, and to record use by animals when visual observations were not being conducted. No cameras were placed at the third dry lick (Upriver) because of the logistics of getting to the site early in the summer season.
Table 4. Number of events recorded and photographs taken on the main trails accessing dry licks, summer 2002.
Lick Date Events Photos Lac-a-nookie 28-May 36 32 4-Jul 53 30 20-Jul 60 36 28-Jul 61 31 9-Aug 51 29 Standard 29-May 48 26 16-Jun 103 40 28-Jun 88 40 10-Jul 86 35 20-Jul 72 30 1-Aug 54 36 13-Aug 55 24 Total 767 389
Camera views of the trails at both dry licks captured a longer extent of the trail uphill from each lick than downhill. Therefore, after an animal triggered the infrared beam, there was a greater chance of photographing other animals behind the lead animal within a group if they were coming towards the lick than if they were moving away from the lick (Fig. 11).
We recorded a different number of individuals going towards and moving away from both Lac-a-nookie lick (towards: 39 sheep, 11 goats; away: 70 sheep, 7 goats) and Standard lick (towards: 99 goats, 20 sheep; away: 68 goats, 43 sheep) during the summer field season (Figs. 12, 13). At both licks, there were more goats coming towards the lick than moving away (Fig. 12). In contrast, more sheep were photographed moving away from the licks than coming towards them, even with the biased views of the cameras (Fig. 13). This may be due to differences between species in use of alternate trails. Sheep may have tended to move away from the licks on the main trail (with camera), but arrived on minor side trails.

Muskwa-Kechika Licks
19
Figure 10. Example photograph of Stone’s sheep on trail to dry lick, taken with a remote infrared camera.
Figure 11. Example photograph of mountain goats coming towards dry lick, taken with a remote infrared camera.
TM 1500
TM 1500

Muskwa-Kechika Licks
20
Tim e of day (h)
0 4 8 12 16 20 24
Num
ber o
f goa
ts p
hoto
grap
hed
trave
lling
aw
ay fr
om th
e lic
k
0
5
10
15
20T im e of day (h)
0 4 8 12 16 20 24
Num
ber o
f goa
ts p
hoto
grap
hed
trave
lling
to th
e lic
k
0
5
10
15
20
Figure 12. Photographs from two remote trail cameras recording mountain goats traveling to (top) and away (bottom) from two dry licks (Lac-a-nookie and Standard), Tuchodi watershed, 2002. Hourly distributions were similar at both licks.

Muskwa-Kechika Licks
21
T im e of day (h)
0 4 8 12 16 20 24Num
ber o
f she
ep p
hoto
grap
hed
trave
lling
aw
ay fr
om th
e lic
k
0
5
10
15
20
25
30
T im e of day (h)
0 4 8 12 16 20 24Num
ber o
f she
ep p
hoto
grap
hed
trave
lling
to th
e lic
k
0
5
10
15
20
25
30
Figure 13. Photographs from two remote trail cameras recording Stone’s sheep traveling to (top) and away (bottom) from two dry licks (Lac-a-nookie and Standard), Tuchodi watershed, 2002. Hourly distributions were similar at both licks.
Muskwa-Kechika Licks
22
We assumed that the best indicator of use by species was from photographs taken in the direction that recorded the highest number of individuals (goats coming towards the lick, sheep moving away from the lick). These photographs suggested that there may be species-specific differences related to temporal use. Goats used the main trails at all hours of the day including after dark (13 individuals between 2300 and 0400, Fig. 12). Sheep, however, were not usually recorded after dark (only 2 individuals between 2300 and 0400, Fig. 13). Of the 21 goats coming to the lick during those night-time hours, 5 were females (3 of which had young), 4 were males, and the sex for 9 animals could not be determined from the photographs (i.e., head, horns, and reproductive organs were not visible).
Remote cameras always documented fewer individuals than seen by researchers during behavioural observations. At the Lac-a-nookie lick, for example, observers documented 15 different sheep at the lick during a 6-hr observation shift on 5 August, but the camera only recorded 5 animals over a 24-hr period. Therefore, cameras may have documented some use for days in which behavioural observations were not conducted, but they did not record attendance of all sheep presumably because all animals did not use the main trail. In addition, although mountain goats were known to use Lac-a-nookie lick, no goats were recorded during observation shifts. The camera, however, documented that goats did indeed use the lick during summer 2002.
Photographs and scan sampling during behavioural observations from the summer 2002 field season showed that Standard lick was frequented by more goats than Stone's sheep – the opposite of Lac-a-nookie lick. Our reports from Standard lick also noted that more animals in total used Standard lick than Lac-a-nookie lick.
It was very difficult to identify individuals in the photographs from the remote cameras. There were, however, a few individuals that could be identified definitively by unique scarring or horn configuration. For those animals, we were able to determine the total time spent at the lick between the photograph of the animal going to the lick and the photograph of the animal moving away from the lick (Table 5). The photographs suggested that those animals remained at the licks on average for 4 to 5 hours. At the extreme, one Stone’s sheep stayed at a lick for 8 hours, and a mountain goat apparently stayed overnight (30.22 hours). One mountain goat and one Stone’s sheep were noted to come to the lick twice in 2 days, and another mountain goat visited three times in 6 days; each of these animals was female accompanied by young of the year (yoy) or a juvenile.
It appears that remote photography and visual observations offer different insights into quantifying use of licks. Photographs recorded use when researchers were not able to make visual observations (e.g., night-time hours and days when other licks were being observed), and potentially can be used to index general trends in temporal use within a day. Visual observations with scan sampling were useful in documenting higher numbers of animals using the licks at specific times than photographed by camera, presumably because some animals accessed the lick by routes other than a single main trail. Observations also are useful for quantifying the proportion of active time that animals actually spend licking soil.

Muskwa-Kechika Licks
23
Table 5. Duration of time at lick and frequency of trips to lick by recognizable individuals (mountain goats and Stone’s sheep) from photographs taken with remote trail cameras, summer 2002. ‘Yoy' indicates young of the year.
Individual Date Duration at lick Frequency of visits per time Goat male 14 June 3 hr 20 min Goat male 18 June 3 hr 12 min Goat male 24 June 4 hr 31 min Goat male 29 July 4 hr 53 min Goat male 26/27 July 30 hr 13 min Goat male 29/30 July 6 hr 13 min Goat male 03 August 2 hr 41 min Goat unknown sex 15/16 July 24 hr 17 min Goat female 29 July 4 hr 3 min Goat female with juvenile
25/27 July 2 times in 29 hr 50 min
Goat female with yoy 7/8, 9/10, 13 August
5 hr 34 min, 6 hr 5 min
3 times in 145 hr 50 min
Sheep juvenile 11 July 4 hr 21 min Sheep juvenile 09 August 8 hr Sheep female with yoy 2/4 August 2 times in 38 hr 51 min
Soil Samples at Licks Soil samples were collected at three dry and three wet licks (Grizzly Creek was added
to the two wet licks that were used for behavioural observations). The overall area of each lick was designated as the edge of trampled mud at wet licks, and by the boundaries of exposed soils at dry licks. Each lick was surveyed with a compass and a hip chain to map the lick boundary. A map was drawn from these measurements and overlain with a 4x4-m grid. High-use sites (determined from scan sampling) within the lick were plotted on the overview map. Sites of low to no use within the lick were randomly chosen from other areas of the grid map. Control sites were spread evenly around the perimeter of the lick on transects extending 10 m outside the lick edge (see Fig. 14). A total of 198 soil samples were collected at high-use, low- or no-use sites, control sites, and along transects running the longest horizontal or vertical distance across the lick (Table 6, Fig. 15). Water samples from Childers and Dead dog licks also were collected from the inflow (apparent groundwater spring), the outflow, and from control sites (the closest body of water outside each lick) (Fig. 15).

Muskwa-Kechika Licks
24
Figure 14. An example of the overview maps drawn for each lick (Childers lick is shown). The top map was used to plot all locations of animals observed at the lick. The bottom map was then used to delineate high- and low-use areas, and randomly select 10 sites within which to sample. Control sites were 10 m beyond the boundary of the lick and evenly distributed around its perimeter.
Table 6. Samples of lick soils (n = 198) obtained from high-use and low- or no-use sites, control samples outside licks, and transects across licks, in the Tuchodi watershed, summer 2002.
Lick
High use samples
Low/no-use samples
Control samples
Transect samples
Childers 10 10 9 15 Dead Dog 10 10 10 Grizzly 10 (random) 9 Lac-a-nookie 9 10 11 7 Standard 10 11 10 Upriver 10 10 10
Control site
Low-use site
High-use site

Muskwa-Kechika Licks
25
Figure 15. Soil and water sampling at licks in the Tuchodi watershed, summer 2002.
P. Hirshfield
K. Parker
J. Ayotte

Muskwa-Kechika Licks
26
All soil samples collected at licks were air-dried, ground, and sieved in preparation for chemical analyses. Protocols were established to determine total elemental content (using inductively coupled plasma (ICP) atomic emission spectroscopy), carbonate composition (acid neutralization procedure, USDA 1954), and cation exchange capacity (Kalra and Maynard 1991). Details of these procedures are presented in Ayotte (2004). We specifically attempted to determine the benefits that could be obtained via the gastrointestinal tract of ungulates ingesting lick soil. For ungulates such as elk, moose, Stone’s sheep, and mountain goats with ruminant digestive systems, the carbonates and cation exchange capacity contribute to buffering capacity. The pH of the rumen, where the buffering role of the soil is considered important (Klaus and Schmid 1998, Kreulen 1985), generally ranges from 5.5-7 (Church 1975). Therefore, we conducted these analyses at pH 7. Elemental cations typically pass with the digesta through the remaining ruminant stomach chambers, encountering pH 2.5 just prior to the major sites of absorption in the small intestine (Church 1975) (see Fig. 16). Consequently, we used a pH 2.5 extraction solution to best represent the concentrations of elements that likely become available to the animal (Mehlich III procedure, Sen Tran and Simard 1993). All soil samples were analyzed for sodium, magnesium, calcium, potassium, phosphorus, manganese, zinc, copper, iron, cobalt, and boron. We also scanned select soil samples from one wet lick and one dry lick with an X-ray defractometer (Whittig 1965) to identify clay mineral types that might contribute to buffering capacity during the transition to spring forage. The water samples collected at wet licks were analyzed for all of the same elements as the lick soils, except for boron and including molybdenum.
Figure 16. Schematic of the transfer of ingested food or soil in the gastrointestinal tract of ruminants, from rumen (pH 5.5-7) through small intestine (pH ~2.5).
http://www.geocities.com/magicgoatman/rumination.html

Muskwa-Kechika Licks
27
We compared high- and low-use sites at the three wet licks (Childers, Dead Dog, and Grizzly) and at the three dry licks (Lac-a-nookie, Standard, and Upriver) with control sites outside those licks. No data were available for high-use sites at Grizzly lick because we did not conduct visual observations to distinguish between high- and low-use areas.
At the wet licks, the average concentrations of soil components were highly variable between the three licks. For example, Childers lick soils contained twice the concentration of calcium, 10 times the concentration of sulphate, six times the cation exchange capacity, and one third the copper concentration of Dead dog and Grizzly licks. At all three wet licks, sodium concentrations were higher in lick soils, although not significantly above control sites (Table 7). Sodium was also higher in inflow water samples compared to water controls. Magnesium levels were not elevated in any of the wet lick soil samples, but they were concentrated in the inflow water samples (Table 8). Relative to buffering components, there were high carbonate levels in soils from all wet licks, but the clay content of high-use soils (~63.2 ± 3.02 %) was not different than control sites (67.2 ± 2.54 %) and there were no expandable clay fractions that would contribute significantly to buffering capacity.
At the dry licks, concentrations of elements and compounds among the licks were relatively similar except for sodium, zinc, carbonates, and cation exchange capacity. Soils from Lac-a-nookie and Standard licks contained carbonates that were 10% higher, and concentrations of zinc and cation exchange capacity that were one third lower than at Upriver lick. Sodium concentrations at Lac-a-nookie lick were similar to Upriver lick, but nearly twice as high as levels at Standard lick. More generally, the chemical composition of the dry licks (Table 9) differed from the wet licks (Table 7). Sodium, carbonates, and pH were significantly greater than controls at all three dry licks. Magnesium at high-use sites was also elevated at all of the dry licks. The clay content of a small sample of high-use soils contained more than twice the amount of clay (49.7 ± 0.67 %) as control samples (20.8 ± 8.37 %), but there were no differences in the types of clay minerals present in the isolated clay fractions of high-use samples compared to controls.
Our chemical analyses of lick soils in the Tuchodi system indicate that licks can serve in a buffering capacity as well as for elemental supplementation. Both wet and dry lick soils, with high carbonate levels, could be used to buffer pH imbalances that may occur in response to intake of lush green forages. The role of clay towards ameliorating digestive ailments is not clear. Clay content was higher at dry licks than surrounding sites, but our sample sizes were too low to make strong conclusions. Licks also are likely to provide easy access to two elements: sodium, and magnesium.

28
Muskw
a-Kechika Licks
Table 7. Average concentrations ( X ± SD) of soil components in samples collected from high-use, low-use, and control sites at three wet licks in the Tuchodi watershed, 2002. Sample sixes are included in parentheses.
Childers lick Dead dog lick Grizzly lick Soil
components High-use
(10) Low-use
(10) Control
(9) High-use
(10) Low-use
(10) Control
(10) Lick (10)
Control (9)
Na (ppm) 153 ± 53.5 131 ± 103.1 77.8 ± 26.1 110 ± 44.6 98.1 ± 41.1 21.4 ± 10.3 79.9 ± 33.6 51.8 ± 34.2
Mg (ppm) 902 ± 180.9 1127 ± 241.5 1179 ± 446 667 ± 93.9 606 ± 115 696 ± 324 1052 ± 262 1479 ± 983
Ca (ppm) 10603 ± 1753 11676 ± 1265 12721 ± 1761 4561 ± 1734 4394 ± 1325 10463 ± 1908 6290 ± 1736 8391 ± 2051
K (ppm) 116 ± 65.5 133 ± 105 280 ± 227 179 ± 84.4 159 ± 138 219 ± 109 75.4 ± 26.5 229 ± 253
P (ppm) 10.4 ± 5.2 8.9 ± 3.0 33.2 ± 33.8 5.9 ± 1.1 5.8 ± 2.3 21.5 ± 20.7 2.4 ± 2.4 29 ± 49.3
Sulfate (ppm) 2112 ± 418 9039 ± 5039 335 ± 405 369 ± 135 390 ± 193 79.7 ± 99.0 394 ± 435 141 ± 142 Fe (ppm) 661 ± 82.7 592 ± 46.6 575 ± 30.4 651 ± 75.6 679 ± 77.7 537 ± 64.5 710 ± 124 546 ± 132
Cu (ppm) 0.73 ± 0.38 2.4 ± 0.18 3.4 ± 1.2 3.0 ± 2.2 2.3 ± 1.7 5.1 ± 2.1 2.7 ± 1.7 4.0 ± 1.3
Mn (ppm) 41.3 ± 9.0 31.6 ± 8.1 48.9 ± 18.1 40.2 ± 10.5 48.8 ± 6.6 44.1 ± 18.7 44.4 ± 24.6 69.2 ± 24.8
Zn (ppm) 13.2 ± 1.4 20.6 ± 6.8 45.2 ± 27.7 21.9 ± 3.2 21.6 ± 3.4 33.2 ± 7.7 25.1 ± 9.5 46.8 ± 48.6
Carbonate (%) 18.5 ± 5.3 19.0 ± 7.0 9.7 ± 3.0 13.9 ± 3.2 17.6 ± 3.1 13.6 ± 5.0 34.2 ± 3.8 28.4 ± 8.5 C (%) 13.0 ± 4.0 15.5 ± 4.9 31.4 ± 12.6 9.0 ± 2.3 7.6 ± 1.2 15.0 ± 8.6 10.2 ± 2.9 15.9 ± 9.0 N (%) 0.50 ± 0.16 0.88 ± 0.28 1.4 ± 0.42 0.40 ± 0.12 0.32 ± 0.05 0.74 ± 0.37 0.44 ± 0.17 0.79 ± 0.52
CEC (cmol(+)/kg) 15.5 ± 3.9 58.3 ± 116 41.7 ± 13.3 14.5 ± 4.9 10.6 ± 1.7 23.8 ± 5.6 11.3 ± 5.4 21.2 ± 12.3

29
Muskw
a-Kechika Licks
Table 8. Average concentrations ( X ± SD) of elements (ppm) in water samples collected from inflow, outflow, and control sites (all n = 3) at two wet licks in the Tuchodi watershed, 2002.
Childers lick Dead dog lick Elements In Out Control In Out Control Na 22.121 ± 27.246 35.964 ± 0.221 2.048 ± 0.048 239.723 ± 10.247 6.775 ± 0.261 4.283 ± 0.015
Mg 44.724 ± 7.280 46.602 ± 0.259 21.107 ± 0.288 107.837 ± 17.615 42.379 ± 0.269 36.971 ± 0.239
Ca 157.06 ± 2.720 145.129 ± 0.831 54.560 ± 1.588 223.135 ± 37.156 105.947 ± 0.454 97.730 ± 0.422
K 1.411 ± 0.996 2.291 ± 0.089 0.669 ± 0.104 7.461 ± 4.319 0.819 ± 0.105 0.780 ± 0.057
Fe 1.344 ± 1.754 1.127 ± 0.515 0.0420 ± 0.049 0.049 ± 0.035 0.121 ± 0.006 0.025 ± 0.001
Cu 0.000 ± 0.000 0.000 ± 0.001 0.000 ± 0.003 0.000 ± 0.001 0.001 ± 0.001 0.001 ± 0.001
Mn 0.128 ± 0.092 0.075 ± 0.001 0.010 ± 0.019 0.268 ± 0.268 0.000 ± 0.001 0.000 ± 0.000
Zn 0.004 ± 0.007 0.009 ± 0.003 0.001 ± 0.002 0.014 ± 0.011 0.000 ± 0.003 0.003 ± 0.001
Mo 0.042 ± 0.000 0.047 ± 0.005 0.019 ± 0.002 0.105 ± 0.011 0.042 ± 0.006 0.029 ± 0.007
Co 0.003 ± 0.004 0.0001 ± 0.002 0.001 ± 0.005 0.000 ± 0.004 0.001 ± 0.002 0.001 ± 0.002

30
Muskw
a-Kechika Licks
Table 9. Average concentrations ( X ± SD) of soil components (ppm) in samples collected from high-use, low-use, and control sites at three dry licks in the Tuchodi watershed, 2002. Sample sizes are included in parentheses.
Soil Lac-a-nookie lick Standard lick Upriver lick
components High-use
(9) Low-use
(10) Control
(11) High-use
(10) Low-use
(11) Control
(10) High-use
(10) Low-use
(10) Control
(10) Na (ppm) 107±104 6.3±11.19 4.2±4.11 60.4±61.5 13.9±18.4 15.1±18.4 118±57.5 11.9±15.0 12.0±5.8 Mg (ppm) 2653±1498 995±467 677±512 3225±5227 883±345 634±262 1713±1465 599±359 671±231 Ca (ppm) 15420±3579 14617±3657 7141±2568 13067±3954 1334±4188 10125±1554 10372±2161 10709±3141 8211±1728 K (ppm) 418±402 139±28.7 143±50.5 146±46.5 120±27.2 155±36.2 233±113 75.8±53.7 314±274 P (ppm) 1.1±2.05 1.1±2.60 8.5±4.6 0.39±0.99 1.6±2.6 6.0±3.7 2.4±2.9 2.4±2.5 17.7±17.9 Sulfate (ppm) 2464±2308 57.9±99.6 8.5±5.9 3187±7094 92.9±157 5.2±1.4 305±367 43.5±53.0 31.1±38.1 Fe (ppm) 170±44.4 183±42.0 373±182 181±31.1 152±38.9 262±145 188±52.9 160±72.1 197±71.8 Cu (ppm) 2.7±0.88 2.2±0.38 2.1±0.49 2.0±0.89 2.3±0.50 2.3±0.36 3.1±0.69 3.1±0.85 2.9±0.49 Mn (ppm) 79.1±11.3 81.1±6.7 98.9±23.1 79.4±20.3 78.5±16.6 92.0±17.8 57.6±12.7 63.4±11.4 77.1±6.8 Zn (ppm) 1.2±0.29 1.1±0.31 2.2±1.1 1.1±0.46 1.2±0.24 4.2±4.2 4.0±1.6 4.5±1.8 13.8±7.9 Carbonate (%) 28.9±1.2 26.1±6.4 11.3±6.8 30.1±9.5 29.4±7.3 20.4±5.9 20.3±1.3 22.2±2.7 17.8±1.8 C (%) 3.6±0.29 3.4±0.75 5.9±2.7 3.3±1.0 3.8±0.88 6.5±2.1 3.5±0.47 4.3±1.4 8.4±2.9 N (%) 0.03±0.02 0.04±0.03 0.24±0.11 0.02±0.01 0.05±0.04 0.24±0.10 0.10±0.03 0.13±0.08 0.31±0.09 CEC (cmol(+)/kg) 1.3±0.38 1.4±0.86 9.1±4.9 1.2±0.84 2.1±1.4 10.0±4.3 3.5±1.9 3.6±2.3 10.2±4.7
Muskwa-Kechika Licks
31
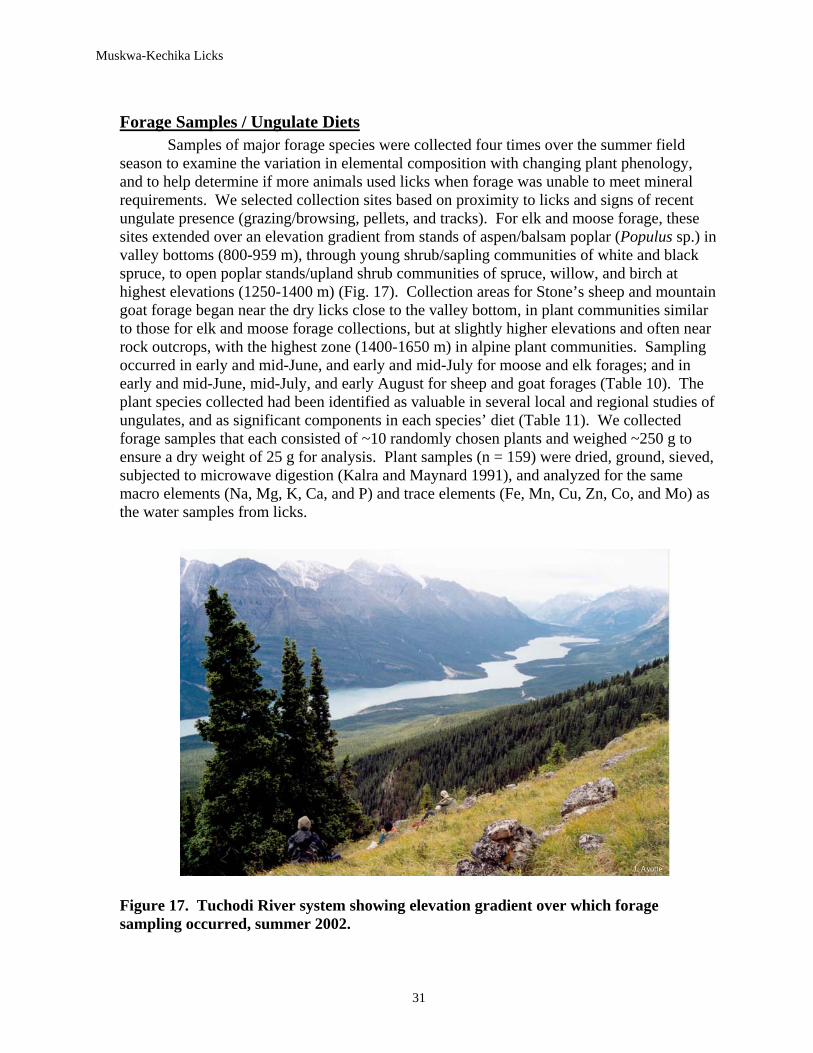
Forage Samples / Ungulate Diets Samples of major forage species were collected four times over the summer field
season to examine the variation in elemental composition with changing plant phenology, and to help determine if more animals used licks when forage was unable to meet mineral requirements. We selected collection sites based on proximity to licks and signs of recent ungulate presence (grazing/browsing, pellets, and tracks). For elk and moose forage, these sites extended over an elevation gradient from stands of aspen/balsam poplar (Populus sp.) in valley bottoms (800-959 m), through young shrub/sapling communities of white and black spruce, to open poplar stands/upland shrub communities of spruce, willow, and birch at highest elevations (1250-1400 m) (Fig. 17). Collection areas for Stone’s sheep and mountain goat forage began near the dry licks close to the valley bottom, in plant communities similar to those for elk and moose forage collections, but at slightly higher elevations and often near rock outcrops, with the highest zone (1400-1650 m) in alpine plant communities. Sampling occurred in early and mid-June, and early and mid-July for moose and elk forages; and in early and mid-June, mid-July, and early August for sheep and goat forages (Table 10). The plant species collected had been identified as valuable in several local and regional studies of ungulates, and as significant components in each species’ diet (Table 11). We collected forage samples that each consisted of ~10 randomly chosen plants and weighed ~250 g to ensure a dry weight of 25 g for analysis. Plant samples (n = 159) were dried, ground, sieved, subjected to microwave digestion (Kalra and Maynard 1991), and analyzed for the same macro elements (Na, Mg, K, Ca, and P) and trace elements (Fe, Mn, Cu, Zn, Co, and Mo) as the water samples from licks.
Figure 17. Tuchodi River system showing elevation gradient over which forage sampling occurred, summer 2002.
J. Ayotte

Muskwa-Kechika Licks
32
Table 10. Forage species sampled near wet and dry licks in the Tuchodi watershed, summer 2002.
Moose and elk forage collections Sheep and goat forage collections Date Species Collected Date Species Collected 5-7 Jun Salix sp. 6-Jun Oxytropis sp. Elymus sp. Artemisia frigida Populus balsamifera Zygadenus elegans Rosa acicularis Lupinus sp. Alnus tenuifolia grass sp. 1 Cornus canadensis grass sp. 2 Salix sp. grass sp. 3 Rosa acicularis grass sp. 4 15-Jun Rosa acicularis 20-Jun Artemisia frigida Vibernum edule Elymus sp. Salix sp. Epilobium sp. Elymus sp. Carex sp. Betula papyrifera Lupinus arcticus Vicea americana Zygadenus elegans Cornus canadensis Bromus sp. 1-Jul Fescue sp. Oxytropis sp. Cornus canadensis Festuca sp. Rosa acicularis grass sp. 1 Elymus sp. grass sp. 2 Populus tremuloides 20-Jul Carex sp. Salix sp. Lupinus arcticus Vicea americana Artemisia frigida Vibernum edule Oxytropis sp. Bromus sp. Elymus sp. Alnus tenuifolia Zygadenus elegans Betula papyrifera Epilobium sp. grass sp. 1 grass sp. 2 grass sp. 3 grass sp. 4 12-Jul Betula papyrifera 10-Aug Agropyron sp. Vicea americana Calamagrostis sp. Rosa acicularis Lupinus arcticus Elymus sp. Elymus sp. Alnus tenuifolia Artemisia frigida Vibernum edule Epilobium sp. Salix sp. Zygadenus elegans Populus tremuloides Oxytropis sp. Cornus canadensis Poa sp. Epilobium Bromus sp. Carex sp. grass sp. 1

Muskwa-Kechika Licks
33
Table 11. Preferred forage and estimated percent composition of the diet for four ungulate species, based on local and regional sources.
Ungulate Preferred forage Composition of diet Source Spring Summer Elk Populus balsamifera shrubs: 3% shrubs: 33% Peck (1987) Rosa acicularis herbs: 7% herbs: 50% Elymus sp. grasses: 90% grasses: 17% Vibernum edule Vicea americana Bromus Moose Populus balsamifera Salix/Betula: 75% Singleton (1976) Salix sp Alnus/Cornus/Populus: 20% Cushwa and Coady (1976) Alnus sp. herbs: 5% Cornus canadensis Betula papyrifera Epilobium Stone's Agropyron grasses: 80% grasses: 60% Seip (1983) Sheep Zygadenus herbs: 20% herbs: 40% Luckhurst (1973) Oxytropis Poa Elymus Hordeae Mountain Agropyron grasses: 5% Hjeljord (1973) Goat Artemesia Carex: 20% Lupinus herbs: 75% Carex Epilobium Festuca altaica
We calculated estimates of the elemental concentrations in each ungulate species’ diet by weighting the proportions of the forage species based on dietary compositions determined in other studies (Table 11). There were no differences in the elemental concentrations of plants grouped by elevation, and so data across elevations were combined for analysis (Tables 12, 13). The spring diets of elk appeared to be higher in potassium and sodium and lower in iron than diets consumed later in the summer. There were no significant changes in elemental concentrations of moose diets across the summer. Diets of sheep and goats showed small changes in phosphorus, molybdenum, and cobalt between sampling periods, but there was no consistency between species’ diets or trends across the summer.
To determine if elements that were elevated in lick soils (sodium, magnesium) might help compensate for deficiencies in diets, we compared the concentrations of those elements in our ungulate diets with documented estimates of nutritional requirements. The average concentrations of sodium (<86 ppm) measured in the diets of the four ungulate species in our study area were much lower than estimates required by captive ungulates (136-1600 ppm; Church 1975, NRC 1996, Hellgren and Pitts 1997, Lintzenich and Ward 1997).

34
Muskw
a-Kechika Licks
Table 12. Average elemental concentrations ( X ± SD, ppm) in estimated diets of elk and moose in the Tuchodi watershed. Dietary estimations are based on samples of six primary forage species. Collections (sample sizes in parentheses) were made in spring (early June), early summer (early/mid July), and summer (late July/early August) 2002. Elk Moose Elements Spring (1) Early summer (3) Summer (3) Spring (3) Early summer (3) Summer (3) Na 58.1 36.5 ± 2.2 34.7 ± 12.4 22.8 24.4 ± 17.9 36.2 ± 10.9
Mg 1187 2066 ± 68.8 1512 ± 802 1679 1947 ± 456 2280 ± 305
Ca 4562 10014 ± 1783 5803 ± 3734 11345 8208 ± 3261 8195 ± 635
K 23942 16923 ± 2407 14051 ± 6663 10096 17577 ± 9668 11331 ± 1745
P 2466 2527 ± 364 1443 ± 486 2913 3487 ± 1782 2101 ± 342
Fe 58.4 3935 ± 3964 199 ± 292 126 98.8 ± 66.1 46.9 ± 17.9
Cu 9.2 8.9 ± 1.3 4.9 ± 2.3 10.9 7.8 ± 1.9 5.8 ± 1.3
Mn 23.8 53.6 ± 10.4 21.2 ± 3.9 67.4 82.2 ± 106.7 106.1 ± 56.3
Mo 10.2 6.4 ± 2.3 0.41 ± 0.62 0.27 0.08 ± 0.07 0.18 ± 0.20
Co 0.34 0.97 ± 0.88 0.34 ± 0.19 0.99 0.96 ± 0.03 0.63 ± 0.25
Zn 46.6 89.1 ± 42.9 27.3 ± 16.7 154 135 ± 72.2 214 ± 79.9

35
Muskw
a-Kechika Licks
Table 13. Average elemental concentrations ( X ± SD, ppm) in estimated diets of Stone’s sheep and mountain goats in the Tuchodi watershed. Dietary estimations are based on samples of six primary forage species. Collections (sample sizes in parentheses) were made in spring (early June), early summer (early/mid July), and summer (late July/early August) 2002. Stone's sheep Mountain goats
Elements Spring
(3) Early summer (3) Summer
(3) Spring
(3) Early summer (3) Summer
(3) Na 67.5 ± 16.7 47.6 ± 2.6 45.9 ± 4.5 50.3 ± 9.7 86.0 ± 37.4 48.8 ± 32.4
Mg 1656 ± 479 2773 ± 924 2576 ± 649 3614 ± 559 3935 ± 2437 6221 ± 2188
Ca 5536 ± 1083 10867 ± 666 10205 ± 746 12359 ± 7017 14197 ± 8963 30194 ± 9942
K 18950 ± 8574 15950 ± 4089 16828 ± 1890 20914 ± 4732 12193 ± 4051 15459 ± 4034
P 2061 ± 734 1147 ± 175 1284 ± 212 3309 ± 961 1387 ± 493 1319 ± 444
Fe 207 ± 107 353 ± 306 321 ± 270 205 ± 137 728 ± 365 338 ± 412
Cu 6.4 ± 2.0 5.0 ± 0.89 6.2 ± 2.4 10.9 ± 2.3 11.8 ± 2.1 7.8 ± 4.9
Mn 69.9 ± 41.7 53.8 ± 5.7 67.9 ± 17.9 114 ± 36.4 94.8 ± 11.6 208 ± 107
Mo 0.00 ± 0.00 1.3 ± 0.29 1.9 ± 0.65 0.14 ± 0.22 0.27 ± 0.34 0.99 ± 0.44
Co 0.51 ± 0.08 0.78 ± 0.19 0.27 ± 0.12 0.72 ± 0.26 0.77 ± 0.21 0.13 ± 0.18
Zn 25.2 ± 7.9 18.6 ± 6.4 22.1 ± 5.8 31.5 ± 6.0 25.1 ± 4.2 20.5 ± 11.4
Muskwa-Kechika Licks
36
Sodium demands are typically 40% higher during early lactation (Staaland et al. 1980), which corresponds with periods of highest use of wet licks by female elk (late June, Fig. 6). If sodium levels are low in diets during most of the year, females may visit licks when predator threats to young are minimized, as potentially exemplified by Stone’s sheep and mountain goats that tended to use dry licks later in the summer (early July to early August, Fig. 8). The iron concentrations in moose diets tended to be lowest in late July, which also corresponded to the period of peak lick use (Fig. 6). This iron content in the estimated diets (46.9 ppm) was borderline for meeting requirements, as reported for wild ungulates (27-45 ppm) and cattle (50 ppm) (NRC 1996, Lintzenich and Ward 1997). Dietary magnesium for the ungulate species in our study (1187-6221 ppm) was within the range of requirements (900-2000 ppm; NRC 1996, Lintzenich and Ward 1997), but other dietary properties of spring forage, particularly high potassium levels in the spring, can affect the absorption of magnesium, resulting in deficiencies. It is possible that soil and water at licks may be an important source of magnesium during the transition to spring forage.
Interactions between Animals Using Licks and Human Use of the Area Between 27 May and 8 August 2002, we kept daily records of riverboats travelling on the
Tuchodi watershed between the Childers Creek confluence and upper Tuchodi Lake. A total of 67 boats were recorded over the 74-day period. There were two peaks in riverboat use: the first half of June and mid-August (Fig. 18). During the first peak (6-16 June), the river volume increased quickly and allowed access by riverboat enthusiasts for the first time that spring to remote watersheds such as the Tuchodi. Boats were observed sporadically through July with many resident hunters taking advantage of high water to haul heavy camp supplies into hunting camps. Another peak in the number of riverboats was observed on 16 August with the opening of hunting seasons for cervids. From these data, it appears that the most likely periods when human and animal presence overlap are at the end of June during high use of wet licks by elk, and in early August during high use of dry licks by Stone’s sheep and mountain goats.
With increasing human use of the area, and the proximity of licks to the Tuchodi River and Lakes, there is a potential for detrimental disturbance. On one occasion when a riverboat passed in clear sight of a dry lick above the upper Tuchodi Lake ~300 m away, several Stone’s sheep at that lick did not change behaviour as the boat passed. In contrast, during one 6-h observation shift at a well-used dry lick located along the bank of the Upper Tuchodi River, a riverboat passed within 10 m of the lick. Before the boat came into view of the lick, all animals (Stone’s sheep and mountain goats) left the lick and did not return during the remaining 3.5 h of an observation shift, even though the sound of the boat engine had faded. Therefore, there is some level of anthropogenic disturbance to ungulates using licks close to the river.

Muskwa-Kechika Licks
37
D ate12 M ay 26 M ay 09 Jun 23 Jun 07 Ju l 21 Ju l 04 A ug 18 A ug
Num
ber o
f riv
erbo
ats
0
2
4
6
8 B e low LakesLakesA bove Lakes
Figure 18. Observed riverboat presence in the Tuchodi watershed (above Childers Creek confluence), May – August 2002.
CONCLUSIONS We determined periods of important lick use for ungulates in the Tuchodi watershed,
based on intensive behavioural observations from 24 May – 12 August 2002, incorporating both attendance numbers and licking behaviour (Table 14). These periods of high use could change with the timing of spring green-up, and consequently, high use just before or after these dates might be expected. In general, elk exhibited a stronger demand for wet lick soil than moose. High use for elk occurred at the end of May and again at the end of June. The use of licks by elk likely was related to a combination of the need to adjust rumen pH with carbonates during spring forage change, and potentially higher sodium and iron demands associated with lactation. There was a more pronounced use of wet licks by moose later in the summer, which appeared to increase across July. This period was probably too late to be influenced by digestive ailments associated with spring forage change, and could be a response to low dietary levels of sodium and/or iron, or increased plant secondary compounds (e.g., tannins) in high intakes of forage in the summer.
Data on the use of dry licks by Stone’s sheep and mountain goats were highly variable across the months of this study. With the incorporation of data from photographs taken by remote trail cameras at the dry licks, early July appeared to be an important period of lick use by mountain goats and Stone’s sheep, possibly influenced by the late green-up of alpine forage (Table 14). There was a second peak in the use of dry licks by both species in early August. Although sodium demands of lactating females of both species may have been important, many animals may have waited to travel from the alpine to licks at lower elevations until their young were large enough to incur the associated predation risks of this travel.

Muskwa-Kechika Licks
38
Table 14. Potential influences on species-specific peaks in attendance at lick areas in the Tuchodi watershed (May-August 2002).
Species Peak attendance Potential influences
Elk late May forage change late June lactation demands Moose mid-July forage tannins Stone's sheep / Mountain goats early July forage change
early August lactation demands / predation threat
Carbonates were elevated in soil across all licks in the study area. The use of carbonates to minimize the effects of digestive acidosis, and the suggestion that poor condition increases susceptibility to acidosis (Kreulen 1985), implies that access to licks could allow some weak individuals an opportunity to improve their poor condition in a relatively short amount of time. Therefore, licks may provide a means of ameliorating digestive imbalances and elemental deficiencies that would indirectly result in increased mortality through opportunistic factors that follow poor health (e.g., predation) (O’Hare et al. 2001). Because of variations in diet selection and the timing of spring forage change, the timing of greatest elemental deficiencies would be expected to be somewhat variable (Franzmann et al. 1975). Further, if symptoms of acidosis develop to a threshold that stimulates travel to licks, some temporal variability would be expected, particularly if individuals of a population were in different body conditions.
Although sodium concentrations were higher than control sites at all dry licks and in some soil / water samples from wet licks, concentrations of other elements including magnesium were also high at most licks. Our results on chemical analyses of lick soils and variations in ungulate attendance at licks imply that explanations of lick function are not consistent across species and licks
Additional details of all methodologies, analyses, and results can be found in Jeremy Ayotte’s Master of Science thesis at the University of Northern British Columbia (Ayotte 2004).
Recommendations for Future Research Additional research on licks in the Tuchodi watershed may be useful to confirm our results
and expand on these findings. The following topics are suggested: 1) Frequency of lick use, and potential use of alternative licks.
Although we have reasonable data on the numbers of animals visiting licks, timing of lick use, and licking intensity when animals were at licks, our sampling scheme did not allow us to determine the number of times (and how often) individuals

Muskwa-Kechika Licks
39
actually visited licks. Further, low numbers of moose recorded in our observations between 24 May and 19 July may indicate that moose, particularly males, are using the numerous small licks in the area rather than the most obvious wet licks observed during our project. Radio-collaring of a small number of individuals would provide valuable information on frequency of lick use by each ungulate species, and may provide insights into ‘new’ licks.
2) Alternative timing of lick use. Camera data suggest that mountain goats use dry licks during all hours of the day, including nocturnal times. It is also possible that attendance by elk and moose (with potential sex differences) at wet licks might occur at night. Photographs from remote cameras set to capture animals at high-use areas would give insights into this speculation. Radio-collared individuals (as noted above) would also lend support to quantifying timing of use.
3) Impact of hunter presence on lick use. Another field season that extended into August and September might be useful in assessing the potential impact of hunter presence on lick use. Data could be gained from remote trail cameras, but the scope of that information is limited. The use of licks by the four different ungulates species, and any species-specific reactions to disturbance, would probably be much more advanced by maintaining crews in the Tuchodi watershed for a continuous field season.
4) Additional chemical analyses of clay found in lick soils. Although the presence of expandable clays was not detected in our few samples, we suggest that further analyses of clay in lick soils should be pursued, especially given that clay is known to improve palatability and digestibility for other herbivores (Diamond 1999, Krishnamanj and Mahaney 2000), and because of the use of licks by ungulates in the Tuchodi system later in the summer when defense compounds in forage are likely high.

Muskwa-Kechika Licks
40
ACKNOWLEDGEMENTS Support for this study was provided by the Muskwa-Kechika Trust Fund and the
University of Northern British Columbia’s (UNBC) Northern Land Use Institute.
We (Fig. 19) extend particular thanks to Ross Peck who introduced us to the Tuchodi watershed and its history. The use of Ross Peck Outfitting infrastructure (airstrip, trails, cabins, and horses) and support from Dale Gunn, Ross Peck, Larry and Lori Warren, and several members of the riverboating community, enabled a safe and successful field season. We appreciate the dedicated efforts of Angela Anderson, Paddy Hirshfield, and Maggie Shook towards field observations (Fig. 20).
Soil analytical methods were chosen from consultations with Lito Arocena, Dave Dick, Paul Sanborn, and Mike Rutherford at UNBC, and Clive Dawson at the Ministry of Forests Analytical Research Laboratory (Victoria, BC). UNBC soils lab researchers Colin Chisolm, Angela Pilley, and Geoffrey Odongo also helped with laboratory logistics. We are grateful to Mike Gillingham, Doug Heard, and Lito Arocena for ecological and analytical contributions.
Figure 19. Authors Katherine L. Parker and Jeremy B. Ayotte, University of Northern British Columbia.
M. Gillingham

Muskwa-Kechika Licks
41
Figure 20. Personnel conducting behavioural observations of ungulates using mineral licks in the Tuchodi watershed, 2002: Angela Anderson, Maggie Shook, Paddy Hirshfield, and Jeremy Ayotte.
LITERATURE CITED Ayotte, J.B. 2004. Ecological importance of licks to four ungulate species in north-central British
Columbia. MSc. Thesis. University of Northern British Columbia, Prince George, British Columbia.
Bryant, J.P., and P.J. Kuropat. 1980. Selection of winter forage by subarctic browsing
vertebrates: the role of plant chemistry. Ann. Rev. Ecol. Syst. 11: 261-85. Bubenik, A.B. 1982. Physiology. In Elk of North America: ecology and management. Edited by
J.W. Thomas, D.E. Toweill. Stackpole Books. Harrisburg, Pennsylvania. Pp. 125-179. Chamberlain, L.C., H.R. Timmerman, B. Snider, F. Dieken, B. Loescher, and D. Fraser. 1977.
Physical and chemical characteristics of some natural licks used by big game animals in northern Ontario. Proc. North American Moose Conf. and Workshop, 13: 200-214.
Church, D.C. 1975. Digestive physiology and nutrition of ruminants. O & B Books, Corvalis,
Oregon. Diamond, J. M. 1999. Dirty eating for healthy living. Nature, 400: 120-121.
E. Jones

Muskwa-Kechika Licks
42
Dormaar, J.F., and B.D. Walker. 1996. Elemental content of animal licks along the eastern slopes
of the Rocky Mountains in southern Alberta, Canada. Can. J. Soil Sci. 76: 509-512. Fort Nelson LRMP Working Group. 1997. Fort Nelson Land and Resource Management Plan.
Report to the British Columbia provincial government (http://srmwww.gov.bc.ca/rmd/lrmp/frtnelsn/toc.htm).
Fraser, D., and H. Hristienko. 1981. Activity of moose and white-tailed deer at mineral springs.
Can. J. Zool. 59: 1991-2000. Franzmann, A.W., A. Flynn, and P.D. Arneson. 1975. Levels of some mineral elements in
Alaskan moose hair. J. Wildl. Manage. 39: 374-378. Hebert, D., and I. McTaggart Cowan. 1971. Natural salt licks as part of the ecology of the
mountain goat. Can. J. Zool. 49: 605-610. Heimer, W.E. 1973. Dall sheep movements and mineral lick use. Alaska Dep. Fish and Game.
Project W-17-2, W-17-3, W-17-4, W-17-5. Fairbanks, Alaska. 35 pp. Heimer, W.E. 1988. A magnesium-driven hypothesis of Dall sheep mineral lick use: Preliminary
tests and management relevance. Proc. Bienn. Symp. North Wild Sheep Goat Council, 6: 269-278.
Hellgren, E.C., and W.J. Pitts. 1997. Sodium economy in white-tailed deer (Odocoileus
virginianus). Physiol. Zool. 70: 547-555. Jones, R.L., and H.C. Hanson. 1985. Mineral licks geophagy and biochemistry of North
American ungulates. Iowa State University Press, Ames, Iowa. 301 pp. Kalra, Y.P. and D.G. Maynard. 1991. Methods for forest soil and plant analysis. Information
report NOR-X-319. Forestry Canada, Northwest Region. Klaus, G., and B. Schmid. 1998. Geophagy at natural licks and mammal ecology: a review.
Mammalia, 62: 481-497. Knight, R.R., and M.R. Mudge. 1967. Characteristics of some natural licks in the Sun River area,
Montana. J. Wildl. Manage. 31: 293-298. Kreulen, D.A. 1985. Lick use by large herbivores: a review of benefits and banes of soil
consumption. Mammal Rev. 15: 107-123. Krishnamanj, R., and W.C. Mahaney. 2000. Geophagy among primates; adaptive significance
and ecological consequence. Anim. Beh. 59: 899-915.

Muskwa-Kechika Licks
43
Lintzenich, B.A., and A.M. Ward. 1997. Hay and pellet ratios: considerations in feeding ungulates. In Nutrition advisory group handbook. Fact Sheet 006. Edited by D.E. Ullrey, M.R. Murphy, and E.T. Clemens. Chicago Zoological Society, Brookfield Zoo, Chicago, Illinois. Pp. 1-12.
Nelson, J.R., and T.A. Leege. 1982. Nutritional requirements and food habits. In Elk of North
America: ecology and management. Edited by J.W. Thomas, and D.E. Toweill. Stackpole Books. Harrisburg, Pennsylvania. pp. 323-367.
NRC (National Research Council). 1996. Nutrient requirements of beef cattle, 6th edition.
National Academy Press, Washington, D.C. O’Hara, T.M., G. Carroll, and P. Barboza. 2001. Mineral and heavy metal status as related to a
mortality event and poor recruitment in a moose population in Alaska. J. Wildife Dis. 37: 509-522.
Ohlson, M., and H. Stalaand. 2001. Mineral diversity in wild plants: benefits and bane for
moose. Oikos, 94: 442-454. Peck, R. 1987. Responses of elk and vegetation to prescribed fire in the Tuchodi River area of
northeastern British Columbia. MSc. Thesis. University of Idaho, Moscow, Idaho. Reisenhoover, K.L., and R.O. Peterson. 1986. Mineral licks as a sodium source for Isle Royale
moose. Oecologia, 71: 121-126. Robbins, C.T., R.S. Podbielancik-Norman, D.L. Wilson, and E.D. Mould. 1981. Growth and
nutrient consumption of elk calves compared to other ungulate species. J. Wildl.Manage. 45: 172-186.
Sen Tran, T., and R.R. Simard. 1993. Mehlich III method. In Soil sampling and methods of
analysis. Edited by M.R. Carter. Lewis Publishing, CRC Press Inc. Boca Raton, Florida. Pp. 43-48.
Shackleton, D. 1999. Hoofed Mammals of British Columbia. UBC Press. Vancouver, British
Columbia. 267 pp. Singer, F.J. 1978. Behaviour of mountain goats in relation to U.S. Highway 2, Glacier National
Park, Montana. J. Wildl. Manage. 42: 591-597. Staaland, H., R.G. White, J.R. Luick, and D.F. Holleman. 1980. Dietary influences on sodium
and potassium metabolism of reindeer. Can. J. Zool. 58: 1728-1734. Stockstad, D.S. 1950. The chemical characterization of natural licks used by big game animals in
western Montana. MSc. Thesis. Montana State University. Bozeman, Montana.

Muskwa-Kechika Licks
44
USDA (US Department of Agriculture). 1954. Acid neutralization procedure. In Saline and Alkali Soils. Handbook 60.
Watts, T.J., and S.D. Shemnitz. 1985. Mineral lick use and movement in a remnant desert
Bighorn sheep population. J. Wildl. Manage. 49: 994-996. Weeks, H.P., Jr., and C.M. Kirkpatrick. 1976. Adaptions of white-tailed deer to naturally
occurring sodium deficiencies. J. Wildl. Manage. 40: 610-625. Whittig, L.D. 1965. X-ray diffraction techniques for mineral identification and mineralogical
composition. In Methods of soil analysis Part 1: Physical and mineralogical properties, including statistics of measurement and sampling. Edited by C.A. Black. American Society of Agronomy Inc. Madison, Wisconsin. Pp. 671-698.
Williams, T.R. 1962. The significance of salt and natural licks in elk management. MSc. Thesis.
University of Idaho, Moscow, Idaho. ** Corrections to chemical Tables 6-9, 12-13 were made in November 2006.