earth sciences research journal - … · topografía; fotogrametría; teledetección; sistemas de...
TRANSCRIPT

This work analyses soil loss over the last 150 years due to urban growth in one of the boroughs of highest environmental value around Madrid (Spain), i.e. Colmenar Viejo. The extent and patterns followed by urban extension are examined retrospectively using a present cartographic base layer. This evolutionary approach considering space and time has required a thorough compilation of cartographic sources that were created using classic topography, photogrammetry or remote sensing, some of which have been rarely used so far. These documents have been georeferenced, edited and handled using Geographic Information Systems (GIS) and remote sensing programs. Urban growth in Colmenar Viejo has been steady, has registered exponential increases (soil sealing affected 0.14% of the total municipal territory in 1861 and covers 2.64% nowadays) and has followed similar patterns to other Spanish towns influenced by metropolitan processes.
ABSTRACTKeywords: Soil sealing; cartography; topography; photogrammetry; remote sensing; Geographic Information Systems (GIS).
Soil sealing in Madrid (Spain), study case of Colmenar Viejo
ISSN 1794-6190 e-ISSN 2339-3459 http://dx.doi.org/10.15446/esrj.v21n3.51450
Andrés Aristegui Cortijo1*, María Eugenia Pérez González2
1*Instituto Nacional Geográfico de España.2 Universidad Complutense de Madrid
EARTH SCIENCES RESEARCH JOURNAL
Earth Sci. Res. J. Vol. 21, No. 3 (September, 2017): 111-116
Este trabajo analiza la pérdida de suelo en los últimos 150 años debido al crecimiento urbano en uno de los municipios de mayor valor ambiental de Madrid (España), Colmenar Viejo. La extensión y los patrones seguidos por la expansión urbana se examinan retrospectivamente usando una capa base cartográfica actual. Este enfoque evolutivo que considera el espacio y el tiempo, ha requerido una recopilación completa de fuentes cartográficas, que fueron creadas usando la topografía clásica, la fotogrametría o la teledetección, algunas de las cuales han sido raramente utilizadas hasta ahora. Estos documentos han sido georeferenciados, editados y manipulados utilizando Sistemas de Información Geográfica (GIS) y programas de teledetección. El crecimiento urbano en Colmenar Viejo ha sido estable, ha registrado aumentos exponenciales (el sellado del suelo afectó al 0,14% del territorio municipal total en 1861 y cubre el 2,64% en la actualidad), y ha seguido patrones similares a otros pueblos españoles influenciados por procesos metropolitanos.
RESUMEN Palabras clave: Sellado del suelo; cartografía; topografía; fotogrametría; teledetección; Sistemas de Información Geográfica.
RecordManuscript received: 23/06/2015Accepted for publication: 30/06/2017
How to cite itemAristegui, C. A., & Perez, G. M. E. (2017). Soil sealing in Madrid (Spain), study case of Colmenar Viejo. Earth Sciences Research Journal, 21(3), 111-116.doi: http://dx.doi.org/10.15446/esrj.v21n3.51450
GE
OL
OG
ICA
L E
NG
INE
ER
ING
Sellado de suelo en Madrid (España). El caso de estudio de Colmenar Viejo
112 Andrés Aristegui Cortijo, María Eugenia Pérez González
Introduction
Major demographic changes have taken place in Europe since the 19th century. This social evolution has resulted on a relevant urban growth and on significant transformations on land use and land cover (Meirich, 2008). These variations can be approached from several disciplines since they are fostered by complex processes. However, in this specific study these changes have been analysed from a cartographic and geographic perspective.
Soil sealing is one of the main consequences of urban growth. This is a matter of grave concern as it entails ground waterproofing and leads to almost irreversible damages on soil ecosystems (Nizeyimana, et al, 2001; Montanarella, 2007; Scalenghe & Ajmone-Marsan, 2009; EEA, 2012; Siedentop & Fina, 2012). Spatio-temporal dynamics of soil sealing have been regularly studied with the use of 20th century maps, aerial photographs, orthophotographs and satellite images (Ridd, 1995; Zhang, 2001; Wu, 2004; Moeller, 2005; Kampouraki et al., 2006, etc.). However, the use of information predating the mid-20th century is rather unusual since only a few organisations have digitised ancient documents on a large scale and made them accessible to the general public. Instead, this study has included 19th century maps provided by the National Geographic Institute of Spain (IGN). They have been used to analyse patterns of urban growth and the extent to which land has been lost to sealing over the last 150 years in a borough located in the outskirts of Madrid. This is a rather innovative approach that enables this retrospective analysis to be extended in time an additional century to what is usually considered. The effects of soil sealing resulting from urban growth are intensely felt in Spain on coastal regions (Ojeda & Villar, 2006; Valera et al., 2011a) and on major metropolitan areas, like Madrid (García & Pérez, 2007, 2011 and 2016; García et al., 2014).
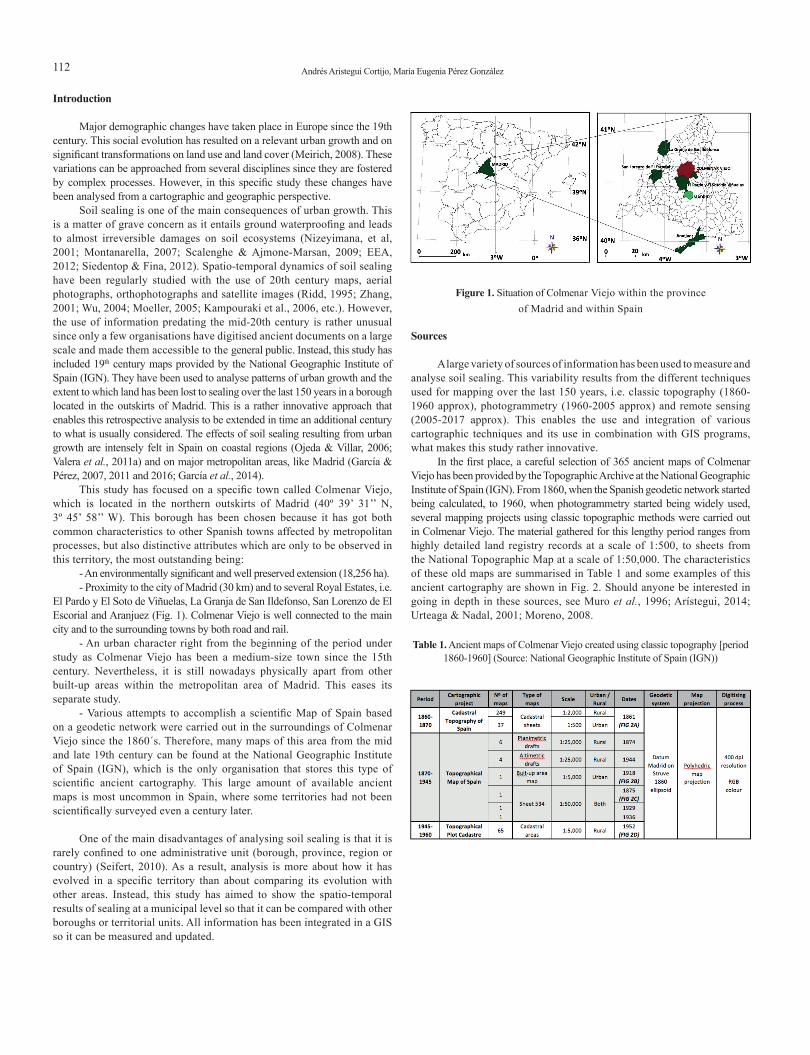
This study has focused on a specific town called Colmenar Viejo, which is located in the northern outskirts of Madrid (40º 39’ 31’’ N, 3º 45’ 58’’ W). This borough has been chosen because it has got both common characteristics to other Spanish towns affected by metropolitan processes, but also distinctive attributes which are only to be observed in this territory, the most outstanding being:
- An environmentally significant and well preserved extension (18,256 ha).- Proximity to the city of Madrid (30 km) and to several Royal Estates, i.e.
El Pardo y El Soto de Viñuelas, La Granja de San Ildefonso, San Lorenzo de El Escorial and Aranjuez (Fig. 1). Colmenar Viejo is well connected to the main city and to the surrounding towns by both road and rail.
- An urban character right from the beginning of the period under study as Colmenar Viejo has been a medium-size town since the 15th century. Nevertheless, it is still nowadays physically apart from other built-up areas within the metropolitan area of Madrid. This eases its separate study.
- Various attempts to accomplish a scientific Map of Spain based on a geodetic network were carried out in the surroundings of Colmenar Viejo since the 1860´s. Therefore, many maps of this area from the mid and late 19th century can be found at the National Geographic Institute of Spain (IGN), which is the only organisation that stores this type of scientific ancient cartography. This large amount of available ancient maps is most uncommon in Spain, where some territories had not been scientifically surveyed even a century later.
One of the main disadvantages of analysing soil sealing is that it is rarely confined to one administrative unit (borough, province, region or country) (Seifert, 2010). As a result, analysis is more about how it has evolved in a specific territory than about comparing its evolution with other areas. Instead, this study has aimed to show the spatio-temporal results of sealing at a municipal level so that it can be compared with other boroughs or territorial units. All information has been integrated in a GIS so it can be measured and updated.
Figure 1. Situation of Colmenar Viejo within the province of Madrid and within Spain
Sources
A large variety of sources of information has been used to measure and analyse soil sealing. This variability results from the different techniques used for mapping over the last 150 years, i.e. classic topography (1860-1960 approx), photogrammetry (1960-2005 approx) and remote sensing (2005-2017 approx). This enables the use and integration of various cartographic techniques and its use in combination with GIS programs, what makes this study rather innovative.
In the first place, a careful selection of 365 ancient maps of Colmenar Viejo has been provided by the Topographic Archive at the National Geographic Institute of Spain (IGN). From 1860, when the Spanish geodetic network started being calculated, to 1960, when photogrammetry started being widely used, several mapping projects using classic topographic methods were carried out in Colmenar Viejo. The material gathered for this lengthy period ranges from highly detailed land registry records at a scale of 1:500, to sheets from the National Topographic Map at a scale of 1:50,000. The characteristics of these old maps are summarised in Table 1 and some examples of this ancient cartography are shown in Fig. 2. Should anyone be interested in going in depth in these sources, see Muro et al., 1996; Arístegui, 2014; Urteaga & Nadal, 2001; Moreno, 2008.
Table 1. Ancient maps of Colmenar Viejo created using classic topography [period 1860-1960] (Source: National Geographic Institute of Spain (IGN))
113Soil sealing in Madrid (Spain), study case of Colmenar Viejo
Figure 2. Examples of ancient maps of Colmenar Viejo created using classic topography [period 1860-1960] (Source: National Geographic
Institute of Spain (IGN))
In the second place, the period from 1960 to 2005 has been analysed by means of visually interpreting some aerial photographs. These images have been chosen from various photogrammetric flights, one per decade. They were captured at different scales, varying from 1:18,000 to 1:40,000, on analogue or digital formats, and on a colour or on a black & white scale, as shown on Table 2.
Table 2. Aerial photographs [period 1960-2005] (Source: National Geographic Institute of Spain (IGN))
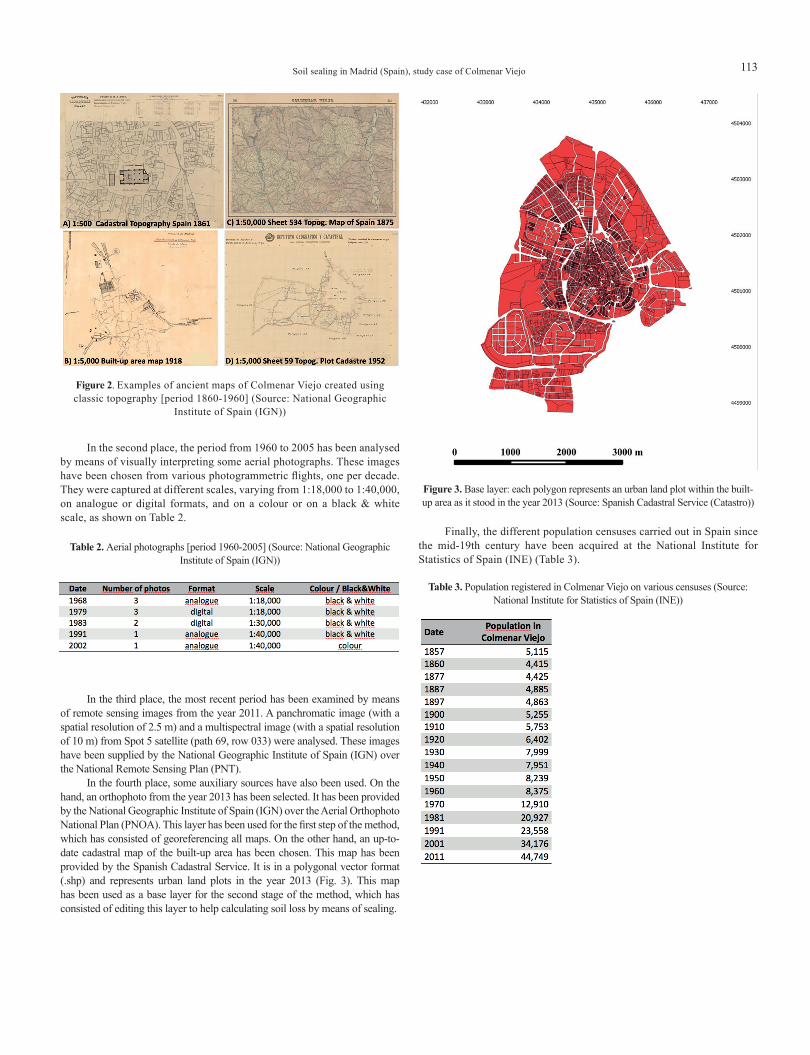
Figure 3. Base layer: each polygon represents an urban land plot within the built-up area as it stood in the year 2013 (Source: Spanish Cadastral Service (Catastro))
Finally, the different population censuses carried out in Spain since the mid-19th century have been acquired at the National Institute for Statistics of Spain (INE) (Table 3).
Table 3. Population registered in Colmenar Viejo on various censuses (Source: National Institute for Statistics of Spain (INE))
In the third place, the most recent period has been examined by means of remote sensing images from the year 2011. A panchromatic image (with a spatial resolution of 2.5 m) and a multispectral image (with a spatial resolution of 10 m) from Spot 5 satellite (path 69, row 033) were analysed. These images have been supplied by the National Geographic Institute of Spain (IGN) over the National Remote Sensing Plan (PNT).
In the fourth place, some auxiliary sources have also been used. On the hand, an orthophoto from the year 2013 has been selected. It has been provided by the National Geographic Institute of Spain (IGN) over the Aerial Orthophoto National Plan (PNOA). This layer has been used for the first step of the method, which has consisted of georeferencing all maps. On the other hand, an up-to-date cadastral map of the built-up area has been chosen. This map has been provided by the Spanish Cadastral Service. It is in a polygonal vector format (.shp) and represents urban land plots in the year 2013 (Fig. 3). This map has been used as a base layer for the second stage of the method, which has consisted of editing this layer to help calculating soil loss by means of sealing.

114 Andrés Aristegui Cortijo, María Eugenia Pérez González
Method
The first step of the method has included changing all maps to a raster format and georeferencing them in datum ETRS89, projection UTM, zone 30 T, which is the official reference system in central Spain at present. This process has been carried out with Global Mapper 14 GIS program, using the 2013 orthophoto as a base layer. Between 30 and 50 control points have been assigned to each map. These control points have been located in places that seem to have remained invariable over the last decades. Afterwards a rubber-sheeting conversion with triangulation has been used and rotations, transformations and changes in local and directional scales have been applied. Mean RMS at control points has been 3.4 m. All control points with a RMS above 6 m have not been taken into account. Finally, georeferenced maps have been saved in .ecw format.
The second stage of the method has included part of the method proposed by Valera et al. (2011 b). First, the urban area has been analysed using maps dating from 1861, 1918 and 1952, photos from 1968, 1979, 1983, 1991 and 2002, and satellite images from 2011. Second, the 2013 cadastral base layer, downloaded on Global Mapper 14 GIS application, has been progressively edited in inverse chronological order by means of visually interpreting maps, photos and satellite images for each date. As the process has gone back in time, plot erasing has always been needed (it has never been necessary to add them) since the built-up area has always shown an increase with time, never a decrease.
Due to the differing nature of mapping techniques, certain decisions had to be taken. On the one hand, spectral analysis using Erdas Imagine 2011 remote sensing program has been used to edit the 2013 cadastral base layer with respect to the 2011 satellite image. On the other hand, to estimate the urban area in 1952, for which only rural maps were available, it has been necessary to erase those plots that appeared on the 1968 edited base layer, but not on the 1952 map. However, the territory comprising the urban area could not be modified because no information from 1952 was available. Therefore they have been left the same as they were in 1968. Also the variability in the different urban units represented on ancient maps had to be overcome. For instance, when it came to adjusting the base layer to the urban area in 1918, maps referred to city blocks and not to land plots. In other words, the available information was less detailed on the 1918 map than on the base layer, since each block includes several plots. Less spatial information meant that blocks had to be edited as a whole as it was not possible to discriminate information related to each plot.
The third level of the method has included analysing patterns and determining urban growth by means of using ArcGIS10.1 GIS program. In this regard, Pinho & Oliveira, 2009 and Tombolini et al., 2015 have been consulted. Two aspects have been assessed:
- Two-dimensional growth considering only the x and y axis. These calculations help examining the extent of soil sealing in quantitative terms. The sealed soil area (in hectares), the sealing increase between consecutive dates (in percentages), the mean annual sealing growth (in hectares per year) and the sealed soil among the total municipal territory (in percentages) have been calculated for each date.
- Three-dimensional growth considering also the z axis. These figures help analysing the patterns followed by urban extension from a qualitative perspective. Since building heights were not represented on maps and there was therefore a lack of information, this analysis has been based on auxiliary information related directly to vertical growth, i.e. population and population density. Population of the town for each date from 1861 to 2011 has been obtained from a linear function between the two population censuses closest in time. Population density for each date has been determined by dividing the estimated population by the urban area. Three-dimensional urban growth has been calculated by means of the following parameters: population (in inhabitants), population increase between consecutive dates (in percentages), mean annual population growth (in inhabitants per year), population density (in inhabitants per sq km) and population density mean annual increase (in percentages).
The fourth step of the method has consisted of examining the territory in situ and verifying the obtained figures and calculations.
Results
The main calculations related to soil sealing and the characteristics of urban growth have been summarised in Table 4 and Fig. 4.
Table 4. Two-dimensional and three-dimensional growth
With respect to the two-dimensional growth of the urban area, which refers to the extent of the process from a quantitative perspective, the following should be noted:
- The old town was small in relation to the present-day built-up area. In 1861 it comprised 25.3 hectares, i.e. only 0.14% of the municipal territory.
- From 1861 to 1918 urban growth was subdued, with a total increase in the built-up area of 40%, which implies a mean annual growth of less than 0.20 hectares. This means that the loss of soil due to sealing in Colmenar Viejo affected hardly 0.19% of the municipal territory by 1918.
- From 1952 to 1991 a considerable urban extension took place and thus the built-up area of the town easily tripled. Mean annual growth showed ever greater increases, going from 3 hectares/year at the initial time to nearly 6 hectares/year at the final stage. At the beginning of the 1990´s, 1.31% of the municipal territory was covered by built-up area.
- The greatest urban growth has taken place over the last two decades. From 1991 to 2011 the built-up area has doubled, with a mean annual growth of between 9 and 16 hectares. At the end of the period, the percentage of sealed soil has already reached 2.64%.
Therefore, the two-dimensional growth of the built-up area throughout the period under study has been both progressive, i.e. all periods have recorded positive increases, and exponential, i.e. the mean annual growth has increased over an ever larger area. The urban area has doubled in size during the period of fastest growth which comprises only twenty years, i.e. from 1991 to 2011. As a result, 2.64% of the municipal territory is now sealed as a consequence of urban processes. This percentage is lower than in other European cities, where soil sealed from 1990 to 2006 within a range of 6% to 9% (EEA, 2012), and it is also lower than in other boroughs within the Region of Madrid, where these figures vary from 8.5% to 13.5% (García et al., 2014). These discrete figures are probably related to the proximity of Colmenar Viejo to some Royal Estates and the influence of their environmental protection. It could therefore be concluded that the data recorded in Colmenar Viejo should not give rise to much concern. However, it should also be borne in mind that since the borough under study covers the second largest
115Soil sealing in Madrid (Spain), study case of Colmenar Viejo
municipal territory within the Region of Madrid, small quantities in relative terms are highly significant in absolute terms.
•1952-1968: detached houses for holiday home use •1979-1991: detached and semi-detached houses with ample gardens •2002-2011: vast urban extension and exorbitant soil sealing;
extensive residential fabric with a predominance of houses over blocks
Conclusions
This study has analysed the spatio-temporal dynamics and has enabled the measuring of the soil sealing process due to urban growth over the last 150 years in a borough located in the northern outskirts of Madrid, i.e. Colmenar Viejo. This town is one of the boroughs of highest environmental value around the capital city of Spain and has got both common characteristics to other Spanish towns influenced by metropolitan processes and specific attributes that are only to be observed in this territory.
The sources and the method used in this study are rather innovative. On the one hand, most soil sealing analysis only consider maps since the mid-20th century. Instead, this study has enabled this retrospective study to go back in time an additional century with the use of 19th century maps obtained from the National Geographic Institute of Spain (IGN). On the other hand, integrating in a GIS program a large volume of maps made by different cartographic techniques, i.e. classic topography, photogrammetry and remote sensing, has guaranteed the capture of a detailed and reliable urban cartography since the mid-19th century and has enabled the use and integration of various mapping techniques. Furthermore, this study has aimed to show the spatio-temporal results of sealing at a municipal level so that it can be measured, updated and compared with other boroughs or territorial units.
Calculating the extension of urban growth from a quantitative perspective has been fulfilled by georeferencing ancient maps, digital maps, aerial photographs and satellite images, integrating them into a GIS program and analysing some parameters regards the two-dimensional urban extension. Observing the patterns followed by urban growth from a qualitative point of view has been achieved by using population censuses accomplished since the mid-19th century and using an indicator system to analyse the three-dimensional urban growth.
Part of Valera´s et al. (2011b) method for editing and adjusting maps to the urban area according to different dates has been used. On the one hand, always using the same layer as the base map avoids slivers. On the other hand, using a vector layer for a plot detail provides accurate and precise information for quantifying and analysing urban growth.
Results show that, in terms of quantity, urban growth has been both progressive, i.e. all periods have recorded positive increases, and exponential, i.e. the mean annual growth has increased over an ever larger area. Along the whole period, urban extension has increased from 25.3 hectares to 482.5 hectares, i.e. from 0.14% to 2.64% of the municipal territory, what means multiplying 19-fold its size. The trend followed by urban growth has been therefore similar to other Spanish towns influenced by metropolitan processes. However, the intensity of this process has remained slightly under the European and Madrilian average, which is probably related to its proximity to some Royal Estates, what has conferred this territory a stronger environmental protection.
In terms of quality, the patterns observed on urban extension comply with the general urban growth model recorded during the 20th and 21st centuries in the outskirts of major Spanish cities.
AcknowledgmentsThis paper has been supported by the Science and Innovation Office
of the Spanish Government under the research program CSO-2012-34785, called “Sellado de suelo en la Comunidad de Madrid y áreas limítrofes. Estudio mediante teledetección y sistemas de información geográfica (Soil sealing in Madrid and surrounding areas. Analysis using remote sensing programs and geographic information systems)”.
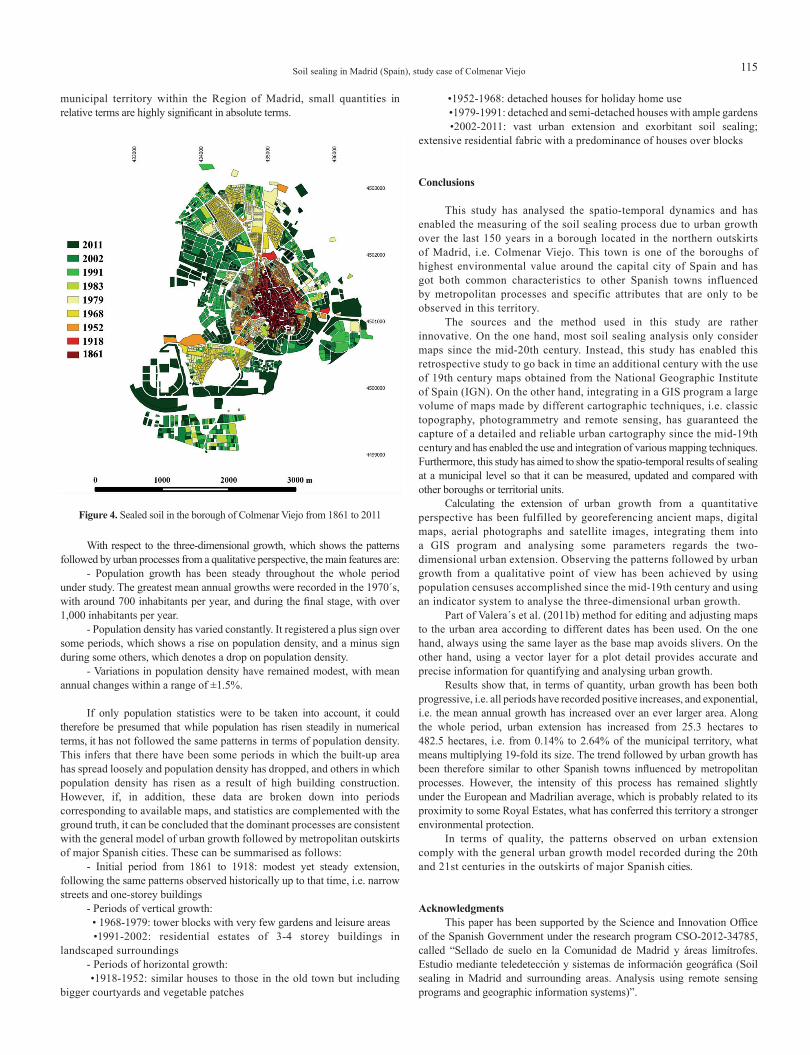
Figure 4. Sealed soil in the borough of Colmenar Viejo from 1861 to 2011
With respect to the three-dimensional growth, which shows the patterns followed by urban processes from a qualitative perspective, the main features are:
- Population growth has been steady throughout the whole period under study. The greatest mean annual growths were recorded in the 1970´s, with around 700 inhabitants per year, and during the final stage, with over 1,000 inhabitants per year.
- Population density has varied constantly. It registered a plus sign over some periods, which shows a rise on population density, and a minus sign during some others, which denotes a drop on population density.
- Variations in population density have remained modest, with mean annual changes within a range of ±1.5%.
If only population statistics were to be taken into account, it could therefore be presumed that while population has risen steadily in numerical terms, it has not followed the same patterns in terms of population density. This infers that there have been some periods in which the built-up area has spread loosely and population density has dropped, and others in which population density has risen as a result of high building construction. However, if, in addition, these data are broken down into periods corresponding to available maps, and statistics are complemented with the ground truth, it can be concluded that the dominant processes are consistent with the general model of urban growth followed by metropolitan outskirts of major Spanish cities. These can be summarised as follows:
- Initial period from 1861 to 1918: modest yet steady extension, following the same patterns observed historically up to that time, i.e. narrow streets and one-storey buildings
- Periods of vertical growth: • 1968-1979: tower blocks with very few gardens and leisure areas •1991-2002: residential estates of 3-4 storey buildings in
landscaped surroundings- Periods of horizontal growth: •1918-1952: similar houses to those in the old town but including
bigger courtyards and vegetable patches

116 Andrés Aristegui Cortijo, María Eugenia Pérez González
References
Arístegui, A. (2014). Los trabajos topográfico-parcelarios de la Junta General de Estadística en Boadilla del Monte (Madrid) [1863- 1868]. CT Catastro, 80, pp. 7-87.
European Environment Agency (2012). Documento de trabajo de los servicios de la Comisión. Directrices sobre mejores prácticas para limitar, mitigar o compensar el sellado del suelo. Bruselas, 15.5.2012, SWD (2012) 101 nal/2.
García Rodríguez, M. P. & Pérez González, M. E. (2007). Changes in soil sealing in Guadalajara: cartography with Landsat images. Science of total Environment, 41. DOI: 10.1016/j.scitotenv.2007.01.048.
García Rodríguez, M. P. & Pérez González, M. E. (2011). Sellado de fluvisoles en la Comunidad de Madrid. Análisis a partir de imágenes Landsat. Anales de Geografía, 31 (2), 125–137.
García Rodríguez, M. P., Pérez González, M. E. & Guerra Zaballos, A. M. (2014). Using TM images to detect soil sealing change in Madrid (Spain). Geoderma, 214–215, 135–140.
García Rodríguez, M. P. & Pérez González, M. E. (2016). Mapping of soil sealing by vegetation indexes and built-up index: A case study in Madrid (Spain). Geoderma, 268, 100-107.
Kampouraki, M., Wood, G. & Brewer, T. (2006). The application of remote sensing to identify and measure sealed areas in urban environments. In: Proceedings from ISPRS 1st International Conference on Object- Based Image Analysis (OBIS 2006) Workshop Proceedings, Saltzberg, Austria.
Meirich, S. (2008). Mapping Guide for a European Urban Atlas. GSE Land Consortium.
Moeller, M. (2005). Remote Sensing for the monitoring of urban growth patterns. In: Proceedings of the ISPRS Joint Conference URBAN/URS. AZ, USA, Tempe.
Montanarella, L. (2007). Trends in land degradation in Europe. In: Climate and land degradation. Germany, Springer-Heidelberg, Sivakumar MVK, Ndegwa N, Edit., pp. 83-104.
Moreno, T. (2008). Breve crónica de un siglo de catastro en España (1906-2002). CT Catastro, 63, pp. 31-60.
Muro, I., Nadal, F. & Urteaga, L. (1996). Geografía, estadística y catastro en España. Barcelona, El Serbal.
Nizeyimana, E. L., Petersen, G. W., Imhoff, M. L., Sinclair Jr., H. R., Waltman, S.W., Reed-Margetan, D. S., Levine, E. R. & Russo, J. M. (2001). Assessing the impact of land conversion to urban use on soils with different productivity levels in the USA. Soil Science Society of America Journal, 65, pp. 391-402.
Ojeda Zújar, J. & Villar Lama, A. (2006). Evolución del suelo urbano alterado en el litoral de Andalucía. 1988-2002. Revista Internacional de Ciencia y Tecnología de la Información Geográfica, 7, pp. 73-99.
Pinho, P. & Oliveira, V. (2009). Cartographic analysis in urban morphology. Environment and planning. B, Planning & Design, 36, 107-127.
Ridd, M. K. (1995). Exploring a V–I–S (vegetation –impervious surface– soil) model for urban ecosystem analysis through remote sensing: comparative anatomy for cities. International Journal of Remote Sensing, 16, 2165- 2185.
Scalenghe, R. & Ajmone-Marsan, F. (2009). The anthropogenic sealing of soils in urban areas. Landscape and Urban Planning, 90/1-2, 1-10.
Seifert, F.M. (2010). 11 Improving Urban Monitoring toward European Urban Atlas. Global Mapping of Human Settlement: Experiences, Datasets, and Prospects, 231.
Siedentop, S. & Fina, S. (2012). Who sprawls most? Exploring the patterns of urban growth across 26 European countries. Environment and Planning, A44(11), 2765 – 2784.
Urteaga, L. & Nadal, F. (2001). Las series del mapa topográfico de España, escala 1:50.000. Madrid, Centro Nacional de Información Geográfica.
Tombolini, I., Munafò, M. & Salvati, L. (2015). Soil sealing footprint as an indicator of dispersed urban growth: a multivariate statistics approach. Urban Research & Practice, Taylor & Francis.
Valera Lozano, A., Añó Vidal, C. & Sánchez Díaz, J. (2011a). Crecimiento urbano (1956-2005) y sellado antropogénico del suelo en el municipio de Alacant. Serie Geográfica, 17, 97-08.
Valera Lozano, A., Añó Vidal, C. & Sánchez Díaz, J. (2011b). Cincuenta años (1956-2006) de crecimiento urbano y degradación de suelos por sellado antropogénico en el término municipal de Valencia. Anales de Geografía de la Universidad Complutense de Madrid, 31/2, 177-191.
Wu, C. (2004). Normalized spectral mixture analysis for monitoring urban composition using ETM+ imagery”. Remote Sensing of Environment, 93, 480-492.
Zhang, Y. (2001). Detection of urban housing development by fusing multisensor satellite data and performing spatial feature post- classification. International Journal of Remote Sensing, 22/17, 3339 - 3355.