e.5.e.–rainforests and desert: distribution, uses, and human influences… · 2018-06-20 · 2...
TRANSCRIPT
Student EditionCalifornia Education and the Environment Initiative
Rainforests and Deserts: Distribution, Uses, and
Human Influences
Earth ScienceStandard
E.5.e.
E

California Education and the Environment InitiativeApproved by the California State Board of Education, 2010
The Education and the Environment Initiative Curriculum is a cooperative endeavor of the following entities:California Environmental Protection Agency
California Natural Resources Agency
California State Board of Education
California Department of Education
Department of Resources Recycling and Recovery (CalRecycle)
Key Partners:Special thanks to Heal the Bay, sponsor of the EEI law, for their partnership
and participation in reviewing portions of the EEI curriculum.
Valuable assistance with maps, photos, videos and design was provided by the
National Geographic Society under a contract with the State of California.
Office of Education and the Environment1001 I Street • Sacramento, California 95814 • (916) 341-6769
http://www.CaliforniaEEI.org
© Copyright 2011 by the California Environmental Protection Agency© 2018 Third Edition
All rights reserved. This publication, or parts thereof, may not be used or reproduced without
permission from the Office of Education and the Environment.
These materials may be reproduced by teachers for educational purposes.
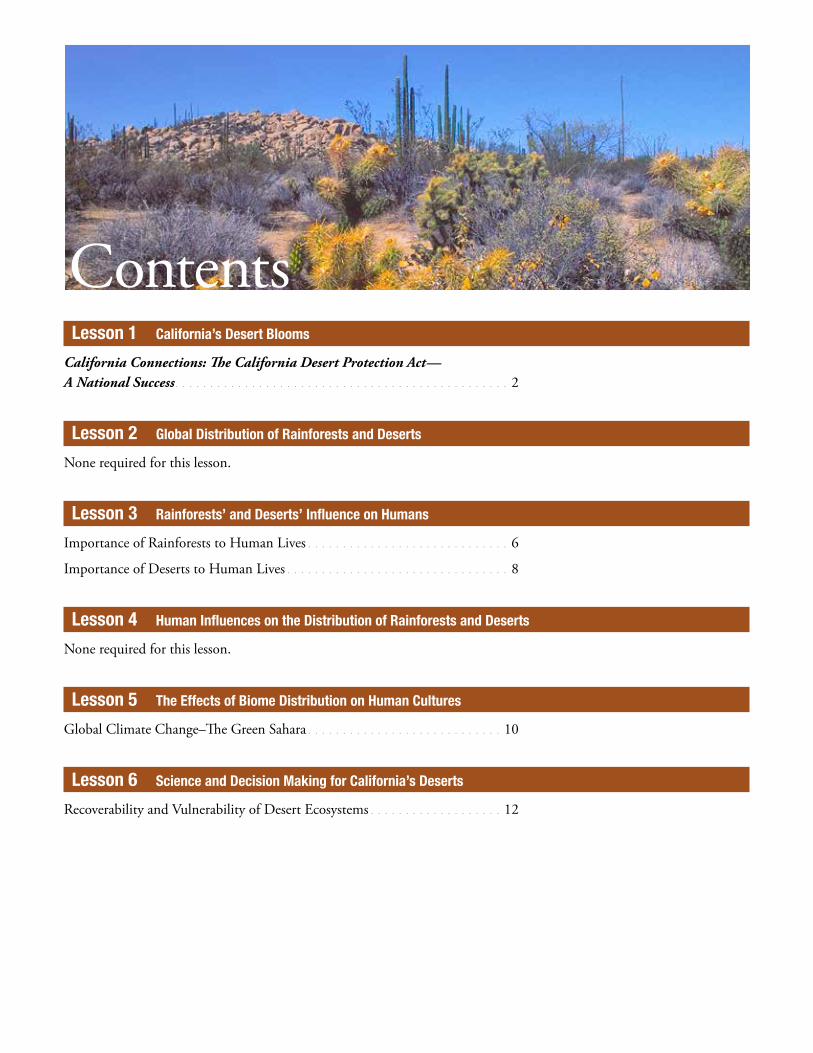
Lesson 1 California’s Desert Blooms
California Connections: The California Desert Protection Act— A National Success 2
Lesson 2 Global Distribution of Rainforests and Deserts
None required for this lesson
Lesson 3 Rainforests’ and Deserts’ Influence on Humans
Importance of Rainforests to Human Lives 6
Importance of Deserts to Human Lives 8
Lesson 4 Human Influences on the Distribution of Rainforests and Deserts
None required for this lesson
Lesson 5 The Effects of Biome Distribution on Human Cultures
Global Climate Change–The Green Sahara 10
Lesson 6 Science and Decision Making for California’s Deserts
Recoverability and Vulnerability of Desert Ecosystems 12
Contents
2 CALIFORNIA EDUCATION AND THE ENVIRONMENT INITIATIVE I Unit E.5.e. I Rainforests and Deserts: Distribution, Uses, and Human Influences I Student Edition
The passage of the California Desert Protection Act in 1994 was the culmination
of a nine-year legal battle by conservationists seeking legislation to protect desert
habitat in California and other parts of the American Southwest. The act survived
four filibusters in the U.S. Senate, finally passing a day after the regularly scheduled
adjournment date of the 103rd Congress, without a vote to spare.
The California Desert Protection Act— A National Success
area wonder what prompted conservationists to protect California’s deserts. Those who know the region can tell you; it is an area rich with unique plants and animals, geological resources, and a place of great scenic beauty.
California’s DesertsDeserts across Earth share
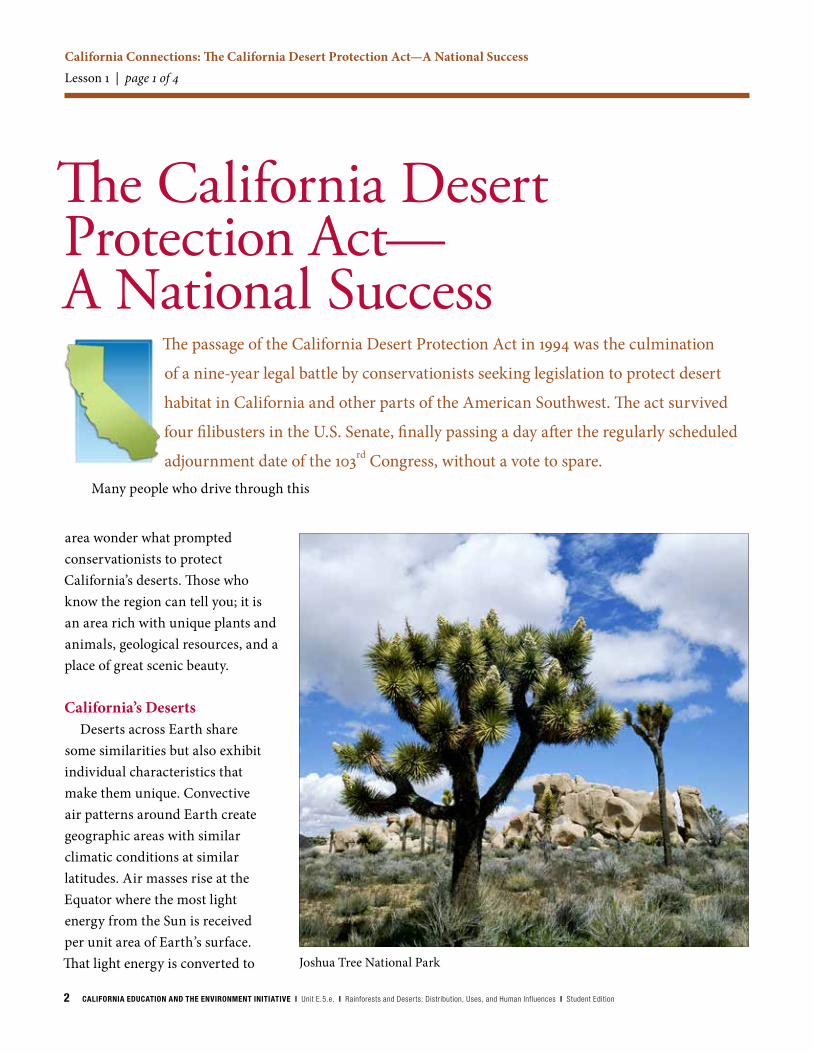
some similarities but also exhibit individual characteristics that make them unique. Convective air patterns around Earth create geographic areas with similar climatic conditions at similar latitudes. Air masses rise at the Equator where the most light energy from the Sun is received per unit area of Earth’s surface. That light energy is converted to Joshua Tree National Park
California Connections: The California Desert Protection Act—A National SuccessLesson 1 | page 1 of 4
Many people who drive through this

CALIFORNIA EDUCATION AND THE ENVIRONMENT INITIATIVE I Unit E.5.e. I Rainforests and Deserts: Distribution, Uses, and Human Influences I Student Edition 3
heat, warming the air. As the air is warmed, its density decreases and it rises. As this rising air expands and cools, moisture within it is released, causing heavy rainfall and depleting the air of moisture. The cooled, moisture-depleted air finally sinks again near latitudes 30° north and south. Deserts are found beneath these bands of sinking, moisture-depleted air. Deserts comprise about one-third of Earth’s land surface.
The latitude of California’s southern border is 32° north, exposing the region to the dry and warm air masses that produce desert conditions. Desert ecosystems cover one-quarter of the state, primarily in the southeastern region. Twenty-five thousand square miles of California are occupied by the Great Basin, Mojave, and Sonoran Deserts. California’s portion of the Sonoran Desert is called the Colorado Desert.
The California Desert Protection Act affected California’s desert areas primarily in the Mojave Desert. The act created Death Valley National Park, expanding the protected area around the former Death Valley Monument. In addition, it created Joshua Tree National Park and Mojave National Preserve, which encompasses not only the California portion of the
desert but also 1,420,000 acres across the rest of the Southwest United States. The designation of national park status also protects and preserves the unrivaled scenic, geologic, and wildlife values of these lands, perpetuates their significant and diverse ecosystems, and protects and preserves their historical and cultural values.
Preservation HistoryThe story behind the unexpected
success of the California Desert Protection Act began in the late 1960s with controversy over recreational land use. Photographs of the Barstow-Vegas motorcycle race astonished the state director of the Bureau of Land Management. Director Russ Penny saw that the
damage caused by these off-road vehicles to desert vegetation and soils could lead to serious erosion. His concerns resulted in some of the earliest studies of deserts as unique and fragile ecosystems. Conservationists then began a public education program that included desert study trips to educate Californians about the value of these lands.
A law passed in 1976 required the Bureau of Land Management to determine if any of its public lands should be set aside as wilderness. (Wilderness is defined as “an area where Earth and its community of life are untrammeled by man, where man himself is a visitor who does not remain.”) The legislation also mandated preparation of a
California Connections: The California Desert Protection Act—A National SuccessLesson 1 | page 2 of 4
Barstow-Vegas motorcycle race

4 CALIFORNIA EDUCATION AND THE ENVIRONMENT INITIATIVE I Unit E.5.e. I Rainforests and Deserts: Distribution, Uses, and Human Influences I Student Edition
Petroglyph
California Desert Plan. Over the next four years, there were open public debates on resource uses in California deserts. A compromise plan that considered mining, cattle grazing, and recreation, as well as wilderness interests, emerged at the end of the Carter administration in 1981.
But during the following Reagan years, the desert plan was gutted by amendments. No lands were set aside as wilderness despite the efforts of wilderness advocates. In 1986, California Senator Alan Cranston introduced the California Desert Protection Act. Senator Cranston continued to champion the act throughout its passage. From 1987 to 1993, California Senator Diane Feinstein introduced new versions of the act with each new Congress. Each version resolved new site-specific concerns of resource users, such as ranchers and small mining operations. Other interests included agriculture, urban development, and military installations. These varied interests led to much dialogue and compromise as the act was developed.
The strongest opposition to the act came from off-road vehicle groups whose activities inadvertently inspired the early desert conservation efforts. Despite
delaying tactics by opponents, in 1994 the Senate stayed in session an extra day and the act received the votes required to pass. Millions of acres of desert wilderness areas and national parks were newly designated.Why Fight for the Desert?
The lands protected by the act are located in an area rich in human and natural heritage. The lands include archaeological sites, homesteads, rock-walled military outposts, towering sand dunes, volcanic cinder cones, and stands of Joshua trees. The Environmental Impact Report (EIR) produced to evaluate the consequences of implementing or failing to implement the act also documented fossilized dinosaur tracks, American Indian petroglyphs,
abundant wildflowers, and several threatened and endangered species, including the desert bighorn sheep and the desert tortoise.
Just as the Mojave Desert Preserve is abundant and beautiful, each park created within it by the act boasts unique splendor. Joshua Tree National Park encompasses parts of both the Mojave and Colorado deserts. It contains magnificent rock formations and spectacular plant life, from wildflowers on the desert floor to pine forests in the high country. The landscape of Death Valley National Park includes a diverse range of pine forests, salt playas, and jagged rocks. It is a land of extremes—one of the hottest, driest, and lowest places on Earth. Mojave National Preserve has
California Connections: The California Desert Protection Act—A National SuccessLesson 1 | page 3 of 4

CALIFORNIA EDUCATION AND THE ENVIRONMENT INITIATIVE I Unit E.5.e. I Rainforests and Deserts: Distribution, Uses, and Human Influences I Student Edition 5
Clouds over desert
an equally remarkable geologic diversity—from limestone and granite to countless types of metamorphic rocks.
These wilderness areas offer an unequaled opportunity to experience vast areas of landscape and history that have been preserved and protected from human activity since the establishment of the act. The effects of land use and development can still threaten wilderness areas. Preservation of desert wilderness requires the highest levels of protection and management, as provided through the act.Provisions of the Act
The purpose of the act was fivefold, to: (1) preserve natural values, (2) perpetuate ecosystems, (3) protect historical and cultural values, (4) provide opportunities for scientific research and recreation, and (5) promote public understanding. It transferred over 3 million acres of California desert from the Bureau of Land Management to the National Park Service. It designated nearly 8 million acres of wilderness areas. Nearly 10,000 acres of U.S. Forest Service lands and 9,000 acres of U.S. Fish and Wildlife Service lands were also set aside as wilderness.
President Clinton said, in signing the act in 1994, “This is the first time
since 1980 that the United States has set aside so rich and vast an area… treasures that merit protection on behalf of the American people.” Not everyone shared the enthusiasm or opinion of President Clinton about the act. Many business owners and residents remained defiant about the new restrictions. They considered it an unfair expansion of public lands at the expense of the rights and interests of private property owners. Yet there are those who deeply care for the desert’s rich natural heritage and appreciate this wilderness as a place of solitude and a source of inspiration. They support the government’s continued role in protecting these public lands, California’s part of the global desert band.
California Connections: The California Desert Protection Act—A National SuccessLesson 1 | page 4 of 4

6 CALIFORNIA EDUCATION AND THE ENVIRONMENT INITIATIVE I Unit E.5.e. I Rainforests and Deserts: Distribution, Uses, and Human Influences I Student Edition
The rainforest biome comprises a variety of ecosystems, and although it occupies only
about 7% of the land on Earth, it holds the highest biodiversity known on the planet and provides
many ecosystem goods and ecosystem services that are important to humans. Rainforests add water
to the atmosphere through the process of transpiration, which releases water from leaves during
photosynthesis. This moisture contributes to the formation of rain clouds that release the water back
on the rainforest. Most essential nutrients in rainforests are contained within living plants, dead
wood, and decaying leaves (biomass).
Importance of Rainforests to Human LivesLesson 3 | page 1 of 2
Clear-cut
Trees for LumberThe removal of trees from
rainforests has become a common practice over the last 200 years. The wood extracted from rainforests is used for making furniture and other hardwood products. There are many types of wood that have been critical in the development of human societies, such as teak, known for its durability when used in shipbuilding. Some woods, such as rosewood, mahogany, and many others, have particular beauty and are used in furniture and ornaments. Ebony, a wood that is extremely dense and dark, has been traditionally used in piano keys. Grenadilla, another dark wood, has traditionally been used to make woodwind instruments, such as the clarinet and oboe. While many traditional uses of exotic
Importance of Rainforests to Human Lives

CALIFORNIA EDUCATION AND THE ENVIRONMENT INITIATIVE I Unit E.5.e. I Rainforests and Deserts: Distribution, Uses, and Human Influences I Student Edition 7
Importance of Rainforests to Human LivesLesson 3 | page 2 of 2
hardwoods found in rainforests have been replaced by plastics, there is still a great demand for the beautiful woods that are only found in these locations.
Below are a few of the common goods that humans gain from rainforest ecosystems.
Foods and Spices from the Rainforest
Although fruits and vegetables can be gathered from rainforests by locals for food, the real value of the rainforest to the modern human diet is the diversity of plants that have been extracted for use in farming and agriculture. While it may be obvious that Brazil nuts are from the rainforest, so are macadamias, cashews, even peanuts. It might be surprising to know that potatoes, corn, and even rice were first found in rainforests. Chocolate, vanilla, cinnamon, coffee, and
sugarcane were first discovered in rainforests. Selected spices from the rainforests include ginger, black and cayenne pepper, nutmeg, and cloves.
The avocado, tomato, orange, lemon, grapefruit, and banana were discovered in rainforests. Add to the list figs, guavas, pineapples, passion fruit, and mangoes, but this is not all. There are at least 3,000 fruits found in rainforests, and only about 200 of these are currently cultivated for human consumption. It is estimated that approximately 80% of the plant species cultivated for agriculture worldwide were discovered in rainforests. If there were no rainforests, some of the f lavors people enjoy most would not exist.
PharmaceuticalsThe idea of finding medicines
in plant species to cure
human ailments is an old one. Hippocrates (ca 460–370 BCE), en-dash generally acknowledged as the father of modern medicine, prescribed willow bark powder for fever, headaches, and joint pain. It was not until 1899 that the active ingredient in willow bark, salicylic acid, was patented and sold as
“Bayer Aspirin.” So it was a natural step for modern scientists to look in the most species-diverse areas of the world, rainforests, for more medicines. Today, about 25% of Western pharmaceuticals are based on chemicals found in rainforest plants (and some animals). Astoundingly, only about 1% of the species found in rainforests have been screened for medically useful compounds. It is obvious there is a vast potential for finding new remedies and cures in the species found in the remaining rainforests. There is a parallel between pharmaceuticals and food source items found in the rainforest: there is so much yet to be discovered.
Fruit and nuts
8 CALIFORNIA EDUCATION AND THE ENVIRONMENT INITIATIVE I Unit E.5.e. I Rainforests and Deserts: Distribution, Uses, and Human Influences I Student Edition
Importance of Deserts to Human LivesDeserts are important biomes that occupy up to 30% of the land space on Earth. Human popula-
tions have long occupied desert habitats and have adapted to the arid environment. As the human
population grows, we have discovered that deserts contain ecosystems important to the survival
and well-being of our own species.
Importance of Deserts to Human LivesLesson 3 | page 1 of 2
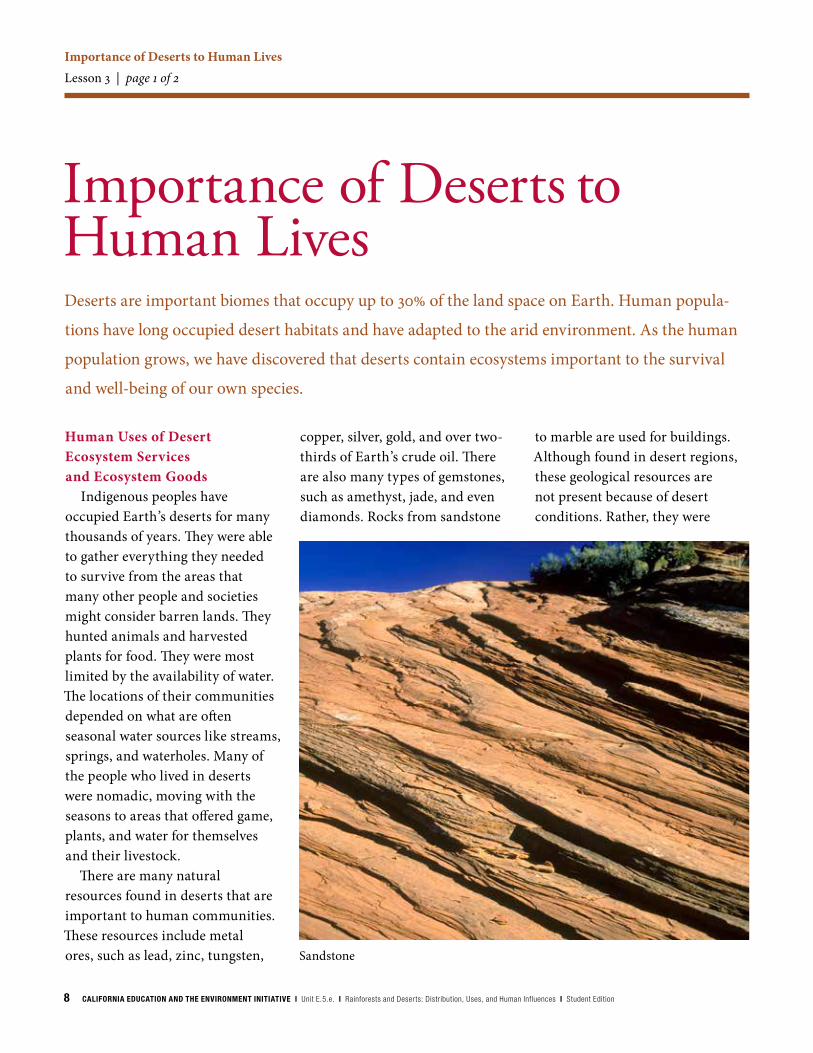
Sandstone
Human Uses of Desert Ecosystem Services and Ecosystem Goods
Indigenous peoples have occupied Earth’s deserts for many thousands of years. They were able to gather everything they needed to survive from the areas that many other people and societies might consider barren lands. They hunted animals and harvested plants for food. They were most limited by the availability of water. The locations of their communities depended on what are often seasonal water sources like streams, springs, and waterholes. Many of the people who lived in deserts were nomadic, moving with the seasons to areas that offered game, plants, and water for themselves and their livestock.
There are many natural resources found in deserts that are important to human communities. These resources include metal ores, such as lead, zinc, tungsten,
copper, silver, gold, and over two-thirds of Earth’s crude oil. There are also many types of gemstones, such as amethyst, jade, and even diamonds. Rocks from sandstone
to marble are used for buildings. Although found in desert regions, these geological resources are not present because of desert conditions. Rather, they were
CALIFORNIA EDUCATION AND THE ENVIRONMENT INITIATIVE I Unit E.5.e. I Rainforests and Deserts: Distribution, Uses, and Human Influences I Student Edition 9
Importance of Deserts to Human LivesLesson 3 | page 2 of 2
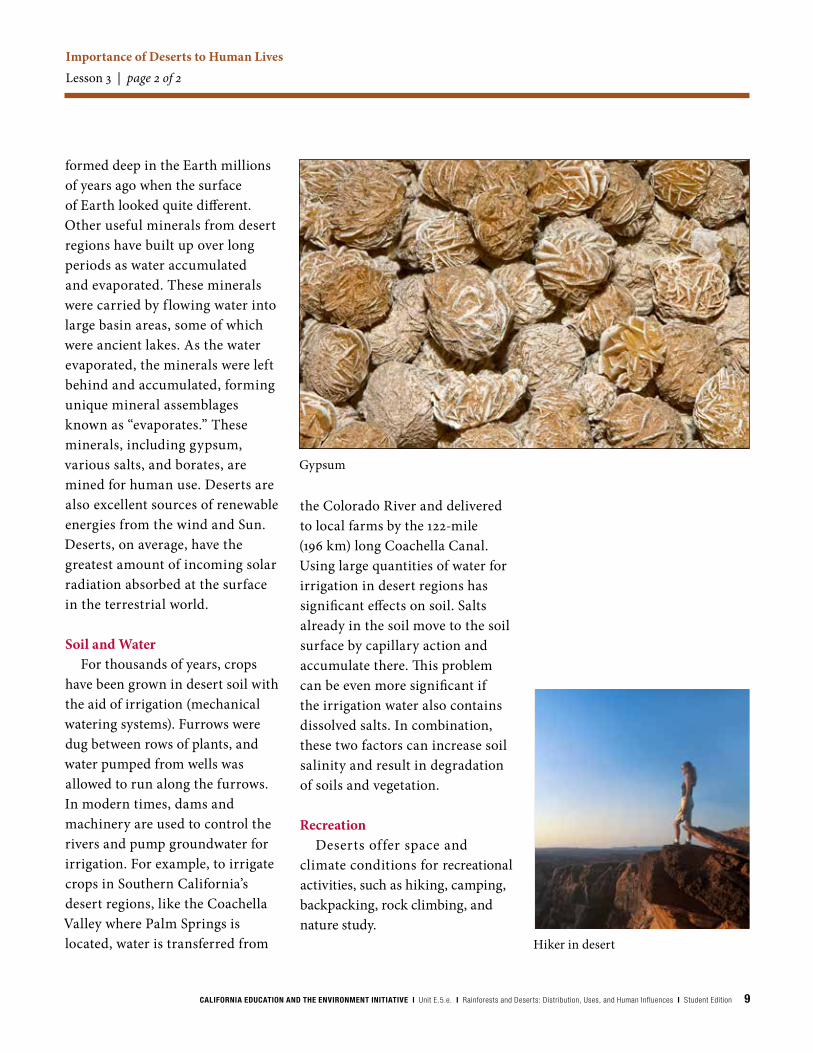
formed deep in the Earth millions of years ago when the surface of Earth looked quite different. Other useful minerals from desert regions have built up over long periods as water accumulated and evaporated. These minerals were carried by f lowing water into large basin areas, some of which were ancient lakes. As the water evaporated, the minerals were left behind and accumulated, forming unique mineral assemblages known as “evaporates.” These minerals, including gypsum, various salts, and borates, are mined for human use. Deserts are also excellent sources of renewable energies from the wind and Sun. Deserts, on average, have the greatest amount of incoming solar radiation absorbed at the surface in the terrestrial world.
Soil and WaterFor thousands of years, crops
have been grown in desert soil with the aid of irrigation (mechanical watering systems). Furrows were dug between rows of plants, and water pumped from wells was allowed to run along the furrows. In modern times, dams and machinery are used to control the rivers and pump groundwater for irrigation. For example, to irrigate crops in Southern California’s desert regions, like the Coachella Valley where Palm Springs is located, water is transferred from
Gypsum
Hiker in desert
the Colorado River and delivered to local farms by the 122-mile (196 km) long Coachella Canal. Using large quantities of water for irrigation in desert regions has significant effects on soil. Salts already in the soil move to the soil surface by capillary action and accumulate there. This problem can be even more significant if the irrigation water also contains dissolved salts. In combination, these two factors can increase soil salinity and result in degradation of soils and vegetation.
RecreationDeserts offer space and
climate conditions for recreational activities, such as hiking, camping, backpacking, rock climbing, and nature study.

10 CALIFORNIA EDUCATION AND THE ENVIRONMENT INITIATIVE I Unit E.5.e. I Rainforests and Deserts: Distribution, Uses, and Human Influences I Student Edition
Global Climate Change— The Green Sahara
Earth has endured many changes throughout geological history that have influenced the geo-
graphic distribution of deserts, rainforests, and other biomes. Some changes have resulted in more
rainfall in desert areas, changing them to grasslands or even forests.
Global Climate Change—The Green SaharaLesson 5 | page 1 of 2
Camel in Sahara Desert
During the majority of the last 70,000 years, the Sahara has appeared much as it does today, the largest hot desert on Earth. But, about 12,000 years ago, a minor change in the spinning of Earth on its axis caused a major change in the region’s climate. This shifting of the planet appears to have caused Africa’s seasonal monsoons to move on a track that was slightly to the north of their otherwise “normal” pattern.
As a result of the shifting monsoons, some areas in the Sahara Desert filled with lakes, grasslands, and forests, creating what is known as the “Green Sahara.” These areas were rich in vegetation and animals, such as hippos, giraffes, crocodiles, and elephants. Eventually, nomadic people “followed” the movement of the animals and vegetation. They began to hunt, harvest, and live in the area.
As global climatic conditions changed over time, the areas of lush vegetation expanded and then receded, allowing

CALIFORNIA EDUCATION AND THE ENVIRONMENT INITIATIVE I Unit E.5.e. I Rainforests and Deserts: Distribution, Uses, and Human Influences I Student Edition 11
Global Climate Change—The Green SaharaLesson 5 | page 2 of 2
at least two different cultures to occupy the region. About 3,500 years ago, changing climatic conditions began to cause the
“Green Sahara” to slowly retreat and revert to the hot and arid conditions that are found in today’s Sahara Desert.
History is the written record of humans, limiting this record to about 7,000 years. Therefore, to understand more ancient cultures, it is necessary to study clues from archaeological sites. To assess changes in climate, scientists rely on sophisticated methods like analyzing pollen and carbon dating of artifacts to estimate temperature and rainfall dating back tens of thousands of years. Anthropologists have been able to combine these two types of data and compare the
Archeologists in the desert
Skeleton being excavated
timing of changes in ancient climate with records of the successes and failures of ancient cultures.
The shifting sands of the Sahara once covered the evidence of the ancient peoples that occupied the Green Sahara. In 2000, a paleontologist looking for dinosaur bones in Niger, in north-central Africa, came across a Stone Age burial ground in the Gobero region that contained over 200 graves. He discovered two distinct types of people—one type was strong and tall, and the other was shorter and less athletic. Patterns on fragments of pottery indicated that the pottery was made by two distinct cultures.
The larger people were named the Kiffian. The Kiffian occupied the Green Sahara about 8,000 to 10,000 years ago. Near the grave sites archaeologists discovered stone tools, fishhooks carved from bone, and harpoons. Scientific methods dated these tools to the same period as the Kiffian skeletons. Researchers also found the bones of lake-dwelling hippos, crocodiles, and large fish,
indicating that these people based their culture on hunting and fishing in lakes and rivers.
The smaller people were named Tenerians, a group that inhabited the area about 4,500 to 6,500 years ago. Stone tools found in the area, such as spearheads, knives, and pendants, indicate that Tenerians were a hunting and gathering culture. Bones of cattle from the same period caused scientists to speculate that the Tenerians may also have been herders of domesticated animals.
A variety of scientists are continuing to examine the area and the artifacts from these two cultures. One of the key questions they would like to answer is,
“What caused these two cultures to disappear?”

12 CALIFORNIA EDUCATION AND THE ENVIRONMENT INITIATIVE I Unit E.5.e. I Rainforests and Deserts: Distribution, Uses, and Human Influences I Student Edition
Recoverability and Vulnerability of Desert EcosystemsLesson 6 | page 1 of 4
U.S. Department of the InteriorU.S. Geological Survey
Fact Sheet 058–03November 2003
Recoverability and Vulnerability of Desert Ecosystems
The U.S. Geological Survey (USGS) Recoverability and Vulnerability of Desert Ecosystems (RVDE) project is designed to provide scientific understand-ing to help conserve and restore threat-ened desert landscapes. Current research focuses on the Mojave Desert Ecosystem, which is a 125,000-km2 landscape spread over parts of southern Nevada, western Arizona, southwestern Utah, and south-eastern California. It is home to over one million people, including the Nation’s fastest growing city, Las Vegas, and is within a day’s drive of 40 million people. Many endangered plants and animals depend on the Mojave ecosystem. It con-tains four national park units, six major military training bases, and a matrix of BLM and privately owned land. Stew-ards of our public lands are faced with the need to make sound decisions on land use that will allow for economic, recreational, and military use, while still keeping the desert ecosystem healthy and ensuring the survival of threatened species.
USGS scientists are taking an inter-disciplinary approach to understanding the physical and biological processes that influence vulnerability of the desert ecosystem to disturbance and its sub-sequent ability to recover. They are studying historical information, conduct-ing experimental studies on physical and biological processes, and mapping and modeling the existing landscape. These data can be synthesized into maps and predictive models that show how eco-system components respond to imposed stress, providing valuable tools for desert land managers. Such tools will help land managers make decisions that sustain the desert even as economic, recreation, and military uses continue.
Mapping and Modeling Current Conditions
Because vulnerability and recovery times vary across the landscape, RVDE scientists hypothesized that landscape variables such as geology, slope, soil, micro-climate, and botanic habitat must influence how quickly an area bounces back from human impact. Modeling vulnerability and recoverability therefore requires maps of the landscape fac-
tors determined to be the most impor-tant. Existing geospatial data for the Mojave Desert, such as elevation, roads, hydrography, and Landsat imagery, were collected by the Mojave Desert Ecosys-tem Program and are available online at www.mojavedata.gov. Starting with these data, RVDE scientists mapped other crucial data sets, such as surficial geol-ogy and plant distribution, and modeled various complex landscape characteristics that are spatially and temporally vari-
Figure 1. Location of the Mojave Desert Ecosystem (boundary shown in yellow) and the RVDE study area (boundary shown in orange).
Printed on recycled paper
Recoverability and Vulnerability of Desert Ecosystems
The U.S. Geological Survey (USGS) Recoverability and Vulnerability of Desert Ecosystems (RVDE) project is designed to provide scientific understand-ing to help conserve and restore threatened desert landscapes. Current research focuses on the Mojave Desert Ecosystem,which is a125,000-km2 landscape spread over parts of southern Nevada, western Arizona, southwestern Utah, and southeastern California. It is home to over one million people, including the Nation’s fastest growing city, Las Vegas, and is within a day’s drive of 40 million people. Many endangered plants and animals depend on the Mojave ecosystem. It contains four national park units, six major military training bases, and a matrix of BLM and privately owned land. Stewards of our public lands are faced with the need to make sound decisions on land use that will allow for economic, recreational, and military use, while still keeping the desert ecosystem healthy and ensuring the survival of threatened species. USGS scientists are taking an interdisciplinary approach to understanding the physical and biological processes that
influence vulnerability of the desert ecosystem to disturbance and its subsequent ability to recover. They are studying historical information, conducting experimental studies on physical and biological processes, and mapping and modeling the existing landscape. These data can be synthesized into maps and predictive models that show how eco system components respond to imposed stress, providing valuable tools for desert land managers. Such tools will help land managers make decisions that sustain the desert even as economic, recreation, and military uses continue.
Mapping and Modeling Current Conditions
Because vulnerability and recovery times vary across the landscape, RVDE scientists hypothesized that landscape variables such as geology, slope, soil, micro-climate, and botanic habitat must influence how quickly an area bounces back from human impact. Modeling vulnerability and recoverability therefore requires maps of the landscape factors determined to be the most important. Existing geospatial
data for the Mojave Desert, such as elevation, roads, hydrography, and Landsat imagery, were collected by the Mojave Desert Ecosystem Program and are available online at www.mojavedata.gov. Starting with these data, RVDE scientists mapped other crucial data sets, such as surficial geology and plant distribution, and modeled various complex landscape characteristics that are spatially and temporally variable. For example, soil moisture and soil texture are two important physical landscape factors that influence several components of the ecosystem, including
Figure 1. Location of the Mojave Desert Ecosystem (boundary shown in yellow) and the RVDE study area (boundary shown in orange).

CALIFORNIA EDUCATION AND THE ENVIRONMENT INITIATIVE I Unit E.5.e. I Rainforests and Deserts: Distribution, Uses, and Human Influences I Student Edition 13
able. For example, soil moisture and soil texture are two important physical landscape factors that influence several components of the ecosystem, including vegetation cover and composition, soil
compaction and erosion, and biological soil crusts. Hydrologists are working on improved spatial and temporal models of soil moisture and evapotranspiration in the Mojave Desert. Geologists are devel-
Figure 2. Land use in the Mojave has included military, mining, grazing, and recreational activities.
Figure 3. RDVE scientists use wind tunnel experiments to study wind erosion vulnerability.
oping better maps of soil texture by com-bining maps of surficial geology with soil sample analyses and topography. Maps of evapotranspiration and soil properties can help predict conditions conducive to biological soil crusts, a very fragile and important element of desert ecosystems. Information on current disturbance is also important. For example, RVDE scien-tists are collecting and analyzing data on recent fire occurrences to better under-stand fire characteristics in the Mojave Desert. These maps of existing landscape conditions form the base for building vulnerability and recoverability models.
Understanding the ProcessesRVDE scientists are focusing on
common impacts and processes that result from a number of different kinds of activities, including disturbance or removal of the vegetation, and distur-bances to the soil that result in compac-tion, destruction of fragile soil crusts, and increased susceptibility to wind erosion. To understand how vegetation recovers, it is necessary to understand
Recovery and Vulnerability of Desert EcosystemsLesson 6 | page 2 of 4
vegetation cover and composition, soil compaction and erosion, and biological soil crusts. Hydrologists are working on improved spatial and temporal models of soil moisture and evapotranspiration in the Mojave Desert. Geologists are devel oping better maps of soil texture by combining maps of surficial geology with soil sample analyses and topography. Maps of evapotranspiration and soil properties can help predict conditions conducive to biological soil crusts, a very fragile and important element of desert ecosystems. Information on current disturbance is also important. For example, RVDE scientists are collecting and analyzing data on recent fire occurrences to better understand fire characteristics in the Mojave Desert. These maps of existing landscape conditions form the base for building vulnerability and recoverability models.
Understanding the ProcessesRVDE scientists are focusing on
common impacts and processes that result from a number of different kinds of activities, including disturbance or removal of the vegetation, and disturbances to the soil that result in compaction, destruction of fragile soil crusts, and increased susceptibility to wind erosion. To understand how vegetation recovers, it is necessary to understand how vegetation changes naturally over
time in undisturbed areas of the Mojave. Scientists are also studying vegetation recovery in disturbed areas, both in terms of percent cover and species composition. Vulnerability to soil compaction, recovery from compaction, vulnerability to wind erosion, and time for recovery of soil crusts are all functions of a number of factors, such as soil moisture and soil texture. RVDE scientists use a variety of experimental techniques to determine the functions involved in these processes.
Using the Past to Understand the Present
Some of the once-bustling mining towns that thrived in the Mojave during the early 1900s have vanished with
Figure 2. Land use in the Mojave has included military, mining, grazing, and recreational activities.
Figure 3. RDVE scientists use wind tunnel experiments to study wind erosion vulnerability
almost complete replacement of vegetation cover, while the sites of other ghost towns are still readily apparent. USGS scientists in the RVDE project are collecting information about conditions in the past to analyze these differences in ecosystem recovery rates and thus better understand how the desert recovers. Analyses

14 CALIFORNIA EDUCATION AND THE ENVIRONMENT INITIATIVE I Unit E.5.e. I Rainforests and Deserts: Distribution, Uses, and Human Influences I Student Edition
how vegetation changes naturally over time in undisturbed areas of the Mojave. Scientists are also studying vegetation recovery in disturbed areas, both in terms of percent cover and species composi-tion. Vulnerability to soil compaction, recovery from compaction, vulnerability to wind erosion, and time for recovery of soil crusts are all functions of a number of factors, such as soil moisture and soil texture. RVDE scientists use a variety of experimental techniques to determine the functions involved in these processes.
Using the Past to Understand the Present
Some of the once-bustling mining towns that thrived in the Mojave dur-ing the early 1900s have vanished with almost complete replacement of vegeta-
tion cover, while the sites of other ghost towns are still readily apparent. USGS scientists in the RVDE project are col-lecting information about conditions in the past to analyze these differences in ecosystem recovery rates and thus better understand how the desert recov-ers. Analyses of climate history and its influence on vegetation recovery and geomorphic processes, such as overland flow, provide clues as to how vulnerabil-ity and recoverability may vary over time. Studies of areas that were disturbed in the past but have since been abandoned, such as military training areas, ghost towns, roads, and utility rights of way, provide useful data on recovery processes and times. Repeat photography is a valuable tool in the analysis of recovery. Data from old maps depicting land use history allow a better understanding of the effect
Figure 4. Harrisburg townsite, Panamint Mountains in Death Valley National Park. A, 1908 and B, 1999.
Figure 5. Vegetation plots established in the Nevada Test Site by Dr. Janice Beatley in the 1960s were remeasured by RVDE scientists to study natural vegetation change over time, such as this plot shown in A, 1964 and B, 2000.
of historical land use patterns on current conditions.
Modeling Vulnerability and Recov-erability
To make this research useful to land managers, RVDE scientists are synthesiz-ing this information into spatial models of vulnerability and recoverability. The maps or models of the most relevant landscape factors are combined with knowledge of landscape processes gained from experiments and field studies to derive spatial models of vulnerability and recoverability. Prototype models are being developed for soil compaction (both vulnerability and recoverability), wind erosion vulnerability, soil crust predictions, and vegetation recovery for a part of the Mojave Desert. As these
Recovery and Vulnerability of Desert EcosystemsLesson 6 | page 3 of 4
how vegetation changes naturally over time in undisturbed areas of the Mojave. Scientists are also studying vegetation recovery in disturbed areas, both in terms of percent cover and species composi-tion. Vulnerability to soil compaction, recovery from compaction, vulnerability to wind erosion, and time for recovery of soil crusts are all functions of a number of factors, such as soil moisture and soil texture. RVDE scientists use a variety of experimental techniques to determine the functions involved in these processes.
Using the Past to Understand the Present
Some of the once-bustling mining towns that thrived in the Mojave dur-ing the early 1900s have vanished with almost complete replacement of vegeta-
tion cover, while the sites of other ghost towns are still readily apparent. USGS scientists in the RVDE project are col-lecting information about conditions in the past to analyze these differences in ecosystem recovery rates and thus better understand how the desert recov-ers. Analyses of climate history and its influence on vegetation recovery and geomorphic processes, such as overland flow, provide clues as to how vulnerabil-ity and recoverability may vary over time. Studies of areas that were disturbed in the past but have since been abandoned, such as military training areas, ghost towns, roads, and utility rights of way, provide useful data on recovery processes and times. Repeat photography is a valuable tool in the analysis of recovery. Data from old maps depicting land use history allow a better understanding of the effect
Figure 4. Harrisburg townsite, Panamint Mountains in Death Valley National Park. A, 1908 and B, 1999.
Figure 5. Vegetation plots established in the Nevada Test Site by Dr. Janice Beatley in the 1960s were remeasured by RVDE scientists to study natural vegetation change over time, such as this plot shown in A, 1964 and B, 2000.
of historical land use patterns on current conditions.
Modeling Vulnerability and Recov-erability
To make this research useful to land managers, RVDE scientists are synthesiz-ing this information into spatial models of vulnerability and recoverability. The maps or models of the most relevant landscape factors are combined with knowledge of landscape processes gained from experiments and field studies to derive spatial models of vulnerability and recoverability. Prototype models are being developed for soil compaction (both vulnerability and recoverability), wind erosion vulnerability, soil crust predictions, and vegetation recovery for a part of the Mojave Desert. As these
of climate history and its inf luence on vegetation recovery and geomorphic processes, such as overland f low, provide clues as to how vulnerability and recoverability may vary over time. Studies of areas that were disturbed in the past but have since been abandoned, such as military training areas, ghost towns, roads, and utility rights of way, provide useful data on recovery processes and times. Repeat photography is a valuable tool in the analysis of recovery. Data from old maps depicting
land use history allow a better understanding of the effect of historical land use patterns on current conditions.Modeling Vulnerability and Recoverability
To make this research useful to land managers, RVDE scientists are synthesizing this information into spatial models of vulnerability and recoverability. The maps or models of the most relevant landscape factors are combined with knowledge of landscape processes gained from experiments and field studies to derive spatial models of vulnerability and
recoverability. Prototype models are being developed for soil compaction (both vulnerability and recoverability), wind erosion vulnerability, soil crust predictions, and vegetation recovery for a part of the Mojave Desert. As these models are refined and additional models developed, they will be combined into a suite of tools that can be used by land managers to provide input for decisionmaking. For example, assessing the relative vulnerability of several sites could help in choosing the location and best timing for off-road vehicle use or military
Figure 4. Harrisburg townsite, Panamint Mountains in Death Valley National Park. A, 1908 and B, 1999
Figure 5. Vegetation plots established in the Nevada Test Site by Dr. Janice Beatley in the 1960s were remeasured by RVDE scientists to study natural vecgetation change over time, such as this plot shown in A, 1964 and B, 2000
CALIFORNIA EDUCATION AND THE ENVIRONMENT INITIATIVE I Unit E.5.e. I Rainforests and Deserts: Distribution, Uses, and Human Influences I Student Edition 15
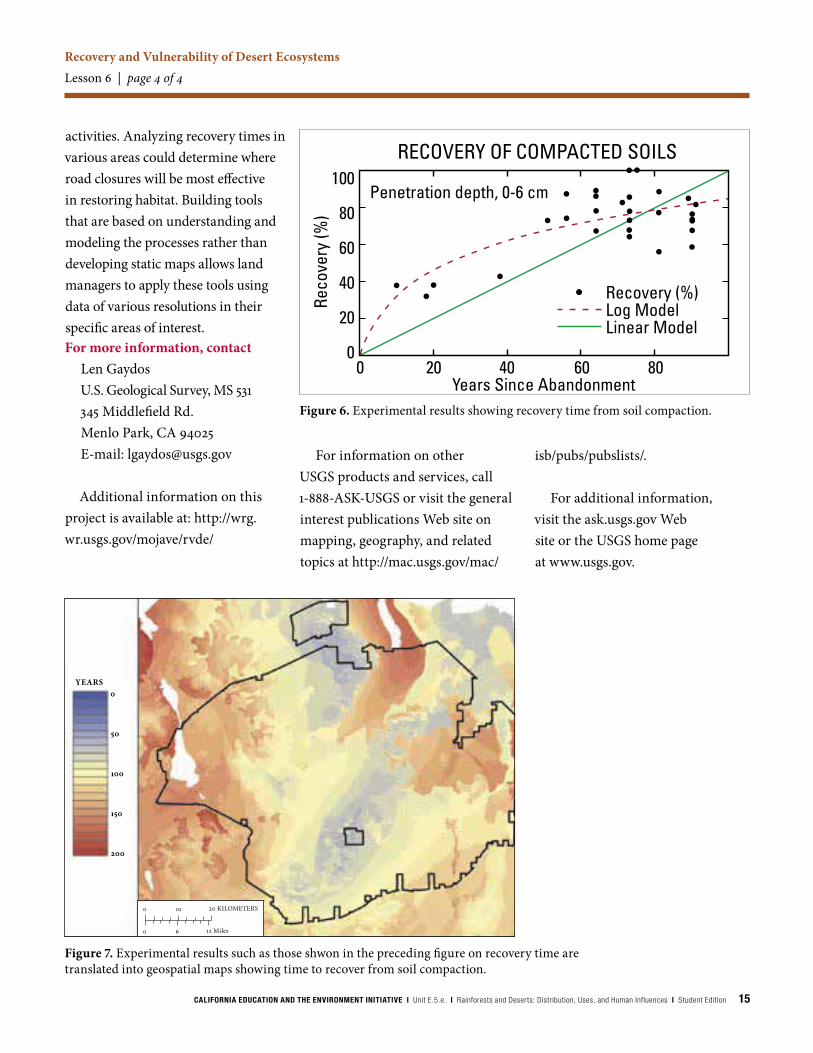
Figure 6. Experimental results showing recovery time from soil compaction.
Figure 7. Experimental results such as those shown in the preceding figure on recovery time are translated into geospatial maps showing time to recover from soil compaction.
models are refined and additional models developed, they will be combined into a suite of tools that can be used by land managers to provide input for decision-making. For example, assessing the rela-tive vulnerability of several sites could help in choosing the location and best timing for off-road vehicle use or military activities. Analyzing recovery times in various areas could determine where road closures will be most effective in restoring habitat. Building tools that are based on understanding and modeling the processes rather than developing static maps allows land managers to apply these tools using data of various resolutions in their specific areas of interest.
For more information, contact Len GaydosU.S. Geological Survey, MS 531345 Middlefield Rd.Menlo Park, CA 94025E-mail: [email protected]
Additional information on this project is available at: http://wrg.wr.usgs.gov/mojave/rvde/
For information on other USGS prod-ucts and services, call 1-888-ASK-USGS or visit the general interest publications Web site on mapping, geography, and related topics at http://mac.usgs.gov/mac/isb/pubs/pubslists/.
For additional information, visit the ask.usgs.gov Web site or the USGS home page at www.usgs.gov.
RECOVERY OF COMPACTED SOILS
Penetration depth, 0-6 cm
Years Since Abandonment
Reco
very
(%)
Recovery (%)Log ModelLinear Model
00
20
40
60
80
100
20 40 60 80
Recovery and Vulnerability of Desert EcosystemsLesson 6 | page 4 of 4
activities. Analyzing recovery times in various areas could determine where road closures will be most effective in restoring habitat. Building tools that are based on understanding and modeling the processes rather than developing static maps allows land managers to apply these tools using data of various resolutions in their specific areas of interest.For more information, contact
Len GaydosU.S. Geological Survey, MS 531345 Middlefield Rd.Menlo Park, CA 94025E-mail: [email protected]
Additional information on this project is available at: http://wrg.wr.usgs.gov/mojave/rvde/
For information on other USGS products and services, call 1-888-ASK-USGS or visit the general interest publications Web site on mapping, geography, and related topics at http://mac.usgs.gov/mac/
isb/pubs/pubslists/.
For additional information, visit the ask.usgs.gov Web site or the USGS home page at www.usgs.gov.
Figure 6. Experimental results showing recovery time from soil compaction.
Figure 7. Experimental results such as those shwon in the preceding figure on recovery time are translated into geospatial maps showing time to recover from soil compaction.
0
50
100
150
200
20 KILOMETERS0 10
0 6 12 Miles
YEARS


California Education and the Environment InitiativePrinted on post-consumer recycled paperE5eSE