dynamic decision paper
TRANSCRIPT
A
Pa
b
c
a
ARRAA
KDAP(SS
1
itwdpnvi
naAafibitd
i
1d
Applied Soft Computing 11 (2011) 3998–4010
Contents lists available at ScienceDirect
Applied Soft Computing
journa l homepage: www.e lsev ier .com/ locate /asoc
dynamic threshold decision system for stock trading signal detection
ei-Chann Changa,∗, T. Warren Liaob, Jyun-Jie Lina, Chin-Yuan Fanc
Department of Information Management, Yuan Ze University, Taoyuan 32026, Taiwan, ROCDepartment of Construction Management and Industrial Engineering, Louisiana State University, PFT Hall, Baton Rouge, LA 70803, USAScience & Technology Policy Research and information Center, National Applied Research Laboratories, Taipei, Taiwan, ROC
r t i c l e i n f o
rticle history:eceived 24 July 2010eceived in revised form 21 February 2011ccepted 22 February 2011vailable online 8 March 2011
eywords:ynamic threshold
a b s t r a c t
Trading signal detection has become a very popular research topic in financial investment area. This paperdevelops a model using the Piecewise Linear Representations (PLR) and Artificial Neural Networks (ANNs)to analyze the nonlinear relationships between the stock closed price and various technical indexes, anduncovering the knowledge of trading signals hidden in historical data. Piecewise Linear Representationtools are applied to find the best stock turning points (trading signals) based on the historical data. Theseturning points represent short-term trading signals for selling or buying stocks from the market. Thisstudy further applies an Artificial Neural Network model to learn the connection weights from these
rtificial Neural Network (ANN)iecewise Linear Representation methodPLR)tock turning points detectiontock trading signals
historical turning points, and afterwards an exponential smoothing based dynamic threshold model isused to forecast the future trading signals. The stock trading signal is predicted using the neural networkon a daily basis. The dynamic threshold bounds generated provide a guide for triggering a buy or selldecision when the ANN-predicted trading signal goes above or under the threshold bounds. Through aseries of experiments, this research shows superior results than our previous research (Chang et al., 2009
rese
[1]) and other benchmark. Introduction
Stock trading signals have become a very popular research topicn financial engineering. Many researchers and investors have triedo determine the best time to buy or sell stocks, but inevitably makerong decisions. The reason why trading signals are so difficult toetect or even observe is that price variations are subject to theroblems of high dimensionality and non-stationary, because eco-omic environments and political situations both affect stock priceariations which make it even more difficult for researchers andnvestors to forecast trading signals.
Financial analysis often uses the fundamental analytical tech-ique of trend analysis, which predicts or confirms trend reversalsnd trades at the peak or valley of the stock’s price variation range.
financial time series consists of a sequence of local maximalnd minimal points. These points contain useful information fornancial analysis. Technical analysis is a major analytical techniqueased solely on price data. Evaluating financial time series data
nvolves looking for peaks, valleys, trends, patterns, and other fac-ors affecting a stock’s price movement. Therefore, making buy/sell
ecisions based on these factors is a challenging task.Stocks trading signals normally use technical indicators to mon-tor the stock prices and assist investors in setting up trading
∗ Corresponding author. Tel.: +886 936101320; fax: +886 34638884.E-mail address: [email protected] (P.-C. Chang).
568-4946/$ – see front matter © 2011 Elsevier B.V. All rights reserved.oi:10.1016/j.asoc.2011.02.029
arches.© 2011 Elsevier B.V. All rights reserved.
rules for buy–sell–hold decisions. Technical indicators are pro-duced based on historical stock data. Historical stock data is inturn affected by the overall economic environment and politicalsituations over time. This implies that technical indicators hideimportant information previously ignored. In previous studies,researchers have exerted significant effort in forecasting stock pricevariation and have proposed numerous sophisticated techniquesto predict stock prices movements. Many researchers have useddata mining and artificial intelligence tools to analyze technicalindicators in an attempt to find the best trading signals. However,most past studies focus on the precise price prediction only, butin real world applications, determining the opportunity of trad-ing points is more important than getting the price prediction. Toovercome the shortcoming, this research develops a novel tradingsignals detection system to detect the buy/sell points more effec-tively and technical indicators are used as the input features fortrading signals prediction.
The contributions of this research include two parts; firstly, wedevelop a model using Piecewise Linear Representations (PLR) andArtificial Neural Networks (ANNs) to analyze the nonlinear rela-tionships between the stock closed price and various technicalindexes, and to capture the knowledge of trading signals that arehidden in historical data. Then the learned ANN model is used to
predict the future trading signals on a daily basis. However, thestock price varies in daily life, the trading signals’ output from ANNis within the range of 0–1. It is still not clear to the user to define agood buy or sell decision. Therefore, secondly, a dynamic threshold
t Com
dToopb
tSpetsf
2
ctiitpTap
2
firdmsotiBt(wiacrro
tdMpdamd
fitmaww
P.-C. Chang et al. / Applied Sof
ecision system is further developed to trigger a trading decision.he dynamic threshold decision system is applied to generate a buyr sell decision when the predicted stock trading signal goes abover under the threshold. Therefore, the buy or sell decision can beredicted on a daily basis. Based on this strategy, the investors canuy or sell the selected stock and make a profit.
The remainder of this paper is divided into five sections. Sec-ion 2 reviews related literature in the area of stock trading signals.ection 3 describes the development of a hybrid system for sup-orting stock trading point decision making. Section 4 presents thexperimental tests conducted in this study to determine the effec-iveness of trading points generated using the proposed hybridystem. The final section provides conclusions and directions foruture research.
. Literature survey
The stock market is a complex system where decision-makingan be very difficult; the market is affected by numerous factors andhere is a high level of noisiness [2], stock trading signal detections becoming the most popular research area in financial engineer-ng. Many researchers have used different methods to predict stockrading signal. Recent studies in this area have increasingly usedattern recognition, data mining and computational intelligence.his section briefly introduces stock trading signal detection andlso discusses the research methods used in stock trading signalrediction.
.1. Traditional financial time series forecasting
Many researchers try to use formulas and statistical tools tond stock trading signals. The most popular methods include theegression model, the GARCH (generalized autoregressive con-itional heteroskedasticity) model, the ARIMA (autoregressiveoving average) model, and the probabilistic model. The regres-
ion model is a kind of simple linear forecasting model, where theutput value y depends on the input signals x1 . . . xn. However,his type of model does not seem to do very well in forecast-ng financial stock or exchange data. To address this weakness,usuttil and Kalnishkan [3] developed two new regression models,he weight controlled kernel aggregating algorithm for regressionWeCKAAR) and the kernel aggregating algorithm for regressionith changing dependencies (KAARCh). The WeCKAAR adds decay-
ng weights to existing regression techniques, while the KAARChdds an aggregating algorithm to trading signals. These methodsan merge experts’ opinion selected from a large pool of opinionules to obtain optimal strategies. With the help of these two algo-ithms, their study showed excellent results in forecasting resultsf the Russian Trading System Stock Exchange (RTSSE).
The GARCH model is a very popular model used in traditionalrading signal prediction. The GARCH model assigns exponentiallyecreasing weights to the original regression models. Diebold andariano [4] used this model to test exchange rate currencies. Their
aper shows that the results of this model are similar to the tra-itional regression model and random walk strategy. Gencay [5]ttempted to test linear and non-linear models using the GARCHodel, but their results failed to generate significant trading signal
ata.Another popular model which has been used in forecasting
nancial time series data is the Box–Jenkins ARIMA model. Unlikeraditional regression models, these models combine stock data’s
oving average value and also find similar patterns. Timmermannnd Granger [6] used this model to solve financial time series data,hile Valenzuela et al. [7] and Pai and Lin [8] combined ARIMAith intelligent techniques, e.g. support vector machines for time
puting 11 (2011) 3998–4010 3999
series prediction. The later study uses the ARIMA model as a linearpredictor to forecast stock price data, and then uses support vec-tor machines to deal with the residual parts obtained from ARIMAmodel. Their research produces forecasting patterns that are verysimilar to the actual results. Their approach seems more successfulthan other methods. However, ARIMA model still has the limita-tion for system reliability [9]. The researcher presents that SVMmodel with the intelligence approach, e.g. genetic algorithm, is abetter predictor than traditional approaches in forecasting systemreliability.
Although the models described above show very interestingresults in financial time series forecasting, they do not producesignificant results in trading signal information. Unlike time seriesforecasting, trade signal prediction must be very precise. A strongtrading signal detection method must consider not only stock pricevariations, but also other information that can help investors “buylow, sell high”. Previous research shows that traditional linear mod-els like the regression model, the GARCH model, and the ARIMAmodel, do not perform well in this task.
The probabilistic model offers an alternative to solve this prob-lem. Bao and Yang [10] proposed a new learning strategy in stocktrading signal detection that using the probabilistic model. Theirproposed approach first attempts to find stock data critical point,and then adopts Markovian network to find the best trading sig-nal probability. They were able to produce excellent results forS&P500 index data, and according to the authors’ description, suc-cessfully predicted 416 of 454 profitable stocks. These results arequite successful in financial trading signal area.
As this section describes, probabilistic models can help solvethe trading signal problem. However, probabilistic models requirecomplex mathematical formulas which are not that easy to beunderstood by the investors. Therefore, it seems there should beanother way to solve this problem more efficiently.
2.2. Pattern recognition
Pattern recognition is another hot topic been investigated forpredicting stock trading signals. Many researchers have used his-torical data patterns to find future trading signals. Recently, Leighet al. [11–13] proposed a chart heuristic for stock trading signalforecasting. A chart heuristic is a special kind of pattern recogni-tion method. This method is based on the recognition of graphicalstocks’ price patterns and stocks’ transaction volume. Using a seriesweight calculation, this method can find the best timing for trad-ing that will earn the most profit. Leigh et al. [14] and Wang andChan [15] used this method to forecast prices variation for the NYSE,the DOW-JONES Industrial Average, and the S&P500 index, and allachieved very significant results.
A chart heuristic seems to be the most popular pattern recogni-tion tool used in financial time series data forecasting and tradingsignal detection. However, this method only considers graphicalpatterns, and ignores important messages that appear in differentindices. Technical indices offer another solution in financial tradingsignal detection. A technical index shows much more informationthan price and transaction volume. Technical indices are anotherkind of method frequently used in financial trading signal predic-tion.
2.3. Technical index analysis
Technical index analysis (TA) is the process of analyzing his-torical stock prices to determine the possible future trends of a
stock price. TA explores internal market information and assumesthat all the necessary factors are in the stock exchange information.TA methodology is based on historically formed regularities in thestock exchange, and assumes that the same result will repeat in
4 ft Com
tmsvocp
afgaibsis
somcs
2
cbHwaac
rmbddabspsamafsTngwufbwwfhbi
ww
000 P.-C. Chang et al. / Applied So
he future. Technical index analysis (TA) is one of the most popularethods in use by stock traders [16]. Traditionally, TA proposes a
et of investment rules for the investor. However, the use of indi-idual trading rules is not very effective from the investor’s pointf view [17,18]. Since the application of numerous rules is compli-ated and it is hard to combine trading rules, the overall tradingrofit results seems not good enough.
Many researchers have tried to use the combination of technicalnalysis and transaction amount to determine the exact momentor stock trading. To determine these time points, analysts develop aroup of technical rules (TR) based on technical indicators (TIs). Theim of each rule is to generate either a buy signal when a bull markets anticipated or a sell signal when a bear market is expected. Theetter rule is one earning higher profit. Every TI is a function of time-eries values, whereas each TR is a function of TI values and otherndependent parameters. A TR function can produce buy, hold, orell signals. For more detailed information on TA, refer to [19,20].
Technical analysis can help extract financial information fromtock price pattern. However, this method must be combined withther methods to help investors make accurate decisions. Recently,any researchers have used computational intelligence tools in
ombination with technical analysis to better determine tradingignals.
.4. Computational intelligence
Computational intelligence methods are also popular in finan-ial trading signal forecasting [21]. Artificial Neural Networks haveeen applied to this area more frequently than other methods.owever Refs. [22–25] show that these models have limitationshen subjected to the tremendous noise and complex dimension-
lity of stock price data. The quantity of data and input variableslso interfere with each other. Therefore, the results may not beonvincing.
To improve the strength of Artificial Neural Networks,esearchers have applied other computational intelligence (CI)ethods to predict stock trading signal. A stock trading method
ased on hidden Markov processes can be adopted to model theynamics of stock price trends. In Ref. [26], volatility from priceata was used to characterize the amplitude of price return fluctu-tions, and the authors assumed that volatility could be describedy a hidden Markov process. Westerhoff [27] developed a noveltock market model based not only on past prices, but also onast trading volume. This model has the potential to replicateome important stylized facts of stock markets, especially bubblesnd crashes, excess volatility, fat tails, uncorrelated price incre-ents, and volatility clustering. Thawornwong et al. [28] developed
n intelligent stock trading decision support system that couldorecast buying and selling signals based on the predictions ofhort-term and long-term trends using rule-based neural networks.he neural network component is composed of two rule-basedeural networks used to predict stock price trends. A hybrid neuro-enetic approach [29,30] was also developed for stock trading, inhich a recurrent neural network (NN) with one hidden layer wassed for the prediction model. Recurrent neural network’s inputeatures are generated from a number of technical indicators usedy financial experts. The genetic algorithm (GA) optimizes the NN’seights under a 2-D encoding and crossover strategy. This modelas tested with data from 36 companies in the NYSE and NASDAQ
or a period of 13 years, from 1992 to 2004. This neuro-geneticybrid model was shown to have notable improvement over theuy-and-hold strategy, and the context-based ensemble further
mproved the results.Recently, evolutionary computations and Artificial Neural Net-
orks (ANNs) have gained wide popularity, especially in problemshose solution spaces are so complex and large that it is impossible
puting 11 (2011) 3998–4010
to use traditional optimization methods. The application of ANNsfor stock market prediction has its advantages and disadvantages.For example, Ref. [31] showed that ANNs could be used success-fully for short-term series prediction. The application of an ANN isespecially effective when the link between the independent anddependent variables from stock price variation is nonlinear andvery noisy, which is typical of a stock market. The main drawbackof the ANN approach is that ANNs do not provide any insight intothe underlying processes, and prevent us from obtaining a specificcollection of rules. Therefore, decision-making that relies solely onANN results is not advisable. On the other hand, the applicationof evolutionary algorithms eliminates these problems and makesit possible to create more complex rules out of simple ones at theexpense of greater computational effort. This suggests that hybridsystems can help avoid the weaknesses of signaling method whileintegrating their individual strengths. The following sections brieflyintroduce and survey related techniques applied in this study.
2.4.1. Technical analysis in our systemAs mentioned before, technical analysis (TA) is the process of
analyzing historical stock prices to determine the possible futuretrends of a stock price. TA explores internal market information andassumes that all the necessary factors are in the stock exchangeinformation as a result of price dynamics. The TA methodology isbased on historically formed regularities in the stock exchange, andassumes that the same results which appear in stock price variationwill repeat in the future.
Thus, technical analysts affirm that the combination of thepast share transaction rate and the transaction amount allows theinvestigator to determine the exact moment when the shares areeither overvalued or undervalued. To determine these time points,analysts form a group of technical rules (TR) based on technical indi-cators (TIs). The aim of each rule is to generate a buy signal whena bull market is anticipated or a sell signal when a bear market isexpected. The better the rules, the higher the earnings from tradingstocks are. Every TI is a function of time-series values, whereas eachTR is a function of TI values and other independent parameters. ATR function can produce buy, hold, or sell signals. For more detailedinformation on TA, refer to [19].
2.4.2. Exponential smoothing, ESExponential smoothing is a technique that can be applied to time
series data, either to produce smoothed data for presentation, or tomake prediction. The time series data themselves are a sequence ofobservations. Unlike the simple moving average that weights thepast observations equally; exponential smoothing assigns expo-nentially decreasing weights over time.
The trading signal sometimes has the same direction (up ordown) with stock; this makes it unreasonable to choose the thresh-old as 0.5 in the training phase. For overcoming this situation anddeveloping a dynamic threshold, this research applies the adap-tive exponential smoothing method [32] to solve this problem.Exponential smoothing had been used in many applications [33],especially in forecasting model [34,35].
2.4.3. Piecewise Linear Representation, PLROur previous study [1] shows that stock trading signals can be
observed from variations in technical indexes or pattern matching.However, these variations are not easy to observe for all investors,and each trading time point appears and disappears quickly. There-fore, this study attempts to develop an intelligent trading pointprediction system that investors can use to make a good trad-
ing strategy. Some recent studies applied PLR to pattern matching[36,37]. This study takes a different approach using PLR to iden-tify the trough and peak of historical data. Based on these tradingpoints, an Evolving Neural Network model is built to forecast the
P.-C. Chang et al. / Applied Soft Computing 11 (2011) 3998–4010 4001
e poss
fi
otdedntspofts
2stvtsr
2mepattaidtsalosIt
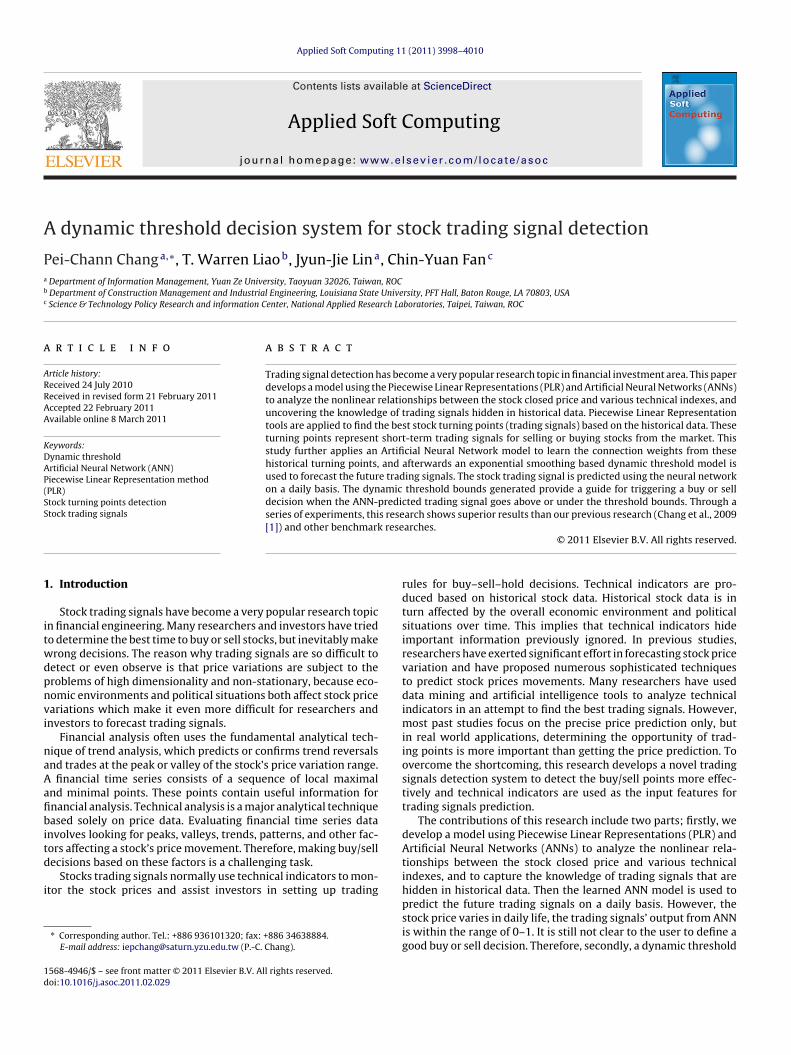
Fig. 1. Using PLR to generat
uture trading point of a specific stock. The main procedures of PLRn predicting the trading point are described as follows:
PLR can be used as a sliding window to find the turning pointsf financial time series data. This method determines the size ofhe sliding window, and labels the relative maximum or minimumata points within the time window as the turning points. How-ver, this may not be a very good approach, since the turning pointsepend upon the size of the sliding window. If the window size isot properly set, the sub-segments generated by PLR may lead tohe wrong decision for future trading points. Therefore, this studyelects historical data for piecewise representation. The turningoints decided in this approach are therefore more representativef PLR and can be used to predict future trading points. Another keyactor to be decided is the threshold value of a piecewise represen-ation, which will be explained in greater detail in the followingection.
.4.3.1. Setup the segmentation threshold value (ı) of PLR. Largeregmentation threshold value will create long trend patterns; onhe contrary, the patterns are very sensitive when the thresholdalue is very small. This research adopts genetic algorithms to fine-une the threshold value (ı). Depending on the variation of eachtock in the historical data, the threshold value is set up within theange of [0.01,5.0].
.4.3.2. Trading point decision. PLR were developed for patternatching, the advantage of this approach is to find the local
xtrema. The contribution of this study is that it uses PLR out-uts to generate possible trading points. Take the Apple stock asn example. PLR will generate a segmentation diagram accordingo the threshold value applied. The graphs in Fig. 1 show the originalime series and the segmentation result in steps. These segmentsre transformed later and regarded as trading signals to be used asnput into the ANN for supervised learning. It is worthy to note thatifferent threshold values for PLR will provide different segmenta-ion results. A smaller threshold value represents a more detailedegmentation thus it is more sensitive with stock variation. Whilelarger threshold value represents a coarse segmentation that is a
onger trend of the stock; therefore, this study uses different thresh-
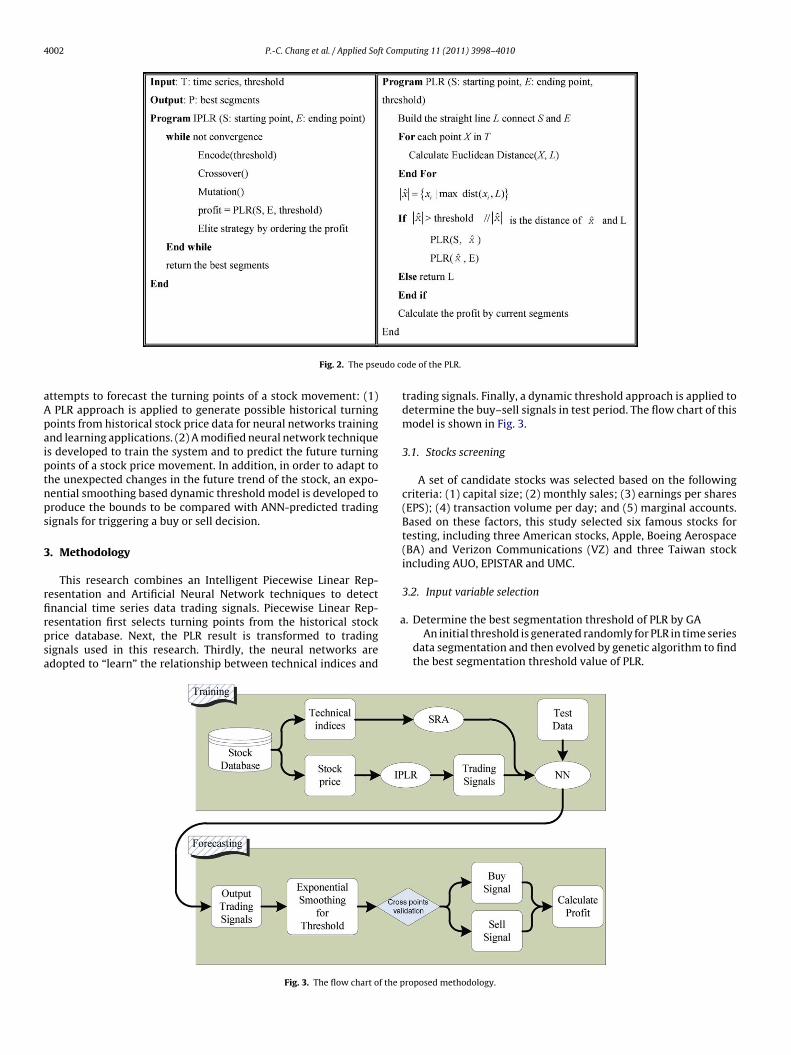
ld values in PLR to study the variation of the proposed model andelects the one that makes the most profit within these values.n addition, Fig. 2 lists the pseudo codes of PLR used to generaterading points.ible trading points (Apple).
The quality of the trading points generated by PLR is determinedby the threshold value (ı). In the traditional application, a tradingsignal is usually determined based on financial experts’ opinions.The financial experts use technical analysis and economic situa-tions to make a trading decision. If the trading signal is not properlydetermined, the investor can make a mistake and lose money. How-ever, this study links these trading decisions to the financial expertof the threshold value (ı). In summary, this study applies GA to opti-mize the threshold value of PLR, with the expectation of generatingbetter sub-segments and higher profits.
As discussed above, a considerable amount of research has beenconducted to study the behavior of stock price movements. How-ever, investor are more interested in making profit by followingsimple trading decision such as buy/hold/sell from the systemrather than predicting the stock price itself. Therefore, this studydevelops an intelligent stock trading decision support system byproviding trading signals to investors based on stock price varia-tions.
2.4.4. Neural networksTraditional Artificial Neural Networks (ANNs) simulate the bio-
logical neural networks in human brains. ANNs area kind of“learning algorithm”; that is, they can be trained to improvetheir performance by either supervised or unsupervised learning.A back-propagation network (BPN) is the most useful techniquein the supervised learning of Artificial Neural Networks (ANNs),and therefore, this study chooses supervised learning, i.e., learnedby samples. After learning (or training), the trained weight canbe used to predict future occurrence. The BPN method has beenwidely applied to many scientific and commercial fields for non-linear analysis and prediction. However, some researchers, like Yao[38] doubt the efficiency of traditional neural networks. The mostimportant reason for this doubt is that the learning algorithm isstrictly dependent on the shape of the error surface and the ini-tial connection weights, so it means that Artificial Neural Networkcannot converge to the global optimum. These limitations makeArtificial Neural Networks inconsistent and unpredictable in dif-ferent applications [39–42]. In this research, because the issues ofneural networks described above, we design a transform functionof trading signals and make it easier to be learned by neural net-
works. Furthermore, a dynamic threshold strategy is adopted todiscover good trading points from the output of neural networks.Prediction of a financial market is rather challenging dueto chaos and uncertainty of the system. This study makes two
4002 P.-C. Chang et al. / Applied Soft Computing 11 (2011) 3998–4010
udo co
aApaiptnps
3
rfirpsa
Fig. 2. The pse
ttempts to forecast the turning points of a stock movement: (1)PLR approach is applied to generate possible historical turning
oints from historical stock price data for neural networks trainingnd learning applications. (2) A modified neural network techniques developed to train the system and to predict the future turningoints of a stock price movement. In addition, in order to adapt tohe unexpected changes in the future trend of the stock, an expo-ential smoothing based dynamic threshold model is developed toroduce the bounds to be compared with ANN-predicted tradingignals for triggering a buy or sell decision.
. Methodology
This research combines an Intelligent Piecewise Linear Rep-esentation and Artificial Neural Network techniques to detectnancial time series data trading signals. Piecewise Linear Rep-
esentation first selects turning points from the historical stockrice database. Next, the PLR result is transformed to tradingignals used in this research. Thirdly, the neural networks aredopted to “learn” the relationship between technical indices anda
Fig. 3. The flow chart of the p
de of the PLR.
trading signals. Finally, a dynamic threshold approach is applied todetermine the buy–sell signals in test period. The flow chart of thismodel is shown in Fig. 3.
3.1. Stocks screening
A set of candidate stocks was selected based on the followingcriteria: (1) capital size; (2) monthly sales; (3) earnings per shares(EPS); (4) transaction volume per day; and (5) marginal accounts.Based on these factors, this study selected six famous stocks fortesting, including three American stocks, Apple, Boeing Aerospace(BA) and Verizon Communications (VZ) and three Taiwan stockincluding AUO, EPISTAR and UMC.
3.2. Input variable selection
. Determine the best segmentation threshold of PLR by GAAn initial threshold is generated randomly for PLR in time series
data segmentation and then evolved by genetic algorithm to findthe best segmentation threshold value of PLR.
roposed methodology.
P.-C. Chang et al. / Applied Soft Computing 11 (2011) 3998–4010 4003
Ft
b
c
0.0 0.1 0.2 0.3 0.4 0.5 0.6 0.7 0.8 0.9 1.0
1 6 11 16 21 26 31 36 41 46 51 56 61 66 71 76 81 86 91 96 101
106
111
116
Trading Signals
d
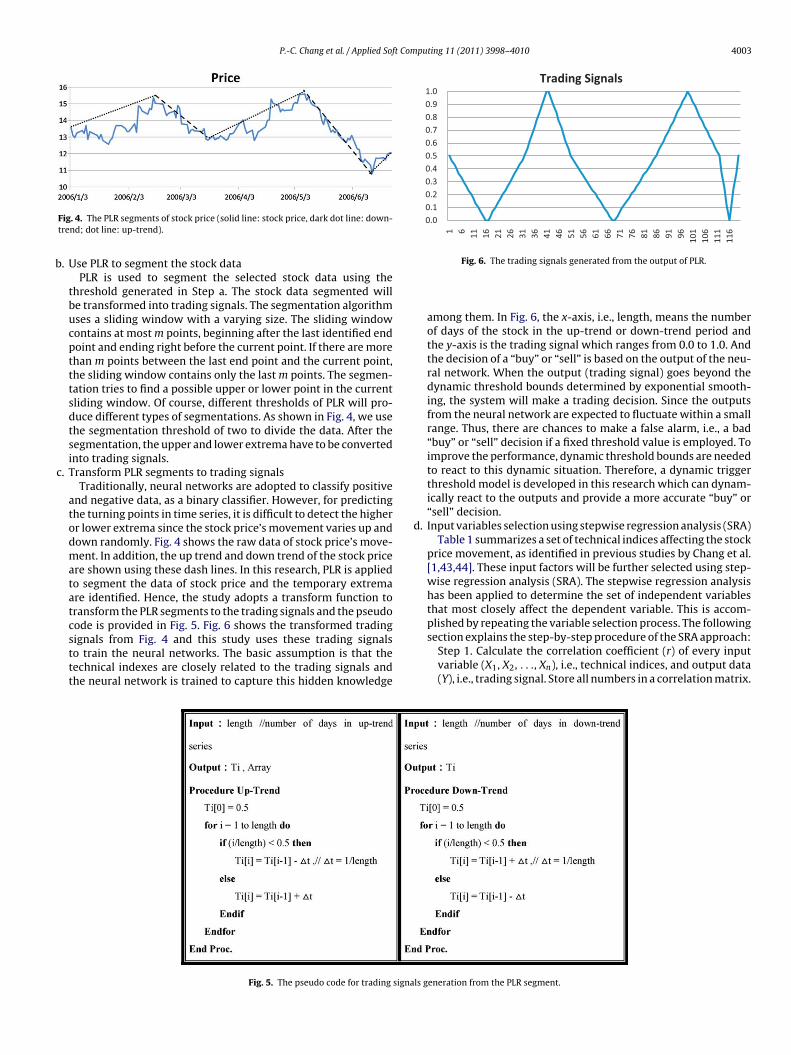
ig. 4. The PLR segments of stock price (solid line: stock price, dark dot line: down-rend; dot line: up-trend).
. Use PLR to segment the stock dataPLR is used to segment the selected stock data using the
threshold generated in Step a. The stock data segmented willbe transformed into trading signals. The segmentation algorithmuses a sliding window with a varying size. The sliding windowcontains at most m points, beginning after the last identified endpoint and ending right before the current point. If there are morethan m points between the last end point and the current point,the sliding window contains only the last m points. The segmen-tation tries to find a possible upper or lower point in the currentsliding window. Of course, different thresholds of PLR will pro-duce different types of segmentations. As shown in Fig. 4, we usethe segmentation threshold of two to divide the data. After thesegmentation, the upper and lower extrema have to be convertedinto trading signals.
. Transform PLR segments to trading signalsTraditionally, neural networks are adopted to classify positive
and negative data, as a binary classifier. However, for predictingthe turning points in time series, it is difficult to detect the higheror lower extrema since the stock price’s movement varies up anddown randomly. Fig. 4 shows the raw data of stock price’s move-ment. In addition, the up trend and down trend of the stock priceare shown using these dash lines. In this research, PLR is appliedto segment the data of stock price and the temporary extremaare identified. Hence, the study adopts a transform function totransform the PLR segments to the trading signals and the pseudocode is provided in Fig. 5. Fig. 6 shows the transformed trading
signals from Fig. 4 and this study uses these trading signalsto train the neural networks. The basic assumption is that thetechnical indexes are closely related to the trading signals andthe neural network is trained to capture this hidden knowledgeFig. 5. The pseudo code for trading signal
Fig. 6. The trading signals generated from the output of PLR.
among them. In Fig. 6, the x-axis, i.e., length, means the numberof days of the stock in the up-trend or down-trend period andthe y-axis is the trading signal which ranges from 0.0 to 1.0. Andthe decision of a “buy” or “sell” is based on the output of the neu-ral network. When the output (trading signal) goes beyond thedynamic threshold bounds determined by exponential smooth-ing, the system will make a trading decision. Since the outputsfrom the neural network are expected to fluctuate within a smallrange. Thus, there are chances to make a false alarm, i.e., a bad“buy” or “sell” decision if a fixed threshold value is employed. Toimprove the performance, dynamic threshold bounds are neededto react to this dynamic situation. Therefore, a dynamic triggerthreshold model is developed in this research which can dynam-ically react to the outputs and provide a more accurate “buy” or“sell” decision.
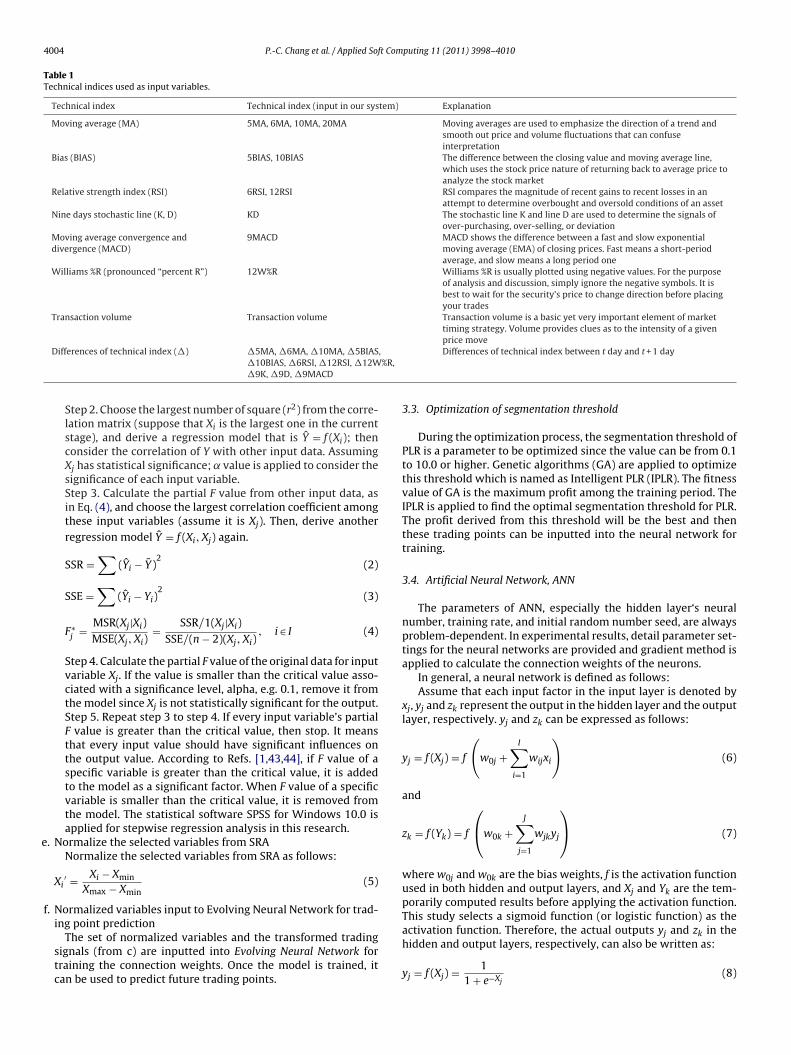
. Input variables selection using stepwise regression analysis (SRA)Table 1 summarizes a set of technical indices affecting the stock
price movement, as identified in previous studies by Chang et al.[1,43,44]. These input factors will be further selected using step-wise regression analysis (SRA). The stepwise regression analysishas been applied to determine the set of independent variablesthat most closely affect the dependent variable. This is accom-plished by repeating the variable selection process. The followingsection explains the step-by-step procedure of the SRA approach:
Step 1. Calculate the correlation coefficient (r) of every input
variable (X1, X2, . . ., Xn), i.e., technical indices, and output data(Y), i.e., trading signal. Store all numbers in a correlation matrix.s generation from the PLR segment.
4004 P.-C. Chang et al. / Applied Soft Computing 11 (2011) 3998–4010
Table 1Technical indices used as input variables.
Technical index Technical index (input in our system) Explanation
Moving average (MA) 5MA, 6MA, 10MA, 20MA Moving averages are used to emphasize the direction of a trend andsmooth out price and volume fluctuations that can confuseinterpretation
Bias (BIAS) 5BIAS, 10BIAS The difference between the closing value and moving average line,which uses the stock price nature of returning back to average price toanalyze the stock market
Relative strength index (RSI) 6RSI, 12RSI RSI compares the magnitude of recent gains to recent losses in anattempt to determine overbought and oversold conditions of an asset
Nine days stochastic line (K, D) KD The stochastic line K and line D are used to determine the signals ofover-purchasing, over-selling, or deviation
Moving average convergence anddivergence (MACD)
9MACD MACD shows the difference between a fast and slow exponentialmoving average (EMA) of closing prices. Fast means a short-periodaverage, and slow means a long period one
Williams %R (pronounced “percent R”) 12W%R Williams %R is usually plotted using negative values. For the purposeof analysis and discussion, simply ignore the negative symbols. It isbest to wait for the security’s price to change direction before placingyour trades
Transaction volume Transaction volume Transaction volume is a basic yet very important element of markettiming strategy. Volume provides clues as to the intensity of a givenprice move
,%R,
e
f
Differences of technical index (�) �5MA, �6MA, �10MA, �5BIAS�10BIAS, �6RSI, �12RSI, �12W�9K, �9D, �9MACD
Step 2. Choose the largest number of square (r2) from the corre-lation matrix (suppose that Xi is the largest one in the currentstage), and derive a regression model that is Y = f (Xi); thenconsider the correlation of Y with other input data. AssumingXj has statistical significance; ˛ value is applied to consider thesignificance of each input variable.Step 3. Calculate the partial F value from other input data, asin Eq. (4), and choose the largest correlation coefficient amongthese input variables (assume it is Xj). Then, derive anotherregression model Y = f (Xi, Xj) again.
SSR =∑
(Yi − Y)2
(2)
SSE =∑
(Yi − Yi)2
(3)
F∗j = MSR(Xj|Xi)
MSE(Xj, Xi)= SSR/1(Xj|Xi)
SSE/(n − 2)(Xj, Xi), i ∈ I (4)
Step 4. Calculate the partial F value of the original data for inputvariable Xj. If the value is smaller than the critical value asso-ciated with a significance level, alpha, e.g. 0.1, remove it fromthe model since Xj is not statistically significant for the output.Step 5. Repeat step 3 to step 4. If every input variable’s partialF value is greater than the critical value, then stop. It meansthat every input value should have significant influences onthe output value. According to Refs. [1,43,44], if F value of aspecific variable is greater than the critical value, it is addedto the model as a significant factor. When F value of a specificvariable is smaller than the critical value, it is removed fromthe model. The statistical software SPSS for Windows 10.0 isapplied for stepwise regression analysis in this research.
. Normalize the selected variables from SRANormalize the selected variables from SRA as follows:
Xi′ = Xi − Xmin
Xmax − Xmin(5)
. Normalized variables input to Evolving Neural Network for trad-ing point prediction
The set of normalized variables and the transformed tradingsignals (from c) are inputted into Evolving Neural Network fortraining the connection weights. Once the model is trained, itcan be used to predict future trading points.
Differences of technical index between t day and t + 1 day
3.3. Optimization of segmentation threshold
During the optimization process, the segmentation threshold ofPLR is a parameter to be optimized since the value can be from 0.1to 10.0 or higher. Genetic algorithms (GA) are applied to optimizethis threshold which is named as Intelligent PLR (IPLR). The fitnessvalue of GA is the maximum profit among the training period. TheIPLR is applied to find the optimal segmentation threshold for PLR.The profit derived from this threshold will be the best and thenthese trading points can be inputted into the neural network fortraining.
3.4. Artificial Neural Network, ANN
The parameters of ANN, especially the hidden layer‘s neuralnumber, training rate, and initial random number seed, are alwaysproblem-dependent. In experimental results, detail parameter set-tings for the neural networks are provided and gradient method isapplied to calculate the connection weights of the neurons.
In general, a neural network is defined as follows:Assume that each input factor in the input layer is denoted by
xj, yj and zk represent the output in the hidden layer and the outputlayer, respectively. yj and zk can be expressed as follows:
yj = f (Xj) = f
(w0j +
I∑i=1
wijxi
)(6)
and
zk = f (Yk) = f
⎛⎝w0k +
J∑j=1
wjkyj
⎞⎠ (7)
where w0j and w0k are the bias weights, f is the activation functionused in both hidden and output layers, and Xj and Yk are the tem-porarily computed results before applying the activation function.This study selects a sigmoid function (or logistic function) as theactivation function. Therefore, the actual outputs y and z in the
j khidden and output layers, respectively, can also be written as:yj = f (Xj) = 11 + e−Xj
(8)
P.-C. Chang et al. / Applied Soft Computing 11 (2011) 3998–4010 4005
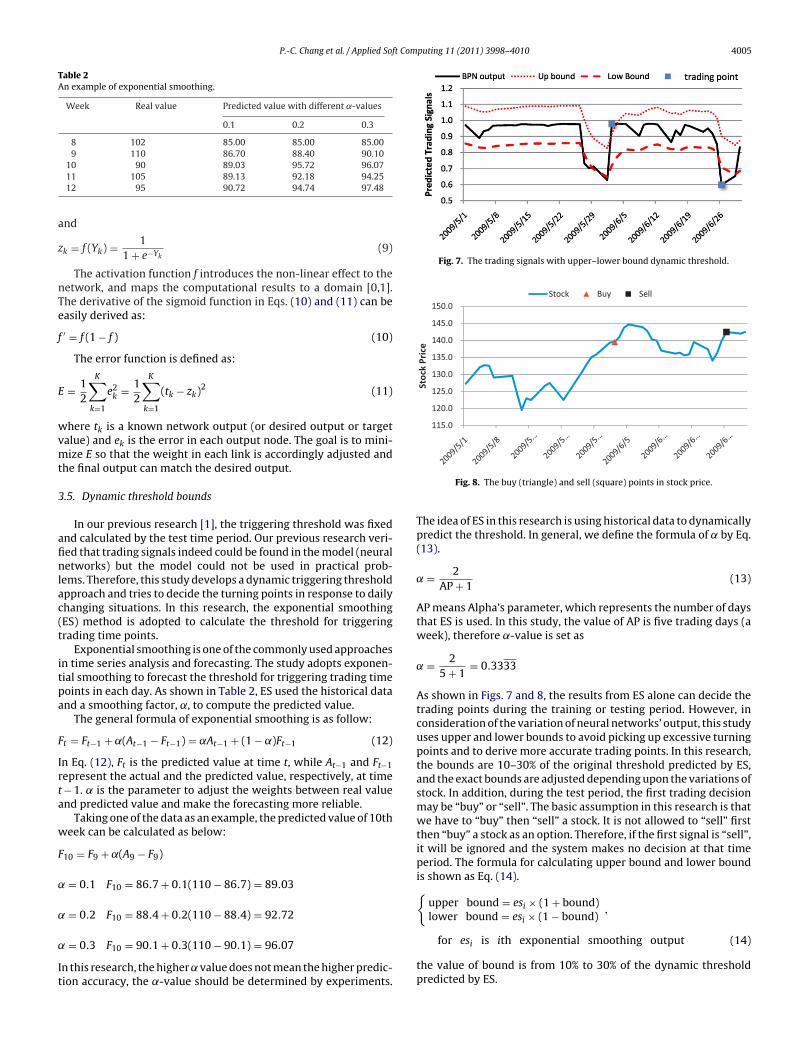
Table 2An example of exponential smoothing.
Week Real value Predicted value with different ˛-values
0.1 0.2 0.3
8 102 85.00 85.00 85.009 110 86.70 88.40 90.10
a
z
nTe
f
E
wvmt
3
afinlac(t
itpa
F
Irta
w
F
˛
˛
˛
It
Fig. 7. The trading signals with upper–lower bound dynamic threshold.
10 90 89.03 95.72 96.0711 105 89.13 92.18 94.2512 95 90.72 94.74 97.48
nd
k = f (Yk) = 11 + e−Yk
(9)
The activation function f introduces the non-linear effect to theetwork, and maps the computational results to a domain [0,1].he derivative of the sigmoid function in Eqs. (10) and (11) can beasily derived as:
′ = f (1 − f ) (10)
The error function is defined as:
= 12
K∑k=1
e2k = 1
2
K∑k=1
(tk − zk)2 (11)
here tk is a known network output (or desired output or targetalue) and ek is the error in each output node. The goal is to mini-ize E so that the weight in each link is accordingly adjusted and
he final output can match the desired output.
.5. Dynamic threshold bounds
In our previous research [1], the triggering threshold was fixednd calculated by the test time period. Our previous research veri-ed that trading signals indeed could be found in the model (neuraletworks) but the model could not be used in practical prob-
ems. Therefore, this study develops a dynamic triggering thresholdpproach and tries to decide the turning points in response to dailyhanging situations. In this research, the exponential smoothingES) method is adopted to calculate the threshold for triggeringrading time points.
Exponential smoothing is one of the commonly used approachesn time series analysis and forecasting. The study adopts exponen-ial smoothing to forecast the threshold for triggering trading timeoints in each day. As shown in Table 2, ES used the historical datand a smoothing factor, ˛, to compute the predicted value.
The general formula of exponential smoothing is as follow:
t = Ft−1 + ˛(At−1 − Ft−1) = ˛At−1 + (1 − ˛)Ft−1 (12)
n Eq. (12), Ft is the predicted value at time t, while At−1 and Ft−1epresent the actual and the predicted value, respectively, at time− 1. ˛ is the parameter to adjust the weights between real valuend predicted value and make the forecasting more reliable.
Taking one of the data as an example, the predicted value of 10theek can be calculated as below:
10 = F9 + ˛(A9 − F9)
= 0.1 F10 = 86.7 + 0.1(110 − 86.7) = 89.03
= 0.2 F10 = 88.4 + 0.2(110 − 88.4) = 92.72
= 0.3 F10 = 90.1 + 0.3(110 − 90.1) = 96.07
n this research, the higher ˛ value does not mean the higher predic-ion accuracy, the ˛-value should be determined by experiments.
Fig. 8. The buy (triangle) and sell (square) points in stock price.
The idea of ES in this research is using historical data to dynamicallypredict the threshold. In general, we define the formula of ˛ by Eq.(13).
˛ = 2AP + 1
(13)
AP means Alpha’s parameter, which represents the number of daysthat ES is used. In this study, the value of AP is five trading days (aweek), therefore ˛-value is set as
˛ = 25 + 1
= 0.3333
As shown in Figs. 7 and 8, the results from ES alone can decide thetrading points during the training or testing period. However, inconsideration of the variation of neural networks’ output, this studyuses upper and lower bounds to avoid picking up excessive turningpoints and to derive more accurate trading points. In this research,the bounds are 10–30% of the original threshold predicted by ES,and the exact bounds are adjusted depending upon the variations ofstock. In addition, during the test period, the first trading decisionmay be “buy” or “sell”. The basic assumption in this research is thatwe have to “buy” then “sell” a stock. It is not allowed to “sell” firstthen “buy” a stock as an option. Therefore, if the first signal is “sell”,it will be ignored and the system makes no decision at that timeperiod. The formula for calculating upper bound and lower boundis shown as Eq. (14).{
upper bound = esi × (1 + bound)lower bound = esi × (1 − bound)
,
for es is ith exponential smoothing output (14)
ithe value of bound is from 10% to 30% of the dynamic thresholdpredicted by ES.
4006 P.-C. Chang et al. / Applied Soft Computing 11 (2011) 3998–4010
50.0
70.0
90.0
110.0
130.0
150.0
170.0
190.0
210.0
2008/1/2 2008/4/2 2008/7/2 2008/10/2 2009/1/2 2009/4/2
Pri
ce (
Cur
renc
y in
USD
)
Apple
3
iaF
4
psTtfthsaityipmtottfe(E
20.0
22.0
24.0
26.0
28.0
30.0
32.0
34.0
36.0
38.0
2008/1/2 2008/4/2 2008/7/2 2008/10/2 2009/1/2 2009/4/2
Pri
ce (
Cur
renc
y in
USD
)
VZ
Fig. 11. Verizon Communications (VZ) stock price and trend line.
4.0 6.0 8.0
10.0 12.0 14.0 16.0 18.0 20.0 22.0
Pri
ce (
Cur
renc
y in
USD
)
AUO
Fig. 12. AUO stock price and trend line.
0.0 20.0 40.0 60.0 80.0
100.0 120.0 140.0 160.0 180.0 200.0
Pri
ce (
Cur
renc
y in
TW
D)
EPISTAR
Fig. 9. Apple stock price and trend line.
.6. Estimate the earning
The earning of each stock traded within these testing periodss calculated based on an initial investment of US 100,000 dollarsnd typical transaction costs in the current stock exchange market.inally, the net profit is computed.
. Numerical examples
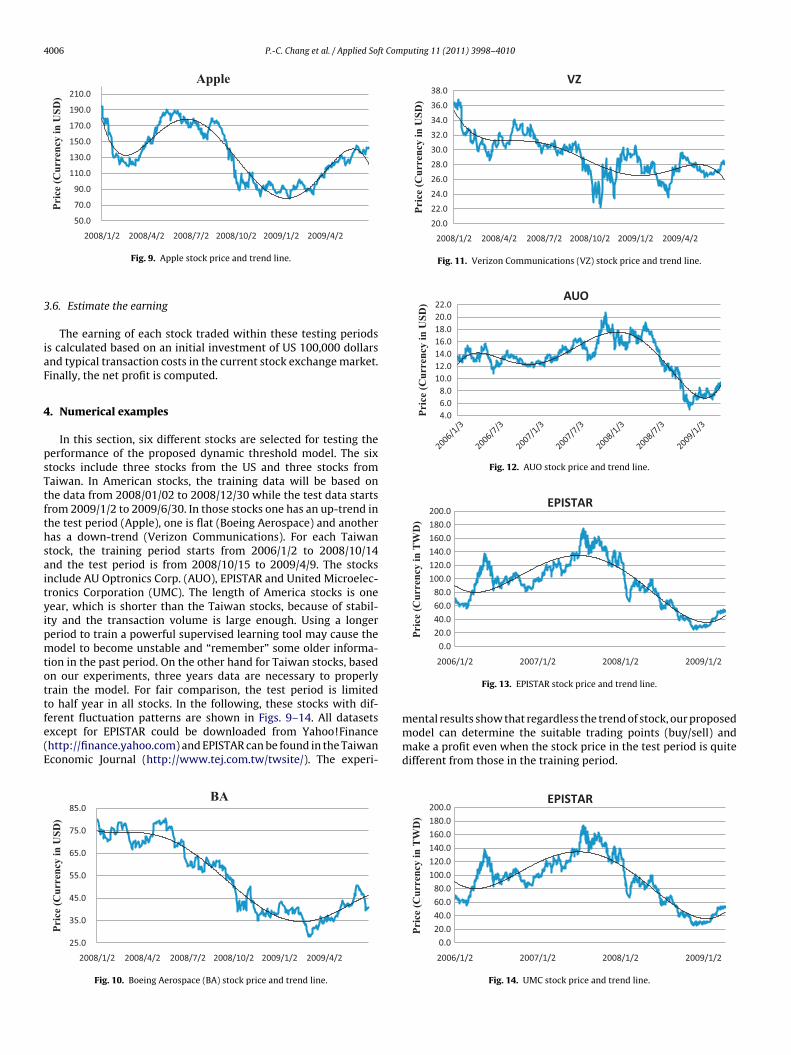
In this section, six different stocks are selected for testing theerformance of the proposed dynamic threshold model. The sixtocks include three stocks from the US and three stocks fromaiwan. In American stocks, the training data will be based onhe data from 2008/01/02 to 2008/12/30 while the test data startsrom 2009/1/2 to 2009/6/30. In those stocks one has an up-trend inhe test period (Apple), one is flat (Boeing Aerospace) and anotheras a down-trend (Verizon Communications). For each Taiwantock, the training period starts from 2006/1/2 to 2008/10/14nd the test period is from 2008/10/15 to 2009/4/9. The stocksnclude AU Optronics Corp. (AUO), EPISTAR and United Microelec-ronics Corporation (UMC). The length of America stocks is oneear, which is shorter than the Taiwan stocks, because of stabil-ty and the transaction volume is large enough. Using a longereriod to train a powerful supervised learning tool may cause theodel to become unstable and “remember” some older informa-
ion in the past period. On the other hand for Taiwan stocks, basedn our experiments, three years data are necessary to properlyrain the model. For fair comparison, the test period is limitedo half year in all stocks. In the following, these stocks with dif-erent fluctuation patterns are shown in Figs. 9–14. All datasets
xcept for EPISTAR could be downloaded from Yahoo!Financehttp://finance.yahoo.com) and EPISTAR can be found in the Taiwanconomic Journal (http://www.tej.com.tw/twsite/). The experi-25.0
35.0
45.0
55.0
65.0
75.0
85.0
2008/1/2 2008/4/2 2008/7/2 2008/10/2 2009/1/2 2009/4/2
Pri
ce (
Cur
renc
y in
USD
)
BA
Fig. 10. Boeing Aerospace (BA) stock price and trend line.
2006/1/2 2007/1/2 2008/1/2 2009/1/2
Fig. 13. EPISTAR stock price and trend line.
mental results show that regardless the trend of stock, our proposed
model can determine the suitable trading points (buy/sell) andmake a profit even when the stock price in the test period is quitedifferent from those in the training period.0.0 20.0 40.0 60.0 80.0
100.0 120.0 140.0 160.0 180.0 200.0
2006/1/2 2007/1/2 2008/1/2 2009/1/2
Pri
ce (
Cur
renc
y in
TW
D)
EPISTAR
Fig. 14. UMC stock price and trend line.
P.-C. Chang et al. / Applied Soft Computing 11 (2011) 3998–4010 4007
Table 3The parameter setup for ENN by DOE (Design of Experiments).
Parameter Best
# of neuron in hidden layer 7Transfer function SigmoidLearning rule Least Mean Square (LMS)# of learning epoches 1000
Table 4Input variables for different segmentation threshold values by SRA for PLR.
Initial threshold (ı) Selected factors Profits
2 5BIAS 53,432.13 9MACD, �5BIAS 55,653.1
4
imatf
4l�tt
p
woi
4
pmre[potTooFgFi
r
4
Tp
(a)
(b)
70.0
80.0
90.0
100.0
110.0
120.0
130.0
140.0
150.0
2009/1/2 2009/2/11 2009/3/23 2009/5/2 2009/6/11
Pri
ce (
Cur
renc
y in
USD
)
Apple Price Sell Buy
0.0
0.2
0.4
0.6
0.8
1.0
1.2
1 6 11 16 21 26 31 36 41 46 51 56 61 66 71 76 81 86 91 96 101
106
111
116
121
Apple
financial environment and any event suddenly occurs in any coun-try will affect the financial market abruptly owing to the closelyrelated global economic situation. Therefore, a dynamic thresholdbased strategy will improve our system, making it more accurate
(a)
(b)
25.0
30.0
35.0
40.0
45.0
50.0
55.0
2009/1/5 2009/2/14 2009/3/26 2009/5/5 2009/6/14
Pri
ce (
Cur
renc
y in
USD
)
BA Price Sell Buy
0.0
0.2
0.4
0.6
0.8
1.0
1.2 BA
4 �5BIAS, �9K, �9MACD 61,280.35 12W%R, �5BIAS, �6MA 56,276.26 5BIAS 53,720.7
.1. Input variables and parameter settings of ANN
The parameter setting of ANN including the number of neuronsn the hidden layer, transfer function, learning rule, etc., are deter-
ined based on a DOE (Design of Experiments). These parametersre very important since they will affect the system performance ifhey are not properly adjusted. The final set up of the parametersor ANN is listed in Table 3 after the DOE experimental tests.
For the Apple stock, the best segmentation threshold value is.0 with the maximum profit. The formula of profit calculation is
isted in Eq. (15) and the input variables selected are �5BIAS, �9K,9MACD, as shown in Table 4. These input variables are applied to
he IPLR procedure and they will not be changed at all throughouthe whole forecasting process.
rofit =n∏
i=1
{[(1 − a − b) · Si − (1 + a) · Bi
(1 + a) · Bi
]+ 1}
· C (15)
here a is the tax, b is the transition fee and n means the numberf buy/sell decisions. Si is the sell price; Bi is the buy price while Cs the invested capital.
.2. The comparisons of different prediction models
After setting up the parameters of the experiments, we com-ared the proposed dynamic threshold based neural networksethod with three existing methods. These three different algo-
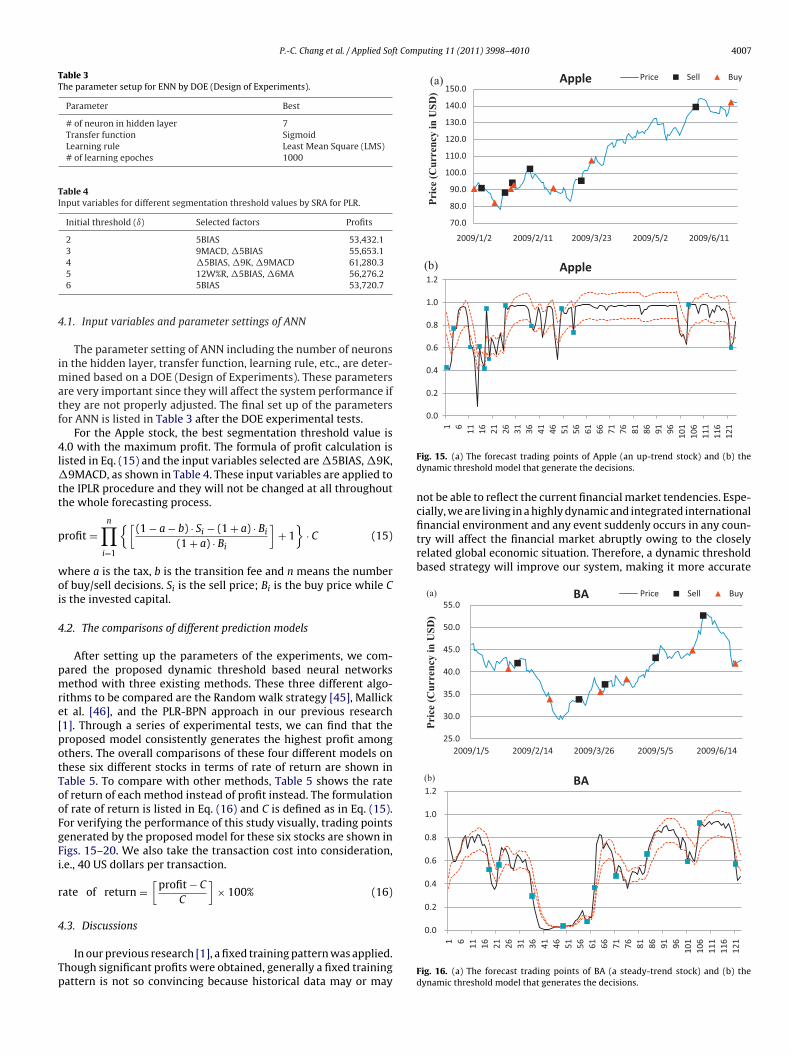
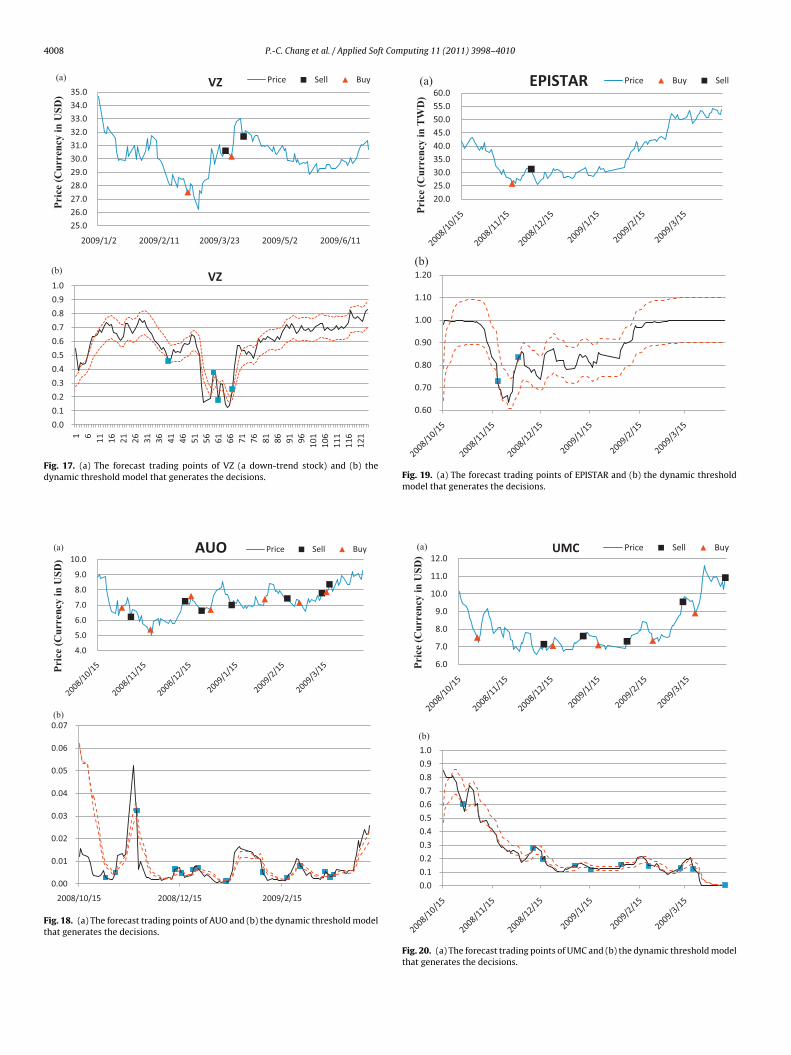
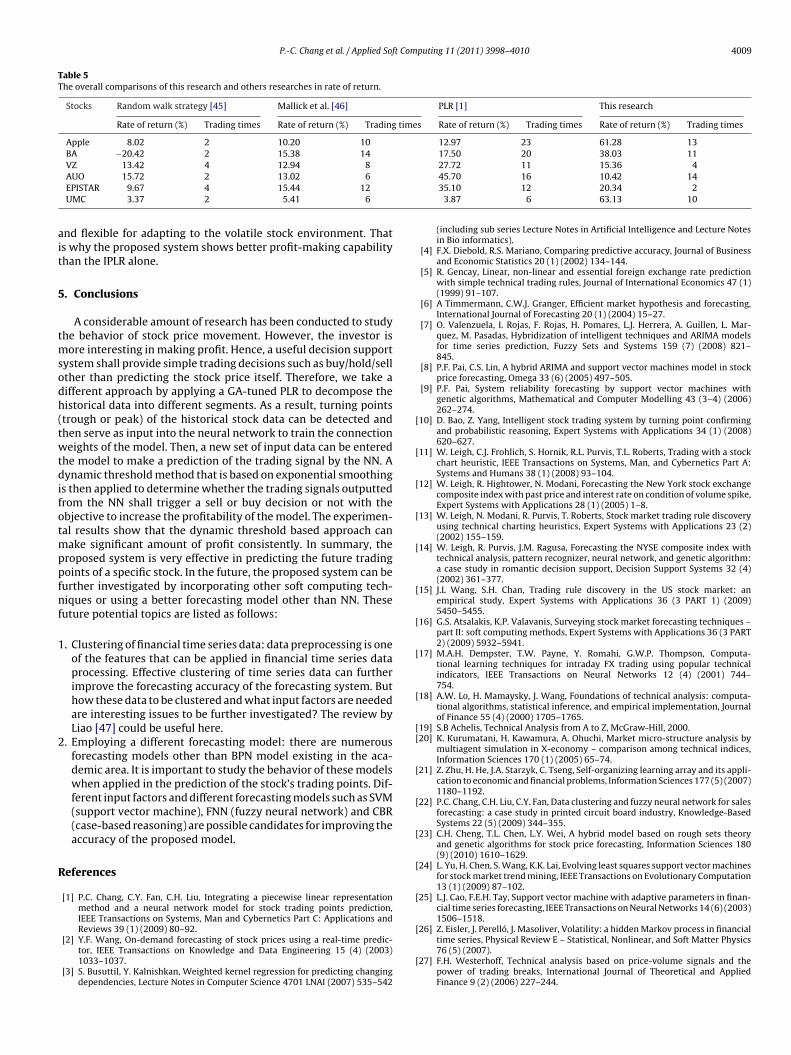
ithms to be compared are the Random walk strategy [45], Mallickt al. [46], and the PLR-BPN approach in our previous research1]. Through a series of experimental tests, we can find that theroposed model consistently generates the highest profit amongthers. The overall comparisons of these four different models onhese six different stocks in terms of rate of return are shown inable 5. To compare with other methods, Table 5 shows the ratef return of each method instead of profit instead. The formulationf rate of return is listed in Eq. (16) and C is defined as in Eq. (15).or verifying the performance of this study visually, trading pointsenerated by the proposed model for these six stocks are shown inigs. 15–20. We also take the transaction cost into consideration,.e., 40 US dollars per transaction.
ate of return =[
profit − C
C
]× 100% (16)
.3. Discussions
In our previous research [1], a fixed training pattern was applied.hough significant profits were obtained, generally a fixed trainingattern is not so convincing because historical data may or may
Fig. 15. (a) The forecast trading points of Apple (an up-trend stock) and (b) thedynamic threshold model that generate the decisions.
not be able to reflect the current financial market tendencies. Espe-cially, we are living in a highly dynamic and integrated international
1 6 11 16 21 26 31 36 41 46 51 56 61 66 71 76 81 86 91 96 101
106
111
116
121
Fig. 16. (a) The forecast trading points of BA (a steady-trend stock) and (b) thedynamic threshold model that generates the decisions.
4008 P.-C. Chang et al. / Applied Soft Computing 11 (2011) 3998–4010
(a)
(b)
25.0 26.0 27.0 28.0 29.0 30.0 31.0 32.0 33.0 34.0 35.0
2009/1/2 2009/2/11 2009/3/23 2009/5/2 2009/6/11
Pri
ce (
Cur
renc
y in
USD
)
VZ Price Sell Buy
0.0
0.1
0.2
0.3
0.4
0.5
0.6
0.7
0.8
0.9
1.0
1 6 11 16 21 26 31 36 41 46 51 56 61 66 71 76 81 86 91 96 101
106
111
116
121
VZ
Fig. 17. (a) The forecast trading points of VZ (a down-trend stock) and (b) thedynamic threshold model that generates the decisions.
(a)
(b)
4.0
5.0
6.0
7.0
8.0
9.0
10.0
Pri
ce (
Cur
renc
y in
USD
)
AUO Price Sell Buy
0.00
0.01
0.02
0.03
0.04
0.05
0.06
0.07
2008/10/15 2008/12/15 2009/2/15
Fig. 18. (a) The forecast trading points of AUO and (b) the dynamic threshold modelthat generates the decisions.
(a)
(b)
20.0 25.0 30.0 35.0 40.0 45.0 50.0 55.0 60.0
Pri
ce (
Cur
renc
y in
TW
D)
EPISTAR Price Buy Sell
0.60
0.70
0.80
0.90
1.00
1.10
1.20
Fig. 19. (a) The forecast trading points of EPISTAR and (b) the dynamic thresholdmodel that generates the decisions.
(a)
(b)
6.0
7.0
8.0
9.0
10.0
11.0
12.0
Pri
ce (
Cur
renc
y in
USD
)
UMC Price Sell Buy
0.0 0.1 0.2 0.3 0.4 0.5 0.6 0.7 0.8 0.9 1.0
Fig. 20. (a) The forecast trading points of UMC and (b) the dynamic threshold modelthat generates the decisions.
P.-C. Chang et al. / Applied Soft Computing 11 (2011) 3998–4010 4009
Table 5The overall comparisons of this research and others researches in rate of return.
Stocks Random walk strategy [45] Mallick et al. [46] PLR [1] This research
Rate of return (%) Trading times Rate of return (%) Trading times Rate of return (%) Trading times Rate of return (%) Trading times
Apple 8.02 2 10.20 10 12.97 23 61.28 13BA −20.42 2 15.38 14 17.50 20 38.03 11VZ 13.42 4 12.94 8 27.72 11 15.36 4
ait
5
tmsodh(twtdifotmppfnf
1
2
R
[
[
[
[
[
[
[
[
[
[[
[
[
[
[
[
[
AUO 15.72 2 13.02 6EPISTAR 9.67 4 15.44 12UMC 3.37 2 5.41 6
nd flexible for adapting to the volatile stock environment. Thats why the proposed system shows better profit-making capabilityhan the IPLR alone.
. Conclusions
A considerable amount of research has been conducted to studyhe behavior of stock price movement. However, the investor is
ore interesting in making profit. Hence, a useful decision supportystem shall provide simple trading decisions such as buy/hold/sellther than predicting the stock price itself. Therefore, we take aifferent approach by applying a GA-tuned PLR to decompose theistorical data into different segments. As a result, turning pointstrough or peak) of the historical stock data can be detected andhen serve as input into the neural network to train the connectioneights of the model. Then, a new set of input data can be entered
he model to make a prediction of the trading signal by the NN. Aynamic threshold method that is based on exponential smoothing
s then applied to determine whether the trading signals outputtedrom the NN shall trigger a sell or buy decision or not with thebjective to increase the profitability of the model. The experimen-al results show that the dynamic threshold based approach can
ake significant amount of profit consistently. In summary, theroposed system is very effective in predicting the future tradingoints of a specific stock. In the future, the proposed system can beurther investigated by incorporating other soft computing tech-iques or using a better forecasting model other than NN. These
uture potential topics are listed as follows:
. Clustering of financial time series data: data preprocessing is oneof the features that can be applied in financial time series dataprocessing. Effective clustering of time series data can furtherimprove the forecasting accuracy of the forecasting system. Buthow these data to be clustered and what input factors are neededare interesting issues to be further investigated? The review byLiao [47] could be useful here.
. Employing a different forecasting model: there are numerousforecasting models other than BPN model existing in the aca-demic area. It is important to study the behavior of these modelswhen applied in the prediction of the stock’s trading points. Dif-ferent input factors and different forecasting models such as SVM(support vector machine), FNN (fuzzy neural network) and CBR(case-based reasoning) are possible candidates for improving theaccuracy of the proposed model.
eferences
[1] P.C. Chang, C.Y. Fan, C.H. Liu, Integrating a piecewise linear representationmethod and a neural network model for stock trading points prediction,IEEE Transactions on Systems, Man and Cybernetics Part C: Applications andReviews 39 (1) (2009) 80–92.
[2] Y.F. Wang, On-demand forecasting of stock prices using a real-time predic-tor, IEEE Transactions on Knowledge and Data Engineering 15 (4) (2003)1033–1037.
[3] S. Busuttil, Y. Kalnishkan, Weighted kernel regression for predicting changingdependencies, Lecture Notes in Computer Science 4701 LNAI (2007) 535–542
[
45.70 16 10.42 1435.10 12 20.34 2
3.87 6 63.13 10
(including sub series Lecture Notes in Artificial Intelligence and Lecture Notesin Bio informatics).
[4] F.X. Diebold, R.S. Mariano, Comparing predictive accuracy, Journal of Businessand Economic Statistics 20 (1) (2002) 134–144.
[5] R. Gencay, Linear, non-linear and essential foreign exchange rate predictionwith simple technical trading rules, Journal of International Economics 47 (1)(1999) 91–107.
[6] A Timmermann, C.W.J. Granger, Efficient market hypothesis and forecasting,International Journal of Forecasting 20 (1) (2004) 15–27.
[7] O. Valenzuela, I. Rojas, F. Rojas, H. Pomares, L.J. Herrera, A. Guillen, L. Mar-quez, M. Pasadas, Hybridization of intelligent techniques and ARIMA modelsfor time series prediction, Fuzzy Sets and Systems 159 (7) (2008) 821–845.
[8] P.F. Pai, C.S. Lin, A hybrid ARIMA and support vector machines model in stockprice forecasting, Omega 33 (6) (2005) 497–505.
[9] P.F. Pai, System reliability forecasting by support vector machines withgenetic algorithms, Mathematical and Computer Modelling 43 (3–4) (2006)262–274.
10] D. Bao, Z. Yang, Intelligent stock trading system by turning point confirmingand probabilistic reasoning, Expert Systems with Applications 34 (1) (2008)620–627.
11] W. Leigh, C.J. Frohlich, S. Hornik, R.L. Purvis, T.L. Roberts, Trading with a stockchart heuristic, IEEE Transactions on Systems, Man, and Cybernetics Part A:Systems and Humans 38 (1) (2008) 93–104.
12] W. Leigh, R. Hightower, N. Modani, Forecasting the New York stock exchangecomposite index with past price and interest rate on condition of volume spike,Expert Systems with Applications 28 (1) (2005) 1–8.
13] W. Leigh, N. Modani, R. Purvis, T. Roberts, Stock market trading rule discoveryusing technical charting heuristics, Expert Systems with Applications 23 (2)(2002) 155–159.
14] W. Leigh, R. Purvis, J.M. Ragusa, Forecasting the NYSE composite index withtechnical analysis, pattern recognizer, neural network, and genetic algorithm:a case study in romantic decision support, Decision Support Systems 32 (4)(2002) 361–377.
15] J.L Wang, S.H. Chan, Trading rule discovery in the US stock market: anempirical study, Expert Systems with Applications 36 (3 PART 1) (2009)5450–5455.
16] G.S. Atsalakis, K.P. Valavanis, Surveying stock market forecasting techniques –part II: soft computing methods, Expert Systems with Applications 36 (3 PART2) (2009) 5932–5941.
17] M.A.H. Dempster, T.W. Payne, Y. Romahi, G.W.P. Thompson, Computa-tional learning techniques for intraday FX trading using popular technicalindicators, IEEE Transactions on Neural Networks 12 (4) (2001) 744–754.
18] A.W. Lo, H. Mamaysky, J. Wang, Foundations of technical analysis: computa-tional algorithms, statistical inference, and empirical implementation, Journalof Finance 55 (4) (2000) 1705–1765.
19] S.B Achelis, Technical Analysis from A to Z, McGraw-Hill, 2000.20] K. Kurumatani, H. Kawamura, A. Ohuchi, Market micro-structure analysis by
multiagent simulation in X-economy – comparison among technical indices,Information Sciences 170 (1) (2005) 65–74.
21] Z. Zhu, H. He, J.A. Starzyk, C. Tseng, Self-organizing learning array and its appli-cation to economic and financial problems, Information Sciences 177 (5) (2007)1180–1192.
22] P.C. Chang, C.H. Liu, C.Y. Fan, Data clustering and fuzzy neural network for salesforecasting: a case study in printed circuit board industry, Knowledge-BasedSystems 22 (5) (2009) 344–355.
23] C.H. Cheng, T.L. Chen, L.Y. Wei, A hybrid model based on rough sets theoryand genetic algorithms for stock price forecasting, Information Sciences 180(9) (2010) 1610–1629.
24] L. Yu, H. Chen, S. Wang, K.K. Lai, Evolving least squares support vector machinesfor stock market trend mining, IEEE Transactions on Evolutionary Computation13 (1) (2009) 87–102.
25] L.J. Cao, F.E.H. Tay, Support vector machine with adaptive parameters in finan-cial time series forecasting, IEEE Transactions on Neural Networks 14 (6) (2003)1506–1518.
26] Z. Eisler, J. Perelló, J. Masoliver, Volatility: a hidden Markov process in financial
time series, Physical Review E – Statistical, Nonlinear, and Soft Matter Physics76 (5) (2007).27] F.H. Westerhoff, Technical analysis based on price-volume signals and thepower of trading breaks, International Journal of Theoretical and AppliedFinance 9 (2) (2006) 227–244.
4 ft Com
[
[
[
[
[
[
[
[
[
[
[
[
[
[
[
[
[
[
[
International Conference Service Systems and Service Management – Exploring
010 P.-C. Chang et al. / Applied So
28] S. Thawornwong, D. Enke, C. Dagli, Genetic algorithms and neural networks forstock trading prediction and technical signal optimization, in: Proceedings ofthe Annual Meeting of the Decision Sciences Institute, 2002.
29] Y.K. Kwon, B.R. Moon, A hybrid neurogenetic approach for stock forecasting,IEEE Transactions on Neural Networks 18 (3) (2007) 851–864.
30] G. Armano, M. Marchesi, A. Murru, A hybrid genetic-neural architecture forstock indexes forecasting, Information Sciences 170 (1) (2005) 3–33.
31] F.D. Freitas, A.F. De Souza, A.R. de Almeida, Prediction-based portfolio opti-mization model using neural networks, Neurocomputing 72 (10–12) (2009)2155–2170.
32] D.W. Trigg, A.G. Leach, Exponential smoothing with an adaptive response rate,Operational Research Quarterly 18 (1) (1967) 53–59.
33] E.S. Gardner Jr., Exponential smoothing: the state of the art – part II, Interna-tional Journal of Forecasting 22 (4) (2006) 637–666.
34] E.L. de Faria, M.P. Albuquerque, J.L. Gonzalez, J.T.P. Cavalcante, Predictingthe Brazilian stock market through neural networks and adaptive exponen-tial smoothing methods, Expert Systems with Applications 36 (10) (2009)12506–12509.
35] B. Billah, M.L. King, R.D. Snyder, A.B. Koehler, Exponential smoothing modelselection for forecasting, International Journal of Forecasting 22 (2) (2006)239–247.
36] A. Kimura, K. Kashino, T. Kurozumi, H. Murase, A quick search method for audiosignals based on a piecewise linear representation of feature trajectories, IEEETransactions on Audio, Speech and Language Processing 16 (2) (2008) 396–407.
37] Y. Ding, X. Yang, A.J. Kavs, J. Li, A novel piecewise linear segmentation fortime series, in: Proceedings of the 2010, the 2nd International Conference onComputer and Automation Engineering, 2010.
38] X. Yao, Evolving artificial neural networks, Proceedings of the IEEE 87 (9) (1999)1423–1447.
[
puting 11 (2011) 3998–4010
39] Y. Ikuno, H. Kawabata, Y. Shirao, M. Hirata, T. Nagahara, Y. Iagaki, Application ofan improved genetic algorithm to the learning of neural networks, Solid StateCommunications 91 (3) (1994) 731–735.
40] G. Leng, T.M. McGinnity, G. Prasad, Design for self-organizing fuzzy neural net-works based on genetic algorithms, IEEE Transactions on Fuzzy Systems 14 (6)(2006) 755–765.
41] C.K. Goh, E.J. Teoh, K.C. Tan, Hybrid multiobjective evolutionary design for arti-ficial neural networks, IEEE Transactions on Neural Networks 19 (9) (2008)1531–1548.
42] P.A. Castillo, J.J. Merelo, M.G. Arenas, G. Romero, Comparing evolution-ary hybrid systems for design and optimization of multilayer perceptronstructure along training parameters, Information Sciences 177 (14) (2007)2884–2905.
43] P.C. Chang, C.H. Liu, A TSK type fuzzy rule based system for stock price predic-tion, Expert Systems with Applications 34 (1) (2008) 135–144.
44] P.C. Chang, C.Y. Fan, A hybrid system integrating a wavelet and TSK fuzzy rulesfor stock price forecasting, IEEE Transactions on Systems, Man and CyberneticsPart C: Applications and Reviews 38 (6) (2008) 802–815.
45] C.L. Giles, S. Lawrence, A.C. Tsoi, Noisy time series prediction using a recurrentneural network and grammatical inference, Machine Learning 44 (1–2) (2001)161–183.
46] D. Mallick, V.C.S. Lee, Y.S. Ong, An empirical study of genetic programminggenerated trading rules in computerized stock trading service system, in: 5th
Service Dynamics with Science and Innovative Technology, ICSSSM 2008, 2008,pp. 1–6.
47] T.W. Liao, Clustering of time series data – a survey, Pattern Recognition 38(2005) 1857–1874.