dwelling older adults: focus on bushehr elderly health
TRANSCRIPT

Page 1/19
Association Between Platelet, White Blood Cell Count, PlateletTo White Blood Cell Ratio and Sarcopenia in Community-Dwelling Older Adults: Focus On Bushehr Elderly Health (BEH)ProgramMohamad Gholizade
The Persian Gulf Tropical Medicine Research Center, The Persian Gulf Biomedical Sciences Research Institute, BushehrUniversity of Medical Sciences, Bushehr, IranAkram Farhadi
Department of Health Education and Promotion, Faculty of Health, Bushehr University of Medical Sciences, Bushehr, IranMaryam Marzban ( [email protected] )
The Persian Gulf Tropical Medicine Research Center, The Persian Gulf Biomedical Sciences Research Institute, BushehrUniversity of Medical Sciences, Bushehr, IranMehdi Mahmudpour
The Persian Gulf Tropical Medicine Research Center, The Persian Gulf Biomedical Sciences Research Institute, BushehrUniversity of Medical Sciences, Bushehr, IranIraj Nabipour
The Persian Gulf Tropical Medicine Research Center, The Persian Gulf Biomedical Sciences Research Institute, BushehrUniversity of Medical Sciences, Bushehr, IranMohammadreza Kalantarhormozi
Department of Internal Medicine, School of Medicine, Bushehr University of Medical Sciences, Bushehr, IranGita Sha�ee
Chronic Diseases Research Center, Endocrinology and Metabolism Population Sciences Institute, Tehran University of MedicalSciences, Tehran, Iran.Afshin Ostovar
Osteoporosis Research Center, Endocrinology and Metabolism Clinical Sciences Institute, Tehran University of MedicalSciences, Tehran, IranBagher Larijani
Endocrinology and Metabolism Research Center, Endocrinology and Metabolism Clinical Sciences Institute, Tehran University ofMedical Sciences, Tehran, IranAmir Hossein Darabi
The Persian Gulf Tropical Medicine Research Center, The Persian Gulf Biomedical Sciences Research Institute, BushehrUniversity of Medical Sciences, Bushehr, IranEisa Safavi
Department of Paraclinic, Bushehr University of Medical Sciences, Bushehr, Iran
Research Article
Keywords: Sarcopenia, Platelet, White blood cell, Chronic in�ammation, Older adults, Platelet to white blood cell ratio.
Posted Date: September 20th, 2021
DOI: https://doi.org/10.21203/rs.3.rs-890375/v1

Page 2/19
License: This work is licensed under a Creative Commons Attribution 4.0 International License. Read Full License

Page 3/19
Abstract
BackgroundSarcopenia is a progressive age-related skeletal muscle disorder associated with harmful impacts on health. The present studyaimed to investigate the relation between sarcopenia, platelet (PLT), white blood cell (WBC), and PLT to WBC ratio (PWR) due tothe importance of early sarcopenia diagnosis.
MethodsThis cross-sectional study was conducted based on the second stage of the Bushehr Elderly Health (BEH) Program. Sarcopeniawas de�ned based on the revised edition of the European Working Group on Sarcopenia in Older People (EWGSOP2) inaccordance with the Iranian cut-off point. Univariate and adjusted multivariate logistic regression and linear regression were usedto evaluate the associations.
ResultsThe prevalence of sarcopenia among participants was 35.73 %. PLT count and PWR were statistically higher in severe sarcopenicparticipants, while no differences were seen in WBC. In crude analysis, sarcopenia was not associated with quartiles of PLT, WBC,and PWR, while after adjusting for age, marital status, and sex, the association was seen in the fourth quartile of PLT and PWR[OR (95%CI) = 1.40 (1.08 to 1.81), p-value = 0.009 for PLT; OR (95%CI) = 1.55 (1.20 to 2.00), p-value = 0.001 for PWR]. Thisassociation remained signi�cant in the fully adjusted model [OR (95%CI) = 1.92 (1.25 to 2.95), p-value = 0.003 for PLT; OR(95%CI) = 1.64 (1.06 to 2.52), p-value = 0.024 for PWR]. Among sarcopenia parameters, PLT count was more likely to beassociated with handgrip strength and muscle mass. After stratifying the participants by gender, sarcopenia parameters were nolonger statistically signi�cant in men.
ConclusionThis study showed that PLT and PWR were associated with sarcopenia after considering confounding factors, while thisassociation was not seen in WBC. Moreover, results showed that gender had an important impact on sarcopenia parameters.
IntroductionGiven the increase in the older adults population, the age-related diseases have proportionately raised [1]. On the other hand,aging has been shown to be associated with a decrease in muscle mass and muscle strength. It is estimated that each person,after age 30, approximately loses 0.1 to 0.5% muscle mass per year, which will escalate after age 65 [2, 3]. This age-relateddecline in muscle mass is de�ned as sarcopenia [4]. Sarcopenia is prevalent among older adults; however, its prevalence variesamong older adults in various parts of the world[5]. Various mechanisms have been described for age-related muscle massdecline or sarcopenia, including insulin resistance, nutrition, age-related sex hormone, oxidative stress, neuromusculardysfunction, endocrine abnormality, physical inactivity [6–8], but lately, studies have emphasized the key role of chronicin�ammation in age-related muscle mass decrease [9]. It has been con�rmed that aging is associated with a reduction in theregulation of pro-in�ammatory cytokines [10]. This dysregulation is associated with decreased muscle mass and strength byinterfering with muscle synthesis and catabolism [11, 12].
WBC, PLT, and platelet to white blood cell ratio count are broad and affordable disease indicators used in clinical settings. WBC isa standardized and stable marker that measures in�ammation[13].
PLTs, a signi�cant part of blood, have been shown that alongside the hemostasis function contribute to subclinical in�ammationand oxidative stress[14]. Studies have shown that PLT activity increases in in�ammatory diseases, and it has been con�rmed

Page 4/19
that PLTs can indicate an in�ammatory state [15]. Moreover, in vivo studies have demonstrated that age-related elevated TNF-αincreases PLT activity, while anti-TNF-α administration declines PLT activity [16].
Previous studies have investigated the effectiveness of WBC and PLT count as possible markers of sarcopenia [17, 18]. In thisregard, some studies have shown a signi�cant association between elevated PLT count and sarcopenia [18, 19], while otherstudies from china health and aging trend, and community-dwelling older adults did not �nd a signi�cant association betweenPLT and sarcopenia [20, 21].
Given the controversial results in previous studies and lack of su�cient information in eastern Mediterranean countries, anddrawing on data from the BEH program, in this study, it was attempted to investigate whether PLT, WBC, and PWR are associatedwith sarcopenia. In addition, early diagnosis of sarcopenia with inexpensive markers like CBC seems to be essential for earlydetection, prevention and treatment of sarcopenia.
MethodsResearch design and participants:
This cross-sectional study was conducted based on the second stage of the Bushehr elderly health (BEH) program. Themethodology of the BEH program has previously been reported in detail [22, 23]. The BEH program is a prospective cohort studyin Bushehr, south of Iran, targeting a population of 60 and over. Among 3297 who were selected through multistage strati�edrandom sampling, 3000 were accepted to participate in the �rst phase of the study (participants rate was 91%). The �rst stagewas conducted from March 2013 to October 2014, and the second phase, focusing on musculoskeletal and cognitive outcomes,started in 2015 with 2368 who were following the �rst stage (response rate was 81%).
Measurement of laboratory parameters:
Venous blood samples were collected from the participants following 8–12 h of fasting condition. Red blood cell count (RBC),hemoglobin (Hgb), WBC, PLT were assessed by an automated hematology analyzer, Medonic CA620 (Menarini Diagnostic Srl,Florence, Italy). Blood urea nitrogen (BUN), creatinine (Cr), uric acid, alkaline phosphatase (Alk-p), fasting plasma glucose (FPG),and lipid pro�le were assessed by an auto-analyzer using commercial kits (ParsAzmun, Karaj, Iran). Hemoglobin A1c (HbA1c)was measured by the CERA-STAT system (CERAGEMMEDISYS,chungcheongnam-do, Korea).
Measures and de�nition of sarcopenia:
Sarcopenia was de�ned based on the current revised edition of the European Working Group on sarcopenia in Older People(EWGSOP2), issued recently and de�ned as having low muscle mass and low muscle strength; it is also characterized as severeif the previous criteria were extant with poor physical performance. Dual x-ray absorptiometry (DXA, Discovery WI, Hologic,Bedford, Virginia, USA) was used to measure fat mass and muscle mass with minimal radiation exposure. Appendicular skeletalmuscle mass (ASM) for each participant was calculated as the sum of upper and lower limb muscle mass. The skeletal musclemass index (SMI) was de�ned as ASM/height2 (kg/m2). According to previous studies, the cut-off point for low muscle masswas de�ned as SMI< 7.0 kg/m2 for men and < 5.4 kg/m2 for women in the Iranian population[24]. Muscle strength was assessedbased on handgrip strength and chair stand measures. Handgrip strength was measured three times for each hand using adigital dynamometer. The handgrip strength threshold was 26 kg for men and 18 kg for women[24]. In this study, the chair standtest was used to assess the lower extremity muscle strength[25]. For the measuring chair stand test, participants were asked tokeep their arms folded across their chest; then, if participants could perform the �rst test, they were asked to stand up and sitdown �ve times without using arms. Time was recorded for each participant from the initial sitting to the �nal standing position,and the cut-off point was de�ned as chair stand test time > 15 seconds. Physical performance was evaluated by short physicalperformance battery (SPPB) and usual gait speed. SPPB is a group of tests evaluating physical performance by combining theresult of the chair stand, gait speed, and balance tests described elsewhere[23]. For measuring the usual gait speed, participantswere asked to walk for 4.57 m at a normal pace twice; then, the fastest record was used. Poor physical performance was de�nedas SPPB ≤ 8 point score or gait speed ≤ 0.8 m/s[25].
Page 5/19
Other variables:
Metabolic syndrome (MetS) was de�ned according to the revised edition of national cholesterol education program adulttreatment panel III (NCEP-ATP III)[26], and cognitive function was assessed using the mini-mental state examination (MMSE),mini-cog, and categorical verbal �uency test (CFT), which have been described in the previous study [27]. The chronic diseasesincluded liver disease, lung disease, cardiovascular disease, thyroid diseases, osteoarthritis (OA), rheumatoid arthritis (RA), whichwere de�ned as self-reported or medication use. Chronic renal failure was de�ned as glomerular �ltration rate (GFR) below 60;hypertension (HTN) as medication use, systolic blood pressure ≥ 140 mmHg, or diastolic blood pressure ≥ 90 mmHg), anddiabetes mellitus (DM), as HbA1C≥6.5, FPG ≥ 126 mg/dl or taking anti-diabetic medication). Use of Anti-in�ammatorymedication was de�ned as the implementation of non-steroidal anti-in�ammatory drugs (NSAID), azathioprine, mesalazine,sulfasalazine, methotrexate, mycophenolate mofetil, corticosteroids, colchicine, and tacrolimus. Use of anti-PLT medication wasde�ned as the use of aspirin (ASA), clopidogrel, and dipyridamole. The use of anti-hyperlipidemic medication comprised theimplementation of statins (atorvastatin, lovastatin, and simvastatin) or �brates (gem�brozil and feno�brate). The use of HTNmedication was characterized by the implementation of angiotensin-converting enzyme inhibitors (ACEIs), angiotensin receptorblockers (ARBs), alpha-blocker medications, beta-blockers, calcium channel blockers (CCBs), diuretic medications, and nitratesmedications. Other covariates included age (years), gender (male/female), marital status (single, married, divorced, and widow),and smoking, which included no history of smoking, smoking regularly if the participant had a history of smoking at least onecigarette per day in a week, and the lower rate known as smoking occasionally. Still, as other covariates, body mass index (BMI )was calculated by dividing weight (kg) to height squared (m2); waist to hip circumference ratio (WHR), which was calculated bydividing waist circumference (WC) to hip circumference (HC), and disability was assessed by instrumental activities of dailyliving (IADL) using Lawton scale questionnaires, translated into Persian[28].
Statistical analysis:
The normality of all variables was assessed by the Kolmogorov–Smirnov test. PLT, WBC and PWR were divided into fourquartiles as fellows: Q1 ≤ 220, 220 <Q2 < 259, 259≤ Q3≤ 300, and Q4> 300 (103 / for PLT; Q1 ≤ 6.1, 6.1 <Q2 < 7.3, 7.3≤ Q3≤8.4, and Q4> 8.4 (103/ for WBC, and Q1 ≤29.46, 29.46< Q2 < 36, 36≤ Q3≤ 43.28, and Q4> 43.28 for PWR. Categorical variableswere presented by the frequency and percentage, and the mean and standard deviation (SD) were used for continuousvariables. Differences in quartiles were evaluated by running one-way analysis of variance (ANOVA) and chi-square (X2) forcontinuous variables and categorical variables, respectively. Multivariable linear and logistic regression analyses were used toevaluate the association between PLT, sarcopenia, and sarcopenia parameters. Covariates that had a signi�cant clinical andpathophysiological association with desired outcomes were �rst assessed by univariate regression models; then, statisticallysigni�cant covariates were used in multivariate logistic regression analyses. Covariates were adjusted as: model 1= age, marital,and gender; model 2= model 1 + smoking, metabolic syndrome, cognitive disorder, and the number of chronic diseases; model 3= model2 + Anti-in�ammatory medications, anti-PLT medications, anti-diabetic medications, anti-hyperlipidemic medications,HTN medications, IADL, waist to hip ratio (WHR), and BMI; model 4= model 3 + laboratory parameters (HGB, WBC, HbA1c, HDL-cholesterol, ALK-P, TG, uric acid, and creatinine). Stata MP (version 15) was used, and a two-sided p-value of <0.05 was taken asstatistically signi�cant for all analyses. P-values for trends were obtained from adjusted models by assigning quartiles ascontinuous variables.
ResultsOf 2,368 who were included in this study, 1,223 participants (51.65%) were female. The mean age of the participants was 69.34 ±6.33, and the prevalence of sarcopenia among participants was 35.73 %. According to Table 1, there are signi�cant differences inPLT count and PWR between sarcopenic and nonsarcopenic participants, while no statistical differences are seen in WBC.Participants with severe sarcopenia have a higher prevalence of metabolic syndrome, cognitive disorder, and they are more likelyto use anti-in�ammatory, anti-hyperlipidemic, and anti-HTN medication than participants with mild sarcopenia.
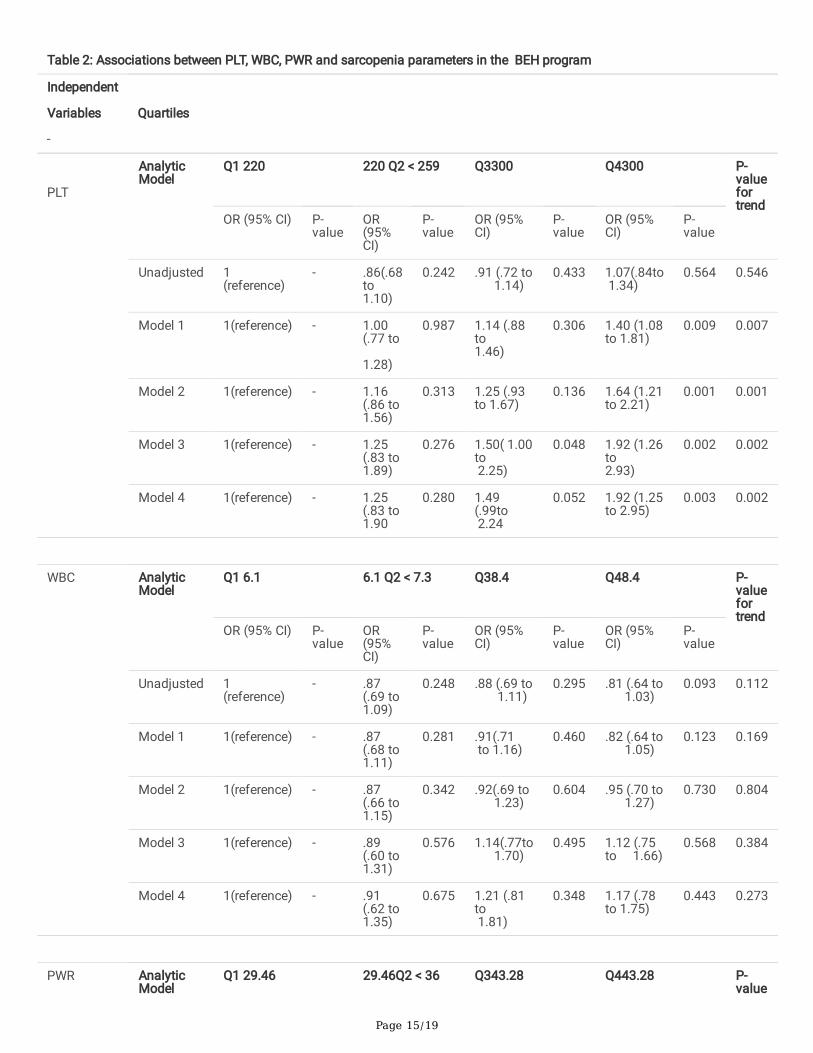
Table 2 demonstrates multivariate logistic regression analysis between sarcopenia, PLT, WBC, and PWR. Considering the lowestquartile (Q1) as a reference, in unadjusted analysis, sarcopenia is not associated with PLT, WBC, and PWR. Although WBC is not
Page 6/19
associated with sarcopenia in any analysis models, the association between PLT, PWR, and sarcopenia appears after adjustingcovariates. According to the analysis, the association between sarcopenia and the fourth quartile is seen after adjusting age,gender, marital status (model 1) [OR (95%CI) = 1.40 (1.08 to 1.81), p-value =0.009 for PLT; OR (95%CI) =1.55 (1.20 to 2.00), p-value =0.001 for PWR]. This association between PLT, PWR, and sarcopenia in the fourth quartile is steadily getting stronger asother covariates are considered in the analysis [in the fully-adjusted model (model 4): OR (95%CI) =1.92 (1.25 to 2.95), p-value=0.003 for PLT; OR (95%CI) =1.70 (1.11 to 2.60), p-value =0.013 for PWR].
Multivariate linear regression between PLT and sarcopenia parameters is illustrated in Table 3. Results show that after fullyadjusted analysis (model 4), only the association between ASM and handgrip remains statistically signi�cant, which means thatPLTs are more likely to affect handgrip strength (β = -.0120) and ASM (β = -.0070) compared to gait speed (β = -.0001) andSPPB (β =-.0006). However, after strati�ed analysis based on gender, none of the sarcopenia parameters are statisticallyassociated with PLTs in men (all p-values > 0.05), while in women, handgrip remains statistically signi�cant even after adjustingfor age, marital, smoking, metabolic syndrome, chronic diseases, and cognitive disorder (model 2), and ASM remains statisticallysigni�cant in the fully adjusted model (model 4).
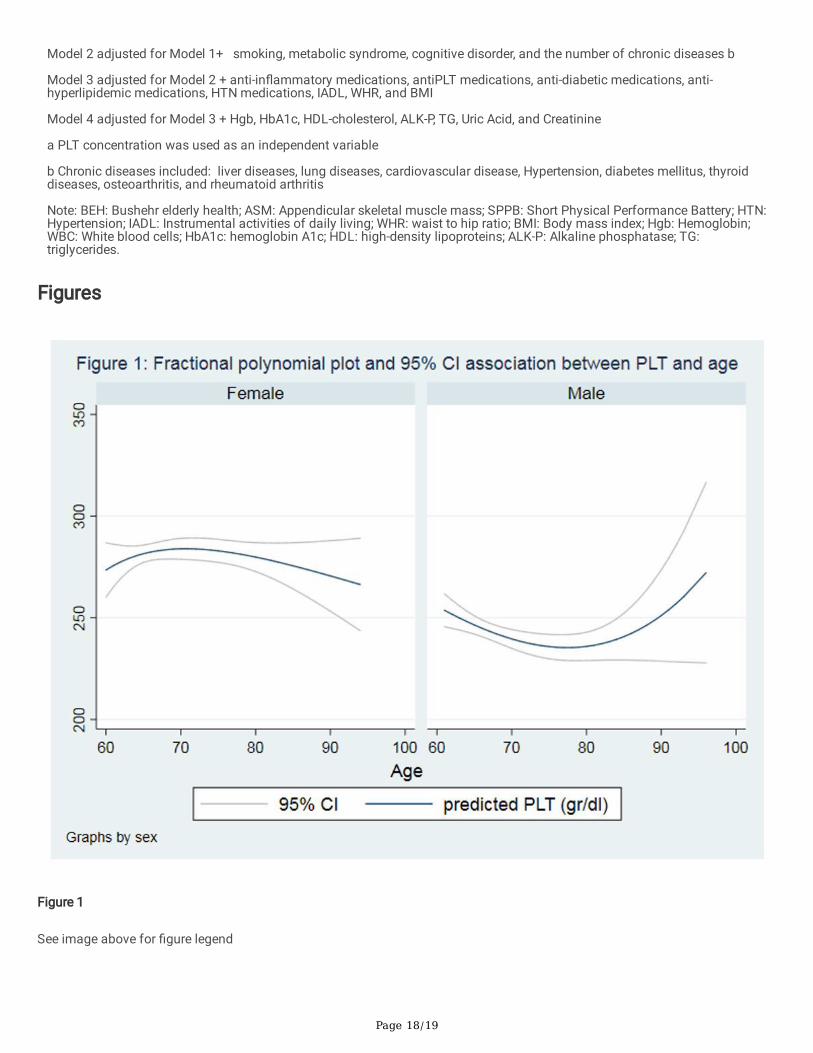
Figures 1 and 2 show the association between PLT, PWR, and age based on gender differences by fractional polynomial plots. As�gures illustrate, by increasing age, PWR escalates; however, PLT slightly declines in women over 90 years old.
DiscussionThis study showed that sarcopenia association with PLT count and PWR appeared in the primary adjustment, which remainedsigni�cant even after controlling for potential confounders. This association was not seen between WBC and sarcopenia.Moreover, among sarcopenia measures, a prominent effect of PLTs was only seen in ASM and handgrip. However, consideringgender separately, the association between PLT and sarcopenia parameters remained statistically signi�cant only in women.
Previous �ndings revealed that the biological effect of aging might be caused by oxidative stress and mitochondrialdysfunction[29]. The aging process is associated with chronic low-grade in�ammation, which is called In�amm-aging[30]. It hasbeen demonstrated that In�amm-aging plays a prominent role in the pathogenesis number of age-related chronic diseases suchas atherosclerosis, insulin resistance, sarcopenia, frailty, and disability [31]. For instance, obesity and body fat mass, which havebeen explained to be associated with sarcopenia, have been shown to be positively correlated with PLT activity [19].
In our study, severe sarcopenia participants had a higher amount of PLT and PWR than other groups. After adjusting the model,the effect of PLT on sarcopenia showed a meaningful effect; however, the pathway of this effect is not clearly understood.
This association might be explained by endothelial dysfunction. Endothelial dysfunction is identi�ed as an imbalance betweenvasodilatory and vasoconstrictive actions that cause a reduction in vasodilation activity of vessels. The integrity of endothelium,different receptors, and �ow-mediated stimuli can affect the production and release of endothelium-derived relaxing factors(EDRF) such as nitric oxide [32]. EDRF causes vasodilation by activated cellular cascade such as soluble guanylate cyclase andsubsequently raises cyclic guanylate in vascular smooth muscle. EDRF can play an anti-in�ammatory role by inhibiting PLTaggregation and adhesion. Moreover, PLTs are initiators of vascular in�ammation and remodeling and might cause oxygen andnutrients supply disturbance in muscle cells by interfering in microcirculation and microvascular endothelium[33, 34]. Anotherpossible mechanism is that PLTs might accelerate bone marrow hematopoietic stem cell proliferation and affect thedifferentiation of human CD34-positive cells into foam cells, which has been shown to play a key role in the pathophysiology ofatherosclerotic and small vessels diseases such as cerebral microbleeds (CMBs) [34, 35]. CMBs have been shown to beassociated with cognitive impairment, physical frailty, and low handgrip strength, independent of other confounding factors. Thishypothesis might be con�rmed by a higher prevalence of cognitive impairment in severe sarcopenic participants.
White blood cell count is a strong indicator of low-grade in�ammation and also might interfere with muscle metabolism byproducing pro-in�ammatory cytokines like IL-6 [20, 21]. However, our study did not �nd any signi�cant association between WBCcount and sarcopenia; even PLT and PWR have been shown to have a signi�cant association.
Page 7/19
Effect of PLTs and WBC count can be simultaneously assessed by PLT to-white blood cell ratio (PWR)[36]. The interactionbetween PLTs and WBC has been introduced in the pathogenesis of several diseases (e.g., cerebrovascular infarction). PLTs havebeen shown to affect other blood cells by releasing chemokines and membrane ligands and also play as a bridge in white bloodcells-PLT aggregates (LPAs) in the periphery[37]. Therefore, PWR can represent the degree of in�ammation, and a signi�cantassociation of PWR may show the prominent effect of PLT than WBC on sarcopenia.
PLT count has been shown to decrease with aging in different older adults population. It has been demonstrated that despite thestable number of PLTs in middle-aged people, the PLT count declines by approximately 10% after age 60, which is moreprominent in men[38]. Previous studies have shown that women have almost 15% higher PLT count than men, showing genderdifferences in PLT count in older adults [38, 39]. However, our study showed that PLT count might decrease slightly after 60 inwomen. Although the PLT count in men is lower than women, we see the gradually escalating change in PLT count after age 90in men. However, only less than 0.6% of our population is older than 90 years; therefore, we cannot interpret this increasing trendaccurately. PLT count decreased in the older adults might be explained by the fact that hematopoietic stem cell reserve reduceswith aging[40]. Although the drop in PLT count is observed, PLT activity seems to increase with aging. It shows that the level ofcytokines released by activated PLTs such as PLT factor 4 (PF4), which affects muscle mass, increases in the older adultspopulation[33, 41]. The effect of age-related in�ammation might explain this increase. In addition, it has been revealed thatplatelet response to in�ammatory cytokines increases by aging, leading to platelet hyperactivity in older adults [42].
After stratifying participants based on gender in this study, none of the sarcopenia parameters had a statistically signi�cantassociation with PLT in men. These results were consistent with previous studies emphasizing gender-related differences insarcopenia and sarcopenia parameters[43, 44]. However, the differences might be related to the age-related decline in sexhormones and the other physiological pathway, especially in menopausal women, who have a higher decline rate than men[45]. Ithas been con�rmed that the decline in estrogen levels in postmenopausal women is associated with a decrease in muscle mass.This association could be explained by the regulatory effects of estrogen on pro-in�ammatory cytokines and the direct protectiveeffect of estrogen on muscles, which decreases in menopausal women. Gender-related variations in the distribution of fat massmight also be attributed to these differences. Furthermore, in developing countries such as Iran, women have been shown to befrailer, making them more susceptible to sarcopenia than men[46]. Higher prevalence of frailty in women might be due to the factthat a signi�cant number of the women’s population in lower-middle-income (LMICs) and developing countries, have a lowersocioeconomic status than men, which might affect the quality of their nutrition intake, chance to participate in regular exercise,and access to healthcare services.
Moreover, after adjusting medications (e.g., anti-in�ammatory, anti-PLT, HTN, anti-hyperlipidemic, and anti-diabetic medication) inwomen, results demonstrated that the association between PLT, ASM, and handgrip strength decreased, so that it was no longerstatistically signi�cant in the handgrip strength. These medications might prevent sarcopenia and might directly reverse thisprocess. According to Landi et al., individuals who used non-steroidal anti-in�ammatory drugs (NSAID) had almost 80% lowerrisk of sarcopenia compared with non-NSAID users, even after considering potential confounders[47]. Furthermore, anti-diabeticagents such as metformin play a protective role against sarcopenia through increased insulin sensitivity and glucosehemostasis. Aghili et al.’s study showed that those who received metformin had a lower risk for sarcopenia, which was notablytrue in women [48, 49].
This study was conducted using reliable data and a fully validated protocol with a large number of participants representing theIranian older adults population. In this study, sarcopenia was de�ned by revised edition of the European Working Group onSarcopenia in Older People (EWGSOP2). Moreover, in this study, the relationship between PLT and sarcopenia was adjusted by anumber of covariates such as sociodemographic factors, metabolic syndrome, cognitive disorder, and medications. None theless, this study had a number of potential limitations one of which was the cross-sectional nature of the study sincemusculoskeletal outcomes were measured only in the second stage of the BEH program, and thus, the cause-effect relationshipsbetween PLT, PWR, and sarcopenia could not be recognized. In addition, other in�ammatory cytokines and markers (e.g., TNF-a,interleukin- 6, C-reactive-protein), mean PLT volume (MPV), and nutritional status were not presented in this study.
Conclusion

Page 8/19
In conclusion, this study showed that PLT and PWR were associated with sarcopenia after considering confounding factors,muscle mass, and muscle strength, whereas WBC was not signi�cantly connected with sarcopenia. Moreover, based on theresults, women showed a signi�cant association with PLT levels and sarcopenia with their components of it. We suggest thatregular PLT screening will be effective alongside other in�ammatory markers such as TNF-a, CRP, and ESR. Regular follow-ups ofCBC consisting PLT, WBC, Hgb in the elderly population might be helpful in pre-diagnosis of sarcopenia in the early stage.However, further longitudinal studies with different in�ammatory cytokines are needed to con�rm the connection between thein�ammatory markers and sarcopenia and whether anti-in�ammatory medication can prevent sarcopenia from happening.
AbbreviationsBEH: Bushehr elderly health; SBP: Systolic blood pressure; DBP: diastolic blood pressure; BMI: Body mass index; WHR: waist tohip ratio; IADL: Instrumental activities of daily living; ASM: Appendicular skeletal muscle mass; SMI: skeletal muscle mass index;SPPB: Short Physical Performance Battery; HTN: Hypertension; HDL: high-density lipoproteins; LDL: low-density lipoproteins; TG:triglycerides; Hgb: Hemoglobin; RBC: Red blood cells; PLT: platelet; WBC: White blood cells; PWR: PLT to WBC ratio; BUN: bloodurea nitrogen; ALK-P: Alkaline phosphatase; HbA1c: hemoglobin A1c; EDRF: Endothelium-derived relaxing factor.
DeclarationsEthics approval and consent to participate
The Ethics Committee of Bushehr University of Medical Sciences granted ethical permission for this study (Ref. No. B-91–14-2)in compliance with the Helsinki Declaration and national guidelines for research ethics. Before research enrollment, allparticipants gave their informed consent after being informed about procedures involved in the study. Participation was entirelyoptional, and any participant could withdraw consent at any moment with no repercussions.
Consent for publication
Not applicable.
Availability of data and materials
The datasets used during the current study are available from the corresponding author, AO ([email protected]) or IN([email protected]) upon reasonable request.
Competing interests
The authors declare no competing interests.
Funding
The Persian Gulf Biomedical Sciences Research Institute, a�liated with Bushehr (Port) University of Medical Sciences (BPUMS),and the Endocrinology and Metabolism Research Institute, a�liated with Tehran University of Medical Sciences, both contributedfunding for the BEH Program. This study project was designed and carried out with the help of researchers from both researchinstitutions.
Authors’ contributions
MM, MGH, and ES conceived the study and performed data analysis and interpretation. AF, MEM, MGH drafted the manuscriptand participated in interpretation, study design, and conduct and helped draft the manuscript and interpretation. IN, MK, GSH, KA,BL, AHD, and AO participated in the study design and interpretation of the �ndings. All authors reviewed and approved thesubmitted manuscript.
Acknowledgments
Page 9/19
The authors would like to express their appreciation to all medical research center employees at Bushehr University of MedicalSciences (BUMS) and Tehran University of Medical Sciences (TUMS) for their dedication and collaboration. The authors wouldalso like to convey their heartfelt appreciation to the Persian Gulf Martyrs Hospital's Clinical Research Development Center andthe Persian Gulf Tropical Medicine Research Center. We would like to thank all participants for their participation in the study.
References1. Livshits G, Kalinkovich A: In�ammaging as a common ground for the development and maintenance of sarcopenia, obesity,
cardiomyopathy and dysbiosis. Ageing research reviews 2019, 56:100980.
2. Liguori I, Russo G, Aran L, Bulli G, Curcio F, Della-Morte D, Gargiulo G, Testa G, Cacciatore F, Bonaduce D: Sarcopenia:assessment of disease burden and strategies to improve outcomes. Clinical interventions in aging 2018, 13:913.
3. Tsukasaki K, Matsui Y, Arai H, Harada A, Tomida M, Takemura M, Otsuka R, Ando F, Shimokata H: Association of musclestrength and gait speed with cross-sectional muscle area determined by mid-thigh computed tomography—A comparisonwith skeletal muscle mass measured by dual-energy X-ray absorptiometry. The Journal of frailty & aging 2020, 9(2):82-89.
4. Rosenberg IH: Sarcopenia: origins and clinical relevance. The Journal of nutrition 1997, 127(5):990S-991S.
5. Papadopoulou S, Tsintavis P, Potsaki G, Papandreou D: Differences in the prevalence of sarcopenia in community-dwelling,nursing home and hospitalized individuals. A systematic review and meta-analysis. The journal of nutrition, health &aging 2020, 24(1):83-90.
�. Kim JA, Choi KM: Sarcopenia and fatty liver disease. Hepatology international 2019, 13(6):674-687.
7. Malafarina V, Úriz-Otano F, Iniesta R, Gil-Guerrero L: Sarcopenia in the elderly: diagnosis, physiopathology and treatment.Maturitas 2012, 71(2):109-114.
�. Tay L, Leung B, Wee S, Tay K, Ali N, Chan M, Lim W: Association of nutrition and immune-endocrine dysfunction with musclemass and performance in cognitively impaired older adults. Archives of gerontology and geriatrics 2018, 75:20-27.
9. Bano G, Trevisan C, Carraro S, Solmi M, Luchini C, Stubbs B, Manzato E, Sergi G, Veronese N: In�ammation and sarcopenia:A systematic review and meta-analysis. Maturitas 2017, 96:10-15.
10. Grosicki GJ, Barrett BB, Englund DA, Liu C, Travison TG, Cederholm T, Koochek A, von Berens Å, Gustafsson T, Benard T et al:Circulating Interleukin-6 Is Associated with Skeletal Muscle Strength, Quality, and Functional Adaptation with ExerciseTraining in Mobility-Limited Older Adults. The Journal of frailty & aging 2020, 9(1):57-63.
11. Grosicki GJ, Barrett B, Englund D, Liu C, Travison T, Cederholm T, Koochek A, von Berens Å, Gustafsson T, Benard T:Circulating Interleukin-6 Is Associated with Skeletal Muscle Strength, Quality, and Functional Adaptation with ExerciseTraining in Mobility-Limited Older Adults. The Journal of frailty & aging 2020, 9(1):57-63.
12. Schaap LA, Pluijm SM, Deeg DJ, Harris TB, Kritchevsky SB, Newman AB, Colbert LH, Pahor M, Rubin SM, Tylavsky FA: Higherin�ammatory marker levels in older persons: associations with 5-year change in muscle mass and muscle strength. Journalsof Gerontology Series A: Biomedical Sciences and Medical Sciences 2009, 64(11):1183-1189.
13. Kounis NG, Soufras GD, Tsigkas G, Hahalis G: White blood cell counts, leukocyte ratios, and eosinophils as in�ammatorymarkers in patients with coronary artery disease. Clinical and Applied Thrombosis/Hemostasis 2015, 21(2):139-143.
14. Jesri A, Okonofua EC, Egan BM: Platelet and white blood cell counts are elevated in patients with the metabolic syndrome.The Journal of Clinical Hypertension 2005, 7(12):705-711.
15. Yazici S, Yazici M, Erer B, Erer B, Calik Y, Ozhan H, Ataoglu S: The platelet indices in patients with rheumatoid arthritis: meanplatelet volume re�ects disease activity. Platelets 2010, 21(2):122-125.
1�. Davizon-Castillo P, McMahon B, Aguila S, Bark D, Ashworth K, Allawzi A, Campbell RA, Montenont E, Nemkov T, D'AlessandroA et al: TNF-α-driven in�ammation and mitochondrial dysfunction de�ne the platelet hyperreactivity of aging. Blood 2019,134(9):727-740.
17. Chung T-H, Shim J-Y, Lee Y-J: Association between leukocyte count and sarcopenia in postmenopausal women: The KoreanNational Health and Nutrition Examination Survey. Maturitas 2016, 84:89-93.
Page 10/19
1�. Park W-J, Jung D-H, Lee J-W, Shim J-Y, Kwon Y-J: Association of platelet count with sarcopenic obesity in postmenopausalwomen: A nationwide population-based study. Clinica Chimica Acta 2018, 477:113-118.
19. Lee HS, Koh I-H, Kim H-S, Kwon Y-J: Platelet and white blood cell count are independently associated with sarcopenia: Anationwide population-based study. Thrombosis research 2019, 183:36-44.
20. Zhao W-y, Zhang Y, Hou L-s, Xia X, Ge M-l, Liu X-L, Yue J-R, Dong B-r: The association between systemic in�ammatorymarkers and sarcopenia: Results from the West China Health and Aging Trend Study (WCHAT). Archives of gerontology andgeriatrics 2021, 92:104262.
21. Tang T, Xie L, Tan L, Hu X, Yang M: In�ammatory indexes are not associated with sarcopenia in Chinese community-dwellingolder people: a cross-sectional study. BMC geriatrics 2020, 20(1):1-9.
22. Ostovar A, Nabipour I, Larijani B, Heshmat R, Darabi H, Vahdat K, Ravanipour M, Mehrdad N, Raeisi A, Heidari G: Bushehrelderly health (BEH) Programme, phase I (cardiovascular system). BMJ open 2015, 5(12):e009597.
23. Sha�ee G, Ostovar A, Heshmat R, Darabi H, Shari� F, Raeisi A, Mehrdad N, Shadman Z, Razi F, Amini MR: Bushehr ElderlyHealth (BEH) programme: study protocol and design of musculoskeletal system and cognitive function (stage II). BMJopen 2017, 7(8):e013606.
24. Sha�ee G, Heshmat R, Ostovar A, Khatami F, Fahimfar N, Arzaghi SM, Gharibzadeh S, Hanaei S, Nabipour I, Larijani B:Comparison of EWGSOP-1and EWGSOP-2 diagnostic criteria on prevalence of and risk factors for sarcopenia among Iranianolder people: the Bushehr Elderly Health (BEH) program. Journal of diabetes and metabolic disorders 2020, 19(2):727-734.
25. Cruz-Jentoft AJ, Bahat G, Bauer J, Boirie Y, Bruyère O, Cederholm T, Cooper C, Landi F, Rolland Y, Sayer AA: Sarcopenia:revised European consensus on de�nition and diagnosis. Age and ageing 2019, 48(1):16-31.
2�. Ervin RB: Prevalence of Metabolic Syndrome Among Adults 20 years of age and over, by sex, age, race and ethnicity, andbody mass index; United States, 2003-2006. 2009.
27. Marzban M, Nabipour I, Farhadi A, Ostovar A, Larijani B, Darabi AH, Shabankari E, Gholizade M: Association between anemia,physical performance and cognitive function in Iranian elderly people: evidence from Bushehr Elderly Health (BEH) program.BMC geriatrics 2021, 21(1):1-17.
2�. Khalagi K, Ansarifar A, Fahimfar N, Sanjari M, Gharibzdeh S, Shari� F, Sha�ee G, Heshmat R, Nabipour I, Larijani B: Cardio-metabolic and socio-demographic risk factors associated with dependency in basic and instrumental activities of daily livingamong older Iranian adults: Bushehr elderly health program. BMC geriatrics 2021, 21(1):1-9.
29. Ji LL: Redox signaling in skeletal muscle: role of aging and exercise. Advances in physiology education 2015, 39(4):352-359.
30. Franceschi C, Garagnani P, Parini P, Giuliani C, Santoro A: In�ammaging: a new immune–metabolic viewpoint for age-relateddiseases. Nature Reviews Endocrinology 2018, 14(10):576-590.
31. Franceschi C, Garagnani P, Vitale G, Capri M, Salvioli S: In�ammaging and ‘Garb-aging’. Trends in Endocrinology &Metabolism 2017, 28(3):199-212.
32. Zuchi C, Tritto I, Carluccio E, Mattei C, Cattadori G, Ambrosio G: Role of endothelial dysfunction in heart failure. Heart failurereviews 2020, 25(1):21-30.
33. Vajen T, Benedikter BJ, Heinzmann AC, Vasina EM, Henskens Y, Parsons M, Maguire PB, Stassen FR, Heemskerk JW,Schurgers LJ: Platelet extracellular vesicles induce a pro-in�ammatory smooth muscle cell phenotype. Journal ofextracellular vesicles 2017, 6(1):1322454.
34. Daub K, Langer H, Seizer P, Stellos K, May AE, Goyal P, Bigalke B, Schönberger T, Geisler T, Siegel‐Axel D: Platelets inducedifferentiation of human CD34+ progenitor cells into foam cells and endothelial cells. The FASEB journal 2006, 20(14):2559-2561.
35. Zou J, Yuan C, Wu C, Cao C, Yang H: The effects of platelet-rich plasma on the osteogenic induction of bone marrowmesenchymal stem cells. Connective tissue research 2014, 55(4):304-309.
3�. Chen Z, Huang Y, Li S, Lin J, Liu W, Ding Z, Li X, Chen Y, Pang W, Yang D: Platelet-to-white blood cell ratio: a prognosticpredictor for 90-day outcomes in ischemic stroke patients with intravenous thrombolysis. Journal of Stroke andCerebrovascular Diseases 2016, 25(10):2430-2438.
Page 11/19
37. Amalia L, Dalimonthe NZ: Clinical signi�cance of Platelet-to-white blood cell ratio (PWR) and National Institute of healthstroke scale (NIHSS) in acute ischemic stroke. Heliyon 2020, 6(10):e05033.
3�. Biino G, Santimone I, Minelli C, Sorice R, Frongia B, Traglia M, Ulivi S, Di Castelnuovo A, Gögele M, Nutile T: Age-and sex-related variations in platelet count in Italy: a proposal of reference ranges based on 40987 subjects' data. PloS one 2013,8(1):e54289.
39. Segal JB, Moliterno AR: Platelet counts differ by sex, ethnicity, and age in the United States. Annals of epidemiology 2006,16(2):123-130.
40. Montenont E, Rondina MT, Campbell RA: Altered functions of platelets during aging. Current opinion in hematology 2019,26(5):336-342.
41. Bastyr III EJ, Kadrofske MM, Vinik AI: Platelet activity and phosphoinositide turnover increase with advancing age. TheAmerican journal of medicine 1990, 88(6):601-606.
42. Hearps AC, Martin GE, Angelovich TA, Cheng WJ, Maisa A, Landay AL, Jaworowski A, Crowe SM: Aging is associated withchronic innate immune activation and dysregulation of monocyte phenotype and function. Aging cell 2012, 11(5):867-875.
43. Gao L, Jiang J, Yang M, Hao Q, Luo L, Dong B: Prevalence of sarcopenia and associated factors in Chinese community-dwelling elderly: comparison between rural and urban areas. Journal of the American Medical Directors Association 2015,16(11):1003. e1001-1003. e1006.
44. Argyriadou S, Vlachonikolis I, Melisopoulou H, Katachanakis K, Lionis C: In what extent anemia coexists with cognitiveimpairment in elderly: a cross-sectional study in Greece. BMC family practice 2001, 2(1):1-6.
45. Xing Y, Wei C, Chu C, Zhou A, Li F, Wu L, Song H, Zuo X, Wang F, Qin W: Stage-speci�c gender differences in cognitive andneuropsychiatric manifestations of vascular dementia. American Journal of Alzheimer's Disease & Other Dementias® 2012,27(6):433-438.
4�. Biritwum RB, Minicuci N, Yawson AE, Theou O, Mensah GP, Naidoo N, Wu F, Guo Y, Zheng Y, Jiang Y et al: Prevalence of andfactors associated with frailty and disability in older adults from China, Ghana, India, Mexico, Russia and South Africa.Maturitas 2016, 91:8-18.
47. Landi F, Marzetti E, Liperoti R, Pahor M, Russo A, Martone AM, Colloca G, Capoluongo E, Bernabei R: Nonsteroidal anti-in�ammatory drug (NSAID) use and sarcopenia in older people: results from the ilSIRENTE study. J Am Med Dir Assoc 2013,14(8):626.e629-613.
4�. Aghili R, Malek M, Valojerdi AE, Banazadeh Z, Naja� L, Khamseh ME: Body composition in adults with newly diagnosed type2 diabetes: effects of metformin. Journal of Diabetes & Metabolic Disorders 2014, 13(1):1-8.
49. Chen F, Xu S, Wang Y, Chen F, Cao L, Liu T, Huang T, Wei Q, Ma G, Zhao Y: Risk Factors for Sarcopenia in the Elderly with Type2 Diabetes Mellitus and the Effect of Metformin. Journal of Diabetes Research 2020, 2020.
Tables

Page 12/19
Table 1: Characteristics of the study participants based on severity of sarcopenia in BEH program
parameters
Total
(n= 2,368)
Severesarcopenia
(n= 454)
p-valuea
Nosarcopenia
(n= 1,522)
Mildsarcopenia
(n= 392)
Demographic &Clinical
Age (years) 69.30 ± 6.33 67.99 ±5.48
69.58 ± 6.05 73.44 ±7.35
<0.0001
Sex (Female), n (%) 1,223 (51.65) 836(54.93)
132 ( 33.67) 255 (56.17)
<0.001
Maritalstatus, n (%)
Single 19 ( 0.80) 10 (0.66) 2 (0.51) 7 (1.54 ) <0.001
Married 1,824 (77.03) 1,189(78.12)
331 (84.44) 304(66.96)
Divorce 20 (0.84) 10 (0.66) 6 ( 1.53) 4 (0.88)
Widow 505 (21.33) 313 (20.57)
53 ( 13.52) 139(30.62)
Smoking None 1,523 (83.41) 994(83.95)
233 (76.90) 296(87.32)
0.003
Yes,occasionally
30 (1.64) 15 (1.27) 10 (3.30) 5 (1.47)
Yes,regularly
273 (14.95) 175(14.78)
60 (19.80) 38 (11.21)
Cognitive disorder, n (%) 1,397 (59.45) 860(57.03)
212 (54.36) 325(71.90)
<0.001
Metabolic syndrome, n (%) 1,179 (49.81) 863(56.70)
127 (32.40) 189(41.72)
<0.001
Chronicdisease
None 244 (10.30) 152 (9.99) 55 (14.03) 37 (8.15) 0.066
One 317 (13.39) 199(13.07)
53 (13.52) 65 (14.32)
Two or more 1,807 (76.31) 1,171(76.94)
284 (72.45) 352(77.53)
SBP (mm Hg) 139.57±19.32
140.08±18.83
136.44±20.16 140.57 ±19.98
0.0019
DBP (mm Hg) 81.49 ± 8.64 82.10±8.40
80.48 ± 8.74 80.29 ±9.15
<0.0001
BMI (kg/m2) 27.33 ± 4.63 29.05 ±4.44
24.19 ± 3.07 24.28 ±3.16
<0.0001
Waist circumference (cm) 98.39 ±11.67
101.81±10.98
92.33 ± 10.13 92.16 ±10.42
<0.0001
WHR .89 ± .12 .90 ± .15 .89 ± .06 .88 ± .07 0.1193
IADL (dependent), n (%) 1,201 (56.31) 751(53.84)
164 46.99) 286(73.52)
<0.001
Sarcopeniaparameters
ASM (kg) 15.89 ± 3.63 16.77 ±3.52
15.24 ± 3.13 13.51 ±3.15
<0.0001
SMI (kg/m2) 6.23 ± .98 6.58 ± .90 5.78 ± .77 5.45 ± .76 <0.0001
Total body fat mass (%) 37.57 ± 8.11 38.71 ± 34.00 ± 7.58 36.83 ± <0.0001

Page 13/19
8.11 7.57
Gait speed (m/s) .84 ± .30 .87 ± .31 1.05 ± .17 .59 ± .17 <0.0001
SPPB 9.38 ± 1.73 9.62 ±1.72
9.61 ± 1.04 8.22 ± 1.86 <0.0001
Mean hand grip (kg)
22.22 ± 9.20 23.83 ±9.64
22.17 ± 7.61 16.88 ±6.59
<0.0001
Medications Anti-in�ammatorymedication, n (%)
1,171 (60.27) 771 (60.71)
157 (53.22) 243(64.29)
0.012
AntiPLT medication, n (%) 995 ( 51.21) 661 (52.05)
137 (46.44) 197 ( 52.12)
0.205
Antihyperlipidemiamedication, n (%)
807 (41.53) 563(44.33)
111 (37.63) 133(35.19)
0.002
Anti-HTN medication, n (%) 1,186( 61.04)
794 (62.52)
153 ( 51.86) 239 (63.23)
0.002
DM medication, n (%) 591 ( 30.42) 390( 30.71)
83 ( 28.14) 118 ( 31.22)
0.641
Total cholesterol 182.13 ±44.20
182.54±44.14
181.38 ±44.38
181.39 ±44.33
0.8301
Biochemicalparameters
HDL-cholesterol (mg/dl) 45.96 ±11.20
45.67 ±10.95
45.90 ± 10.99 46.99 ±12.16
0.0873
LDL- cholesterol 109.40 ±37.75
109.07±38.39
110.28 ±36.88
109.74 ±36.38
0.8340
TG 135.69 ±70.27
140.45±69.57
127.92±63.16
126.45 ±76.77
0.0001
Hgb 14.50 ± 1.73 14.56 ±1.72
14.57 ± 1.65 14.21 ±1.84
0.0004
RBC (10^6) 5.01± .63 5.03 ± .62 5.03 ± .62 4.91± .69 0.0017
PLT (10^3) 262.52±66.02
262.10±65.23
256.61±67.75
269.02±66.75
0.0224
WBC (10^3) 7.36 ± 2.19 7.43 ±2.36
7.16 ± 1.82 7.30 ± 1.84 0.0789
PLT to WBC ratio 37.28 ±11.34
36.94 ±11.16
37.22± 11.18 38.48 ±11.99
0.0402
BUN 14.98 ± 5.70 14.59 ±5.42
15.26± 5.31 16.07 ±6.73
<0.0001
Creatinine 1.10 ± .36 1.08 ± .35 1.12 ± .31 1.13 ± .44 0.0292
Uric acid 5.17 ± 1.30 5.21 ±1.28
5.14 ± 1.26 5.08 ± 1.39 0.1882
Alk-P 220.32 ±75.80
222.23±77.74
212.07 ±74.28
221.05 ±69.98
0.0593
HbA1c 5.67 ± 1.56 5.69± 1.54 5.57± 1.47 5.66± 1.67 0.3843
a P-values for continuous variables and categorical variables were assessed using ANOVA and Chi-square, respectively.
Note: BEH: Bushehr elderly health; SBP: Systolic blood pressure; DBP: diastolic blood pressure; BMI: Body mass index; WHR:waist to hip ratio; IADL: Instrumental activities of daily living; ASM: Appendicular skeletal muscle mass; SMI: skeletal musclemass index; SPPB: Short Physical Performance Battery; HTN: Hypertension; HDL: high-density lipoproteins; LDL: low-densitylipoproteins; TG: triglycerides; Hgb: Hemoglobin; RBC: Red blood cells; PLT: platelet ; WBC: White blood cells; PWR: PLT toWBC ratio; BUN: blood urea nitrogen; ALK-P: Alkaline phosphatase; HbA1c: hemoglobin A1c.

Page 14/19
Page 15/19
Table 2: Associations between PLT, WBC, PWR and sarcopenia parameters in the BEH program
Independent
Variables
Quartiles
PLT
AnalyticModel
Q1 220
220 Q2 < 259
Q3300
Q4300
P-valuefortrend
OR (95% CI) P-value
OR(95%CI)
P-value
OR (95%CI)
P-value
OR (95%CI)
P-value
Unadjusted 1(reference)
- .86(.68to1.10)
0.242 .91 (.72 to 1.14)
0.433 1.07(.84to 1.34)
0.564 0.546
Model 1 1(reference) - 1.00(.77 to 1.28)
0.987 1.14 (.88to 1.46)
0.306 1.40 (1.08to 1.81)
0.009 0.007
Model 2 1(reference) - 1.16(.86 to1.56)
0.313 1.25 (.93to 1.67)
0.136 1.64 (1.21to 2.21)
0.001 0.001
Model 3 1(reference) - 1.25(.83 to1.89)
0.276 1.50( 1.00to 2.25)
0.048 1.92 (1.26to 2.93)
0.002 0.002
Model 4 1(reference) - 1.25(.83 to1.90
0.280 1.49(.99to 2.24
0.052 1.92 (1.25to 2.95)
0.003 0.002
WBC AnalyticModel
Q1 6.1
6.1 Q2 < 7.3
Q38.4
Q48.4
P-valuefortrend
OR (95% CI) P-value
OR(95%CI)
P-value
OR (95%CI)
P-value
OR (95%CI)
P-value
Unadjusted 1(reference)
- .87(.69 to1.09)
0.248 .88 (.69 to 1.11)
0.295 .81 (.64 to 1.03)
0.093 0.112
Model 1 1(reference) - .87(.68 to1.11)
0.281 .91(.71 to 1.16)
0.460 .82 (.64 to 1.05)
0.123 0.169
Model 2 1(reference) - .87(.66 to1.15)
0.342 .92(.69 to 1.23)
0.604 .95 (.70 to 1.27)
0.730 0.804
Model 3 1(reference) - .89(.60 to1.31)
0.576 1.14(.77to 1.70)
0.495 1.12 (.75to 1.66)
0.568 0.384
Model 4 1(reference) - .91(.62 to1.35)
0.675 1.21 (.81to 1.81)
0.348 1.17 (.78to 1.75)
0.443 0.273
PWR AnalyticModel
Q1 29.46
29.46Q2 < 36
Q343.28
Q443.28
P-value

Page 16/19
fortrendOR (95% CI) P-
valueOR(95%CI)
P-value
OR (95%CI)
P-value
OR (95%CI)
P-value
Unadjusted 1(reference)
- 1.07(.84 to 1.36)
0.555 1.05 (.82to 1.33)
0.666 1.24 (.98to 1.57)
0.070 0.094
Model 1 1(reference) - 1.12(.87 to1.44)
0.361 1.19 (.92to 1.538)
0.176 1.55 (1.20to 2.00)
0.001 0.001
Model 2 1(reference) - 1.15 (.86 to 1.56)
0.329 1.34 (.99to 1.81)
0.054 1.65( 1.22to 2.23)
0.001 0.001
Model 3 1(reference) - 1.01(.67 to1.52)
0.931 1.36 (.90to 2.04)
0.133 1.70 (1.11to 2.60)
0.013 0.005
Model 4 1(reference) - 1.00 (.66 to 1.51)
0.976 1.36 (.91to 2.06)
0.132 1.64 (1.06to 2.52)
0.024 0.009
Multivariate logistic regression was used for analysis
Model 1 adjusted for age, marital, and sex
Model 2 adjusted for Model 1+ smoking, metabolic syndrome, cognitive disorder, and the number of chronic diseases a
Model 3 adjusted for Model 2 + anti-in�ammatory medications, anti- platelet medications, anti-diabetic medications, anti-hyperlipidemic medications, HTN medications, IADL, WHR, and BMI
Model 4 adjusted for Model 3 + Hgb, HbA1c, HDL_C, ALK-P, TG, uric acid, and creatinine
a Chronic diseases included: liver diseases, lung diseases, cardiovascular disease, Hypertension, , diabetes mellitus ,thyroiddiseases, osteoarthritis, and rheumatoid arthritis
Note: BEH: Bushehr elderly health; PLT: platelet; WBC: White blood cells; PWR: PLT to WBC ratio;HTN: Hypertension; IADL: Instrumental activities of daily living; WHR: waist to hip ratio; BMI: Body massindex; Hgb: Hemoglobin; HbA1c: hemoglobin A1c; HDL: high-density lipoproteins; ALK-P: Alkaline phosphatase; TG:triglycerides.
Table 3: The relationship between PLT and sarcopenia parameters in the Bushehr Health (BEH) Program

Page 17/19
Outcomevariable
Analyticdel
All Male Female
β (95% CI) P-value
β (95% CI) P-value
β (95% CI) P-value
a
ASM Unadjusted -0.0135 (-0.0157 to-.0114)
<0.001
-0.0006(-0.0006 to0.0019)
0.649 -0.0034 (-0.0053 to-0.0015)
<0.001
Model 1 -0.0118( -0.0138 to-0.0098)
<0.001
-0.0015(-0.0039 to0.0008)
0.206 -0.0034 (-0.0052 to-0.0015)
<0.001
Model 2 -0.0110 ( -0.0133 to-0.0088)
<0.001
-0.0022 (-0.0048 to0.0003)
0.095 -0.0044(-0.0065 to-0.0023)
<0.001
Model 3 -.0105(-.0127 to-.0082)
<0.001
-.0023(-.0049 to.0002)
0.076 -.0034(-.0052 to -.0017)
<0.001
Model 4 -.0070(-.0091 to -.0050)
<0.001
-.0017 (-.0043 to .0008)
0.192 -.0032 (-.0050to-.0014)
<0.001
Handgrip Unadjusted -0.0300 ( -0.0354 to-0.0245)
<0.001
0.0002 (-0.0072 to0.0077)
0.947 -0.0047 (-0.0091 to-0.0003)
0.033
Model 1 -0.0262 (-.0311 to-0.0212)
<0.001
-.0030 (-.0096 to.0036)
0.370 -.0050(-.0089 to-.0010)
0.013
Model 2 -.0219 (-.0273 to-.0164)
<0.001
-.0037 (-.0111 to.0037)
0.328 -.0053 (-.0099 to-.0007)
0.023
Model 3 -.0194(-.0253 to-.0135)
<0.001
-.0050(-.0142 to.0040)
0.273 -.0039(-.0090 to.0010)
0.124
Model 4 -.0120 (-.0178 to -.0062)
<0.001
-.0038 (-.0129 to .0053)
0.410 -.0032 ( -.0084 to .0019)
0.216
gait speed Unadjusted -.0004 (-.0006 to-.0003)
<0.001
-.0000 (-.0002 to.0002)
0.901 -.0000 (-.0003 to.0001)
0.533
Model 1 -.0004 (-.0006 to-.0002)
<0.001
-.0001 (-.0003 to.0001)
0.332 -.0000 (-.0002 to.0001)
0.549
Model 2 -.0002 (-.0004 to-.0001)
0.003 -.0000 (-.0002 to.0002)
0.978 -.0000(-.0003to.0001)
0.586
Model 3 -.0001 (-.0003 to.0000)
0.103 -.0000(-.0003 to.0002)
0.759 .0000(-.0001 to.0003)
0.495
Model 4 -.0001 (-.0003 to .0000)
0.341 -.0000 (-.0003 to.0002)
0.791 .0000 (-.0002 to.0003)
0.668
SPPB Unadjusted -.0024 (-.0035 to-.0013)
<0.001
.0001 (-.0013to.0016)
0.858 -.0010 (-.0027 to.0006
0.209
Model 1 -.0022 (-.0032 to-.0012)
<0.001
-.0002 (-.0016 to.0011)
0.698 -.0012 (-.0028 to.0003)
0.115
Model 2 -.00195 (-.0031 to-.0007)
0.002 -.0000 (-.0016 to.0015)
0.973
-.0018 (-.0036 to.0000)
0.058
Model 3 -.0010(-.0024 to.0003)
0.151 .0006(-.0013 to.0025)
0.533 -.0008(-.0029 to .0012)
0.425
Model 4 -.0006(-.0021 to.0007)
0.354 .0006 (-.0013 to.0026)
0.512 -.0009(-.0031 to.0011
0.371
Multivariate linear regression was used for analysis
Model 1 adjusted for age, marital
Page 18/19
Model 2 adjusted for Model 1+ smoking, metabolic syndrome, cognitive disorder, and the number of chronic diseases b
Model 3 adjusted for Model 2 + anti-in�ammatory medications, antiPLT medications, anti-diabetic medications, anti-hyperlipidemic medications, HTN medications, IADL, WHR, and BMI
Model 4 adjusted for Model 3 + Hgb, HbA1c, HDL-cholesterol, ALK-P, TG, Uric Acid, and Creatinine
a PLT concentration was used as an independent variable
b Chronic diseases included: liver diseases, lung diseases, cardiovascular disease, Hypertension, diabetes mellitus, thyroiddiseases, osteoarthritis, and rheumatoid arthritis
Note: BEH: Bushehr elderly health; ASM: Appendicular skeletal muscle mass; SPPB: Short Physical Performance Battery; HTN:Hypertension; IADL: Instrumental activities of daily living; WHR: waist to hip ratio; BMI: Body mass index; Hgb: Hemoglobin;WBC: White blood cells; HbA1c: hemoglobin A1c; HDL: high-density lipoproteins; ALK-P: Alkaline phosphatase; TG:triglycerides.
Figures
Figure 1
See image above for �gure legend

Page 19/19
Figure 2
See image above for �gure legend