du pont 1q15 slides final
TRANSCRIPT

Conference Call
April 21, 2015
DuPont First Quarter 2015 Earnings

1
Regulation G The attached charts include company information that does not conform to generally accepted accounting principles (GAAP).
Management believes that an analysis of this data is meaningful to investors because it provides insight with respect to ongoing operating
results of the company. These measures should not be viewed as an alternative to GAAP measures of performance. Furthermore, these
measures may not be consistent with similar measures provided by other companies. This data should be read in conjunction with
previously published company reports on Forms 10-K, 10-Q, and 8-K. These reports, along with reconciliations of non-GAAP measures to
GAAP are available on the Investor Center of www.dupont.com under Filings and Reports – Reconciliations and Other Data.
Reconciliations of non-GAAP measures to GAAP are also included with this presentation.
Forward-Looking Statements This document contains forward-looking statements which may be identified by their use of words like “plans,” “expects,” “will,” “believes,”
“intends,” “estimates,” “anticipates” or other words of similar meaning. All statements that address expectations or projections about the
future, including statements about the company's strategy for growth, product development, regulatory approval, market position,
anticipated benefits of recent acquisitions, timing of anticipated benefits from restructuring actions, outcome of contingencies, such as
litigation and environmental matters, expenditures and financial results, are forward looking statements. Forward-looking statements are
not guarantees of future performance and are based on certain assumptions and expectations of future events which may not be realized.
Forward-looking statements also involve risks and uncertainties, many of which are beyond the company’s control. Some of the important
factors that could cause the company’s actual results to differ materially from those projected in any such forward-looking statements are:
fluctuations in energy and raw material prices; failure to develop and market new products and optimally manage product life cycles; ability
to respond to market acceptance, rules, regulations and policies affecting products based on biotechnology; significant litigation and
environmental matters; failure to appropriately manage process safety and product stewardship issues; changes in laws and regulations or
political conditions; global economic and capital markets conditions, such as inflation, interest and currency exchange rates; business or
supply disruptions; security threats, such as acts of sabotage, terrorism or war, weather events and natural disasters; ability to protect and
enforce the company's intellectual property rights; successful integration of acquired businesses and separation of underperforming or non-
strategic assets or businesses and successful completion of the proposed spinoff of the Performance Chemicals segment including ability
to fully realize the expected benefits of the proposed spinoff. The company undertakes no duty to update any forward-looking statements
as a result of future developments or new information.
Developing Markets
Total developing markets is comprised of Developing Asia, Developing Europe, Middle East & Africa, and Latin America. A detailed list of
all developing countries is available on the Earnings News Release link on the Investor Center website at www.dupont.com.

1Q 2015 Financial Highlights* $ in millions, except EPS
2
1Q15 vs. 1Q14
EPS
Operating earnings* $1.34 (15%)
GAAP earnings $1.13 (27%)
Segment Operating Earnings* $1,943 (14%)
1Q15 vs. 1Q14
Consolidated Net Sales $9,172 (9%)
Volume (1%)
Local Prices & Product Mix -
Currency Impact (6%)
Portfolio (2%)
* See appendix for reconciliations of Non-GAAP Measures

1Q 2015 Operating EPS* Variance
3
* See appendix for details of significant items and reconciliation of Non-GAAP Measures
Lower corporate and interest expense and lower shares outstanding together contributed $0.07 to the quarter
Higher tax rate and EGL negatively impacted operating EPS by $0.03 per share and $0.02 per share, respectively
Segment results, including a $0.25 per share impact from currency, were down due to challenging agriculture and
TiO2 markets, partially offset by strength in Performance Materials, Electronics & Communication and Safety &
Protection
Key Factors
$1.58 Operating*
EPS
$0.05 ($0.26)
($0.02)
$0.02
($0.03)
$1.34 Operating*
EPS
1Q14 Corp & Interest Exp Lower Shares Segment Results Tax Rate EGL 1Q15
($0.25)
Currency

Collaboration Speeds Innovation
2013 Highlights
Global Sales – Regional Highlights
4
U.S. & Canada 47%
Developing EMEA 9%
Developed EMEA 17%
Developing Asia 10%
Developed Asia 8%
Latin America 9%
1Q 2015 Sales by Region
1Q 2014 Sales by Region
U.S. & Canada 44%
Developing EMEA 10%
Developed EMEA 19%
Developing Asia 10%
Developed Asia 7%
Latin America 10%
Shifts mainly reflect the impact of currency movements versus the U.S. Dollar, particularly
in EMEA

1Q 2015 Segment Operating Earnings* Variance
($ in millions)
5 * See appendix for details of significant items and reconciliation of Non-GAAP Measures
Performance Materials results driven by demand for ethylene and performance polymers, partially offset by lower ethylene
selling prices
Other reflects lower expenses associated with pre-commercial programs and discontinued businesses
Electronics & Communications earnings growth fueled by demand in consumer electronics paired with strong productivity
gains
Safety & Protection delivered broad based volume growth across Tyvek® , Kevlar®, and Nomex® brands
Performance Chemicals results impacted by lower TiO2 volumes and price
Agriculture results driven by impact of currency and decreased volumes due to expected reductions in global corn planted
area and lower insecticide demand in Latin America from reduced insect pressure, partially offset by pricing gains
Key Factors
($77) $0 $10
1Q14 Perf Mtls Other E&C S&P IB N&H Perf Chem Ag 1Q15
$2,248
Segment
Operating
Earnings*
$34
$1,943
Segment
Operating
Earnings*
$26 $9 ($4) ($303)

Balance Sheet and Cash March 31, 2015
6
Free Cash Flow
• Slightly improved over prior year
• Benefit from reduction in working capital
Balance Sheet
• $6.6B net debt**
• Increase since year end due to normal seasonal
working capital requirements
Expected Uses of Cash for 2015
• Announced 4 percent increase in 2Q dividend
• Capex spend est. $1.8B FY 2015, including
Performance Chemicals
• Continued growth investments in line with strategy
-4.0
-3.0
-2.0
-1.0
0.0
1Q 14 1Q 15
$ B
illi
on
s
0
4
8
12
16
Sep-13 Dec-13 Mar-14 Jun-14 Sep-14 Dec-14 Mar-15
$ B
illio
ns
Gross Debt Cash Net Debt**
Free Cash Flow*
Cash and Debt
* Free Cash Flow is cash provided by operating activities of ($2,123MM) and ($2,421MM) less purchases of plant, property and equipment of $565MM and $320MM for the
quarter ended March 31, 2015 and 2014, respectively.
** See appendix for reconciliation of Non-GAAP measures.

2013 Highlights
Other Highlights
7
• Redesign initiative on track and contributed $0.10 per share to operating earnings in
the quarter; now expect about $0.40 per share in savings for full year 2015
• On track to complete Performance Chemicals separation July 1st, pending final
approval from DuPont’s Board of Directors
• Expect to return all or substantially all of anticipated Chemours one-time dividend proceeds of
approximately $4 billion to shareholders via share repurchases within 12-18 months of separation,
a portion of which will occur by the end of 2015
• Expect Chemours to declare quarterly dividend of about $100 million payable in 3Q15 to
shareholders of record after the separation

Performance Materials*** Performance Polymers (DPP), Packaging & Industrial Polymers (P&IP)
8
1Q13 1Q14 1Q15 0%
5%
10%
15%
20%
25%
0
75
150
225
300
375
Ma
rgin
$ in
Millio
ns
1Q Comments
• Sales – Sales of $1.4B were down 8 percent as strong volume
growth was more than offset by the impacts of the Glass
Laminating Solutions/Vinyls divestiture, currency, and lower
ethylene prices
• Portfolio and currency reduced sales by 13 percent; excluding
these factors, sales would have been up 5 percent
• Segment volume increased 8 percent on solid North America and
Asia demand in auto and increased ethylene sales. Prior year
ethylene sales were constrained in advance of a planned
maintenance outage
• Operating Earnings - Up 12 percent as higher volumes and
stronger mix more than offset negative impacts from currency
and portfolio changes
• Operating margins increased ~400 bps due to mix enrichment
2Q Outlook
• 2Q: Sales - Down about low-teens percent due primarily to
portfolio changes, currency, and lower ethylene prices.
Excluding currency and portfolio, sales up in the low-single digit
range
• Operating Earnings - Increase in the mid-single digits on higher
volume and continued mix enrichment
• The benefit of lower ethane costs will be more than offset by
lower margins for ethylene and ethylene-based products.
* Segment sales include transfers.
**See appendix for reconciliation of non-GAAP measures.
***Prior periods reflect reclassification of Viton® fluoroelastomers from Performance Materials to Performance Chemicals.
1Q Operating Earnings**
1Q Sales*
Vol 8%, Local Price -3%, Currency -5% Port./Other -8%
1,534
1,411
1,200
1,300
1,400
1,500
1,600
1,700
1Q14 Volume LocalPrice
1Q15(ex-curr& portf.)
Curr. Portf./other
1Q15
$ in
Millio
ns

* Segment sales include transfers.
**See appendix for reconciliation of non-GAAP measures.
Electronics & Communications
9
1Q13 1Q14 1Q15 0%
5%
10%
15%
20%
0
25
50
75
100
125
Ma
rgin
$ in
Millio
ns
1Q Comments
• Sales - Down 10 percent as volume growth in consumer
electronics was more than offset by the impact of competitive
pressures on sales of Solamet® paste and the negative impact
of lower metals pricing and currency
• Operating Earnings - Improved 13 percent on stronger product
mix and continued productivity
2Q Outlook
• Sales - Down about low-teens percent with continued solid
demand for consumer electronics more than offset by the
negative impact of metals pricing, currency and lower
Solamet® paste sales
• Operating Earnings – Down low-single digits percent as
productivity actions partially offset the impact of lower sales
• Competitive position in PV paste is stabilizing
• Currently testing new Solamet® paste with customers; expect
to launch the first in a series of new products in 2Q, with
additional introductions later in the year
1Q Operating Earnings**
1Q Sales*
Vol -3%, Local Price -5%, Currency -2%, Port./Other 0%
580
521
450
500
550
600
1Q14 Volume LocalPrice
1Q15(ex-curr& portf.)
Curr. Portf./other
1Q15
$ in
Millio
ns

Safety & Protection Protection Technologies (DPT), Building Innovations (BI), Sustainable
Solutions (DSS)
10
1Q13 1Q14 1Q15 0%
5%
10%
15%
20%
25%
0
50
100
150
200
250
Ma
rgin
$ in
Millio
ns
1Q Comments
• Sales – Down 4 percent as 6 percent volume growth was more
than offset by currency and portfolio impact
• Increased demand in global industrial markets and continued
strong public sector demand in Europe
• Operating Earnings – Up 5 percent on higher volumes and
continued productivity
• Higher costs associated with the Chambers Works outage were
largely offset by a benefit in connection with the advancement of
an ongoing claim
2Q Outlook
• 2Q: Sales – Volume growth is more than offset by currency
and portfolio, resulting in sales down mid-single digits on a
percent basis
• Operating Earnings - Increase in the mid-single digits due to
volume growth and continued productivity
* Segment sales include transfers.
**See appendix for reconciliation of non-GAAP measures.
1Q Operating Earnings**
1Q Sales*
Vol 6%, Local Price -1%, Currency-4%, Port./Other -5%
* Segment sales include transfers.
**See appendix for reconciliation of non-GAAP measures.
947
909
850
900
950
1,000
1,050
1Q14 Volume LocalPrice
1Q15(ex-curr& portf.)
Curr. Portf./other
1Q15
$ in
Millio
ns
Industrial Biosciences
11
1Q13 1Q14 1Q15 0.0%
5.0%
10.0%
15.0%
20.0%
25.0%
0
10
20
30
40
50
60
Ma
rgin
$ in
Millio
ns
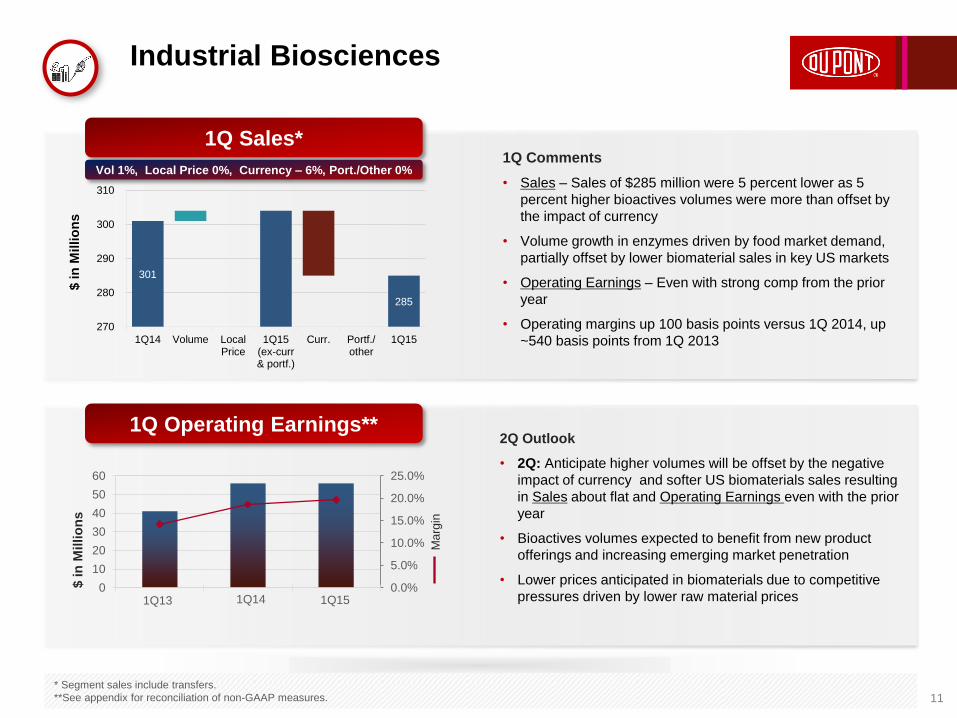
1Q Comments
• Sales – Sales of $285 million were 5 percent lower as 5
percent higher bioactives volumes were more than offset by
the impact of currency
• Volume growth in enzymes driven by food market demand,
partially offset by lower biomaterial sales in key US markets
• Operating Earnings – Even with strong comp from the prior
year
• Operating margins up 100 basis points versus 1Q 2014, up
~540 basis points from 1Q 2013
2Q Outlook
• 2Q: Anticipate higher volumes will be offset by the negative
impact of currency and softer US biomaterials sales resulting
in Sales about flat and Operating Earnings even with the prior
year
• Bioactives volumes expected to benefit from new product
offerings and increasing emerging market penetration
• Lower prices anticipated in biomaterials due to competitive
pressures driven by lower raw material prices
* Segment sales include transfers.
**See appendix for reconciliation of non-GAAP measures.
1Q Operating Earnings**
1Q Sales*
Vol 1%, Local Price 0%, Currency – 6%, Port./Other 0%
301
285
270
280
290
300
310
1Q14 Volume LocalPrice
1Q15(ex-curr& portf.)
Curr. Portf./other
1Q15
$ in
Millio
ns

Nutrition & Health
12 * Segment sales include transfers.
**See appendix for reconciliation of non-GAAP measures.
1Q13 1Q14 1Q15 0%
3%
6%
9%
12%
0
20
40
60
80
100
120
Ma
rgin
$ in
Millio
ns
1Q Comments
• Sales – 6 percent lower as volume growth was more than
offset by an 8 percent negative impact from currency
• Volume growth in probiotics, cultures, texturants and
ingredient systems was partially offset by lower volume in
specialty proteins, mostly in North America
• Operating Earnings – Decreased $4 million as volume gains
and improved mix were more than offset by the negative
impact of currency
2Q Outlook
• Sales – Expected to be high-single digits percent lower as
volume growth is more than offset by strong currency
headwinds
• Specialty protein market to remain very competitive
• Operating Earnings – Expected to be low-teens percent
lower primarily due to the negative impact of currency
1Q Operating Earnings**
1Q Sales*
Vol 2%, Local Price 0%, Currency-8%, Port./Other 0%
861
813
750
800
850
900
1Q14 Volume LocalPrice
1Q15(ex-curr& portf.)
Curr. Portf./other
1Q15
$ in
Millio
ns

* Segment sales include transfers.
**See appendix for reconciliation of non-GAAP measures.
Agriculture Pioneer, Crop Protection
13
1Q13 1Q14 1Q15 0.0%
10.0%
20.0%
30.0%
40.0%
0
400
800
1,200
1,600
Ma
rgin
$ in
Millio
ns
2Q and 1H Outlook
• Increased headwinds from currency and lower expected corn planted
area
• 1H: Sales – High-single digits percent lower as local pricing gains will
be more than offset by currency and lower corn seed and insecticide
volumes; Operating Earnings – Low-to-mid-teens percent lower as
disciplined cost actions and local pricing gains will be more than
offset by currency and lower volume.
• 2Q: Sales – Mid-single-digits percent lower; Operating Earnings –
Down low-to-mid-single digits percent
• Confident in long term sustainable demand growth, strategy and Ag
pipeline
1Q Comments
• Results better than expected primarily due to disciplined cost actions
• Sales – 10 percent lower as 3 percent higher local prices were more
than offset by 8 percent negative impact from currency and 5 percent
lower volumes
• Local prices were higher from new product mix in Pioneer and pricing
actions in parts of Europe and Asia, partially offsetting currency
• Volumes were lower due to expected reductions in global corn
planted area and lower insecticide demand in Latin America
• Operating Earnings – Decreased 21 percent as productivity and
disciplined cost actions were more than offset by currency and lower
volumes
1Q Operating Earnings**
1Q Sales*
Vol -5%, Local Price 3%, Currency-8%, Port./Other 0%
4,394
3,937
3,500
3,700
3,900
4,100
4,300
4,500
1Q14 Volume LocalPrice
1Q15(ex-curr& portf.)
Curr. Portf./other
1Q15
$ in
Millio
ns
Performance Chemicals*** Titanium Technologies (DTT), Chemical & Fluoroproducts (DC&F)
14
1Q13 1Q14 1Q15 0%
5%
10%
15%
20%
25%
0
50
100
150
200
250
300
Ma
rgin
$ in
Millio
ns
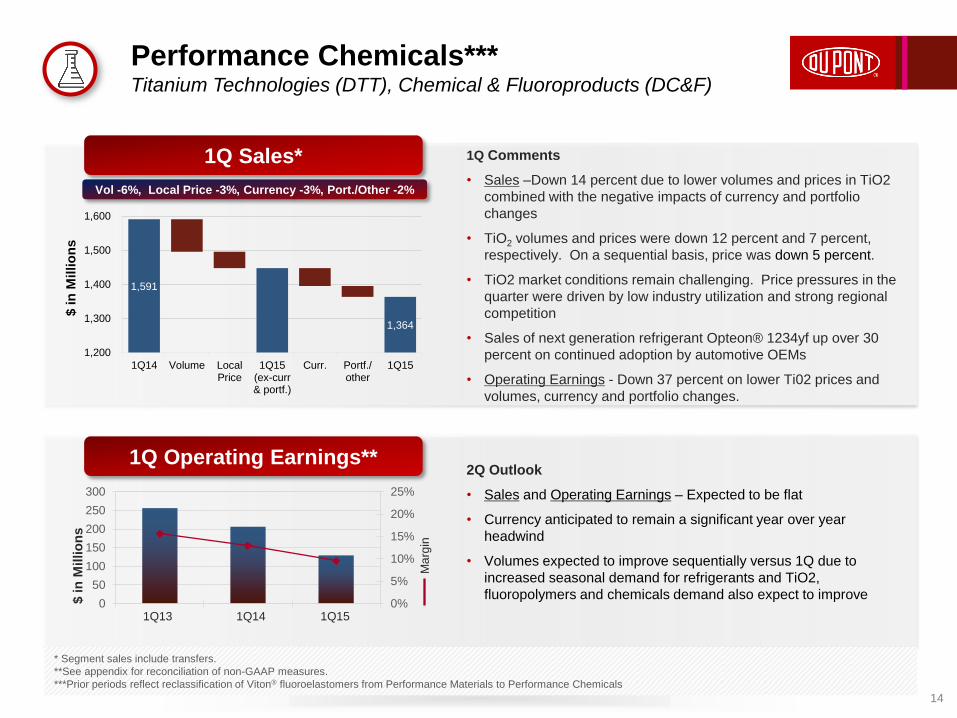
1Q Comments
• Sales –Down 14 percent due to lower volumes and prices in TiO2
combined with the negative impacts of currency and portfolio
changes
• TiO2 volumes and prices were down 12 percent and 7 percent,
respectively. On a sequential basis, price was down 5 percent.
• TiO2 market conditions remain challenging. Price pressures in the
quarter were driven by low industry utilization and strong regional
competition
• Sales of next generation refrigerant Opteon® 1234yf up over 30
percent on continued adoption by automotive OEMs
• Operating Earnings - Down 37 percent on lower Ti02 prices and
volumes, currency and portfolio changes.
2Q Outlook
• Sales and Operating Earnings – Expected to be flat
• Currency anticipated to remain a significant year over year
headwind
• Volumes expected to improve sequentially versus 1Q due to
increased seasonal demand for refrigerants and TiO2,
fluoropolymers and chemicals demand also expect to improve
* Segment sales include transfers.
**See appendix for reconciliation of non-GAAP measures.
***Prior periods reflect reclassification of Viton® fluoroelastomers from Performance Materials to Performance Chemicals
1Q Operating Earnings**
1Q Sales*
Vol -6%, Local Price -3%, Currency -3%, Port./Other -2%
1,591
1,364
1,200
1,300
1,400
1,500
1,600
1Q14 Volume LocalPrice
1Q15(ex-curr& portf.)
Curr. Portf./other
1Q15
$ in
Millio
ns

APPENDIX 1:
FIRST QUARTER 2015 SEGMENT COMMENTARY
This data should be read in conjunction with the Company’s first quarter earnings news
release dated April 21, 2015, DuPont’s 1Q 2015 Earnings Conference Call presentation
materials and reconciliations of non-GAAP to GAAP measures included in the presentation
materials and posted on the DuPont Investor Center website at www.dupont.com.
4/20/2015 15

Segment Commentary First Quarter Earnings 2015
16
Performance Materials
In Performance Materials, we delivered strong volume growth in the quarter, which helped to offset the impact from
currency and lower ethylene prices. Sales of $1.4 billion were up 5 percent year-over-year, excluding an 8 percent
negative impact from portfolio changes, primarily the GLS/Vinyls divestiture, and a 5 percent impact from currency.
Segment volumes increased 8 percent on solid North America and Asia demand in auto and increased ethylene sales.
Sales of ethylene were constrained in the prior year in advance of a planned maintenance outage at our Orange, Texas
ethylene unit.
Operating earnings increased 12 percent as higher volumes and a stronger mix overcame the negative impacts from
currency and portfolio changes. Operating margins increased approximately 400 basis points primarily due to mix
enrichment.
Demand for engineering polymers and elastomers was solid in North America and Asia, despite sluggish year over year
growth in auto builds and weaker demand in Europe and Latin America. In Packaging and Industrial Polymers, the
decline in oil prices year-over-year provided a significant headwind due to lower ethylene prices and margins, offsetting
the favorable impact of advantaged ethane and natural gas pricing. For the second quarter, we anticipate sales will be
low-teens percent lower due primarily to portfolio changes, currency, and lower ethylene prices. Excluding these items,
sales would be up in the low-single-digit range. Operating earnings are expected to be up in the mid-single digits
percent on higher volume and continued mix enrichment.
In the second quarter, we anticipate the benefit of lower ethane cost will be more than offset by lower margins for
ethylene and ethylene-based products.

In Electronics & Communications, operating earnings improved 13 percent on a stronger product mix and from
productivity actions. Sales were 10 percent lower with continued growth in consumer electronics which were more than
offset by the impact of competitive pressures on sales of Solamet® paste and the negative impact of lower metals
pricing and currency.
We are the market and technology leader in photovoltaic materials like our Tedlar® films and are driving a robust
innovation pipeline aimed at furthering solar cell efficiency and module lifetime, which will support continued growth. We
believe our competitive position in PV paste is stabilizing. We expect to launch the first in our series of new Solamet®
paste products in the second quarter, with additional introductions later in 2015.
We expect continued solid demand for our materials into consumer electronics. Second quarter sales are forecast to be
down low-teens percent due to the negative impact of metals pricing, currency and from lower Solamet® paste sales.
Second quarter operating earnings are expected to be down low-single digits percent as productivity will partially offset
the impact of lower sales versus a strong prior year quarter.
Segment Commentary First Quarter Earnings 2015
17
Electronics & Communications

Safety & Protection delivered solid improvements in volume, operating margins and operating earnings. Sales of $909
million were down 4 percent as 6 percent volume growth was more than offset by the negative impact of currency as well
as the Sontara® divestiture. Volume growth of 6 percent was broad-based in global industrial markets, including demand
for Tyvek® protective material, Kevlar® high strength materials and Nomex® thermal resistant fiber, driven by sales into
the mechanical, military, medical packaging and chemical markets. The demand for our products – including the latest
versions of Tyvek®, Kevlar®, and Nomex®, - resulted in volume growth in every region in the first quarter.
First quarter segment operating earnings of $184 million were up 5 percent on volume growth and productivity
improvements. Higher costs associated with lower plant utilization at the Chambers Works facility were largely offset by
a benefit in connection with the advancement of an ongoing claim.
Operating margins improved 170 basis points year over year reflecting improved mix and continued productivity.
In the second quarter, sales will be down in the mid-single digit percent range as volume growth will be more than offset
by the impact of currency and portfolio changes. Operating earnings growth will be in the mid-single-digit percent range,
due to continued demand for our products, ongoing innovation, and continued operational productivity.
Segment Commentary First Quarter Earnings 2015
18
Safety & Protection

Segment Commentary First Quarter Earnings 2015
19
Industrial Biosciences
In Industrial Biosciences, volume and operating margins improved this quarter, despite the challenging environment.
Sales of $285 million were 5 percent lower as 5 percent higher bioactives volumes were more than offset by the impact of
currency. Volumes growth in enzymes driven by food market demand, partially offset by lower biomaterial sales in US
markets.
Operating earnings of $56 million were even with the prior year, overcoming the negative impact of currency. Operating
margins continued to improve, with a 100 basis point increase versus the prior year and 540 basis point increase in total
versus the first quarter of 2013.
We expect higher volumes to continue in the second quarter, driven by benefits from new product offerings in bioactives
and increasing penetration into emerging markets. However, the negative impacts of currency, softer US biomaterial
sales, and lower biomaterials prices will result in sales about flat and operating earnings about even with the prior year on
stronger volumes offsetting negative currency impacts.

In Nutrition & Health, the business produced volume and operating margin improvement this quarter. Sales were 6
percent lower, as a 2 percent increase due to volume was offset by an 8 percent negative impact from currency.
We generated strong volume growth in probiotics, cultures, texturants and ingredient systems, partially offset by lower
volumes in the specialty protein market in North America. Volume growth was strong in EMEA despite pressures from
the Russia food import ban, offsetting weakness in Latin America.
Operating earnings decreased $4 million as volume gains and improved mix were more than offset by the negative
impact of currency.
In the second quarter, we expect continued volume growth in most product lines and the specialty protein market to
remain very competitive. Sales are expected to be high-single digits percent lower due to continued strong currency
headwinds. Operating earnings are expected to be low-teens percent lower primarily due to the negative impact of
currency.
Segment Commentary First Quarter Earnings 2015
20
Nutrition & Health

Segment Commentary First Quarter Earnings 2015
21
Agriculture
In Agriculture, the business performed well given the overall difficult market conditions in the industry. First quarter results,
which are primarily driven by the 2015 planting season in the northern hemisphere and the completion of the Safrinha
season in Brazil, were slightly better than expected in January, primarily due to disciplined cost actions.
2015 is playing out to be one of the most competitive seasons in recent years given the challenging economic environment
in the ag sector and with seed suppliers having abundant inventories globally. Lower insect pressure in Brazil and
continued elevated distributor inventories in the Americas are presenting headwinds in crop protection markets.
First quarter Agriculture segment sales were $3.9 billion, down 10 percent, as 3 percent higher local prices were offset by 8
percent negative impact from currency and 5 percent lower volumes. Seed sales were 11 percent lower and crop protection
sales were down 8 percent versus last year.
We were able to capture 3 percent higher prices across the segment, driven by an improved mix of Pioneer’s newest corn
hybrids and soybean varieties and pricing actions in parts of Europe and Asia, partially offsetting the impact of a stronger
U.S. dollar. Higher local prices were offset by a negative impact from currency, primarily from a weaker Euro, Canadian
dollar, Ukrainian hryvnia, Russian ruble and Brazilian Real.
Volume declined 5 percent due to lower corn planted area, lower insecticide volumes in Latin America and earlier timing of
seed shipments. The largest headwind to volume we continue to face is a further shift from corn to soybeans. We have
seen growers in Brazil reduce corn plantings in the past summer and Safrinha seasons and our North America seed order
book confirms the continued shift to soybeans away from corn. In addition, the insect control business has been impacted
by the shutdown of the LaPorte manufacturing facility in Texas resulting in a shortfall in the supply of methomyl and oxamyl.

Segment Commentary First Quarter Earnings 2015
22
Agriculture (continued)
First quarter operating earnings were significantly impacted by currency and declined 21 percent as lower sales were partially
offset by productivity improvements and disciplined cost actions taken in response to the current market environment in
agriculture.
Even in this difficult environment, we continue to perform and execute on the variables that are within our control – including
bringing new products to market that meet customer demand. We are seeing a positive impact from mix on price as growers
demand our newest corn and soybean genetics. And we continue to build our robust pipeline, with growth prospects in the
near term from new corn and soybean genetics and technologies like event DP4114 and Leptra™ for insect control.
For the first half of 2015, which reflects the majority of the northern hemisphere season, we now expect Agriculture segment
sales to be high-single digits percent lower with operating earnings low-to-mid-teens percent below 2014 as local pricing gains
and cost reductions will be offset by currency and lower corn seed and insecticide volumes. Looking specifically at the second
quarter, sales are expected to be mid-single digits percent lower primarily due to currency with operating earnings down low-to-
mid single digits percent.
In Performance Chemicals, sales of $1.4 Billion were down 14 percent due to lower volumes and prices combined with the
negative impacts of currency and portfolio changes.
Challenging industry fundmentals continued in the first quarter as Ti02 volumes were down 12 percent and price down 7
percent. On a sequential basis, price was down 5 percent. Price pressures in the quarter were driven in part by lower
than optimal industry utilization rates and strong regional competition.
In Chemicals and Fluoroproducts, volumes were even with the prior year as higher demand for fluoropolymers was offset
by lower sales of fluorochemicals, principally due to the reduction in R22 production allocations. Demand for our next
generation refrigerant, Opteon® 1234yf was up over 30 percent on continued adoption by automotive OEMS.
Operating earnings were down 37 percent driven primarily by lower Ti02 prices and volumes, the negative impacts of
currency, and the impact of portfolio changes.
For the 2nd quarter, we anticipate sales and operating earnings will be flat versus the prior year, with currency anticipated
to remain a significant headwind year over year.
Segment volumes are expected to improve sequentially versus 1Q due to increased seasonal demand for refrigerants and
Ti02. Demand for fluoropolymers and chemicals is also expected to improve.
Segment Commentary First Quarter Earnings 2015
23
Performance Chemicals

INDEX PAGE
SELECTED OPERATING RESULTS 24
SELECTED INCOME STATEMENT DATA 25
SEGMENT SALES 26
SEGMENT PRETAX OPERATING INCOME 27
SEGMENT OPERATING EARNINGS 28
SIGNIFICANT ITEMS BY SEGMENT - PRETAX OPERATING INCOME 29
RECONCILIATION OF NON-GAAP MEASURES 30-32
RECONCILIATION OF ADJUSTED OPERATING EARNINGS PER SHARE 33
RECONCILIATION OF BASE INCOME TAX RATE TO EFFECTIVE INCOME TAX RATE 34
Note: Management believes that an analysis of operating earnings (as defined on page 24), a "non-GAAP" measure, is meaningful to investors because it provides insight with respect to ongoing operating results of the company. Such measurements are not recognized in accordance with generally accepted accounting principles (GAAP) and should not be viewed as an alternative to GAAP measures of performance.
E. I. DU PONT DE NEMOURS AND COMPANY AND CONSOLIDATED SUBSIDIARIESQUARTERLY SUPPLEMENTAL FINANCIAL DATA AND NON-GAAP RECONCILIATIONS
(UNAUDITED)MARCH 31, 2015
1Q15 Supplemental Financial Data and Non-GAAP Reconciliations 24 4/21/2015
E. I. DU PONT DE NEMOURS AND COMPANY AND CONSOLIDATED SUBSIDIARIES
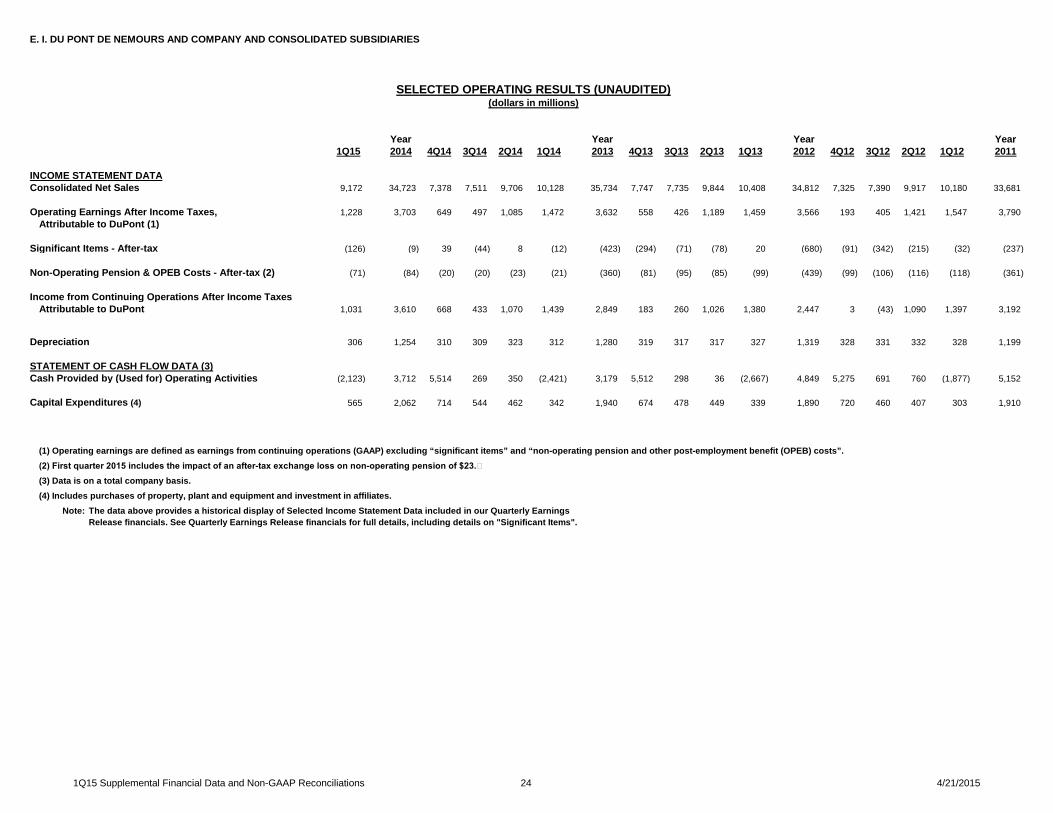
Year Year Year Year1Q15 2014 4Q14 3Q14 2Q14 1Q14 2013 4Q13 3Q13 2Q13 1Q13 2012 4Q12 3Q12 2Q12 1Q12 2011
INCOME STATEMENT DATAConsolidated Net Sales 9,172 34,723 7,378 7,511 9,706 10,128 35,734 7,747 7,735 9,844 10,408 34,812 7,325 7,390 9,917 10,180 33,681
Operating Earnings After Income Taxes, 1,228 3,703 649 497 1,085 1,472 3,632 558 426 1,189 1,459 3,566 193 405 1,421 1,547 3,790 Attributable to DuPont (1)
Significant Items - After-tax (126) (9) 39 (44) 8 (12) (423) (294) (71) (78) 20 (680) (91) (342) (215) (32) (237)
Non-Operating Pension & OPEB Costs - After-tax (2) (71) (84) (20) (20) (23) (21) (360) (81) (95) (85) (99) (439) (99) (106) (116) (118) (361)
Income from Continuing Operations After Income TaxesAttributable to DuPont 1,031 3,610 668 433 1,070 1,439 2,849 183 260 1,026 1,380 2,447 3 (43) 1,090 1,397 3,192
Depreciation 306 1,254 310 309 323 312 1,280 319 317 317 327 1,319 328 331 332 328 1,199
STATEMENT OF CASH FLOW DATA (3)Cash Provided by (Used for) Operating Activities (2,123) 3,712 5,514 269 350 (2,421) 3,179 5,512 298 36 (2,667) 4,849 5,275 691 760 (1,877) 5,152
Capital Expenditures (4) 565 2,062 714 544 462 342 1,940 674 478 449 339 1,890 720 460 407 303 1,910
(1) Operating earnings are defined as earnings from continuing operations (GAAP) excluding “significant items” and “non-operating pension and other post-employment benefit (OPEB) costs”.(2) First quarter 2015 includes the impact of an after-tax exchange loss on non-operating pension of $23.(3) Data is on a total company basis.(4) Includes purchases of property, plant and equipment and investment in affiliates.
Note: The data above provides a historical display of Selected Income Statement Data included in our Quarterly EarningsRelease financials. See Quarterly Earnings Release financials for full details, including details on "Significant Items".
SELECTED OPERATING RESULTS (UNAUDITED)(dollars in millions)

1Q15 Supplemental Financial Data and Non-GAAP Reconciliations 25 4/21/2015
E. I. DU PONT DE NEMOURS AND COMPANY AND CONSOLIDATED SUBSIDIARIES
Year Year Year Year1Q15 2014 4Q14 3Q14 2Q14 1Q14 2013 4Q13 3Q13 2Q13 1Q13 2012 4Q12 3Q12 2Q12 1Q12 2011
Consolidated Net Sales 9,172 34,723 7,378 7,511 9,706 10,128 35,734 7,747 7,735 9,844 10,408 34,812 7,325 7,390 9,917 10,180 33,681
Segment Sales 9,241 35,011 7,439 7,580 9,783 10,209 36,046 7,814 7,813 9,925 10,494 35,194 7,397 7,480 10,022 10,295 34,087
Segment Operating Earnings (1) 1,943 5,955 1,014 923 1,770 2,248 5,925 939 853 1,857 2,276 6,251 616 921 2,241 2,473 6,292
Adjusted EBIT (Operating Earnings) (1) (2) 1,902 5,435 992 969 1,529 1,945 5,021 675 587 1,693 2,066 5,147 346 614 2,058 2,129 5,293
Adjusted EBITDA (Operating Earnings) (1) (2) 2,348 7,052 1,371 1,327 1,972 2,382 6,624 1,062 966 2,097 2,499 6,778 740 1,007 2,475 2,556 6,744
Operating Earnings Before Income Taxes (1) 1,822 5,069 905 877 1,439 1,848 4,587 567 482 1,582 1,956 4,708 230 501 1,950 2,027 4,886
Operating Earnings Per Share (1) (3) 1.34 4.01 0.71 0.54 1.17 1.58 3.88 0.59 0.45 1.28 1.56 3.77 0.20 0.43 1.50 1.64 4.02
(1) See Reconciliation of Non-GAAP Measures.
(2) Adjusted EBIT from operating earnings is operating earnings (as defined on page 24) before income taxes, net income attributable to noncontrolling interests and interest expense. Adjusted EBITDA from operating earnings is adjusted EBIT from operating earnings before depreciation and amortization of intangible assets.
(3) Earnings per share for the year may not equal the sum of quarterly earnings per share due to changes in average share calculations.
Note:
SELECTED INCOME STATEMENT DATAOPERATING EARNINGS (UNAUDITED)(dollars in millions, except per share)
The data above provides a historical display of Selected Income Statement Data included in our Quarterly Earnings Release financials. See Quarterly Earnings Release financials for full details, including details on "Significant Items".
1Q15 Supplemental Financial Data and Non-GAAP Reconciliations 26 4/21/2015
E. I. DU PONT DE NEMOURS AND COMPANY AND CONSOLIDATED SUBSIDIARIES
Year Year Year Year1Q15 2014 4Q14 3Q14 2Q14 1Q14 2013 4Q13 3Q13 2Q13 1Q13 2012 4Q12 3Q12 2Q12 1Q12 2011
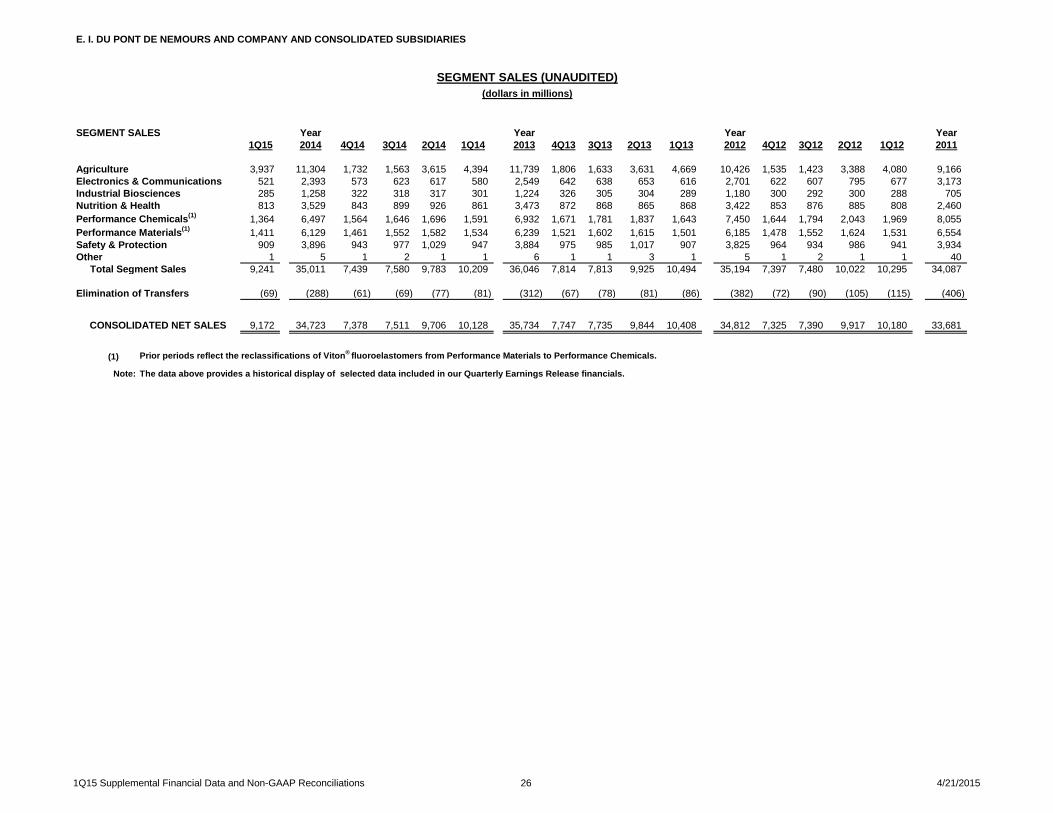
Agriculture 3,937 11,304 1,732 1,563 3,615 4,394 11,739 1,806 1,633 3,631 4,669 10,426 1,535 1,423 3,388 4,080 9,166 Electronics & Communications 521 2,393 573 623 617 580 2,549 642 638 653 616 2,701 622 607 795 677 3,173 Industrial Biosciences 285 1,258 322 318 317 301 1,224 326 305 304 289 1,180 300 292 300 288 705 Nutrition & Health 813 3,529 843 899 926 861 3,473 872 868 865 868 3,422 853 876 885 808 2,460 Performance Chemicals(1) 1,364 6,497 1,564 1,646 1,696 1,591 6,932 1,671 1,781 1,837 1,643 7,450 1,644 1,794 2,043 1,969 8,055 Performance Materials(1) 1,411 6,129 1,461 1,552 1,582 1,534 6,239 1,521 1,602 1,615 1,501 6,185 1,478 1,552 1,624 1,531 6,554 Safety & Protection 909 3,896 943 977 1,029 947 3,884 975 985 1,017 907 3,825 964 934 986 941 3,934 Other 1 5 1 2 1 1 6 1 1 3 1 5 1 2 1 1 40
Total Segment Sales 9,241 35,011 7,439 7,580 9,783 10,209 36,046 7,814 7,813 9,925 10,494 35,194 7,397 7,480 10,022 10,295 34,087
Elimination of Transfers (69) (288) (61) (69) (77) (81) (312) (67) (78) (81) (86) (382) (72) (90) (105) (115) (406)
CONSOLIDATED NET SALES 9,172 34,723 7,378 7,511 9,706 10,128 35,734 7,747 7,735 9,844 10,408 34,812 7,325 7,390 9,917 10,180 33,681
(1) Prior periods reflect the reclassifications of Viton® fluoroelastomers from Performance Materials to Performance Chemicals.
Note: The data above provides a historical display of selected data included in our Quarterly Earnings Release financials.
SEGMENT SALES
SEGMENT SALES (UNAUDITED)(dollars in millions)
1Q15 Supplemental Financial Data and Non-GAAP Reconciliations 27 4/21/2015
E. I. DU PONT DE NEMOURS AND COMPANY AND CONSOLIDATED SUBSIDIARIES
Year Year Year Year1Q15 2014 4Q14 3Q14 2Q14 1Q14 2013 4Q13 3Q13 2Q13 1Q13 2012 4Q12 3Q12 2Q12 1Q12 2011
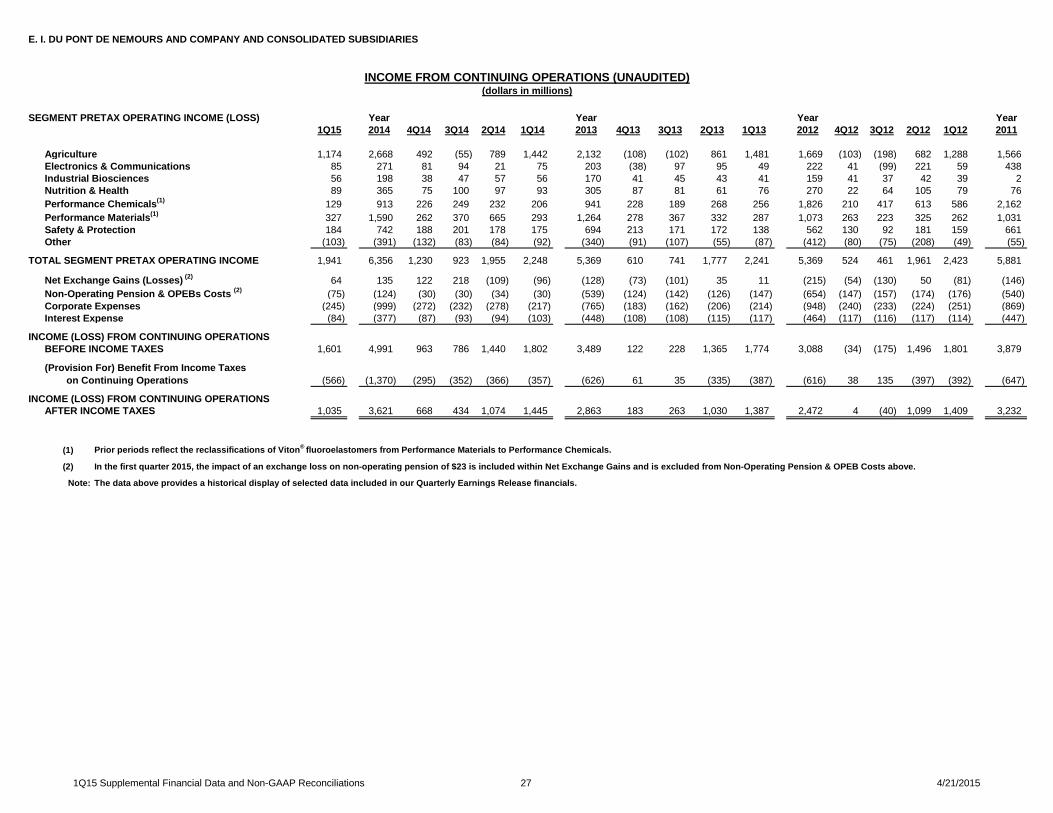
Agriculture 1,174 2,668 492 (55) 789 1,442 2,132 (108) (102) 861 1,481 1,669 (103) (198) 682 1,288 1,566 Electronics & Communications 85 271 81 94 21 75 203 (38) 97 95 49 222 41 (99) 221 59 438 Industrial Biosciences 56 198 38 47 57 56 170 41 45 43 41 159 41 37 42 39 2 Nutrition & Health 89 365 75 100 97 93 305 87 81 61 76 270 22 64 105 79 76 Performance Chemicals(1) 129 913 226 249 232 206 941 228 189 268 256 1,826 210 417 613 586 2,162 Performance Materials(1) 327 1,590 262 370 665 293 1,264 278 367 332 287 1,073 263 223 325 262 1,031 Safety & Protection 184 742 188 201 178 175 694 213 171 172 138 562 130 92 181 159 661 Other (103) (391) (132) (83) (84) (92) (340) (91) (107) (55) (87) (412) (80) (75) (208) (49) (55)
TOTAL SEGMENT PRETAX OPERATING INCOME 1,941 6,356 1,230 923 1,955 2,248 5,369 610 741 1,777 2,241 5,369 524 461 1,961 2,423 5,881
Net Exchange Gains (Losses) (2) 64 135 122 218 (109) (96) (128) (73) (101) 35 11 (215) (54) (130) 50 (81) (146) Non-Operating Pension & OPEBs Costs (2) (75) (124) (30) (30) (34) (30) (539) (124) (142) (126) (147) (654) (147) (157) (174) (176) (540) Corporate Expenses (245) (999) (272) (232) (278) (217) (765) (183) (162) (206) (214) (948) (240) (233) (224) (251) (869) Interest Expense (84) (377) (87) (93) (94) (103) (448) (108) (108) (115) (117) (464) (117) (116) (117) (114) (447)
INCOME (LOSS) FROM CONTINUING OPERATIONSBEFORE INCOME TAXES 1,601 4,991 963 786 1,440 1,802 3,489 122 228 1,365 1,774 3,088 (34) (175) 1,496 1,801 3,879
(566) (1,370) (295) (352) (366) (357) (626) 61 35 (335) (387) (616) 38 135 (397) (392) (647)
INCOME (LOSS) FROM CONTINUING OPERATIONSAFTER INCOME TAXES 1,035 3,621 668 434 1,074 1,445 2,863 183 263 1,030 1,387 2,472 4 (40) 1,099 1,409 3,232
(1) Prior periods reflect the reclassifications of Viton® fluoroelastomers from Performance Materials to Performance Chemicals.
(2)
Note: The data above provides a historical display of selected data included in our Quarterly Earnings Release financials.
In the first quarter 2015, the impact of an exchange loss on non-operating pension of $23 is included within Net Exchange Gains and is excluded from Non-Operating Pension & OPEB Costs above.
SEGMENT PRETAX OPERATING INCOME (LOSS)
INCOME FROM CONTINUING OPERATIONS (UNAUDITED)(dollars in millions)
(Provision For) Benefit From Income Taxes on Continuing Operations

1Q15 Supplemental Financial Data and Non-GAAP Reconciliations 28 4/21/2015
E. I. DU PONT DE NEMOURS AND COMPANY AND CONSOLIDATED SUBSIDIARIES
Year Year Year Year1Q15 2014 4Q14 3Q14 2Q14 1Q14 2013 4Q13 3Q13 2Q13 1Q13 2012 4Q12 3Q12 2Q12 1Q12 2011
Agriculture 1,139 2,352 129 (55) 836 1,442 2,483 88 (62) 941 1,516 2,138 (77) (70) 947 1,338 1,791 Electronics & Communications 85 355 97 94 89 75 334 93 97 95 49 259 43 58 99 59 438 Industrial Biosciences 56 211 49 47 59 56 169 40 45 43 41 162 41 40 42 39 81 Nutrition & Health 89 380 82 100 105 93 299 81 81 61 76 319 58 77 105 79 202 Performance Chemicals(1) 129 934 228 249 251 206 1,015 230 261 268 256 1,862 243 420 613 586 2,162 Performance Materials(1) 327 1,298 332 370 303 293 1,280 294 367 332 287 1,177 266 324 325 262 984 Safety & Protection 184 794 209 201 209 175 690 209 171 172 138 620 133 147 181 159 661 Other (66) (369) (112) (83) (82) (92) (345) (96) (107) (55) (87) (286) (91) (75) (71) (49) (27)
TOTAL SEGMENT OPERATING EARNINGS 1,943 5,955 1,014 923 1,770 2,248 5,925 939 853 1,857 2,276 6,251 616 921 2,241 2,473 6,292
Corporate Expenses (164) (702) (144) (171) (186) (201) (762) (191) (162) (195) (214) (864) (215) (174) (224) (251) (813) Interest Expense (84) (377) (87) (93) (94) (103) (448) (108) (108) (115) (117) (464) (117) (116) (117) (114) (447)
1,695 4,876 783 659 1,490 1,944 4,715 640 583 1,547 1,945 4,923 284 631 1,900 2,108 5,032
(378) (938) (71) (122) (347) (398) (983) (43) (111) (373) (456) (1,190) (61) (164) (460) (505) (1,137) Net After-tax Exhange (Losses) Gains (2) (85) (224) (63) (39) (54) (68) (86) (39) (43) 19 (23) (142) (29) (59) (10) (44) (65) Less: Net Income Attr. to Noncontrolling Interests 4 11 - 1 4 6 14 - 3 4 7 25 1 3 9 12 40
OPERATING EARNINGS 1,228 3,703 649 497 1,085 1,472 3,632 558 426 1,189 1,459 3,566 193 405 1,421 1,547 3,790
Net Income Attributable to Noncontrolling Interests 4 11 - 1 4 6 14 - 3 4 7 25 1 3 9 12 40 Non-Operating Pension & OPEB Costs - After-tax (2) (71) (84) (20) (20) (23) (21) (360) (81) (95) (85) (99) (439) (99) (106) (116) (118) (361) Significant Items - After-tax (126) (9) 39 (44) 8 (12) (423) (294) (71) (78) 20 (680) (91) (342) (215) (32) (237)
INCOME (LOSS) FROM CONTINUING OPERATIONSAFTER INCOME TAXES 1,035 3,621 668 434 1,074 1,445 2,863 183 263 1,030 1,387 2,472 4 (40) 1,099 1,409 3,232
(1) Prior periods reflect the reclassifications of Viton® fluoroelastomers from Performance Materials to Performance Chemicals.
(2)
Note: The data above provides a historical display of selected data included in our Quarterly Earnings Release financials.
OPERATING EARNINGS (UNAUDITED) (dollars in millions)
In the first quarter 2015, the impact of an after-tax exchange loss on non-operating pension of $23 is excluded from Net After-tax Exchange Losses and is included within Non-Operating Pension & OPEB Costs-After tax above.
OPERATING EARNINGS BEFORE INCOME TAXES AND EXCHANGE (LOSSES) GAINS
Provision For Income Taxes on Operating Earnings, Excluding Taxes on Exchange (Losses) Gains
SEGMENT OPERATING EARNINGS

1Q15 Supplemental Financial Data and Non-GAAP Reconciliations 29 4/21/2015
E. I. DU PONT DE NEMOURS AND COMPANY AND CONSOLIDATED SUBSIDIARIES
SEGMENT PRETAX IMPACT OF Year Year Year YearSIGNIFICANT ITEMS 1Q15 2014 4Q14 3Q14 2Q14 1Q14 2013 4Q13 3Q13 2Q13 1Q13 2012 4Q12 3Q12 2Q12 1Q12 2011
Agriculture 35 316 363 - (47) - (351) (196) (40) (80) (35) (469) (26) (128) (265) (50) (225) Electronics & Communications - (84) (16) - (68) - (131) (131) - - - (37) (2) (157) 122 - - Industrial Biosciences - (13) (11) - (2) - 1 1 - - - (3) - (3) - - (79) Nutrition & Health - (15) (7) - (8) - 6 6 - - - (49) (36) (13) - - (126) Performance Chemicals - (21) (2) - (19) - (74) (2) (72) - - (36) (33) (3) - - - Performance Materials - 292 (70) - 362 - (16) (16) - - - (104) (3) (101) - - 47 Safety & Protection - (52) (21) - (31) - 4 4 - - - (58) (3) (55) - - - Other (37) (22) (20) - (2) - 5 5 - - - (126) 11 - (137) - (28)
TOTAL SIGNIFICANT ITEMS
BY SEGMENT - PRETAX (2) 401 216 - 185 - (556) (329) (112) (80) (35) (882) (92) (460) (280) (50) (411)
Note: The data above provides a historical display of significant items included in our Quarterly Earnings Release financials.
SIGNIFICANT ITEMS BY SEGMENT - PRETAX OPERATING INCOME (UNAUDITED)(dollars in millions)

1Q15 Supplemental Financial Data and Non-GAAP Reconciliations 30 4/21/2015
E. I. DU PONT DE NEMOURS AND COMPANY AND CONSOLIDATED SUBSIDIARIES
Year Year Year Year1Q15 2014 4Q14 3Q14 2Q14 1Q14 2013 4Q13 3Q13 2Q13 1Q13 2012 4Q12 3Q12 2Q12 1Q12 2011
RECONCILIATION OF DILUTED EPS (1)
Operating EPS 1.34 4.01 0.71 0.54 1.17 1.58 3.88 0.59 0.45 1.28 1.56 3.77 0.20 0.43 1.50 1.64 4.02 Non-Operating Pension & OPEB Costs (2) (0.07) (0.10) (0.02) (0.02) (0.03) (0.03) (0.39) (0.09) (0.09) (0.10) (0.11) (0.46) (0.11) (0.11) (0.12) (0.12) (0.39) Significant Items (0.14) (0.01) 0.04 (0.05) 0.01 (0.01) (0.45) (0.31) (0.08) (0.08) 0.02 (0.72) (0.09) (0.37) (0.23) (0.04) (0.25) GAAP EPS from continuing operations 1.13 3.90 0.73 0.47 1.15 1.54 3.04 0.19 0.28 1.10 1.47 2.59 - (0.05) 1.15 1.48 3.38
RECONCILIATION OF SEGMENT PTOI
Segment Operating Earnings 1,943 5,955 1,014 923 1,770 2,248 5,925 939 853 1,857 2,276 6,251 616 921 2,241 2,473 6,292 Significant Items included in Segment PTOI (2) 401 216 - 185 - (556) (329) (112) (80) (35) (882) (92) (460) (280) (50) (411) Segment PTOI 1,941 6,356 1,230 923 1,955 2,248 5,369 610 741 1,777 2,241 5,369 524 461 1,961 2,423 5,881
RECONCILIATION OF ADJUSTED EBIT / ADJUSTED EBITDA TO CONSOLIDATED INCOME STATEMENTS
Income From Continuing Operations Before Income Taxes 1,601 4,991 963 786 1,440 1,802 3,489 122 228 1,365 1,774 3,088 (34) (175) 1,496 1,801 3,879 Add: Significant Items - Pretax - (Benefit) / Charge 123 (46) (88) 61 (35) 16 559 321 112 91 35 966 117 519 280 50 467 Add: Non-Operating Pension & OPEB Costs - Pretax (2) 98 124 30 30 34 30 539 124 142 126 147 654 147 157 174 176 540 Operating Earnings Before Income Taxes 1,822 5,069 905 877 1,439 1,848 4,587 567 482 1,582 1,956 4,708 230 501 1,950 2,027 4,886 Less: Net Income Attributable to Noncontrolling Interests 4 11 - 1 4 6 14 - 3 4 7 25 1 3 9 12 40 Add: Interest Expense 84 377 87 93 94 103 448 108 108 115 117 464 117 116 117 114 447
Adjusted EBIT (Operating Earnings) 1,902 5,435 992 969 1,529 1,945 5,021 675 587 1,693 2,066 5,147 346 614 2,058 2,129 5,293
Add: Depreciation and Amortization 446 1,617 379 358 443 437 1,603 387 379 404 433 1,631 394 393 417 427 1,451
Adjusted EBITDA (Operating Earnings) 2,348 7,052 1,371 1,327 1,972 2,382 6,624 1,062 966 2,097 2,499 6,778 740 1,007 2,475 2,556 6,744
(1) Earnings per share for the year may not equal the sum of quarterly earnings per share due to changes in average share calculations.(2) First quarter 2015 includes the impact of an exchange loss on non-operating pension of $23.
RECONCILIATION OF NON-GAAP MEASURES (UNAUDITED)(dollars in millions, except per share)

1Q15 Supplemental Financial Data and Non-GAAP Reconciliations 31 4/21/2015
E. I. DU PONT DE NEMOURS AND COMPANY AND CONSOLIDATED SUBSIDIARIES
Mar-15 Dec-14 Sep-14 Jun-14 Mar-14 Dec-13 Sep-13 Jun-13 Mar-13 Dec-12 Sep-12 Jun-12 Mar-12 Dec-11CALCULATION OF NET DEBT
Cash and Cash Equivalents 3,622 6,910 3,982 4,174 3,782 8,941 7,005 6,685 6,555 4,284 3,418 3,506 3,410 3,586 Marketable Securities 125 124 566 173 67 145 184 211 26 123 105 50 191 433 Total Cash 3,747 7,034 4,548 4,347 3,849 9,086 7,189 6,896 6,581 4,407 3,523 3,556 3,601 4,019
Short-Term Borrowings and Capital Lease Obligations 1,621 1,423 3,889 2,506 2,019 1,721 4,204 3,315 2,006 1,275 4,564 3,696 3,593 817 Long-Term Borrowings and Capital Lease Obligations 8,763 9,271 9,279 9,292 9,298 10,741 10,755 10,765 11,279 10,465 10,502 11,254 11,232 11,736 Total Debt 10,384 10,694 13,168 11,798 11,317 12,462 14,959 14,080 13,285 11,740 15,066 14,950 14,825 12,553
Net Debt (Non-GAAP) 6,637 3,660 8,620 7,451 7,468 3,376 7,770 7,184 6,704 7,333 11,543 11,394 11,224 8,534
Year Year Year Year
1Q15 2014 4Q14 3Q14 2Q14 1Q14 2013 4Q13 3Q13 2Q13 1Q13 2012 4Q12 3Q12 2Q12 1Q12 2011CALCULATION OF FREE CASH FLOW
Cash Provided by (Used for) Operating Activities (2,123) 3,712 5,514 269 350 (2,421) 3,179 5,512 298 36 (2,667) 4,849 5,275 691 760 (1,877) 5,152 Less: Purchases of Property, Plant and Equipment 565 2,020 709 530 461 320 1,882 659 466 436 321 1,793 654 443 395 301 1,843 Free Cash Flow (2,688) 1,692 4,805 (261) (111) (2,741) 1,297 4,853 (168) (400) (2,988) 3,056 4,621 248 365 (2,178) 3,309
RECONCILIATION OF NON-GAAP MEASURES (UNAUDITED)(dollars in millions)
1Q15 Supplemental Financial Data and Non-GAAP Reconciliations 32 4/21/2015
E. I. DU PONT DE NEMOURS AND COMPANY AND CONSOLIDATED SUBSIDIARIES
Year Year Year Year1Q15 2014 4Q14 3Q14 2Q14 1Q14 2013 4Q13 3Q13 2Q13 1Q13 2012 4Q12 3Q12 2Q12 1Q12 2011
SEGMENT PTOI MARGIN % (PTOI / Segment Sales) (1)
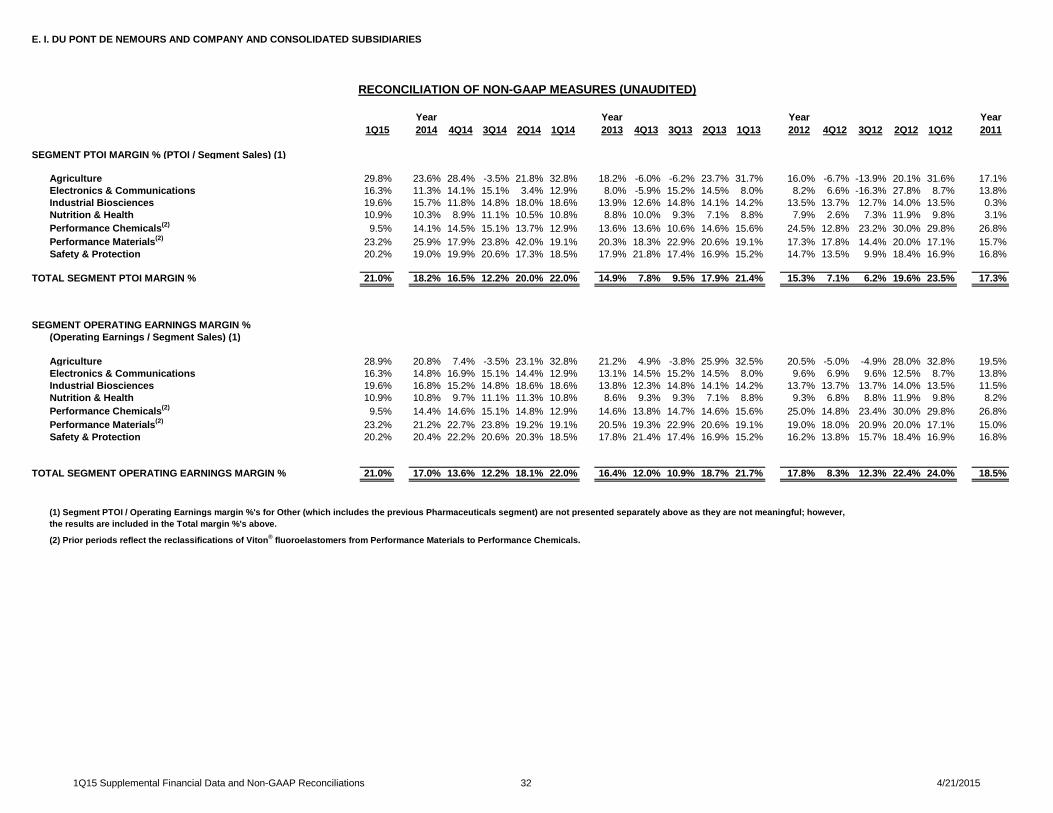
Agriculture 29.8% 23.6% 28.4% -3.5% 21.8% 32.8% 18.2% -6.0% -6.2% 23.7% 31.7% 16.0% -6.7% -13.9% 20.1% 31.6% 17.1%Electronics & Communications 16.3% 11.3% 14.1% 15.1% 3.4% 12.9% 8.0% -5.9% 15.2% 14.5% 8.0% 8.2% 6.6% -16.3% 27.8% 8.7% 13.8%Industrial Biosciences 19.6% 15.7% 11.8% 14.8% 18.0% 18.6% 13.9% 12.6% 14.8% 14.1% 14.2% 13.5% 13.7% 12.7% 14.0% 13.5% 0.3%Nutrition & Health 10.9% 10.3% 8.9% 11.1% 10.5% 10.8% 8.8% 10.0% 9.3% 7.1% 8.8% 7.9% 2.6% 7.3% 11.9% 9.8% 3.1%Performance Chemicals(2) 9.5% 14.1% 14.5% 15.1% 13.7% 12.9% 13.6% 13.6% 10.6% 14.6% 15.6% 24.5% 12.8% 23.2% 30.0% 29.8% 26.8%Performance Materials(2) 23.2% 25.9% 17.9% 23.8% 42.0% 19.1% 20.3% 18.3% 22.9% 20.6% 19.1% 17.3% 17.8% 14.4% 20.0% 17.1% 15.7%Safety & Protection 20.2% 19.0% 19.9% 20.6% 17.3% 18.5% 17.9% 21.8% 17.4% 16.9% 15.2% 14.7% 13.5% 9.9% 18.4% 16.9% 16.8%
TOTAL SEGMENT PTOI MARGIN % 21.0% 18.2% 16.5% 12.2% 20.0% 22.0% 14.9% 7.8% 9.5% 17.9% 21.4% 15.3% 7.1% 6.2% 19.6% 23.5% 17.3%
SEGMENT OPERATING EARNINGS MARGIN % (Operating Earnings / Segment Sales) (1)
Agriculture 28.9% 20.8% 7.4% -3.5% 23.1% 32.8% 21.2% 4.9% -3.8% 25.9% 32.5% 20.5% -5.0% -4.9% 28.0% 32.8% 19.5%Electronics & Communications 16.3% 14.8% 16.9% 15.1% 14.4% 12.9% 13.1% 14.5% 15.2% 14.5% 8.0% 9.6% 6.9% 9.6% 12.5% 8.7% 13.8%Industrial Biosciences 19.6% 16.8% 15.2% 14.8% 18.6% 18.6% 13.8% 12.3% 14.8% 14.1% 14.2% 13.7% 13.7% 13.7% 14.0% 13.5% 11.5%Nutrition & Health 10.9% 10.8% 9.7% 11.1% 11.3% 10.8% 8.6% 9.3% 9.3% 7.1% 8.8% 9.3% 6.8% 8.8% 11.9% 9.8% 8.2%Performance Chemicals(2) 9.5% 14.4% 14.6% 15.1% 14.8% 12.9% 14.6% 13.8% 14.7% 14.6% 15.6% 25.0% 14.8% 23.4% 30.0% 29.8% 26.8%Performance Materials(2) 23.2% 21.2% 22.7% 23.8% 19.2% 19.1% 20.5% 19.3% 22.9% 20.6% 19.1% 19.0% 18.0% 20.9% 20.0% 17.1% 15.0%Safety & Protection 20.2% 20.4% 22.2% 20.6% 20.3% 18.5% 17.8% 21.4% 17.4% 16.9% 15.2% 16.2% 13.8% 15.7% 18.4% 16.9% 16.8%
21.0% 17.0% 13.6% 12.2% 18.1% 22.0% 16.4% 12.0% 10.9% 18.7% 21.7% 17.8% 8.3% 12.3% 22.4% 24.0% 18.5%
(2) Prior periods reflect the reclassifications of Viton® fluoroelastomers from Performance Materials to Performance Chemicals.
TOTAL SEGMENT OPERATING EARNINGS MARGIN %
RECONCILIATION OF NON-GAAP MEASURES (UNAUDITED)
(1) Segment PTOI / Operating Earnings margin %'s for Other (which includes the previous Pharmaceuticals segment) are not presented separately above as they are not meaningful; however, the results are included in the Total margin %'s above.
1Q15 Supplemental Financial Data and Non-GAAP Reconciliations 33 4/21/2015
E. I. DU PONT DE NEMOURS AND COMPANY AND CONSOLIDATED SUBSIDIARIES
Year YearRECONCILIATION OF ADJUSTED OPERATING EPS 2014 2008
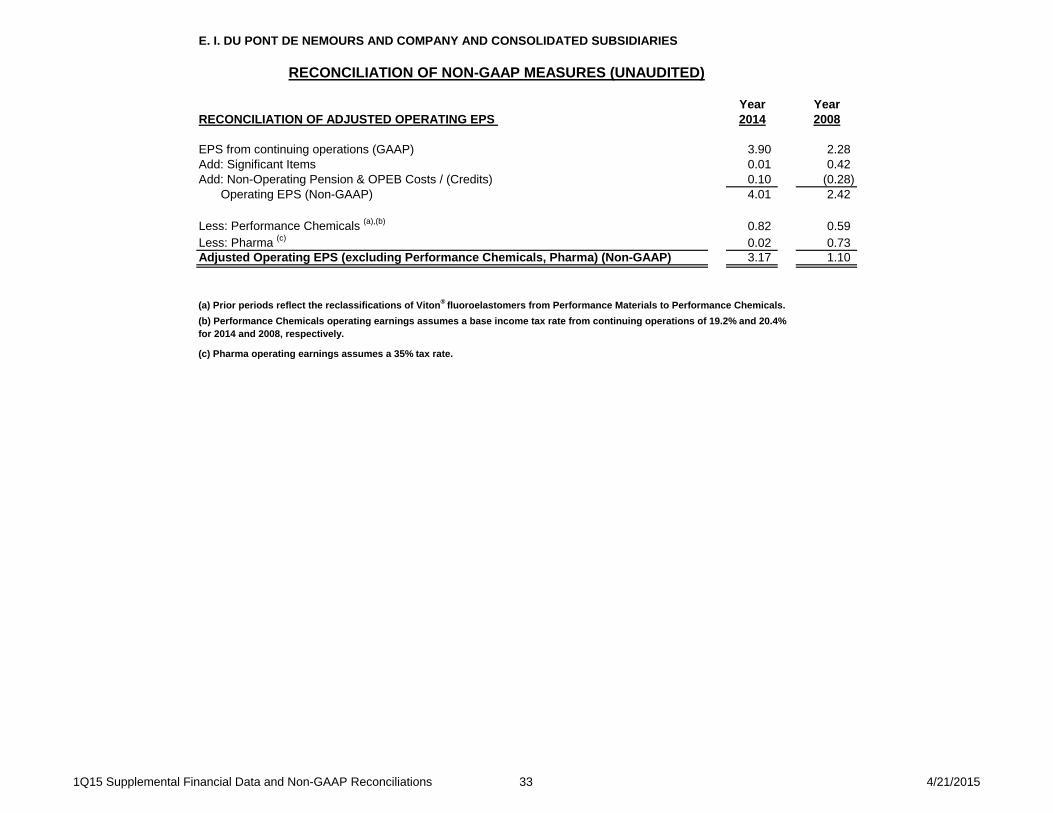
EPS from continuing operations (GAAP) 3.90 2.28 Add: Significant Items 0.01 0.42 Add: Non-Operating Pension & OPEB Costs / (Credits) 0.10 (0.28)
Operating EPS (Non-GAAP) 4.01 2.42
Less: Performance Chemicals (a),(b) 0.82 0.59 Less: Pharma (c) 0.02 0.73 Adjusted Operating EPS (excluding Performance Chemicals, Pharma) (Non-GAAP) 3.17 1.10
(c) Pharma operating earnings assumes a 35% tax rate.
RECONCILIATION OF NON-GAAP MEASURES (UNAUDITED)
(a) Prior periods reflect the reclassifications of Viton® fluoroelastomers from Performance Materials to Performance Chemicals.(b) Performance Chemicals operating earnings assumes a base income tax rate from continuing operations of 19.2% and 20.4% for 2014 and 2008, respectively.

1Q15 Supplemental Financial Data and Non-GAAP Reconciliations34
4/21/2015
E. I. DU PONT DE NEMOURS AND COMPANY AND CONSOLIDATED SUBSIDIARIES
2015 2014 2015 Outlook1 2014 Actual
Effective income tax rate 35.4% 19.8% 30.8% 27.4%Significant items effect and non-operating pension/OPEB costs effect (3.0%) 0.2% (5.3%) (0.7%)
32.4% 20.0% 25.5% 26.7%
Exchange gains (losses) effect2 (10.1%) 0.5% -3.5% (7.5%)Base income tax rate from continuing operations 22.3% 20.5% 22.0% 19.2%
1 - Represents the company's anticipated full year tax rates.2 - The company does not forecast the impact of exchange gains (losses) on the projected tax rate.
Tax rate, from continuing operations, before significant items and non-operating pension/OPEB costs
Three months endedMarch 31,
RECONCILIATION OF BASE INCOME TAX RATE TO EFFECTIVE INCOME TAX RATE (UNAUDITED)
Base income tax rate is defined as the effective income tax rate less the effect of exchange gains (losses), significant items and non-operating pension/OPEB costs.
Year ended December 31,

Copyright © 2014 DuPont or its affiliates. All rights reserved. The DuPont Oval Logo, DuPont™, The miracles of science™ and all products denoted with ™ or ® are registered trademarks or trademarks of E. I. du Pont de Nemours and Company or its affiliates.
Images reproduced by E. I. du Pont de Nemours and Company under license from the National Geographic Society.
Copyright © 2015 DuPont or its affiliates. All rights reserved. The DuPont Oval Logo, DuPont™, The miracles of science™ and all products, unless otherwise indicated, denoted with ™ or ® are registered trademarks or trademarks of E. I. du Pont de Nemours and Company or its affiliates.
Images reproduced by E. I. du Pont de Nemours and Company under license from the National Geographic Society.
© National Geographic Image