draft pied shag population review - doc.govt.nz · a population review of pied shags was ... island...
TRANSCRIPT

Pied shag: A national population review

This report was prepared by Wildlife Management International Limited for the Department of
Conservation as fulfilment of Contract 4349: POP2011-07 Pied shag population review.
June 2013
Wildlife Management International Limited
Po Box 607
Blenheim
Marlborough 7240
New Zealand
Email: [email protected]
Web: www.wmil.co.nz

Contents Abstract...................................................................................................................................................4
Introduction ............................................................................................................................................5
Methods.................................................................................................................................................. 5
Results.....................................................................................................................................................6
Summary of existing knowledge of breeding biology.........................................................................6
Impacts of non-seasonal breeding on population estimates .............................................................7
Data collection ....................................................................................................................................8
Breeding distribution ..........................................................................................................................9
Current population size.....................................................................................................................12
Population trends .............................................................................................................................12
National population trends...........................................................................................................12
Regional population trends...........................................................................................................13
Other available population trend data .........................................................................................19
Colony size ........................................................................................................................................19
Breeding habitat ...............................................................................................................................20
Banding studies.................................................................................................................................21
Longevity and movements............................................................................................................21
Causes of mortality .......................................................................................................................21
Threats ..............................................................................................................................................22
Fishing gear entanglement at colonies .........................................................................................22
Colony removal .............................................................................................................................22
Discussion..............................................................................................................................................22
Recommendations ................................................................................................................................24
Acknowledgements...............................................................................................................................25
References cited ...................................................................................................................................25

Pied shag: A national population review
Mike Bell
Wildlife Management international Limited, PO Box 607, Blenheim, Marlborough 7240, New
Zealand.
Email: [email protected]
Abstract A population review of pied shags was carried out by collating colony records from a wide range of
sources including published and unpublished “grey” literature, web based recording schemes, and
observations from bird watchers. Over 1500 colony records were found for the period 1934-2013.
Using colony count data, the present national population of pied shag was estimated at 3,159
breeding pairs. Extrapolating for breeding age birds not nesting at the time of counts the breeding
population is estimated at 6, 400 breeding pairs. The breeding distribution is disjunct, with breeding
occurring in three areas; northern North Island (from Wairoa north), central New Zealand
(wellington to Canterbury) and the southern South Island (Southland and Stewart Island). The pied
shag population has been increasing since the 1950’s, from an estimated 719 breeding pairs in 42
colonies; to 3,159 breeding pairs in 220 colonies in the 2000’s; an annual increase of approximately
2.3%. There has been some variation regionally in the rate of population increase. The northern
North Island population has increased slower (1.5% per annum), than the central New Zealand
population (5.4%), which has expanded into Nelson and Wellington. Unfortunately data from the
southern South Island population is too limited to evaluate trends for this region. Pied shags
generally nest in small colonies (mean 18.5 nests, range 1-118), with 58% of colony counts under 15
nests and 85% with fewer than 30 nests. Pied shag colonies were almost exclusively found in marine
habitats (87.7%) and the small proportion of colonies in fresh water habitats were all within 4.2 km
of the sea (mean 1.2, range 0.1-4.2km, n = 34). Nests were predominately found in native vegetation
(72.6%), with introduced vegetation of lesser importance and only two colonies were found on
manmade structures. Results from banded birds show that the oldest bird lived to 18 years old, and
birds are relatively sedentary. Recoveries or re-sightings of both juvenile and adult birds were close
to the colony where they were banded; juvenile mean 11.3 km (range 0-39 km), adult mean 12.5 km
(range 0-23 km). The breeding biology of pied shags in New Zealand is reasonably well known.
Significantly, birds breed all year round, which has implications when estimating the national
population. Pied shags were observed to die at colonies after becoming entangled by fishing line
which was attached to a hook imbedded in the bird. This was seen at 9 (13%) of 67 northern North
Island colonies visited during field surveys in 2012/13. Recently two colonies have been removed by
the local Councils following complaints by residents. Recommendations for further work are
provided.

Introduction The pied shag (Phalacrocorax varius) is a large (male 2.2 kg, female 1.7 kg) predominantly black and
white shag which primarily inhabits inshore coastal waters and estuaries (Marchant and Higgins
1990). Two subspecies are recognised; Phalacrocorax varius varius found in New Zealand and
Phalacrocorax varius hyploleucus found in Australia (Checklist committee 2010).
Pied shag is generally considered widespread and moderately common, with a population of 5,000-
10,000 pairs estimated by Heather and Robertson (1996), and a threat ranking of National
Vulnerable (Miskelly et. al. 2008). However it is likely that the population was formerly more
numerous and widespread; with pied shags suffering heavy persecution in the early 1900’s (Oliver
1930).
Pied shag was identified at a high-moderate risk from fishing, primarily from poorly observed set
net, inshore drift net and beach seine fisheries (Rowe 2013). At present there are no mitigation
measures in place in these fisheries to protect shags, and the impacts on the population are
unknown. Bycatch has also been recorded in commercial bottom longline fisheries (e.g. CSP 2010),
and little is known about bycatch in recreational fisheries. Determining fisheries related risk to pied
shag is problematic as little is known about their population size and breeding distribution.
This study aimed to collate all existing knowledge to evaluate the population size and trends of pied
shag in New Zealand.
Methods This population review was carried out by collating all available pied shag colony records. A colony
record consisted of a dated observation confirming breeding at a specified location. The most useful
data included a count of occupied nests, though some records only indicated the presence of a
colony.
Data was compiled from a range of sources, including carrying out a literature review where colony
records were gleaned from published papers and “grey literature” unpublished reports (mainly form
Government agencies). In addition individual observers were encouraged to submit colony records
following advertisement of the project through the Ornithological Society of New Zealand (via
Annual Conferences, Southern Bird and BirdingNZ web groups) and the Department of Conservation
Area Offices.
Following on from the initial data collection, in September 2012 WMIL staff carried out field surveys
on foot searching all mainland colony locations recorded from the Bay of Plenty north to Cape
Regina. In addition to confirming the presence or absence of colonies new additional colonies were
searched for. Surveys in this region were especially important to check on colony status of a large
number of colonies which did not have recent records (20+ years).
All colony records, from both the review and field surveys, were recorded and stored in a GIS linked
database. Fields recorded were colony name (name assigned to each colony – usually a location
name), OSNZ region, habitat (including marine/freshwater and colony exposure), colony tree
species, latitude and longitude, observation date, nests present, nest count, breeding stage, other
species breeding at colony, other notes, and record source (either quoted published paper or
unpublished report, or name of observer).
When estimating population trends data was pooled into decades with the maximum count
recorded for that decade used. With 1950’s referring to 1950-59, 1960’s being 1960-69, etc. Data
from 1950’s also includes 10 counts from 1934 to 1949; and from the 2000’s includes all colony
records up until 2013. For colonies where there was only presence data for a particular decade, the
mean of counts for the decade either side is used (Table 1).
Table 1. Example of estimating population trends from presence data.
A) Data extracted from database – Maximum count for each decade, during the 1980’s the
colony was only recorded as being present, with no count data.
1950's 1960's 1970's 1980's 1990's 2000's
Whale Island/ Moutohora 10 P 15 14
B) Estimated population for 1980’s determined by the mean of counts from 1970’s and 1990’s.
1950's 1960's 1970's 1980's 1990's 2000's
Whale Island/ Moutohora 10 13 15 14
Results
Summary of existing knowledge of breeding biology
The breeding biology of pied shags is reasonable well known, with two detailed studies of pied shag
breeding biology being conducted in New Zealand (Millener 1972; Powlesland et. al. 2008). The
breeding parameters of pied shag in New Zealand are summarised below-
Breeding habitat – Of 21 colonies studied from 1969-72 Millener (1972) found 76% were marine,
and 24% freshwater, although all of these were within 400m of the sea. Most colonies (67%) where
found in shelters harbours, estuaries or lakes, with fewer (33%) on exposed coasts or islands.
Breeding season – Eggs laid year round, however two peaks of egg laying recorded; Feb-May and
Aug-Oct (Millener 1972; Powlesland et. al. 2008). However all colonies showed some irregularity in
breeding timing, in particular in smaller colonies (Millener 1972). Both Millener (1972) and
Powlesland et. al. (2008) thought that breeding outside of peak periods was by young inexperienced
breeders.
Nest – The nest is a raised platform of sticks, twigs and foliage measuring 80cm in diameter (range
25-140cm), with a nest bowl lined with fibrous material such as flax, grass or seaweed. Most nests
are used twice a year, and are refurbished at the start of each breeding attempt (Millener 1972;
Powlesland et. al. 2008).

Eggs – Pale blue when laid, but colour rapidly obscured as eggs become stained brownish; mean egg
dimensions 59.2 x 38.1mm and weight 46.7g (2.7% of female weight) (Millener 1972).
Clutch size – Mean 3.35, range 2-5; with 2 days between each egg laid (Millener 1972).
Incubation period – 28.8 days, range 25-33 days, shared by the sexes (Millener 1972).
Nestling period – 53.2 days, range 47-60 days (Millener 1972).
Age at independence – 133 days (Millener 1972).
Breeding success – Breeding success of between 45-75% recorded (Millener 1972; Powlesland et. al.
2008).
Age at first breeding – Minimum age 2 years, mean not known (limited data available) (Millener
1972).
Breeding period - Courtship mean 15 days (range 5-30); nest building 21.4 days (4-57 days);
incubation 28.8 days (25-33 days); chick rearing 53.2 days (47-60 days); post fledgling care min 30
days, max 80 days. Therefore the full breeding cycle takes between 4 Months (minimum ranges) and
9 months (maximum ranges), but is the average is probably around six months of average, and each
pair is likely to breed once per year despite the two peaks in egg laying (Millener 1972).
Impacts of non-seasonal breeding on population estimates
As described above there have been two detailed studies of pied shag in New Zealand; Millener
(1972) in multiple colonies in Auckland, and Powlesland et. al. (2008) at a developing colony in
Makara (Wellington). Both show a similar breeding pattern with two peaks of egg laying (recorded as
clutches started each month), a spring and autumn peak (Table 2).
Table 2. The percentage of clutches started each month during studies of pied shag breeding biology.
Jan Feb Mar Apr May Jun Jul Aug Sep Oct Nov Dec
Millener (1972) 1.5 6.6 14.1 6.9 6.0 3.0 3.9 15.3 21.6 13.5 5.7 2.1
Powlesland et. al.
(2008) 2.6 20.1 19.5 5.2 3.2 1.3 5.8 9.1 20.1 7.8 3.2 1.9
Average 2.0 13.4 16.8 6.0 4.6 2.1 4.9 12.2 20.8 10.6 4.5 2.0
The breeding cycle takes on average 6 months, of which five months would have birds present at
nest sites (courtship, nest building, incubation and chick rearing) (Millener 1972). Hence the
proportion of the population breeding at any one time is estimated by extending the percentage of
clutches laid each month by the five month nest occupation period (Table 3). As would be expected,
the estimated percentage of the population breeding each month follows a similar two peak
pattern; with the estimated proportion of the population breeding during Sept-Dec being 45-55%;
and between Mar-June around 40%. As such any colony count is only recording up to 55% of the
entire breeding population.

Table 3. The estimated proportion of pied shags breeding at a colony each month, determined from
percentage of clutches initiated each month.
Clutch Estimated percentage population breeding
initiated Jan Feb Mar Apr May Jun Jul Aug Sep Oct Nov Dec
Jan 2 2 2 2 2
Feb 13.4 13.4 13.4 13.4 13.4
Mar 16.8 16.8 16.8 16.8 16.8
Apr 6 6 6 6 6
May 4.6 4.6 4.6 4.6 4.6
Jun 2.1 2.1 2.1 2.1 2.1
Jul 4.9 4.9 4.9 4.9 4.9
Aug 12.2 12.2 12.2 12.2 12.2
Sep 20.8 20.8 20.8 20.8 20.8
Oct 10.6 10.6 10.6 10.6 10.6
Nov 4.5 4.5 4.5 4.5 4.5
Dec 2 2 2 2 2
TOTAL 39.9 32.5 38.7 40.2 42.8 42.9 34.4 29.8 44.6 50.6 53 50.1
Millener (1972) noted that most colonies show some irregularity in timing of breeding, and that
smaller colonies often did not have birds laying in all months. Likewise Powlesland et. al. (2008) did
not record laying in all months until 2001, when the colony was 6 years old with over 10 nests
present. As such a blanket correction factor for all colonies is probably note warranted.
Due to the uncertainty of an overall correction factor for all colonies regardless of size, and limited
data during earlier decades of this study, figures used in this report are colony counts. As such it
should be noted that these figures are a minimum numbers, and that the total population is likely to
be 50-60% higher.
Data collection
A total of 1512 colony records were collected from a wide range of sources; including
• Published papers - 39% of all colony records came from published sources; primarily
“Notornis” and in particular Classified Summarised Notes.
• “Grey literature” - 15% of records come from unpublished reports; including a significant
number of unpublished Wildlife Service reports held in National Archives, but data come
from a wide range of other non published reports
• Individual observers – 38% of all records were supplied by individual observers (primarily
OSNZ members and DOC staff) following advertised requests for information on pied shag
colonies. A significant pool of data was forwarded by Northland OSNZ who maintained a
shag colony register in the 1970’s-90’s for their region. Data recorded in electronic
databases (i.e. OSNZ’s ebird and DOC’s Bioweb) are included here.
• WMIL surveys - 7% of records were a result of specific surveys carried out by WMIL staff as
part of this contract.

The number of colony records over time is not even (Figure 1); with limited colony records prior to
the 1970’s. The amount of data increases during the 1970’s and 80’s when the use of Classified
Summarised Notes published in “Notornis” was at its strongest. The significant amount of data
collected for the 2000’s is primarily a result of survey work carried out by WMIL.
Figure 1. Proportion of colony records for pied shag recorded each decade since the 1950’s. Data for
the 1950’s includes 10 records from 1934-49, and records for the 2000’s includes records up to 2013.
Breeding distribution
A total of 293 pied shag colonies were recorded between 1934 – 2013. Breeding was recorded from
the top of the North Island to the bottom of Stewart Island, but the breeding distribution is disjunct
(Figure 2). Colonies are located in three distinct areas of the country-
1. Northern North Island – with colonies from Wairoa up and around the East Cape, Bay of
Plenty, Coromandel, South Auckland, Auckland, Northland and the Far North.
2. Central New Zealand – with colonies in Wellington, Nelson, Marlborough and Canterbury.
3. Southern South Island – with colonies in Fiordland, Southland and Stewart Island.


Figure 2. Location of all reported breeding colonies pied shag; 1934-
2013.

Current population size
Using colony count data the present national population of pied shag is estimated at 3,159 breeding
pairs. Extrapolating for breeding aged birds not breeding at the time of the count, the estimated
national population is 6,400 breeding pairs.
To determine the present population size of pied shag accurate data is available for the northern
North Island and central New Zealand breeding areas, but is limited for the southern South Island. To
estimate the population from the southern South Island I took the maximum count for each colony
location and combined this with the accurate counts from the northern North Island and central
New Zealand.
Most pied shags are found in the top half of the North Island; with the northern North Island
population comprising 57% of the national population, central New Zealand 38% and the southern
South Island 5%.
Population trends
National population trends
The number of breeding pairs and colonies of pied shags in New Zealand has been increasing since
the 1950’s (Figure 3). As previously mentioned, figures used in this report are colony counts,
although this represents a minimum total population size it is likely to better represent population
trends due to the high number of small establishing colonies which may not have year round
breeding. In the 1950’s there was an estimated 719 breeding pairs found in 42 colonies, 50 years
later during the 2000’s there is an estimated 3,159 breeding pairs in 220 colonies; an annual increase
of approximately 2.3%.
Figure 3. Population trend of pied shags in New Zealand 1950’s – 2000’s. Black line estimated
number of breeding pairs; grey line number of breeding colonies.

Regional population trends
Northern North Island
The number of breeding pairs and colonies of pied shags in breeding in the northern North Island
has been increased since the 1950’s, although during the 1970’s – 1990’s the population stabilised at
around 1,500 breeding pairs (Figure 4). In the 1950’s there was an estimated 630 breeding pairs
found in 32 colonies, 50 years later during the 2000’s there is an estimated 1,785 breeding pairs in
115 colonies; an annual increase of approximately 1.5%.
Figure 4. Population trend of pied shags breeding in the northern North Island 1950’s – 2000’s. Black
line estimated number of breeding pairs; grey line number of breeding colonies.
There have been considerable population fluctuations in regions throughout the northern North
Island breeding range. With most regions seeing a decrease in breeding numbers at same stage
during the 1960’s – 1990’s (Figure 5). Both the breeding population and breeding range has
increased significantly in the last decade (Figure 5 and 6). In particular there has been an expansion
of the breeding range into the Bay of Plenty and Gisborne/East Cape (Figure 5 and 6).

Figure 5. Population trends of pied shags from different regions breeding in the northern North Island
1950’s – 2000’s. Black line estimated number of breeding pairs; grey line number of breeding
colonies.

Figure 6. Distribution of pied shag breeding colonies in the northern North Island 1970’s-2000’s.

Central New Zealand
The number of breeding pairs and colonies of pied shags in breeding in central New Zealand has
increased since the 1950’s, especially since the 1980’s (Figure 7). In the 1950’s there was an
estimated 46 breeding pairs found only 5 known colonies, 50 years later during the 2000’s there is
an estimated 1,204 breeding pairs in 90 colonies; an annual increase of approximately 5.4%.
Figure 7. Population trend of pied shags breeding in the central New Zealand 1950’s – 2000’s. Black
line estimated number of breeding pairs; grey line number of breeding colonies.
There has been considerable population growth in regions throughout the central New Zealand
breeding range (Figure 8). This has been driven from Marlborough and Canterbury which had the
only colonies in until the late 1970’s (Figure 8 and 9). Since the 1980’s pied shag numbers have
dramatically increased in Marlborough and Canterbury, with the population expanding into Nelson
and Wellington (Figure 8 and 9).

Figure 8. Population trends of pied shags from different regions breeding in central New Zealand
1950’s – 2000’s. Black line estimated number of breeding pairs; grey line number of breeding
colonies.

Figure 9. Distribution of pied shag breeding colonies in central New Zealand 1970’s-2000’s.

Southern South Island
Unfortunately the data for the southern South Island breeding range is too limited to determine
population trends for this area. Here the population is estimated by using the maximum recorded
count at each colony; the estimated population is 170 breeding pairs. Pied shags are breeding in
Fiordland, Southland and Stewart Island (Figure 10).
Figure 10. Breeding locations of pied shags in the southern South Island.
Insert Map
Other available population trend data
OSNZ Beach patrol data
The Ornithological Society of New Zealand has carried out a Beach Patrol Scheme since the 1950’s.
Pooling data for all regions, the number of pied shags recovered/100km of beach patrolled has
increased over time (Figure 11).
Figure 11. Number of pied shags recovered per 100km of beach patrolled 1960-2000; Ornithological
Society of New Zealand Beach Patrol Scheme.
Colony size
Pied shags generally nested in small colonies; with the average size 18.5 nests (range 1-118). In total
58% of colony counts are under 15 nests and 85% of colony counts fewer than 30 nests (Figure 12).

Figure 12. Colony size of pied shag colonies recorded in New Zealand 1934-2013.
Breeding habitat
Pied shag colonies were almost exclusively found in marine habitats, with 87.7% of colonies found in
along the coastline in sheltered bays or coves (65.6%), exposed coastal areas (6.8), river or stream
mouths (6.4%) or within estuaries (8.9%) (Figure 13). A small proportion of colonies are found in
fresh water habitats (12.3%), including freshwater lakes, up rivers or on sewage ponds. Of these
colonies found on freshwater, all are close to the sea (mean 1.2 km, range 0.1-4.2km, n = 34).
Figure 13. Habitat preference of pied shag breeding colonies in New Zealand 1934-2013.

Of the 172 colonies where the tree species was recorded most (72.6%) were found in native
vegetation; and this was dominated by Pohutukawa. Fewer colonies (22%) were found in introduced
vegetation; primarily Pine and Macrocarpa. Only two colonies were found on manmade structures;
on a maimai and old disused wharf (Figure 14).
Figure 14. Vegetation preference of pied shags breeding in New Zealand 1934-2013.
Banding studies
Longevity and movements
A total of 173 pied shags have been banded in New Zealand between 1951 and 2011, with all but
one of those banded during 1951-1982. Most birds were banded in 1969-1972, including 91
individually colour banded birds, as part of a wider MSc study on pied shags (Millener 1972). Most of
the birds have been banded as chicks (127 chicks, 41 Juveniles, 4 adults, 1 age not recorded - the
2011 bird which was the banding of a released rehabilitated bird), which means that most recoveries
are of known aged birds.
There is been a relatively high recovery rate, with 35% of birds recovered or colour banded birds re-
sighted; including repeat re-sightings of some of the colour banded birds. The oldest bird lived to 18
years old; which is comparable to the 20 years recorded in Australia (Marchant and Higgins 1990).
Pied shags have only been recorded moving a small distance from the colony (banding location).
Recoveries or re-sightings of juvenile birds (<1 year old birds), were on average 11.3 km from the
banding location (range 0-39 km). Recoveries of adult birds (>1 year old) were on average 12.5 km
from the banding location (range 0-23 km).
Causes of mortality
The cause of death has been recorded for only 13 recovered banded pied shags; 1 was shot (in 1970
when pied shags were unprotected), 1 died in an oil spill, 1 was caught on a fishing line (was not
recorded if commercial or recreational) and 8 have been killed in fishing nets (again not recorded if
commercial or recreational).
Threats
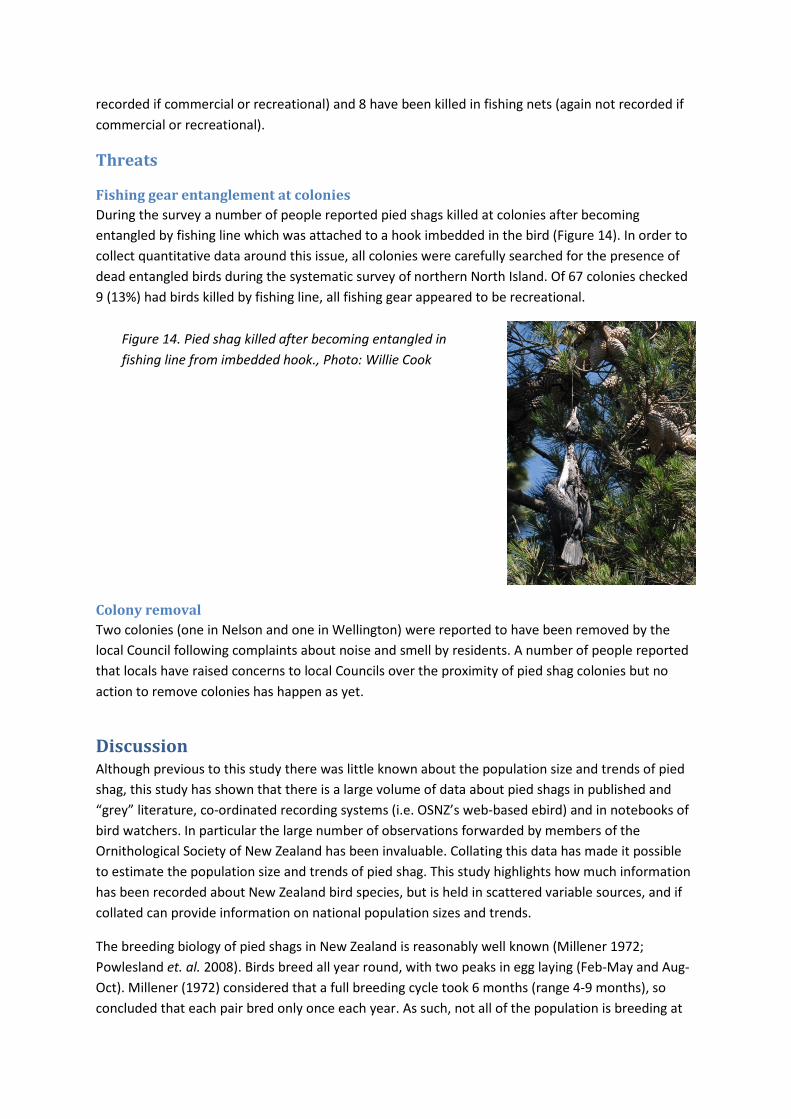
Fishing gear entanglement at colonies
During the survey a number of people reported pied shags killed at colonies after becoming
entangled by fishing line which was attached to a hook imbedded in the bird (Figure 14). In order to
collect quantitative data around this issue, all colonies were carefully searched for the presence of
dead entangled birds during the systematic survey of northern North Island. Of 67 colonies checked
9 (13%) had birds killed by fishing line, all fishing gear appeared to be recreational.
Colony removal
Two colonies (one in Nelson and one in Wellington) were reported to have been removed by the
local Council following complaints about noise and smell by residents. A number of people reported
that locals have raised concerns to local Councils over the proximity of pied shag colonies but no
action to remove colonies has happen as yet.
Discussion Although previous to this study there was little known about the population size and trends of pied
shag, this study has shown that there is a large volume of data about pied shags in published and
“grey” literature, co-ordinated recording systems (i.e. OSNZ’s web-based ebird) and in notebooks of
bird watchers. In particular the large number of observations forwarded by members of the
Ornithological Society of New Zealand has been invaluable. Collating this data has made it possible
to estimate the population size and trends of pied shag. This study highlights how much information
has been recorded about New Zealand bird species, but is held in scattered variable sources, and if
collated can provide information on national population sizes and trends.
The breeding biology of pied shags in New Zealand is reasonably well known (Millener 1972;
Powlesland et. al. 2008). Birds breed all year round, with two peaks in egg laying (Feb-May and Aug-
Oct). Millener (1972) considered that a full breeding cycle took 6 months (range 4-9 months), so
concluded that each pair bred only once each year. As such, not all of the population is breeding at
Figure 14. Pied shag killed after becoming entangled in
fishing line from imbedded hook., Photo: Willie Cook

any one time, and this has significant impacts on estimating the national population. To estimate the
entire national population it is equally important to consider the proportion of breeding birds which
will not be present at a colony at the time of the census.
The pied shags breeding population was split into three distinct areas; northern North Island (Wairoa
north), central New Zealand (Wellington to Canterbury), and southern South Island (Southland and
Stewart Island). By using colony count data the present breeding population is estimated at 3,159
pairs; extrapolating for birds not breeding at the time of the count, the estimated national
population is 6,400 breeding pairs. With 57% of the population in the northern North Island, 38% in
central New Zealand and only 5% in the southern South Island. The breeding distribution reported
here is similar to that described by Robertson et. al. (2007).
Given the increasing population trend observed, the national population estimate reported here is
lower than previous population estimates of 5,000-10,000 breeding pairs in 1996 (Heather and
Robertson 1996). With this study reporting a significant population increase, it is clear that past
attempts have over-estimated the breeding population. This highlights the difficulty of estimating
national populations of highly visual widespread seabird species such as shags without undertaking
extensive data reviews and/or targeted surveys.
Pied shags were heavily persecuted in the early 1900’s (Oliver 1930) and the population was much
reduced. This study shows that since the 1950’s the pied shag population has been increasing, and
their range expanding. The national population has increased at an estimated 2.3% per annum.
Population increase is also confirmed by OSNZ beach patrol data, which has seen an increase in
recovery rates of pied shags found dead on beaches. The present expansion of breeding range, is in
fact likely to be birds re-colonising the former range of the species.
Although the national population is increasing, there are some regional differences in rate of
population increase and expansion.
The northern North Island population has shown slower growth (1.5% per annum); the Far North
population has remained stable; Northland initially increased to the 1980’s but has since been
declining; Auckland, South Auckland and the Bay of Plenty has seen steady gradual growth; whilst
Gisborne/Wairoa has increased sharply since the 1990’s.
In comparison the central New Zealand population has experienced rapid population growth (5.4%
per annum), and significant range expansion. In the 1950’s pied shags were only recorded breeding
in Marlborough and Canterbury, but have now expanded into Nelson and Wellington. Unfortunately
data from the southern South Island population is too limited to determine population trends there.
The drivers of different growth rates in regional populations, and in particular the stable or declining
populations in the Far North and Northland are not known. Likely factors include; the availability of
suitable foraging habitat, prey availability, availability of suitable breeding habitat, impacts of
fisheries (both commercial and recreational), impacts of introduced predators, and human
disturbance.
Most pied shags breed in small colonies, with over half of the colonies numbering less than 15 pairs,
and great majority numbering fewer than 30 pairs. The preference for birds to breed in small

colonies has probably led to expansion of their breeding range, rather than expansion of existing
colonies, particularly as seen in Gisborne/Wairoa, Wellington, Nelson and Canterbury.
Pied shag breeding is almost exclusively restricted to marine habitats, with few colonies recorded on
freshwater lakes, further up rivers or on sewage ponds. Nests are predominately in native
vegetation, and the presence of native vegetation to the water’s edge is likely to be important in
maintaining breeding habitat for pied shags. The high number of nests recorded in Pohutukawa is
testament to the high proportion of birds breeding in the northern North Island, and the dominance
of Pohutukawa in northern coastal environments.
Results from banding show that pied shags do not disperse far from their colonies, confirming that
pied shag are generally sedentary although some juvenile dispersal is reported (Marchant and
Higgins 1990), leading to the gradual expansion of range observed.
This study identified two potentially significant threats for pied shags. A relatively high number of
pied shags were found dead in colonies following entanglement by fishing line. As it is not known the
time it would take for a pied shag corpse to decay and fall free it is difficult to quantify mortality
rates. However, given that during a 3 week period, dead birds were found in 13% of colonies visited,
it suggests that this may be a significant cause of mortality. Although not retrieved, most of this
fishing tackle appeared to be from recreational fishing, and such fishing could be a major source of
mortality. Pied shags have also been reported killed in set nets and inshore long lines (CSP 2010;
Ramm 2012; Rowe 2009).
Two colonies were reported to have been removed by felling of breeding trees by local councils
following complaints by residents. Conflict between people and shags is likely to continue as the
country’s population continues to grow with more coastal housing and subdivision occurring. Given
the importance of coastal vegetation to pied shag breeding, increased coastal development is likely
to impact on pied shag populations.
Recommendations 1. Estimating the national pied shag population is complicated by annual breeding in the
species. Investigation into the proportion of the population breeding at any one time is
recommended and will enable more accurate estimates of the national pied shag
population. This study should aim at looking into the variability in breeding in relation to
colony size.
2. The foraging range of breeding pied shags is not well known, and to better understand the
possible risks of commercial and recreational fishing on pied shags an investigation using
GPS tracking should be carried out.
3. Investigation of the impacts of recreational fishing, and in particular line entanglement on
pied shags is recommended.
4. Promoting advocacy for pied shags is recommended to reduce possible negative human
shag interactions.
5. This study highlights that there is considerable data available to undertake national
population reviews of species where it is presently considered that little is known about

their population trends. Similar reviews of other species considered at moderate to high risk
from fisheries and other human-induced impacts are recommended.
6. This study highlights the need to undertake intensive data investigations when determining
the population size and trends of highly visible apparently common seabirds such as shags.
When undertaking population reviews that involve requesting observations from members
of the Ornithological Society of New Zealand it is recommended that timeframes should be
long enough to span two National Conference periods (18-24 months). This way enough
time is provided to present preliminary results and request additional observations.
Acknowledgements This project would not have been possible without the help of many people supplying observations
of pied shag colonies; I am very grateful to everybody who supplied observations. In addition I thank
the Ornithological Society of New Zealand who provide Beach Patrol Scheme data and who
facilitated requests for data from their membership. This project was funded by the Department of
Conservation’s Conservation Services Programme (www.doc.govt.nz/mcs ) project POP2011-07 Pied
shag population review. Thanks to WMIL staff, and especially Kelvin Floyd who developed the GIS
linked database for data collection, and produced the maps used in this report.
References cited Checklist Committee (OSNZ). 2010. Checklist of the birds of New Zealand, Norfolk and Maquarie
Islands, and the Ross Dependency, Antarctica (4th ed.). Wellington: Ornithological Society of New
Zealand and Te Papa Press.
Conservation Services Programme 2010. Protected species interactions with the snapper (Pagrus
auratus) demersal longline fishery in FMA 1. DOC Marine Conservation Services Series 6. Department
of Conservation, Wellington. 23 p.
Heather, B.D.; Robertson, H.A. 2005. The field guide to the birds of New Zealand. Viking, Auckland.
Marchant, S.; Higgins, P.J. (eds.) 1990. Handbook of Australian, New Zealand and Antarctic birds. Vol.
1, ratites to ducks. Oxford University Press, Melbourne.
Millener, P.R. 1972. The biology of the New Zealand pied cormorant Phalacrocorax varius varius
Gmelin (1789). Unpubl. MSc Thesis, University of Auckland, Auckland, New Zealand.
Miskelly, C.M.; Dowding, J.E.; Elliott, G.P.; Hitchmough, R.A.; Powlesland, R.G.; Robertson, H.A.;
Sagar, P.M.; Scofield, R.P.; Taylor, G.A. 2008. Conservation status of New Zealand birds,
2008.Notornis 55: 117-135.
Oliver, W.R.P. 1930. New Zealand Birds. A.H. & A.W. Reed limited, Auckland.

Powlesland, R.G.; Sharp, S.E.; Smith, A.N.H. 2008. Aspects of the breeding biology of the pied shag
(Phalacrocorax varius) at Makara Beach, Wellington, New Zealand. Notornis 55: 69-76.
Ramm, K. 2012 Conservation Services Programme Observer Report: 1 July 2009 to 30 June 2010.
Department of Conservation, Wellington. 103 p. Available for download at
http://www.doc.govt.nz/mcs
Robertson, C.J.R.; Hyvonen, P.; Fraser, M.J.; Pickard, C.R. 2007. Atlas of bird distribution in New
Zealand, 1999-2004. Ornithological Society of New Zealand, Wellington
Rowe, S.J. 2009: Conservation Services Programme observer report: 01 July 2004 to 30 June 2007.
DOC Marine Conservation Services Series 1. Department of Conservation, Wellington. 93 p. Available
for download at http://www.doc.govt.nz/mcs
Rowe, S. 2013: Level 1 risk assessment for incidental seabird mortality associated with fisheries in
New Zealand’s Exclusive Economic Zone. DOC Marine Conservation Services Series 10. Department of
Conservation, Wellington. 58 p.