
Contents
Business review#
2 Aboutus4 Vodafoneataglance6 Chairman’sstatement8 Mobiletelecommunications industry10 ChiefExecutive’sreview12 Strategyinaction28 Keymarketreview30 Sustainablebusiness32 People
Performance#
34 Operatingresults44 Guidance45 Principalriskfactors anduncertainties47 Financialposition andresources
Governance#
52 Boardofdirectors andGroupmanagement55 Corporategovernance62 Directors’remuneration
Financials74 Contents75 Directors’statement
ofresponsibility#
76 Auditreportoninternalcontrols
77 Criticalaccountingestimates79 Auditreportonthe consolidatedfinancial statements80 Consolidatedfinancial statements125 AuditreportontheCompany financialstatements126 Companyfinancial
statements
Additional information132 Shareholderinformation#
139 Historyanddevelopment#
140 Regulation#
143 Non-GAAPinformation#
146 Form20-Fcross referenceguide148 Forward-lookingstatements149 Definitionofterms151 Selectedfinancialdata
#Thesesectionsmakeupthedirectors’report.
The terms ‘Vodafone’, the ‘Group’, ‘we’, ‘our’ and ‘us’ refer to the Company and, as applicable, its subsidiaries and/or interests in joint ventures and associates.
Unless otherwise stated references: to ‘year’ or ‘2011’ mean the financial year ended 31 March 2011; to ‘2010’ or ‘previous year’ mean the financial year ended 31 March 2010; to the ‘third quarter’, ‘previous quarter’ or ‘Q3’ are to the quarter ended 31 December 2010; and to the ‘fourth quarter’ or ‘Q4’ are to the quarter ended 31 March 2011.
All amounts marked with an ‘(*)’ represent organic growth which presents performance on a comparable basis, both in terms of merger and acquisition activity and foreign exchange rates.
Definitions of terms used throughout the report can be found on page 149.
This report is dated 17 May 2011.
Highlights of the year■ Grouprevenueincreased3.2%to£45.9billionwithastrongresultfromemergingmarketsandsignsofrenewedgrowthinsomepartsofEurope.
■ Adjustedoperatingprofitrose3.1%to£11.8billion,supportedbyagoodperformancefromourUSassociate,VerizonWireless.
■ Freecashflowof£7.0billion,reflectingconsistentlevelsofcapitalexpenditureandstrongworkingcapitalperformance.
■ £14.2billionexpectedtoberaisedfromagreeddisposalsofinterestsinChinaMobile(China),SoftBank(Japan)and,afteryearend,SFR(France).
■ Totaldividendspershareof8.90pence,up7.1%inlinewithourdividendpersharegrowthtarget.£6.8billioncommittedtosharebuybacks.
Our new strategyInNovember2010weunveiledanupdatedstrategytomoveusfrom‘AStrongerVodafone’to‘AMoreValuableVodafone’.Thenewstrategyiscomposedoffourmainelements:
FocusonkeyareasofgrowthpotentialMobiledata,emergingmarkets,enterprise,totalcommunicationsandnewservices.
DelivervalueandefficiencyfromscaleUsingoursizeandscaletodrivecostefficienciesandoperationaleffectiveness.
Generateliquidityorfreecashflowfromnon-controlledinterestsReleasingliquidityandfreecashflowfromminoritystakesandinvestments.
ApplyrigorouscapitaldisciplinetoinvestmentdecisionsAllocatingcapitaltomaximiseshareholdervalue.
Find out more on pages 12 to 27
You can visit our online annual report at:
www.vodafone.com/investor
Vodafone Group PlcAnnualReport20111

Techn
ologies an
d resou
rces
Ser
vice
s
Distribution
Devices
AboutusA business intent on meeting all our customers’ communication needs
Technologies and resourcesThelatesttechnologiesofferingourbestcustomerexperience
Network infrastructureWehaveoneofthelargestmobilefootprintsintheworldwithmorethan224,000basestationsites.Duringtheyearournetworkscarriedaround850billionminutesofvoicetraffic(equivalentto208minutespermonth,percustomer)and161petabytesofdataequivalenttodownloadingover1,400threeminutevideoclipseverysecond.
Network performanceWecontinuetoinvestaround£6billionayeartomaintainleadershipofournetworks.TestsshowthatintheEuroperegion,VodacomandEgypt,Vodafoneofferspeakuserdatadownlinkspeedswhichareonaverage40%fasterthanourbestcompetitors.
Research and development (‘R&D’)Wedriveinnovationthroughnewtechnologiesandenhancementstoexistingcapabilities.ThisyearR&Dexpenditureamountedto£287million.
Customer support technologiesOurbillingandcustomerrelationshipmanagementsystemsarebeingenhancedtoenableourcustomerstomanageasingleaccount,withasinglebill,formultipledevicesorforseveralpeople.
Licences and spectrumLicencesandspectrumenableustodeliverfixedandmobilecommunicationsservicesincertainmarkets.Duringtheyearweacquiredadditionallicencesandspectruminseveralmarkets,includingIndiaforthirdgeneration(‘3G’)servicesandGermanyfortheprovisionoffourthgeneration(‘4G’)or‘LTE’services,toenhancethespeed,coverageandqualityofvoiceanddataservicesinthosemarkets.
Strategic agreementsWeworkcloselywithsomeoftheworld’sleadingcompaniestodeliverinnovativeproductsandservicestoourcustomers.OuragreementswithSamsung,Google®,Microsoft®,HTCandothershaveenabledustobefirsttomarketwithcutting-edgesmartdevices.WenowdistributetheAppleiPadintheUKandtoourenterprisecustomersinEurope.Forenterprisecustomers,inpartnershipwithMicrosoftweprovidetheMicrosoftOnlinesuitewhichprovideshostedemail,conferencingandcollaborationservices.InconjunctionwithRIM®andNokia,VodafonecustomersusingsmartphoneswillbeabletosecurelypayforapplicationsviatheirVodafonebill.
BrandAccordingtoBrandFinanceplc,theVodafonebrandhasrisentobecomethefifthmostvaluablebrandintheworld.Inthe2010calendaryearwerenewedourtitlepartnershipwiththeVodafoneMcLarenMercedesFormulaOneteam.Ithasbeenastrongyearforthesponsorshipwithincreasedtelevisionviewingfiguresandgreaterexposure.
PeopleWeemployedapproximately83,900peopleworldwideduringtheyear,comparedto85,000thepreviousyear.
Employees by activity (%)
Customer care and administration Operations Selling and distribution
CustomersInternationalcustomerbasewithdiverseneeds
Wehaveaninternationalcustomerbaseinbothdevelopedandemergingmarketswithover370millionmobilecustomersinmorethan30countries.Duringtheyearweaddedover40millioncustomers,mostlyinIndia.Weserve
India Vodacom Germany Egypt Italy UK Spain Other
Customers by markets (%)
Customer serviceWe are redesigning and improving our customer care, retail presence and online service to ensure that customers get the best data experience with Vodafone.
17
34
36
12109
655
17
49
2Vodafone Group PlcAnnualReport2011

Business Review
Techn
ologies an
d resou
rces
Ser
vice
sDistribution
Devices
Consumer contract
Consumer prepaid
Enterprise
abroadrangeofcustomersfromindividualsoneitherprepaidorcontractpriceplanstoenterprisecustomersrangingfromsmallandmediumsizedbusinessestolargerdomesticandmultinationalcompanies.Ourcustomers’needsareevolvingwithincreasingdemandformulti-productofferswhichcombinemobileandfixedbroadbandsolutionswithtraditionalvoiceandSMSservices.
Customers segments (%)
DevicesEnsuringthatourservicesareavailablethroughmultipleplatforms
Smartphones and tabletsThesehaveadvancedcapabilitiesincludingaccesstoemail,theinternetandmobileapplicationssuchasGoogleMaps™andFacebook.Smartphonesnowaccountfor19%ofthetotalnumberofphonesusedbyourcustomersinEurope.WenowsupplytheiPhonein19markets.
Vodafone branded handsetsWearemakingVodafonedesignedhandsetsavailabletomassmarketaudienceswhileofferingdifferentiatedexperiences.Duringtheyear14newhandsetswerereleasedunderourownbrandandweshipped5.8million.
Other connected devicesInadditiontohandsets,wesupplyarangeofinnovativeconnectedsmartdevices.DuringtheyearwelaunchedourfirsteverUSBstickbasedon4G/LTEtechnologyandVodafoneWebBoxwhichenablescustomerstoconnecttotheinternetusingexistingtelevisionsetsbysimplyplugginginakeyboardwithanembeddedmobileSIM.
4G/LTE mobile broadband USB stickThe Samsung GT-B3740, is our first ever 4G/LTE network device which enables customers to experience super-fast mobile broadband.
ServicesServicestomeetallourcustomers’needs
VoiceWeareoneofthelargestcarriersofmobilevoicetrafficintheworldprovidingdomestic,internationalandroamingvoiceservicestomorethan370millioncustomers.
MessagingOurnetworkssentandreceivedover292billiontext,picture,musicandvideomessagesthisyear.
DataMorethan75millioncustomersbuyourmobiledataserviceswhichallowaccesstotheinternet,emailandapplicationsontheirphones,tablets,laptopsandnetbooks.
Fixed lineOversixmillioncustomersuseourfixedbroadbandservicesin13marketstomeettheirtotalcommunicationsneeds.Inaddition,throughGateway,weprovidewholesalecarrierservicestomorethan40Africancountries.
Other service revenueThisincludesbusinessmanagedservices,suchassecureremotenetworkaccess,andrevenuefrommobilevirtualnetworkoperatorsgeneratedfromsellingaccesstoournetworkatthewholesalelevel.
Service revenue by type (%)
Voice Messaging Data Fixed Line Other
DistributionAbroadrangeofchannelsthroughwhichcustomerscanaccessourservicesandproducts
Indirect channelsThelevelofindirectdistributionvariesbetweenmarketsandmayincludeusingthirdpartyserviceproviders,independentdealers,distributorsandretailers.
OnlineTheinternethasalsobecomeanincreasinglypowerfulandcost-effectivedistributionchannel.51%ofourEuropeancontractcustomersreceivetheirbillsonline.
12
79
9
12
84
6412
Direct channelsWedirectlyownandmanageabout2,200storesaroundtheworldandwealsohavearound10,300Vodafone-brandedstoresrunthroughfranchiseandexclusivedealerarrangements.Inmostofourlocalmarketssalesforcesalsoselldirecttoenterprisecustomers.
Vodafone Group PlcAnnualReport20113
Business review

Revenue (£bn)
VodafoneataglanceWe are one of the world’s largest mobile communications companies by revenue
Vodafone M-PesaOver 20 million people, mainly in emerging markets, use this service to send and receive money using their mobile phones. More on page 20.
Capital expenditure (£bn)
Adjusted operating profit (£bn)
Operating free cash flow (£bn)
Base stationWe are leaders in data networks with over 66,000 3G sites delivering high speed mobile broadband capability.
Europe Africa, Middle East and
Asia Pacific Non-Controlled Interests
and Common Functions
0.6
4.8
0.3 (0.1)
13.3
1.3
2.2
2.4
32.0
5.7 3.7
7.5
Partner marketsPartnermarketsextendourreachoutsideourequityinvestmentsbyenteringintoapartnershipagreementwithalocalmobileoperator,enablingarangeofourglobalproductsandservicestobemarketedinthatoperator’sterritory.Underthetermsofthesepartnermarketagreementswecooperatewithourpartnersinthedevelopmentandmarketingofcertainservicesandproducts.ThesepartnershipscreateadditionalrevenuethroughfeespaidbythepartnersforaccesstoVodafoneGroupproducts,servicesand
Over40Partner markets
ourbrandportfoliowithouttheneedforequityinvestment.
AspartoftheagreementforthesaleofVodafone’sinterestinSFRtoVivendi,wehaveenteredintoanagreementwithSFRwhichwillcontinueourcommercialcooperationandwillallowustocontinuetodelivercross-borderservicestocustomersacrossthemajormarketsofwesternEurope.
4Vodafone Group PlcAnnualReport2011

OurmobilesubsidiariesandjointventureinEuropeoperateunderthebrandname‘Vodafone’andourmajorfixedlinebusinessesoperateas‘Vodafone’orinthecaseofItalyas‘TeleTu’orinSpainas‘Tele2’.
OursubsidiariesandjointventuresinAMAPoperateunderthe‘Vodafone’brand,orinthecaseofVodacomanditsmobilesubsidiaries,as‘Vodacom’and‘Gateway’brands.InIndiaweoperateas‘VodafoneEssar’.OurassociateinKenyaoperatesas‘Safaricom’.
Non-ControlledInterestsarebusinessesinwhichwehaveanequityinterestbutdonothavemanagementcontrol.Weaimtomaximisethevalueoftheseinterestseitherbygeneratingliquidityorincreasingfreecashflow.DuringtheyearwesoldourinterestsinChinaMobileandSoftBankandinApril2011weannouncedanagreementtosellour44%interestinSFR.
CommonFunctionsprimarilyrepresenttheresultsofthepartnermarketsandthenetresultofunallocatedcentralGroupcosts.
Revenue(1)
Adjustedoperatingprofit(1)
Capitalexpenditure(1)
Operatingfreecashflow(1)
Mobilecustomersbymarket(2)
Non-ControlledInterestsandCommonFunctions
Millions
Germany 36.7Italy 23.4UK 19.1Spain 17.3Turkey 16.8Romania 9.2Portugal 6.1Netherlands 5.0Greece 3.9CzechRepublic 3.2Hungary 2.7Ireland 2.2Albania 1.6Malta 0.2Total 147.4
Millions
India 134.6Vodacom 43.5Egypt 31.8Australia 3.6Ghana 3.0NewZealand 2.5Qatar 0.8Fiji 0.3Total 220.1
Vodacom consists of:SouthAfrica 26.5Tanzania 8.9DemocraticRepublicofCongo 4.2Mozambique 3.1Lesotho 0.8
Africa,MiddleEastandAsiaPacific(‘AMAP’)
Europe
Notes:(1) The sum of these amounts do not equal Group totals due
to Non-Controlled Interests and Common Functions and intercompany eliminations.
(2) Controlled and jointly controlled businesses. Excludes 3.4 million customers representing the Group’s share of customers in our Polish joint venture Polkomtel which is in our Non-Controlled Interests and Common Functions segment.
2.5%decrease
£32.0bn(2010:£32.8bn)
20.0%growth
£13.3bn(2010:£11.1bn)
55.5%growth
£1.3bn(2010:£0.8bn)
6.2%growth
£2.2bn(2010:£2.1bn)
53.7%growth
£2.4bn(2010:£1.6bn)
9.8%decrease
£5.7bn(2010:£6.4bn)
stable
£3.7bn(2010:£3.7bn)
9.2%decrease
£7.5bn(2010:£8.2bn)
Business Country Ownership at 31 March 2011
VerizonWireless US 45.0%
SFR France 44.0%(1)
Polkomtel Poland 24.4%
BhartiAirtel India 4.4%(2)
ChinaMobile China Sold(3)
SoftBank Japan Sold(4)
Notes:(1) Sale announced in April 2011. (2) Indirect interest.(3) We previously held a 3.2% interest in China Mobile Limited. (4) Our interests previously included loan notes and receivables issued by SoftBank.
£7.4bnAgreed proceeds from the sale of Non-Controlled Interests
In addition to the above, our associate Safaricom had 6.9 million mobile customers based on our percentage ownership.
Vodafone Group PlcAnnualReport20115
Business review

Dividend per share (pence)
7.77 8.31 8.90
Improving operational performanceAfter the macroeconomic shocks of the previous financial year and the business challenges that accompanied them, our overall operating environment did not deteriorate further during the year. Most markets saw economic growth recover, although southern Europe remained weaker.
Within this context, the Group has performed well. We achieved organic service revenue growth of 2.1%(*), a significant change in momentum from last year’s 1.6%(*) decline.
Our adjusted operating profit was up 3.1% at £11.8 billion, reflecting a stable performance in our controlled operations and strong growth in the contribution from Verizon Wireless, our US associate.
Data has been the key driver of growth over the last year. Our customers around the world are increasingly drawn to the experience of the mobile internet and related services. Organic data revenue growth was 26.4%(*) achieved through combining increasingly disciplined pricing structures with a broad range of devices and a network with a deserved reputation for market-leading speed and reliability.
We have continued to make substantial investments in our infrastructure to maintain our advantage over our peers, with a total capital expenditure outlay of £6.2 billion during the year. The Group, however, remains highly cash generative, with free cash flow for the year totalling £7.0 billion.
Delivering value from non-controlled interestsThe Board remains committed to achieving full value from the non-controlled interests within the Group. This has been an ongoing process, starting with the disposals of our interests in Belgacom and Swisscom five years ago, but inevitably pausing during the financial crisis when asset prices were depressed. During the year, we successfully disposed of our holdings in China Mobile Limited and SoftBank, generating proceeds of £7.4 billion. Just after the year end, we were pleased to announce the sale of our 44% interest in SFR, the number two mobile operator in France.
Increasing shareholder returnsThis time last year the Board put in place a target to grow total dividends per share by at least 7% per annum over the following three years, and I am pleased to announce a 7.1% increase in the final dividend for the March 2011 year, giving a total payout for the year of 8.90 pence.
In addition, from the proceeds from our portfolio rationalisation, we have committed £6.8 billion to share buyback programmes. Combined with the dividend, this takes total committed shareholder returns during the year to £15.7 billion, or 17% of our market capitalisation at 31 March 2011. Including share price appreciation, our total
shareholder return for the year was 23%, compared to 8% for the FTSE 100.
Tax policyDuring the year, the Group has been involved in two high profile tax cases in the UK and India. Our tax policy is straightforward: we pay taxes that are due in the countries where we make profits or record capital gains in line with the prevailing legislation of those jurisdictions.
Our peopleI am proud to say every year that our people all around the world are absolutely committed to serving our customers and are often the difference between Vodafone and our competitors. However, this year I must highlight the extraordinary commitment and dedication shown to maintaining services to customers in two of our markets in extremis.
In Egypt, our employees risked their personal safety in a very volatile environment to keep the network up and running at a time when mobile communication was more important than ever, keeping the voice network outage to less than 24 hours.
In New Zealand, our people responded magnificently to the earthquake that devastated Christchurch in February 2011. They ensured network coverage was maintained 24 hours a day despite major power outages and structural damage, and managed unprecedented levels of demand as the mobile phone became the primary means of communication for the people of Christchurch and the rescue services. The team worked around the clock to ensure the safety of our own staff and to provide temporary stores and subsidised packages to support customers’ communications needs.
The Vodafone FoundationWe have continued to fund the good work of the Vodafone Foundation. Through the Vodafone Foundation and our network of national affiliate foundations we support communities and societies in the countries in which we operate. In this financial year we invested a total of £50 million in foundation programmes and social causes.
Our World of Difference programme is now in 20 countries and has so far enabled 1,500 people to take paid time to work for a charitable purpose of their choice in their own community or in a developing country.
Our Mobiles for Good programme, combining our technology with our giving, saw the launch of Instant Network, a partnership with Telecoms Sans Frontieres which enables a network to be deployed from three suitcases, covering 10 sq km for usage of up to 12,000 people. Field trials are currently underway.
“I leave Vodafone with huge optimism for its future”
2009 2010 2011
Chairman’s statement6 Vodafone Group Plc Annual Report 2011

5745
51635397
151
5643
165
5593
159
5958
177
6010
179
139
152
120
160
140
200
180
4000
5500
4750
7000
6250
1 Apr 10 1 Jun 10 1 Aug 10 1 Oct 10 1 Dec 10 1 Apr 111 Feb 11
Vodafone (share price in pence) FTSE 100 index
Vodafone share price vs FTSE 100
+23%Vodafone total shareholder return(2011 financial year)
+8%FTSE 100 total shareholder return(2011 financial year)
Across the Group we continue to promote text giving, enabling our customers to give money simply and free of charge to support charitable appeals following disasters. Using this platform we raised over NZ$1.3 million for the Red Cross to support the people of Christchurch.
The BoardDuring the year the Board appointed Renee James as a non‑executive director. Renee is Senior Vice President and General Manager of the Software and Services Group for Intel Corporation. She joined the Board in January 2011 and it is clear that her industry knowledge and expertise will make a strong contribution to the Group through another period of rapid technological change.
The Board welcomed the publication in February of the Davies Review on Women on Boards and, in line with its recommendations, it is our aspiration to have a minimum of 25% female representation on the Board by 2015. The Financial Reporting Council is currently consulting on changes to the UK Corporate Governance Code including a recommendation that companies adopt a boardroom diversity policy; we expect to comply with any such recommendation. The Board recognises the importance of gender balance throughout the Group and continues to support our CEO, Vittorio Colao, in his efforts to build a diverse organisation. Further information can be found in the Corporate Governance section of this report.
After five years as Chairman I am retiring from the Board at the AGM in July. It has been a privilege to chair a Board of such diverse and rich experience, and to help steer the Group through the challenges of a dynamic industry and an uncertain economic environment.
As a Board, our goal has always been to make the right decisions based on the long‑term opportunities for the business. As a result, we now have an established presence in a number of emerging markets that offer attractive potential for sustained growth; and our commitment to maintaining investment throughout the economic cycle means we have
mobile networks that lead the industry for speed and reliability. This will be crucial as customers’ expectations grow in line with their data usage.
Furthermore, we have continually assessed the risks and opportunities of having capital deployed in some of our non‑controlled interests. This is particularly true of Verizon Wireless, from which we have not received a dividend (other than tax related dividend receipts) for six years. It would arguably have been easier to sell our stake along the way, but our decision to remain invested has been strongly vindicated by its exceptional operating performance and strong cash generation, which have led to a significant increase in the value of the asset.
Our approach has led to strong returns to shareholders over the last five years. Total shareholder return since July 2006 has been 85%, compared to 22% for the FTSE 100.
I am delighted to welcome Gerard Kleisterlee as Vodafone’s new Chairman. As CEO of Philips, Gerard spent ten successful years at the helm of an international consumer technology business, and the Group is certain to make continued good progress under his stewardship. I wish him, and the Group, all the best for the future.
Sir John BondChairman
Vodafone Group Plc Annual Report 2011 7
Business reviewBusiness review
Where the industry is now
Mobile telecommunications industryAnindustrywith5.6billioncustomerswithgrowthdrivenbyincreasingglobaldemandfordataservicesandrisingmobilepenetrationinemergingmarkets
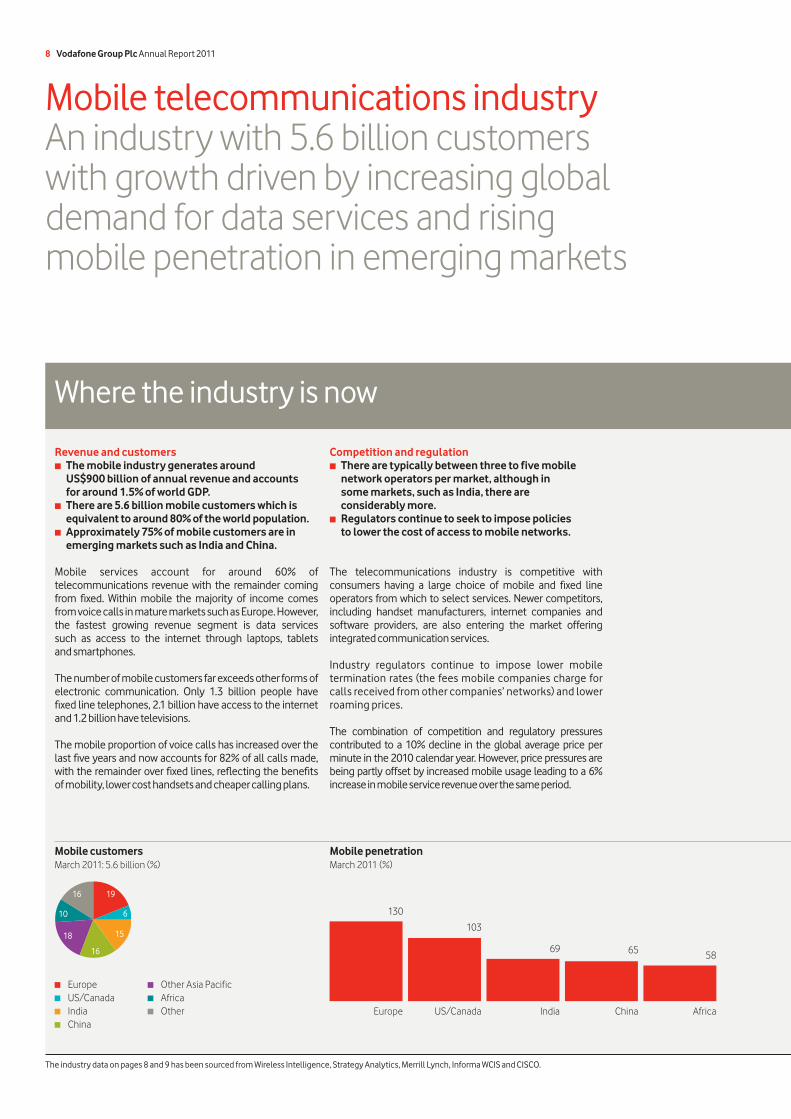
Mobile penetrationMarch2011(%)
Mobile customers March2011:5.6billion(%)
Europe US/Canada India China Africa
Revenue and customers ■ The mobile industry generates around
US$900 billion of annual revenue and accounts for around 1.5% of world GDP.
■ There are 5.6 billion mobile customers which is equivalent to around 80% of the world population.
■ Approximately 75% of mobile customers are in emerging markets such as India and China.
Mobile services account for around 60% of telecommunications revenue with the remainder coming from fixed. Within mobile the majority of income comes from voice calls in mature markets such as Europe. However, the fastest growing revenue segment is data services such as access to the internet through laptops, tablets and smartphones.
The number of mobile customers far exceeds other forms of electronic communication. Only 1.3 billion people have fixed line telephones, 2.1 billion have access to the internet and 1.2 billion have televisions.
The mobile proportion of voice calls has increased over the last five years and now accounts for 82% of all calls made, with the remainder over fixed lines, reflecting the benefits of mobility, lower cost handsets and cheaper calling plans.
Competition and regulation ■ There are typically between three to five mobile
network operators per market, although in some markets, such as India, there are considerably more.
■ Regulators continue to seek to impose policies to lower the cost of access to mobile networks.
The telecommunications industry is competitive with consumers having a large choice of mobile and fixed line operators from which to select services. Newer competitors, including handset manufacturers, internet companies and software providers, are also entering the market offering integrated communication services.
Industry regulators continue to impose lower mobile termination rates (the fees mobile companies charge for calls received from other companies’ networks) and lower roaming prices.
The combination of competition and regulatory pressures contributed to a 10% decline in the global average price per minute in the 2010 calendar year. However, price pressures are being partly offset by increased mobile usage leading to a 6% increase in mobile service revenue over the same period.
Europe US/Canada India China
OtherAsiaPacific Africa Other
130
103
The industry data on pages 8 and 9 has been sourced from Wireless Intelligence, Strategy Analytics, Merrill Lynch, Informa WCIS and CISCO.
586569
19
6
16
10
15
16
18
8 Vodafone Group Plc Annual Report 2011

A multiplicity of connected
devices
Where the industry is going
Mobile data demand is being accelerated by devices and network improvements
Mobile penetrationMarch2011(%)
Emerging market customer growth will be driven by rising mobile penetration and GDP growth Marketcustomersgrowth
(2010–2014estimatedcumulativeannualgrowthrate)(%)
A growing industryDatatraffichasmorethandoubledyear-on-yearduetousageofsmartconnecteddevicesandsignificantprogressinmobilenetworktechnology.
Mobile data and networks ■ Mobile data traffic is driving revenue growth. ■ Network speeds are increasing dramatically
because of improving technology. ■ The pace of product innovation remains high.
In 2006 data accounted for 3% of industry revenue, in 2010 it reached 13% and by 2014 it is expected to be 21%. Demand is being driven by the widening range of smart connected devices, such as mobile broadband sticks, smartphones and tablets, greater network speeds and an increased range of applications with greater functionality. Smartphone sales grew by 66% in the 2010 calendar year, compared to a 16% increase in the 2009 calendar year, and are expected to continue to grow due to lower entry prices, device innovation and attractive applications.
Today’s 3G networks offer typically achieved data download speeds of up to 4 Mbps which is around 100 times faster than that delivered by 2G networks ten years ago. The industry has recently begun to deploy 4G/LTE networks which will provide typically achieved rates of up to 12 Mbps, depending on the capability of the devices and the network.
Device innovation is a key feature of our industry. Recent developments include femtocells which enhance customers’ indoor 3G signals via a fixed line broadband connection and mobile Wi-Fi devices which allow customers to share their mobile broadband connection with others.
Emerging markets ■ Mobile phone usage continues to grow rapidly. ■ Data represents a significant growth opportunity.
The number of customers using mobile services in emerging markets such as India and Africa has grown rapidly over the last ten years, increasing by over 17 times, compared to nearly 130% in more mature markets such as Europe. The key driver of growth has been a fundamental need for communication services against a background of often low quality alternative fixed line infrastructure and strong economic growth.
Most of the future growth in mobile customers is expected to continue to be in emerging markets where mobile penetration is only around 70% compared to approximately 130% in mature markets such as Europe, supported by the expectation of continued strong economic growth.
Data also represents a substantial growth opportunity in emerging markets both in terms of mobile broadband and mobile internet services. It is being driven partly by the lack of fixed line broadband infrastructure but also by locally relevant content and services in local languages, and software innovations that give customers a high-quality mobile internet experience on affordable handsets.
2006 2010
Smartphone share of industry handset shipments (%) 8 21
Typically achieved data download speeds (Mbps) 2.2 4
6%
The industry data on pages 8 and 9 has been sourced from Wireless Intelligence, Strategy Analytics, Merrill Lynch, Informa WCIS and CISCO.
7%
India
18%
SouthAfrica Egypt
Vodafone Group Plc Annual Report 2011 9
Business reviewBusiness review

Chief Executive’s review
Financial review of the yearWe have performed well this year, combining a better operational performance with good strategic progress. Organic service revenue growth improved during the year, with a strong result from emerging markets and signs of renewed growth in some parts of Europe.
Customers have adopted data services in increasing numbers, as smartphones proliferate and the tablet market begins to take off. Our network investment is becoming a key differentiator, as we are leading the migration to smartphones in most of our European operations. Through this and our continued stronger commercial focus, we are growing our market share again in most of our markets.
However, markets remain competitive and the economic environment, particularly across southern Europe, is challenging. We continue to keep a tight rein on costs and working capital, allowing us to maintain our levels of investment while again delivering a strong free cash flow performance.
Group revenue for the year was up 3.2% to £45.9 billion, with Group service revenue up 2.1%(*) on an organic basis and up 2.5%(*) in Q4. Group EBITDA margin fell 1.1 percentage points, reflecting continuing weakness across southern Europe, higher growth in lower margin markets, and the increased investment in migrating customers to higher value smartphones. As a result, EBITDA fell 0.4% year-on-year.
Group adjusted operating profit rose 3.1% to £11.8 billion, at the top end of our guidance range after allowing for currency exchange rate movements and despite the additional costs incurred by Verizon Wireless’s iPhone launch. The main drivers were good growth in the Africa, Middle East and Asia Pacific region (‘AMAP’) and a strong performance from Verizon Wireless.
We recorded impairment charges of £6.1 billion relating to our businesses in Spain, Greece, Portugal, Italy and Ireland which were primarily driven by higher discount rates given sharply increased interest rates. The impairment in Spain represented approximately half of the total.
Free cash flow was £7.0 billion, at the top end of our medium- term guidance as a result of our continued financial discipline and a strong working capital performance. Capital expenditure was £6.2 billion, broadly flat on last year and in line with our target, as we focused on widening our data coverage and improving network performance.
Adjusted earnings per share was 16.75 pence, up 4.0% on last year, reflecting higher profitability and lower shares in issue as a result of the ongoing £2.8 billion buyback programme. The Board is recommending a final dividend per share of 6.05 pence, to give total dividends per share for the year of 8.90 pence, up 7.1% year-on-year.
EuropeOrganic service revenue in Europe was down 0.4%(*) during the year and down 0.8%(*) in Q4. This represents a good recovery on last year (-3.8%)(*) and is the result of two different trends: the more stable economies of northern Europe (Germany, UK, Netherlands) were up 2.7%(*), while the rest of Europe was down 2.9%(*) as a result of the ongoing macroeconomic challenges. Data revenue growth continued to be strong, but was offset by continued voice price declines and cuts to mobile termination rates (‘MTRs’).
Organic EBITDA for Europe was down 3.7%(*) and the EBITDA margin fell 1.7 percentage points as a result of the decline in revenue, ongoing competitive activity and higher commercial costs as we accelerated smartphone adoption.
AMAPOrganic service revenue growth in AMAP was 9.5%(*), accelerating through the year to a level of 11.8%(*) in Q4. Our two major businesses, India and Vodacom, reported growth of 16.2%(*) and 5.8%(*) respectively. Our performance in India has been driven by increasing voice penetration and a more stable pricing environment. In South Africa, Vodacom continues to be highly successful in promoting data services.
Organic EBITDA was up 7.5%(*) with EBITDA margin falling 0.6 percentage points(*). The two main factors behind the margin decline were the adverse impact from higher recurring licence fee costs in India and the change in regional mix from the strong growth in India.
Verizon WirelessOur US associate, Verizon Wireless, has continued to perform strongly. Organic service revenue was up 5.8%(*) and EBITDA was up 6.7%(*), with good growth in customers and strong data take-up. In Q4, Verizon Wireless launched a CDMA version of the iPhone, ending the exclusivity of its main competitor. Our share of profits from Verizon Wireless amounted to £4.6 billion, up 8.5%(*).
Delivering a more valuable VodafoneIn November 2010 we announced an updated strategy, designed to build on the progress made during my first two years as CEO. There are four main elements to the strategy to build a more valuable Vodafone:
■ Focus on key areas of growth potential; ■ Deliver value and efficiency from scale; ■ Generate liquidity or free cash flow from non-controlled
interests; and ■ Apply rigorous capital discipline to investment decisions.
I am pleased to say that we are making good progress in each area.
“We are gaining or holding market share in most of our major markets and are leading our competitors in the drive to migrate customers to smartphones and data packages.”
10 Vodafone Group Plc Annual Report 2011
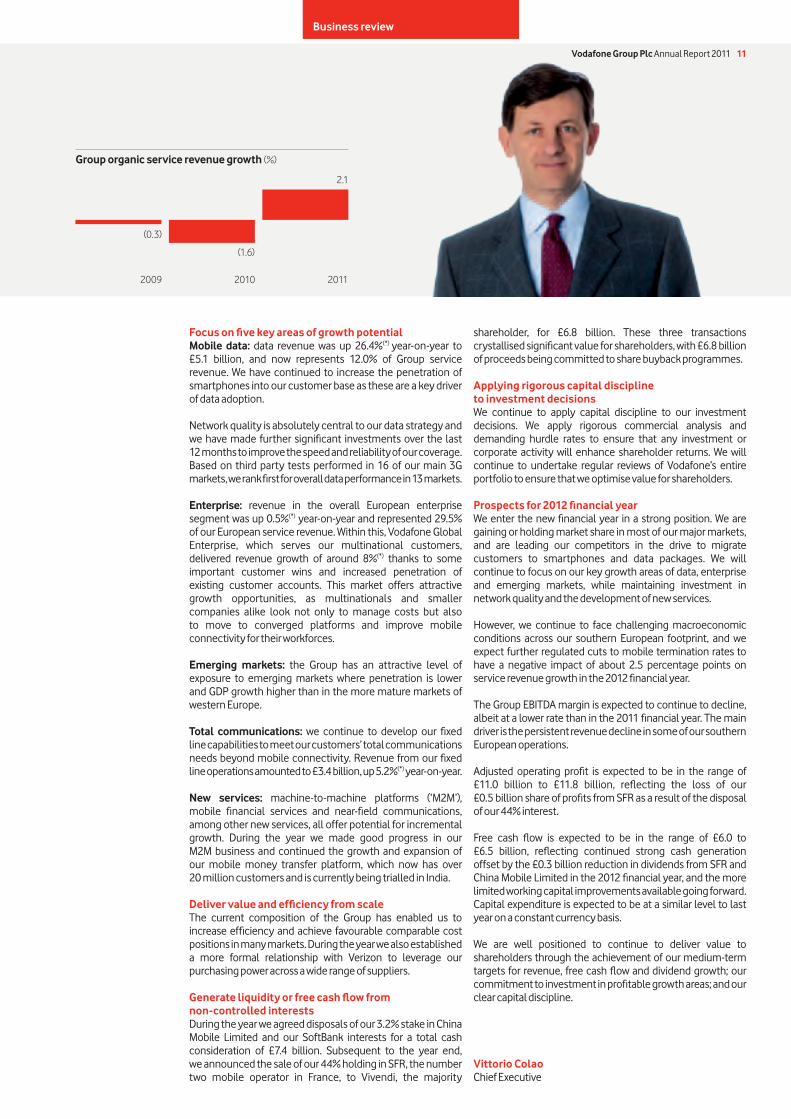
Group organic service revenue growth (%)
2009 2010 2011
(0.3)
(1.6)
2.1
Focus on five key areas of growth potentialMobile data: data revenue was up 26.4%(*) year-on-year to £5.1 billion, and now represents 12.0% of Group service revenue. We have continued to increase the penetration of smartphones into our customer base as these are a key driver of data adoption.
Network quality is absolutely central to our data strategy and we have made further significant investments over the last 12 months to improve the speed and reliability of our coverage. Based on third party tests performed in 16 of our main 3G markets, we rank first for overall data performance in 13 markets.
Enterprise: revenue in the overall European enterprise segment was up 0.5%(*) year-on-year and represented 29.5% of our European service revenue. Within this, Vodafone Global Enterprise, which serves our multinational customers, delivered revenue growth of around 8%(*) thanks to some important customer wins and increased penetration of existing customer accounts. This market offers attractive growth opportunities, as multinationals and smaller companies alike look not only to manage costs but also to move to converged platforms and improve mobile connectivity for their workforces.
Emerging markets: the Group has an attractive level of exposure to emerging markets where penetration is lower and GDP growth higher than in the more mature markets of western Europe.
Total communications: we continue to develop our fixed line capabilities to meet our customers’ total communications needs beyond mobile connectivity. Revenue from our fixed line operations amounted to £3.4 billion, up 5.2%(*) year-on-year.
New services: machine-to-machine platforms (‘M2M’), mobile financial services and near-field communications, among other new services, all offer potential for incremental growth. During the year we made good progress in our M2M business and continued the growth and expansion of our mobile money transfer platform, which now has over 20 million customers and is currently being trialled in India.
Deliver value and efficiency from scaleThe current composition of the Group has enabled us to increase efficiency and achieve favourable comparable cost positions in many markets. During the year we also established a more formal relationship with Verizon to leverage our purchasing power across a wide range of suppliers.
Generate liquidity or free cash flow from non‑controlled interestsDuring the year we agreed disposals of our 3.2% stake in China Mobile Limited and our SoftBank interests for a total cash consideration of £7.4 billion. Subsequent to the year end, we announced the sale of our 44% holding in SFR, the number two mobile operator in France, to Vivendi, the majority
shareholder, for £6.8 billion. These three transactions crystallised significant value for shareholders, with £6.8 billion of proceeds being committed to share buyback programmes.
Applying rigorous capital discipline to investment decisionsWe continue to apply capital discipline to our investment decisions. We apply rigorous commercial analysis and demanding hurdle rates to ensure that any investment or corporate activity will enhance shareholder returns. We will continue to undertake regular reviews of Vodafone’s entire portfolio to ensure that we optimise value for shareholders.
Prospects for 2012 financial yearWe enter the new financial year in a strong position. We are gaining or holding market share in most of our major markets, and are leading our competitors in the drive to migrate customers to smartphones and data packages. We will continue to focus on our key growth areas of data, enterprise and emerging markets, while maintaining investment in network quality and the development of new services.
However, we continue to face challenging macroeconomic conditions across our southern European footprint, and we expect further regulated cuts to mobile termination rates to have a negative impact of about 2.5 percentage points on service revenue growth in the 2012 financial year.
The Group EBITDA margin is expected to continue to decline, albeit at a lower rate than in the 2011 financial year. The main driver is the persistent revenue decline in some of our southern European operations.
Adjusted operating profit is expected to be in the range of £11.0 billion to £11.8 billion, reflecting the loss of our £0.5 billion share of profits from SFR as a result of the disposal of our 44% interest. Free cash flow is expected to be in the range of £6.0 to £6.5 billion, reflecting continued strong cash generation offset by the £0.3 billion reduction in dividends from SFR and China Mobile Limited in the 2012 financial year, and the more limited working capital improvements available going forward. Capital expenditure is expected to be at a similar level to last year on a constant currency basis.
We are well positioned to continue to deliver value to shareholders through the achievement of our medium-term targets for revenue, free cash flow and dividend growth; our commitment to investment in profitable growth areas; and our clear capital discipline.
Vittorio ColaoChief Executive
Vodafone Group Plc Annual Report 2011 11
Business reviewBusiness review

Focus on key areas of growth potential
More on pages 14 to 24
Deliver value and efficiency from scale
More on page 25
Generate liquidity or free cash flow from non‑controlled interests
More on page 26
Apply rigorous capital discipline to investment decisions
More on page 27
We aim to deliver organic service revenue growth of 1-4% per year until the year ending 31 March 2014. We see five key areas of growth potential:
■ mobile data: accelerate mobile data growth opportunity; ■ emerging markets: increase mobile penetration and data adoption; ■ enterprise: selectively expand growth segments; ■ total communications: continue to develop the adoption
of converged fixed and mobile services; and ■ new services: expand into new growth areas including
machine-to-machine and financial services.
We will continue to drive benefit from the Group’s scale advantage and maintain our focus on cost. We have favourable cost positions in many markets and intend to generate further significant savings from technology standardisation, off-shoring, outsourcing and platform sharing.
Our strategic goals
“Our new strategy is delivering a more valuable Vodafone”
We will seek to maximise the value of non-controlled interests either through generating liquidity or increasing free cash flow in order to fund profitable investment and enhance shareholder returns.
We will continue to apply capital discipline to our investment decisions through rigorous commercial analysis and demanding investment criteria to ensure any investment in existing businesses or acquisitions will enhance value for shareholders.
We aim to maintain our low single A long-term credit rating.
Notes:(1) See“Principalriskfactorsanduncertainties”onpages45to46formoredetailsontherisks
facingourbusinessand“Corporategovernance–RiskmanagementandRiskmitigation”onpage59fordetailonhowwemanageandmitigaterisk.
Strategy in action
(2) Organicgrowthwhichpresentsperformanceonacomparablebasis,bothintermsofmergerandacquisitionactivityandforeignexchangerates.
(3) India,Vodacom,Egypt,Turkey,Ghana,Qatar,andFiji.
12 Vodafone Group Plc Annual Report 2011

Business driversThe following are some of our principal business drivers which may influence our performance(1)
How we measure our progress
Organic European operating expenses (£bn)
Return to shareholders (£bn) Dividendspaid Sharebuybacks
A number of factors may impact the prices we charge and therefore the revenue we receive including:
■ competition; ■ regulatory decisions and legislation on
mobile termination rates, international roaming charges and the availability and cost of spectrum; and
■ changes in macroeconomic conditions.
OurbusinessinIndiahasgrownfrom28millioncustomersatthetimeofacquisitioninMay2007tobecomeourlargestmarketwithover134millioncustomersat31March2011.
The net savings from our cost efficiency programmes may be impacted by inflationary pressures and the volume of traffic on our networks which can affect our operating costs. Net savings will be used either to invest in commercial activities or respond to competitor activity or retained for margin enhancement.
In those businesses in which we have a non-controlling interest, matters such as the timing and amount of cash distribution may require the consent of our partners which can influence the level of free cash flow we receive from that business .
The returns we make on investments may be impacted by competitor activity, regulatory decisions and macroeconomic conditions that affect our commercial position, financial performance and the market environment in which we operate.
The cost of financing investment and hence the return on investment may be influenced by changes in credit markets or our credit ratings.
Notes:(4) ExcludesIndia,GhanaandQatarasthesewerenotownedforthefullfinancialyear.(5) Informationnotavailable.(6) ExcludestaxrelateddividendreceiptsfromVerizonWireless.
£15.7bnTotal returns to shareholders over the last three years.
Key revenue performance indicators(2)
2009 2010 2011
Service revenue growth (0.3)% (1.6)% 2.1%
Data revenue growth 25.9% 19.3% 26.4%
Emerging markets service revenue growth(3) 6.4%(4) 7.9% 11.8%
Europe enterprise service revenue growth –(5) (4.8)% 0.5%
Fixed line revenue growth 2.1% 7.9% 5.2%
2009 2010 2011
2009 2010 2011
2009 2010 2011
Dividends and sale proceeds from non‑controlled interests (£bn) Dividendincomefromnon-controlledinterests(6)
Cashreceivedfromthesaleofnon-controlledinterests(7)
4.13.9
0.5
3.7
4.5
(7) Afurther£1.5billionisexpectedbereceivedinApril2012fromthesaleoftheGroup’sinterestsinSoftBank.
1.0
2.1
4.0 4.1
5.9
0.50.4
Vodafone Group Plc Annual Report 2011 13
Business review

Mobile data: strategyOurdatarevenuewasup26.4%(*)year-on-yearto£5.1billionandnowrepresents12.0%ofGroupservicerevenue.Networkqualityiscentraltoourdatastrategyandbasedonthirdpartytestsperformedin16ofourmain3Gmarkets,werankfirstforoveralldataperformancein13markets.
14 Vodafone Group Plc Annual Report 2011
Business Review
Focus on key areas of growth potential: Mobiledata–strategy
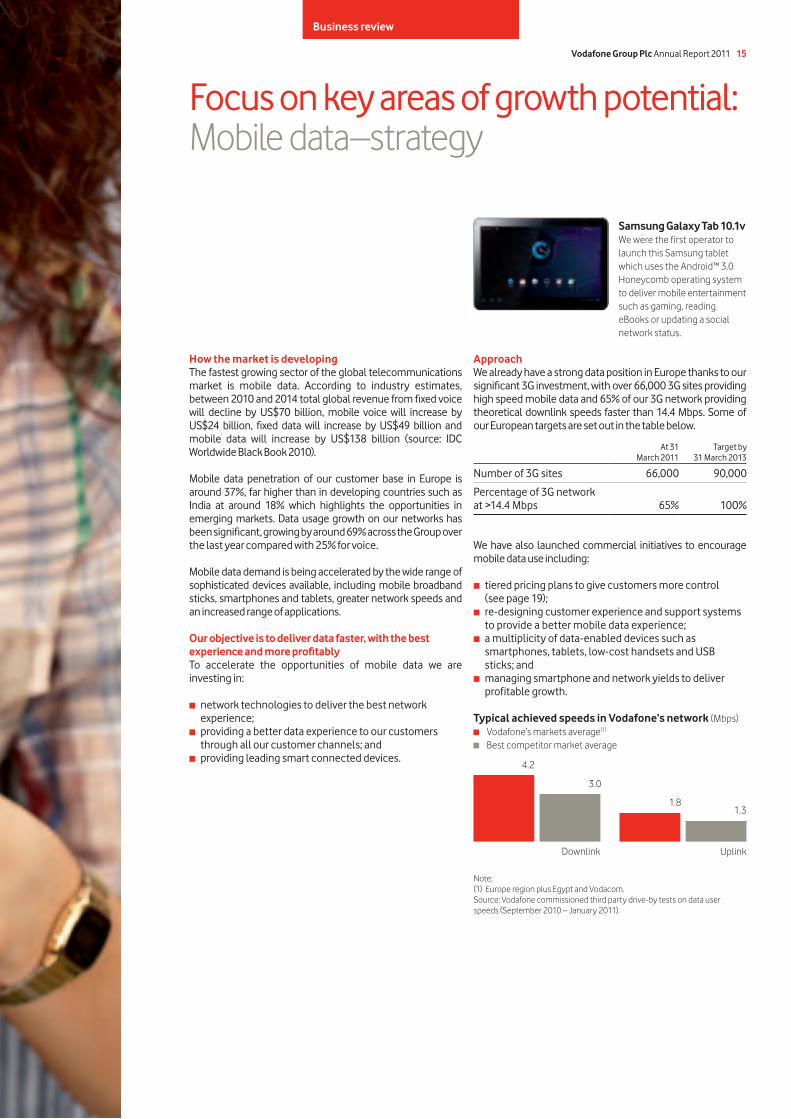
Samsung Galaxy Tab 10.1vWewerethefirstoperatortolaunchthisSamsungtabletwhichusestheAndroid™3.0Honeycomboperatingsystemtodelivermobileentertainmentsuchasgaming,readingeBooksorupdatingasocialnetworkstatus.
How the market is developingThe fastest growing sector of the global telecommunications market is mobile data. According to industry estimates, between 2010 and 2014 total global revenue from fixed voice will decline by US$70 billion, mobile voice will increase by US$24 billion, fixed data will increase by US$49 billion and mobile data will increase by US$138 billion (source: IDC Worldwide Black Book 2010).
Mobile data penetration of our customer base in Europe is around 37%, far higher than in developing countries such as India at around 18% which highlights the opportunities in emerging markets. Data usage growth on our networks has been significant, growing by around 69% across the Group over the last year compared with 25% for voice.
Mobile data demand is being accelerated by the wide range of sophisticated devices available, including mobile broadband sticks, smartphones and tablets, greater network speeds and an increased range of applications.
Our objective is to deliver data faster, with the best experience and more profitablyTo accelerate the opportunities of mobile data we are investing in:
■ network technologies to deliver the best network experience;
■ providing a better data experience to our customers through all our customer channels; and
■ providing leading smart connected devices.
ApproachWe already have a strong data position in Europe thanks to our significant 3G investment, with over 66,000 3G sites providing high speed mobile data and 65% of our 3G network providing theoretical downlink speeds faster than 14.4 Mbps. Some of our European targets are set out in the table below.
At 31 March 2011
Target by 31 March 2013
Number of 3G sites 66,000 90,000
Percentage of 3G network at >14.4 Mbps 65% 100%
4.2
3.0
1.81.3
Downlink Uplink
Typical achieved speeds in Vodafone’s network (Mbps) Vodafone’smarketsaverage(1)
Bestcompetitormarketaverage
Note:(1) EuroperegionplusEgyptandVodacom.Source:Vodafonecommissionedthirdpartydrive-bytestsondatauserspeeds(September2010–January2011).
We have also launched commercial initiatives to encourage mobile data use including:
■ tiered pricing plans to give customers more control (see page 19);
■ re-designing customer experience and support systems to provide a better mobile data experience;
■ a multiplicity of data-enabled devices such as smartphones, tablets, low-cost handsets and USB sticks; and
■ managing smartphone and network yields to deliver profitable growth.
Vodafone Group Plc Annual Report 2011 15
Business reviewBusiness review

Mobile data: technologyWe have collaborated with our main suppliers to pioneer the development of single RAN base station equipment which enables us to replace our existing 2G and 3G base stations with one solution which also supports LTE, providing significant savings in energy consumption and maintenance, and delivering improvements in capacity and coverage.
16 Vodafone Group Plc Annual Report 2011

Business Review
Network trialsWe always aim to deliver a market-leading customer experience and we use a third party to compare our networks with those of our major competitors. During the year we benchmarked our 16 main 3G markets. The results showed that we are the leading data services provider in 13 markets. On average across the networks measured we were almost 40% faster on data downlink than our best competitor and 40% faster on data uplink, a result achieved through our investment in extensive network upgrades and optimisation.
Investing to increase coverageContinued site deploymentAt 31 March 2011 we had over 66,000 3G sites in Europe, providing 83% 3G coverage across our major European markets. This represents an increase of over 8,500 sites during the year.
Vodafone 3G stationWe have continued to introduce Vodafone 3G stations, also known as femtocells in our markets. These innovative devices deliver a personal 3G mobile phone signal to customers through a fixed line broadband connection, giving coverage to customers where mobile operators are unable to provide a strong enough signal. At 31 March 2011 Vodafone 3G stations were in service in seven of our markets serving almost 400,000 customers.
Investing to improve customer experienceHigh speed packet access (‘HSPA’) upgrades We have continued to upgrade our HSPA networks with 65% of our European 3G network equipped with 14.4 Mbps theoretical peak downlink speeds or above and 90% providing 7.2 Mbps or above theoretical downlink speeds. Peak download speeds of up to 43.2 Mbps (downlink) and 5.8 Mbps (uplink) are now supported in several key traffic areas. These figures are theoretical peak rates deliverable in ideal radio conditions with no customer contention for resources.
Long-term evolution (‘LTE’) During the year we commercially launched our 4G/LTE technology in Germany and Verizon Wireless launched in the US. 4G/LTE can offer better performance than our current 3G/HSPA technology while increasing network capacity.
High capacity backhaul upgradesTo support the high speed data capabilities introduced across our access networks we have upgraded our backhaul and backbone transmission networks, which connect our base stations together, to the latest high bandwidth IP technologies.
As part of a strategy to implement scalable and cost-effective self-build solutions we have deployed high capacity ethernet microwave technology and high bandwidth optical fibre transmission solutions. In Europe about 80% of our radio base stations are served by self-built transmission (where we have physically installed and own the infrastructure) and over 20% are currently connected using high capacity technologies.
New services and capabilities engineeringWe have consolidated the national IP networks in all our major markets into a single IP network giving us the ability to deliver high quality IP connectivity to our customers.
Investing to improve cost efficiency Yield management capabilityWe have been supporting the improvement of 3G data service quality by managing the operational effectiveness of our network capacity. This enables us to optimise content and services as well as manage our costs. We have improved 3G data service quality in this way in 18 markets.
Network sharingTo reduce the cost of mobile network infrastructure, we have continued to use network sharing agreements with other operators in all of our controlled markets, with 70% of the new radio sites throughout the Group being shared with other mobile network operators.
Single radio access network (‘RAN’) and green technologyBy 31 March 2011 we had installed over 9,000 of these new single RAN base stations. We are also working hard to reduce our carbon impact through the wide-scale adoption of leading edge green technology solutions. Across our markets we are equipping our radio sites with advanced carbon-efficient solutions such as wind, solar and fuel cell technologies.
Research and development (‘R&D’)Our R&D ambition is to pioneer innovative services and technology in order to connect anyone and any device to one another and to the internet. We have introduced six key programmes to achieve these ambitions: networks of the future; smart charging; mobile location analysis; consumer electronics; automotive; and M2M.
Our focus over the next year will be on data and smart communication. We are also launching an innovation centre in the US and have strengthened our patent portfolio through strategic patent filing activity in areas relevant to our business interests.
Focus on key areas of growth potential: Mobile data–technology
Vodafone 3G stationBranded as Vodafone Sure Signal in the UK a femtocell that guarantees a 3G signal and super-fast mobile data transfer where installed in homes; also available for enterprise customers.
Vodafone Group Plc Annual Report 2011 17
Business review

Mobile data: customer experience, pricing and connected devicesWe are enhancing our customer care, retail presence and online service to ensure that customers get the best data experience. We are introducing data centric store formats and we now have 5,000 specialised data customer care representatives in Europe.
18 Vodafone Group Plc Annual Report 2011
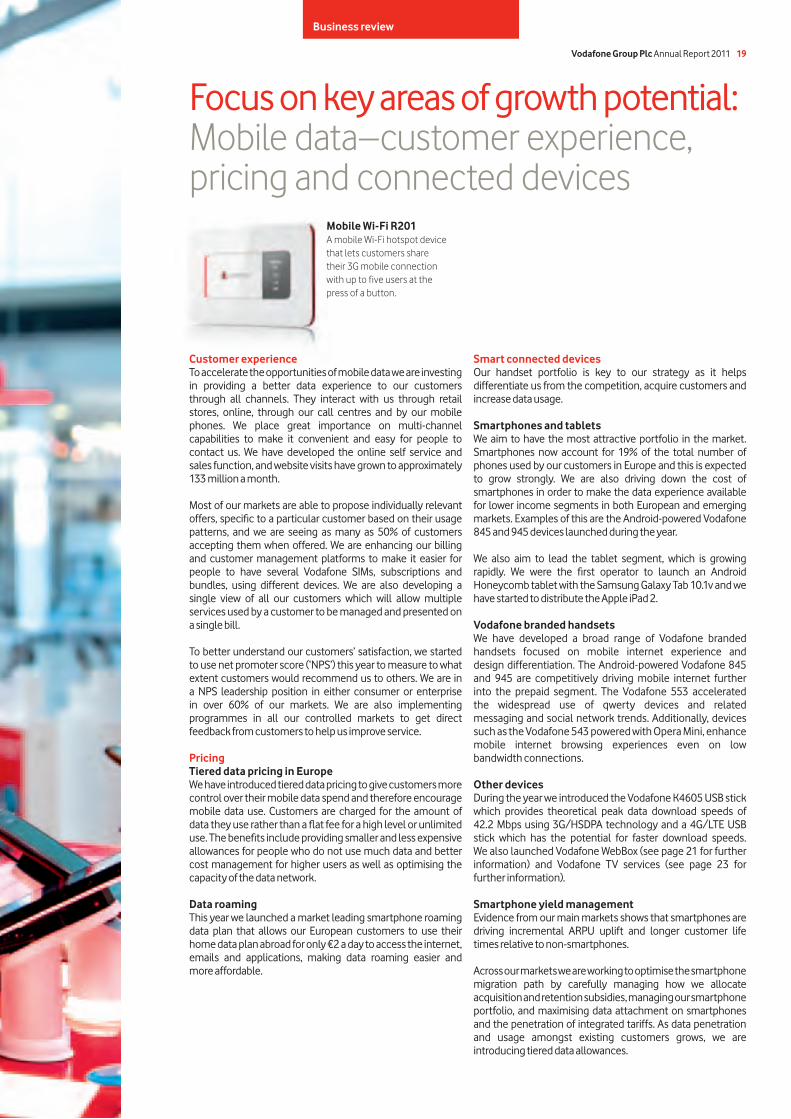
Mobile Wi-Fi R201A mobile Wi-Fi hotspot device that lets customers share their 3G mobile connection with up to five users at the press of a button.
Customer experienceTo accelerate the opportunities of mobile data we are investing in providing a better data experience to our customers through all channels. They interact with us through retail stores, online, through our call centres and by our mobile phones. We place great importance on multi-channel capabilities to make it convenient and easy for people to contact us. We have developed the online self service and sales function, and website visits have grown to approximately 133 million a month.
Most of our markets are able to propose individually relevant offers, specific to a particular customer based on their usage patterns, and we are seeing as many as 50% of customers accepting them when offered. We are enhancing our billing and customer management platforms to make it easier for people to have several Vodafone SIMs, subscriptions and bundles, using different devices. We are also developing a single view of all our customers which will allow multiple services used by a customer to be managed and presented on a single bill.
To better understand our customers’ satisfaction, we started to use net promoter score (‘NPS’) this year to measure to what extent customers would recommend us to others. We are in a NPS leadership position in either consumer or enterprise in over 60% of our markets. We are also implementing programmes in all our controlled markets to get direct feedback from customers to help us improve service.
PricingTiered data pricing in EuropeWe have introduced tiered data pricing to give customers more control over their mobile data spend and therefore encourage mobile data use. Customers are charged for the amount of data they use rather than a flat fee for a high level or unlimited use. The benefits include providing smaller and less expensive allowances for people who do not use much data and better cost management for higher users as well as optimising the capacity of the data network.
Data roamingThis year we launched a market leading smartphone roaming data plan that allows our European customers to use their home data plan abroad for only €2 a day to access the internet, emails and applications, making data roaming easier and more affordable.
Smart connected devices Our handset portfolio is key to our strategy as it helps differentiate us from the competition, acquire customers and increase data usage.
Smartphones and tabletsWe aim to have the most attractive portfolio in the market. Smartphones now account for 19% of the total number of phones used by our customers in Europe and this is expected to grow strongly. We are also driving down the cost of smartphones in order to make the data experience available for lower income segments in both European and emerging markets. Examples of this are the Android-powered Vodafone 845 and 945 devices launched during the year.
We also aim to lead the tablet segment, which is growing rapidly. We were the first operator to launch an Android Honeycomb tablet with the Samsung Galaxy Tab 10.1v and we have started to distribute the Apple iPad 2.
Vodafone branded handsetsWe have developed a broad range of Vodafone branded handsets focused on mobile internet experience and design differentiation. The Android-powered Vodafone 845 and 945 are competitively driving mobile internet further into the prepaid segment. The Vodafone 553 accelerated the widespread use of qwerty devices and related messaging and social network trends. Additionally, devices such as the Vodafone 543 powered with Opera Mini, enhance mobile internet browsing experiences even on low bandwidth connections.
Other devicesDuring the year we introduced the Vodafone K4605 USB stick which provides theoretical peak data download speeds of 42.2 Mbps using 3G/HSDPA technology and a 4G/LTE USB stick which has the potential for faster download speeds. We also launched Vodafone WebBox (see page 21 for further information) and Vodafone TV services (see page 23 for further information).
Smartphone yield managementEvidence from our main markets shows that smartphones are driving incremental ARPU uplift and longer customer life times relative to non-smartphones.
Across our markets we are working to optimise the smartphone migration path by carefully managing how we allocate acquisition and retention subsidies, managing our smartphone portfolio, and maximising data attachment on smartphones and the penetration of integrated tariffs. As data penetration and usage amongst existing customers grows, we are introducing tiered data allowances.
Focus on key areas of growth potential: Mobile data–customer experience, pricing and connected devices
Vodafone Group Plc Annual Report 2011 19
Business review

Customer growth will be driven by rising mobile penetration and GDP growthThe number of customers using mobile services in emerging markets such as India and Africa has grown rapidly over the last ten years, increasing by over 17 times compared to nearly 130% in more mature markets such as Europe. In the 2010 calendar year the Indian mobile market increased by more than 225 million customers, nearly four times the size of the UK population. The key driver of growth has been a fundamental need for communication services against a background of low quality fixed infrastructure and strong economic growth.
Most of the future growth in mobile phone users is expected to continue to be in emerging markets where mobile penetration is still only approximately 70% compared with around 130% in Europe, supported by the expectation of continued strong economic growth. We expect to see between 20 to 40 percentage points of additional penetration by 2014 in emerging markets(1).
Data is the next major opportunityData represents a substantial growth opportunity as only 19% of our active customers in emerging markets use data services which is about half the rate in Europe. There are two significant opportunities. One is mobile broadband, helped by the lack of a comprehensive fixed broadband infrastructure in emerging markets. Already in South Africa mobile broadband accounts for around 90% of all broadband. The other is mobile internet which we are driving by:
■ enhancing the mobile internet experience through our Opera Mini browser software which provides faster page downloads;
■ driving down the cost of internet enabled handsets powered by Opera Mini, with prices starting at US$45;
■ low day-to-day micro pricing which allows the purchase of individual data services, for example the download of a single ring tone; and
■ locally relevant content and services in local languages.
Focus on key areas of growth potential: Emerging markets
Vodafone 252In April 2011 we launched one of our most affordable devices which now comes pre-loaded with Vodafone M-Pesa for mobile payment services and a prepaid balance indicator that helps customers to keep track of their phone credit to avoid overspending.
Development impact of products and servicesMobile services are a key driver of economic development in emerging markets by increasing access to communications and mobile-enabled services. We continued to market Vodafone-branded competitively priced handsets, selling 1.7 million devices during the year in our emerging markets(2).
The uptake of Vodafone M-Pesa, which brings financial services to people without bank accounts, continued to grow, making an increasing contribution to economic development in communities that lack conventional banking services. It now has over 20 million customers globally (11 million in 2010), who transferred around US$500 million a month during the year (up from US$300 million a month in the previous financial year). We launched Vodafone M-Pesa in South Africa, Qatar and Fiji during the year, bringing the total to six markets, and began pilots in India with ICICI Bank and HDFC Bank.
The Vodafone WebBox (see opposite) was launched in South Africa in February 2011 and other markets will follow in the 2012 financial year.
Strong performanceWe are either number one or two in six of our seven emerging markets based on revenue. This year’s performance highlights include:
■ increased revenue market share in India and Turkey; ■ data revenue growth of 43.8%(*) in Vodacom and 37.7%(*)
in Egypt; and ■ surpassing the 134 million customer mark in India, an
increase of 34 million over the year.
We launched 3G services in India in February 2011 and anticipate that this will provide further revenue growth opportunities going forward.
Notes:(1) Source: Informa WCIS. (2) India, Vodacom, Egypt, Turkey, Ghana, Qatar and Fiji.
20 Vodafone Group Plc Annual Report 2011

62%Group customers from emerging markets(2)
(2010: 57%)
Vodafone WebBoxA Vodafone innovation bringing internet access to a customer’s existing television set just by plugging in a keyboard with a built-in mobile SIM card. It was developed specifically for customers in emerging markets where technology and cost barriers often exclude people from enjoying readily available internet access.
27%Group revenue from emerging markets(2)
(2010: 23%)
Vodafone Group Plc Annual Report 2011 21
Business reviewBusiness review

22 Vodafone Group Plc Annual Report 2011
Focus on key areas of growth potential:Enterprise
Enterprise customersOur enterprise customers range from small-office-home-office (‘SoHo’) businesses and small to medium-sized enterprises (‘SMEs’), through to large domestic and multinational companies. Across the Group we have 34 million enterprise customers accounting for around 9% of all customers and around 23% of service revenue.
Selected expansion in growth marketsSoHo and SMEOur focus for SoHos and SMEs is to provide customers with integrated fixed and mobile communications solutions where we host and maintain the entire service “in the cloud” to help customers reduce costs and simplify administration. Vodafone One Net for example, brings together fixed and mobile communications in one system and now has around 1.4 million end users in six markets. Through our partnership with Microsoft we provide our customers with hosted email, conferencing and collaboration services in a single package called Microsoft Online suite, which is now available in four markets.
Domestic companiesFor larger domestic companies we provide unified communications solutions delivering integrated mobile and fixed services, fixed voice and data services, IP virtual private networks and network integration services.
Multinational companiesVodafone Global Enterprise manages the communication needs of over 560 of our largest multinational corporate customers. It provides a range of managed services which bring together every aspect of a customer’s telecommunications infrastructure, both fixed and mobile, providing greater visibility and control of expenditure. During the year Vodafone Global Enterprise achieved organic revenue growth of around 8%(*). New customers and renewed contracts this year included Unilever, Luxottica and Bosch. In March 2011 Vodafone Global Enterprise received the HP Supplier of the Year Award for its role in delivering globally consistent managed mobility services to Hewlett Packard.
In October 2010 we acquired Quickcomm and TnT Expense Management, which are specialist providers of telecommunications expense management services. The acquisitions will strengthen our ability to provide our enterprise customers with greater visibility and control over their combined fixed line and mobile expenditure.
In the area of health, Vodafone Global Enterprise is working with partners such as Novartis on innovative health projects. Further information is contained in “Sustainable business” on page 30.
Machine-to-machine (‘M2M’) servicesMachine-to-machine communications, commonly known as M2M or telemetry, enables devices to communicate with one another via built-in mobile SIM cards. This allows key information to be automatically exchanged without human intervention making it possible to reduce costs, and improve efficiency and services to customers, for example, enabling drivers to upload and download real-time information to their sat nav devices on traffic jams which can help reduce journey times and save fuel.
Vodafone One NetEnables small and medium size business customers to combine their fixed and mobile communications into a single service with one number, one voice mailbox and one bill.

Business review
Vodafone Group Plc Annual Report 2011 23
Business review
Focus on key areas of growth potential: Total communications
To meet customers’ total communications needs beyond just mobile we have developed our fixed line capabilities including voice calls and broadband data, to provide a full suite of services. We can integrate customers’ mobile and fixed line communications into one service and provide related services such as Vodafone TV. Enterprise customers in particular have shown an increasing demand for receiving all their communication products from one company.
ApproachOur European strategy is to obtain long-term access to fast fixed broadband to service high value customers in a capital efficient manner. Access is obtained through wholesale agreements, partnerships or acquisitions.
Fixed servicesFixed broadband and voice account for around 8% of our service revenue. We have fixed services in 13 countries with 6.1 million fixed broadband customers at 31 March 2011, a 9.5% increase over the previous year. In addition, through Gateway, we provide wholesale carrier services in over 40 African countries.
Combining fixed and mobile servicesThe Vodafone DSL Router, now available in 11 markets, up from six markets the previous year, combines mobile and fixed broadband services. This means customers can connect
immediately after purchase via the USB broadband modem and then later with fixed broadband when this has been provisioned. During the year we have enriched this product in our largest fixed markets (Germany, Italy and Spain) through the integration of digital living network alliance (‘DLNA’) capabilities which facilitates the sharing of digital media between different electronic devices. For example, a DLNA compliant TV can operate with a DLNA compliant PC to play music or videos, or display photos.
We have been offering triple play services (fixed broadband, voice and TV) in Portugal since 2009. This year we increased our presence in the home TV market by launching services in Italy, Spain and Germany.
Application servicesWe offer a range of total communications applications as well as services for enterprise and consumer customers. For example Vodafone Always Best Connected software enables customers to stay connected to the internet on the best available connection wherever they are by automatically managing the switching between connection types including mobile broadband, Wi-Fi and LAN. Vodafone PC Backup is an online back-up and restore service that enables users to remotely store data securely and automatically via their internet connection.
Vodafone TV This is a new service, launched in four markets, that provides a wide range of content over the airwaves through a fixed line broadband connection. In Germany it is supplied through an innovative ‘hybrid’ set-top box which delivers free and pay TV channels transmitted by satellite, cable or broadband. It also provides on-demand films and TV programmes, and other premium content.
Vodafone DSL RouterThe DSL Router comes complete with a Vodafone Mobile Broadband USB stick so customers can have instant access to the internet while their fixed broadband is set-up.

24 Vodafone Group Plc Annual Report 2011
Focus on key areas of growth potential: New services
Mobile payments (an application of NFC)Vodafone, ABN AMRO, ING, KPN, Rabobank and T-Mobile signed a letter of intent this year to create a joint venture company and introduce simple and secure mobile payments at checkouts in the Netherlands. It is an early example of how Vodafone is leading the market for mobile payments in partnership with other mobile network operators and major banks.
We have strategically chosen to expand into a number of new growth segments to create additional revenue and enhanced customer experience that complement our core voice and data products.
Machine-to-machine (‘M2M’)M2M connections allow devices to communicate with one another via built-in mobile SIM cards. This allows us to offer services such as fleet tracking and asset management, remote monitoring of, for example, vending machines, cash machines and building management, as well as security and surveillance. We are now serving around 5.3 million M2M connections around the world. Further information is contained in “Focus on key areas of growth potential: Enterprise” on page 22 and “Sustainable business” on page 30.
Third party billingWe work with third party content and service providers to simplify our customers’ experience when they purchase applications and content by letting our customers charge these services direct to their mobile account (‘charge to bill’). We provide a single technical interface to these providers to reach all our European customers and we plan to expand this reach to other parts of the world over the 2012 financial year.
Financial servicesVodafone M-Pesa is now live in six markets. Further information is contained in “Focus on key areas of growth potential: Emerging markets” on page 20.
Near field communication (‘NFC’)NFC allows communication between devices when they are touched together or brought within a few centimetres of each other. We aim to make mobile phones the preferred device for most personal transactions including payments, tickets, coupons, identification and the provision of information. We have been developing mobile NFC standards since 2006, have conducted trials in several markets and are now developing services and partnerships in preparation for commercial launch in key markets.
Mobile advertising We have an established mobile advertising business in 18 countries with a wide range of capabilities. The fast adoption of smartphone devices is promoting mobile as an alternative channel to reach consumers and we are collaborating with other mobile network operators to make the most of the potential of mobile advertising.
Vodafone Ad Plusin Romania allows companies to access by SMS an opted in customer base of up to five million customers. Research in Romania shows almost 58% of our customers like to receive relevant adverts on their mobile.
Vodafone Group Plc Annual Report 2011 25
Business reviewBusiness review
Deliver value and efficiency from scale
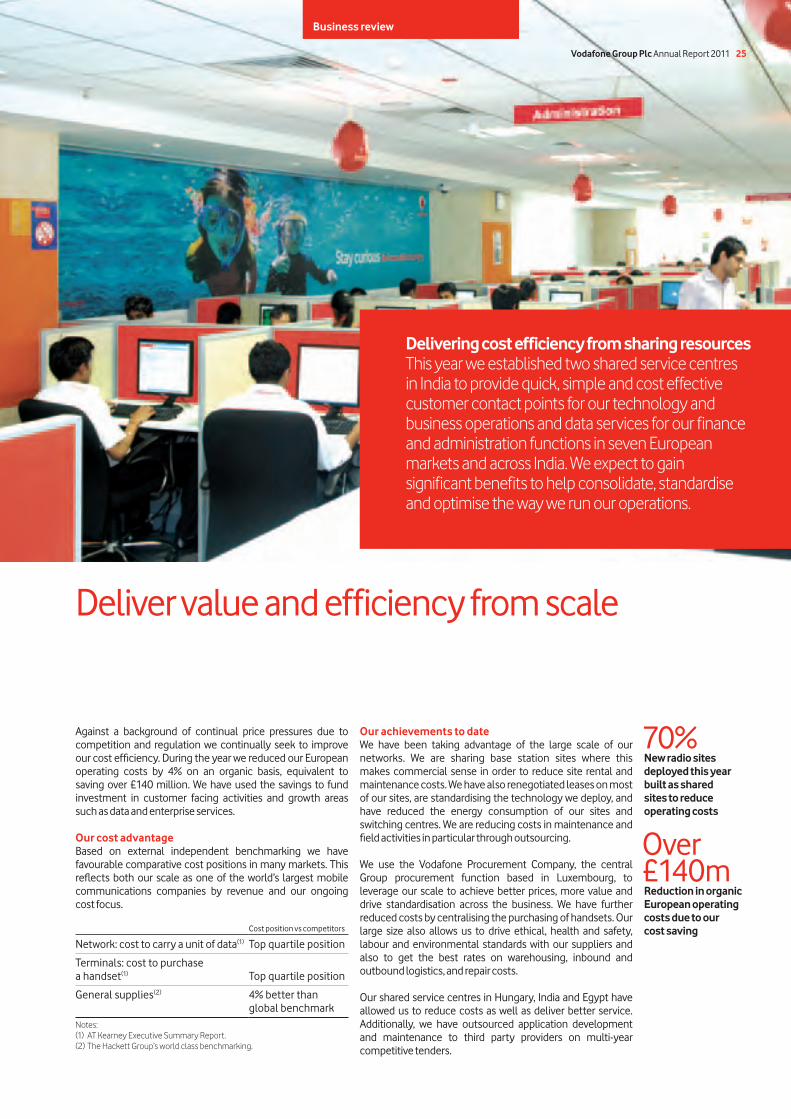
Against a background of continual price pressures due to competition and regulation we continually seek to improve our cost efficiency. During the year we reduced our European operating costs by 4% on an organic basis, equivalent to saving over £140 million. We have used the savings to fund investment in customer facing activities and growth areas such as data and enterprise services.
Our cost advantageBased on external independent benchmarking we have favourable comparative cost positions in many markets. This reflects both our scale as one of the world’s largest mobile communications companies by revenue and our ongoing cost focus.
Cost position vs competitors
Network: cost to carry a unit of data(1) Top quartile position
Terminals: cost to purchase a handset(1) Top quartile position
General supplies(2) 4% better than global benchmark
Notes:(1) AT Kearney Executive Summary Report.(2) The Hackett Group’s world class benchmarking.
Our achievements to dateWe have been taking advantage of the large scale of our networks. We are sharing base station sites where this makes commercial sense in order to reduce site rental and maintenance costs. We have also renegotiated leases on most of our sites, are standardising the technology we deploy, and have reduced the energy consumption of our sites and switching centres. We are reducing costs in maintenance and field activities in particular through outsourcing.
We use the Vodafone Procurement Company, the central Group procurement function based in Luxembourg, to leverage our scale to achieve better prices, more value and drive standardisation across the business. We have further reduced costs by centralising the purchasing of handsets. Our large size also allows us to drive ethical, health and safety, labour and environmental standards with our suppliers and also to get the best rates on warehousing, inbound and outbound logistics, and repair costs.
Our shared service centres in Hungary, India and Egypt have allowed us to reduce costs as well as deliver better service. Additionally, we have outsourced application development and maintenance to third party providers on multi-year competitive tenders.
Delivering cost efficiency from sharing resourcesThis year we established two shared service centres in India to provide quick, simple and cost effective customer contact points for our technology and business operations and data services for our finance and administration functions in seven European markets and across India. We expect to gain significant benefits to help consolidate, standardise and optimise the way we run our operations.
70%New radio sites deployed this year built as shared sites to reduce operating costs
Over £140mReduction in organic European operating costs due to our cost saving

26 Vodafone Group Plc Annual Report 2011
Verizon WirelessIn the US, our associate Verizon Wireless has continued to perform strongly. Organic service revenue increased by 5.8%(*) led by a 3.1% increase in the customer base to 88.4 million and strong data revenue growth driven by increased smartphone penetration. Verizon Wireless launched 4G LTE services in December 2010 and began distribution of the iPhone on its network in February 2011.
Generate liquidity or free cash flow from non-controlled interests
Non-controlled interests constitute around 40% (based on third party estimates) of the value of the Group’s assets. We aim to maximise the value of these interests either by generating liquidity or increasing free cash flow in order to fund profitable investment and enhance shareholder returns.
Verizon Wireless Verizon Wireless is our largest non-controlled interest, in which we have an equity interest of 45%. It is the revenue market leader in the US and performed strongly this year with service revenue growth of 5.8%(*). To create additional value we are working closely with Verizon Wireless on several initiatives that leverage our combined scale and scope including purchasing of network equipment, IT and services, technology enhancements and propositions for multinational companies. We received around £1.0 billion in dividends this year, in relation to tax related dividend receipts (see “Dividends from associates and to non-controlling shareholders” on page 48 for further information), which was substantially less than our proportionate share of Verizon Wireless’ free cash flow which shows the material opportunity for incremental returns.
Polkomtel Polkomtel trades as Plus in Poland and is a leading operator in Poland. Along with the four other owners we are exploring options for a sale of the business.
Bharti Airtel Bharti is the market leader in India. Following the purchase of our controlling interest in Vodafone Essar in India in 2007, we sold 5.6% of our stake in Bharti in 2008 and retained a 4.4% indirect interest.
Sale of interestsIn September 2010 we sold our 3.2% interest in China Mobile Limited for £4.3 billion. In November 2010 we sold our interests in SoftBank of Japan for £3.1 billion and approximately half of the proceeds have been received to date and used to reduce the Group’s net debt. The remaining proceeds are expected to be received in April 2012. In April 2011 we announced the sale of our 44% interest in SFR, the second largest mobile operator in France, for £6.8 billion. The transaction, which is subject to competition authority and regulatory approvals, is expected to complete during the second calendar quarter of 2011.
Proceeds from the sale of all of these interests are being used to reduce net debt and committed to a £6.8 billion buyback of our shares of which £2.6 billion has been completed to date.
39% Group adjusted operating profit from Verizon Wireless(2010: 36%)

Business review
Vodafone Group Plc Annual Report 2011 27
Business review
Creating value for shareholdersWe aim to increase shareholder returns through regular dividends and one-off returns. In 2009 we established a target to grow total dividends per share by at least 7% per annum until the financial year ending 31 March 2013, and consistent with this, total dividends per share increased by 7.1% in 2011 to 8.90 pence per share. In addition, we have committed £6.8 billion to buying back our shares, of which £2.6 billion has been returned to date.
Apply rigorous capital discipline to investment decisions
Discipline of regular business reviewsWe are focused on enhancing returns to our shareholders and are therefore careful how we invest shareholders’ money. We regularly review the cash needs of each of our businesses across the globe, taking into account their performance and competitive position.
How we invest your moneyOrganic investmentWe make capital investments, such as for new equipment or spectrum, in our existing businesses to improve their performance and drive organic growth.
Returns to shareholdersWe thoroughly review the best ways to provide returns to our shareholders. We have a target of increasing total dividends per share by at least 7% a year until the financial year ending 31 March 2013. When we have surplus funds we consider additional returns to shareholders through special dividends or share buyback programmes.
Selective acquisitionsWhen managing capital we also consider whether to strengthen the Group by acquiring other companies to increase our operations in a particular market. All potential acquisitions are judged on strict financial and commercial criteria, especially whether they would provide meaningful scale in a particular segment, the cost of the acquisition and the ability to enhance the Group’s free cash flow. For example, in March 2011 we announced our intention to acquire BelCompany BV, the Netherlands’ largest independent telecom retailer, which will expand our Dutch stores from 86 to 296.
Investment principlesAll of our investments, whether in existing businesses or acquisitions, are subject to rigorous commercial analysis and demanding hurdle rates (the minimum rate of return on an investment) to ensure they enhance shareholder returns. We remain committed to our target credit rating of low single A for long-term debt as this provides us with a low cost of debt and good access to liquidity from financial institutions.
Low single ATarget long-term credit rating
7%Target annual increase in total dividends per share until March 2013

28 Vodafone Group Plc Annual Report 2011
Key market performance at a glance
Country Organic service revenue growthKey achievements
■ Excluding the impact of regulated termination rate cuts, service revenue growth was 2.1%(*).
■ Strong growth in enterprise segment due to significant customer wins.
■ Our first market to launch 4G/LTE.
■ Increased market share in a challenging economic and competitive environment.
■ A 21.5 %(*) increase in data revenue due to increased smartphone penetration.
■ Now with 1.7 million fixed broadband customers (on a 100% basis), up 29%.
■ Extremely challenging economic environment and increasing competitive pressure.
■ New integrated voice and data plans to support smartphone adoption.
■ New management in place since April 2011.
Key market reviewRevenue trends continue to improve
We have gained or held market share in most of our key markets
■ Group organic service revenue growth improved during the year, with a strong result from emerging markets and encouraging signs of renewed growth in some parts of Europe.
■ In Europe service revenue was down 0.4%(*) during the year; however, this was significantly better than last year’s decline of 3.8%(*). We are seeing positive revenue trends in the more stable economies of northern Europe such as Germany, the UK and the Netherlands, while our remaining mature markets in Europe, particularly those impacted by government austerity measures, have seen declining revenue growth. Turkey has seen significant revenue growth this year, driven by improvements both in voice and data revenue.
■ Service revenue growth in our Africa, Middle East and Asia Pacific region was 9.5(*). Our two major businesses within this region, India and Vodacom, reported continued strong growth reflecting the benefits of rising mobile penetration in India and a more stable pricing environment; and strong take-up of data services in South Africa.
■ See operating results on pages 34 to 38 for further details of performance within each of our markets during the year.
Germany
Italy
Spain
Service revenue growth (%)(*) (6.9)
EBITDA margin (%) 30.4
Operating free cash flow (£m) 885
Service revenue growth (%)(*) (2.1)
EBITDA margin (%) 46.2
Operating free cash flow (£m) 2,067
Service revenue growth (%)(*) 0.8
EBITDA margin (%) 37.4
Operating free cash flow (£m) 2,297 2009 2010 2011
2009 2010 2011
2009 2010 2011
(2.5)
1.2
(4.9)
(3.5)
1.9
(7.0)
0.8
(2.1)
(6.9)

Vodafone Group Plc Annual Report 2011 29
Business review
Country Organic service revenue growthKey achievements
■ Significant year-on-year improvement in revenue trends.
■ Data revenue increased 28.5%(*) due to increasing penetration of smartphones.
■ Strong contract customer growth due to increased commercial focus.
■ Revenue growth improved through the year as the customer base increased and price declines slowed.
■ Fourth successive year of gaining revenue market share.
■ Commenced 3G services in February 2011 with 1.5 million customers by 31 March.
■ Strong revenue growth led by increasing demand for mobile broadband services.
■ Launched WebBox service for internet access.
■ Continued network investment with over 3,200 base stations now 4G/LTE ready.
Mobile service revenue market share (%)(1) 2010 2011
United Kingdom
India
Service revenue growth (%)(*) 16.2
EBITDA margin (%) 25.6
Operating free cash flow (£m) 433
Service revenue growth (%)(*) 5.8
EBITDA margin (%) 33.7
Operating free cash flow (£m) 1,339
Service revenue growth (%)(*) 4.7
EBITDA margin (%) 23.4
Operating free cash flow (£m) 950
Vodacom
Germany Italy Spain
34 34 37 37
19(2)32
2009 2010 2011
2009 2010 2011
2009 2010 2011
2533
18
54
25
UK
53(2)
South Africa(3)India
(1.1)
33(4)
13.8
(4.7)
14.7
4.6
4.7
16.2
5.8
Notes:(1) At 31 March (2011 estimated).(2) Q3 2010 and Q3 2011 data; mobile total revenue share.
Revenue by key market (%)
Germany Italy Spain UK India Vodacom Other
12
11
11
812
29
17
Our strong brand and increased customer focus, supported by our leading network performance, is driving our improved performance.
(3) Market share information relates to South Africa which is Vodacom’s largest business.(4) This figure reflects pro-forma growth which is organic growth adjusted to include acquired business for the whole
of both periods.

30 Vodafone Group Plc Annual Report 2011
Sustainable businessSustainability underpins everything we do
StrategyOur sustainability strategy has three components:
■ sustainable societies: helping create more sustainable societies by providing communication services to meet the needs of people in emerging markets and facilitating the transition to a low carbon society;
■ eco-efficiency: cutting our carbon footprint in developed markets, reducing carbon intensity in rapidly growing emerging markets and minimising other environmental impacts; and
■ ethical business: ensuring responsible, ethical and honest behaviour throughout our operations and supply chain.
Performance for the yearCreating more sustainable societiesOur networks, products and services have been making a difference to people’s lives around the world and contributing to achieving the United Nations’ Millennium Development Goals.
Many of our innovative services, pricing plans and products, such as Vodafone WebBox, Vodafone-branded handsets and Vodafone M-Pesa are tailored to emerging markets. See “Focus on key areas of growth potential: Emerging markets” on page 20 for further information.
Vodafone mHealth Solutions uses mobile communications to improve the efficiency of healthcare. In developed countries
our focus is on remote care services, including assisted living and condition management, saving costs and improving patients’ quality of life, as well as mobile-based services that increase the efficiency of clinical trials. In emerging markets we are using mobile to improve access to medicine, for example, ‘SMS for Life’, a supply chain management solution which helps clinics manage supplies of malaria drugs. It has successfully improved stock management in Tanzania and is now being rolled out in other countries in collaboration with Novartis and other pharmaceutical companies.
Mobile communications, particularly M2M connections, have been playing a part in the transition to a low carbon society by facilitating the development of smart energy grids and improving the efficiency and emissions from vehicle travel (see “M2M services” see page 22). We have been working with British Gas in the UK and Italgas in Italy to provide M2M connections in homes for over one million smart meters to allow consumers to monitor and reduce their electricity and gas use.
Eco-efficiencyOur total CO
2 emissions increased by 62.6% to 1.96 million
tonnes principally due to the inclusion of India, South Africa, Ghana and Qatar in our reporting, and were approximately level against last year on a like-for-like basis. Our target is to reduce our absolute CO
2 emissions in developed markets by
50% from the 2007 financial year baseline by March 2020, and
Enabling mobile healthcareVodafone mHealth Solutions delivers mobile solutions which enable the accessibility, efficiency and quality of healthcare. For example our ‘Nompilo’ project, developed with GeoMed, allows community caregivers in South Africa to input and access patient information by mobile, reducing administration time and costs while improving patient care through more effective monitoring and evaluation. The service will be trialled next in Tanzania and Spain.
50%CO
2 reduction
target in developed markets versus the 2007 baseline by March 2020

Vodafone Group Plc Annual Report 2011 31
Business review
in emerging markets we are setting carbon intensity targets to reduce emissions per network node.
We are deploying more efficient equipment across our network, working with suppliers to develop more efficient equipment, and using solar and wind power to generate renewable energy for off-grid base stations.
Ethical businessOur business and sustainability strategies are underpinned by our business principles and code of conduct which stress the importance of responsible, ethical and honest behaviour in everything we do. This means being a responsible employer, maintaining the health and safety of our employees and contractors (see “People” on page 32), ensuring high standards of labour and environmental protection in our supply chain, transparent and ethical business practices, clear pricing and maintaining a safe internet experience (including child safety and privacy). In response to the proposed disclosure requirements on conflict minerals required by the US Dodd-Frank legislation, we continue to strengthen our due diligence activities on the source and chain of custody of these materials. The issue of human rights and access to communications has been brought into sharp focus by continuing events in the Middle East and North Africa.
Social investment The Vodafone Foundation and its network of 27 local foundations continue to invest in the communities in which Vodafone operates. Specific initiatives include Mobiles for Good projects which include the piloting of handsets for women at risk of domestic violence and an instant network which provides rapid network coverage for emergencies, Red Alert SMS fundraising services for emergency appeals and its World of Difference programme which enables individuals to take paid time to work for a charity of their choice for up to a year. We make grants to a variety of local charitable organisations meeting the needs of their communities. Total donations for the year were £49.6 million and included donations of £5.2 million towards foundation operating costs.
Sustainability governanceThe Executive Committee is ultimately responsible for our sustainability performance and receives a formal update every year, as does the Board. Each local market has a sustainability management structure and a system for monitoring performance and reporting to the Group. We also influence and monitor the sustainability performance of our joint ventures, outsourcing partners and other organisations with which we work.
The Vodafone Sustainability Expert Advisory Panel met twice during the year to discuss various issues. We engage a wide range of stakeholders, including customers, investors, employees, suppliers, communities, governments and regulators.
Our 11th annual sustainability report, which is assured by Ernst & Young LLP using the International Standard on Assurance Engagements (‘ISAE 3000’) to check adherence to the AA1000 AccountAbility Principles Standard (‘AA1000APS’), is available at www.vodafone.com/sustainability. 16 local markets also publish their own sustainability reports.
Energy efficiency Solar and wind power generating renewable energy for our off-grid base stations in Spain.
Instant NetworkVodafone Foundation and Group Technology worked with Huawei and Telecoms Sans Frontieres to develop a portable GSM/EDGE mobile network that provides instant mobile coverage for emergency situations in under 40 minutes, which fits into three suitcase-size boxes to be transported by plane worldwide.
Key performance indicators(1)
2011 2010 2009
Vodafone Group
Energy use (GWh) (direct and indirect) 4,117 3,278 3,044
Carbon dioxide emissions (millions of tonnes) 1.96 1.21 1.22
Percentage of energy sourced from renewables 19.42 23 19
Number of phones collected for reuse and recycling (millions) 1.23 1.33 1.53
Network equipment waste generated (tonnes) 7,473 5,870 4,944
Percentage of network equipment waste sent for reuse or recycling 99 98 97
Note:(1) These performance indicators were calculated using actual or estimated
data collected by our mobile operating companies. The data is sourced from invoices, purchasing requisitions, direct data measurement and estimations where required. The carbon dioxide emissions figures are calculated using the kWh/CO
2 conversion factor for the electricity provided by the national
grid, suppliers or the International Energy Agency and for other energy sources in each operating company. The 2011 data includes India, Ghana, Qatar and South Africa but excludes all other Vodacom markets. Our joint venture in Italy is included in all years.

32 Vodafone Group Plc Annual Report 2011
PeopleOur people are integral to building and sustaining our success
Organisation effectiveness and changeWe employed an average of around 83,900 people worldwide during the year and saw an increase in the percentage of women in senior roles, up from 14.5% to 16.5%. People numbers have changed in different areas of the business according to overall business strategy. For example: in Vodacom head count was increased to support the growing enterprise business and data; in India, we increased headcount to grow the business; in Ghana, to drive operational efficiency, we reduced headcount through redundancy and outsourcing of network operations, call centres and facilities; and in the UK we reduced back office roles and increased investment in customer facing activities.
We have also made a number of changes to our structure, governance and accountabilities to help us concentrate on our main commercial and financial priorities. These changes include the creation of a Group Commercial unit, expansion of the role and scope of Group Technology to oversee all operating companies, the consolidation of our regional structure into two distinct regions, plus reporting line changes to align teams more closely with their functions.
Employment policies and employee relationsOur employment policies are developed to reflect local legal, cultural and employment requirements. We aim to be recognised as an employer of choice and therefore seek to maintain high standards and good employee relations wherever we operate.
Our goal is to create a working culture that is inclusive for all. We believe that having a diverse workforce helps to meet the different needs of our customers across the globe. An inclusive culture and environment is one which respects, values, celebrates and makes the most of the individual differences we each bring to Vodafone, to the benefit of our customers, employees, shareholders, business partners and the wider communities in which we operate. We do not condone unfair treatment of any kind and offer equal opportunities in all aspects of employment and advancement regardless of race, nationality, gender, age, marital status, sexual orientation, disability, religious or political beliefs. This also applies to agency workers, the self-employed and contract workers who work for us. In our latest people survey, 87% of employees agreed that Vodafone treats people fairly, regardless of their gender, background, age or beliefs.
Employees by location (%)
Germany Italy Spain UK India Vodacom Other
The Vodafone WayThe Vodafone Way is about a consistent way of working, with speed, simplicity and trust. The aim is to be an admired organisation which delivers through being customer obsessed, innovation hungry, ambitious and competitive, and one company with local roots. We launched a global recognition initiative to identify people who are role models for The Vodafone Way and have recognised over 300 ‘The Vodafone Way Global Heroes’.
7 510
13
941
15
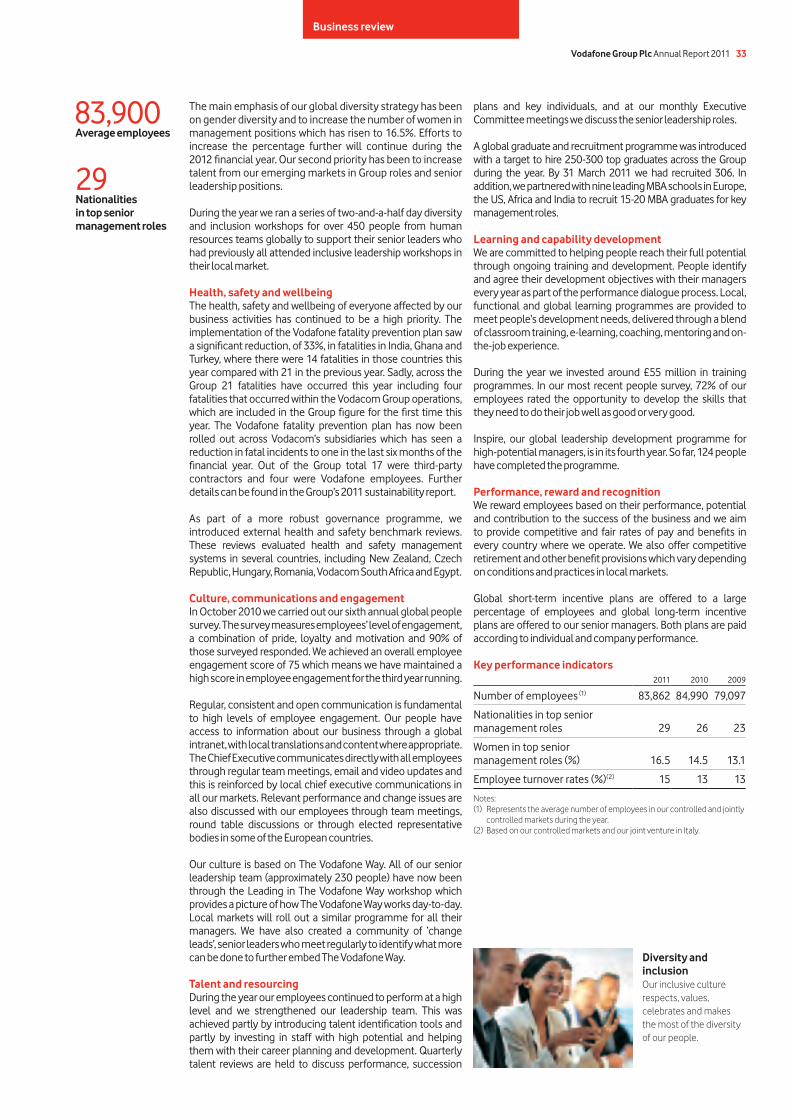
Vodafone Group Plc Annual Report 2011 33
Business review
The main emphasis of our global diversity strategy has been on gender diversity and to increase the number of women in management positions which has risen to 16.5%. Efforts to increase the percentage further will continue during the 2012 financial year. Our second priority has been to increase talent from our emerging markets in Group roles and senior leadership positions.
During the year we ran a series of two-and-a-half day diversity and inclusion workshops for over 450 people from human resources teams globally to support their senior leaders who had previously all attended inclusive leadership workshops in their local market.
Health, safety and wellbeingThe health, safety and wellbeing of everyone affected by our business activities has continued to be a high priority. The implementation of the Vodafone fatality prevention plan saw a significant reduction, of 33%, in fatalities in India, Ghana and Turkey, where there were 14 fatalities in those countries this year compared with 21 in the previous year. Sadly, across the Group 21 fatalities have occurred this year including four fatalities that occurred within the Vodacom Group operations, which are included in the Group figure for the first time this year. The Vodafone fatality prevention plan has now been rolled out across Vodacom’s subsidiaries which has seen a reduction in fatal incidents to one in the last six months of the financial year. Out of the Group total 17 were third-party contractors and four were Vodafone employees. Further details can be found in the Group’s 2011 sustainability report.
As part of a more robust governance programme, we introduced external health and safety benchmark reviews. These reviews evaluated health and safety management systems in several countries, including New Zealand, Czech Republic, Hungary, Romania, Vodacom South Africa and Egypt.
Culture, communications and engagementIn October 2010 we carried out our sixth annual global people survey. The survey measures employees’ level of engagement, a combination of pride, loyalty and motivation and 90% of those surveyed responded. We achieved an overall employee engagement score of 75 which means we have maintained a high score in employee engagement for the third year running.
Regular, consistent and open communication is fundamental to high levels of employee engagement. Our people have access to information about our business through a global intranet, with local translations and content where appropriate. The Chief Executive communicates directly with all employees through regular team meetings, email and video updates and this is reinforced by local chief executive communications in all our markets. Relevant performance and change issues are also discussed with our employees through team meetings, round table discussions or through elected representative bodies in some of the European countries.
Our culture is based on The Vodafone Way. All of our senior leadership team (approximately 230 people) have now been through the Leading in The Vodafone Way workshop which provides a picture of how The Vodafone Way works day-to-day. Local markets will roll out a similar programme for all their managers. We have also created a community of ‘change leads’, senior leaders who meet regularly to identify what more can be done to further embed The Vodafone Way.
Talent and resourcingDuring the year our employees continued to perform at a high level and we strengthened our leadership team. This was achieved partly by introducing talent identification tools and partly by investing in staff with high potential and helping them with their career planning and development. Quarterly talent reviews are held to discuss performance, succession
Key performance indicators2011 2010 2009
Number of employees (1) 83,862 84,990 79,097
Nationalities in top senior management roles 29 26 23
Women in top senior management roles (%) 16.5 14.5 13.1
Employee turnover rates (%)(2) 15 13 13
Notes:(1) Represents the average number of employees in our controlled and jointly controlled markets during the year.(2) Based on our controlled markets and our joint venture in Italy.
Diversity and inclusionOur inclusive culture respects, values, celebrates and makes the most of the diversity of our people.
29Nationalities in top senior management roles
83,900Average employees
plans and key individuals, and at our monthly Executive Committee meetings we discuss the senior leadership roles.
A global graduate and recruitment programme was introduced with a target to hire 250-300 top graduates across the Group during the year. By 31 March 2011 we had recruited 306. In addition, we partnered with nine leading MBA schools in Europe, the US, Africa and India to recruit 15-20 MBA graduates for key management roles.
Learning and capability developmentWe are committed to helping people reach their full potential through ongoing training and development. People identify and agree their development objectives with their managers every year as part of the performance dialogue process. Local, functional and global learning programmes are provided to meet people’s development needs, delivered through a blend of classroom training, e-learning, coaching, mentoring and on-the-job experience.
During the year we invested around £55 million in training programmes. In our most recent people survey, 72% of our employees rated the opportunity to develop the skills that they need to do their job well as good or very good. Inspire, our global leadership development programme for high-potential managers, is in its fourth year. So far, 124 people have completed the programme.
Performance, reward and recognitionWe reward employees based on their performance, potential and contribution to the success of the business and we aim to provide competitive and fair rates of pay and benefits in every country where we operate. We also offer competitive retirement and other benefit provisions which vary depending on conditions and practices in local markets.
Global short-term incentive plans are offered to a large percentage of employees and global long-term incentive plans are offered to our senior managers. Both plans are paid according to individual and company performance.


