morrowsodali-transactions.commorrowsodali-transactions.com/attachments... · empowering everybody...
TRANSCRIPT

Empowering everybody to be confidently connectedVodafone Group Plc Annual Report 2014
Vodafone Group Plc Annual Report for the year ended 31 M
arch 2014
Vodafone Group Plc
Registered Office: Vodafone House The Connection Newbury Berkshire RG14 2FN England
Registered in England No. 1833679
Telephone: +44 (0) 1635 33251 Fax: +44 (0) 1635 238080
vodafone.com Contact details:
Shareholder helpline Telephone: +44 (0) 870 702 0198 (In Ireland): +353 (0) 818 300 999
Investor Relations [email protected] vodafone.com/investor
Media Relations vodafone.com/media/contact
Sustainability [email protected] vodafone.com/sustainability
Access our online Annual Report at:vodafone.com/ar2014

OverviewIn this section: An introduction to the report covering who we are, the Chairman’s reflections on the year, notable events, and a snapshot of where and how we do business.
1 About us
2 Chairman’s statement
3 Financial highlights
4 Our year
8 Where we do business
10 How we do business
Strategy reviewIn this section: A summary of the changing landscape we operate in, and how that has shaped our strategy and financial position. Plus a review of performance against our goals and our approach to running a sustainable business.
12 Chief Executive’s review
14 Crystallising value from Verizon Wireless
16 Key performance indicators
18 Market overview
21 Our strategy 22 Consumer Europe 24 Unified Communications 26 Consumer Emerging Markets 28 Enterprise 30 Network 32 Operations
34 Sustainable business
36 Our people
PerformanceIn this section: Commentary on operating performance for the Group, the key operating segments – Europe and AMAP (Africa, Middle East and Asia Pacific), and a summary of key risks.
38 Chief Financial Officer’s review
40 Operating results
46 Risk summary
GovernanceIn this section: The governance framework, including the role and effectiveness of the Board and the alignment of the interests of management with long-term value creation.
49 Chairman’s overview
50 Board of directors and Group management
54 Corporate governance
69 Directors’ remuneration
86 Directors’ report
FinancialsIn this section: The statutory financial statements of both the Group and the Company and associated audit report.
87 Contents
88 Directors’ statement of responsibility
90 Audit report on internal control over financial reporting
91 Audit report on the consolidated and parent company financial statements
96 Consolidated financial statements and financial commentary
176 Company financial statements
Additional informationIn this section: Find out about our shares, history and development, regulatory matters impacting our business, an assessment of potential risks to the Company, and other statutory financial information.
182 Shareholder information
190 History and development
191 Regulation
196 Principal risk factors and uncertainties
201 Non-GAAP information
206 Form 20-F cross reference guide
209 Forward-looking statements
211 Definition of terms
213 Selected financial data
Inside this year’s reportTh
e fo
llow
ing
sect
ions
con
stit
ute
the
stra
tegi
c re
port
:
Unless otherwise stated references to “year” or “2014” mean the financial year ended 31 March 2014, to “2013” or “previous year” mean the financial year ended 31 March 2013, and to the “fourth quarter” or “Q4” are to the quarter ended 31 March 2014. For other references please refer to page 45.
All amounts marked with an “*” represent organic growth, which excludes the impact of foreign currency movements, acquisitions and disposals and certain other items, see definition on page 212. Definitions of terms used throughout the report can be found on pages 211 and 212.
The terms “Vodafone”, the “Group”, “we”, “our” and “us” refer to the Company and, as applicable, its subsidiaries and/or interests in joint ventures and associates.
Website references are for information only and do not constitute part of this annual report.
This report is dated 20 May 2014.
Vodafone Group Plc Annual Report 2014
Glue area

We’ve come a long way since making the first ever mobile call in the UK on 1 January 1985. In 30 years, a small mobile operator in Newbury has grown into a global business and one of the most valuable telecoms brands in the world. We now have mobile operations in 27 countries and partner with mobile networks in 48 more. Today, we have 434 million mobile customers around the world. And because we now do more than just mobile, we’re able to provide fixed broadband services in 17 markets, and 9 million customers use us for their fixed broadband needs.
Our core purpose is to empower our customers to be confidently connected – whether at home, during the daily commute, in the office, or abroad – wherever and however they choose. We want everyone to be confidently connected to their friends, families, and customers, and to always have access to the content and information they choose.
We’re aiming to differentiate ourselves from our competitors, by having the best network, providing the best customer experience and having the best integrated worry-free solutions.
While we expect these actions to improve our business performance over time, we recognise that financial results alone are not enough. A commitment to improve our social impact and behave ethically and responsibly at all times is integral to ensuring the long-term sustainability of our businesses.
Our business is constantly evolving to adapt to changes in customer behaviour, technology, regulation and the competitive landscape. Our strategy is our response to these changes, while ensuring we operate in a responsible way.
As you’ll see in this year’s report, we are making great strides towards our strategic goals, as we begin to realise our vision of empowering everybody to be confidently connected…
About us
This year’s report contains a new strategic report on pages 1 to 47, which includes an analysis of our performance and position, a review of the business during the year, and outlines the principal risks and uncertainties we face. The strategic report was approved by the Board and signed on its behalf by the Chief Executive and Chief Financial Officer.
Vittorio Colao Chief Executive
Nick Read Chief Financial Officer
Vodafone Group Plc Annual Report 2014 01Overview
Strategy review Performance Governance Financials
Additional information
Glue area

Chairman’s statement
Three pillars of successThree distinct elements sum up why Vodafone has had such a strong track record of shareholder value creation over recent years. First, in response to the increasing demand for data we have formulated a clear strategy of becoming a leading unified communications provider and to strengthen further our network and service differentiation, through investments in mobile and fixed capabilities. Second, we have made significant progress in executing our strategy. We have actively managed our portfolio, particularly disposing of our non-controlling interests, and used part of the proceeds to accelerate the roll-out of 3G and 4G mobile capability and the deployment of next-generation fixed line operations in a number of key markets. To accelerate our strategy further we acquired Kabel Deutschland in Germany and agreed the purchase of Ono in Spain – two leading cable companies in their respective markets. Finally, we have extended our very strong track record of balancing the long-term needs of the business with significant returns to shareholders. We ended the year in a strong financial position and with a clear strategy for long-term growth.
Our role in society and protection of customer dataTelecommunications technology has a significant positive impact on economic development and individual wellbeing. We remain committed to enhancing the positive social impact of mobile – our networks and services are used to address everything from illiteracy to supporting the local healthcare infrastructure and realising the potential of budding entrepreneurs.
Our technology helps people to connect and share information. In this context data protection is critical. However, this year there have been a number of troubling allegations about the activities of security agencies in accessing customer data. As a trusted communications service provider, we view our customers’ privacy as absolutely key.
As a demonstration of our commitment to transparency in this regard, our latest sustainability report includes a section on law enforcement disclosure. This explains the nature and extent of government powers to order our assistance, together with information about agency and authority demands in countries where statistical data can lawfully be disclosed.
We are dependent on government policies and regulatory frameworks. While this applies to all our operations, it is critical for the development of a globally competitive and healthy telecom industry in Europe. Europe needs to find the right balance between protecting consumer interests and the consumer’s long-term interest in investment in next-generation telecom infrastructure and innovation, that will enable future growth and prosperity for its citizens. So far that balance in our opinion has not been found in the proposals for reform of the digital single market currently under consideration in Brussels.
Alignment with shareholdersOur remuneration policies continue to ensure that management is strongly aligned with shareholders, with a focus on rewarding long-term value creation. After the return of value arising from the sale of our Verizon Wireless stake, Vittorio, and other members of the Executive Committee reinvested a significant proportion of their net proceeds back into Vodafone shares to demonstrate their commitment to the business and the strength of that alignment. The Board continues to consider the ordinary dividend to be the core element of shareholder returns, and believes in a consistent dividend policy. This year we raised the dividend per share by 8%, and as a reflection of our confidence in our future performance, we intend to raise it annually hereafter.
Changes to the Board During the year, Andy Halford informed the Board of his intention to step down as Group CFO. I would like to thank him for his outstanding contribution to Vodafone during his eight year tenure as CFO and in his previous roles. He has brought an invaluable rigour and clarity to our financial reporting and investor communication, while consistently driving significant improvements to our organisational efficiency. I am confident that Nick Read, who joined the Board as CFO on 1 April 2014, will be a worthy successor. During the year there were a number of changes to the non-executive team and these are set out in my Governance statement on page 49. My medium-term ambitions for the composition of the Board are to bring in further marketing expertise, and achieve a greater gender balance. By September we will have three female directors and we will be well on our way to our goal of 25% of Board members being women by 2015.
Gerard KleisterleeChairman
Reflections on the yearIt has been a momentous year for Vodafone and our shareholders. We have completed the second biggest transaction in corporate history, with the sale of our interest in Verizon Wireless; progressed our unified communications strategy with the acquisition of leading cable companies; and delivered the biggest ever return to shareholders, of US$85 billion (£51 billion).
Vodafone Group Plc Annual Report 201402

Financial highlights
Mixed financial performance Our financial performance this year reflects the combination of good performance in emerging markets and challenging conditions in Europe.
Due to changes in our business and accounting standards this year’s report shows two views of our performance – management (how we run our business) and statutory (how we are required to report).
Note:1 Vodafone Italy became a 100% owned subsidiary on 21 February 2014.
Management basis
£43.6bn -1.9%RevenueRevenue decreased by 1.9% and fell by 3.5%* on an organic basis as strong growth in emerging markets was offset by competitive and regulatory pressures and continued macroeconomic weakness in Europe.
17.54p -12.8%Adjusted earnings per shareAdjusted earnings per share was down 12.8% mainly reflecting both lower EBITDA and higher depreciation and amortisation.
29.4% -1.1ppEBITDA marginEBITDA margin fell by 1.1 percentage points. On an organic basis, margin was down 1.3* percentage points as the impact of steep revenue declines in Europe offset improving margins in our AMAP region, most notably in India and Australia.
£7.1bn +13.3%Capital expenditureCash capital expenditure increased by £0.8 billion driven by the acquisition of Kabel Deutschland, the fibre roll-out in Spain, and initial Project Spring investment in India and Germany.
£7.9bn -37.4%Adjusted operating profit (‘AOP’)The reported fall relates mainly to the sale of our interest in Verizon Wireless during the year. On an organic basis, AOP declined by 9.4%*, reflecting the decline in EBITDA and higher depreciation and amortisation.
£4.4bn -21.5%Free cash flowFree cash flow declined by 21.5%, reflecting the fall in EBITDA, increased capital expenditure and the impact of weaker exchange rates in our emerging markets.
Read more 38
Statutory basis
£38.3bn +0.8%RevenueRevenues increased by 0.8% as growth in our AMAP region and from business acquisitions offset revenue declines in Europe.
£59.4bn N/AProfit for the financial year Profit for the financial year increased by £58.8 billion primarily due to a pre-tax gain on disposal of our interest in Verizon Wireless of £45.0 billion and recognition of deferred tax assets of £19.3 billion.
£12.1bn +5.7%Cash generated by operationsCash generated by operations increased by 5.7%, primarily as a result of higher working capital related cash flows.
Read more 97, 103
This annual report contains financial information on both a statutory basis, which under IFRS accounting principles include the financial results of our joint ventures (Vodafone Italy1, Vodafone Hutchison Australia, Vodafone Fiji and Indus Towers) as one line item in the income statement and in a limited number of lines in the statement of cash flows, as well as on a management basis which includes our share of these joint ventures in both these statements on a line-by-line basis.
The discussion of our revenues, EBITDA, adjusted operating profit, free cash flow and capital expenditure below is performed under the management basis, as this is assessed as being the most insightful presentation and is how the Group’s operating performance is reviewed internally by management. The discussion of items of profit and losses under adjusted operating profit is performed on a statutory basis.
See “Non-GAAP information” on page 201 for further information and reconciliations between the management and statutory basis.
Ordinary dividend per shareWe have announced a final dividend per share of 7.47 pence, giving total dividends per share for the year of 11.00 pence – an 8% increase year-on-year.
Vodafone Group Plc Annual Report 2014 03Overview
Strategy review Performance Governance Financials
Additional information

New pic to come
Our year
April Expanding Vodafone RedWe expanded Vodafone Red – our customer proposition offering unlimited calls and texts with generous data allowances – to 14 markets.
By March 2014 we reached 20 markets.
April M-Pesa in IndiaWe launched M-Pesa, our money-transfer service in India. The initial launch included over 8,000 agents in the eastern areas of India, covering around 220 million people, and we have expanded the service nationwide throughout the year.
June Kabel DeutschlandWe announced plans to acquire Kabel Deutschland, Germany’s largest cable operator, for €10.7 billion (£9.1 billion). This helps us create a leading unified communications operator in Germany offering combined fixed and mobile services.
The transaction closed in October 2013.
A year bursting with activity
Vodafone Group Plc Annual Report 201404

August 4GWe launched 4G in two more markets – the UK and the Netherlands. In the UK the service includes Sky Sports or Spotify.
We also launched 4G in Australia, the Czech Republic, Ireland, Malta and Spain during the year.
September Sale of our interest in Verizon WirelessWe announced an agreement to sell our 45% interest in Verizon Wireless to Verizon for US$130 billion (£79 billion). This was the second largest corporate deal in history when it completed on 21 February 2014.
As part of this transaction we increased our ownership of Vodafone Italy from 77% to 100%. See page 14 for more information.
November Project SpringWe announced details of our Project Spring strategy to increase our organic investment over two years to deliver network and service differentiation compared to our competitors.
See page 13 for more information on Project Spring.
Vodafone Group Plc Annual Report 2014 05Overview
Strategy review Performance Governance Financials
Additional information

Our year (continued)
November Vodafone Foundation Instant NetworkTwo Instant Networks, which each pack into four cases, were deployed 24 hours after Typhoon Haiyan, to establish a temporary replacement mobile network where permanent infrastructure was destroyed. In just 29 days, it enabled people to send over 1.4 million texts and make over 443,200 calls.
December M-Pesa “Text to Treatment” programmeThe Vodafone Foundation announced a partnership with Kick4Life in Lesotho, a country where almost 1 in 4 live with HIV/AIDS, to accelerate the number of children being tested and treated for the virus. The initiative aims to get a generation of young people on antiretrovirals via our M-Pesa “Text to Treatment” programme.
January New brand strategy – Vodafone FirstsWe launched our Firsts programme, inspiring people to do something remarkable for the first time using mobile technology. This new global brand engagement strategy will be launching across all our markets in 2014.
Vodafone Group Plc Annual Report 201406
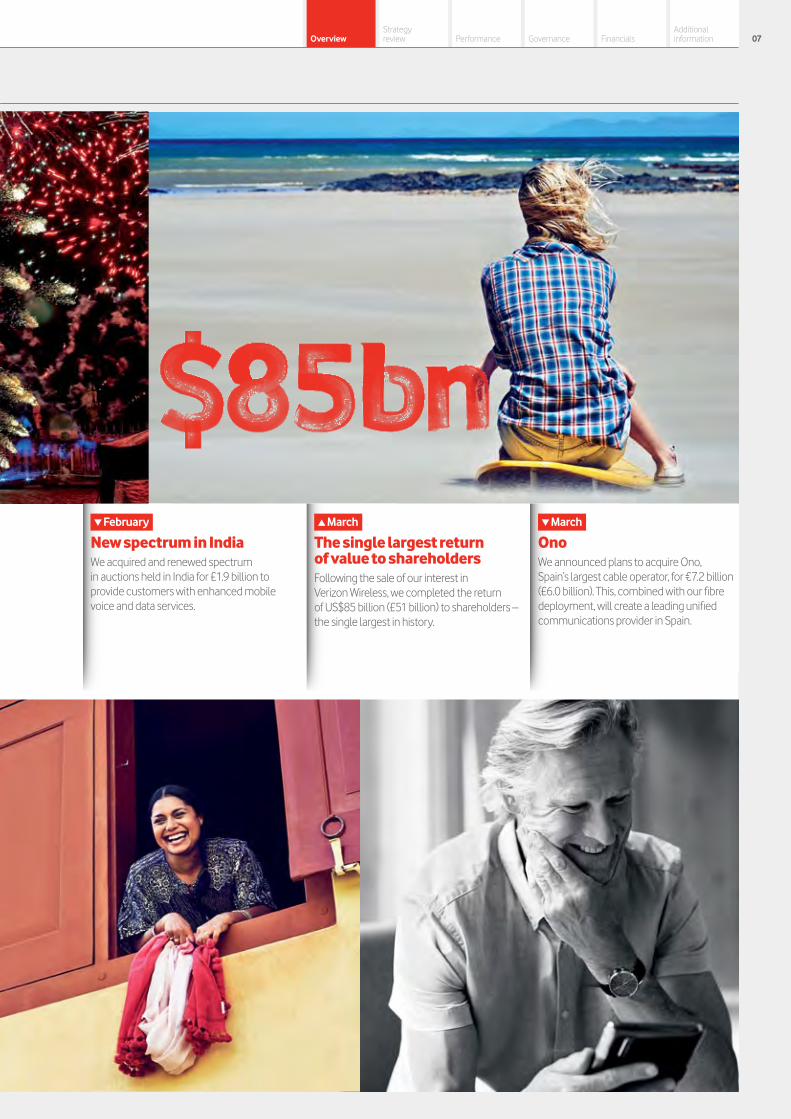
March The single largest return of value to shareholdersFollowing the sale of our interest in Verizon Wireless, we completed the return of US$85 billion (£51 billion) to shareholders – the single largest in history.
March OnoWe announced plans to acquire Ono, Spain’s largest cable operator, for €7.2 billion (£6.0 billion). This, combined with our fibre deployment, will create a leading unified communications provider in Spain.
February New spectrum in IndiaWe acquired and renewed spectrum in auctions held in India for £1.9 billion to provide customers with enhanced mobile voice and data services.
Vodafone Group Plc Annual Report 2014 07Overview
Strategy review Performance Governance Financials
Additional information

Over 1 trillionVoiceWe carried 1.2 trillion minutes of calls over our network last year – that’s the equivalent of everyone around the world talking for two and a half hours.
544 petabytesDataOver 544 petabytes of data were sent across our network last year – that’s enough data for over 100 billion one minute video clips.
337 billionMessagingOur network carried 337 billion text, picture, music and video messages last year.
9.3 millionFixed broadbandWe have 9.3 million fixed broadband customers, mainly in Germany, Spain and Italy.
Other servicesIncludes revenue from mobile virtual network operators (‘MVNOs’) using our network in our markets and from operators outside our footprint using our products and services as part of our partner market network that spans 48 countries.
Breadth of services, scale and global reachWe are one of the world’s largest telecommunications companies providing a wide range of services including voice, messaging, data and fixed broadband. We have 434 million mobile customers and 9 million fixed broadband customers across the globe.
Our business is split across two geographic regions – Europe, and Africa, Middle East and Asia Pacific (‘AMAP’), which includes our emerging markets.
Where we do business
The services we provide
Group service revenue 2014 Other
4%
Mobile
81%
Fixed
15%
Vodafone Group Plc Annual Report 201408

In February 2014 we sold our interest in Verizon Wireless.
Verizon Wireless interest sold
£3.5bnrevenue
13.5m mobile customers (30% prepaid)
28% mobile market share1
10% Fixed % of service revenue
£6.4bnrevenue
19.5m mobile customers (40% prepaid)
25% mobile market share1
26% Fixed % of service revenue
£8.3bnrevenue
32.3m mobile customers (52% prepaid)
34% mobile market share1
30% Fixed % of service revenue
£4.3bnrevenue
27.8m mobile customers (82% prepaid)
33%mobile market share1
15% Fixed % of service revenue
Our international reachGroup revenue 2014
EuropeWe are the number one or two mobile operator in most of our European markets with market shares ranging from around 25% to over 40%. We have a small but growing share in fixed line across Europe, with the acquisition of Kabel Deutschland and proposed acquisition of Ono boosting our positions in Germany and Spain.
AMAPWe are the number one or two mobile operator in most of our AMAP region. Our mobile market shares vary by market from around 20% to over 50%.
Countries
AlbaniaCzech Republic#Germany#Greece#HungaryIreland#Italy#
Malta#Netherlands#Portugal#Romania#Spain#UK#
Countries
AustraliaEgypt#FijiGhana#IndiaKenya (Safaricom)New Zealand#
Qatar#Turkey#Vodacom Group (Democratic Republic of Congo (‘DRC’), Lesotho, Mozambique, South Africa#, and Tanzania)
Europe
£28.0bnAMAP
£15.0bn
Other (includes partner markets and common functions)
£0.6bn
Our main markets
Spain UK Germany
Read more about Verizon Wireless
14
Italy
£4.7bnrevenue
65.4m mobile customers (92% prepaid)
52% mobile market share (South Africa)1
£4.4bnrevenue
166.6m mobile customers (94% prepaid)
22% mobile market share3
IndiaVodacom Group2
Notes:1 Vodafone estimates for the quarter ended 31 March 2014, based
on mobile or total service revenues.2 Fixed service revenue represents less than 1% of service revenue.3 Source: Telecom Regulatory Authority of India, December 2013.
# Markets where we have fixed broadband operations.
n Our marketsn Our partner markets
Vodafone Group Plc Annual Report 2014 09Overview
Strategy review Performance Governance Financials
Additional information

How we do business
Consistent investment rewards our shareholdersOur business model is based on continued high levels of investment to build a superior telecommunications network and customer experience, and to sustain high levels of cash generation with which we can reward shareholders and reinvest in the business – hence creating a virtuous circle of investment, revenue, strong cash conversion and reinvestment.
We take a sustainable approach to the way we do business. The majority of our products and services offer social and economic benefits for our customers, whether through helping them to reduce their environmental footprint or enhancing access to financial services, healthcare and education, particularly in emerging markets.
Assets Customers
Reven
ue
Cash fl ow
Reinvestment
Shareholder returns
Vodafone Group Plc Annual Report 201410

11
AssetsNetworksWe aim to have the best mobile network in each of our markets, combined with competitive fixed networks in our main markets. This means giving our customers far-reaching coverage, a very reliable connection, and increasing speeds and data capacity. We believe that over time, offering a superior network experience will enable us to secure a premium positioning in most of our markets. We combine our ongoing high level of network investment with a commitment to securing the best possible portfolio of spectrum. For more information on our network strategy see page 30.
Distribution and customer serviceWe reach our customers through around 14,500 exclusive branded stores including franchises, a broad network of distribution partners and third party retailers. The Internet, whether accessed through a mobile device or PC, is becoming an increasingly important channel for both sales and after sales service. Our call centres are available 24 hours a day, seven days a week in all our European markets.
Supplier relationshipsIn the last financial year we spent around £16 billion buying equipment, devices and services. Given our large scale and global reach, we tend to be a key strategic partner for many of our suppliers. We work closely with them to build robust networks, develop innovative services and offer the widest range of the latest devices.
PeopleDuring the year we employed an average of nearly 93,000 people. We support, train and encourage our employees, ensuring they have the right capabilities, commitment and enthusiasm to achieve our targets and build on our success in delivering an outstanding experience to all our customers. We are working hard to build a more diverse workforce that is more representative of our customer base. For more information on our people see page 36.
BrandToday, Vodafone is the UK’s most valuable brand with an attributed worth of US$30 billion (Source: 2014 Brand Finance Global 500). The strength of our brand raises the profile of our distribution channels and is a major driver of purchasing decisions for consumers and enterprise customers alike.
CustomersWith 434 million customers globally, we are one of the biggest mobile operators in the world. Over 90% of our mobile customers are individuals and the rest are enterprise customers ranging from large multinationals, to small and medium sized businesses, down to the owner of the local corner shop. The majority and the growing share of our mobile customers are in emerging markets. We also have over nine million fixed broadband customers, and most of these are in Europe – in fact we are the fourth largest provider of fixed broadband services in Western Europe and will become the third following the pending acquisition of Ono in Spain.
RevenueMobile consumers pay for our services either via contracts (typically up to two years in length) or through buying their airtime in advance (prepaid). Enterprise customers often have longer contracts. Fixed customers typically pay via one to two year contracts.
We have a diverse service revenue stream with 51% from mobile services in Europe, 30% from mobile operations in AMAP, 15% from fixed services and the remainder from other items such as MVNO agreements. Within our mobile business, 51% of annual service revenue arises from consumers’ monthly price plans, which we call in-bundled revenue. In-bundled revenue is an increasing proportion of our business and is relatively stable compared to out-of-bundle revenue, which is much more vulnerable to competitive and economic pressure.
Cash flowOur track record of converting revenue into cash flow is strong – with some £16 billion generated over the last three years. We achieve this by operating efficient networks where we seek to minimise costs, thus supporting our gross margin. We also have strong market share positions – as we are typically the first or second largest mobile operator out of three or four in each market. This provides economies of scale and is a key driver of cost efficiencies and EBITDA margin, which in turn provides healthy cash flow. See page 32 for more details of our plans to improve our operating efficiency.
Shareholder returnsThe cash generated from operations allows us to sustain a generous shareholder returns programme while also investing in the future prosperity of the business – with almost £23 billion returned to shareholders over the last three years, excluding the Verizon Wireless return of value. With our strong financial foundation, and as a sign of our confidence in our future performance, we intend to grow the annual dividend per share each year going forward.
ReinvestmentWe have maintained a high and consistent level of capex in recent years, to support wider coverage, higher speeds and greater capacity in our networks. Through our IT investment we are enhancing our customer relationship capability and providing new customer billing services. In addition, we have continued to invest in our stores, our internet and social media presence and spectrum licences to support future services and growth.
To boost our investment even more we started Project Spring, our organic investment programme, which aims to accelerate and extend our current strategy, and thereby strengthen further our network and service differentiation. We expect total investments, including Project Spring, to be around £19 billion over the next two years. See page 13 for more details.
Want to find out more?Network
30Operations
32Our people
36 Financial review, including revenue, cash flow and shareholder returns
38
Risk management and mitigation
46
Vodafone Group Plc Annual Report 2014 11Overview
Strategy review Performance Governance Financials
Additional information

Chief Executive’s review
A defining year for the Group…Our emerging markets are performing well, although our mature European markets continue to face challenging conditions. However, we have continued to make good progress in delivering our long-term strategy, by building firm foundations for the future with our substantial investments in Vodafone Red, Project Spring and unified communications.
Review of the yearIt has been a year of substantial strategic progress. The sale of our Verizon Wireless stake has rewarded shareholders for their support, and enabled the acceleration of our strategy through the acquisition of Kabel Deutschland, the pending acquisition of Ono and our Project Spring investment programme.
Our operational performance has been mixed. The Group’s emerging markets businesses have performed strongly throughout the year: we have executed our strategy well and have successfully positioned ourselves for the rapid growth in data we are now witnessing. In Europe, where we continue to face competitive, regulatory and macroeconomic pressures, we have taken steps to improve our commercial performance, particularly in Germany and Italy, and are beginning to see encouraging early signs.
Verizon Wireless transactionThe sale of our 45% interest in Verizon Wireless, the leading mobile operator in the United States, was the culmination of a highly successful 14 year investment which began when Verizon and Vodafone entered into a partnership to create Verizon Wireless in 2000.
We had been very happy to stay invested in the business over the years, despite our minority position, because of the strong growth and returns generated, and the attractiveness of the US market. However, the Board viewed the offer of US$130 billion as a very attractive price at which to exit. The completion of the transaction enabled us to return a record US$85 billion to our shareholders, while retaining ample financial flexibility to pursue our own strategy both organically and through targeted acquisitions. See page 14 for more information.
Strategic progressWe have made very substantial progress on our strategy in the past year, despite the significant challenges faced in Europe. With the acquisition of Kabel Deutschland in Germany and the planned purchase of Ono in Spain, our continued fibre build in Portugal and Spain, and our fibre plans in Italy, allied to last year’s acquisition of Cable & Wireless Worldwide in the UK, we are becoming a leader in unified communications across Europe. This enables us to access a large and growing fixed revenue pool where our market share is currently much lower than in mobile, while also helping us defend our mobile business from converged offers.
We continue to provide a market-leading network experience in most of our markets, and now have 4.7 million 4G customers across 14 countries – all our major European markets, as well as South Africa, Australia and New Zealand. Early experience from 4G shows us that customers use roughly twice as much data compared to 3G data usage, driven principally by video streaming.
Smartphone adoption continues to grow strongly in all markets and the increased availability of mobile applications and low cost devices is driving significant growth in data usage. Data traffic in India increased by 125% year-on-year, and at the end of the year we had 52 million data customers in India alone, with seven million of these being 3G data customers. Data adoption is becoming truly mass market.
Our Vodafone Red plans are now available in 20 markets, with 12 million customers at the year end. The footprint of our money transfer service, M-Pesa, continues to grow and we expanded the service with launches in the year in India, Egypt, Mozambique, Lesotho, and our first European market – Romania. In India the service is now nationwide.
Enterprise now represents 27% of Group service revenue. The creation of a discrete Enterprise unit is also beginning to bear fruit, as we focus on a smaller number of products with the potential for global application. Our strategic focus areas – Vodafone Global Enterprise, serving our biggest multi-national accounts and our machine-to-machine unit, where we are a global leader, delivered further growth. We continue to develop Vodafone One Net to provide converged services for small- and medium-sized companies.
Vodafone Group Plc Annual Report 2014Vodafone Group Plc Annual Report 20141212

Where we aim to be five years from now
Project SpringProject Spring is our organic investment programme which will allow us to accelerate and extend our strategic priorities through investment in mobile and fixed networks, products and services, and our retail platform. Announced alongside the Verizon transaction in September 2013, Project Spring will strengthen further our network and service differentiation. The transition to 4G and unified communications, coupled with an improved economic outlook for Europe, lead us to believe Vodafone has a unique opportunity to invest now.
We expect total investments, including Project Spring, to be around £19 billion over the next two years. The main elements of our investment are:
4G in Europe: we aim to reach 91% population coverage by March 2016;
3G in emerging markets: with 95% population coverage in targeted urban areas in India by March 2016;
next-generation fixed line infrastructure: laying fibre to more base stations and deep into residential areas across Europe and in selected emerging market urban areas;
development of enterprise products and services: extending our M2M reach to 75 countries and rolling out hosting and IP-VPN services internationally; and
investment in our retail estate: modernising 8,000 of our stores to improve the customer experience.
OutlookIn the short term, we continue to face competitive, macroeconomic and regulatory pressures, particularly in Europe, and still need to secure our recovery in some key markets. While we are therefore heavily focused on the successful execution of our significant capital investment programme, we are also absolutely committed to operational efficiency and standard operating models across all markets. We anticipate that our investments will begin to translate into clearly improved network performance and customer satisfaction in the coming year. In the medium term, this will become more evident in key operational metrics such as churn and average revenue per user (‘ARPU’); and subsequently into revenue, profitability and cash flow.
I am confident about the future of the business given the growth prospects in data, emerging markets, enterprise and unified communications. We have commenced our Project Spring two-year investment programme which will accelerate our plans to establish stronger network and service differentiation for our customers. I expect the first signs of this to become evident later this year, with wider 4G coverage in Europe and 3G coverage in emerging markets, improved network performance and increased customer advocacy. While cash flow will be depressed during this investment phase, our intention to continue to grow dividends per share annually demonstrates our confidence in strong future cash flow generation.
Vittorio Colao Chief Executive
Want to find out more?Market overview, and where are we going?
18
Our strategy and positioning for the future
21
Our financial guidance
39
Read more about our strategy
21
Project Spring accelerates and extends our strategic priorities through investment in mobile and fixed networks, products
and services and our retail platform, to strengthen further our network and service differentiation.
Supported by:
An excellent network experience A simplified and cost-efficient business model and operations
Consumer Europe
A leading mobile data provider
Unified Communications
Converged services in all key European markets
Consumer Emerging Markets
A strong leader and first choice for data
Enterprise
Major enterprise provider with full service offering
Vodafone Group Plc Annual Report 2014Vodafone Group Plc Annual Report 2014 13Overview
Strategy review Performance Governance Financials
Additional information
A big deal! This was the second biggest transaction ever and the return of US$85 billion (£51 billion) is the equivalent of around 90% of the total dividends paid by all the other FTSE 100 companies in the whole of 2013.
Vodafone ItalyAs part of the transaction we also agreed to acquire Verizon’s 23% stake in Vodafone Italy, in which we owned 77%, thereby securing full ownership.
Crystallising value from Verizon Wireless
Opening the next chapter in the history of VodafoneOn 2 September 2013, we announced our agreement with Verizon to sell our US group, whose principal asset was its 45% interest in Verizon Wireless, for US$130 billion, mainly in cash and Verizon shares. We chose to return around 71% of the net proceeds to shareholders amounting to around US$85 billion. This is the largest ever single return to shareholders in history and rewards our shareholders for their long-term support of our US strategy. This also represents the opening of an important new chapter in our history by leaving us in a strong financial position and well positioned to execute our strategy.
Vodafone Group Plc Annual Report 2014Vodafone Group Plc Annual Report 20141414

Why sell our stake? We have had a very successful 14 year investment in Verizon Wireless. During this time its service revenue has quadrupled to US$69 billion, its EBITDA has grown from US$6 billion in 2001 to US$34 billion in 2013, and we received nearly US$16 billion of income dividends. This investment has clearly created a great deal of value for Vodafone shareholders. The sale not only crystallised the value of this significant asset, it has also enabled us to realise that value at a very attractive price, representing around nine times Verizon Wireless EBITDA and 13 times operational cash flow.
What will the sale enable us to do? We carefully considered how to make best use of the sale proceeds and we decided to retain a proportion of the cash received to allow us to invest in the business and to reduce net debt, and we returned US$85 billion to shareholders.
Project Spring, our new investment programme, will improve the quality of our networks, products and services in our major markets, relative to our competitors. Project Spring is in addition to our existing capital expenditure programme and will bring total investment over the next two years to around £19 billion.
This will amount to the largest and fastest period of investment in our history. We have used the retained proceeds to reduce our net debt significantly and as a result the Company is much more resilient going forwards.
What’s the shareholder return?We have a track record of making significant returns to shareholders – with almost £23 billion returned in the last three years alone in the form of dividends and share buybacks. Consistent with that track record, we also returned a large proportion of the net proceeds from the sale of our interest in Verizon Wireless – 71% or US$85 billion (£51 billion) comprising £37 billion worth of Verizon shares and £14 billion of cash, during the year. As part of the transaction, we also consolidated our shares – exchanging every eleven old Vodafone shares for six new Vodafone shares.
Overall, we believe we have struck the right balance between investing in the future of the Company and rewarding our shareholders for their long-term support of our US strategy. Following the sale we have reduced debt and established a bigger gap between our cash flow and ordinary dividends paid. As a result, and as a sign of confidence in the future, we intend to continue to grow the dividend per share annually going forward.
Vodafone Group Plc Annual Report 2014Vodafone Group Plc Annual Report 2014 15Overview
Strategy review Performance Governance Financials
Additional information
Key performance indicators
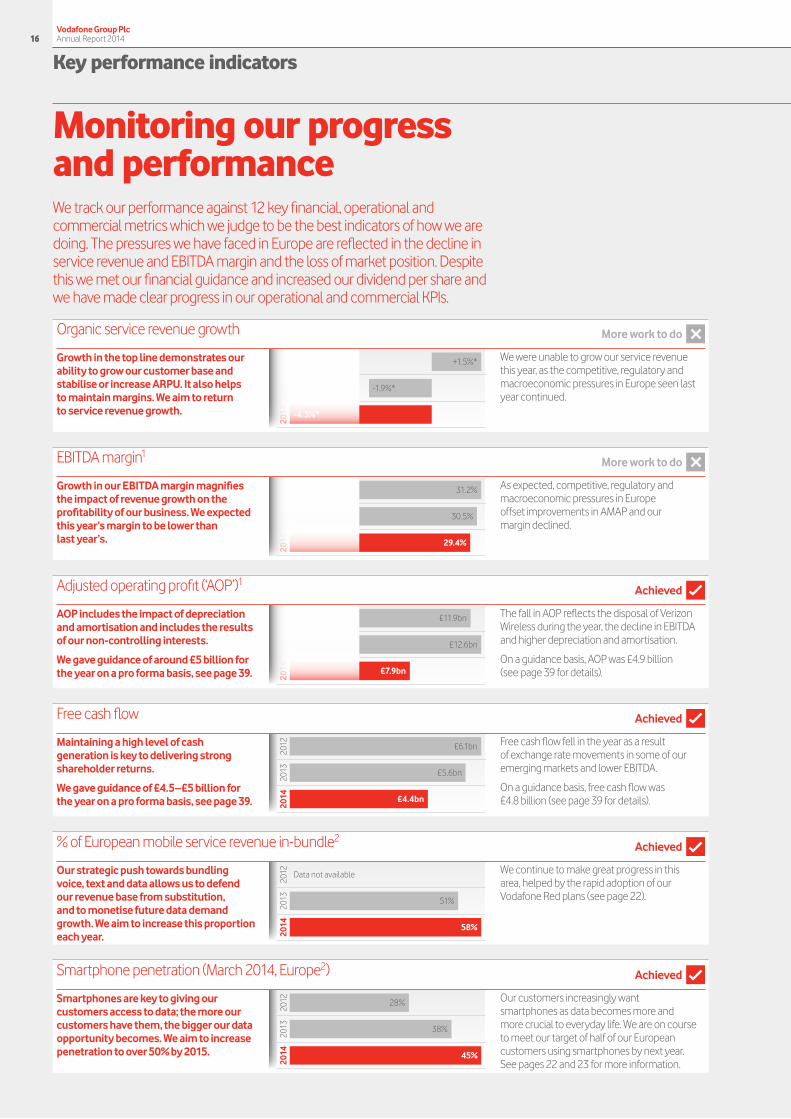
Monitoring our progress and performanceWe track our performance against 12 key financial, operational and commercial metrics which we judge to be the best indicators of how we are doing. The pressures we have faced in Europe are reflected in the decline in service revenue and EBITDA margin and the loss of market position. Despite this we met our financial guidance and increased our dividend per share and we have made clear progress in our operational and commercial KPIs.
Growth in the top line demonstrates our ability to grow our customer base and stabilise or increase ARPU. It also helps to maintain margins. We aim to return to service revenue growth.
Growth in our EBITDA margin magnifies the impact of revenue growth on the profitability of our business. We expected this year’s margin to be lower than last year’s.
AOP includes the impact of depreciation and amortisation and includes the results of our non-controlling interests.
We gave guidance of around £5 billion for the year on a pro forma basis, see page 39.
Maintaining a high level of cash generation is key to delivering strong shareholder returns.
We gave guidance of £4.5–£5 billion for the year on a pro forma basis, see page 39.
Our strategic push towards bundling voice, text and data allows us to defend our revenue base from substitution, and to monetise future data demand growth. We aim to increase this proportion each year.
Smartphones are key to giving our customers access to data; the more our customers have them, the bigger our data opportunity becomes. We aim to increase penetration to over 50% by 2015.
More work to do
Achieved
Achieved
Achieved
Achieved
2012
2013
2014
£6.1bn
£5.6bn
£4.4bn
2012
2013
2014
Data not available
51%
58%
2012
2013
2014
28%
38%
45%
2012
2013
2014
+1.5%*
-1.9%*
-4.3%*
2012
2013
2014
31.2%
30.5%
29.4%
2012
2013
2014
£11.9bn
£12.6bn
£7.9bn
More work to do
Organic service revenue growth
We were unable to grow our service revenue this year, as the competitive, regulatory and macroeconomic pressures in Europe seen last year continued.
As expected, competitive, regulatory and macroeconomic pressures in Europe offset improvements in AMAP and our margin declined.
The fall in AOP reflects the disposal of Verizon Wireless during the year, the decline in EBITDA and higher depreciation and amortisation.
On a guidance basis, AOP was £4.9 billion (see page 39 for details).
Free cash flow fell in the year as a result of exchange rate movements in some of our emerging markets and lower EBITDA.
On a guidance basis, free cash flow was £4.8 billion (see page 39 for details).
We continue to make great progress in this area, helped by the rapid adoption of our Vodafone Red plans (see page 22).
Our customers increasingly want smartphones as data becomes more and more crucial to everyday life. We are on course to meet our target of half of our European customers using smartphones by next year. See pages 22 and 23 for more information.
EBITDA margin1
Adjusted operating profit (‘AOP’)1
Free cash flow
% of European mobile service revenue in-bundle2
Smartphone penetration (March 2014, Europe2)
Vodafone Group Plc Annual Report 2014Vodafone Group Plc Annual Report 20141616

We continuously improve the speed of our European network to create the best data experience for our customers and had a target of 75% of smartphone data sessions to be at least 3Mbps by 2015.
We track our relative performance by measuring the change in our revenue market share against our key competitors. We aim to gain or hold revenue market share in most of our markets.
The ordinary dividend remains the primary method of shareholder return and we have an outstanding record of growth here.
Our target was to maintain the dividend per share at its 2013 level.
We use NPS to measure the extent to which our customers would recommend us to friends and family. We aim to increase or maintain the number of markets where we are ranked number one by NPS.
The employee engagement score measures employees’ level of engagement – a combination of pride, loyalty and motivation. Our goal here is to retain our top quartile position.
Diversity increases the range of skills and styles in our senior leadership team, our 223 most senior managers. Increased female representation is one measure of diversity. Our goal is simple, to increase the proportion each year.
Achieved
More work to do
Achieved
Achieved
Achieved
KPIs achieved
2012
2013
2014
75% at least 400Kbps
75% at least 1Mbps
75% at least 3Mbps
2012
2013
2014
11 out of 17 markets
9 out of 17 markets
7 out of 17 markets
2012
2013
2014
9.52p
10.19p
11.00p
2012
2013
2014
77
78
77
2012
2013
2014
11 out of 21 markets
8 out of 21 markets
9 out of 21 markets
2012
2013
2014
19%
20%
22%
Achieved
Notes: 1 EBITDA and AOP have been redefined to exclude restructuring costs. AOP has also be redefined to exclude amortisation of customer bases and brand intangible assets. Comparatives have been restated. 2 Europe now excludes Turkey.
Mobile network performance floor (Europe2)
We achieved our 2015 target this year. Our new target is for 90% of data sessions in Europe to be at least 3Mbps by March 2016. See page 30 for more detail on our Network strategy.
We lost share in the majority of our European markets over the year but gained share in some of our key emerging markets, including India, South Africa and Turkey.
The Verizon Wireless transaction enabled us to increase the dividend per share by 8% to 11.00 pence and we now expect to increase it annually.
This year we increased the number of markets where we are ranked number one but the total of nine markets remains too low. We aim to improve our position over the coming year.
Our employee engagement score remains broadly stable and we retained a top quartile position. More information can be found on page 36.
Gender diversity is a key area of our global diversity strategy and we have continued to make progress in this area. We also increased the number of women on both the Executive Committee and the Board. See page 36 for more details.
Relative mobile market share performance
Ordinary dividend per share
Consumer net promoter score (‘NPS’)
Employee engagement
% of women in the senior leadership team
Want to find out more?All KPIs are shown on a management basis
03
See how these targets are used with the incentive plans for senior management
69
Vodafone Group Plc Annual Report 2014Vodafone Group Plc Annual Report 2014 17Overview
Strategy review Performance Governance Financials
Additional information
Market overview
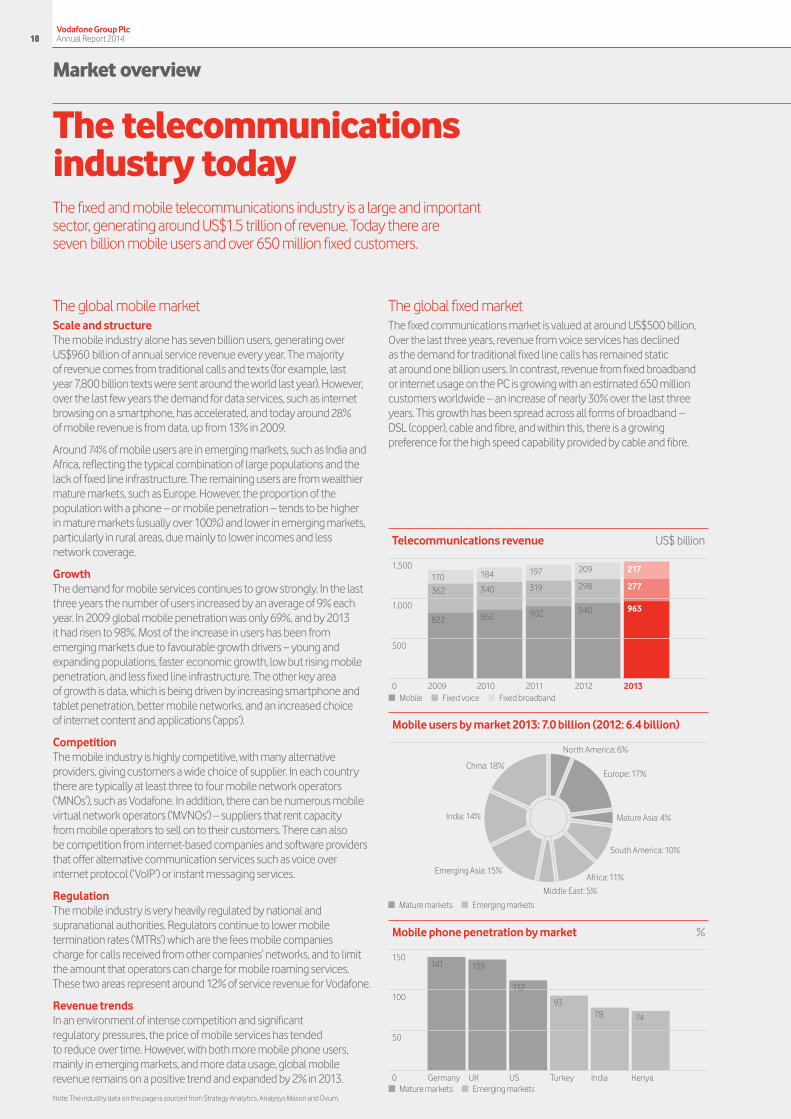
Mobile users by market 2013: 7.0 billion (2012: 6.4 billion)
Europe: 17%
North America: 6%
Mature Asia: 4%
Middle East: 5%
South America: 10%
Africa: 11%Emerging Asia: 15%
India: 14%
China: 18%
n Mature markets n Emerging markets
n Mature markets n Emerging markets
n Mobile n Fixed voice n Fixed broadband
Germany
141
UK US Turkey India Kenya
138
112
9378 74
0
50
100
150
Mobile phone penetration by market %
The telecommunications industry todayThe fixed and mobile telecommunications industry is a large and important sector, generating around US$1.5 trillion of revenue. Today there are seven billion mobile users and over 650 million fixed customers.
The global mobile marketScale and structureThe mobile industry alone has seven billion users, generating over US$960 billion of annual service revenue every year. The majority of revenue comes from traditional calls and texts (for example, last year 7,800 billion texts were sent around the world last year). However, over the last few years the demand for data services, such as internet browsing on a smartphone, has accelerated, and today around 28% of mobile revenue is from data, up from 13% in 2009.
Around 74% of mobile users are in emerging markets, such as India and Africa, reflecting the typical combination of large populations and the lack of fixed line infrastructure. The remaining users are from wealthier mature markets, such as Europe. However, the proportion of the population with a phone – or mobile penetration – tends to be higher in mature markets (usually over 100%) and lower in emerging markets, particularly in rural areas, due mainly to lower incomes and less network coverage.
GrowthThe demand for mobile services continues to grow strongly. In the last three years the number of users increased by an average of 9% each year. In 2009 global mobile penetration was only 69%, and by 2013 it had risen to 98%. Most of the increase in users has been from emerging markets due to favourable growth drivers – young and expanding populations, faster economic growth, low but rising mobile penetration, and less fixed line infrastructure. The other key area of growth is data, which is being driven by increasing smartphone and tablet penetration, better mobile networks, and an increased choice of internet content and applications (‘apps’).
CompetitionThe mobile industry is highly competitive, with many alternative providers, giving customers a wide choice of supplier. In each country there are typically at least three to four mobile network operators (‘MNOs’), such as Vodafone. In addition, there can be numerous mobile virtual network operators (‘MVNOs’) – suppliers that rent capacity from mobile operators to sell on to their customers. There can also be competition from internet-based companies and software providers that offer alternative communication services such as voice over internet protocol (‘VoIP’) or instant messaging services.
RegulationThe mobile industry is very heavily regulated by national and supranational authorities. Regulators continue to lower mobile termination rates (‘MTRs’) which are the fees mobile companies charge for calls received from other companies’ networks, and to limit the amount that operators can charge for mobile roaming services. These two areas represent around 12% of service revenue for Vodafone.
Revenue trendsIn an environment of intense competition and significant regulatory pressures, the price of mobile services has tended to reduce over time. However, with both more mobile phone users, mainly in emerging markets, and more data usage, global mobile revenue remains on a positive trend and expanded by 2% in 2013.
The global fixed marketThe fixed communications market is valued at around US$500 billion. Over the last three years, revenue from voice services has declined as the demand for traditional fixed line calls has remained static at around one billion users. In contrast, revenue from fixed broadband or internet usage on the PC is growing with an estimated 650 million customers worldwide – an increase of nearly 30% over the last three years. This growth has been spread across all forms of broadband – DSL (copper), cable and fibre, and within this, there is a growing preference for the high speed capability provided by cable and fibre.
Note: The industry data on this page is sourced from Strategy Analytics, Analysys Mason and Ovum.
2009
822
362
170
862
340
184
902
319
197
940
298
209
963
277
217
2010 2011 2012 20130
500
1,000
1,500
Telecommunications revenue US$ billion
Vodafone Group Plc Annual Report 2014Vodafone Group Plc Annual Report 20141818

Supporting access to mobile
Overcoming barriers to mobile ownership for women in emerging markets Our Connected Women report looked at the gender gap in mobile phone ownership in emerging economies and the social and economic impact of extending women’s access to mobile phones.
Vodafone Turkey launched the Vodafone Women First programme in 2013, which combines promotional offers with services that help women to increase their income, use mobile technology and acquire new skills. Launched in 2013, it attracted 75,000 women customers in its first nine months, of which 15% were new customers for Vodafone.
Want to find out more?See sustainable business
34 See the full Connected Women report
vodafone.com/connectedwomen
Vodafone Group Plc Annual Report 2014Vodafone Group Plc Annual Report 2014 19Overview
Strategy review Performance Governance Financials
Additional information
Market overview (continued)
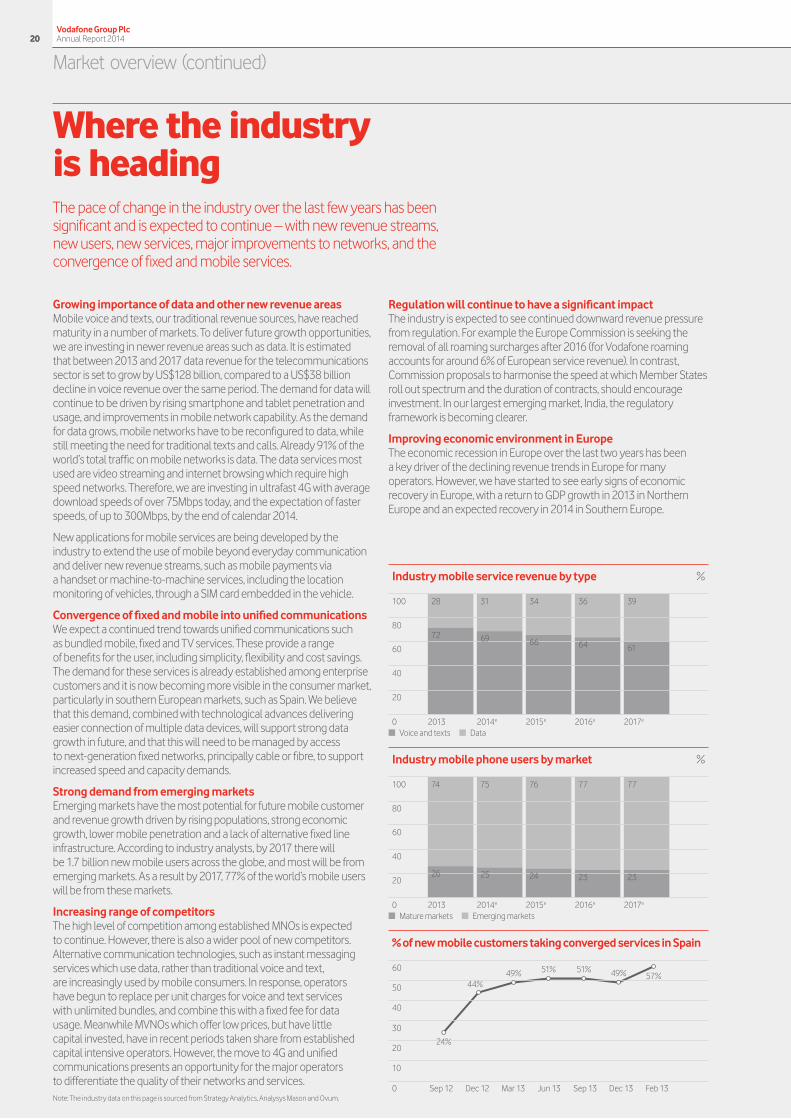
Growing importance of data and other new revenue areasMobile voice and texts, our traditional revenue sources, have reached maturity in a number of markets. To deliver future growth opportunities, we are investing in newer revenue areas such as data. It is estimated that between 2013 and 2017 data revenue for the telecommunications sector is set to grow by US$128 billion, compared to a US$38 billion decline in voice revenue over the same period. The demand for data will continue to be driven by rising smartphone and tablet penetration and usage, and improvements in mobile network capability. As the demand for data grows, mobile networks have to be reconfigured to data, while still meeting the need for traditional texts and calls. Already 91% of the world’s total traffic on mobile networks is data. The data services most used are video streaming and internet browsing which require high speed networks. Therefore, we are investing in ultrafast 4G with average download speeds of over 75Mbps today, and the expectation of faster speeds, of up to 300Mbps, by the end of calendar 2014.
New applications for mobile services are being developed by the industry to extend the use of mobile beyond everyday communication and deliver new revenue streams, such as mobile payments via a handset or machine-to-machine services, including the location monitoring of vehicles, through a SIM card embedded in the vehicle.
Convergence of fixed and mobile into unified communicationsWe expect a continued trend towards unified communications such as bundled mobile, fixed and TV services. These provide a range of benefits for the user, including simplicity, flexibility and cost savings. The demand for these services is already established among enterprise customers and it is now becoming more visible in the consumer market, particularly in southern European markets, such as Spain. We believe that this demand, combined with technological advances delivering easier connection of multiple data devices, will support strong data growth in future, and that this will need to be managed by access to next-generation fixed networks, principally cable or fibre, to support increased speed and capacity demands.
Strong demand from emerging marketsEmerging markets have the most potential for future mobile customer and revenue growth driven by rising populations, strong economic growth, lower mobile penetration and a lack of alternative fixed line infrastructure. According to industry analysts, by 2017 there will be 1.7 billion new mobile users across the globe, and most will be from emerging markets. As a result by 2017, 77% of the world’s mobile users will be from these markets.
Increasing range of competitorsThe high level of competition among established MNOs is expected to continue. However, there is also a wider pool of new competitors. Alternative communication technologies, such as instant messaging services which use data, rather than traditional voice and text, are increasingly used by mobile consumers. In response, operators have begun to replace per unit charges for voice and text services with unlimited bundles, and combine this with a fixed fee for data usage. Meanwhile MVNOs which offer low prices, but have little capital invested, have in recent periods taken share from established capital intensive operators. However, the move to 4G and unified communications presents an opportunity for the major operators to differentiate the quality of their networks and services.
Regulation will continue to have a significant impactThe industry is expected to see continued downward revenue pressure from regulation. For example the Europe Commission is seeking the removal of all roaming surcharges after 2016 (for Vodafone roaming accounts for around 6% of European service revenue). In contrast, Commission proposals to harmonise the speed at which Member States roll out spectrum and the duration of contracts, should encourage investment. In our largest emerging market, India, the regulatory framework is becoming clearer.
Improving economic environment in EuropeThe economic recession in Europe over the last two years has been a key driver of the declining revenue trends in Europe for many operators. However, we have started to see early signs of economic recovery in Europe, with a return to GDP growth in 2013 in Northern Europe and an expected recovery in 2014 in Southern Europe.
Where the industry is headingThe pace of change in the industry over the last few years has been significant and is expected to continue – with new revenue streams, new users, new services, major improvements to networks, and the convergence of fixed and mobile services.
Note: The industry data on this page is sourced from Strategy Analytics, Analysys Mason and Ovum.Sep 12
24%
Dec 12 Mar 13 Jun 13 Sep 13 Dec 13 Feb 130
20
10
30
40
50
60
% of new mobile customers taking converged services in Spain
44%49% 51% 51% 49% 57%
2013
72 69 66 64 61
28 31 34 36 39
2014e 2015e 2016e 2017e0
20
40
60
80
100
Industry mobile service revenue by type %
2013
26 25 24 23 23
74 75 76 77 77
2014e 2015e 2016e 2017e0
20
40
60
80
100
Industry mobile phone users by market %
n Voice and texts n Data
n Mature markets n Emerging markets
Vodafone Group Plc Annual Report 2014Vodafone Group Plc Annual Report 20142020

Our strategy
Our strategy is shaped by the following industry trends:
Read more: Consumer Europe
22
Unified Communications
24
Consumer Emerging Markets
26
Enterprise
28
Network
30
Operations
32
What we want to achieve for our customers:
Always best connected Best mobile voice and data (coverage and quality) – 4G/3G
Competitive in fixed and best converged experience
Unmatched customer experience Number one in customer experience – in store, online, on the phone
Consistent execution across markets
Integrated worry-free solutions Simplest connectivity and price plans
Converged enterprise product suite
Innovator in new services, such as mobile payments
Project Spring accelerates and extends our strategic priorities through investment in mobile and fixed networks, products
and services, and our retail platform, to strengthen further our network and service differentiation.
In light of these expected industry trends our strategic goals are focused on four key growth areas and targets:
Supported by:
An excellent network experience A simplified and cost-efficient business model and operations
Consumer Europe
A leading mobile data provider
Unified Communications
Converged services in all key European markets
Consumer Emerging Markets
A strong leader and first choice for data
Enterprise
Major enterprise provider with full service offering
Growing importance of data and other new revenue areas
Increasing demand for unified communications for both enterprises and consumers
Strong demand from emerging markets
Increasing range of competitors
Improving economic environment in Europe
Accelerating our strategyAs the demand for ubiquitous data grows rapidly, we are transforming our business to become a leading unified communications company, and to strengthen further our network and service differentiation against our peers.
Vodafone Group Plc Annual Report 2014Vodafone Group Plc Annual Report 2014 21Overview
Strategy review Performance Governance Financials
Additional information

Our strategy (continued)
Consumer Europe While voice and messaging remain important for European consumers, demand for data is rapidly accelerating. We are focused on providing the best data experience – both in mobile and fixed – matched by outstanding customer service combined with a range of worry-free price plans and additional services.
Vodafone Red enabling worry-free usageVodafone Red offers unlimited calls and texts with generous data allowances – enabling our customers to use their smartphones worry-free. We already have 12 million users across 20 markets and 37% of new contract customers join on Red plans. Our research shows that Red customers are more likely to recommend us to their friends and family and we are seeing early signs that they are less likely to leave us for another operator. Red also helps us protect our revenue, with 58% of our European mobile service revenue now in-bundle compared to 51% a year ago, and it reduces the risk to our business from over‑the‑top services.
We have launched Red family plans, with 0.8 million customers, and have combined Red plans with fixed broadband in some markets.
Simple, worry-free roaming offerAs people travel they want to use their phones and “roam” abroad, therefore we developed an offer that lets customers use their home allowance for a small daily fee, removing any worries about their bills.
These plans are now available in 15 markets and 14 million customers have registered to use these services, accounting for 26% of consumer contract roamers. Customers on these offers use their phone more and generate higher roaming ARPUs than those on standard tariffs.
Delivering an unmatched customer experienceWe are modernising around 8,000 of our stores to a new format that enables customers to interact with us in a more engaging way and these stores have been seen to increase transactions by more than 5%. We have already upgraded over 1,100 stores and Project Spring will accelerate our plans to modernise the remaining stores by March 2016.
We are also upgrading our customer service, with all of our call centres across Europe now offering “24/7” service and we have expanded our “self-care” solutions online and on mobile.
4G driving increased data usage and engagementAlthough most of our customers are using 2G and 3G services, we are seeing increased demand for 4G services, with 4.7 million customers across 14 markets. 4G is attractive because it offers much faster speeds and a better user experience and as a result our 4G customers use on average twice as much data as our 3G users.
By adding attractive content such as music and sport packages with 4G plans we believe we can drive growth in both data usage and revenue. In the UK for example, 4G plans are generating 18% more ARPU versus comparable 3G plans and customers are using 2.3 times more data.
Mobile devices driving data adoptionThe growing popularity of smartphones is supporting data adoption, accounting for 78% of the handsets we sold in Europe last year. This has helped European smartphone penetration grow to 45%.
We sold 2.2 million Vodafone branded smartphones in Europe and beyond during the year, instrumental in stimulating data adoption in low-end contract and prepaid segments.
Fixed and unified communicationsConsumers increasingly want unified communications as they benefit from one plan that includes their fixed and mobile connections and in some cases TV package as well. We already have over 8.5 million fixed broadband customers in Europe and we are increasingly offering mobile and fixed services together. We expect unified communications to become more and more important over time – see page 24 for details on our strategy.
Innovating in mobile paymentsAs part of our drive for innovation we are developing services which allow our customers to use their smartphones to pay for goods and services, using our secure network. During the year we launched Vodafone Wallet in Germany and Spain.
Context a Nearly half our European customers now use a smartphone, with more and more also using tablets.
a The average data usage per customer is also increasing rapidly.
a Customers want simplicity and worry-free bills and they demand the best in customer service.
a The bundling of fixed and mobile products for residential customers is becoming increasingly common across Europe and we expect this trend to continue.
a Aggressive price competition continues in many of our markets.
Where we are going a We are enabling worry-free usage through our Red and roaming plans.
a We are improving our customer experience across all contact points.
a We are pushing the adoption of smartphones and are encouraging our customers to use more and more data.
a We are becoming a leading unified communications provider across Europe.
a We are innovating in mobile payments.
Vodafone Group Plc Annual Report 2014Vodafone Group Plc Annual Report 20142222

Transforming the retail experienceWe are updating our stores into a common and consistent store concept. Each of our transformed stores now have a simple design allowing each store to run different promotions and host a “top 10” table with live devices, on-site “Tech Expert” support who can transfer customers’ data from their old phones to their new ones. At the same time we are retraining our staff to better serve customers.
An easier way to pay“Contactless” payments are becoming an increasingly popular way to pay for small value transactions. We have created the Vodafone Wallet to leverage this opportunity, which allows you to pay for anything with your phone. It digitises everything in your wallet: payment cards, loyalty cards, tickets or coupons. We launched the first commercial wallet in Spain, ahead of our competitors and built the first mobile wallet in Europe, based entirely on industry standards.
The average data usage on a smartphone is now around 500MB per month compared to around 350MB a year ago1
Extending our reach through partner marketsThrough relationships with other mobile operators around the world we have extended our reach to a further 48 countries stretching from Chile to Russia, Iceland to Brazil. These markets extend our mobile reach beyond our own mobile operations and support the global access to our services which our customers have come to expect from us.
Note:1 Android and iOS devices.
2012 2013 2014
28
38
45
0
15
30
45
European smartphone penetration %
2012 2013 2014
data not available
51
58
0
20
40
60
% of European mobile service revenue in-bundle %
Vodafone Group Plc Annual Report 2014Vodafone Group Plc Annual Report 2014 23Overview
Strategy review Performance Governance Financials
Additional information
Making good progress on unified communications strategy
Our strategy (continued)
Unified CommunicationsOur roots are in mobile services, and these still represent the majority of our revenues. However, more and more businesses and individual consumers are seeking unified communications, or converged fixed and mobile services, and we are changing the shape of our Company to meet this demand.
What is unified communications? As customer demand for ubiquitous data and content grows rapidly over the coming years, the most successful communications providers will be the ones who can provide seamless high speed connectivity at home, at work, at play and anywhere in between. This will require the integration of multiple technologies – 3G, 4G, WiFi, cable and fibre – into a single meshed network offering the best, uninterrupted experience – what we call “unified communications”.
Unified communications for enterpriseCombined fixed and mobile services have been a feature of the enterprise market, particularly for small- and medium-sized companies, for several years. We have been a market leader with products such as Vodafone One Net, which provides integrated fixed and mobile services which create significant business efficiencies for customers. This year we have evolved One Net as an application that can also serve the needs of larger national corporates as well.
With the acquisition of Cable & Wireless Worldwide in 2012, we have made a step change in our ability to offer unified communications services to customers in the UK and gained an extensive international footprint. After successfully integrating sales forces this year, we are now beginning to build a strong pipeline of new business.
Unified communications for consumersOver the last few years, we have seen a significant move towards bundling of fixed and mobile products for residential customers, often including television in the package as well. Of our markets, Spain and Portugal are the most advanced in this regard, but we expect it to become prevalent in all our major European markets. This presents us with a clear opportunity, as our share of fixed services in our European markets is under 10%, whereas our share of the mobile market is well over 25%. In addition, mobile customer churn is typically three times higher than that of customers taking combined fixed and mobile services.
However, unified communications is also a threat, particularly in the residential market, as historically we have not owned or had access to next‑generation fixed line infrastructure such as fibre or cable. This could allow cable operators with MVNO platforms, or integrated fixed and mobile incumbents, to take share in the market with aggressively discounted offers.
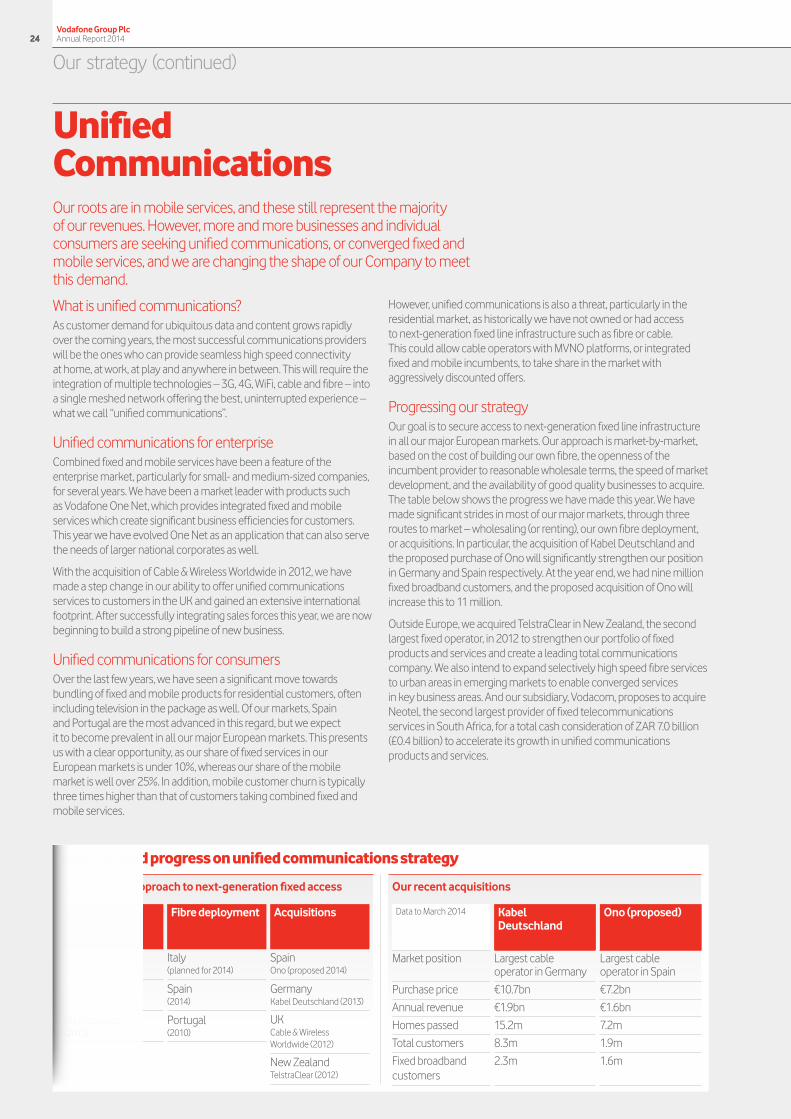
Progressing our strategyOur goal is to secure access to next‑generation fixed line infrastructure in all our major European markets. Our approach is market-by-market, based on the cost of building our own fibre, the openness of the incumbent provider to reasonable wholesale terms, the speed of market development, and the availability of good quality businesses to acquire. The table below shows the progress we have made this year. We have made significant strides in most of our major markets, through three routes to market – wholesaling (or renting), our own fibre deployment, or acquisitions. In particular, the acquisition of Kabel Deutschland and the proposed purchase of Ono will significantly strengthen our position in Germany and Spain respectively. At the year end, we had nine million fixed broadband customers, and the proposed acquisition of Ono will increase this to 11 million.
Outside Europe, we acquired TelstraClear in New Zealand, the second largest fixed operator, in 2012 to strengthen our portfolio of fixed products and services and create a leading total communications company. We also intend to expand selectively high speed fibre services to urban areas in emerging markets to enable converged services in key business areas. And our subsidiary, Vodacom, proposes to acquire Neotel, the second largest provider of fixed telecommunications services in South Africa, for a total cash consideration of ZAR 7.0 billion (£0.4 billion) to accelerate its growth in unified communications products and services.
Our recent acquisitions
Data to March 2014 Kabel Deutschland
Ono (proposed)
Market position Largest cable operator in Germany
Largest cable operator in Spain
Purchase price €10.7bn €7.2bn
Annual revenue €1.9bn €1.6bn
Homes passed 15.2m 7.2m
Total customers 8.3m 1.9m
Fixed broadband customers
2.3m 1.6m
Our strategic approach to next-generation fixed access
Italy (2013)
Germany (2013)
Netherlands (2013)
Wholesale
Italy (planned for 2014)
Spain (2014)
Portugal (2010)
Fibre deployment
Spain Ono (proposed 2014)
Germany Kabel Deutschland (2013)
UK Cable & Wireless Worldwide (2012)
New Zealand TelstraClear (2012)
Acquisitions
Vodafone Group Plc Annual Report 2014Vodafone Group Plc Annual Report 20142424

Unified Communications
Our market-leading unified communications solution in PortugalIn Portugal we have developed a market‑leading unified communications solution by combining our fibre‑based fixed broadband, advanced internet TV (with full cloud catch-up TV and multi-screen option – tablet, PC, smartphone) and our mobile offers. As a result we are the operator with the highest mobile net promoter score.
As part of our Project Spring programme we are accelerating the deployment of high speed fibre, which offers up to 300Mbps, to reach 1.5 million homes by mid‑2015.
Vodafone Group Plc Annual Report 2014Vodafone Group Plc Annual Report 2014 25Overview
Strategy review Performance Governance Financials
Additional information
Our strategy (continued)
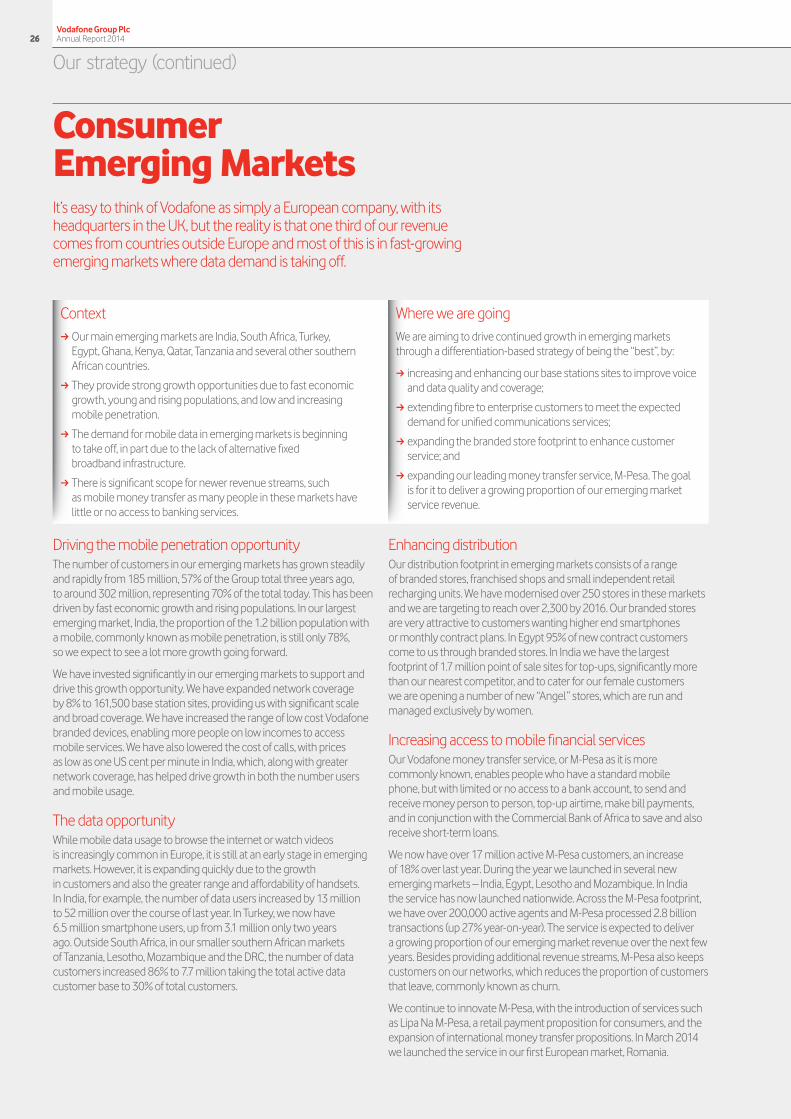
Consumer Emerging Markets It’s easy to think of Vodafone as simply a European company, with its headquarters in the UK, but the reality is that one third of our revenue comes from countries outside Europe and most of this is in fast-growing emerging markets where data demand is taking off.
Driving the mobile penetration opportunityThe number of customers in our emerging markets has grown steadily and rapidly from 185 million, 57% of the Group total three years ago, to around 302 million, representing 70% of the total today. This has been driven by fast economic growth and rising populations. In our largest emerging market, India, the proportion of the 1.2 billion population with a mobile, commonly known as mobile penetration, is still only 78%, so we expect to see a lot more growth going forward.
We have invested significantly in our emerging markets to support and drive this growth opportunity. We have expanded network coverage by 8% to 161,500 base station sites, providing us with significant scale and broad coverage. We have increased the range of low cost Vodafone branded devices, enabling more people on low incomes to access mobile services. We have also lowered the cost of calls, with prices as low as one US cent per minute in India, which, along with greater network coverage, has helped drive growth in both the number users and mobile usage.
The data opportunityWhile mobile data usage to browse the internet or watch videos is increasingly common in Europe, it is still at an early stage in emerging markets. However, it is expanding quickly due to the growth in customers and also the greater range and affordability of handsets. In India, for example, the number of data users increased by 13 million to 52 million over the course of last year. In Turkey, we now have 6.5 million smartphone users, up from 3.1 million only two years ago. Outside South Africa, in our smaller southern African markets of Tanzania, Lesotho, Mozambique and the DRC, the number of data customers increased 86% to 7.7 million taking the total active data customer base to 30% of total customers.
Enhancing distributionOur distribution footprint in emerging markets consists of a range of branded stores, franchised shops and small independent retail recharging units. We have modernised over 250 stores in these markets and we are targeting to reach over 2,300 by 2016. Our branded stores are very attractive to customers wanting higher end smartphones or monthly contract plans. In Egypt 95% of new contract customers come to us through branded stores. In India we have the largest footprint of 1.7 million point of sale sites for top‑ups, significantly more than our nearest competitor, and to cater for our female customers we are opening a number of new “Angel” stores, which are run and managed exclusively by women.
Increasing access to mobile financial servicesOur Vodafone money transfer service, or M-Pesa as it is more commonly known, enables people who have a standard mobile phone, but with limited or no access to a bank account, to send and receive money person to person, top-up airtime, make bill payments, and in conjunction with the Commercial Bank of Africa to save and also receive short-term loans.
We now have over 17 million active M-Pesa customers, an increase of 18% over last year. During the year we launched in several new emerging markets – India, Egypt, Lesotho and Mozambique. In India the service has now launched nationwide. Across the M-Pesa footprint, we have over 200,000 active agents and M-Pesa processed 2.8 billion transactions (up 27% year-on-year). The service is expected to deliver a growing proportion of our emerging market revenue over the next few years. Besides providing additional revenue streams, M-Pesa also keeps customers on our networks, which reduces the proportion of customers that leave, commonly known as churn.
We continue to innovate M-Pesa, with the introduction of services such as Lipa Na M-Pesa, a retail payment proposition for consumers, and the expansion of international money transfer propositions. In March 2014 we launched the service in our first European market, Romania.
Context a Our main emerging markets are India, South Africa, Turkey, Egypt, Ghana, Kenya, Qatar, Tanzania and several other southern African countries.
a They provide strong growth opportunities due to fast economic growth, young and rising populations, and low and increasing mobile penetration.
a The demand for mobile data in emerging markets is beginning to take off, in part due to the lack of alternative fixed broadband infrastructure.
a There is significant scope for newer revenue streams, such as mobile money transfer as many people in these markets have little or no access to banking services.
Where we are goingWe are aiming to drive continued growth in emerging markets through a differentiation-based strategy of being the “best”, by:
a increasing and enhancing our base stations sites to improve voice and data quality and coverage;
a extending fibre to enterprise customers to meet the expected demand for unified communications services;
a expanding the branded store footprint to enhance customer service; and
a expanding our leading money transfer service, M-Pesa. The goal is for it to deliver a growing proportion of our emerging market service revenue.
Vodafone Group Plc Annual Report 2014Vodafone Group Plc Annual Report 20142626
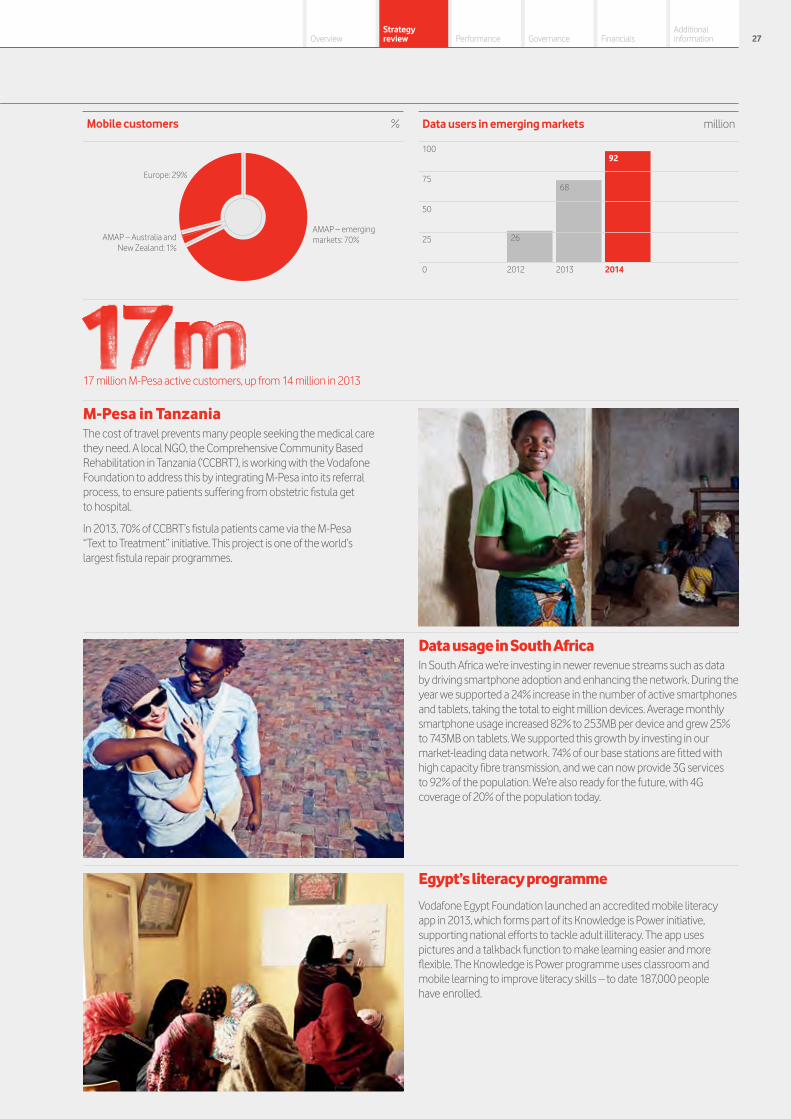
M-Pesa in TanzaniaThe cost of travel prevents many people seeking the medical care they need. A local NGO, the Comprehensive Community Based Rehabilitation in Tanzania (‘CCBRT’), is working with the Vodafone Foundation to address this by integrating M-Pesa into its referral process, to ensure patients suffering from obstetric fistula get to hospital.
In 2013, 70% of CCBRT’s fistula patients came via the M-Pesa “Text to Treatment” initiative. This project is one of the world’s largest fistula repair programmes.
Data usage in South AfricaIn South Africa we’re investing in newer revenue streams such as data by driving smartphone adoption and enhancing the network. During the year we supported a 24% increase in the number of active smartphones and tablets, taking the total to eight million devices. Average monthly smartphone usage increased 82% to 253MB per device and grew 25% to 743MB on tablets. We supported this growth by investing in our market-leading data network. 74% of our base stations are fitted with high capacity fibre transmission, and we can now provide 3G services to 92% of the population. We’re also ready for the future, with 4G coverage of 20% of the population today.
Egypt’s literacy programme
Vodafone Egypt Foundation launched an accredited mobile literacy app in 2013, which forms part of its Knowledge is Power initiative, supporting national efforts to tackle adult illiteracy. The app uses pictures and a talkback function to make learning easier and more flexible. The Knowledge is Power programme uses classroom and mobile learning to improve literacy skills – to date 187,000 people have enrolled.
17 million M-Pesa active customers, up from 14 million in 2013
2012 2013 2014
26
68
92
0
50
25
75
100
Data users in emerging markets millionMobile customers %
Europe: 29%
AMAP – emerging markets: 70%AMAP – Australia and
New Zealand: 1%
Vodafone Group Plc Annual Report 2014Vodafone Group Plc Annual Report 2014 27Overview
Strategy review Performance Governance Financials
Additional information

Our strategy (continued)
Enterprise We want to build on our core strength in mobile to become the leading communications provider for businesses across the world, whether large or small. We are focused on providing a range of mobile, fixed, hosting, cloud and other business services that are simple to use, worry-free and cost-effective.
Mobile and unified communicationsWhile the majority of our revenue still comes from mobile, we are increasingly providing unified communications services. The recent acquisitions of Cable & Wireless Worldwide (‘CWW’) and TelstraClear, combined with our existing fixed assets, enabled us to accelerate growth of our fixed and converged services, with 23% of our Enterprise revenue coming from fixed services, an increase of 12 percentage points over the year.
Vodafone One Net, our flagship converged offer which combines fixed and mobile services, is available to businesses of all sizes, from both small and medium up to global multinational companies and is live in ten markets.
Vodafone Global Enterprise (‘VGE’)VGE delivers total communications services to some of the world’s largest multinational companies. We currently serve around 1,700 companies and provide services in over 100 countries.
VGE simplifies operations for our customers by providing them with a single account and service team, a single multi-country contract, single pricing structures and a single portfolio of products and services. These are underpinned by our fully integrated fixed and mobile network, cloud-based hosting platforms, machine-to-machine capability and other business services.
Carrier ServicesOur Carrier Services division manages the commercial relationships with other operators to support, in particular, international voice and data services. We are the second largest international voice carrier in the world, carrying 50 billion international voice minutes annually. We are one of the world’s largest investors in submarine cables that reach more than 100 countries. We offer a broad portfolio of carrier voice and data products and work with over 1,000 communication service providers globally.
Machine-to-Machine (‘M2M’)M2M technology connects “things” to the internet, transforming them into intelligent devices that exchange real time information – in effect enabling machines to talk.
Our M2M business serves customers across all market sectors, with specific focus on the key growth sectors of automotive, smart metering and consumer electronic products. M2M is growing rapidly and we have increased M2M connections from 12.0 million to 16.2 million in the year.
Connections in the global M2M market are expected to grow at an average of 24% per year between 2013 and 20181. We continue to be ranked as the market leader by a number of market analysts, including Analysys Mason and Machina Research.
Cloud and HostingBringing together mobile, fixed, cloud and hosting services, we help organisations move their data and applications to the cloud, transforming the way they do business. Our capabilities mean we are well placed to capitalise on the global growth of cloud computing and the increasing technology and procurement link between hosting, cloud and connectivity.
With the successful integration of our CWW operations, our Cloud and Hosting Services business now serves more than 1,200 public sector and enterprise customers in multiple regions. Our 14 data centres in the UK, Ireland and South Africa are complemented by a partner network of data centre facilities that allow us to serve multinational customers globally. Our services include co-location, managed hosting, private and public cloud services, messaging and software-as-a-service applications.
Context a Mobility increasingly sits at the heart of how organisations function, how they maximise their employee productivity and how they interact with their customers, suppliers and partners.
a Customers increasingly want more than just mobile solutions. Demand for unified communications and full service offerings, machine-to-machine and cloud and hosting is increasing, providing exciting new growth opportunities.
Where we are going a We are building on our core strength in mobile and increasing capability in fixed to develop a portfolio of products and services, based on converged fixed and mobile solutions, to sell to businesses across the globe.
a Our strategy and investment is focused on: three high-growth product areas – unified communications, cloud and hosting and machine-to-machine; and three market segments – small- and medium-sized enterprises (‘SMEs’), large and multinational corporates and carriers.
Note:1 Source: Berg Insight, The Global Wireless M2M Market, October 2013.
Vodafone Group Plc Annual Report 2014Vodafone Group Plc Annual Report 20142828
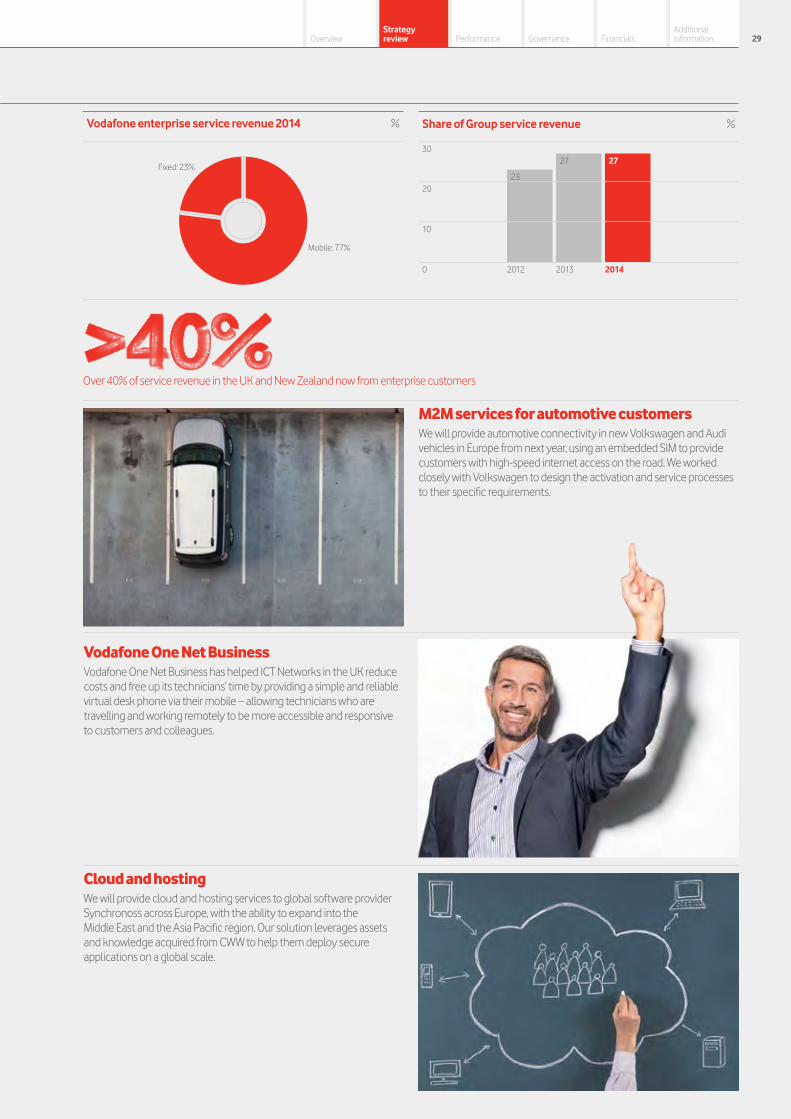
2012 2013 2014
23
27 27
0
10
20
30
Share of Group service revenue %
Over 40% of service revenue in the UK and New Zealand now from enterprise customers
M2M services for automotive customersWe will provide automotive connectivity in new Volkswagen and Audi vehicles in Europe from next year, using an embedded SIM to provide customers with high-speed internet access on the road. We worked closely with Volkswagen to design the activation and service processes to their specific requirements.
Vodafone One Net BusinessVodafone One Net Business has helped ICT Networks in the UK reduce costs and free up its technicians’ time by providing a simple and reliable virtual desk phone via their mobile – allowing technicians who are travelling and working remotely to be more accessible and responsive to customers and colleagues.
Cloud and hostingWe will provide cloud and hosting services to global software provider Synchronoss across Europe, with the ability to expand into the Middle East and the Asia Pacific region. Our solution leverages assets and knowledge acquired from CWW to help them deploy secure applications on a global scale.
Vodafone enterprise service revenue 2014 %
Fixed: 23%
Mobile: 77%
Vodafone Group Plc Annual Report 2014Vodafone Group Plc Annual Report 2014 29Overview
Strategy review Performance Governance Financials
Additional information
Our strategy (continued)
Network We aim to have the best mobile network in all our markets, be competitive in fixed services and provide the best converged fixed and mobile services to support the growing demand for unified communications. We are aiming to provide our customers with a “perfect voice” call experience, and provide both high quality and broad data coverage.
Mobile network Europe Across Europe data has become an increasingly important driver of total traffic on our network. In the last year European data traffic increased by 44%, compared to 4% for voice. Video streaming and web browsing are the most popular data applications – accounting for nearly 75% of data usage. 3G accounts for most of our data traffic, so it’s a key area for investment. This is why today around two thirds of our European 3G network can now deliver peak downlink speeds of 43.2Mbps and the latest smartphone drive trials showed that we had the best or co-best 3G data network in 15 out of 20 markets. The faster speeds offered by 4G make this increasingly attractive to our customers, shown by a significant rise in the number of users last year to 4.7 million. The increasing take-up of 4G means that this now represents 18% of total European data traffic.
Mobile network emerging marketsNearly 40% of Group mobile data is now carried across our AMAP network, which includes our emerging markets, and by the end of the year India became the greatest data user by volume of any country within Vodafone. The scope for further data growth remains significant with only 52 million of our 167 million customers in India having access to data, of which only seven million are 3G users. 3G usage is already averaging in excess of nearly 750MB per month – compared to around 500MB in Europe. To meet this rapid growth in data traffic, we have rolled out more than 10,500 3G and over 9,700 2G sites in India supported by more than 13,000 kilometres of fibre in the last two years.
Investing in fixed networks for unified communicationsAs demand for unified communications and data grows we are increasing our access to next‑generation fixed line infrastructure to support this. Through a combination of wholesale agreements, self-build programmes and targeted acquisitions we now have access to fixed line infrastructure in 17 markets (with data speeds of up to 300Mbps in some) and we offer combined fixed and mobile propositions in 12 countries.
Context a The telecoms industry continues to experience a rapid increase in the demand for data services, such as video streaming and internet browsing on smartphones and tablets.
a Across the Group data traffic increased by 64% over the last year and data now accounts for 81% of our total traffic including voice.
a Mobile and fixed network technology is continuing to evolve providing faster data speeds and the capability to carry more data.
a Customers are also increasingly seeking fixed and mobile converged or unified communications propositions.
Where we are going
Our strategy is focused upon delivering a clearly differentiated, market-leading network position. We will do this through:
a the provision of the best mobile voice and data service, by the rapid and widespread deployment of 3G and 4G, and upgrades to network backhaul infrastructure; and
a being competitive in the fixed market and delivering leading unified communication solutions, by acquiring access to an effective mix of high speed next‑generation fixed network cable and fibre infrastructure.
The largest part of Project Spring will be significant additional investment in our mobile and fixed networks over the next two years to both accelerate and clearly differentiate our network position in all of our markets. This is the largest network investment programme in our history.
In our European mobile networks, this will enable us to deliver “perfect voice” which means a call success rate of over 99%. We will also deliver the best 4G data experience with over 90% outdoor population coverage and 90% of customer data sessions on high speed smartphones will be above 3Mbps. This will be supported by a future proofed network with over 98% of sites covered with high capacity backhaul. In emerging markets, we will also deliver “perfect voice” and will grow our 3G coverage to 95% in targeted urban areas in India. For our fixed customers, we will deploy fibre in Italy passing 6.4 million households, extend our fibre roll‑out in Portugal to more households and build fibre coverage to support 15,000 enterprises in South Africa.
Project Spring
During the year we acquired Kabel Deutschland in Germany and announced the acquisition of Ono in Spain, both of which provide us with high quality cable network infrastructure. The integration of Cable & Wireless Worldwide in the UK and TelstraClear in New Zealand remains on track and we have made good progress on our fibre build programmes in Spain and Portugal with a target to reach three million and 1.5 million homes passed respectively by 2015.
SpectrumRadio spectrum is the key raw material for our mobile business. During the year we acquired and renewed spectrum for £2.2 billion in India, Romania, New Zealand and the Czech Republic, with a cash cost of £0.9 billion during the year. The purchases in India will enable the provision of enhanced voice and data services including 2G, 3G and 4G across the country. We have a strong portfolio of spectrum assets to support the rapid deployment of 4G, with 800/900MHz frequency spectrum for deep indoor coverage and 1800/2600MHz for capacity and performance. See page 194 for more details.
Vodafone Group Plc Annual Report 2014Vodafone Group Plc Annual Report 20143030

Expanding our 4G networkOur 4G journey continues to go from strength to strength. In the last year, we launched 4G services in a further seven markets, including the UK, bringing the total to 14. 17% of the smartphones on our European network are 4G capable, and our 4G network enables customers to upload and download content two to three times faster than over 3G. This allows users to stream video content and browse the internet with less delay. By 2016 we expect to expand our 4G network to cover over 90% of the European population.
Network innovationWe work very closely with our network suppliers to continually develop innovative new solutions to help improve our customers’ network experience, deliver efficiencies and enable us to differentiate. During this year, we began testing and deploying several solutions, which will be available in the near future. For example, “4G carrier aggregation”, bonds together multiple spectrum blocks to increase peak data downloads speeds up to 300Mbps; and “4G Broadcast” enables an unlimited number of smartphone users, with compatible devices, to watch TV channels without putting additional load on the 4G network. We were the first operator to trial this service in Europe in February 2014.
Portable network supports victims of typhoonIn November 2013, the Vodafone Foundation deployed two Instant Network to support relief efforts following Typhoon Haiyan, in the Philippines. These portable networks pack into four cases, each weighing less than 100kg. Over 29 days the networks enabled 1.4 million SMS and 443,200 calls to be made.
In February 2014, the Vodafone Foundation launched the Instant Network Mini – a “network in a backpack” weighing just 11kg, which can be deployed in ten minutes.
Over 263,400 mobile base stations, making us one of the largest mobile operators in the world
2012 2013 2014
216
331
544
0
200
400
600
Data traffic petabytes
n Download n Upload
1991 (2G) 2004 (3G) 2014 (4G)
0.1 0.05
8
1.5
20
10
0
10
20
30
Average data speeds Mbps
Vodafone Group Plc Annual Report 2014Vodafone Group Plc Annual Report 2014 31Overview
Strategy review Performance Governance Financials
Additional information
Our strategy (continued)
Operations We are using the benefits of our global reach and scale to standardise and simplify the way we do business across the Group. This will both improve cost efficiency and reduce the time to launch new services and products to our customers.
Using our centralised functions moreThe Vodafone Procurement Company (‘VPC’) in Luxembourg centrally manages the strategic procurement of the majority of our overall spend. This allows us to leverage scale and achieve better prices and terms and conditions. During the year the spend managed through the VPC increased to €10.2 billion which represents around 50% of our spend, up from €6.9 billion in the prior year.
By utilising the VPC we also learn how to apply best practice across different spend categories. For example, by applying techniques from how we manage the software licences for our data centres under a single contract to how we buy software for our network operations, we have achieved a 30% reduction in prices compared to what our markets were achieving in isolation.
Standardisation and simplification In the UK, we completed the first phase of a programme to simplify our organisation and improve all of our IT systems for billing, customer relationship management, and online and retail services. All prepaid customers services have migrated from legacy IT systems to one new integrated platform. This has resulted in simplification of our tariffs and improved end-to-end order processing times. We have also upgraded all our retail points of sale to make the sales and logistics processes simpler for our staff. All of this means a better experience for customers. We have reduced the number of ways of returning a handset to eight, and through our rationalisation programme we are reducing our consumer price plans from nearly 5,000 to under 500.
Offshoring functions to shared service centres of expertiseOur business depends on having simple and effective operations that leverage the benefits of shared service centres to support our operations across the globe.
Over the past three years we have expanded the scope of shared service centres in Egypt, India and Europe to provide financial, administrative, IT, customer operations and human resource services for all of our markets. In 2012, we had just 9,5001 shared centre employees and this has now risen to over 13,300, and has expanded to cover commercial activities for our Enterprise business and customers. Our shared services are delivering cash cost savings at an annualised run-rate of about £180 million. We expect to have around 16,000 employees in shared services by 2016.
Applying new technology to improve efficiencyWe have been at the forefront of Single RAN (Radio Access Network) technology that enables the combination of 2G, 3G and 4G technologies into the same radio equipment. This has a number of cost benefits including reduced floor space requirements on‑site which reduces our site rentals, and efficient power technology provides savings our energy bill. Single RAN units are now present in 45% of our sites and we plan to expand this to 69% by 2016.
Reducing non-customer facing costs While we continue to expand our employee base in customer facing positions, we have been able to make savings across administrative support positions in Europe. On balance this has led to a decrease in the number of employees in Europe (excluding our acquisitions of Kabel Deutschland and the minority stake in Vodafone Italy) and an increase in the number of employees in AMAP.
Context a The challenging economic, regulatory and competitive environment we face in Europe has led to declining revenues in our European businesses.
a Inflationary pressure in emerging markets is putting upward pressure on our cost base.
a The trend towards greater data usage significantly increases the traffic on our network.
a Against this background, to protect our level of profitability, we must continue to find ways to improve operating efficiency and simplify and standardise processes for customers.
Where we are going
We aim to improve operational efficiency, and to speed up and co-ordinate our time to market for new propositions and services, by:
a using our centralised functions more;
a driving standardisation and simplification of our business to maximise the benefits of our scale;
a offshoring more business functions to shared service centres;
a applying new technology to improve efficiency; and
a reducing non-customer facing cost.
Note:1 Restated from 6,000, as stated in last year’s report, to include shared services employees supporting India
customer operations.
Vodafone Group Plc Annual Report 2014Vodafone Group Plc Annual Report 20143232
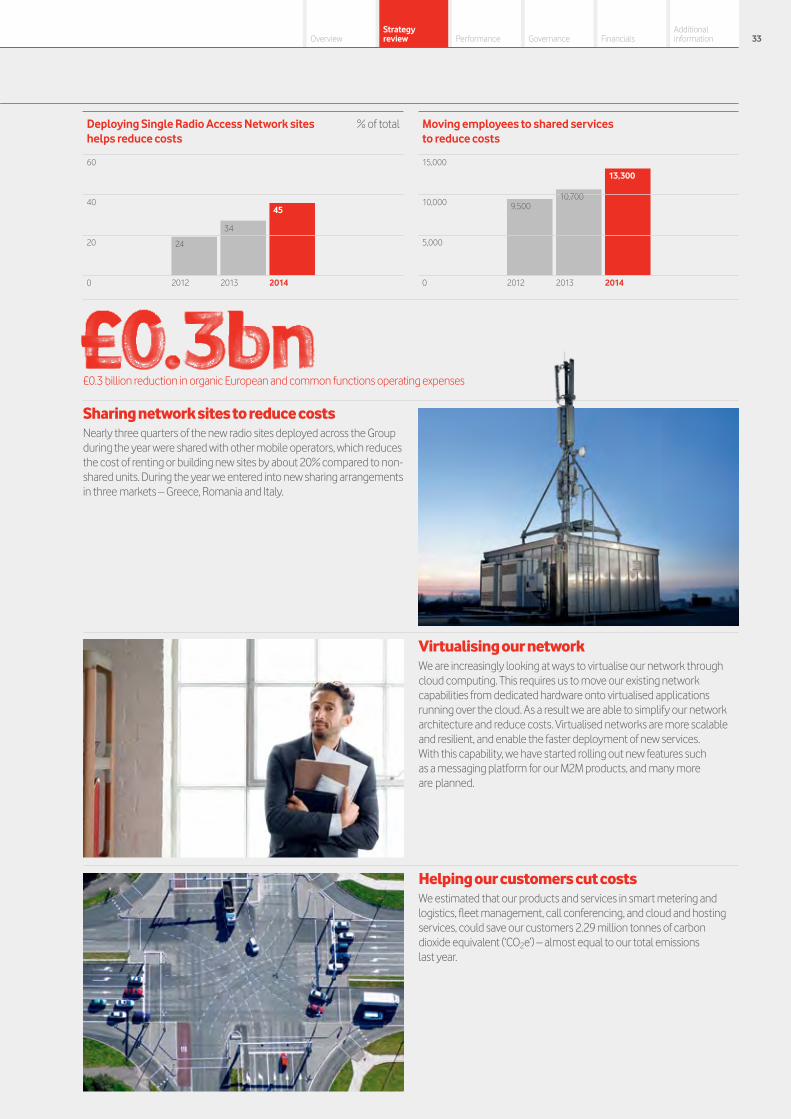
Sharing network sites to reduce costsNearly three quarters of the new radio sites deployed across the Group during the year were shared with other mobile operators, which reduces the cost of renting or building new sites by about 20% compared to non-shared units. During the year we entered into new sharing arrangements in three markets – Greece, Romania and Italy.
Virtualising our networkWe are increasingly looking at ways to virtualise our network through cloud computing. This requires us to move our existing network capabilities from dedicated hardware onto virtualised applications running over the cloud. As a result we are able to simplify our network architecture and reduce costs. Virtualised networks are more scalable and resilient, and enable the faster deployment of new services. With this capability, we have started rolling out new features such as a messaging platform for our M2M products, and many more are planned.
Helping our customers cut costsWe estimated that our products and services in smart metering and logistics, fleet management, call conferencing, and cloud and hosting services, could save our customers 2.29 million tonnes of carbon dioxide equivalent (‘CO2e’) – almost equal to our total emissions last year.
£0.3 billion reduction in organic European and common functions operating expenses
2012 2013 2014
24
34
45
0
20
40
60
Deploying Single Radio Access Network sites helps reduce costs
% of total
2012 2013 2014
9,50010,700
13,300
0
5,000
10,000
15,000
Moving employees to shared services to reduce costs
Vodafone Group Plc Annual Report 2014Vodafone Group Plc Annual Report 2014 33Overview
Strategy review Performance Governance Financials
Additional information
Sustainable business
Contributing to social and economic improvementTelecommunications technology has the power to transform people’s lives. Ensuring that we continue to connect more people to essential services, while expanding the reach of our network, is the best way we can support that improvement.
Telecommunications technology can be used to tackle some of the most pressing challenges faced by society today. Our products and services provide access to a range of solutions to these challenges in areas including financial services, healthcare and education. We remain determined to continue to contribute to the social and economic development of all our customers and particularly our 302 million customers who live in emerging markets, while ensuring we continue to fulfil our strategic business goals.
How we achieve our goals is integral to the long-term success of the business. We remain fully committed to operating ethically and responsibly in everything we do. This includes ensuring we respect our customers’ human rights, improving ethical and environmental standards in our supply chain and managing our energy use, while remaining proactive in our response to emerging sustainability risks.
This report highlights our progress in four critical areas.
Connecting people to vital servicesMobile money continues to be a driver of financial inclusion, offering people access to payments and financial services beyond the reach of traditional institutions. Our platform, M-Pesa, expanded its geographical reach in 2014, launching recently in Mozambique, Lesotho, Egypt, Romania and India.
M-Pesa now has 17 million active users who can access a wide range of services that enhance their ability to improve their livelihoods, including the ability to pay bills and even be paid their salary via M-Pesa. A new savings and loan product, launched in conjunction with the Commercial Bank of Africa, enables M-Pesa users to save and access loans, often for the very first time.
The M-Pesa platform supports our efforts in many other areas, including our aim to increase productivity and improve the lives of 500,000 smallholder farmers in Africa, through the Connected Farmer Alliance initiative. Our first formal partnership with Kilombero Plantations Limited, in Tanzania, tested how mobile technology could support the Company’s engagement with smallholder rice farmers. We are also piloting our solution with a dairy cooperative in Kenya, to help them run more efficiently, increasing productivity and incomes for the members who supply the cooperative with milk.
Protecting our customers’ information and respecting their privacyThe amount of data and personal information transmitted over our networks is increasing, as our customers use their mobile and other connected devices more and more. Our commitment to protect that information and respect their right to privacy and freedom of expression remains critical in retaining their trust.
We can only ensure our customers’ privacy if we first ensure the security of their information and communications. Cyber security threats continue to proliferate, so Vodafone’s Global Security Operations Centre monitors our IT systems 24 hours a day, seven days a week, to anticipate or detect attacks and minimise their impact.
The issue of government surveillance has come under increased scrutiny. For the first time we have published a Law Enforcement Disclosure report, which sets out our approach to responding to law enforcement demands for access to customer information, together with information about intelligence agency and authority demands on a country-by-country basis, where statistical data can lawfully be disclosed.
Vodafone is a member of the Telecommunications Industry Dialogue on Freedom and Privacy of Expression, which in March 2013 launched a two-year collaboration with the Global Network Initiative (‘GNI’) and a set of Guiding Principles, which address the issues of privacy and freedom of expression as they relate to the telecommunications sector.
Supporting ethical practices in the supply chainWe continue to work with our suppliers and others in our industry to raise ethical, labour and environmental standards in our supply chain, through an enhanced code of ethical purchasing. In 2014, we conducted 30 rigorous audits of both new and existing suppliers and 38 through the Joint Audit Co-operation (‘JAC’), in collaboration with nine other telecommunications operators.
This year, we published our first Conflict Minerals report in response to US Securities and Exchange Commission requirements. Our policy requires our suppliers to take steps to ensure that minerals used to finance conflict in the Democratic Republic of Congo (‘DRC’) or neighbouring countries do not end up in our products and we are working through industry initiatives to continue to tackle this issue.
Saving energy and cutting carbonWe are a top-rated global communications service provider for the machine-to-machine (‘M2M’) industry. Using our M2M solutions helps our enterprise customers to cut carbon emissions and generate cost savings. We estimated the carbon savings we deliver for customers from our M2M products and services, call conferencing and cloud and hosting, to be a total of 2.29 million tonnes of carbon dioxide equivalent (‘CO2e’) in 2013 – almost equal to our total emissions. By March 2014, we had contracts to provide nearly 14 million M2M connections with carbon-reducing potential in smart metering, fleet management and logistics.
Though we continue to extend the reach of our network to more customers, who are using increasing amounts of data, our own carbon footprint has remained almost stable and we remain committed to reduce it as far as possible through energy efficiency measures. The efficiency of our operations has greatly improved with emissions per base station now at ten tonnes CO2e, almost 40% lower than in 2007. Our total carbon emissions in 2014 were 2.55 million tonnes of CO2e, a slight increase on 2013 due to newly acquired operations.
Want to find out more?Read our sustainability report 2013–14, for more information on Vodafone’s contribution to social and economic development.
vodafone.com/sustainability/report2014
Vodafone Group Plc Annual Report 2014Vodafone Group Plc Annual Report 201434

Connected Women Vodafone’s Connected Women Summit focused on the impact of mobile technology on the lives of women around the world. New research, commissioned by the Vodafone Foundation, looked at the social and economic impact of extending women’s access to mobile phones. The Connected Women report found that stabilising the gender gap in our markets could have an economic benefit for women and society of more than US$22.3 billion annually from 2020.
Retail: 74
Office: 458
Network: 4,690
Supporting victims of domestic violenceTecSOS, from the Vodafone Foundation, rapidly connects victims of domestic violence to emergency services. Now available in six European markets, it has helped more than 31,900 victims. In the UK, TecSOS is used by over 50% of police forces – it won the Metropolitan Police Commissioner’s Award for Best Use of Technology and was granted a “Secured by Design” licence, which recognises TecSOS as a high quality service to be used by the police.
Instant EducationThe Vodafone Foundation opened the first “Instant Network School” in the DRC in 2013, in partnership with Italian NGO, Don Bosco. The Vodafone Foundation’s Instant Network Schools programme is supported by the Qatar Foundation’s “Educate a Child” initiative. The school, in Goma, is enabling 400–500 children aged 7–17 to access online educational content via tablets provided through the Instant Network mobile education programme.
The total amount of donations made to the Vodafone Foundations in 2013 – including £5.9 million towards its operating costs. Since its inception, Vodafone has donated over £475 million to the charitable programmes led by our Foundations.
2012 2013 2014
2.23 2.362.55
0
1
2
3
Carbon emissions2 Millions of tonnes CO2e
Notes:1 Energy use does not include fuel use for transport.2 Calculated using local market actual or estimated data sourced from invoices, purchasing requisitions,
direct data measurement and estimations. Carbon emissions calculated in line with DEFRA guidance and Greenhouse Gas Protocol. For full methodology see our sustainability report 2014. CWW and TelstraClear data included for 2014 only and data for 2014 acquisitions excluded.
n Scope 1 (direct greenhouse gas (‘GHG’) emissions) n Scope 2 (indirect GHG emissions)
Energy use 20141,2 GWh
Vodafone Group Plc Annual Report 2014Vodafone Group Plc Annual Report 2014 35Overview
Strategy review Performance Governance Financials
Additional information
Our people
One company, local roots We believe our people are fundamental to our success – that’s why we want to attract and retain exceptional employees. We’re committed to providing an inclusive workplace where we offer great opportunities for our people to build their skills and careers.
We continue to develop our people to ensure that they have the right skills and experience to deliver an outstanding experience to our customers.
During the year we employed an average of 92,812 people and had 97,721 employees as of March 2014. The number of our people increased during the year following our acquisition of Kabel Deutschland in Germany and the move to full ownership of Vodafone Italy.
The following sections highlight our progress in the key areas behind our people strategy.
Increasing employee engagementEvery year all our employees participate in our global People Survey which allows us to measure engagement levels, compare ourselves to other large companies and helps us identify ways to improve how we do things.
Our employee engagement index measures how committed our employees are, their desire to continue working for us and their willingness to recommend Vodafone as an employer. The index remained broadly stable at 77 points this year compared to 78 last year. Crucially we retained our top quartile position. Our employee turnover rate also remained broadly stable at 15%.
Embedding The Vodafone Way The Vodafone Way is about ensuring our employees work with speed, simplicity and trust so that we can be customer-obsessed, ambitious and competitive, innovation-hungry and work as one company with local roots.
For the third consecutive year we have run development workshops for all senior employees with a particular focus on ensuring we provide a superior experience to all our customers.
Building a diverse and inclusive cultureWe believe that a diverse team is crucial to our success, helping us better understand and meet the needs of our customers. Our Group-wide diversity and inclusion strategy aims to create a working environment which values, celebrates and makes the most of individual differences.
We do not condone unfair treatment of any kind and offer equal opportunities in all aspects of employment and advancement regardless of race, nationality, gender, age, marital status, sexual orientation, disability, and religious or political beliefs. This also applies to agency workers, the self-employed and contract workers who work for us. We promote an open culture that encourages people to raise issues to ensure that any behaviour which excludes or discriminates against individuals does not go unchallenged. This year’s People Survey showed that 89% of employees believe that Vodafone treats people fairly, regardless of their gender, background, age or beliefs.
Creating a lean and effective organisationWe continue to make our business more efficient, simplifying processes across our markets and sharing best practice. We continue to move transactional and back office activities to our shared service centres in Egypt, India and Europe. In the last year we undertook an exercise to reduce our non-customer facing support functions, as discussed on page 32.
We aim to treat all employees fairly, consulting with those affected by change and clearly communicating developments. We support employees through organisational changes, finding people new jobs in the company or arranging for them to work for a partner company where possible. We also help those whose roles are made redundant search for new jobs, offering them training on job applications and interview skills, and advice on how to start their own business.
During the year we completed the integration of employees from Cable & Wireless Worldwide and we established single product management teams for consumer and enterprise.
Strengthening capabilitiesWe want people to grow their careers at Vodafone and develop the skills and talent needed to grow our business. We do this through formal training, on the job experience and regular coaching from managers.
We conduct an annual analysis of learning needs to identify priorities and ensure that learning plans support our business strategy. Every employee also has a formal review once a year with their manager to review their performance and set clear goals and development plans for the year ahead.
Our global learning academies in marketing, technology, sales, retail, finance and supply chain enable people to develop the critical skills they need to excel in their functions. We work with leading business schools and accredited external providers to develop and deliver the training. Last year, around 180,000 online courses were completed and we trained around 18,000 people in our Technology Academy and over 10,000 people in our Retail and Sales academies.
We conduct regular talent reviews to identify high-potential future leaders and accelerate the progress of high-potential managers through our “Inspire” programme, which offers development and executive coaching over an 18 month period and may include an assignment to another Vodafone market or function.
Our “Discover” programme for graduates accelerates the careers of high performing graduates and we recruited 596 people from 20 countries onto this programme during the year. We also have an international assignment programme, “Columbus”, with 35 graduates from 16 different markets taking part this year.
Note:Employee numbers are shown on a management view and on a full time employee basis. A statutory view is provided on page 152.
Vodafone Group Plc Annual Report 2014Vodafone Group Plc Annual Report 201436

Recognising performanceWe maintained our approach of rewarding people based on their performance, potential and contribution to our success. We benchmark roles regularly to ensure competitive, fair remuneration in every country in which we operate. We also offer competitive retirement and other benefit provisions which vary depending on conditions and practices in local markets.
Global short-term incentive plans are offered to a large percentage of employees and global long-term incentive plans are offered to our senior managers. Individual and company performance measures are attached to these plans which give employees the opportunity to be rewarded for exceptional performance as well as ensuring that we do not reward poor performance.
Doing what’s rightWe have a “Code of Conduct” that sets out our business principles and what we expect from employees to ensure they protect themselves as well as the Company’s reputation and assets. We actively promoted our Code of Conduct throughout the year via our global “Doing What’s Right” campaign. The aim was to improve understanding of and engagement with key topics including health and safety, anti-bribery, privacy, security and competition law to ensure that people know what’s expected of them and managers know what is expected of their teams.
Creating a safe place to workDriving a culture where safety is an integral part of every business decision is critical to our vision of preventing any incidents that could affect the health and safety of our people. We continue to work hard to ensure employees and contractors know how to identify and manage risks and take personal responsibility for their own safety and the safety of those around them.
We have a wide range of programmes and systems to tackle our key risks, often tailored to the particular needs of each market. Despite this, we greatly regret to report that 12 people died while undertaking work on behalf of Vodafone last year. Strengthening programmes to target occupational road risk – one of our biggest risks and the main cause of these fatalities – remains a major focus for all local markets.
Through increased awareness and a strong focus on managing our top five safety risks, our injury rates have continued to decline in 2014. The safety culture in Vodafone continues to mature – our latest People Survey showed that 89% of employees believe that our “Absolute Rules”, which help employees follow best practice for safety, are taken seriously.
Average number of employees
2012
2013
2014
86,373
91,272
92,812
Employee turnover rates
2012
2013
2014
15%
16%
15%
Nationalities in top senior leadership roles
2012
2013
2014
25
26
24
Women in top senior leadership roles
2012
2013
2014
19%
20%
22%
Valuing diversity At the end of the year we had 61,848 (63%) male and 35,873 (37%) female employees and we have increased female representation at all levels of the business, particularly within more senior roles. Women now make up 22% of our senior leadership team (our 223 most senior managers) – an improvement on last year but we still have work to do. We also increased the number of women on our Executive Committee to two.
Spain: 4%Italy: 5%
Vodacom: 8%
Germany: 12%
UK: 16%
India: 18%
Other: 37%
Employees by location %
Vodafone Group Plc Annual Report 2014Vodafone Group Plc Annual Report 2014 37Overview
Strategy review Performance Governance Financials
Additional information

Our financial performance was mixedOur financial performance reflects continued strong growth in our emerging markets, partly offsetting competitive, regulatory and macroeconomic pressures in Europe. While we have seen declines in our revenue and EBITDA, we have met our financial guidance and increased the dividend per share.
Overall performanceThe Group’s emerging markets businesses have delivered strong organic growth this year, combining good local execution on marketing and distribution with leading network quality. In particular, data usage in emerging markets is really taking off, providing further growth potential for the Group. This has however been offset by significant ongoing pressures in our European operations, from a combination of a weak macroeconomic environment, regulatory headwinds, and stiff competition. We experienced revenue declines in all of our major European markets, and related pressure on margins, despite continuing measures to control costs.
Group revenue for the year fell 3.5%* to £43.6 billion, with Group organic service revenue down 4.3%*. Our AMAP region service revenue continued to perform strongly, growing 6.1%*, driven by our major emerging markets (India +13.0%*, Vodacom +4.1%*, Turkey +7.9%*). The Group EBITDA1 margin fell 1.3* percentage points on an organic basis, as the impact of steep revenue declines in Europe offset improving margins in AMAP, notably in India and Australia. Group EBITDA1 fell 7.4%* to £12.8 billion.
Group adjusted operating profit1 fell 9.4%* year-on-year to £7.9 billion largely reflecting the decline in EBITDA1, and includes a £3.2 billion profit contribution from Verizon Wireless to 2 September 2013. Adjusted operating profit on a pro forma guidance basis was £4.9 billion2.
Verizon WirelessThe profit contribution of Verizon Wireless is reported in our 2014 financial year results for five months to 2 September 2013, the date we announced its sale. Our share of Verizon Wireless’ profits for this five month period amounted to £3.2 billion. The sale of the US group, whose principal asset was Verizon Wireless, led to a pre-tax gain on disposal of £45.0 billion.
Impairment lossesWe recorded impairment charges of £6.6 billion relating to our businesses in Germany, Spain, Portugal, Czech Republic and Romania. These were driven by lower projected cash flows within business plans, resulting from the tougher macroeconomic environment and heavy price competition.
Financing costs and taxationOn a statutory basis, net financing costs have decreased 6.4% primarily due to the recognition of mark-to-market gains, offset by a £99 million loss (2013: £nil) on the redemption of US$5.65 billion bonds as part of the restructuring of the Group’s financing arrangements following the disposal of Verizon Wireless and lower interest income on settlement of tax issues.
The adjusted effective tax rate for the year ended 31 March 2014 was 27.3%, in line with our expectation for the year. Our adjusted effective tax rate does not include the impact of the recognition of an additional deferred tax asset in respect of the Group’s historic tax losses in Germany (£1,916 million) and Luxembourg (£17,402 million), and the estimated US tax liability (£2,210 million) relating to the rationalisation and reorganisation of our non-US assets prior to the disposal of our interest in Verizon Wireless.
Adjusted earnings per shareAdjusted earnings per share1 fell 12.8% to 17.54 pence, driven by lower adjusted operating profit, offset by a lower share count arising from the Group’s share buyback programme. The Board is recommending a final dividend per share of 7.47 pence, to give total ordinary dividends per share for the year of 11.0 pence, up 8% year-on-year.
Free cash flowFree cash flow was £4.4 billion, down 21.5% from the prior year. On a pro forma guidance basis, free cash flow was £4.8 billion2, within our guidance range of £4.5 billion to £5.0 billion for the year. The year-on-year decline reflects the relative strength of sterling against the South African rand and Indian rupee over the course of the year, partly offset by movements in the euro, as well as tough trading conditions. In addition to the free cash flow reported above, we received an income dividend of £2.1 billion from Verizon Wireless.
Capital expenditureCapital expenditure increased 13.3% to £7.1 billion, with the growth driven by the inclusion of CWW for 12 months, the inclusion of KDG from October 2013, the commencement of our fibre roll-out in Spain, and initial Project Spring investments in Germany and India. In addition, we acquired and renewed spectrum for £2.2 billion in India, Romania, New Zealand and the Czech Republic, with a cash cost of £0.9 billion during the year.
Vodafone Group Plc Annual Report 201438
Chief Financial Officer’s review

Group1,2,3
Management basis1 Statutory basis1
Europe£m
AMAP £m
Non-Controlled Interests and
Common Functions4
£mEliminations
£m2014
£m2013
£m2014
£m2013
£m
Revenue 27,997 14,971 686 (38) 43,616 44,445 38,346 38,041Service revenue 25,977 13,087 502 (37) 39,529 40,495 35,190 34,999Other revenue 2,020 1,884 184 (1) 4,087 3,950 3,156 3,042
EBITDA2 8,175 4,680 (24) – 12,831 13,566 11,084 11,466Adjusted operating profit2 2,688 2,092 3,094 – 7,874 12,577 4,310 5,590Adjustments for:
Impairment losses (6,600) (7,700)Restructuring costs and other one-off items (355) (311)Amortisation of acquired customer bases and brand intangible assets (551) (249)Other income and expense (717) 468
Operating loss (3,913) (2,202)Non-operating income and expense (149) 10 Net financing costs (1,208) (1,291)Income tax credit/(expense) 16,582 (476)Profit/(loss) for the financial year from continuing operations 11,312 (3,959)Profit for the financial year from discontinued operations 48,108 4,616 Profit for the financial year 59,420 657
Notes:1 Management basis amounts and growth rates are calculated consistent with how the business is managed and operated, and include the results of the Group’s joint ventures, Vodafone Italy, Vodafone Hutchison Australia,
Vodafone Fiji and Indus Towers, on a proportionate basis, including the profit contribution from Verizon Wireless to 2 September 2013. Statutory basis includes the results of the Group’s joint ventures using the equity accounting basis rather than on a proportionate consolidation basis, with the profit contribution from Verizon Wireless being classified within discontinued operations. See “Non-GAAP information” on page 201 for details.
2 All amounts are presented on the Group’s revised segment basis. EBITDA and adjusted operating profit have been restated to exclude restructuring costs. Adjusted operating profit has also been redefined to exclude amortisation of customer base and brand intangible assets. See page 201 for “Non-GAAP financial information”.
3 2014 results reflect average foreign exchange rates of £1:€1.19 and £1:US$1.59 (2013: £1:€1.23 and £1:US$1.58).4 Common Functions primarily represent the results of the partner markets and the net result of unallocated central Group costs.
Net debt Net debt on a statutory basis decreased £11.7 billion to £13.7 billion as proceeds from the disposal of our US group, whose principal asset was its 45% stake in Verizon Wireless, positive free cash flow and favourable foreign exchange movements more than offset the acquisition of Kabel Deutschland, licences and spectrum payments and equity shareholder returns including equity dividends, the special distribution and share buybacks. In Q4, we paid £2.4 billion in relation to the expected tax liability for the Verizon Wireless transaction, of which US$3.3 billion (£2.0 billion) was paid to Verizon. We now expect this liability to total US$3.6 billion (£2.2 billion).
Performance against 2014 financial year guidance2
On 2 September 2013 we issued pro forma guidance for the 2014 financial year, which excluded VZW and included 100% of Vodafone Italy, both for the whole year. This pro forma guidance included Vodafone’s remaining joint ventures (Australia, Fiji and Indus Towers), on an equity accounting basis, consistent with IFRS requirements.
Based on guidance foreign exchange rates, our pro forma adjusted operating profit for the 2014 financial year was £4.9 billion2, in line with the around £5.0 billion range set in September 2013. On the same basis our pro forma free cash flow was £4.8 billion2, in line with our guidance range of £4.5–£5.0 billion.
2015 financial year guidance3
EBITDA £bn
Free cash flow £bn
2015 financial year guidance 11.4–11.9 Positive
We expect EBITDA to be in the range of £11.4 billion to £11.9 billion.
We expect free cash flow to be positive after all capex, before the impact of M&A, spectrum purchases and restructuring costs. Total capex over the next two years is expected to be around £19 billion, after which we anticipate capital intensity normalising to a level of 13–14% of annual revenue.
Nick Read Chief Financial Officer
Vodafone Group Plc Annual Report 201438 39Overview
Strategy review Performance Governance Financials
Additional information
Notes:* All amounts in this document marked with an “*” represent organic growth which presents performance on a comparable basis, both in terms of merger and acquisition activity and movements in foreign exchange rates.
See page 202 “Non-GAAP financial information” for further details.1 Please see page 201 for “Non-GAAP financial information”.2 Guidance foreign exchange rates for the year ended 31 March 2014 were £1:€1.17, £1=US$1.52, £1:INR 84.9 and £1:ZAR 14.3.3 We have based guidance for the 2015 financial year on our current assessment of the global macroeconomic outlook and assume foreign exchange rates of £1:€1.21, £1:INR 105.8 and £1:ZAR 18.4. It excludes the impact
of licences and spectrum purchases, material one-off tax-related payments, restructuring costs and any fundamental structural change to the Eurozone. It also assumes no material change to the current structure of the Group. Actual foreign exchange rates may vary from the foreign exchange rate assumptions used. A 1% change in the euro to sterling exchange rate would impact EBITDA by £60 million and have no material impact on free cash flow. A 1% change in the Indian rupee to sterling exchange rate would impact EBITDA by £10 million and free cash flow by £5 million. A 1% change in the South African Rand to sterling exchange rate would impact EBITDA by £15 million and free cash flow by £5 million. Guidance for the year ending 31 March 2015 includes the results of Vodafone’s remaining joint ventures (Australia, Fiji and Indus Towers) on an equity basis, consistent with IFRS requirements.
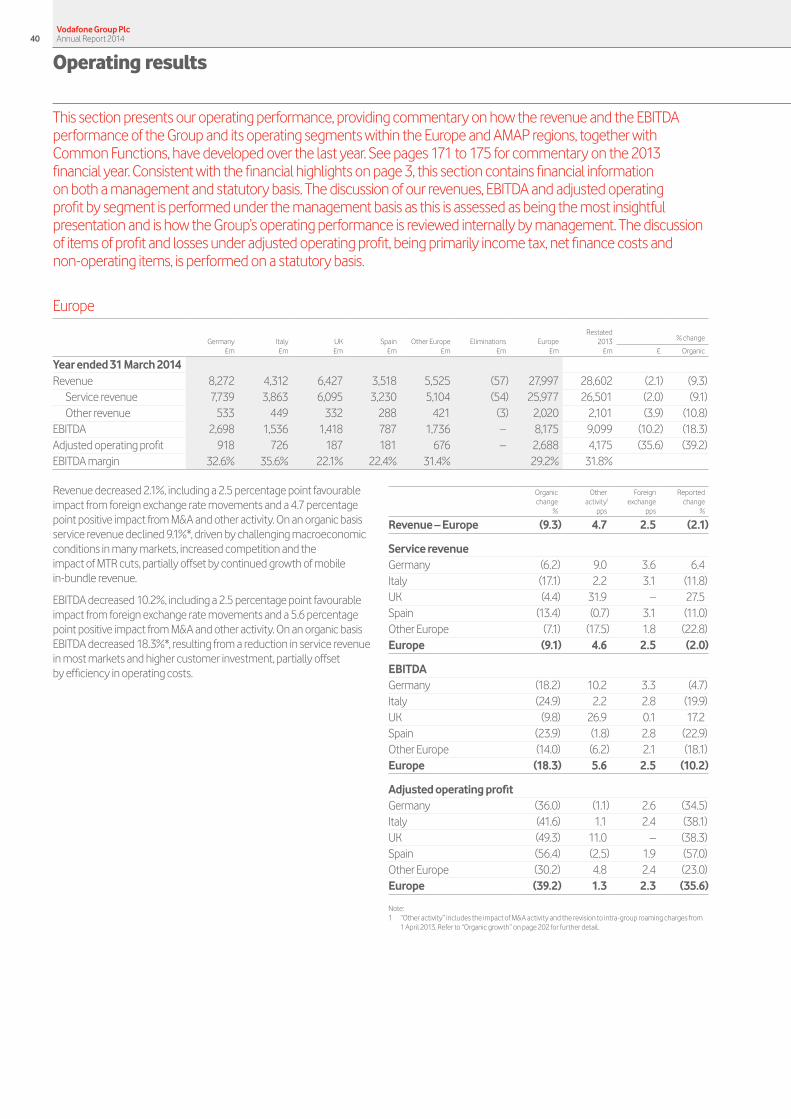
Europe
Germany£m
Italy£m
UK£m
Spain£m
Other Europe£m
Eliminations£m
Europe£m
Restated2013
£m
% change
£ Organic
Year ended 31 March 2014Revenue 8,272 4,312 6,427 3,518 5,525 (57) 27,997 28,602 (2.1) (9.3)
Service revenue 7,739 3,863 6,095 3,230 5,104 (54) 25,977 26,501 (2.0) (9.1)Other revenue 533 449 332 288 421 (3) 2,020 2,101 (3.9) (10.8)
EBITDA 2,698 1,536 1,418 787 1,736 – 8,175 9,099 (10.2) (18.3)Adjusted operating profit 918 726 187 181 676 – 2,688 4,175 (35.6) (39.2)EBITDA margin 32.6% 35.6% 22.1% 22.4% 31.4% 29.2% 31.8%
Revenue decreased 2.1%, including a 2.5 percentage point favourable impact from foreign exchange rate movements and a 4.7 percentage point positive impact from M&A and other activity. On an organic basis service revenue declined 9.1%*, driven by challenging macroeconomic conditions in many markets, increased competition and the impact of MTR cuts, partially offset by continued growth of mobile in-bundle revenue.
EBITDA decreased 10.2%, including a 2.5 percentage point favourable impact from foreign exchange rate movements and a 5.6 percentage point positive impact from M&A and other activity. On an organic basis EBITDA decreased 18.3%*, resulting from a reduction in service revenue in most markets and higher customer investment, partially offset by efficiency in operating costs.
Organic change
%
Other activity1
pps
Foreign exchange
pps
Reported change
%
Revenue – Europe (9.3) 4.7 2.5 (2.1)
Service revenueGermany (6.2) 9.0 3.6 6.4 Italy (17.1) 2.2 3.1 (11.8)UK (4.4) 31.9 – 27.5 Spain (13.4) (0.7) 3.1 (11.0)Other Europe (7.1) (17.5) 1.8 (22.8)Europe (9.1) 4.6 2.5 (2.0)
EBITDAGermany (18.2) 10.2 3.3 (4.7)Italy (24.9) 2.2 2.8 (19.9)UK (9.8) 26.9 0.1 17.2 Spain (23.9) (1.8) 2.8 (22.9)Other Europe (14.0) (6.2) 2.1 (18.1)Europe (18.3) 5.6 2.5 (10.2)
Adjusted operating profitGermany (36.0) (1.1) 2.6 (34.5)Italy (41.6) 1.1 2.4 (38.1)UK (49.3) 11.0 – (38.3)Spain (56.4) (2.5) 1.9 (57.0)Other Europe (30.2) 4.8 2.4 (23.0)Europe (39.2) 1.3 2.3 (35.6)
Note:1 “Other activity” includes the impact of M&A activity and the revision to intra-group roaming charges from
1 April 2013. Refer to “Organic growth” on page 202 for further detail.
This section presents our operating performance, providing commentary on how the revenue and the EBITDA performance of the Group and its operating segments within the Europe and AMAP regions, together with Common Functions, have developed over the last year. See pages 171 to 175 for commentary on the 2013 financial year. Consistent with the financial highlights on page 3, this section contains financial information on both a management and statutory basis. The discussion of our revenues, EBITDA and adjusted operating profit by segment is performed under the management basis as this is assessed as being the most insightful presentation and is how the Group’s operating performance is reviewed internally by management. The discussion of items of profit and losses under adjusted operating profit, being primarily income tax, net finance costs and non-operating items, is performed on a statutory basis.
Vodafone Group Plc Annual Report 201440
Operating results

GermanyService revenue decreased 6.2%*, with a slightly improving trend in Q4 compared to Q3. Performance for the year was driven by intense price competition in both the consumer and enterprise segments and an MTR cut effective from December 2012, with Vodafone particularly impacted due to our traditionally high ARPU. In a more competitive environment we launched both a more aggressive 3G price plan (“Smart”) and pushed otelo in the entry-level contract segment. Mobile in-bundle revenue increased 2.7%* as a result of growth in integrated Vodafone Red offers, which was more than offset by a decline in mobile out-of-bundle revenue of 22.6%*. We continue to focus on Vodafone Red and 4G where we had nearly 3.0 million customers and 891,000 consumer contract customers respectively at 31 March 2014.
EBITDA declined 18.2%*, with a 4.3* percentage point decline in EBITDA margin, driven by lower service revenue and increased customer investment.
The roll-out of 4G services continued with a focus on urban areas, with overall outdoor population coverage of 70% at 31 March 2014, which combined with our ongoing network enhancement plan has resulted in a significant improvement in voice and data performance in the second half of the year.
Following its acquisition on 14 October 2013, KDG contributed £702 million to service revenue and £297 million to EBITDA in Germany. The domination and profit and loss transfer agreement was registered on 14 March 2014 and the integration of Vodafone Germany and KDG began on 1 April 2014.
ItalyService revenue declined 17.1%* driven by the effect of the summer prepaid price war penetrating the customer base and the negative impact of MTR cuts effective from January and July 2013. Mobile in-bundle revenue grew 15.2%* driven by the take-up of integrated prepaid plans. Vodafone Red, which had nearly 1.5 million customers at 31 March 2014, continues to penetrate further into the base leading to improving churn in the contract segment.
Enterprise revenue growth, while still negative, showed signs of improvement during the year thanks to the success of “Zero”. Prepaid experienced a steep ARPU decline as a result of the market move to aggressive bundled offers. 4G services are now available in 202 municipalities and outdoor coverage has reached 35%.
Fixed line revenue declined 3.2%* as a result of declining fixed voice usage, partly offset by continued broadband revenue growth supported by 77,000 net broadband customer additions during the year. Vodafone Italy now offers fibre services in 37 cities and is progressing well on its own fibre build plans.
EBITDA declined 24.9%*, with a 4.8* percentage point decline in EBITDA margin, primarily driven by the lower revenue, partially offset by strong efficiency improvements delivered on operating costs which fell 7.1%*.
UKService revenue decreased 4.4%*, principally driven by declines in enterprise and prepaid and a 1.9 percentage point impact from MTR cuts, partially offset by consumer contract service revenue growth. Mobile in-bundle revenue increased 0.6%* as the positive impact of contract customer growth and greater penetration of Vodafone Red plans into the customer base, with nearly 2.7 million customers at 31 March 2014, offset pricing pressures. Mobile out-of-bundle declined 7.2%*, primarily driven by lower prepaid revenue.
The activity to integrate the UK operations of CWW was accelerated successfully and we continue to deliver cash and capex synergies as planned. The sales pipeline is now growing, which we expect to materialise into revenue increases in the 2015 financial year.
The roll-out of 4G services continued following the launch in August 2013, with services now available in 14 cities and over 200 towns, with over 637,000 4G enabled plans (including Mobile Broadband) at 31 March 2014. We are making significant progress in network performance, particularly in the London area.
EBITDA declined 9.8%*, driven by lower revenue and a 1.0* percentage point decline in the EBITDA margin as a result of higher customer investment.
SpainService revenue declined 13.4%*, as a result of intense convergence price competition, macroeconomic price pressure in enterprise and a MTR cut in July 2013. Service revenue trends began to improve towards the end of the year. As a result of a stronger commercial performance and lower customer churn from an improved customer experience, the contract customer base decline slowed during the year and the enterprise customer base remained broadly stable. Mobile in-bundle revenue declined 0.4%* driven by the higher take-up of Vodafone Red plans, which continue to perform well, with over 1.2 million customers at 31 March 2014. We had 797,000 4G customers at 31 March 2014 and services are now available in all Spanish provinces, 227 municipalities and 80 cities.
Fixed line revenue declined 0.2%* as we added 216,000 new customers during the year and added 276,000 homes to our joint fibre network with Orange. On 17 March 2014 we agreed to acquire Grupo Corporativo Ono, S.A. (‘Ono’), the leading cable operator in Spain and the transaction is, subject to customary terms and conditions including anti-trust clearances by the relevant authorities, expected to complete in calendar Q3 2014.
EBITDA declined 23.9%*, with a 3.4* percentage point decline in EBITDA margin, primarily driven by the lower revenue, partly offset by lower commercial costs and operating cost reductions of 9.4%*.
Other EuropeService revenue declined 7.1%* as price competition and MTR cuts resulted in service revenue declines of 5.6%*, 8.4%* and 14.1%* in the Netherlands, Portugal and Greece respectively. However, Hungary and Romania returned to growth in H2, and all other markets apart from Portugal showed an improvement in revenue declines in Q4.
In the Netherlands mobile in-bundle revenue increased by 3.4%*, driven by the success of Vodafone Red plans. In Portugal, the broadband customer base and fixed line revenues continued to grow as the fibre roll-out gained momentum in a market moving strongly towards converged offers, whilst in Greece the customer base grew due to the focus on data. In Ireland, contract growth remained good in a declining market.
EBITDA declined 14.0%*, with a 2.1* percentage point reduction in the EBITDA margin, driven by lower service revenue, partly offset by operating cost efficiencies.
Vodafone Group Plc Annual Report 201440 41Overview
Strategy review Performance Governance Financials
Additional information

Africa, Middle East and Asia Pacific
India£m
Vodacom£m
Other AMAP£m
Eliminations£m
AMAP£m
Restated2013
£m
% change
£ Organic
Year ended 31 March 2014Revenue 4,394 4,718 5,860 (1) 14,971 15,413 (2.9) 8.4
Service revenue 3,927 3,866 5,295 (1) 13,087 13,729 (4.7) 6.1 Other revenue 467 852 565 – 1,884 1,684 11.9 27.4
EBITDA 1,397 1,716 1,567 – 4,680 4,532 3.3 16.2 Adjusted operating profit 354 1,228 510 – 2,092 1,893 10.5 28.6 EBITDA margin 31.8% 36.4% 26.7% 31.3% 29.4%
Revenue declined 2.9% mainly as a result of a 12.0 percentage point adverse impact from foreign exchange rate movements, particularly with regard to the Indian rupee, the South African rand and the Turkish lira. On an organic basis service revenue grew 6.1%*, driven by a higher customer base, increased customer usage and successful pricing strategies, partially offset by the impact of MTR reductions and a general weakening in macroeconomic conditions in certain countries. Growth was led by strong performances in India, Turkey, Qatar and Ghana and robust performances in Vodacom and Egypt, partly offset by service revenue declines in Australia and New Zealand.
EBITDA increased 3.3%, including a 13.9 percentage point adverse impact from foreign exchange rate movements. On an organic basis, EBITDA grew 16.2%*, driven primarily by strong growth in India, Turkey, Australia, Qatar and Ghana as well as improved contributions from Egypt and Vodacom.
Organic change
%
Otheractivity1
pps
Foreign exchange
pps
Reported change
%
Revenue – AMAP 8.4 0.7 (12.0) (2.9)
Service revenueIndia 13.0 – (11.7) 1.3 Vodacom 4.1 (2.8) (13.7) (12.4)Other AMAP 2.8 4.0 (9.4) (2.6)AMAP 6.1 0.7 (11.5) (4.7)
EBITDAIndia 26.4 – (13.7) 12.7 Vodacom 6.6 0.2 (16.1) (9.3)Other AMAP 19.3 3.2 (10.7) 11.8 AMAP 16.2 1.0 (13.9) 3.3
Adjusted operating profitIndia 83.3 – (23.1) 60.2 Vodacom 8.9 0.3 (17.0) (7.8)Other AMAP 66.5 (2.6) (13.9) 50.0 AMAP 28.6 (0.2) (17.9) 10.5
Notes:1 “Other activity” includes the impact of M&A activity and the revision to intra-group roaming charges from
1 April 2013. Refer to “Organic growth” on page 202 for further detail.
IndiaService revenue increased 13.0%*, driven by continued customer growth and data usage as well as improved voice pricing. Mobile customers increased by 14.2 million during the year, yielding a closing customer base of 166.6 million at 31 March 2014.
Data usage grew 125% during the year, primarily resulting from a 39% increase in mobile internet users and a 67% increase in usage per customer. At 31 March 2014 active data customers totalled 52 million including seven million 3G customers.
We progressively rolled out M-Pesa across India over the year, reaching nationwide coverage by March 2014.
EBITDA grew 26.4%*, with a 3.3* percentage point increase in EBITDA margin, driven by the higher revenue and the resulting economies of scale on costs.
In February, Vodafone India successfully bid for additional spectrum in 11 telecom circles in the Indian Government’s 900MHz and 1800MHz spectrum auction, enabling the company to provide customers with enhanced mobile voice and data services across the country. Of the total £1.9 billion cost of these spectrum licences, £0.5 billion was paid during the financial year with the remainder payable in instalments starting in 2017.
VodacomService revenue grew 4.1%*, driven by strong growth in Vodacom’s mobile operations outside South Africa. In South Africa, organic service revenue increased 0.3%*, despite the adverse impact of an MTR cut, due to the strong growth in data revenues of 23.5%*, driven by higher smartphone penetration and the strong demand for prepaid bundles.
Vodacom’s mobile operations outside South Africa delivered service revenue growth of 18.9%* mainly from continued customer base growth. M-Pesa continued to perform well and is now operational in all of the Vodacom mobile operations outside of South Africa, with over 4.4 million customers actively using the service.
EBITDA increased 6.6%*, driven by revenue growth, optimisation in customer investment and efficiencies in South Africa operating costs. The EBITDA margin decline of 0.3* percentage points is the result of higher sales of lower margin handsets.
On 14 April 2014, Vodacom announced the acquisition of the Vodacom customer base from Nashua, a mobile cellular provider for South African mobile network operators, subject to the approval of the Competition Authority.
On 19 May 2014 Vodacom announced that it had reached an agreement with the shareholders of Neotel Proprietary Limited (‘Neotel’), the second largest provider of fixed telecommunications services for both enterprise and consumers in South Africa, to acquire 100% of the issued share capital in, and shareholder loans against, Neotel for a total cash consideration of ZAR 7.0 billion (£0.4 billion). The transaction remains subject to the fulfilment of a number of conditions precedent including applicable regulatory approvals and is expected to close before the end of the financial year.
Vodafone Group Plc Annual Report 201442
Operating results (continued)
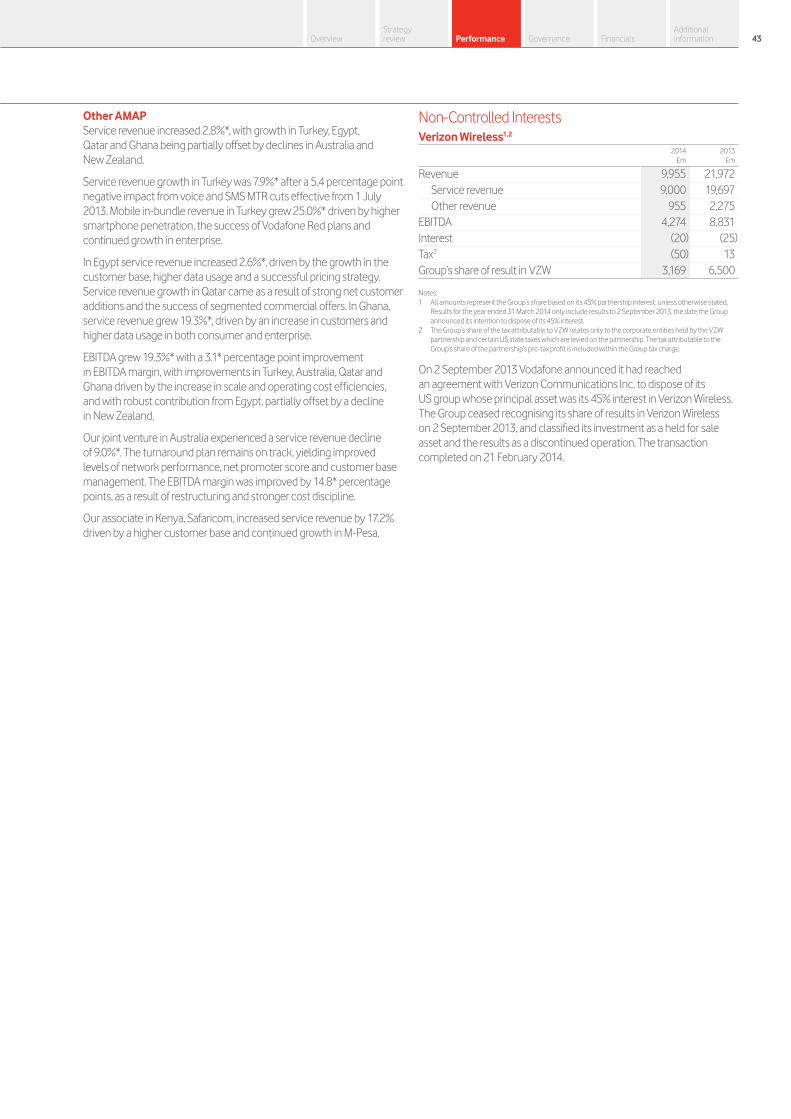
Other AMAPService revenue increased 2.8%*, with growth in Turkey, Egypt, Qatar and Ghana being partially offset by declines in Australia and New Zealand.
Service revenue growth in Turkey was 7.9%* after a 5.4 percentage point negative impact from voice and SMS MTR cuts effective from 1 July 2013. Mobile in-bundle revenue in Turkey grew 25.0%* driven by higher smartphone penetration, the success of Vodafone Red plans and continued growth in enterprise.
In Egypt service revenue increased 2.6%*, driven by the growth in the customer base, higher data usage and a successful pricing strategy. Service revenue growth in Qatar came as a result of strong net customer additions and the success of segmented commercial offers. In Ghana, service revenue grew 19.3%*, driven by an increase in customers and higher data usage in both consumer and enterprise.
EBITDA grew 19.3%* with a 3.1* percentage point improvement in EBITDA margin, with improvements in Turkey, Australia, Qatar and Ghana driven by the increase in scale and operating cost efficiencies, and with robust contribution from Egypt, partially offset by a decline in New Zealand.
Our joint venture in Australia experienced a service revenue decline of 9.0%*. The turnaround plan remains on track, yielding improved levels of network performance, net promoter score and customer base management. The EBITDA margin was improved by 14.8* percentage points, as a result of restructuring and stronger cost discipline.
Our associate in Kenya, Safaricom, increased service revenue by 17.2% driven by a higher customer base and continued growth in M-Pesa.
Non-Controlled InterestsVerizon Wireless1,2
2014£m
2013 £m
Revenue 9,955 21,972 Service revenue 9,000 19,697 Other revenue 955 2,275
EBITDA 4,274 8,831 Interest (20) (25)Tax2 (50) 13 Group’s share of result in VZW 3,169 6,500
Notes:1 All amounts represent the Group’s share based on its 45% partnership interest, unless otherwise stated.
Results for the year ended 31 March 2014 only include results to 2 September 2013, the date the Group announced its intention to dispose of its 45% interest.
2 The Group’s share of the tax attributable to VZW relates only to the corporate entities held by the VZW partnership and certain US state taxes which are levied on the partnership. The tax attributable to the Group’s share of the partnership’s pre-tax profit is included within the Group tax charge.
On 2 September 2013 Vodafone announced it had reached an agreement with Verizon Communications Inc. to dispose of its US group whose principal asset was its 45% interest in Verizon Wireless. The Group ceased recognising its share of results in Verizon Wireless on 2 September 2013, and classified its investment as a held for sale asset and the results as a discontinued operation. The transaction completed on 21 February 2014.
Vodafone Group Plc Annual Report 201442 43Overview
Strategy review Performance Governance Financials
Additional information
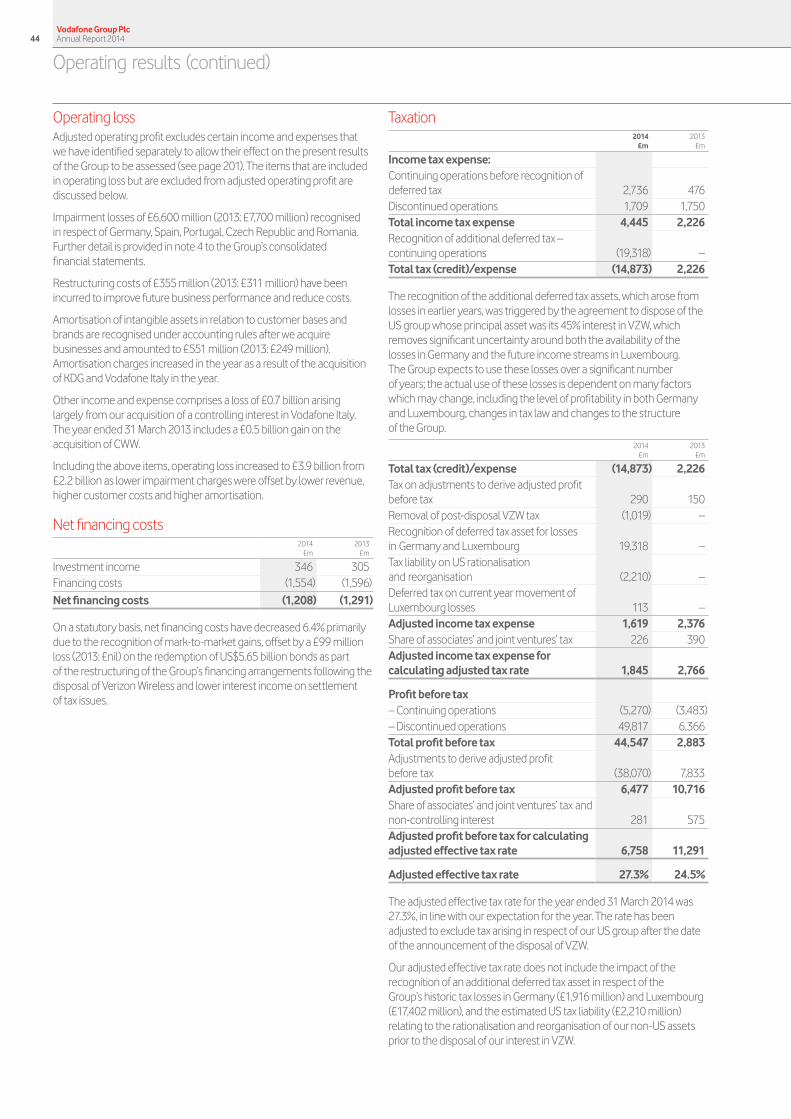
Operating lossAdjusted operating profit excludes certain income and expenses that we have identified separately to allow their effect on the present results of the Group to be assessed (see page 201). The items that are included in operating loss but are excluded from adjusted operating profit are discussed below.
Impairment losses of £6,600 million (2013: £7,700 million) recognised in respect of Germany, Spain, Portugal, Czech Republic and Romania. Further detail is provided in note 4 to the Group’s consolidated financial statements.
Restructuring costs of £355 million (2013: £311 million) have been incurred to improve future business performance and reduce costs.
Amortisation of intangible assets in relation to customer bases and brands are recognised under accounting rules after we acquire businesses and amounted to £551 million (2013: £249 million). Amortisation charges increased in the year as a result of the acquisition of KDG and Vodafone Italy in the year.
Other income and expense comprises a loss of £0.7 billion arising largely from our acquisition of a controlling interest in Vodafone Italy. The year ended 31 March 2013 includes a £0.5 billion gain on the acquisition of CWW.
Including the above items, operating loss increased to £3.9 billion from £2.2 billion as lower impairment charges were offset by lower revenue, higher customer costs and higher amortisation.
Net financing costs
2014
£m 2013
£m
Investment income 346 305 Financing costs (1,554) (1,596)Net financing costs (1,208) (1,291)
On a statutory basis, net financing costs have decreased 6.4% primarily due to the recognition of mark-to-market gains, offset by a £99 million loss (2013: £nil) on the redemption of US$5.65 billion bonds as part of the restructuring of the Group’s financing arrangements following the disposal of Verizon Wireless and lower interest income on settlement of tax issues.
Taxation
2014
£m2013
£m
Income tax expense: Continuing operations before recognition of deferred tax 2,736 476 Discontinued operations 1,709 1,750 Total income tax expense 4,445 2,226 Recognition of additional deferred tax – continuing operations (19,318) – Total tax (credit)/expense (14,873) 2,226
The recognition of the additional deferred tax assets, which arose from losses in earlier years, was triggered by the agreement to dispose of the US group whose principal asset was its 45% interest in VZW, which removes significant uncertainty around both the availability of the losses in Germany and the future income streams in Luxembourg. The Group expects to use these losses over a significant number of years; the actual use of these losses is dependent on many factors which may change, including the level of profitability in both Germany and Luxembourg, changes in tax law and changes to the structure of the Group.
2014
£m2013
£m
Total tax (credit)/expense (14,873) 2,226 Tax on adjustments to derive adjusted profit before tax 290 150 Removal of post-disposal VZW tax (1,019) – Recognition of deferred tax asset for losses in Germany and Luxembourg 19,318 – Tax liability on US rationalisation and reorganisation (2,210) –Deferred tax on current year movement of Luxembourg losses 113 – Adjusted income tax expense 1,619 2,376 Share of associates’ and joint ventures’ tax 226 390 Adjusted income tax expense for calculating adjusted tax rate 1,845 2,766
Profit before tax – Continuing operations (5,270) (3,483)– Discontinued operations 49,817 6,366 Total profit before tax 44,547 2,883 Adjustments to derive adjusted profit before tax (38,070) 7,833 Adjusted profit before tax 6,477 10,716 Share of associates’ and joint ventures’ tax and non-controlling interest 281 575 Adjusted profit before tax for calculating adjusted effective tax rate 6,758 11,291
Adjusted effective tax rate 27.3% 24.5%
The adjusted effective tax rate for the year ended 31 March 2014 was 27.3%, in line with our expectation for the year. The rate has been adjusted to exclude tax arising in respect of our US group after the date of the announcement of the disposal of VZW.
Our adjusted effective tax rate does not include the impact of the recognition of an additional deferred tax asset in respect of the Group’s historic tax losses in Germany (£1,916 million) and Luxembourg (£17,402 million), and the estimated US tax liability (£2,210 million) relating to the rationalisation and reorganisation of our non-US assets prior to the disposal of our interest in VZW.
Vodafone Group Plc Annual Report 201444
Operating results (continued)

Discontinued operationsOn 2 September 2013 the Group announced it had reached an agreement with Verizon Communications Inc. to dispose of its US group whose principal asset was its 45% interest in VZW. The Group ceased recognising its share of results in VZW on 2 September 2013, and classified its investment as a held for sale asset and the results as a discontinued operation. The transaction completed on 21 February 2014.
The table below sets out all of the elements relating to this discontinued operation within the consolidated income statement.
2014
£m2013
£m
Share of result in associate 3,191 6,422 Net financing income/(costs) 27 (56)Profit before taxation 3,218 6,366 Taxation relating to performance of discontinued operations (1,709) (1,750)Post-tax profit from discontinued operations 1,509 4,616
The table below sets the gain on disposal of discontinued operations.
2014
£m2013
£m
Gain on disposal of discontinued operations before tax 44,996 – Other items arising from the disposal 1,603 –Net gain on disposal of discontinued operations 46,599 –
Profit for the financial year from discontinued operations 48,108 4,616
Earnings/(loss) per shareWe have redefined adjusted earnings per share to exclude amortisation of acquired customer base and brand-related intangible assets, restructuring costs and one-off items in relation to both the disposal of our interest in Verizon Wireless and the acquisition of the remaining 23% of Vodafone Italy. Comparatives have been restated consistently.
Adjusted earnings per share was 17.54 pence, a decrease of 12.8% year-on-year, reflecting lower adjusted operating profit primarily due to the cessation of equity accounting for VZW from 2 September 2013, partially offset by a reduction in shares in issue arising from the Group’s share buyback programme.
Basic earnings per share from continuing operations increased to 42.10 pence (2013: loss of 15.66 pence) primarily due to the recognition of the additional deferred tax assets in the current year.
Statutory basis
2014
£m2013
£m
Profit attributable to equity shareholders 59,254 413
Adjustments: Impairment loss 6,600 7,700 Amortisation of acquired customer base and brand intangible assets 551 249Restructuring costs 355 311 Other income and expense 717 (468)Discontinued and other items (46,520) –Non-operating income and expense 149 (10)Investment income and financing costs 78 51
(38,070) 7,833
Taxation (17,511) (150)Removal of VZW trading results and tax after 2 September1 1,019 (2,669)Non-controlling interests (50) (28)Adjusted profit attributable to equity shareholders 4,642 5,399
Million Million
Weighted average number of shares outstanding – basic 26,472 26,831 Weighted average number of shares outstanding – diluted 26,682 26,831
Note:1 The adjustment for the year ended 31 March 2014 primarily relates to the removal of tax in respect of our
US group after 2 September 2013, whereas the adjustment for the year ended 31 March 2013 includes the removal of both profit contributions and tax for the period from 2 September 2012 to 31 March 2013.
Vodafone Group Plc Annual Report 201444 45Overview
Strategy review Performance Governance Financials
Additional information
References to “Q4” are to the quarter ended 31 March 2014 unless otherwise stated. References to the “second half of the year” are to the six months ended 31 March 2014 unless otherwise stated. References to the “year” or “financial year” are to the financial year ended 31 March 2014 and references to the “prior financial year” are to the financial year ended 31 March 2013 unless otherwise stated. References to the “2014 financial year”, “2015 financial year”, “2016 financial year”, “2017 financial year” and the “2019 financial year” are to the financial years ending 31 March 2014, 2015, 2016, 2017 and 2019, respectively. References to “calendar Q3 2014” are to the quarter ended 30 September 2014, unless otherwise stated.

Identifying and managing our risksWe have a clear framework for identifying and managing risk, both at an operational and strategic level. Our risk identification and mitigation processes have been designed to be responsive to the ever-changing environments in which we operate.
For more detail of our strategy for managing risk
196
Vodafone Group Plc Annual Report 201446
Risk summary
Managing risk
IdentifySenior management identify the key risks
and develop mitigation actions
IdentifyLocal management
create a register of their top ten risks and
mitigation actions
Review and assessmentGroup Risk Co-ordinator, who is the Group Audit Director, consolidates the operating companies’ and Group risks to compile the Group’s key risks
ProcessRisks and mitigation validated with the Executive Committee and presented to the Audit and Risk Committee for review
Review and confirmationReview and confirmation by the Board
Executive Committee
Senior management
of Group functions
Group Risk Co-ordinator
Board
Audit and Risk Committee
Senior management of operating companies
Ongoing review and control
There is ongoing review of the risks and controls
in place to mitigate these risks by the Audit
and Risk Committee
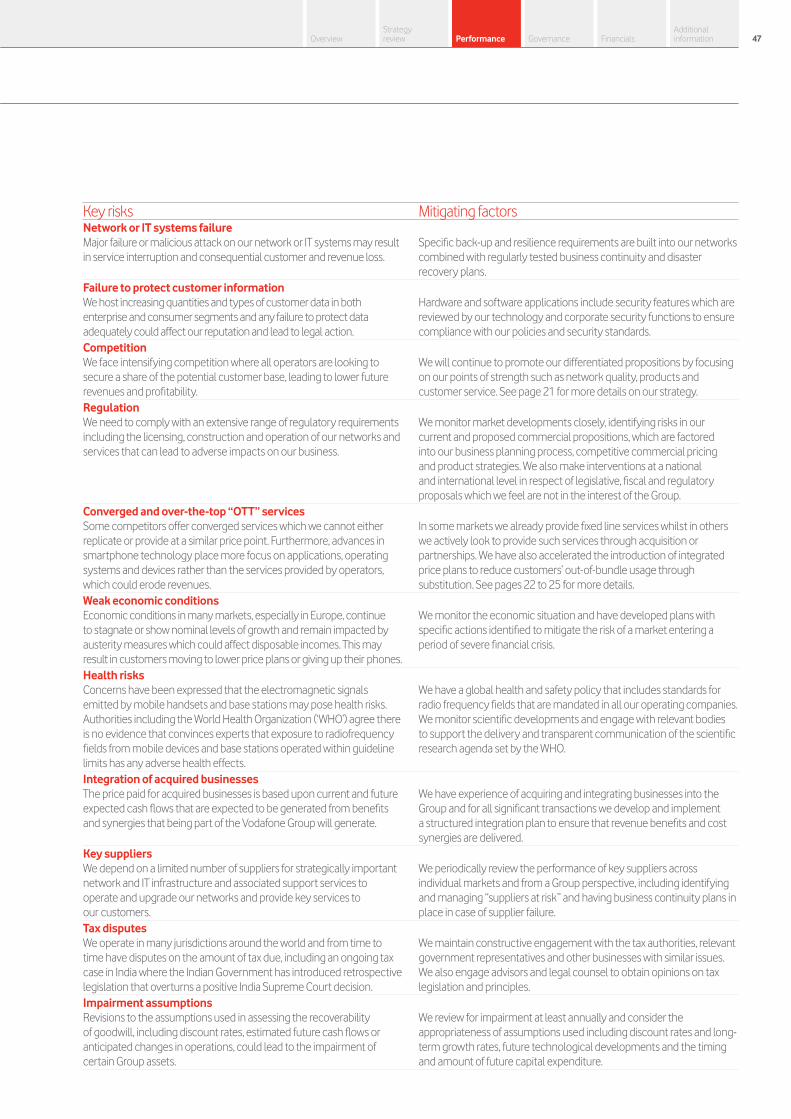
Vodafone Group Plc Annual Report 201446 47Overview
Strategy review Performance Governance Financials
Additional information
Key risks Mitigating factorsNetwork or IT systems failureMajor failure or malicious attack on our network or IT systems may result in service interruption and consequential customer and revenue loss.
Specific back-up and resilience requirements are built into our networks combined with regularly tested business continuity and disaster recovery plans.
Failure to protect customer informationWe host increasing quantities and types of customer data in both enterprise and consumer segments and any failure to protect data adequately could affect our reputation and lead to legal action.
Hardware and software applications include security features which are reviewed by our technology and corporate security functions to ensure compliance with our policies and security standards.
CompetitionWe face intensifying competition where all operators are looking to secure a share of the potential customer base, leading to lower future revenues and profitability.
We will continue to promote our differentiated propositions by focusing on our points of strength such as network quality, products and customer service. See page 21 for more details on our strategy.
RegulationWe need to comply with an extensive range of regulatory requirements including the licensing, construction and operation of our networks and services that can lead to adverse impacts on our business.
We monitor market developments closely, identifying risks in our current and proposed commercial propositions, which are factored into our business planning process, competitive commercial pricing and product strategies. We also make interventions at a national and international level in respect of legislative, fiscal and regulatory proposals which we feel are not in the interest of the Group.
Converged and over-the-top “OTT” servicesSome competitors offer converged services which we cannot either replicate or provide at a similar price point. Furthermore, advances in smartphone technology place more focus on applications, operating systems and devices rather than the services provided by operators, which could erode revenues.
In some markets we already provide fixed line services whilst in others we actively look to provide such services through acquisition or partnerships. We have also accelerated the introduction of integrated price plans to reduce customers’ out-of-bundle usage through substitution. See pages 22 to 25 for more details.
Weak economic conditionsEconomic conditions in many markets, especially in Europe, continue to stagnate or show nominal levels of growth and remain impacted by austerity measures which could affect disposable incomes. This may result in customers moving to lower price plans or giving up their phones.
We monitor the economic situation and have developed plans with specific actions identified to mitigate the risk of a market entering a period of severe financial crisis.
Health risksConcerns have been expressed that the electromagnetic signalsemitted by mobile handsets and base stations may pose health risks. Authorities including the World Health Organization (‘WHO’) agree there is no evidence that convinces experts that exposure to radiofrequency fields from mobile devices and base stations operated within guideline limits has any adverse health effects.
We have a global health and safety policy that includes standards forradio frequency fields that are mandated in all our operating companies. We monitor scientific developments and engage with relevant bodies to support the delivery and transparent communication of the scientific research agenda set by the WHO.
Integration of acquired businessesThe price paid for acquired businesses is based upon current and future expected cash flows that are expected to be generated from benefits and synergies that being part of the Vodafone Group will generate.
We have experience of acquiring and integrating businesses into the Group and for all significant transactions we develop and implement a structured integration plan to ensure that revenue benefits and cost synergies are delivered.
Key suppliersWe depend on a limited number of suppliers for strategically important network and IT infrastructure and associated support services to operate and upgrade our networks and provide key services to our customers.
We periodically review the performance of key suppliers across individual markets and from a Group perspective, including identifying and managing “suppliers at risk” and having business continuity plans in place in case of supplier failure.
Tax disputesWe operate in many jurisdictions around the world and from time to time have disputes on the amount of tax due, including an ongoing tax case in India where the Indian Government has introduced retrospective legislation that overturns a positive India Supreme Court decision.
We maintain constructive engagement with the tax authorities, relevant government representatives and other businesses with similar issues. We also engage advisors and legal counsel to obtain opinions on tax legislation and principles.
Impairment assumptionsRevisions to the assumptions used in assessing the recoverability of goodwill, including discount rates, estimated future cash flows or anticipated changes in operations, could lead to the impairment of certain Group assets.
We review for impairment at least annually and consider the appropriateness of assumptions used including discount rates and long-term growth rates, future technological developments and the timing and amount of future capital expenditure.

Governance49 Chairman’s overview50 Board of directors and Group management54 Corporate governance69 Directors’ remuneration
Vodafone Group Plc Annual Report 201448
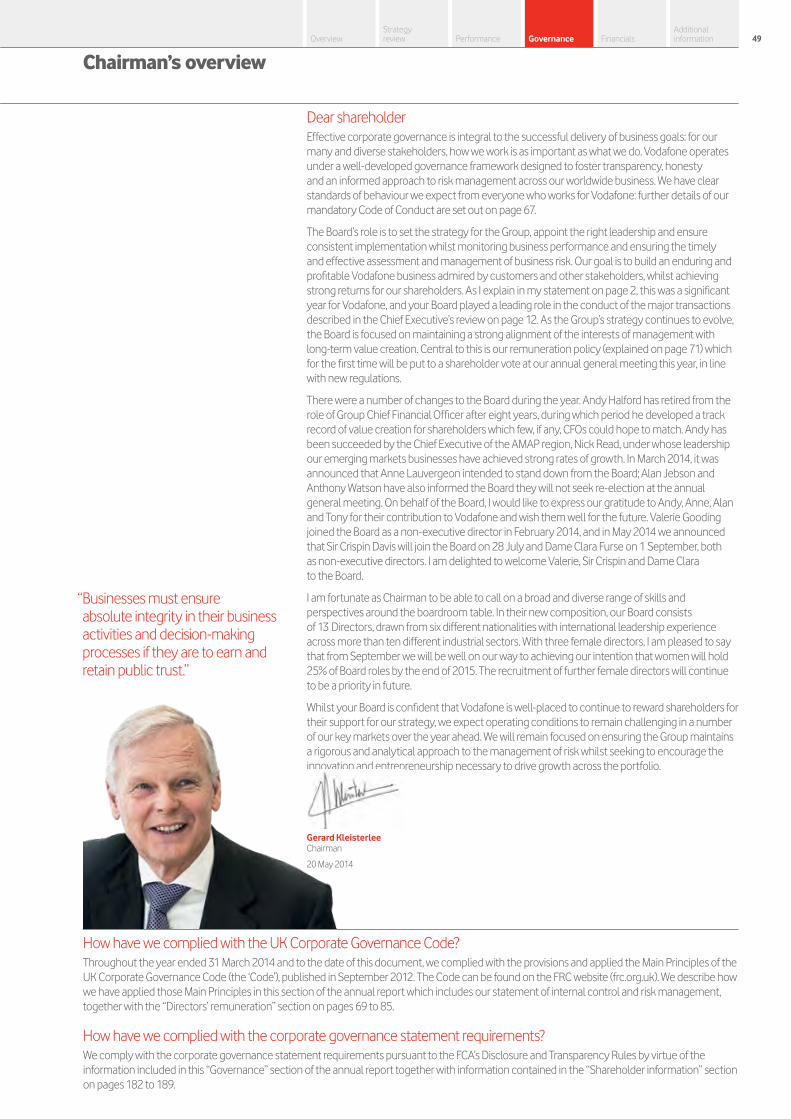
Dear shareholderEffective corporate governance is integral to the successful delivery of business goals: for our many and diverse stakeholders, how we work is as important as what we do. Vodafone operates under a well-developed governance framework designed to foster transparency, honesty and an informed approach to risk management across our worldwide business. We have clear standards of behaviour we expect from everyone who works for Vodafone: further details of our mandatory Code of Conduct are set out on page 67.
The Board’s role is to set the strategy for the Group, appoint the right leadership and ensure consistent implementation whilst monitoring business performance and ensuring the timely and effective assessment and management of business risk. Our goal is to build an enduring and profitable Vodafone business admired by customers and other stakeholders, whilst achieving strong returns for our shareholders. As I explain in my statement on page 2, this was a significant year for Vodafone, and your Board played a leading role in the conduct of the major transactions described in the Chief Executive’s review on page 12. As the Group’s strategy continues to evolve, the Board is focused on maintaining a strong alignment of the interests of management with long-term value creation. Central to this is our remuneration policy (explained on page 71) which for the first time will be put to a shareholder vote at our annual general meeting this year, in line with new regulations.
There were a number of changes to the Board during the year. Andy Halford has retired from the role of Group Chief Financial Officer after eight years, during which period he developed a track record of value creation for shareholders which few, if any, CFOs could hope to match. Andy has been succeeded by the Chief Executive of the AMAP region, Nick Read, under whose leadership our emerging markets businesses have achieved strong rates of growth. In March 2014, it was announced that Anne Lauvergeon intended to stand down from the Board; Alan Jebson and Anthony Watson have also informed the Board they will not seek re-election at the annual general meeting. On behalf of the Board, I would like to express our gratitude to Andy, Anne, Alan and Tony for their contribution to Vodafone and wish them well for the future. Valerie Gooding joined the Board as a non-executive director in February 2014, and in May 2014 we announced that Sir Crispin Davis will join the Board on 28 July and Dame Clara Furse on 1 September, both as non-executive directors. I am delighted to welcome Valerie, Sir Crispin and Dame Clara to the Board.
I am fortunate as Chairman to be able to call on a broad and diverse range of skills and perspectives around the boardroom table. In their new composition, our Board consists of 13 Directors, drawn from six different nationalities with international leadership experience across more than ten different industrial sectors. With three female directors, I am pleased to say that from September we will be well on our way to achieving our intention that women will hold 25% of Board roles by the end of 2015. The recruitment of further female directors will continue to be a priority in future.
Whilst your Board is confident that Vodafone is well-placed to continue to reward shareholders for their support for our strategy, we expect operating conditions to remain challenging in a number of our key markets over the year ahead. We will remain focused on ensuring the Group maintains a rigorous and analytical approach to the management of risk whilst seeking to encourage the innovation and entrepreneurship necessary to drive growth across the portfolio.
Gerard Kleisterlee Chairman
20 May 2014
How have we complied with the UK Corporate Governance Code?Throughout the year ended 31 March 2014 and to the date of this document, we complied with the provisions and applied the Main Principles of the UK Corporate Governance Code (the ‘Code’), published in September 2012. The Code can be found on the FRC website (frc.org.uk). We describe how we have applied those Main Principles in this section of the annual report which includes our statement of internal control and risk management, together with the “Directors’ remuneration” section on pages 69 to 85.
How have we complied with the corporate governance statement requirements?We comply with the corporate governance statement requirements pursuant to the FCA’s Disclosure and Transparency Rules by virtue of the information included in this “Governance” section of the annual report together with information contained in the “Shareholder information” section on pages 182 to 189.
Chairman’s overview
“ Businesses must ensure absolute integrity in their business activities and decision-making processes if they are to earn and retain public trust.”
Vodafone Group Plc Annual Report 201448 49Overview
Strategy review Performance Governance Financials
Additional information

Board of directors and Group management
Who are the directors and senior management? Our business is managed by our Board of directors (‘the Board’). Biographical details of the directors and senior management as at 20 May 2014 are as follows (with further information available at vodafone.com/board):
Skills and experience: a Deep knowledge of consumer electronics, technology, healthcare and lifestyle sectors a Wealth of experience operating in developed and emerging markets a Koninklijke Philips Electronics N.V. – President/Chief Executive Officer and Chairman of Board of Management (2001–2011) a Career with Philips spanning over 30 years a Gerard has also held non-executive director positions at Daimler AG (2009–2014) and Dell Inc. (2010–2013)
Other current appointments: a Royal Dutch Shell – Non-executive director and member of the Audit Committee a IBEX Global Solutions plc – Non-executive director
Board Committees: a Nominations and Governance (Chairman)
Skills and experience: a Over 20 years’ experience working in the telecoms sector a Vodafone Group Plc – Chief Executive Europe (2006–2008) a RCS MediaGroup – Chief Executive (2004–2006) a Vodafone Group Plc – Regional Chief Executive Officer, Southern Europe (role later expanded to include Middle East and Africa regions) (2001–2004) a Omnitel Pronto Italia S.p.A. (became Vodafone Italy) – appointed Chief Executive in 1999 (1996–2004) a McKinsey & Company (1986–1996)
Other current appointments: a Bocconi University, Italy – International Advisory Board member a European Round Table of Industrialists – Steering Committee member a McKinsey & Company – International Advisory Board member a Oxford Martin School – Advisory Council member
Board Committees: a None
Gerard KleisterleeChairmanAge: 67Tenure: 3 yearsNationality: Dutch
Vittorio ColaoChief Executive – Executive directorAge: 52Tenure: 7 yearsNationality: Italian
Skills and experience: a Extensive experience in senior finance roles both at Vodafone and other multinational companies a Vodafone Group Plc – Chief Executive, Africa, Middle East and Asia Pacific (2008–2013) a Vodafone Limited (UK operating company ) – various senior roles, including Chief Financial Officer, Chief Commercial Officer and Chief Executive Officer (2002–2008) a United Business Media plc – Chief Financial Officer of subsidiary Miller Freeman Worldwide plc (1999–2001) a Federal Express Worldwide – senior global finance positions (1989–1999)
Other current appointments: a None
Board Committees: a None
Nick ReadChief Financial Officer – Executive directorAge: 49Tenure: <1 yearNationality: British
Skills and experience: a Wealth of international experience across wireline and wireless industries a Extensive understanding of business applications and solutions a Nortel Networks Corporation – various positions over period of 23 years, including Executive Vice President and President of EMEA region (2001–2005) a British Telecom (1977–1982)
Other current appointments: a None
Board Committees: a NoneStephen Pusey
Chief Technology Officer – Executive directorAge: 52Tenure: 4 yearsNationality: British
Skills and experience: a Wealth of international business experience obtained at companies with high levels of customer service a BUPA – Chief Executive Officer (1998–2008) a British Airways – various positions held over a period of 23 years, including director for Asia-Pacific a Non-executive director of the BBC (2008–2011), J Sainsbury plc (2007–2011), Standard Chartered (2005–2013), Compass Group plc (2000–2006), BAA plc (1998–2004) and Cable & Wireless Communications (1997–2000) a Valerie was also a Board member of the Confederation of British Industry and the Association of British Insurers
Other current appointments: a Premier Farnell plc – Non-executive Chairman a TUI Travel PLC – Non-executive director a English National Ballet – Trustee a Historic Royal Palaces – Trustee
Board Committees: a None
Valerie Gooding cbe
Non-executive directorAge: 64Tenure: <1 yearNationality: British
Skills and experience: a Widespread experience of business in Africa, particularly South Africa and Ghana a Standard Bank of South Africa – Non executive director (2006–2012) a Advisor to the former Presidents of Ghana (2001–2009) and South Africa (1999–2008) a Awarded a Lifetime Award by the Commonwealth Business Council and African Business Magazine (2006) a Awarded the Companion of the Order of the Star (Ghana’s highest national award) (2006) and honorary Knighthood (2003) a AngloGold Ashanti Ltd – Executive President (2002–2005) a Lonmin Plc – Director (1992–2004) a Ashanti Goldfields Co Ltd – Chief Executive Officer (1986–2002) a Advisory Council of the President of the African Development Bank – Member (1990–1992)
Other current appointments: a Advisor to the Presidents of Togo and Nigeria a Imara Energy Corp. – Chairman a Iron Mineral Benefeciation Services – Non-executive Deputy Chairman a Jonah Capital (Pty) Limited – Executive Chairman a Range Resources Limited – Non-executive Chairman a Metropolitan Insurance Company Limited – Chairman a The Investment Climate Facility – Member of Trustee Board
Board Committees: a Remuneration
Samuel JonahNon-executive directorAge: 64Tenure: 5 yearsNationality: Ghanaian
Skills and experience: a Senior leader in international business a Knowledge of international IT systems a MacDonald, Dettwiler and Associates (Canada) – Non-executive director (2006–2012) a HSBC Holdings plc – Group Chief Operating Officer (2003–2006); Group Chief Information Officer (1997–2003) a Saudi British Bank – Senior Manager, Planning and Operations (1984–1987) a HSBC Holdings plc – Head of IT Audit (1978–1984)
Other current appointments: a Experian plc – Non-executive director
Board Committees: a Audit and Risk
Alan JebsonNon-executive directorAge: 64Tenure: 7 yearsNationality: British
Skills and experience: a Deep knowledge of the high-tech sector a Wide ranging experience of international management a Intel Corporation – President (2013–present) a Intel Corporation – Executive Vice President and General Manager of the Software and Services Group (2012–2013) a Intel Corporation – Senior Vice President (2010–2012) a Intel Corporation – Vice President (2005–2010) a Intel Software and Services Group – General Manager (2005–2010) a Intel’s Microsoft Program Office – Vice President and General Manager (2000–2005) a Intel Online Services (Intel’s datacentre business) – Director and Chief Operating Officer (1998–2000)
Other current appointments: a Software subsidiaries of Intel Corporation: Havok Inc., Wind River Systems Inc. and McAfee, Inc. – Chairman
Board Committees: a Remuneration
Renee JamesNon-executive directorAge: 49Tenure: 3 yearsNationality: American
Vodafone Group Plc Annual Report 201450

Tenure 0–2 years 21%
3–6 years 29%
7–10 years 50%
Male/female Male 79%
Female 21%
Executive/non-executive Executive 21%
Non-executive 79%
Board diversityYour Board has due regard for the benefits of diversity in its membership, including gender, and strives to maintain the right balance. It comprises individuals with deep knowledge and experience in core and diverse business sectors within local, international and global markets bringing a wide range of perspectives to the business. Further information on our board diversity policy may be found in the Nominations and Governance Committee report on page 58.
Skills and experience: a Financial expert with extensive international experience a Retired from Ernst & Young in 2006 after a career spanning 36 years a Ernst & Young – Chairman (1995–2006); Managing Partner of North European, Middle East, India and Africa Region (1999–2006)
Other current appointments: a Alliance Boots GmbH – Non-executive director a Ashmore Group plc – Senior Independent Director a BBA Aviation plc – Senior Independent Director a Farnham Castle – Chairman of the Board of Trustees a Financial Reporting Council – Non-executive director a The Vodafone Foundation – Chairman of the Board of Trustees a Nick is also an advisor to Alsbridge plc, Dentons UKMEA LLP and Silicon Valley Bank, London
Board Committees: a Audit and Risk (Chairman)
Nick LandNon-executive directorAge: 66Tenure: 7 yearsNationality: British
Skills and experience: a Wealth of international business knowledge a GDF SUEZ – Non-executive director (2000–2012) a AREVA group – Chief Executive Officer (2001–2011) a AREVA NC (formerly Cogema) – Chairman and Chief Executive Officer (1999–2011) a Alcatel – Senior Executive Vice President; Executive Committee member (1997–1999) a Lazard Frères & Cie – Partner (1995–1997) a French Presidency – Deputy Chief of Staff (1991–1995); Advisor for Economic International Affairs (1990)
Other current appointments: a ALP S.A. – Chief Executive Officer a American Express Company – Non-executive director a EADS N. V. – Non-executive director a Efficiency Capital – Partner a Total S.A. – Non-executive director a Rio Tinto plc – Non-executive director
Board Committees: a Audit and Risk
Anne LauvergeonNon-executive directorAge: 54Tenure: 8 yearsNationality: French
Skills and experience: a Financial, management and marketing skills in international business a Société Générale – Director (2006–2012) a Carrefour S.A. – Chairman (2005–2007) a Marks and Spencer Group plc – Chairman (2000–2004) a Promodès/Carrefour – Chief Executive Officer (1995–2000) a Kraft General Foods (1971–1995)
Other current appointments: a Change Capital Partners LLP – Founder and Chairman
Board Committees: a Nominations and Governance a Remuneration (Chairman)
Luc VandeveldeSenior Independent DirectorAge: 63Tenure: 10 yearsNationality: Belgian
Skills and experience: a Extensive experience in investment and asset management a Queen’s University, Belfast – Honorary degree of Doctor of Science (Economics) (2012) a Awarded a CBE for his services to the economic redevelopment of Northern Ireland (2009) a Norges Bank Investment Management – Advisory Board member (2007–2012) a Marks and Spencer Pension Trust – Chairman (2006–2011) a Financial Reporting Council – Member (2004–2007) a Strategic Investment Board in Northern Ireland – Chairman (2003–2010) a Hermes Pensions Management Ltd – Chief Executive (2002–2006); Chief Investment Officer (1998–2002) a Asian Infrastructure Fund – Chairman (1999–2010) a AMP Asset Management plc – Managing Director (1995–1998) a Citicorp Investment Management – Chief International Investment Officer (1991–1998)
Other current appointments: a Senior Independent Director of Hammerson plc, Witan Investment Trust plc and Lloyds Banking Group plc a Norges Bank Investment Management – Corporate Governance Advisory Board member
Board Committees: a Audit and Risk a Nominations and Governance
Anthony Watson cbe
Non-executive directorAge: 69Tenure: 8 yearsNationality: British
Skills and experience: a Private equity investor with experience of business and financial turnaround a 3i Group plc – Chief Executive (2004–2009) a HBOS plc – Non-executive director (2001–2004) a Manchester United plc – Non-executive director (2000–2004) a Investcorp – Managing Director (1999–2004) a Guinness PLC – Finance Director, becoming Finance Director of Diageo plc upon merger of Guinness and Grand Metropolitan PLC in 1997 (1993–1999)
Other current appointments: a Aberdeen Asian Smaller Companies Investment Trust PLC – Non-executive director a bwin.party digital entertainment plc – Non-executive director and Chairman designate a British Heart Foundation – Chairman of the Trustees a The Francis Crick Institute – Independent director of Trustee Board
Board Committees: a Nominations and Governance a Remuneration
Philip YeaNon-executive directorAge: 59Tenure: 8 yearsNationality: British
Copies of the service agreements of the executive directors and letters of appointment of the non-executive directors are available for inspection at our registered office.
Skills and experience: a Innovator in the technology industry a Commercial leader a Google – Senior Vice President Sales and Business Development (1999–2009) a Netscape Communications – Vice President of Business Development (1997–1999) a Netscape Communications – Director of OEM Sales (1995–1997) a The 3DO Company – Director of Product Management (1993–1995) a GO Corporation – Director of Business Development (1991–1993) a Hewlett-Packard – Product Marketing Manager (1984–1989)
Other current appointments: a Google – Senior Advisor to the Office of CEO/Founders
Board Committees: a None
Omid KordestaniNon-executive directorAge: 50Tenure: 1 yearNationality: American
Geographic representation
American Belgian British Dutch
French Ghanaian Italian
Vodafone Group Plc Annual Report 201450 51Overview
Strategy review Performance Governance Financials
Additional information
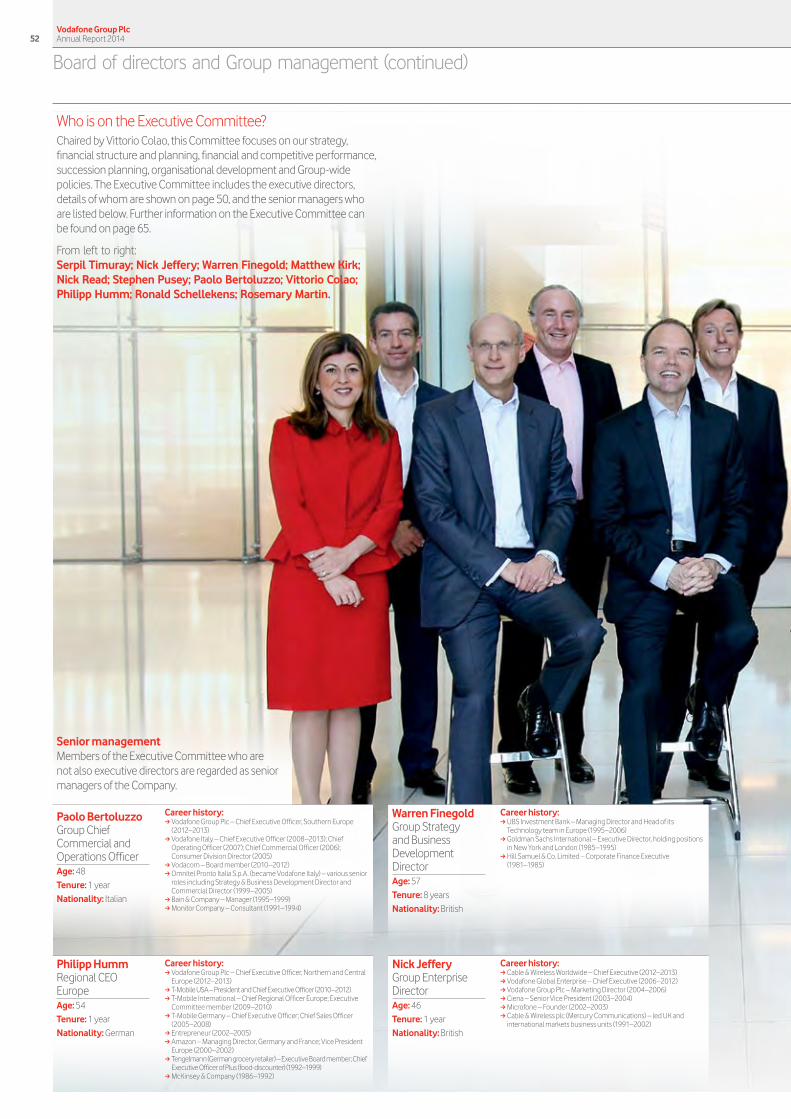
Board of directors and Group management (continued)
Career history: a Vodafone Group Plc – Chief Executive Officer, Southern Europe (2012–2013) a Vodafone Italy – Chief Executive Officer (2008–2013); Chief Operating Officer (2007); Chief Commercial Officer (2006); Consumer Division Director (2005) a Vodacom – Board member (2010–2012) a Omnitel Pronto Italia S.p.A. (became Vodafone Italy) – various senior roles including Strategy & Business Development Director and Commercial Director (1999–2005) a Bain & Company – Manager (1995–1999) a Monitor Company – Consultant (1991–1994)
Career history: a Vodafone Group Plc – Chief Executive Officer, Northern and Central Europe (2012–2013)
a T-Mobile USA – President and Chief Executive Officer (2010–2012) a T-Mobile International – Chief Regional Officer Europe; Executive Committee member (2009–2010) a T-Mobile Germany – Chief Executive Officer; Chief Sales Officer (2005–2008) a Entrepreneur (2002–2005) a Amazon – Managing Director, Germany and France; Vice President Europe (2000–2002)
a Tengelmann (German grocery retailer) – Executive Board member; Chief Executive Officer of Plus (food-discounter) (1992–1999) a McKinsey & Company (1986–1992)
Career history: a Cable & Wireless Worldwide – Chief Executive (2012–2013) a Vodafone Global Enterprise – Chief Executive (2006–2012) a Vodafone Group Plc – Marketing Director (2004–2006) a Ciena – Senior Vice President (2003–2004) a Microfone – Founder (2002–2003) a Cable & Wireless plc (Mercury Communications) – led UK and international markets business units (1991–2002)
Career history: a UBS Investment Bank – Managing Director and Head of its Technology team in Europe (1995–2006) a Goldman Sachs International – Executive Director, holding positions in New York and London (1985–1995) a Hill Samuel & Co. Limited – Corporate Finance Executive (1981–1985)
Paolo BertoluzzoGroup Chief Commercial and Operations OfficerAge: 48Tenure: 1 yearNationality: Italian
Philipp HummRegional CEO EuropeAge: 54Tenure: 1 yearNationality: German
Nick JefferyGroup Enterprise DirectorAge: 46Tenure: 1 yearNationality: British
Warren FinegoldGroup Strategy and Business Development DirectorAge: 57Tenure: 8 yearsNationality: British
Who is on the Executive Committee? Chaired by Vittorio Colao, this Committee focuses on our strategy, financial structure and planning, financial and competitive performance, succession planning, organisational development and Group-wide policies. The Executive Committee includes the executive directors, details of whom are shown on page 50, and the senior managers who are listed below. Further information on the Executive Committee can be found on page 65.
From left to right: Serpil Timuray; Nick Jeffery; Warren Finegold; Matthew Kirk; Nick Read; Stephen Pusey; Paolo Bertoluzzo; Vittorio Colao; Philipp Humm; Ronald Schellekens; Rosemary Martin.
Senior managementMembers of the Executive Committee who are not also executive directors are regarded as senior managers of the Company.
Vodafone Group Plc Annual Report 201452
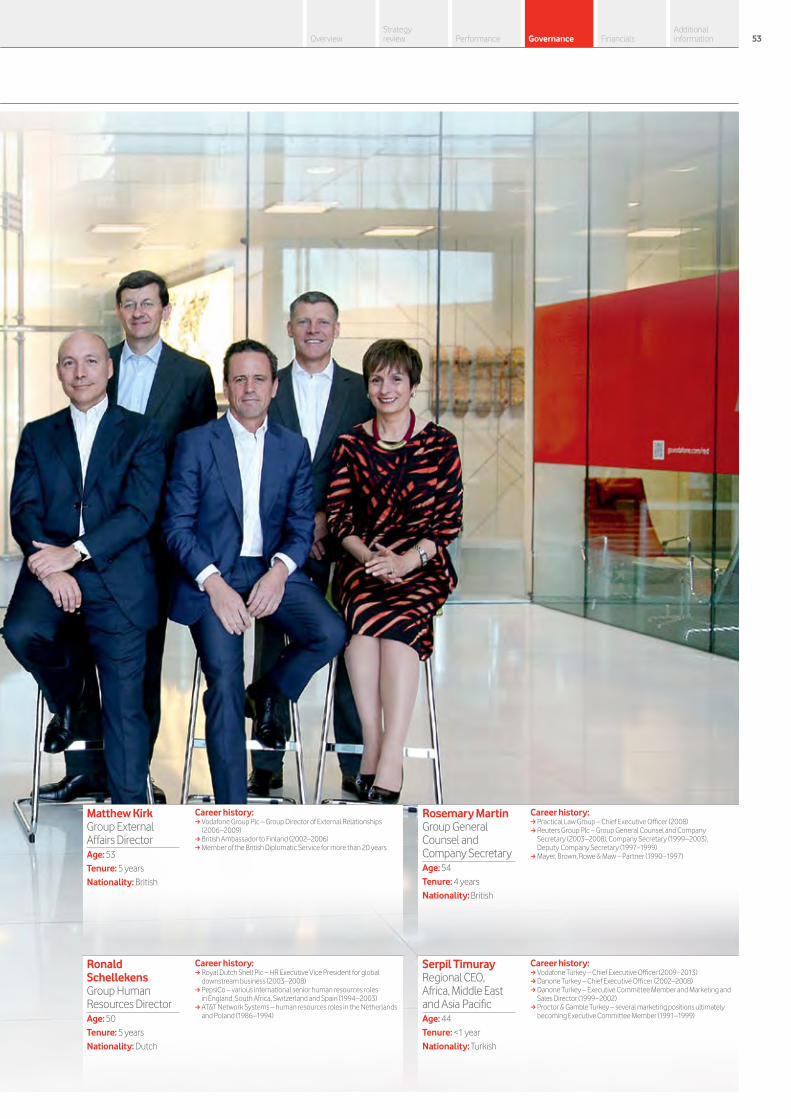
Career history: a Vodafone Group Plc – Group Director of External Relationships (2006–2009) a British Ambassador to Finland (2002–2006) a Member of the British Diplomatic Service for more than 20 years
Matthew KirkGroup External Affairs DirectorAge: 53Tenure: 5 yearsNationality: British
Career history: a Practical Law Group – Chief Executive Officer (2008) a Reuters Group Plc – Group General Counsel and Company Secretary (2003–2008), Company Secretary (1999–2003), Deputy Company Secretary (1997–1999) a Mayer, Brown, Rowe & Maw – Partner (1990–1997)
Rosemary MartinGroup General Counsel and Company SecretaryAge: 54Tenure: 4 yearsNationality: British
Career history: a Royal Dutch Shell Plc – HR Executive Vice President for global downstream business (2003–2008) a PepsiCo – various international senior human resources roles in England, South Africa, Switzerland and Spain (1994–2003) a AT&T Network Systems – human resources roles in the Netherlands and Poland (1986–1994)
Ronald SchellekensGroup Human Resources DirectorAge: 50Tenure: 5 yearsNationality: Dutch
Career history: a Vodafone Turkey – Chief Executive Officer (2009–2013) a Danone Turkey – Chief Executive Officer (2002–2008) a Danone Turkey – Executive Committee Member and Marketing and Sales Director (1999–2002) a Proctor & Gamble Turkey – several marketing positions ultimately becoming Executive Committee Member (1991–1999)
Serpil TimurayRegional CEO, Africa, Middle East and Asia PacificAge: 44Tenure: <1 yearNationality: Turkish
Vodafone Group Plc Annual Report 201452 53Overview
Strategy review Performance Governance Financials
Additional information

How does the Board operate?The role of the BoardThe Board is responsible for the overall conduct of the Group’s business and has the powers and duties set out in the relevant laws of England and Wales and our articles of association. The Board:
a is responsible for setting the Group strategy and for the management, direction and performance of our businesses;
a is accountable to shareholders for the proper conduct of the business;
a is responsible for the long-term success of the Company, having regard for the interests of all stakeholders; and
a is responsible for ensuring the effectiveness of and reporting on our system of corporate governance.
The Board has a formal schedule of matters reserved for its decision and these include:
a Group strategy and long-term plans;
a major capital projects, acquisitions or divestments;
a annual budget and operating plan;
a Group financial structure, including tax and treasury;
a annual and half-year financial results and shareholder communications; and
a system of internal control and risk management.
The schedule is reviewed annually. It was last reviewed in March 2014 when it was decided to add a requirement for Board approval for advisors’ fees in excess of £10 million on corporate acquisitions and disposals.
Other specific responsibilities are delegated to Board committees, details of which are given on pages 58 to 65.
ChairmanGerard Kleisterlee
Key objectives: a leadership, operation and governance of the Board a setting the agenda for the Board
Nominations and Governance CommitteeThree independent non-executive directors plusGerard Kleisterlee (Chairman)
Key objectives: a to ensure the Board comprises
individuals with the necessary skills, knowledge and experience
a to have oversight of all matters relating to corporate governance
More detail: Pages 58 and 59
More detail: Page 55
The Board of Vodafone Group Plc14 directors: three executive directors, the Chairman and ten independent non-executive directors (including the Senior Independent Director).Key objectives:
a responsible for the overall conduct of the Group’s business a setting the Group’s strategy
More detail: See below
Audit and Risk CommitteeFour independent non-executive directors.Chairman: Nick Land
Key objectives: a to provide effective governance
over the Group’s financial results a to review the activity and
performance of the internal audit function and external auditors
a management of the Group’s system of internal control, business risks and related compliance activities
More detail: Pages 60 to 64
Remuneration CommitteeFour independent non-executive directors.Chairman: Luc Vandevelde
Key objective: a to assess and make
recommendations to the Board on the policy on executive remuneration
More detail: Page 65
Chief ExecutiveVittorio Colao
Key objectives: a management of the business a implementation of strategy
and policy
More detail: Page 55
Executive Committee11 members made up of the executive directors, Group function heads and the regional chief executives.Chairman: Vittorio Colao
Key objective: a to focus on strategy, financial structure and planning, financial and competitive
performance, succession planning, organisational development and Group-wide policies
More detail: Page 65
What is our governance framework?Responsibility for good governance lies with your Board. There is a strong and effective governance system in place throughout the Group.
Vodafone Group Plc Annual Report 201454
Corporate governance
Board composition Our Board consists of 14 directors, 13 of whom served throughout the year. Valerie Gooding was appointed as a non-executive director with effect from 1 February 2014.
At 31 March 2014, in addition to the Chairman, Gerard Kleisterlee, there were three executive directors and ten non-executive directors. Andy Halford, the Chief Financial Officer, retired on 31 March 2014 and Nick Read was appointed to this role and as an executive director with effect from 1 April 2014. The executive and non-executive directors are equal members of the Board and have collective responsibility for the Company’s direction. In particular, non-executive directors are responsible for:
a bringing a wide range of skills and experience, including independent judgement on issues of strategy, performance and risk management;
a constructively challenging the strategy proposed by the Chief Executive and executive directors;
a scrutinising and challenging performance across the Group’s business;
a assessing risk and the integrity of the financial information and controls; and
a determining the Company’s broad policy for executive remuneration, and the remuneration packages for the executive directors and the Chairman.
The balance and independence of our Board is kept under review by our Nominations and Governance Committee, details of which can be found on pages 58 and 59.
Tenure of non-executive directors The Code suggests that length of tenure is a factor to consider when determining the independence of non-executive directors. The table below shows the tenure and independence of each of our non-executive directors. We consider all of our non-executive directors to be independent.
Date first elected by
shareholders
Years from first election to
2014 AGM
Considered to be independent
by the Board
Gerard Kleisterlee July 2011 3 See note1
Valerie GoodingTo be put up for
election July 2014 n/a YesRenee James July 2011 3 YesAlan Jebson July 2007 7 YesSamuel Jonah July 2009 5 YesOmid Kordestani July 2013 1 YesNick Land July 2007 7 YesAnne Lauvergeon July 2006 8 YesLuc Vandevelde July 2004 10 Yes2
Anthony Watson July 2006 8 YesPhilip Yea July 2006 8 Yes
Notes:1 Considered to be independent on appointment.2 Considered to be independent for the reasons given on page 59.
Biographical details of the Chairman, Chief Executive and Senior Independent Director can be found on pages 50 and 51 or at vodafone.com/board. Biographical details of the Company Secretary can be found on page 53 or at vodafone.com/exco. The appointment or removal of the Company Secretary is a matter for the Board as a whole.
The ChairmanGerard KleisterleeThe role of the Chairman is set out in writing and agreed by the Board. He is responsible for:
a the effective leadership, operation and governance of the Board;
a ensuring the effectiveness of the Board;
a setting the agenda, style and tone of Board discussions; and
a ensuring the directors receive accurate, timely and clear information.
Key roles and responsibilities
The Chief ExecutiveVittorio ColaoThe role of the Chief Executive is set out in writing and agreed by the Board. He is responsible for:
a management of the Group’s business;
a implementation of the Company’s strategy and policies;
a maintaining a close working relationship with the Chairman; and
a chairing the Executive Committee.
The Senior Independent DirectorLuc VandeveldeThe Senior Independent Director is responsible for:
a acting as a sounding board for the Chairman;
a serving as an intermediary for the other directors;
a being available to shareholders if they have concerns which they have not been able to resolve through the normal channels of the Chairman, Chief Executive or other executive directors or for which such contact is inappropriate; and
a conducting an annual review of the performance of the Chairman and, in the event it should be necessary, convening a meeting of the non-executive directors.
The Company SecretaryRosemary MartinThe Company Secretary acts as Secretary to the Board. In doing so she:
a assists the Chairman in ensuring that all directors have full and timely access to all relevant information;
a assists the Chairman by organising induction and training programmes;
a is responsible for ensuring that the correct Board procedures are followed and advises the Board on corporate governance matters; and
a administers the procedure under which directors can, where appropriate, obtain independent professional advice at the Company’s expense.
Vodafone Group Plc Annual Report 201454 55Overview
Strategy review Performance Governance Financials
Additional information

Board activities in the 2014 financial yearBoard activities are structured to assist the Board in achieving its goal to support and advise executive management on the delivery of the Group’s strategy within a transparent governance framework.
The diagram below shows the key areas of focus for the Board which appear as items on the Board’s agenda at relevant times throughout the year. Concentrated discussion of these items assists the Board in making the right decisions based on the long-term opportunities for the business and its stakeholders.
Key areas of focus for the Board
Business strategy
Customer propositions,
technological, geographic and
structural strategy
Diversity and talent
Succession planning
Talent capability and diversity
Business performance
Chief Executive’s business report
Commercial performance in local markets
Business development
Brand status and evolution
Operations updates
Governance
Board performance
Board committee reports
Corporate governance updates
Financials
Chief Financial Officer’s report
Long range plan/ forecasts
Management accounts
Sustainability
Transformational products
and services
Sustainable business practices
Vodafone Foundation
Shareholder focus
Returns to shareholders
Shareholder engagement
Being responsible
Health and safety
Compliance
Reputation
Business risks
Strategic and operational risks
Conflicts of interestThe Board is aware of the other commitments of its directors and is satisfied that these do not conflict with their duties as directors of the Company. The process for monitoring conflicts is as follows:
a changes to the commitments of all directors are reported to the Board;
a the directors are required to complete a conflicts questionnaire initially on appointment and annually thereafter;
a any conflicts identified would be submitted to the Board (excluding the director to whom the potential conflict related) for consideration and, as appropriate, authorisation in accordance with the Companies Act 2006 and the articles of association;
a where authorisation is granted, it would be recorded in a register of potential conflicts and reviewed periodically; and
a directors are responsible for notifying the Company Secretary if they become aware of actual or potential conflict situations or a change in circumstances relating to an existing authorisation.
No conflicts of interest have been identified during the year.
Board meetingsMatters considered at all Board meetings include:
a the Chief Executive’s report on strategic and business developments;
a the Chief Financial Officer’s report which includes the latest available management accounts;
a an operations update (covering commercial, technology and operational matters);
a a report on potential changes to the Group’s portfolio of corporate assets; and
a where applicable, reports from the Nominations and Governance Committee, Audit and Risk Committee and Remuneration Committee.
In addition to the standing agenda items, topics covered by the Board during the year included the disposal of the Company’s interest in Verizon Wireless, the acquisition of the remaining interest in Vodafone Italy, the acquisition of Kabel Deutschland and the audit tender.
Board effectiveness Board effectiveness is reviewed every year. After last year’s external performance evaluation the Board agreed:
a to develop further its approach to strategic planning and involve the directors earlier in the process of strategy development;
a to provide more opportunities for the directors to meet with executives to assist in succession planning; and
a to ensure the induction of new directors enables them rapidly to contribute fully to the Board.
Since then, the Chairman has introduced a number of improvements including: informing the Board regularly about possible Board appointments, trying to speed up the director appointment process, organising for senior executives to brief directors on various aspects of our business and increasing the number of opportunities available for senior executives to meet with the Board, e.g. through informal meetings or mentoring, and improving the induction programme for new directors.
Performance evaluationBoard effectiveness is reviewed by an external performance evaluation every three years. As an external evaluation was conducted last year, this year the Board performed an internal performance evaluation.
Vodafone Group Plc Annual Report 201456
Corporate governance (continued)

What is the performance evaluation process?
a This year the Chairman met with each director and with executives and advisors who interact with the Board. Interviewees were asked to consider and comment on the performance of the Board as a whole.
a The directors were also asked for their views on, amongst other things: Company strategy, key challenges for the business, the mix of skills, experience, independence, knowledge and diversity on the Board (including gender), effectiveness of the Board’s engagement with shareholders and how well the Board operates.
a The Chairman reviewed the directors’ contributions and the Senior Independent Director led the review of the performance of the Chairman.
a Each Board committee undertook a detailed self-assessment questionnaire.
Output of the performance evaluation
a The Chairman of each Board committee gave feedback on the evaluation of their committee to the Board at its March meeting.
a The Chairman prepared a report on the performance evaluation which was distributed to the directors, reviewed by the Nominations and Governance Committee, and discussed with the Board at the March Board meeting.
a This year’s findings were that the Board was reasonably well balanced. Diversity had improved and it should continue on that path. The process for appointing directors needed to be speeded up. Board arrangements and information flows were generally satisfactory, but more focus could be given on market information and the changing regulatory and competitive environment. Some further refinement of the presentation of performance metrics was agreed. The Board was comfortable with the strong value system and control framework in the Company. Directors observed that executive succession planning had improved. Overall, the directors considered the right balance is struck between operational, strategic and governance matters and directors were positive about the open atmosphere around the boardroom table allowing for a robust and constructive dialogue.
The Board will continue to review its procedures, its effectiveness and development in the financial year ahead.
Board inductionThe Chairman is responsible for ensuring that each director receives an induction on joining the Board and receives the training he or she requires. The Company Secretary organises the induction.
Director induction On appointment, directors receive a personalised induction programme covering amongst other things:
a the business of the Group;
a their legal and regulatory responsibilities as directors;
a briefings and presentations from relevant executives; and
a opportunities to visit business operations.
The induction programme is tailored to each new director, depending on his or her experience and background, and reviewed by the Nominations and Governance Committee.
Information and professional developmentKeeping up-to-date with key business developments is essential for the directors to maintain and enhance their effectiveness. This is achieved as follows:
a from time to time the Board receives presentations from executives in our business on matters of significance. This year there were presentations on our Enterprise business, retail distribution, new products and the regional chief executives delivered presentations on their region’s businesses, the Chief Commercial Officer and Chief Brand Director presented on brand status and evolution and the Group HR Director delivered a presentation on planned actions for improving talent, capability and effectiveness within the Company;
a financial plans, including budgets and forecasts, are regularly discussed at Board meetings;
a the directors have the opportunity to learn the views of major investors at planned events throughout the year (see “How do we engage with our shareholders?” on page 66);
a our directors periodically visit different parts of the Group. In September 2013 the Board met with senior management in the Netherlands and in March 2014 the Board met with senior management in Portugal;
a the non-executive directors are provided with briefings and information to assist them in performing their duties; and
a the directors are regularly updated on the Group’s businesses and the regulatory and industry specific environments in which we operate. Updates are by way of written briefings and meetings with senior executives and, where appropriate, external sources.
As part of their annual performance evaluation, directors are given the opportunity to discuss training and development needs. Directors are expected to take responsibility for identifying their training needs and to take steps to ensure that they are adequately informed about the Company and their responsibilities as a director. The Board is confident that all its members have the knowledge, ability and experience to perform the functions required of a director of a listed company. The Board recognises that there may be occasions when one or more of the directors feels it is necessary to take independent legal and/or financial advice at the Company’s expense. There is an agreed procedure to enable them to do so which is managed by the Company Secretary. No such independent advice was sought in the 2014 financial year.
Re-election of directors All the directors submit themselves for re-election at the AGM to be held on 29 July 2014 with the exception of Valerie Gooding, Dame Clara Furse, Nick Read and Sir Crispin Davis who will seek election for the first time in accordance with our articles of association and Anne Lauvergeon, Alan Jebson and Anthony Watson who will resign from the Board at the AGM. The Nominations and Governance Committee confirmed to the Board that the contributions made by the directors offering themselves for re-election at the AGM in July 2014 continue to be effective and that the Company should support their re-election.
Indemnification of directorsIn accordance with our articles of association and to the extent permitted by the laws of England and Wales, directors are granted an indemnity from the Company in respect of liabilities incurred as a result of their office. In addition, we maintained a directors’ and officers’ liability insurance policy throughout the year. Neither our indemnity nor the insurance provides cover in the event that a director is proven to have acted dishonestly or fraudulently.
Vodafone Group Plc Annual Report 201456 57Overview
Strategy review Performance Governance Financials
Additional information
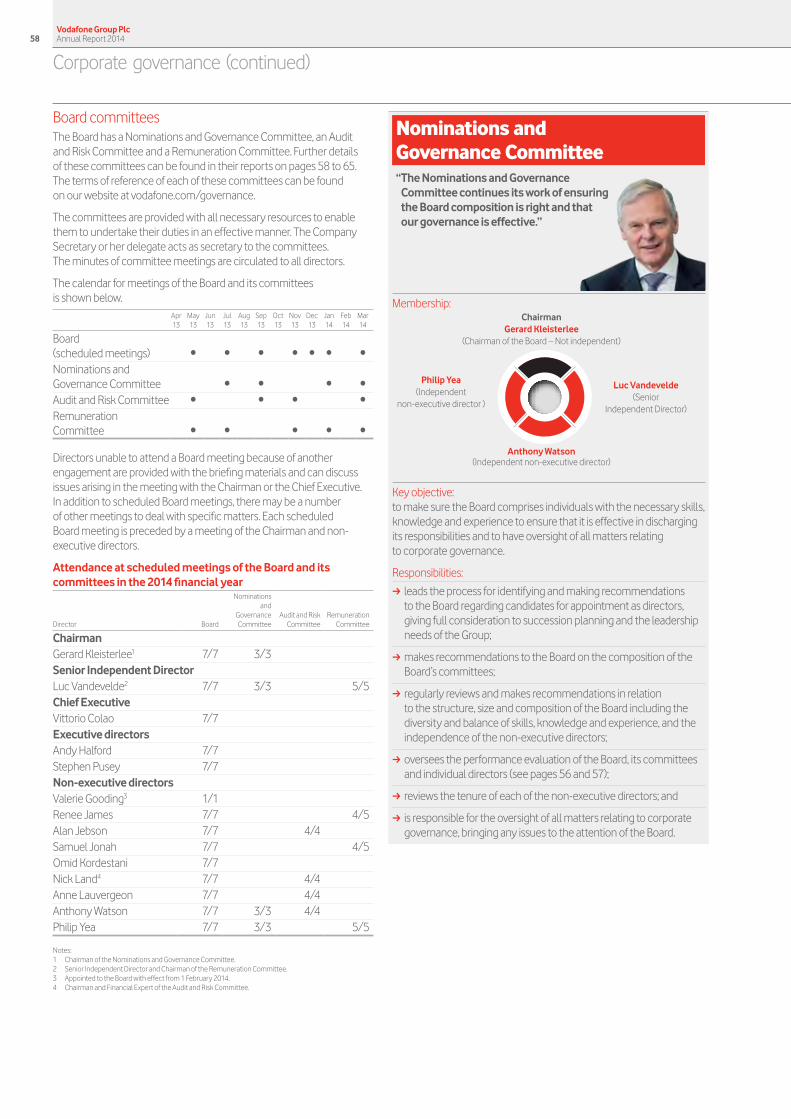
Board committees The Board has a Nominations and Governance Committee, an Audit and Risk Committee and a Remuneration Committee. Further details of these committees can be found in their reports on pages 58 to 65. The terms of reference of each of these committees can be found on our website at vodafone.com/governance.
The committees are provided with all necessary resources to enable them to undertake their duties in an effective manner. The Company Secretary or her delegate acts as secretary to the committees. The minutes of committee meetings are circulated to all directors.
The calendar for meetings of the Board and its committees is shown below.
Apr 13
May 13
Jun 13
Jul 13
Aug 13
Sep 13
Oct 13
Nov 13
Dec 13
Jan 14
Feb 14
Mar 14
Board (scheduled meetings) • • • • • • •Nominations and Governance Committee • • • •Audit and Risk Committee • • • •Remuneration Committee • • • • •
Directors unable to attend a Board meeting because of another engagement are provided with the briefing materials and can discuss issues arising in the meeting with the Chairman or the Chief Executive. In addition to scheduled Board meetings, there may be a number of other meetings to deal with specific matters. Each scheduled Board meeting is preceded by a meeting of the Chairman and non-executive directors.
Attendance at scheduled meetings of the Board and its committees in the 2014 financial year
Director Board
Nominations and
Governance Committee
Audit and Risk Committee
Remuneration Committee
ChairmanGerard Kleisterlee1 7/7 3/3Senior Independent Director Luc Vandevelde2 7/7 3/3 5/5Chief ExecutiveVittorio Colao 7/7Executive directors Andy Halford 7/7Stephen Pusey 7/7Non-executive directorsValerie Gooding3 1/1Renee James 7/7 4/5Alan Jebson 7/7 4/4Samuel Jonah 7/7 4/5Omid Kordestani 7/7Nick Land4 7/7 4/4Anne Lauvergeon 7/7 4/4Anthony Watson 7/7 3/3 4/4Philip Yea 7/7 3/3 5/5
Notes:1 Chairman of the Nominations and Governance Committee.2 Senior Independent Director and Chairman of the Remuneration Committee.3 Appointed to the Board with effect from 1 February 2014.4 Chairman and Financial Expert of the Audit and Risk Committee.
Nominations and Governance Committee “ The Nominations and Governance
Committee continues its work of ensuring the Board composition is right and that our governance is effective.”
Membership:
Key objective:to make sure the Board comprises individuals with the necessary skills, knowledge and experience to ensure that it is effective in discharging its responsibilities and to have oversight of all matters relating to corporate governance.
Responsibilities:
a leads the process for identifying and making recommendations to the Board regarding candidates for appointment as directors, giving full consideration to succession planning and the leadership needs of the Group;
a makes recommendations to the Board on the composition of the Board’s committees;
a regularly reviews and makes recommendations in relation to the structure, size and composition of the Board including the diversity and balance of skills, knowledge and experience, and the independence of the non-executive directors;
a oversees the performance evaluation of the Board, its committees and individual directors (see pages 56 and 57);
a reviews the tenure of each of the non-executive directors; and
a is responsible for the oversight of all matters relating to corporate governance, bringing any issues to the attention of the Board.
Chairman Gerard Kleisterlee
(Chairman of the Board – Not independent)
Anthony Watson (Independent non-executive director)
Philip Yea (Independent
non-executive director )
Luc Vandevelde (Senior
Independent Director)
Vodafone Group Plc Annual Report 201458
Corporate governance (continued)

Committee meetingsNo one other than a member of the Committee is entitled to be present at its meetings; however, other non-executive directors, the Chief Executive and external advisors may be invited to attend. In the event of matters arising concerning my membership of the Board, I would absent myself from the meeting as required and the Board’s Senior Independent Director would take the chair.
Main activities of the Committee during the yearThe Committee met four times during the year and considered executive and non-executive succession planning, refreshment of skills of the Board and the Board effectiveness review.
The Committee leads the process for appointments to the Board. There is a formal, rigorous and transparent procedure for the appointment of new directors. Candidates are identified and selected on merit against objective criteria and with due regard to the benefits of diversity on the Board, including gender.
Four external searches were commissioned during the year, using independent executive search firms, Korn Ferry and Egon Zehnder, neither of which has any other connection to the Company. The first search related to identification of non-executive director candidates with relevant City and/or marketing experience and was undertaken by Korn Ferry. Valerie Gooding was identified as a potential candidate and subsequently recommended to the Board by the Committee on the basis that she met the desired criteria having previously been leader of a branded consumer business.
Korn Ferry also undertook a search to identify a non-executive director with international business experience and chief executive officer experience. The search identified Sir Crispin Davis as a potential candidate and he was subsequently recommended to the Board by the Committee based on his international business experience as a former CEO of a global publishing company. A search was also conducted, again by Korn Ferry, to identify a non-executive director with international banking and finance experience as well as chief executive officer experience. This search identified Dame Clara Furse who was recommended by the Committee for appointment by the Board based on her significant banking and finance experience as former CEO of a number of financial institutions.
Egon Zehnder undertook an external search in respect of the role of Group Chief Financial Officer. Concurrent to this external search, an internal search was undertaken for this role and, following an extensive review of candidates, a preferred internal candidate was chosen with Nick Read being recommended for appointment by the Committee.
The Committee recognises that with the changes in Board composition, changes will be required on the Board’s committees. The first of these changes will be to invite Omid Kordestani to join the Committee with effect from 28 July 2014. Changes will also take place to the Remuneration Committee and Audit and Risk Committee. With effect from 28 July 2014, Philip Yea will resign from the Remuneration Committee and Valerie Gooding will join the Remuneration Committee. Also on 28 July 2014, Sir Crispin Davis, who will be appointed to the Board on this date, and Philip Yea will join the Audit and Risk Committee. Dame Clara Furse will also join the Audit and Risk Committee on her appointment to the Board on 1 September 2014.
The Board acknowledges that diversity extends beyond the boardroom and supports management in their efforts to build a diverse organisation. It endorses the Company’s policy to attract and develop a highly qualified and diverse workforce; to ensure that all selection decisions are based on merit and that all recruitment activities are fair and non-discriminatory. The boardroom diversity policy was introduced in February 2012 and reviewed by the Committee in March 2013 and March 2014. It acknowledges the importance of diversity, including gender, to the effective functioning of the Board and focuses on our aspiration to have a minimum of 25% female representation on the Board by 2015. With the appointment of Valerie Gooding on 1 February 2014 the Board has 21% female representation which will increase to 23% on the appointment of Dame Clara Furse on 1 September 2014. Subject to securing suitable candidates, when making appointments we will seek directors who fit the skills criteria and gender balance that is in line with the Board’s aspiration. We continue to focus on encouraging diversity of business skills and experience, recognising that directors with diverse skills sets, capabilities and experience gained from different geographic and cultural backgrounds enhance the Board. Further information, including the proportions of women in senior management, is shown in “Our people” on page 36 and within the organisation overall, is contained in our 2013-14 sustainability report, available at vodafone.com/sustainability/report2014.
This year, when reviewing the re-election of directors at the AGM in July, the Committee took account of the fact that Luc Vandevelde will have served 11 years as of 31 August 2014 and Philip Yea will have served nine years as of 1 September 2014. The Board has considered the matter carefully and believes that both these non-executive directors continue to demonstrate the qualities of independence and judgement in carrying out their roles, supporting the executive directors and senior management in an objective manner. Their length of service and resulting experience and knowledge of the Company is of great benefit to the Board and both directors will stand for re-election at the AGM. The subject of their independence will be kept under review.
In the year ahead the Committee will continue to assess what enhancements should be made to the Board’s and committees’ composition and will continue to monitor developments in corporate governance to ensure the Company remains at the forefront of good governance practices.
Gerard KleisterleeOn behalf of the Nominations and Governance Committee
20 May 2014
Vodafone Group Plc Annual Report 201458 59Overview
Strategy review Performance Governance Financials
Additional information

Audit and Risk Committee“ Our work continued to focus on the appropriateness
of the Group’s financial reporting, the rigour of the external and internal audit processes, the Group’s management of risk and its system of internal controls. We also conducted a tender for the Group’s statutory audit which resulted in the proposal to shareholders to confirm the appointment of PricewaterhouseCoopers LLP as Group auditors for the 2015 financial year.”
Membership:
Key objective:the provision of effective governance over the appropriateness of the Group’s financial reporting including the adequacy of related disclosures, the performance of both the internal audit function and the external auditor and oversight over the Group’s systems of internal control, business risks and related compliance activities.
Responsibilities:
a reviewing our financial results announcements and financial statements and monitoring compliance with relevant statutory and listing requirements;
a reporting to the Board on the appropriateness of our accounting policies and practices including those identified as critical and requiring further disclosure;
a advising the Board on whether the annual report, taken as a whole, is fair, balanced and understandable and provides the information necessary for shareholders to assess the Company’s performance, business model and strategy;
a overseeing the relationship with the external auditor;
a reviewing the scope, resources, results and effectiveness of the activity of the Group internal audit department;
a monitoring our compliance efforts in respect of section 404 and section 302 of the US Sarbanes-Oxley Act;
a considering and making recommendations to the Board on the nature and extent of the significant risks the Group is willing to take in achieving its strategic objectives;
a overseeing the Group’s compliance processes; and
a performing in-depth reviews of specific areas of financial reporting, risk and internal controls.
The Committee and its workThe membership of the Committee has been selected with the aim of providing the wide range of financial and commercial expertise necessary to meet its responsibilities. Given my recent and relevant financial experience, the Board has designated me as its financial expert on the Committee for the purposes of the US Sarbanes-Oxley Act and the UK Corporate Governance Code. There were no changes to the membership of the Committee during the year, all of whom are non-executive directors of the Company.
The Committee meets at least four times during the year as part of its standard processes, supplemented by additional meetings as necessary. The external auditor, Deloitte LLP, is also invited to each meeting together with the Chief Executive, the Chief Financial Officer, the Group Financial Controller, the Group Financial Reporting Director and the Group Audit Director. The work of the Committee is structured around its responsibilities set out above and its detailed terms of reference which are available at vodafone.com/governance. In addition to these activities the Committee conducts a rolling programme of “in-depth review” sessions where the Group’s senior management provide briefings on key issues and developments particularly in relation to aspects of risk management. A summary of the reviews undertaken during the year are set out within “Risk management” below.
The Committee also regularly meets separately with Deloitte LLP, the Chief Financial Officer and the Group Audit Director without others being present.
Meetings of the Committee generally take place just prior to a Board meeting to maximise the efficiency of interaction with the Board and I report to the Board, as part of a separate agenda item, on the activity of the Committee and matters of particular relevance to the Board in the conduct of its work.
Following the external review of the Committee’s effectiveness in the previous year, I, together with the Committee’s secretary, conducted an internal review of effectiveness involving the members of the Committee, Company management and the external auditor. This confirmed the Committee remained effective at meeting its objectives.
Chairman and financial expert Nick Land
(Independent non-executive director)
Anne Lauvergeon (Independent non-executive director)
Anthony Watson (Independent
non-executive director)
Alan Jebson (Independent
non-executive director)
Vodafone Group Plc Annual Report 201460
Corporate governance (continued)

Main activities of the Committee during the yearI have set out below a summary of the major activities of the Committee in the year categorised between; financial reporting and the related statutory audit; risk management; and the assessment of internal controls. In addition, the Committee conducted a tender for the statutory audit through the process summarised on page 63.
Financial reporting and the related statutory auditThe Committee’s primary responsibility in relation to the Group’s financial reporting is to review with both management and the external auditor the appropriateness of the half-year and annual financial statements concentrating on, amongst other matters:
a the quality and acceptability of accounting policies and practices;
a the clarity of the disclosures and compliance with financial reporting standards and relevant financial and governance reporting requirements;
a any correspondence from regulators in relation to our financial reporting;
a material areas in which significant judgements have been applied or there has been discussion with the external auditor; and
a whether the annual report, taken as a whole, is fair, balanced and understandable and provides the information necessary for shareholders to assess the Company’s performance, business model and strategy. As part of the Committee’s assessment of the annual report, it draws on the work of the Group’s disclosure committee and also has discussions with senior management. The Committee’s overall assessment forms the basis of the advice given to the Board to assist them in making the statement required by the UK Corporate Governance Code.
The Committee is committed to the continuous improvement in the effectiveness and clarity of the Group’s corporate reporting and has encouraged management to support and adopt initiatives by regulatory bodies which would enhance our reporting.
External auditAt the start of the audit cycle for the new financial year we received from Deloitte LLP a detailed audit plan identifying their audit scope, planning materiality and their assessment of key risks, which were discussed and agreed with the Committee. Planning materiality was lower this year, primarily driven by the disposal of our interest in Verizon Wireless. The audit risk identification process is considered a key factor in the overall effectiveness of the external audit process. For the 2014 financial year, the key risks identified were a combination of those identified in the 2013 financial year, being those in relation to goodwill impairment, provisioning for current tax liabilities and deferred tax asset recognition, and revenue recognition as these areas continue to require inherent management judgement, and three new specific risks identified in relation to (i) the accounting for the disposal of our interest in Verizon Wireless and the related acquisition of the remaining 23% interest in Vodafone Italy, (ii) the accounting for our acquisition of Kabel Deutschland and (iii) provisioning for legal and regulatory claims. The latter risk factor was added specifically in response to the reduction in audit materiality.
At each meeting of the Committee, these risks are reviewed and both management’s primary areas of judgement and the external auditor’s key areas of audit focus, are challenged. As a Committee, we support the professional scepticism, particularly in the areas of key judgement and accounting disclosure, displayed by Deloitte LLP.
We hold private meetings with the external auditor at each Committee meeting to provide additional opportunity for open dialogue and feedback from the Committee and the auditor without management being present. Matters typically discussed include the external auditor’s assessment of business risks and management activity thereon, the transparency and openness of interactions with management, confirmation that there has been no restriction in scope placed on them by management, independence of their audit and how they have exercised professional scepticism. I also meet with the external lead audit partner outside the formal Committee process throughout the year.
External audit process effectivenessWe use an audit quality framework to assess the effectiveness of the external audit process. This involves detailed questioning of management at an operating company and Group level and also the members of the Committee. We also considered the firm-wide audit quality inspection report issued by the FRC in May 2013 and Deloitte’s response to the findings. The observations from this assessment for the 2014 financial year were presented and discussed at the May 2014 meeting. Management concluded that there had been appropriate focus and challenge on the primary areas of audit risk and assessed the quality of the audit process to be satisfactory. The Committee concurred with this view. The Committee has identified the 2015 financial year as a potential period of increased risk given the transition of the statutory auditor and will focus closely on this matter throughout the year.
Risk managementThe Group’s risk assessment process and the way in which significant business risks are managed is a key area of focus for the Committee. Our work here was driven primarily by the Group’s assessment of its principal risks and uncertainties, as set out on pages 196 to 200. We receive reports from the Group Audit Director on the Group’s risk evaluation process and review changes to significant risks identified at both operating entity and Group levels.
In addition, the Committee also conducts a rolling programme of in-depth reviews into specific financial, operational and regulatory areas of the business. During the 2014 financial year, in-depth reviews were undertaken in the areas of:
a corporate treasury management;
a legal intercept and related data management;
a competition law and anti-bribery law compliance;
a the management of risk within the supply chain;
a information security;
a risk management within the IT platform standardisation programme in Vodafone UK; and
a the control environment in Vodafone Ghana.
In addition, the Committee received an update on Group legal compliance matters.
These reviews are critical to the role of the Committee, as they allow us to meet key business leaders responsible for these areas and provide independent challenge to their activities.
Vodafone Group Plc Annual Report 201460 61Overview
Strategy review Performance Governance Financials
Additional information

Significant issuesThe Committee discussed with management the critical accounting judgements and key sources of estimation uncertainty outlined in note 1 “Basis of preparation”. The significant areas of focus considered by the Committee in relation to the 2014 accounts, and how these were addressed, are outlined below:
Matter considered ActionGoodwill impairment testing This continued to represent a significant area of focus for the Committee given the materiality of the Group’s goodwill balances (£23.3 billion at 31 March 2014) and the inherent subjectivity in impairment testing. The judgements in relation to goodwill impairment continue to relate primarily to the assumptions underlying the calculation of the value in use of the business, being the achievability of the long-term business plan and the macroeconomic and related modelling assumptions underlying the valuation process.
The Committee received detailed reporting from management and challenged the appropriateness of the assumptions made. Areas of focus were the achievability of the business plans, assumptions in relation to terminal growth in the businesses at the end of the plan period, particularly in Europe where adverse trends in financial performance have been experienced, and discount rates, which have been subject to volatility given the current macroeconomic conditions.
This remains a prime area of audit focus and Deloitte LLP provided detailed reporting on these matters to the Committee including sensitivity testing.
Taxation The Group is subject to a range of tax claims and related legal actions across a number of jurisdictions where it operates. The most material claim is from the Indian tax authorities in relation to our acquisition of Vodafone India Limited from Hutchison Telecommunications International Limited group in 2007, for the amount of INR 142 billion (£1.4 billion) including interest. Further details of this claim are described in note 30 “Contingent liabilities”.
Further, the Group has extensive accumulated tax losses as outlined in note 6 “Taxation”, and a key management judgement is whether a deferred tax asset should be recognised in respect of these losses. As at 31 March 2014 the Group had recognised a £21.2 billion deferred tax asset in respect of these tax losses.
The Group Tax Director presented management’s view of both the provisioning and disclosure of tax contingencies and deferred tax asset recognition at the May 2014 meeting of the Committee. In respect of tax contingencies, including the India case noted opposite, this involved a discussion of the extent and strength of professional advice received from external legal and advisory firms. In relation to the recognition of the deferred tax assets, management’s plans and expectations for future taxable profits were critically reviewed.
This is also an area of higher audit risk and accordingly, the Committee receives detailed oral and written reporting from Deloitte LLP on these matters.
Liability provisioning The Group is subject to a range of claims and legal actions from a number of sources including competitors, regulators, customers, suppliers, and on occasion fellow shareholders in Group subsidiaries. The level of provisioning for contingent and other liabilities is an issue where management and legal judgements are important and accordingly an area of Committee focus. The most material claim is from Telecom Egypt in relation to allegations of breach of non-discrimination provisions within an interconnect agreement. Details of the claim are outlined in note 30 “Contingent liabilities”.
The Committee received a presentation from the Group’s General Counsel and Company Secretary in May 2014 on management’s assessment of the most material claims, including relevant legal advice received and the level of provision held against each. Deloitte LLP also reviews these matters, forming an independent view that is discussed with the Committee.
Revenue recognition The timing of revenue recognition, the recognition of revenue on a gross or net basis, the treatment of discounts, incentives and commissions and the accounting for multi-element arrangements are complex areas of accounting.
Deloitte LLP outlined to the Committee their approach to the audit of revenue, as part of their presentation of the detailed audit plan. The Committee also considered any observations made by the auditors as part of their reporting to the Committee.
Acquisitions and disposals The Group made a number of highly material business acquisitions and disposals during the year including the disposal of Verizon Wireless, and the acquisition of interests in Kabel Deutschland and Vodafone Italy. This gave rise to a number of complex accounting and disclosure requirements in the financial statements.
Management outlined the key accounting and disclosure impacts in relation to these transactions. The Committee requested and received detailed reporting from Deloitte LLP on their assessment of the accounting and disclosures made by management in both the half-year and annual financial statements.
IT controls in relation to privileged user access The Group’s IT infrastructure platform hosts a number of financial reporting related applications. An issue was identified in respect of privileged user access controls within part of the IT infrastructure platform which could have had an adverse impact on certain of the Group’s controls and financial systems.
Management outlined tested alternative controls in place which provided assurance over the completeness and accuracy of the information derived from the impacted financial reporting related applications.
Deloitte LLP extended their controls and substantive testing to obtain assurance over both the compensating controls and the completeness and accuracy of the management information derived from these applications.
Vodafone Group Plc Annual Report 201462
Corporate governance (continued)
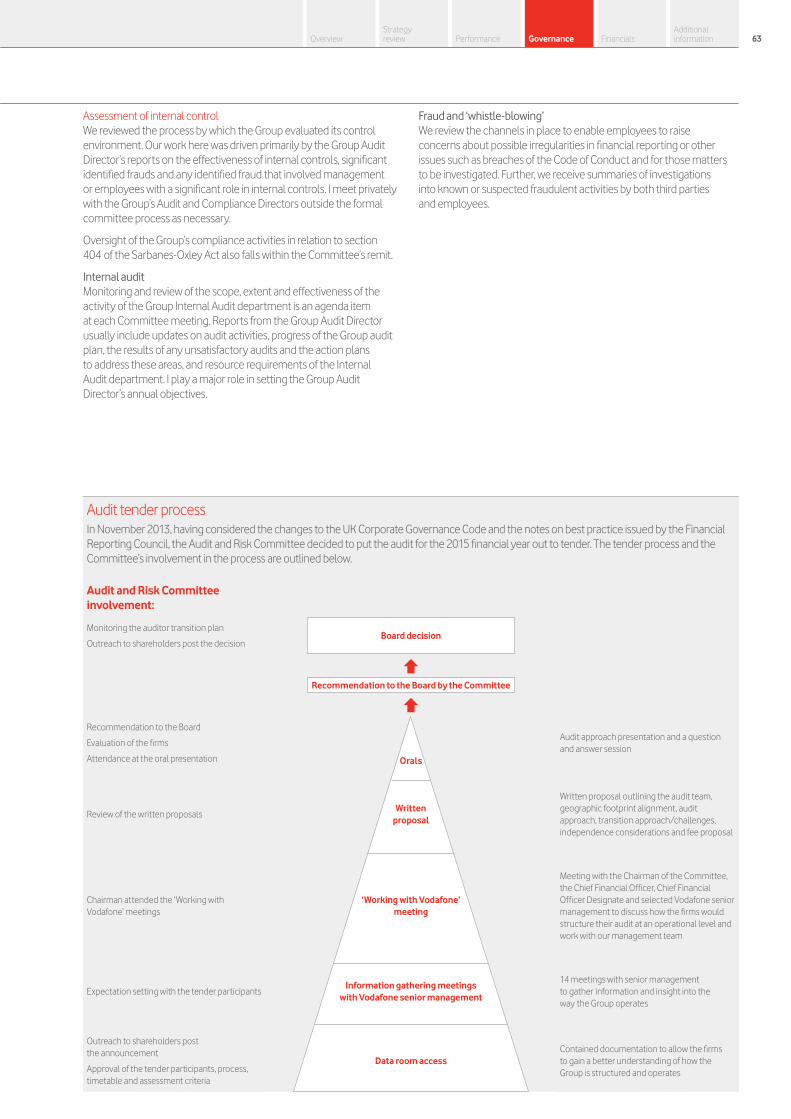
Assessment of internal controlWe reviewed the process by which the Group evaluated its control environment. Our work here was driven primarily by the Group Audit Director’s reports on the effectiveness of internal controls, significant identified frauds and any identified fraud that involved management or employees with a significant role in internal controls. I meet privately with the Group’s Audit and Compliance Directors outside the formal committee process as necessary.
Oversight of the Group’s compliance activities in relation to section 404 of the Sarbanes-Oxley Act also falls within the Committee’s remit.
Internal auditMonitoring and review of the scope, extent and effectiveness of the activity of the Group Internal Audit department is an agenda item at each Committee meeting. Reports from the Group Audit Director usually include updates on audit activities, progress of the Group audit plan, the results of any unsatisfactory audits and the action plans to address these areas, and resource requirements of the Internal Audit department. I play a major role in setting the Group Audit Director’s annual objectives.
Fraud and ‘whistle-blowing’We review the channels in place to enable employees to raise concerns about possible irregularities in financial reporting or other issues such as breaches of the Code of Conduct and for those matters to be investigated. Further, we receive summaries of investigations into known or suspected fraudulent activities by both third parties and employees.
Audit tender processIn November 2013, having considered the changes to the UK Corporate Governance Code and the notes on best practice issued by the Financial Reporting Council, the Audit and Risk Committee decided to put the audit for the 2015 financial year out to tender. The tender process and the Committee’s involvement in the process are outlined below.
Audit and Risk Committee involvement:
Monitoring the auditor transition plan
Outreach to shareholders post the decisionBoard decision
Recommendation to the Board by the Committee
Recommendation to the Board
Evaluation of the firms
Attendance at the oral presentation
Orals
Audit approach presentation and a question and answer session
Review of the written proposalsWritten
proposal
Written proposal outlining the audit team, geographic footprint alignment, audit approach, transition approach/challenges, independence considerations and fee proposal
Chairman attended the ‘Working with Vodafone’ meetings
‘Working with Vodafone’ meeting
Meeting with the Chairman of the Committee, the Chief Financial Officer, Chief Financial Officer Designate and selected Vodafone senior management to discuss how the firms would structure their audit at an operational level and work with our management team
Expectation setting with the tender participantsInformation gathering meetings
with Vodafone senior management
14 meetings with senior management to gather information and insight into the way the Group operates
Outreach to shareholders post the announcement
Approval of the tender participants, process, timetable and assessment criteria
Data room accessContained documentation to allow the firms to gain a better understanding of how the Group is structured and operates
Vodafone Group Plc Annual Report 201462 63Overview
Strategy review Performance Governance Financials
Additional information

Governance of the External Audit relationshipThe Committee considers the reappointment of the external auditor and also assesses their independence on an ongoing basis. The external auditor is required to rotate the audit partner responsible for the Group audit every five years and the year ended 31 March 2014 will be the current lead audit partner’s fifth year. Accordingly, and in compliance with the provisions outlined in the UK Corporate Governance Code and the notes on best practice issued by the Financial Reporting Council in July 2013, the Committee decided to put the audit for the 2015 financial year out to tender in November 2013.
The tender process and the Committee’s involvement in that process is outlined in the diagram on page 63. All of the ‘big 4’ audit firms were invited to participate in the tender. Deloitte LLP withdrew at a preliminary stage noting the longevity of their appointment, having been the Group’s auditors since its stock market listing in 1988.
Having concluded the process in February 2014, the Committee recommended to the Board that PricewaterhouseCoopers LLP be appointed as the Group’s statutory auditor for the 2015 financial year. Accordingly, a resolution proposing the appointment of PricewaterhouseCoopers LLP as our auditor will be put to the shareholders at the 2014 AGM. There are no contractual obligations restricting the Committee’s choice of external auditor and we do not indemnify our external auditor.
The Committee will continue to review the auditor appointment and the need to tender the audit, ensuring the Group’s compliance with the UK Corporate Governance Code and any reforms of the audit market by the UK Competition Commission and the European Union.
In its assessment of the independence of the auditor and in accordance with the US Public Company Accounting Oversight Board’s standard on independence, the Committee receives details of any relationships between the Company and Deloitte LLP that may have a bearing on their independence and receives confirmation that they are independent of the Company within the meaning of the securities laws administered by the US Securities & Exchange Commission (‘SEC’).
During the year, Deloitte LLP and related member firms charged the Group £9 million (2013: £8 million, 2012: £7 million) for statutory audit services. The Committee approved these fees following review of audit scope changes for the 2014 financial year, including the impact of business acquisitions and disposals which were primarily in relation to Kabel Deutschland, the disposal of Verizon Wireless and the acquisition of the remaining 23% interest in Vodafone Italy. The Committee also received assurance from Deloitte LLP that the fees were appropriate for the scope of the work required.
Non-audit servicesAs a further measure to protect the objectivity and independence of the external auditor, the Committee has a policy governing the engagement of the external auditor to provide non-audit services. This precludes Deloitte LLP from providing certain services such as valuation work or the provision of accounting services and also sets a presumption that Deloitte should only be engaged for non-audit services where there is no legal or practical alternative supplier. No material changes have been made to this policy during the financial year.
For certain specific permitted services, the Committee has pre-approved that Deloitte LLP can be engaged by management, subject to the policies set out above, and subject to specified fee limits for individual engagements and fee limits, for each type of specific service. For all other services or those permitted services that exceed the specified fee limits, I, as Chairman, or in my absence another member, can pre-approve permitted services.
In addition to the statutory audit fee, Deloitte LLP and related member firms charged the Group £4 million (2013: £1 million) for audit-related and other assurance services. These fees were materially higher than in prior years as Deloitte acted as the Reporting Accountant in relation to a number of shareholder and regulatory filings in connection with the disposal of our interest in Verizon Wireless and the related acquisition of the remaining 23% interest in Vodafone Italy. Further details of the fees paid, for both audit and non-audit services, can be found in note 3 to the consolidated financial statements.
For a number of years, PricewaterhouseCoopers LLP has provided the Group with a wide range of consulting and assurance services. Following the decision to appoint them as auditors for the 2015 financial year, it was agreed by the Committee that any existing permitted non-audit service engagements which were not in line with the Group’s non-audit services policy should cease by 30 June 2014. This decision was made to allow a timely transition of these services and minimise the impact on the business. From 1 April 2014, PricewaterhouseCoopers LLP will only be engaged for non-audit services which are in line with the Group’s non-audit services policy.
Nick LandOn behalf of the Audit and Risk Committee
20 May 2014
Vodafone Group Plc Annual Report 201464
Corporate governance (continued)
Remuneration Committee “ Our remuneration policy and executive pay
packages are designed to be competitive and drive behaviour in order to achieve long-term strategic goals. When making decisions we are mindful of the wider economic conditions and shareholder feedback.”
Membership:
With effect from 28 July 2014, Philip Yea will step down from the Remuneration Committee and Valerie Gooding will be appointed to the Committee.
Key objective:to assess and make recommendations to the Board on the policies for executive remuneration and packages for the individual executive directors.
Responsibilities:
a determining, on behalf of the Board, the policy on the remuneration of the Chairman of the Board, the executive directors and the senior management team;
a determining the total remuneration packages for these individuals including any compensation on termination of office;
a operating within recognised principles of good governance; and
a preparing an annual report on directors’ remuneration.
Committee meetingsNo one other than a member of the Committee is entitled to be present at its meetings. The Chairman of the Board and Chief Executive may attend the Committee’s meetings by invitation but they do not attend when their individual remuneration is discussed. No director is involved in deciding his or her own remuneration. The Committee met five times during the year.
Main activities of the Committee during the yearA detailed report to shareholders from the Committee on behalf of the Board in which, amongst other things, I have included a description of the Committee’s activities during the year, is contained in “Directors’ remuneration” on pages 69 to 85.
Executive CommitteeThe Committee meets 11 times a year under the chairmanship of the Chief Executive. Topics covered by the Committee include:
a Chief Executive update on the business and business environment;
a regional chief executives’ updates;
a Group function heads’ updates;
a substantial business developments and projects;
a talent;
a presentations from various function heads, for example, the Group Financial Controller, the Group Audit Director and the Group Compliance Director;
a competitor analysis; and
a strategy.
Annually, the Executive Committee, together with the chief executives of the major operating companies, conduct a strategy review to identify key strategic issues to be presented to the Board. The agreed strategy is then used as a basis for developing the upcoming budget and three year operating plans.
The Committee members’ biographical details are set out on pages 52 and 53 and at vodafone.com/exco.
Policy and Compliance CommitteeThis is a sub-committee of the Executive Committee comprising three Executive Committee members. It is appointed to assist the Executive Committee to fulfil its accountabilities with regard to policy compliance. In particular, the Committee approves changes to policies, does deep dives into particular policies to assess whether they are effective and maintains an overview of the status of compliance throughout Vodafone so clear and accurate reports can be made to the Audit and Risk Committee twice a year. Deep dives this year covered the policies relating to radio frequency electromagnetic fields (‘EMF’), competition law, protecting customer information, anti-money laundering and fraud.
Disclosure CommitteeThe Disclosure Committee, appointed by the Chief Executive and Chief Financial Officer to ensure the accuracy and timeliness of Company disclosures, oversees and approves controls and procedures in relation to the public disclosure of financial information and other information material to shareholders. It is composed of the Group General Counsel and Company Secretary (the Chair), Regional Chief Financial Officers, the Group Financial Controller, the Group Investor Relations Director, the Group Strategy and Business Development Director, and the Group External Affairs Director.
Chairman Luc Vandevelde
(Independent non-executive director)
Renee James (Independent non-executive director)
Samuel Jonah (Independent
non-executive director)
Philip Yea (Independent
non-executive director)
Vodafone Group Plc Annual Report 201464 65Overview
Strategy review Performance Governance Financials
Additional information
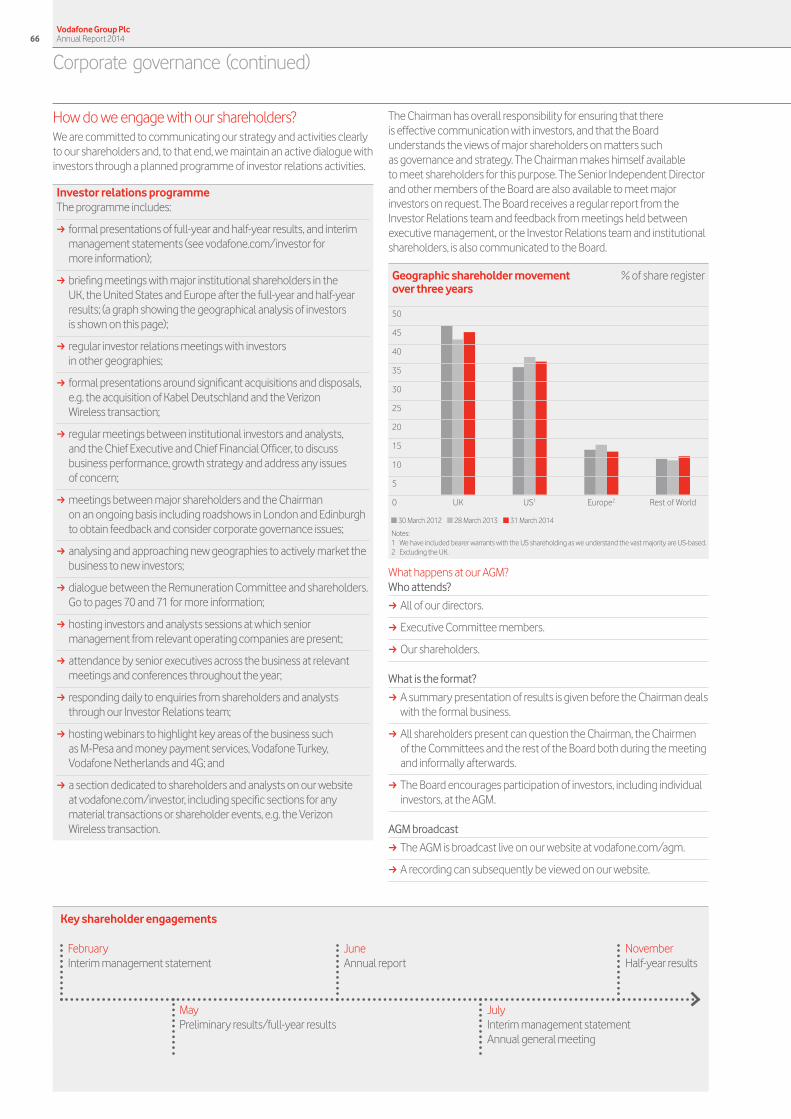
How do we engage with our shareholders?We are committed to communicating our strategy and activities clearly to our shareholders and, to that end, we maintain an active dialogue with investors through a planned programme of investor relations activities.
Investor relations programmeThe programme includes:
a formal presentations of full-year and half-year results, and interim management statements (see vodafone.com/investor for more information);
a briefing meetings with major institutional shareholders in the UK, the United States and Europe after the full-year and half-year results; (a graph showing the geographical analysis of investors is shown on this page);
a regular investor relations meetings with investors in other geographies;
a formal presentations around significant acquisitions and disposals, e.g. the acquisition of Kabel Deutschland and the Verizon Wireless transaction;
a regular meetings between institutional investors and analysts, and the Chief Executive and Chief Financial Officer, to discuss business performance, growth strategy and address any issues of concern;
a meetings between major shareholders and the Chairman on an ongoing basis including roadshows in London and Edinburgh to obtain feedback and consider corporate governance issues;
a analysing and approaching new geographies to actively market the business to new investors;
a dialogue between the Remuneration Committee and shareholders. Go to pages 70 and 71 for more information;
a hosting investors and analysts sessions at which senior management from relevant operating companies are present;
a attendance by senior executives across the business at relevant meetings and conferences throughout the year;
a responding daily to enquiries from shareholders and analysts through our Investor Relations team;
a hosting webinars to highlight key areas of the business such as M-Pesa and money payment services, Vodafone Turkey, Vodafone Netherlands and 4G; and
a a section dedicated to shareholders and analysts on our website at vodafone.com/investor, including specific sections for any material transactions or shareholder events, e.g. the Verizon Wireless transaction.
The Chairman has overall responsibility for ensuring that there is effective communication with investors, and that the Board understands the views of major shareholders on matters such as governance and strategy. The Chairman makes himself available to meet shareholders for this purpose. The Senior Independent Director and other members of the Board are also available to meet major investors on request. The Board receives a regular report from the Investor Relations team and feedback from meetings held between executive management, or the Investor Relations team and institutional shareholders, is also communicated to the Board.
50
45
40
35
30
25
20
15
10
5
0 UK US1 Europe2 Rest of World
■ 30 March 2012 ■ 28 March 2013 ■ 31 March 2014
Geographic shareholder movement over three years
Notes:1 We have included bearer warrants with the US shareholding as we understand the vast majority are US-based.2 Excluding the UK.
% of share register
What happens at our AGM?Who attends?
a All of our directors.
a Executive Committee members.
a Our shareholders.
What is the format?
a A summary presentation of results is given before the Chairman deals with the formal business.
a All shareholders present can question the Chairman, the Chairmen of the Committees and the rest of the Board both during the meeting and informally afterwards.
a The Board encourages participation of investors, including individual investors, at the AGM.
AGM broadcast
a The AGM is broadcast live on our website at vodafone.com/agm.
a A recording can subsequently be viewed on our website.
Key shareholder engagements
FebruaryInterim management statement
MayPreliminary results/full-year results
JuneAnnual report
JulyInterim management statement Annual general meeting
NovemberHalf-year results
Vodafone Group Plc Annual Report 201466
Corporate governance (continued)
Resolutions
a Voting on all resolutions at the AGM is on a poll. The proxy votes cast, including details of votes withheld, are disclosed to those in attendance at the meeting and the results are published on our website and announced via the Regulatory News Service.
A summary of our share and control structures is set out in “Shareholder information” on pages 182 to 189.
How do we deal with internal control and risk management?The Board has overall responsibility for the system of internal control. A sound system of internal control is designed to manage rather than eliminate the risk of failure to achieve business objectives and can only provide reasonable and not absolute assurance against material misstatement or loss.
The Board has established procedures that implement in full the Turnbull Guidance “Internal Control: Revised Guidance for Directors on the Combined Code” for the year under review and to the date of this annual report. These procedures, which are subject to regular review, provide an ongoing process for identifying, evaluating and managing the significant risks we face. See page 89 for management’s report on internal control over financial reporting.
Monitoring and review activitiesThere are clear processes for monitoring the system of internal control and reporting any significant control failings or weaknesses together with details of corrective action. These include:
a the local Chief Executive and Chief Financial Officer of each operating business formally certifying the operation of their control systems each year and highlighting any weaknesses. These results are reviewed by regional management, the Audit and Risk Committee, and the Board;
a local Chief Executives certifying compliance with high risk policies in their companies, with Group Compliance reviewing evidence of compliance;
a the Group’s Disclosure Committee reviewing the appropriateness of disclosures and providing an annual report to the Group’s Chief Executive and the Chief Financial Officer on the effectiveness of the Group’s disclosure controls and procedures;
a maintaining “disclosure controls and procedures”, as such term is defined in Rule 13a-15(e) of the Exchange Act, that are designed to ensure that information required to be disclosed in reports that we file or submit under the Exchange Act is recorded, processed, summarised and reported within the time periods specified in the SEC’s rules and forms, and that such information is accumulated and communicated to management, including our Chief Executive and Chief Financial Officer as appropriate to allow timely decisions regarding required disclosure; and
a the Group Internal Audit department periodically examining business processes on a risk basis throughout the Group and reporting to the Audit and Risk Committee.
In addition, the Board reviews any reports from the external auditor presented to the Audit and Risk Committee and management in relation to internal financial controls.
a evaluating the risks we face in achieving our objectives;
a determining the risks that are considered acceptable to bear;
a assessing the likelihood of the risks concerned materialising;
a identifying our ability to reduce the incidence and impact on the business of risks that do materialise; and
a ensuring that the costs of operating particular controls are proportionate to the benefit.
Risk managementAn overview of the Group’s framework for identifying and managing risk, both at an operational and strategic level, is set out on pages 46 and 47.
Review of effectivenessThe Board and the Audit and Risk Committee have reviewed the effectiveness of the internal control system including financial, operational and compliance controls, and risk management in accordance with the Code for the period from 1 April 2013 to 20 May 2014 (the date of this annual report). No significant failings or weaknesses were identified during this review. However, had there been any such failings or weaknesses, the Board confirms that necessary actions would have been taken to remedy them.
The directors, the Chief Executive and the Chief Financial Officer have evaluated the effectiveness of the disclosure controls and procedures and, based on that evaluation, have concluded that the disclosure controls and procedures were effective at the end of the period covered by this report.
What is our approach to other governance matters?Group policy complianceEach Group policy is owned by a member of the Executive Committee so that there is clear accountability and authority for ensuring the associated business risk is adequately managed. Regional chief executives and the senior leadership team member responsible for each Group function have primary accountability for ensuring compliance with all Group policies by all our markets and entities. Our Group Compliance team and policy champions support the policy owners and local markets in implementing policies and monitoring compliance.
Code of Conduct All of the key Group policies have been consolidated into the Vodafone Code of Conduct. This is a central ethical and policy document applicable to all employees and those who work for or on behalf of Vodafone. It sets out the standards of behaviour expected in relation to areas such as insider dealing, bribery and raising concerns through the whistle-blowing process (known internally as ‘Speak Up’).
Vodafone Group Plc Annual Report 201466 67Overview
Strategy review Performance Governance Financials
Additional information

What are our US listing requirements?As Vodafone’s American depositary shares are listed on the NASDAQ Stock Market LLC (‘NASDAQ’), we are required to disclose a summary of any material differences between the corporate governance practices we follow and those of US companies listed on NASDAQ. Vodafone’s corporate governance practices are primarily based on UK requirements but substantially conform to those required of US companies listed on NASDAQ. The material differences are as follows:
IndependenceDifferent tests of independence for Board members are applied under the Code and the NASDAQ listing rules. The Board is not required to take into consideration NASDAQ’s detailed definitions of independence as set out in the NASDAQ listing rules.
In accordance with the Code, the Board has carried out an assessment based on the independence requirements of the Code and has determined that, in its judgement, all of Vodafone’s non-executive directors (who make up the majority of the Board) are independent within the meaning of those requirements.
CommitteesThe NASDAQ listing rules require US companies to have a nominations committee, an audit committee and a compensation committee, each composed entirely of independent directors, with the nominations committee and the audit committee each required to have a written charter which addresses the committee’s purpose and responsibilities, and the compensation committee having sole authority and adequate funding to engage compensation consultants, independent legal counsel and other compensation advisors.
Our Nominations and Governance Committee is chaired by the Chairman of the Board and its other members are independent non-executive directors. Our Remuneration Committee is composed entirely of independent non-executive directors.
The Audit and Risk Committee is composed entirely of non-executive directors, each of whom (i) the Board has determined to be independent based on the independence requirements of the Code and (ii) meets the independence requirements of the Exchange Act. We have terms of reference for our Nominations and Governance Committee, Audit and Risk Committee and Remuneration Committee, each of which complies with the requirements of the Code and is available for inspection on our website (vodafone.com/governance). These terms of reference are generally responsive to the relevant NASDAQ listing rules but may not address all aspects of these rules.
Code of ConductUnder the NASDAQ listing rules, US companies must adopt a code of conduct applicable to all directors, officers and employees that complies with the definition of a ‘code of ethics’ set out in section 406 of the Sarbanes-Oxley Act. We have adopted a Code of Ethics that complies with section 406 which is applicable only to the senior financial and principal executive officers, and which is available on our website (vodafone.com/governance). We have also adopted a separate Code of Conduct which applies to all employees.
QuorumThe quorum required for shareholder meetings, in accordance with our articles of association, is two shareholders, regardless of the level of their aggregate share ownership, while US companies listed on NASDAQ are required by the NASDAQ listing rules to have a minimum quorum of 33.33% of the shareholders of ordinary shares for shareholder meetings.
Related party transactionsIn lieu of obtaining an independent review of related party transactions for conflicts of interests in accordance with the NASDAQ listing rules, we seek shareholder approval for related party transactions that (i) meet certain financial thresholds or (ii) have unusual features in accordance with the Listing Rules issued by the FCA in the United Kingdom (the ‘Listing Rules’), the Companies Act 2006 and our articles of association.
Further, we use the definition of a ‘transaction with a related party’ as set out in the Listing Rules, which differs in certain respects from the definition of ‘related party transaction’ in the NASDAQ listing rules.
Shareholder approvalWe comply with the NASDAQ listing rules and the Listing Rules, when determining whether shareholder approval is required for a proposed transaction.
Under the NASDAQ listing rules, whether shareholder approval is required for a transaction depends on, among other things, the percentage of shares to be issued or sold in connection with the transaction. Under the Listing Rules, whether shareholder approval is required for a transaction depends on, among other things, whether the size of a transaction exceeds a certain percentage of the size of the listed company undertaking the transaction.
Vodafone Group Plc Annual Report 201468
Corporate governance (continued)

Dear fellow shareholderI am pleased to present you with Vodafone’s remuneration report for 2014.
This year will be the first time we will ask shareholders to vote on our remuneration policy in addition to the rest of the remuneration report. With the new remuneration disclosure regulations in mind we have changed the structure of our report to present first our policy and then detail its implementation. Apart from some changes which I outline below, our policy and practice remain essentially unchanged.
As always we have tried to ensure that the remuneration policy and practice at Vodafone drive behaviours that are in the long-term interests of the Company and its shareholders. The Remuneration Committee continues to be mindful of the considerable interest that exists in executive compensation and we are very conscious of the many and varied concerns.
Our remuneration principlesOur remuneration principles, which our detailed policy supports, are as follows:
a we offer competitive and fair rates of pay and benefits to attract and retain the best people;
a our policy and practices aim to drive behaviours that support our Company strategy and business objectives;
a our ‘pay for performance’ approach means that our incentive plans only deliver significant rewards if and when they are justified by performance; and
a our approach to share ownership is designed to help maintain commitment over the long-term, and to ensure that the interests of our senior management team are aligned with those of shareholders.
Pay for performancePay for performance continues to be an important principle for Vodafone when setting remuneration policy.
A high proportion of total reward is awarded through short-term and long-term performance related remuneration. At target around 70% of the package is delivered in the form of variable pay, which rises to around 85% if maximum payout is achieved.
We ensure our incentive plans only deliver significant rewards if and when they are justified by performance. For the Remuneration Committee this means two things:
a ensuring the targets we set for incentive plans are suitably challenging (as can be seen by the historic levels of achievement for both short- and long-term incentive plans shown on page 82); and
a if needed, exercising discretion. The Committee reviews all incentive plans before any payments are made to executives and has full discretion to adjust payments downwards if it believes circumstances warrant it.
Company performance and the link to incentivesDuring the 2014 year our emerging markets businesses have delivered strong organic revenue growth along with good cash flow and EBITDA performance. However, this has been offset by significant ongoing competitive, regulatory and macroeconomic pressures in our European operations where revenue has declined. Taken in the round this led to slightly below target performance which is reflected in our annual bonus payout of 88.5% of target. More details can be found on page 78.
Over the last three years our adjusted free cash flow performance, although strong in our emerging markets, has been below our target levels in Europe for similar reasons to those described above. However, we have taken significant strategic steps which have led to strong growth in the share price and Total Shareholder Return (‘TSR’) which, when combined with adjusted free cash flow, result in a payout for the executive directors’ long-term incentive awards of 37.2% of maximum. More details can be found on page 79. Strategic initiatives include:
a the sale of our 45% stake in Verizon Wireless;
a the record US$85 billion return to shareholders;
a the announcement of Project Spring – the acceleration of our capital investment to strengthen further our network and customer experience;
a the acquisition of a leading cable operator in Germany as well as fixed line businesses such as CWW and TelstraClear;
a launching Vodafone Red which is now available in 20 markets; and
a developing our M-Pesa footprint.
Luc VandeveldeChairman of the Remuneration Committee
Letter from the Remuneration Committee Chairman
69OverviewStrategy review Performance Governance Financials
Additional information
Directors’ remuneration
Letter from the Remuneration Committee Chairman (continued)
Key decisions on executive remunerationThe Remuneration Committee considers every decision around executive director remuneration very carefully. Some of the major decisions made this year were as follows:
a Nick Read was promoted to Chief Financial Officer during the year and we determined his new remuneration package. Our decision to give Nick a base salary of £675,000 was made in the context of the existing executive directors’ remuneration levels and reviewed against the external market;
a the Remuneration Committee considered the impact of the Verizon Wireless transaction and Project Spring on executive remuneration and decided to remove the impact of Project Spring on pre-existing long-term incentive awards to ensure an appropriate comparison to the original targets that were set. Please see page 84 for more details;
a we decided to reduce the maximum vesting level of our long-term incentive opportunity for our Executive Committee. For the 2015 long-term incentive awards, the maximum vesting level will reduce from three times to two and a half times the target vesting level. We have also introduced a mandatory holding period where 50% of the post-tax shares are released after vesting, a further 25% after the first anniversary of vesting, and the remaining 25% will be released after the second anniversary;
a following a review of the pension levels in the context of pension provision for our broader employee population, from November 2015 pension levels for our Executive Committee will reduce from 30% of salary to 24% of salary. This brings our Executive Committee pension level in line with our UK senior management; and
a the Remuneration Committee took account of business performance, salary increases for other UK employees and external market information when deciding to increase the annual base salaries of the Chief Executive (Vittorio Colao) and the Chief Technology Officer (Stephen Pusey) by 3.6% and 4.3% respectively from 1 July 2014. This is the first salary increase that either individual has received for three years.
Assessment of riskOne of the activities of the Remuneration Committee is to continually be aware and mindful of any potential risk associated with our reward programmes. Vodafone seeks to provide a structure of rewards that encourages acceptable risk taking and high performance through optimal pay mix, performance metrics and calibration, and timing. With that said, it is prudent practice to ensure that our reward programmes achieve this and do not encourage excessive or inappropriate risk taking. The Committee has considered the risk involved in the incentive schemes and is satisfied that the design elements and governance procedures mitigate the principal risks.
Share ownershipFor many years Vodafone has had demanding share ownership goals for our executive directors. These goals, and our achievement against the goals, are set out on page 80. We are delighted that, collectively, our Executive Committee own shares with a value of over £50 million. We are proud that the high level of shareholding by our Executive Committee has been maintained despite the Verizon Wireless transaction and the associated share consolidation. After the transaction our Executive Committee members individually elected to reinvest the vast majority of their post-tax proceeds from the transaction back into Vodafone shares. Owning shares is part of our culture and each year we expect the number of shares owned by our Executive Committee members to grow. This level of ownership by management clearly shows their alignment with shareholders but also indicates their belief in the long-term value creation opportunities of our shares.
Consultation with shareholdersThe Remuneration Committee continues to have dialogue with our shareholders. The views of all shareholders are taken seriously, and letters and emails are replied to promptly. In addition, during the year we invited our largest shareholders to meet with me in person and the resulting meetings were very helpful for us to better understand our shareholders’ viewpoint. We were delighted that last year the remuneration report received a 96.36% vote in favour. This compares with 96.44% support in the prior year. We sincerely hope to receive your continued support at the AGM on 29 July 2014.
Luc VandeveldeChairman of the Remuneration Committee
20 May 2014
Contents of the remuneration reportRemuneration policy The remuneration policy table Chairman and non-executive directors’ remuneration
Page 71Page 72Page 76
Annual report on remuneration Remuneration Committee 2014 remuneration 2015 remuneration Further remuneration information
Page 77Page 77Page 78Page 84Page 85
Vodafone Group Plc Annual Report 201470
Directors’ remuneration (continued)

Remuneration policy
In this forward-looking section we describe our remuneration policy for the Board. This includes our considerations when determining policy, a description of the elements of the reward package and an indication of the potential future value of this package for each of the executive directors. In addition we describe our policy applied to the Chairman and non-executive directors.
We will be seeking shareholder approval for our remuneration policy at the 2014 AGM and we intend to implement at that point. We do not envisage making any changes to our policy over the next three years, however, we will review it each year to ensure that it continues to support our Company strategy. If we feel it is necessary to make a change to our policy within the next three years, we will seek shareholder approval.
Considerations when determining remuneration policyOur remuneration principles which are outlined on page 69 are the context for our policy. Our principal consideration when determining remuneration policy is to ensure that it supports our Company strategy and business objectives.
The views of our shareholders are also taken into account when determining executive pay. In advance of asking for approval for the remuneration policy we have consulted with our major shareholders. We invited our top 20 shareholders to comment on remuneration at Vodafone and several meetings between shareholders and the Remuneration Committee Chairman took place. The main topics of consultation were as follows:
a new share plan rules for which we will seek shareholder approval at the 2014 AGM;
a changes to executive remuneration arrangements (reduction of maximum long-term incentive vesting levels and pension provision); and
a impact of Project Spring on Free Cash Flow performance under the global long-term incentive plan (‘GLTI’).
We have not consulted with employees on the executive remuneration policy nor is any fixed remuneration comparison measurement used. However, when determining the policy for executive directors, we have been mindful of the pay and employment conditions of employees in Vodafone Group as a whole, with particular reference to the market in which the executive is based. Further information on our remuneration policy for other employees is given on page 74.
Performance measures and targetsOur Company strategy and business objectives are the primary consideration when we are selecting performance measures for our incentive plans. The targets within our incentive plans that are related to internal financial measures (such as revenue, profit and cash flow) are typically determined based on our budgets. Targets for strategic and external measures (such as competitive performance and Total Shareholder Return (‘TSR’)) are set based on Company objectives and in light of the competitive marketplace. The threshold and maximum levels of performance are set to reflect minimum acceptable levels at threshold and very stretching but achievable levels at maximum.
As in previous remuneration reports we will disclose the details of our performance targets for our short and long-term incentive plans. However, our annual bonus targets are commercially sensitive and therefore we will only disclose our targets in the remuneration report following the completion of the financial year. We will disclose the targets for each long-term award in the remuneration report for the financial year preceding the start of the performance period.
At the end of each performance period we review performance against the targets, using judgement to account for items such as (but not limited to) mergers, acquisitions, disposals, foreign exchange rate movements, changes in accounting treatment, material one-off tax settlements etc. The application of judgement is important to ensure that the final assessments of performance are fair and appropriate.
In addition, the Remuneration Committee reviews the incentive plan results before any payments are made to executives or any shares vest and has full discretion to adjust the final payment or vesting downwards if they believe circumstances warrant it. In particular, the Committee may use discretion to clawback any unvested share award (or vested but unexercised options) as it sees appropriate, in which case the award may lapse wholly or in part, may vest to a lesser extent than it would otherwise have vested or vesting may be delayed.
Vodafone Group Plc Annual Report 201470 71Overview
Strategy review Performance Governance Financials
Additional information

Remuneration policy (continued)
The remuneration policy tableThe table below summarises the main components of the reward package for executive directors.
Purpose and link to strategy Operation Opportunity Performance metrics
Base salary a To attract and retain the best talent. a Salaries are usually reviewed annually and fixed for 12 months commencing 1 July. Decision is influenced by:
a level of skill, experience and scope of responsibilities of individual;
a business performance, scarcity of talent, economic climate and market conditions;
a increases elsewhere within the Group; and
a external comparator groups (which are used for reference purposes only) made up of companies of similar size and complexity to Vodafone.
a Average salary increases for existing Executive Committee members (including executive directors) will not normally exceed average increases for employees in other appropriate parts of the Group. Increases above this level may be made in specific situations. These situations could include (but are not limited to) internal promotions, changes to role, material changes to the business and exceptional company performance.
None.
Pension a To remain competitive within the marketplace. a Executive directors may choose to participate in the defined contribution pension scheme or to receive a cash allowance in lieu of pension.
a The pension contribution or cash payment is equal to 30% of annual gross salary. In light of pension levels elsewhere in the Group we have decided to reduce the pension benefits level from 30% to no more than 24% from November 2015.
None.
Benefits a To aid retention and remain competitive within the marketplace.
a Travel related benefits. This may include (but is not limited to) company car or cash allowance, fuel and access to a driver where appropriate.
a Private medical, death and disability insurance and annual health checks.
a In the event that we ask an individual to relocate we would offer them support in line with Vodafone’s relocation or international assignment policies. This may cover (but is not limited to) relocation, cost of living allowance, housing, home leave, education support, tax equalisation and advice.
a Legal fees if appropriate.
a Other benefits are also offered in line with the benefits offered to other employees for example, all-employee share plans, mobile phone discounts, maternity/paternity benefits, sick leave, paid holiday, etc.
a Benefits will be provided in line with appropriate levels indicated by local market practice in the country of employment.
a We expect to maintain benefits at the current level but the value of benefit may fluctuate depending on, amongst other things, personal situation, insurance premiums and other external factors.
None.
Annual Bonus –Global Short-Term Incentive Plan (‘GSTIP’)
a To drive behaviour and communicate the key priorities for the year.
a To motivate employees and incentivise delivery of performance over the one year operating cycle.
a The financial metrics are designed to both drive our growth strategies whilst also focusing on improving operating efficiencies. Measuring competitive performance with its heavy reliance on net promoter score (‘NPS’) means providing a great customer experience remains at the heart of what we do.
a Bonus levels and the appropriateness of measures and weightings are reviewed annually to ensure they continue to support our strategy.
a Performance over the financial year is measured against stretching financial and non-financial performance targets set at the start of the financial year.
a The annual bonus is usually paid in cash in June each year for performance over the previous financial year.
a Bonuses can range from 0–200% of base salary, with 100% paid for on-target performance. Maximum is only paid out for exceptional performance.
a Performance over each financial year is measured against stretching targets set at the beginning of the year.
a The performance measures normally comprise of a mix of financial and strategic measures. Financial measures may include (but are not limited to) profit, revenue and cash flow with a weighting of no less than 50%. Strategic measures may include (but are not limited to) competitive performance metrics such as net promoter score and market share.
Long-Term Incentive – Global Long-Term Incentive Plan (‘GLTI’) base awards and co-investment awards (further details can be found in the notes that follow this table)
a To motivate and incentivise delivery of sustained performance over the long term.
a To support and encourage greater shareholder alignment through a high level of personal financial commitment.
a The use of free cash flow as the principal performance measure ensures we apply prudent cash management and rigorous capital discipline to our investment decisions, whilst the use of TSR along with a performance period of not less than three years means that we are focused on the long-term interests of our shareholders.
a Award levels and the framework for determining vesting are reviewed annually to ensure they continue to support our strategy.
a Long-term incentive base awards consist of performance shares which are granted each year.
a Individuals must co-invest in Vodafone shares and hold them in trust for at least three years in order to receive the full target award.
a All awards vest not less than three years after the award based on Group operational and external performance.
a Dividend equivalents are paid in cash after the vesting date.
a The basic target award level is 137.5% of base salary for the Chief Executive (110% for other executive directors).
a The target award level may increase up to 237.5% of base salary for the Chief Executive (or 210% for others) if the individual commits to a co-investment in shares equal in value to their base salary.
a Minimum vesting is 0% of target award level, threshold vesting is 50% and maximum vesting is 250% of the target award level.
a Maximum long-term incentive face value at award of 594% of base salary for the Chief Executive (237.5% x 250%) and 525% for others.
a The awards that vest accrue cash dividend equivalents over the three year vesting period.
a Awards vest to the extent performance conditions are satisfied. There is a mandatory holding period where 50% of the post-tax shares are released after vesting, a further 25% after the first anniversary of vesting, and the remaining 25% will be released after the second anniversary.
a Performance is measured against stretching targets set at the beginning of the performance period.
a Vesting is determined based on a matrix of two measures:
a adjusted free cash flow as our operational performance measure; and
a relative TSR against a peer group of companies as our external performance measure.
Vodafone Group Plc Annual Report 201472
Directors’ remuneration (continued)

Remuneration policy (continued)
The remuneration policy tableThe table below summarises the main components of the reward package for executive directors.
Purpose and link to strategy Operation Opportunity Performance metrics
Base salary a To attract and retain the best talent. a Salaries are usually reviewed annually and fixed for 12 months commencing 1 July. Decision is influenced by:
a level of skill, experience and scope of responsibilities of individual;
a business performance, scarcity of talent, economic climate and market conditions;
a increases elsewhere within the Group; and
a external comparator groups (which are used for reference purposes only) made up of companies of similar size and complexity to Vodafone.
a Average salary increases for existing Executive Committee members (including executive directors) will not normally exceed average increases for employees in other appropriate parts of the Group. Increases above this level may be made in specific situations. These situations could include (but are not limited to) internal promotions, changes to role, material changes to the business and exceptional company performance.
None.
Pension a To remain competitive within the marketplace. a Executive directors may choose to participate in the defined contribution pension scheme or to receive a cash allowance in lieu of pension.
a The pension contribution or cash payment is equal to 30% of annual gross salary. In light of pension levels elsewhere in the Group we have decided to reduce the pension benefits level from 30% to no more than 24% from November 2015.
None.
Benefits a To aid retention and remain competitive within the marketplace.
a Travel related benefits. This may include (but is not limited to) company car or cash allowance, fuel and access to a driver where appropriate.
a Private medical, death and disability insurance and annual health checks.
a In the event that we ask an individual to relocate we would offer them support in line with Vodafone’s relocation or international assignment policies. This may cover (but is not limited to) relocation, cost of living allowance, housing, home leave, education support, tax equalisation and advice.
a Legal fees if appropriate.
a Other benefits are also offered in line with the benefits offered to other employees for example, all-employee share plans, mobile phone discounts, maternity/paternity benefits, sick leave, paid holiday, etc.
a Benefits will be provided in line with appropriate levels indicated by local market practice in the country of employment.
a We expect to maintain benefits at the current level but the value of benefit may fluctuate depending on, amongst other things, personal situation, insurance premiums and other external factors.
None.
Annual Bonus –Global Short-Term Incentive Plan (‘GSTIP’)
a To drive behaviour and communicate the key priorities for the year.
a To motivate employees and incentivise delivery of performance over the one year operating cycle.
a The financial metrics are designed to both drive our growth strategies whilst also focusing on improving operating efficiencies. Measuring competitive performance with its heavy reliance on net promoter score (‘NPS’) means providing a great customer experience remains at the heart of what we do.
a Bonus levels and the appropriateness of measures and weightings are reviewed annually to ensure they continue to support our strategy.
a Performance over the financial year is measured against stretching financial and non-financial performance targets set at the start of the financial year.
a The annual bonus is usually paid in cash in June each year for performance over the previous financial year.
a Bonuses can range from 0–200% of base salary, with 100% paid for on-target performance. Maximum is only paid out for exceptional performance.
a Performance over each financial year is measured against stretching targets set at the beginning of the year.
a The performance measures normally comprise of a mix of financial and strategic measures. Financial measures may include (but are not limited to) profit, revenue and cash flow with a weighting of no less than 50%. Strategic measures may include (but are not limited to) competitive performance metrics such as net promoter score and market share.
Long-Term Incentive – Global Long-Term Incentive Plan (‘GLTI’) base awards and co-investment awards (further details can be found in the notes that follow this table)
a To motivate and incentivise delivery of sustained performance over the long term.
a To support and encourage greater shareholder alignment through a high level of personal financial commitment.
a The use of free cash flow as the principal performance measure ensures we apply prudent cash management and rigorous capital discipline to our investment decisions, whilst the use of TSR along with a performance period of not less than three years means that we are focused on the long-term interests of our shareholders.
a Award levels and the framework for determining vesting are reviewed annually to ensure they continue to support our strategy.
a Long-term incentive base awards consist of performance shares which are granted each year.
a Individuals must co-invest in Vodafone shares and hold them in trust for at least three years in order to receive the full target award.
a All awards vest not less than three years after the award based on Group operational and external performance.
a Dividend equivalents are paid in cash after the vesting date.
a The basic target award level is 137.5% of base salary for the Chief Executive (110% for other executive directors).
a The target award level may increase up to 237.5% of base salary for the Chief Executive (or 210% for others) if the individual commits to a co-investment in shares equal in value to their base salary.
a Minimum vesting is 0% of target award level, threshold vesting is 50% and maximum vesting is 250% of the target award level.
a Maximum long-term incentive face value at award of 594% of base salary for the Chief Executive (237.5% x 250%) and 525% for others.
a The awards that vest accrue cash dividend equivalents over the three year vesting period.
a Awards vest to the extent performance conditions are satisfied. There is a mandatory holding period where 50% of the post-tax shares are released after vesting, a further 25% after the first anniversary of vesting, and the remaining 25% will be released after the second anniversary.
a Performance is measured against stretching targets set at the beginning of the performance period.
a Vesting is determined based on a matrix of two measures:
a adjusted free cash flow as our operational performance measure; and
a relative TSR against a peer group of companies as our external performance measure.
Vodafone Group Plc Annual Report 201472 73Overview
Strategy review Performance Governance Financials
Additional information

Remuneration policy (continued)
Notes to the remuneration policy tableExisting arrangementsWe will honour existing awards to executive directors, and incentives, benefits and contractual arrangements made to individuals prior to their promotion to the Board. This will last until the existing incentives vest (or lapse) or the benefits or contractual arrangements no longer apply.
Long-Term Incentive (‘GLTI’)When referring to our long-term incentive awards we use the financial year end in which the award was made. For example, the ‘2013 award’ was made in the financial year ending 31 March 2013. The awards are usually made in the first half of the financial year (the 2013 award was made in July 2012).
The extent to which awards vest depends on two performance conditions:
a underlying operational performance as measured by adjusted free cash flow; and
a relative Total Shareholder Return (‘TSR’) against a peer group median.
Adjusted free cash flowThe free cash flow performance is based on the cumulative adjusted free cash flow figure over the performance period. The detailed targets and the definition of adjusted free cash flow are determined each year as appropriate. The target adjusted free cash flow level is set by reference to our long-range plan and market expectations. We consider the targets to be critical to the Company’s long-term success and its ability to maximise shareholder value, and to be in line with the strategic goals of the Company. The Remuneration Committee sets these targets to be sufficiently demanding with significant stretch where only outstanding performance will be rewarded with a maximum payout.
The cumulative adjusted free cash flow vesting levels as a percentage of target are shown in the table below (with linear interpolation between points):Performance Vesting percentage
Below threshold 0%Threshold 50%Target 100%Maximum 125%
TSR outperformance of a peer group medianWe have a limited number of appropriate peers and this makes the measurement of a relative ranking system volatile. As such, the outperformance of the median of a peer group is felt to be the most appropriate TSR measure. The peer group for the performance condition is reviewed each year and amended as appropriate.
The relative TSR position determines the performance multiplier. This will be applied to the adjusted free cash flow vesting percentage. There will be no multiplier until TSR performance exceeds median. Above median, the following table will apply (with linear interpolation between points):
Multiplier
Median No increasePercentage outperformance of the peer group median equivalent to 65th percentile 1.5 timesPercentage outperformance of the peer group median equivalent to 80th percentile 2.0 times
In order to determine the percentages for the equivalent outperformance levels above median, the Remuneration Committee seeks independent external advice.
Combined vesting matrixThe combination of the two performance measures gives a combined vesting matrix as follows (with linear interpolation between points):
TSR outperformance
Adjusted free cash flow measure Up to
Median65th percentile
equivalent80th percentile
equivalent
Below threshold 0% 0% 0%Threshold 50% 75% 100%Target 100% 150% 200%Maximum 125% 187.5% 250%
The combined vesting percentages are applied to the target number of shares granted.
Outstanding awardsFor the awards made in the 2013 and 2014 financial years (vesting in July 2015 and June 2016 respectively) the award structure is as set out above, except that the maximum vesting percentage for cumulative adjusted free cash flow was 150% leading to an overall maximum of 300% of target award.
Remuneration policy for other employeesWhile our remuneration policy follows the same fundamental principles across the Group, packages offered to employees reflect differences in market practice in the different countries, role and seniority.
For example, the remuneration package elements for our executive directors are essentially the same as for the other Executive Committee members, with some small differences, for example higher levels of share awards. The remuneration for the next level of management, our senior leadership team, again follows the same principles but with differences such as local and individual performance aspects in the annual bonus targets and performance share awards. They also receive lower levels of share awards which are partly delivered in restricted shares.
Vodafone Group Plc Annual Report 201474
Directors’ remuneration (continued)

Estimates of total future potential remuneration from 2015 pay packagesThe tables below provide estimates of the potential future remuneration for each of the executive directors based on the remuneration opportunity granted in the 2015 financial year. Potential outcomes based on different performance scenarios are provided for each executive director.
The assumptions underlying each scenario are described below.
Fixed Consists of base salary, benefits and pension.Base salary is at 1 July 2014.Benefits are valued using the figures in the total remuneration for the 2014 financial year table on page 78 (of the 2014 report) and on a similar basis for Nick Read (promoted to the Board on 1 April 2014).Pensions are valued by applying cash allowance rate of 30% of base salary at 1 July 2014.
Base(£’000)
Benefits(£’000)
Pension(£’000)
Total fixed(£’000)
Chief Executive 1,150 38 345 1,533Chief Financial Officer 675 23 203 901Chief Technology Officer 600 21 180 801
On target Based on what a director would receive if performance was in line with plan.The target award opportunity for the annual bonus (‘GSTIP’) is 100% of base salary.The target award opportunity for the long-term incentive (‘GLTI’) is 237.5% of base salary for the Chief Executive and 210% for others. We assumed that TSR performance was at median.
Maximum Two times the target award opportunity is payable under the annual bonus (‘GSTIP’).The maximum levels of performance for the long-term incentive (‘GLTI’) are 250% of target award opportunity. We assumed that TSR performance was at or above the 80th percentile equivalent.
All scenarios Each executive is assumed to co-invest the maximum allowed under the long-term incentive (‘GLTI’), 100% of salary, and the long-term incentive (‘GLTI’) award reflects this.Long-term incentives consist of share awards only which are measured at face value i.e. no assumption for increase in share price or cash dividend equivalents payable.
Vittorio Colao, Chief Executive
10,000
12,000
8,000
6,000
4,000
2,000
0 Fixed
£1,533
On target
£5,414
Maximum
£10,661
£’000
28%21%
14%
22%
64%
51%
¢ Salary and benefits ¢ Annual bonus ¢ Long-term incentive
Nick Read, Chief Financial Officer (appointed 1 April 2014)
10,000
12,000
8,000
6,000
4,000
2,000
0 Fixed On target Maximum
£’000
¢ Salary and benefits ¢ Annual bonus ¢ Long-term incentive
£901
£2,994
£5,795
30%23%
47%
16%
23%
61%
Stephen Pusey, Chief Technology Officer
10,000
12,000
8,000
6,000
4,000
2,000
0 Fixed On target Maximum
£’000
¢ Salary and benefits ¢ Annual bonus ¢ Long-term incentive
£801
£2,661
30%23%
16%
23%
61%
47%
£5,151
Recruitment remunerationOur approach to recruitment remuneration is to pay no more than is necessary and appropriate to attract the right talent to the role.
The remuneration policy table (pages 72 and 73) sets out the various components which would be considered for inclusion in the remuneration package for the appointment of an executive director. Any new director’s remuneration package would include the same elements, and be subject to the same constraints, as those of the existing directors performing similar roles. This means a potential maximum bonus opportunity of 200% of base salary and long-term incentive maximum face value of opportunity at award of 594% of base salary.
When considering the remuneration arrangements of individuals recruited from external roles to the Board, we will take into account the remuneration package of that individual in their prior role. We only provide additional compensation to individuals for awards foregone. If necessary we will seek to replicate, as far as practicable, the level and timing of such remuneration, taking into account also any remaining performance requirements applying to it. This will be achieved by granting awards of cash or shares that vest over a timeframe similar to those forfeited and if appropriate based on performance conditions. A commensurate reduction in quantum will be applied where it is determined that the new awards are either not subject to performance conditions or subject to performance conditions that are not as stretching as those of the awards forfeited.
Vodafone Group Plc Annual Report 201474 75Overview
Strategy review Performance Governance Financials
Additional information

Remuneration policy (continued)
Service contracts of executive directorsAfter an initial term of up to two years executive directors’ contracts have rolling terms and are terminable on no more than 12 months’ notice.
The key elements of the service contract for executives relate to remuneration, payments on loss of office (see below), and restrictions during active employment (and for 12 months thereafter). These restrictions include non-competition, non-solicitation of customers and employees etc.
Additionally, all of the Company’s share plans contain provisions relating to a change of control. Outstanding awards and options would normally vest and become exercisable on a change of control to the extent that any performance condition has been satisfied and pro-rated to reflect the acceleration of vesting.
Payments for departing executivesIn the table below we summarise the key elements of our policy on payment for loss of office. We will of course, always comply both with the relevant plan rules and local employment legislation.Provision Policy
Notice period and compensation for loss of office in service contracts
a 12 months’ notice from the Company to the executive director.
a Up to 12 months’ base salary (in line with the notice period). Notice period payments will either be made as normal (if the executive continues to work during the notice period or is on gardening leave) or they will be made as monthly payments in lieu of notice (subject to mitigation if alternative employment is obtained).
Treatment of annual bonus (‘GSTIP’) on termination under plan rules
a The annual bonus will be pro-rated for the period of service during the financial year and will reflect the extent to which Company performance has been achieved.
a The Remuneration Committee has discretion to reduce the entitlement to an annual bonus to reflect the individual’s performance and the circumstances of the termination.
Treatment of unvested long-term incentive awards (‘GLTI’) and co-investment awards on termination under plan rules
a An executive director’s award will vest in accordance with the terms of the plan and satisfaction of performance conditions measured at the normal completion of the performance period, with the award pro-rated for the proportion of the vesting period that had elapsed at the date of cessation of employment.
a The Remuneration Committee has discretion to vary the level of vesting as deemed appropriate, and in particular to determine that awards should not vest in the case of a ‘bad leaver’ which may include, at their absolute discretion, departure in case of poor performance, departure without the agreement of the Board, or detrimental competitive activity.
Pension and benefits a Generally pension and benefit provisions will continue to apply until the termination date.
a Where appropriate other benefits may be receivable, such as (but not limited to) payments in lieu of accrued holiday and legal fees or tax advice costs in relation to the termination.
a Benefits of relative small value may continue after termination where appropriate, such as (but not limited to) mobile phone provision.
In exceptional circumstances, an arrangement may be established specifically to facilitate the exit of a particular individual albeit that any such arrangement would be made within the context of minimising the cost to the Group. We will only take such a course of action in exceptional circumstances and where it is considered to be in the best interests of shareholders.
Chairman and non-executive directors’ remunerationOur policy is for the Chairman to review the remuneration of non-executive directors annually following consultation with the Remuneration Committee Chairman. Fees for the Chairman are set by the Remuneration Committee.Element Policy
Fees a We aim to pay competitively for the role including consideration of the time commitment required. We benchmark the fees against an appropriate external comparator group. We pay fees to our Chairman and Senior Independent Director that include fees for chairmanship of any committees. We pay a fee to each of our other non-executive directors and they receive an additional fee if they chair a committee. Non-executive fee levels are set within the maximum level as approved by shareholders as part of our articles of association.
Allowances a An allowance is payable each time a non-Europe-based non-executive director is required to travel to attend Board and committee meetings to reflect the additional time commitment involved.
Incentives a Non-executive directors do not participate in any incentive plans.
Benefits a Non-executive directors do not participate in any benefit plans. The Company does not provide any contribution to their pension arrangements. The Chairman is entitled to the use of a car and a driver whenever and wherever he is providing his services to or representing the Company. We have been advised that for non-executive directors, certain travel and accommodation expenses in relation to attending Board meetings should be treated as a taxable benefit therefore we also cover the tax liability for these expenses.
Non-executive director service contractsNon-executive directors are engaged on letters of appointment that set out their duties and responsibilities. The appointment of non-executive directors may be terminated without compensation. Non-executive directors are generally not expected to serve for a period exceeding nine years. For further information refer to the “Nomination and Governance Committee” section of the annual report (page 59).
Vodafone Group Plc Annual Report 201476
Directors’ remuneration (continued)
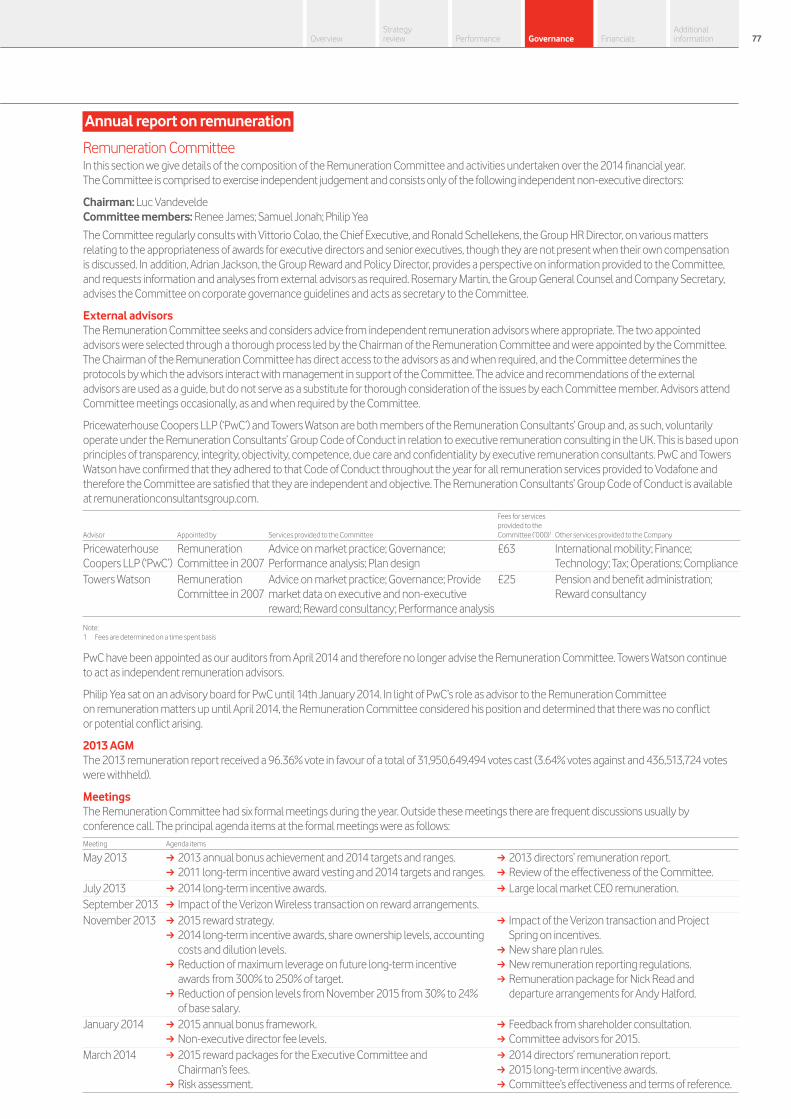
Annual report on remuneration
Remuneration CommitteeIn this section we give details of the composition of the Remuneration Committee and activities undertaken over the 2014 financial year. The Committee is comprised to exercise independent judgement and consists only of the following independent non-executive directors:
Chairman: Luc Vandevelde Committee members: Renee James; Samuel Jonah; Philip Yea
The Committee regularly consults with Vittorio Colao, the Chief Executive, and Ronald Schellekens, the Group HR Director, on various matters relating to the appropriateness of awards for executive directors and senior executives, though they are not present when their own compensation is discussed. In addition, Adrian Jackson, the Group Reward and Policy Director, provides a perspective on information provided to the Committee, and requests information and analyses from external advisors as required. Rosemary Martin, the Group General Counsel and Company Secretary, advises the Committee on corporate governance guidelines and acts as secretary to the Committee.
External advisorsThe Remuneration Committee seeks and considers advice from independent remuneration advisors where appropriate. The two appointed advisors were selected through a thorough process led by the Chairman of the Remuneration Committee and were appointed by the Committee. The Chairman of the Remuneration Committee has direct access to the advisors as and when required, and the Committee determines the protocols by which the advisors interact with management in support of the Committee. The advice and recommendations of the external advisors are used as a guide, but do not serve as a substitute for thorough consideration of the issues by each Committee member. Advisors attend Committee meetings occasionally, as and when required by the Committee.
Pricewaterhouse Coopers LLP (‘PwC’) and Towers Watson are both members of the Remuneration Consultants’ Group and, as such, voluntarily operate under the Remuneration Consultants’ Group Code of Conduct in relation to executive remuneration consulting in the UK. This is based upon principles of transparency, integrity, objectivity, competence, due care and confidentiality by executive remuneration consultants. PwC and Towers Watson have confirmed that they adhered to that Code of Conduct throughout the year for all remuneration services provided to Vodafone and therefore the Committee are satisfied that they are independent and objective. The Remuneration Consultants’ Group Code of Conduct is available at remunerationconsultantsgroup.com.
Advisor Appointed by Services provided to the Committee
Fees for services provided to the Committee (’000)1 Other services provided to the Company
Pricewaterhouse Coopers LLP (‘PwC’)
Remuneration Committee in 2007
Advice on market practice; Governance; Performance analysis; Plan design
£63 International mobility; Finance; Technology; Tax; Operations; Compliance
Towers Watson Remuneration Committee in 2007
Advice on market practice; Governance; Provide market data on executive and non-executive reward; Reward consultancy; Performance analysis
£25 Pension and benefit administration; Reward consultancy
Note:1 Fees are determined on a time spent basis
PwC have been appointed as our auditors from April 2014 and therefore no longer advise the Remuneration Committee. Towers Watson continue to act as independent remuneration advisors.
Philip Yea sat on an advisory board for PwC until 14th January 2014. In light of PwC’s role as advisor to the Remuneration Committee on remuneration matters up until April 2014, the Remuneration Committee considered his position and determined that there was no conflict or potential conflict arising.
2013 AGMThe 2013 remuneration report received a 96.36% vote in favour of a total of 31,950,649,494 votes cast (3.64% votes against and 436,513,724 votes were withheld).
MeetingsThe Remuneration Committee had six formal meetings during the year. Outside these meetings there are frequent discussions usually by conference call. The principal agenda items at the formal meetings were as follows:Meeting Agenda items
May 2013 a 2013 annual bonus achievement and 2014 targets and ranges. a 2011 long-term incentive award vesting and 2014 targets and ranges.
a 2013 directors’ remuneration report. a Review of the effectiveness of the Committee.
July 2013 a 2014 long-term incentive awards. a Large local market CEO remuneration.September 2013 a Impact of the Verizon Wireless transaction on reward arrangements.November 2013 a 2015 reward strategy.
a 2014 long-term incentive awards, share ownership levels, accounting costs and dilution levels.
a Reduction of maximum leverage on future long-term incentive awards from 300% to 250% of target.
a Reduction of pension levels from November 2015 from 30% to 24% of base salary.
a Impact of the Verizon transaction and Project Spring on incentives.
a New share plan rules. a New remuneration reporting regulations. a Remuneration package for Nick Read and departure arrangements for Andy Halford.
January 2014 a 2015 annual bonus framework. a Non-executive director fee levels.
a Feedback from shareholder consultation. a Committee advisors for 2015.
March 2014 a 2015 reward packages for the Executive Committee and Chairman’s fees.
a Risk assessment.
a 2014 directors’ remuneration report. a 2015 long-term incentive awards. a Committee’s effectiveness and terms of reference.
Vodafone Group Plc Annual Report 201476 77Overview
Strategy review Performance Governance Financials
Additional information

Annual report on remuneration (continued)
2014 remunerationIn this section we summarise the pay packages awarded to our executive directors for performance in the 2014 financial year versus 2013. Specifically we have provided a table that shows all remuneration that was earned by each individual during the year and computed a single total remuneration figure for the year. The value of the annual bonus (‘GSTIP’) was earned during the year but will be paid out in cash in the following year and the value of the long-term incentive (‘GLTI’) shows the share awards which will vest in June 2014 as a result of the performance through the three year period ended at the completion of our financial year on 31 March 2014.
The Remuneration Committee reviews all incentive awards prior to payment and has full discretion to reduce awards if it believes this is appropriate. The decision need not be on objective grounds. It should be noted that the Remuneration Committee did not exercise discretion in determining the annual bonus (‘GSTIP’) payout for this year or in deciding the final vesting level of the long-term incentive awards (‘GLTI’).
Total remuneration for the 2014 financial year (audited)Vittorio Colao Andy Halford1 Stephen Pusey
2014 £’000
2013 £’000
2014 £’000
2013 £’000
2014 £’000
2013 £’000
Salary/fees 1,110 1,110 700 700 575 575Taxable benefits2 38 39 47 45 21 21Annual bonus: GSTIP (see below for further detail) 982 731 620 461 509 379Total long-term incentive3: 6,464 8,886 2,424 5,164 2,164 2,842
GLTI vesting during the year4 5,630 7,573 2,111 4,401 1,885 2,422Cash in lieu of GLTI dividends5 834 1,313 313 763 279 420
Cash in lieu of pension 333 333 210 210 173 173Total 8,927 11,099 4,001 6,580 3,442 3,990
Notes:1 Andy Halford retired on 31 March 2014.2 Taxable benefits include amounts in respect of: – Private healthcare (2014: £1,734; 2013: £1,500);
– Cash car allowance £19,200 p.a.; – Travel (2014: Vittorio Colao £17,155; Andy Halford £13,848; 2013 (restated): Vittorio Colao £17,921; Andy Halford £24,626; and Stephen Pusey £408); and – Payment in lieu of holiday at retirement (2014: Andy Halford £11,936).
3 Excludes shares acquired under Vodafone’s Share Incentive Plan (‘SIP’). Andy Halford is the only director who participated and the annual value of the matching shares is £1,500.4 The value shown in the 2013 column is the award which vested on 28 June 2013 and is valued using the execution share price on 28 June 2013 of 188.03 pence. Please note that the values disclosed in this table in 2013 are
slightly different as the value was based on a share price at 31 March 2013 of 186.60 pence. The value shown in the 2014 column is the award which vests on 28 June 2014 and is valued using an average of the closing share price over the last quarter of the 2014 financial year of 234.23 pence. More details are included below.
5 Participants also receive a cash award, equivalent in value to the dividends that would have been paid during the vesting period on any shares that vest. The cash in lieu of dividend value shown in 2013 relates to the award which vested on 28 June 2013, and the value for 2014 relates to the award which vests on 28 June 2014.
2014 annual bonus (‘GSTIP’) payout (audited)In the table below we disclose our achievement against each of the performance measures and targets in our annual bonus (‘GSTIP’) and the resulting total annual bonus payout level for the year ended 31 March 2014 of 88.5%. This is applied to the target bonus level of 100% of base salary for each executive.
Performance measure
Payout at target
performance 100%
Payout at maximum
performance 200%
Actual payout
%
Target performance
level£bn
Actual performance
level1
£bn Commentary
Service revenue 25% 50% 15.6% 39.4 38.7 Below target performance in EuropeEBITDA 25% 50% 12.4% 12.7 12.3 Below target performance in Europe partially
offset by AMAPAdjusted free cash flow 25% 50% 45.1% 4.2 4.7 Strong performance in AMAPCompetitive performance assessment 25% 50% 15.4% Compilation of
market-by-market assessment
Consolidated performance below target although the number of markets where net
promoter score (‘NPS’) ranks #1 increasedTotal annual bonus payout level 100% 200% 88.5%
Note:1 These figures are adjusted to include the removal of the impact of M&A, foreign exchange movements and any changes in accounting treatment.
2015 annual bonus (‘GSTIP’) amounts Base salaryTarget bonus
% of base salary2014 payout
% of targetActual payment
(‘000)
Vittorio Colao 1,110,000 100% 88.5% £982Andy Halford 700,000 100% 88.5% £620
Stephen Pusey 575,000 100% 88.5% £509
Vodafone Group Plc Annual Report 201478
Directors’ remuneration (continued)
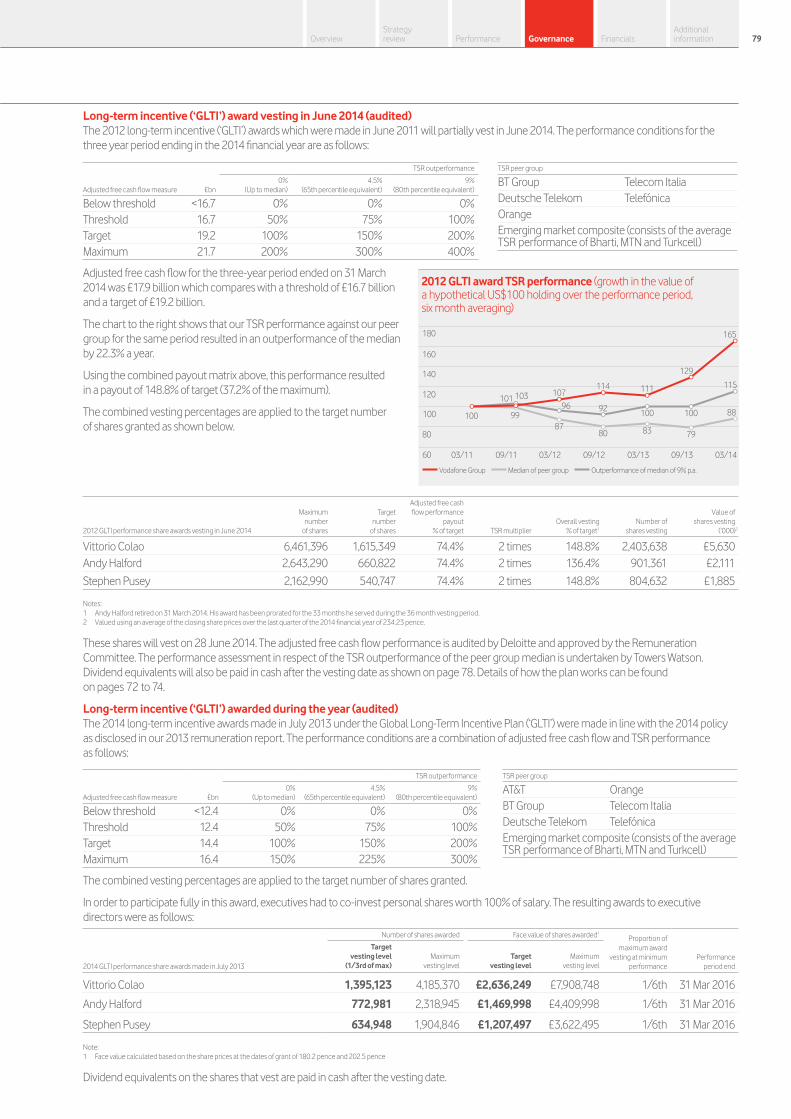
Long-term incentive (‘GLTI’) award vesting in June 2014 (audited)The 2012 long-term incentive (‘GLTI’) awards which were made in June 2011 will partially vest in June 2014. The performance conditions for the three year period ending in the 2014 financial year are as follows:
TSR outperformance
Adjusted free cash flow measure £bn0%
(Up to median)4.5%
(65th percentile equivalent)9%
(80th percentile equivalent)
Below threshold <16.7 0% 0% 0%Threshold 16.7 50% 75% 100%Target 19.2 100% 150% 200%Maximum 21.7 200% 300% 400%
TSR peer group
BT Group Telecom ItaliaDeutsche Telekom TelefónicaOrange Emerging market composite (consists of the average TSR performance of Bharti, MTN and Turkcell)
Adjusted free cash flow for the three-year period ended on 31 March 2014 was £17.9 billion which compares with a threshold of £16.7 billion and a target of £19.2 billion.
The chart to the right shows that our TSR performance against our peer group for the same period resulted in an outperformance of the median by 22.3% a year.
Using the combined payout matrix above, this performance resulted in a payout of 148.8% of target (37.2% of the maximum).
The combined vesting percentages are applied to the target number of shares granted as shown below.
2012 GLTI award TSR performance (growth in the value of a hypothetical US$100 holding over the performance period, six month averaging)
180
160
120
140
100
80
60 03/11 09/11 03/12 09/12 03/13 09/13 03/14
Vodafone Group Median of peer group Outperformance of median of 9% p.a.
100
103101
9996
107
87
114
92
80
111
100
83
129
100
79
165
115
88
2012 GLTI performance share awards vesting in June 2014
Maximum number
of shares
Target number
of shares
Adjusted free cash flow performance
payout % of target TSR multiplier
Overall vesting% of target1
Number of shares vesting
Value ofshares vesting
(‘000)2
Vittorio Colao 6,461,396 1,615,349 74.4% 2 times 148.8% 2,403,638 £5,630Andy Halford 2,643,290 660,822 74.4% 2 times 136.4% 901,361 £2,111
Stephen Pusey 2,162,990 540,747 74.4% 2 times 148.8% 804,632 £1,885
Notes:1 Andy Halford retired on 31 March 2014. His award has been prorated for the 33 months he served during the 36 month vesting period.2 Valued using an average of the closing share prices over the last quarter of the 2014 financial year of 234.23 pence.
These shares will vest on 28 June 2014. The adjusted free cash flow performance is audited by Deloitte and approved by the Remuneration Committee. The performance assessment in respect of the TSR outperformance of the peer group median is undertaken by Towers Watson. Dividend equivalents will also be paid in cash after the vesting date as shown on page 78. Details of how the plan works can be found on pages 72 to 74.
Long-term incentive (‘GLTI’) awarded during the year (audited)The 2014 long-term incentive awards made in July 2013 under the Global Long-Term Incentive Plan (‘GLTI’) were made in line with the 2014 policy as disclosed in our 2013 remuneration report. The performance conditions are a combination of adjusted free cash flow and TSR performance as follows:
TSR outperformance
Adjusted free cash flow measure £bn0%
(Up to median)4.5%
(65th percentile equivalent)9%
(80th percentile equivalent)
Below threshold <12.4 0% 0% 0%Threshold 12.4 50% 75% 100%Target 14.4 100% 150% 200%Maximum 16.4 150% 225% 300%
TSR peer group
AT&T OrangeBT Group Telecom ItaliaDeutsche Telekom TelefónicaEmerging market composite (consists of the average TSR performance of Bharti, MTN and Turkcell)
The combined vesting percentages are applied to the target number of shares granted.
In order to participate fully in this award, executives had to co-invest personal shares worth 100% of salary. The resulting awards to executive directors were as follows:
2014 GLTI performance share awards made in July 2013
Number of shares awarded Face value of shares awarded1Proportion of
maximum award vesting at minimum
performancePerformance
period end
Target vesting level
(1/3rd of max)Maximum
vesting levelTarget
vesting levelMaximum
vesting level
Vittorio Colao 1,395,123 4,185,370 £2,636,249 £7,908,748 1/6th 31 Mar 2016
Andy Halford 772,981 2,318,945 £1,469,998 £4,409,998 1/6th 31 Mar 2016
Stephen Pusey 634,948 1,904,846 £1,207,497 £3,622,495 1/6th 31 Mar 2016
Note:1 Face value calculated based on the share prices at the dates of grant of 180.2 pence and 202.5 pence
Dividend equivalents on the shares that vest are paid in cash after the vesting date.
Vodafone Group Plc Annual Report 201478 79Overview
Strategy review Performance Governance Financials
Additional information

Annual report on remuneration (continued)
All-employee share plansThe executive directors are also eligible to participate in the UK all-employee plans.Summary of plans
SharesaveThe Vodafone Group 2008 Sharesave Plan is an HM Revenue & Customs (‘HMRC’) approved scheme open to all staff permanently employed by a Vodafone Company in the UK as of the eligibility date. Options under the plan are granted at up to a 20% discount to market value. Executive directors’ participation is included in the option table on page 81.Share Incentive PlanThe Vodafone Share Incentive Plan (‘SIP’) is an HMRC approved plan open to all staff permanently employed by a Vodafone Company in the UK. Participants may contribute up to a maximum of £125 per month (or 5% of salary if less) which the trustee of the plan uses to buy shares on their behalf. An equivalent number of shares are purchased with contributions from the employing company. UK-based executive directors are eligible to participate.
Pensions (audited)Vittorio Colao, Andy Halford and Stephen Pusey received a cash allowance of 30% of base salary in lieu of pension contributions during the 2014 financial year. No executive directors accrued benefits under any defined contribution pension plans during the year.
The executive directors are provided benefits in the event of death in service. They also have an entitlement under a long-term disability plan from which two-thirds of base salary, up to a maximum benefit determined by the insurer, would be provided until normal retirement date (aged 60).
Andy Halford retired on 31 March 2014 aged 55. Until 2010, he participated in a legacy defined benefit pension plan into which no additional contributions were payable in 2014. On 31 March 2010 he took the opportunity to take early retirement from this pension scheme due to the closure of the scheme (aged 51 years). In accordance with the scheme rules, his accrued pension at this date was reduced with an early retirement factor for four years to reflect the fact that his pension is being paid before age 55 and is therefore expected to be paid out for a longer period of time. In addition, he exchanged part of his early retirement pension at 31 March 2010 for a tax-free cash lump sum of £118,660. The pension in payment at 31 March 2010 was £17,800 per year. The pension increased on 1 April 2011, 1 April 2012 and 1 April 2013 by 5%, in line with the scheme rules, to £20,605 per year from 1 April 2013.
Alignment to shareholder interests (audited)All of our executive directors have shareholdings in excess of their goals. Current levels of ownership by the executive directors, and the date by which the goal should be or should have been achieved, are shown below. The values are calculated using an average share price over the six months to 31 March 2014 of 229.32 pence. These values do not include the value of the shares that will vest in June 2014.
At 31 March 2014Goal as a %
of salaryCurrent %
of salary held% of goal
achievedNumber of shares1
Value of shareholding
(£m)Date for goal
to be achieved
Vittorio Colao 400% 1,875% 469% 9,077,302 20.8 July 2012Andy Halford (ownership position at retirement on 31 March 2014) 300% 755% 252% 2,305,059 5.3 July 2010Stephen Pusey 300% 630% 210% 1,579,543 3.6 June 2014
Note:1 During the year the Verizon transaction and a share consolidation took place.
Collectively the Executive Committee including the executive directors own more than 22 million Vodafone shares, with a value of over £50 million.
Directors’ interests in the shares of the Company (audited)A summary of interests in shares and scheme interests of the directors who served during the year is given below. More details of the performance shares and options follows.
At 31 March 2014
Share plans Shares options
Total number of interests
in shares1
Unvested GLTI Shares (with
performance conditions)
Share Incentive Plan (without
performance conditions)
SAYE (unvested without
performance conditions)
Executive directorsVittorio Colao 24,251,716 15,157,846 – 16,568Andy Halford (position at retirement on 31 March 2014) 8,561,152 6,249,860 17,014 6,233Stephen Pusey 7,719,776 6,140,233 – –Total 40,532,644 27,547,939 17,014 22,801
Note:1 Includes shares in the share incentive plan (SIP), interests of connected persons, unvested share awards and share options. During the year the Verizon transaction and a share consolidation took place.
.
Vodafone Group Plc Annual Report 201480
Directors’ remuneration (continued)

At 31 March 2014
Total number of interests
in shares1
Non-executive directorsValerie Gooding 4,038 Renee James 27,272 Alan Jebson 44,912Samuel Jonah 30,190 Gerard Kleisterlee 59,755 Omid Kordestani – Nick Land 32,090 Anne Lauvergeon 17,151 Luc Vandevelde 54,880 Anthony Watson 62,727 Philip Yea 33,408
Note:1 During the year the Verizon transaction and a share consolidation took place.
During the period from 1 April 2014 to 20 May 2014, the directors’ total number of interests in shares did not change.
Performance sharesThe maximum number of outstanding shares that have been awarded to directors under the long-term incentive (‘GLTI’) plan are currently as follows:
GLTI performance share awards
2012 awardAwarded: June 2011
Performance period ending: March 2014Vesting date: June 2014
Share price at grant: 163.2 pence
2013 awardAwarded: July 2012
Performance period ending: March 2015Vesting date: July 2015
Share price at grant: 179.4 pence
2014 awardAwarded: June 2013 and September 20131
Performance period ending: March 2016Vesting date: June 2016
Share price at grant: 180.2 pence and 202.5 pence
Vittorio Colao 6,461,396 4,511,080 4,185,370
Andy Halford 2,643,290 1,287,625 2,318,945
Stephen Pusey 2,162,990 2,072,397 1,904,846
Note:1 Due to a close period, executive directors were not able to make co-investment commitments at the time of the main award in June 2013 and therefore part of the award was made in September 2013.
For details of the performance conditions please see page 74.
Share optionsNo share options have been granted to directors during the year. The following information summarises the executive directors’ options under the Vodafone Group 2008 Sharesave Plan (‘SAYE’) and the Vodafone Group Incentive Plan (‘GIP’). HMRC approved awards may be made under both of the schemes mentioned. No other directors have options under any schemes.
Options under the Vodafone Group 2008 Sharesave Plan were granted at a discount of 20% to the market value of the shares at the time of the grant. No other options may be granted at a discount.
Grant date
At 1 April 2013
or date of appointment
Options granted
during the 2014 financial
year
Options exercised
during the 2014 financial
year
Options lapsed
during the 2014 financial
year
Options held at
31 March 2014Option
price Date from which
exercisable Expiry date
Market price on exercise
Gain on exerciseNumber of shares
Number of shares
Number of shares
Number of shares
Number of shares Pence1 Pence
Vittorio ColaoGIP2 Jul 2007 3,003,575 – (3,003,575) – – 167.80 Jul 2010 Jul 2017 213.16 £1,362,503SAYE Jul 2009 16,568 – – – 16,568 93.85 Sep 2014 Feb 2015 –Total 3,020,143 – (3,003,575) – 16,568
Andy HalfordGIP2 Jul 2007 2,295,589 – (2,295,589) – – 167.80 Jul 2010 Jul 2017 213.16 £1,041,392SAYE Jul 2012 6,233 – – 6,233 144.37 Sep 2015 Feb 2016 –Total 2,301,822 – (2,295,589) – 6,233
Stephen PuseyGIP3 Sep 2006 1,034,259 – (1,034,259) – – 113.75 Sep 2009 Aug 2016 212.80 £1,024,417GIP2 Jul 2007 947,556 – (947,556) – – 167.80 Jul 2010 Jul 2017 231.64 £604,888Total 1,981,815 – (1,981,815) – –
Notes:1 The closing trade share price on 31 March 2014 was 220.25 pence. The highest trade share price during the year was 252.3 pence and the lowest price was 180.23 pence.2 The performance condition on the options granted in July 2007 was a three year cumulative growth in adjusted earnings per share. The options vested at 100% in July 2010.3 The performance condition on the options granted in September 2006 was a three year cumulative growth in adjusted earnings per share. The options vested at 100% in September 2009.
Vodafone Group Plc Annual Report 201480 81Overview
Strategy review Performance Governance Financials
Additional information
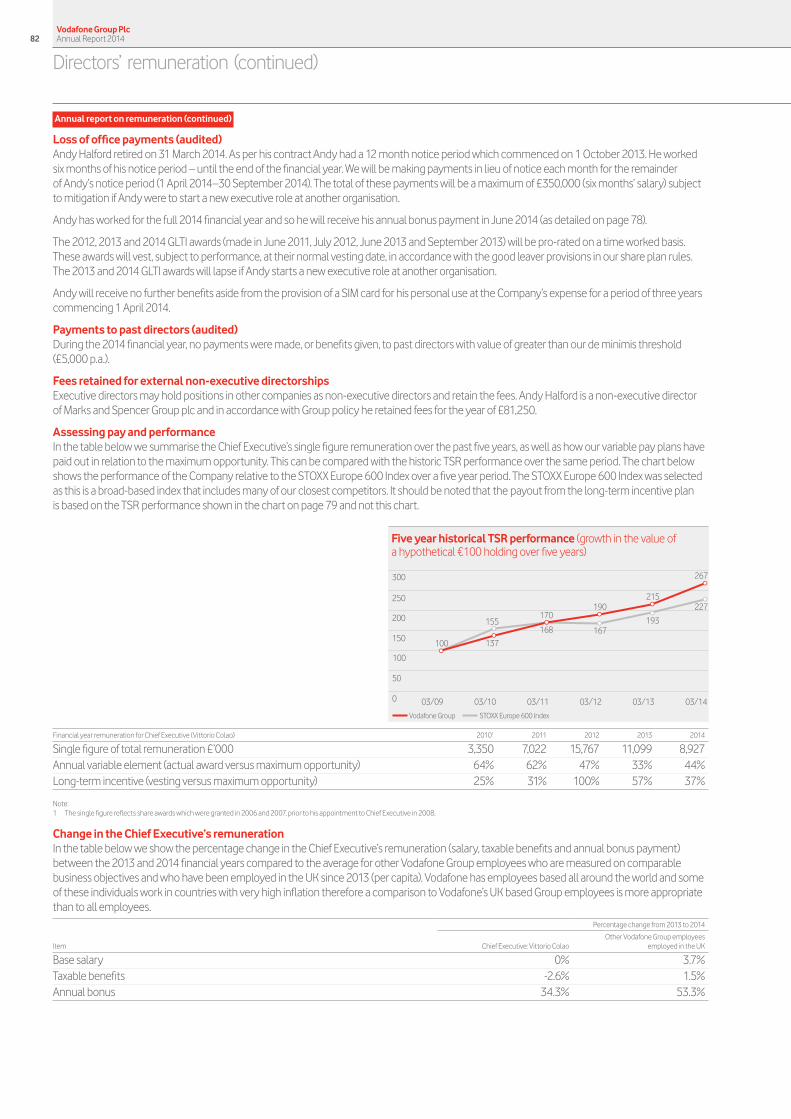
Annual report on remuneration (continued)
Loss of office payments (audited)Andy Halford retired on 31 March 2014. As per his contract Andy had a 12 month notice period which commenced on 1 October 2013. He worked six months of his notice period – until the end of the financial year. We will be making payments in lieu of notice each month for the remainder of Andy’s notice period (1 April 2014–30 September 2014). The total of these payments will be a maximum of £350,000 (six months’ salary) subject to mitigation if Andy were to start a new executive role at another organisation.
Andy has worked for the full 2014 financial year and so he will receive his annual bonus payment in June 2014 (as detailed on page 78).
The 2012, 2013 and 2014 GLTI awards (made in June 2011, July 2012, June 2013 and September 2013) will be pro-rated on a time worked basis. These awards will vest, subject to performance, at their normal vesting date, in accordance with the good leaver provisions in our share plan rules. The 2013 and 2014 GLTI awards will lapse if Andy starts a new executive role at another organisation.
Andy will receive no further benefits aside from the provision of a SIM card for his personal use at the Company’s expense for a period of three years commencing 1 April 2014.
Payments to past directors (audited)During the 2014 financial year, no payments were made, or benefits given, to past directors with value of greater than our de minimis threshold (£5,000 p.a.).
Fees retained for external non-executive directorshipsExecutive directors may hold positions in other companies as non-executive directors and retain the fees. Andy Halford is a non-executive director of Marks and Spencer Group plc and in accordance with Group policy he retained fees for the year of £81,250.
Assessing pay and performanceIn the table below we summarise the Chief Executive’s single figure remuneration over the past five years, as well as how our variable pay plans have paid out in relation to the maximum opportunity. This can be compared with the historic TSR performance over the same period. The chart below shows the performance of the Company relative to the STOXX Europe 600 Index over a five year period. The STOXX Europe 600 Index was selected as this is a broad-based index that includes many of our closest competitors. It should be noted that the payout from the long-term incentive plan is based on the TSR performance shown in the chart on page 79 and not this chart.
Five year historical TSR performance (growth in the value of a hypothetical €100 holding over five years)
300
250
150
200
100
50
0
100 137
155170
168
190
167
215
193
267
227
Vodafone Group STOXX Europe 600 Index
03/09 03/10 03/11 03/12 03/13 03/14
Financial year remuneration for Chief Executive (Vittorio Colao) 20101 2011 2012 2013 2014
Single figure of total remuneration £’000 3,350 7,022 15,767 11,099 8,927Annual variable element (actual award versus maximum opportunity) 64% 62% 47% 33% 44%Long-term incentive (vesting versus maximum opportunity) 25% 31% 100% 57% 37%
Note:1 The single figure reflects share awards which were granted in 2006 and 2007, prior to his appointment to Chief Executive in 2008.
Change in the Chief Executive’s remunerationIn the table below we show the percentage change in the Chief Executive’s remuneration (salary, taxable benefits and annual bonus payment) between the 2013 and 2014 financial years compared to the average for other Vodafone Group employees who are measured on comparable business objectives and who have been employed in the UK since 2013 (per capita). Vodafone has employees based all around the world and some of these individuals work in countries with very high inflation therefore a comparison to Vodafone’s UK based Group employees is more appropriate than to all employees.
Percentage change from 2013 to 2014
Item Chief Executive: Vittorio ColaoOther Vodafone Group employees
employed in the UK
Base salary 0% 3.7%Taxable benefits -2.6% 1.5%Annual bonus 34.3% 53.3%
Vodafone Group Plc Annual Report 201482
Directors’ remuneration (continued)
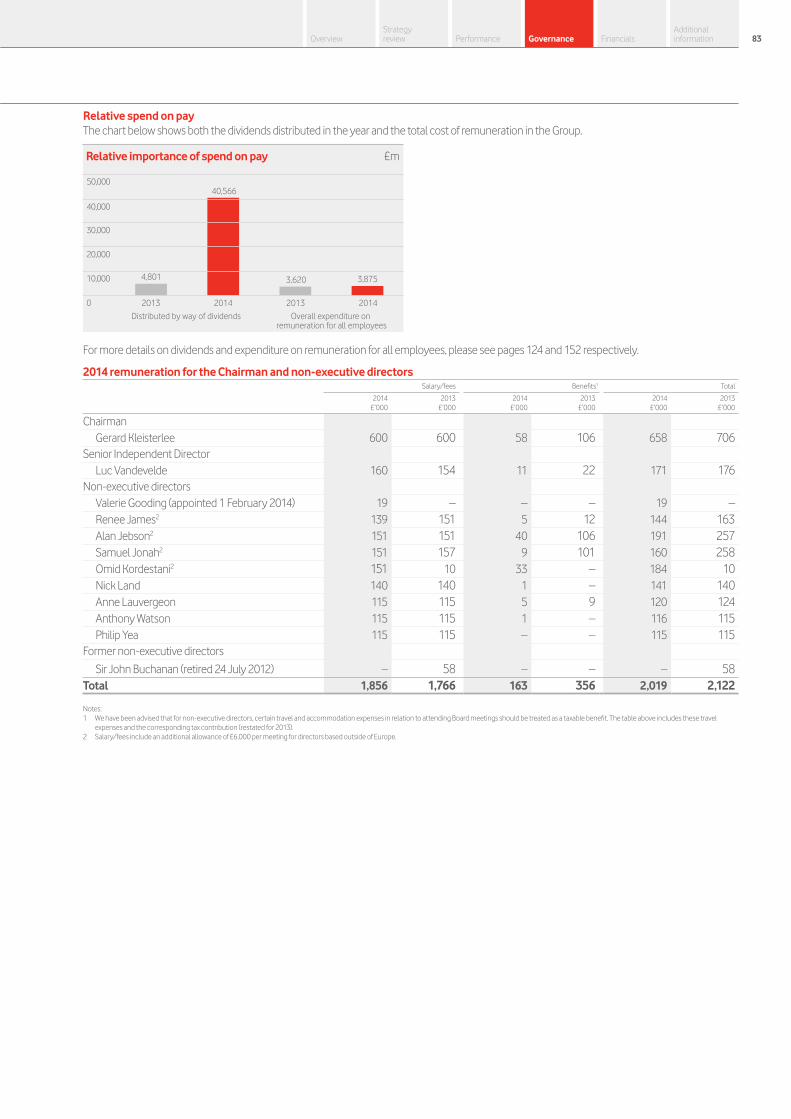
Relative spend on payThe chart below shows both the dividends distributed in the year and the total cost of remuneration in the Group.
Relative importance of spend on pay
40,000
50,000
30,000
20,000
10,000
0
£m
4,801 3,8753,620
40,566
2013 2014 2013 2014
Distributed by way of dividends Overall expenditure on remuneration for all employees
For more details on dividends and expenditure on remuneration for all employees, please see pages 124 and 152 respectively.
2014 remuneration for the Chairman and non-executive directorsSalary/fees Benefits1 Total
2014 £’000
2013 £’000
2014 £’000
2013 £’000
2014 £’000
2013 £’000
ChairmanGerard Kleisterlee 600 600 58 106 658 706
Senior Independent DirectorLuc Vandevelde 160 154 11 22 171 176
Non-executive directorsValerie Gooding (appointed 1 February 2014) 19 – – – 19 –Renee James2 139 151 5 12 144 163Alan Jebson2 151 151 40 106 191 257Samuel Jonah2 151 157 9 101 160 258Omid Kordestani2 151 10 33 – 184 10Nick Land 140 140 1 – 141 140Anne Lauvergeon 115 115 5 9 120 124Anthony Watson 115 115 1 – 116 115Philip Yea 115 115 – – 115 115
Former non-executive directors
Sir John Buchanan (retired 24 July 2012) – 58 – – – 58Total 1,856 1,766 163 356 2,019 2,122
Notes:1 We have been advised that for non-executive directors, certain travel and accommodation expenses in relation to attending Board meetings should be treated as a taxable benefit. The table above includes these travel
expenses and the corresponding tax contribution (restated for 2013). 2 Salary/fees include an additional allowance of £6,000 per meeting for directors based outside of Europe.
Vodafone Group Plc Annual Report 201482 83Overview
Strategy review Performance Governance Financials
Additional information
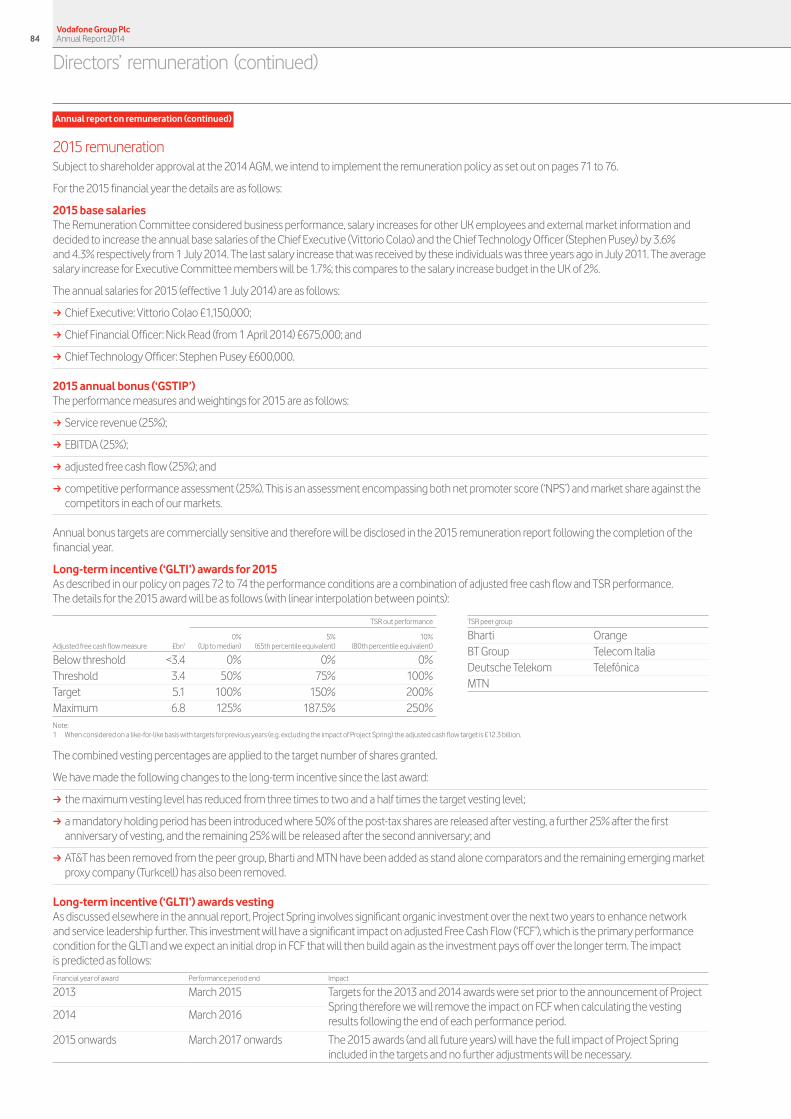
Annual report on remuneration (continued)
2015 remunerationSubject to shareholder approval at the 2014 AGM, we intend to implement the remuneration policy as set out on pages 71 to 76.
For the 2015 financial year the details are as follows:
2015 base salariesThe Remuneration Committee considered business performance, salary increases for other UK employees and external market information and decided to increase the annual base salaries of the Chief Executive (Vittorio Colao) and the Chief Technology Officer (Stephen Pusey) by 3.6% and 4.3% respectively from 1 July 2014. The last salary increase that was received by these individuals was three years ago in July 2011. The average salary increase for Executive Committee members will be 1.7%; this compares to the salary increase budget in the UK of 2%.
The annual salaries for 2015 (effective 1 July 2014) are as follows:
a Chief Executive: Vittorio Colao £1,150,000;
a Chief Financial Officer: Nick Read (from 1 April 2014) £675,000; and
a Chief Technology Officer: Stephen Pusey £600,000.
2015 annual bonus (‘GSTIP’)The performance measures and weightings for 2015 are as follows:
a Service revenue (25%);
a EBITDA (25%);
a adjusted free cash flow (25%); and
a competitive performance assessment (25%). This is an assessment encompassing both net promoter score (‘NPS’) and market share against the competitors in each of our markets.
Annual bonus targets are commercially sensitive and therefore will be disclosed in the 2015 remuneration report following the completion of the financial year.
Long-term incentive (‘GLTI’) awards for 2015As described in our policy on pages 72 to 74 the performance conditions are a combination of adjusted free cash flow and TSR performance. The details for the 2015 award will be as follows (with linear interpolation between points):
Adjusted free cash flow measure
TSR out performance
£bn1
0%(Up to median)
5% (65th percentile equivalent)
10%(80th percentile equivalent)
Below threshold <3.4 0% 0% 0%Threshold 3.4 50% 75% 100%Target 5.1 100% 150% 200%Maximum 6.8 125% 187.5% 250%
TSR peer group
Bharti OrangeBT Group Telecom ItaliaDeutsche Telekom TelefónicaMTN
Note:1 When considered on a like-for-like basis with targets for previous years (e.g. excluding the impact of Project Spring) the adjusted cash flow target is £12.3 billion.
The combined vesting percentages are applied to the target number of shares granted.
We have made the following changes to the long-term incentive since the last award:
a the maximum vesting level has reduced from three times to two and a half times the target vesting level;
a a mandatory holding period has been introduced where 50% of the post-tax shares are released after vesting, a further 25% after the first anniversary of vesting, and the remaining 25% will be released after the second anniversary; and
a AT&T has been removed from the peer group, Bharti and MTN have been added as stand alone comparators and the remaining emerging market proxy company (Turkcell) has also been removed.
Long-term incentive (‘GLTI’) awards vestingAs discussed elsewhere in the annual report, Project Spring involves significant organic investment over the next two years to enhance network and service leadership further. This investment will have a significant impact on adjusted Free Cash Flow (‘FCF’), which is the primary performance condition for the GLTI and we expect an initial drop in FCF that will then build again as the investment pays off over the longer term. The impact is predicted as follows:Financial year of award Performance period end Impact
2013 March 2015 Targets for the 2013 and 2014 awards were set prior to the announcement of Project Spring therefore we will remove the impact on FCF when calculating the vesting results following the end of each performance period.2014 March 2016
2015 onwards March 2017 onwards The 2015 awards (and all future years) will have the full impact of Project Spring included in the targets and no further adjustments will be necessary.
Vodafone Group Plc Annual Report 201484
Directors’ remuneration (continued)

2015 remuneration for the Chairman and non-executive directorsFor the 2015 review, the fees for our Chairman and non-executives have been benchmarked against a comparator group of the FTSE 30 companies. Following the review there will be no increases to the fees of non-executive directors. The Chairman’s fees will be increased by 4.2% to £625,000 from 1 July 2014.
Position/roleFee payable (£’000)
From 1 April 2014
Chairman1 625Senior Independent Director2 160Non-executive director 115Chairmanship of Audit and Risk Committee 25
Note:1 The Chairman’s fee also includes the fee for the Chairmanship of the Nominations and Governance Committee.2 The Senior Independent Director’s fees also include the fee for the Chairmanship of the Remuneration Committee.
For 2015, the allowance payable each time a non-Europe-based non-executive director is required to travel to attend Board and committee meetings to reflect the additional time commitment involved is £6,000.
Further remuneration informationDilutionAll awards are made under plans that incorporate dilution limits as set out in the guidelines for share incentive schemes published by the Association of British Insurers. The current estimated dilution from subsisting executive awards is approximately 3.2% of the Company’s share capital at 31 March 2014 (2.0% at 31 March 2013), whilst from all-employee share awards it is approximately 0.6% (0.3% at 31 March 2013). This gives a total dilution of 3.8% (2.3% at 31 March 2013).
Service contractsThe terms and conditions of appointment of our directors are available for inspection at the Company’s registered office during normal business hours and at the AGM (for 15 minutes prior to the meeting and during the meeting). The executive directors have notice periods in their service contracts of 12 months. The non-executive directors’ letters of appointment do not contain provision for notice periods or for compensation if their appointments are terminated.
The executive directors will be proposed for election or re-election at the 2014 AGM.
Luc VandeveldeOn behalf of the Board
20 May 2014
Vodafone Group Plc Annual Report 201484 85Overview
Strategy review Performance Governance Financials
Additional information

Directors’ reportThe Directors of your Company present their report together with the consolidated financial statements for the year ended 31 March 2014.
This report has been prepared in accordance with requirements outlined within The Large and Medium-sized Companies and Groups (Accounts and Reports) Regulations 2008 and forms part of the management report as required under DTR4. Certain information that fulfils the requirements of the directors’ report can be found elsewhere in this document and is referred to below. This information is incorporated into this directors’ report by reference.
Responsibility statementAs required under the Disclosure and Transparency Rules a statement made by the Board regarding the preparation of the financial statements is set out on page 88. This statement also provides details regarding the disclosure of information to the Company’s auditors and management’s report on internal control over financial information.
Going concernThe going concern statement required by the Listing Rules and the Code is set out in the “Directors’ statement of responsibility” on page 89.
Strategic reportThe strategic report is set out in pages 1 to 47 and is incorporated into this directors’ report by reference.
Directors and their interestsA full list of the individuals who were directors of the Company during the financial year ended 31 March 2014 is set out below.
Gerard Kleisterlee, Vittorio Colao, Andy Halford, Stephen Pusey, Valerie Gooding, Renee James, Alan Jebson, Samuel Jonah, Omid Kordestani, Nick Land, Anne Lauvergeon, Luc Vandevelde, Anthony Watson and Philip Yea.
Details of each director’s interests in the Company’s ordinary shares, options held over ordinary shares, interests in share options and long term incentive plans are set out in full on pages 69 to 85.
Directors’ conflicts of interestEstablished within the Company is a procedure for managing and monitoring conflicts of interest for directors. Full details of this procedure is set out on page 56.
Directors’ indemnitiesDetails of qualifying third party indemnity provisions for the benefit of the Company’s directors can be found on page 57.
Corporate governance statementUnder Disclosure and Transparency Rule 7, a requirement exists for certain parts of the corporate governance statement to be outlined in the directors’ report. This information is laid out in the corporate governance statement, on pages 48 to 85.
Capital structure and rights attaching to sharesAll information relating to the Company’s capital structure, rights attaching to shares, dividends, the policy to repurchase the Company’s own shares and other shareholder information is contained on pages 182 to 189 and incorporated into this directors’ report by reference.
DividendsFull details of the Company’s dividend policy and proposed final dividend payment for the year ended 31 March 2014, are set out on page 124.
SustainabilityInformation about the Company’s approach to sustainability risks and opportunities is set out on pages 34 and 35. Also included on these pages are details of our greenhouse gas emissions.
Political donationsNo political donations under the Companies Act 2006 have been made during the financial year. The Group policy is that no political donations be made or political expenditure incurred.
Financial risk management objectives and policiesDisclosures relating to financial risk management objectives and policies, including our policy for hedging are set out in note 23 to the consolidated financial statements.
Exposure to price, credit, liquidity and cash flow risksOur disclosures relating to exposure to price risk, credit risk, liquidity risk and cash flow risk are outlined in note 23 to the consolidated financial statements.
Important events since the end of the financial yearDetails of those important events affecting the Group which have occurred since the end of the financial year are set out in the strategic report and note 34 to the consolidated financial statements.
Future developments within the GroupThe strategic report contains details of likely future developments within the Group.
Research and developmentDetails of the Group’s activities relating to research and development are contained in note 3 to the consolidated financial statements.
BranchesAs the Group is a global business there are activities operated through many jurisdictions.
Employee disclosuresOur disclosures relating to the employment of disabled persons, the number of women in senior management roles, employee engagement and policies are included in “Our people” on pages 36 and 37.
By Order of the Board
Rosemary MartinCompany Secretary
20 May 2014
Vodafone Group Plc Annual Report 201486
Directors’ report

Page
88 Directors’ statement of responsibility
90 Auditreportoninternalcontroloverfinancialreporting
91 Auditreportontheconsolidatedandparentcompanyfinancialstatements
96 Consolidatedfinancialstatementsandfinancialcommentary
96 Consolidated income statement 96 Consolidated statement
of comprehensive income98 Consolidated statement
of financial position100 Consolidated statement of changes
in equity 102 Consolidated statement of cash flows
Page
104 Notestotheconsolidatedfinancial statements:
104 1. Basis of preparation Income statement109 2. Segmental analysis113 3. Operating (loss)/profit114 4. Impairment losses 118 5. Investment income and
financing costs119 6. Taxation123 7. Discontinued operations124 8. Earnings per share124 9. Equity dividends Financialposition 125 10. Intangible assets127 11. Property, plant and equipment129 12. Investments in associates and
joint ventures132 13. Other investments133 14. Inventory134 15. Trade and other receivables135 16. Trade and other payables136 17. Provisions137 18. Called up share capital Cashflows138 19. Reconciliation of net cash flow from
operating activities 138 20. Cash and cash equivalents139 21. Borrowings 143 22. Liquidity and capital resources146 23. Capital and financial risk
management Employeeremuneration151 24. Directors and key management
compensation152 25. Employees 153 26. Post employment benefits 157 27. Share-based payments Additionaldisclosures159 28. Acquisitions and disposals163 29. Commitments164 30. Contingent liabilities167 31. Related party transactions167 32. Principal subsidiaries170 33. Subsidiaries exempt from audit170 34. Subsequent events
Page
171 Otherunauditedfinancialinformation:
171 Prior year operating results
176 Companybalancesheetof VodafoneGroupPlc
177 NotestotheCompanyfinancial statements:
177 1. Basis of preparation178 2. Fixed assets178 3. Debtors179 4. Other investments179 5. Creditors179 6. Share capital180 7. Share-based payments180 8. Reserves and reconciliation
of movements in equity shareholders’ funds
180 9. Equity dividends181 10. Contingent liabilities
ReportingourfinancialperformanceWe continue to review the format of our consolidated financial statements with the aim of making them clear and easier to follow. This year, in addition to continuing with the integrated financial review which combines commentary on certain items within the primary financial statements, we have changed the order and grouping of the notes to the financial statements to help with the flow of information and focus on areas that we feel are key to understanding our business. We have also placed accounting policies within the notes to the accounts to which they best relate. We hope this format makes it easier for you to navigate to the information that is important to you.
The “Consolidated financial statements” on pages 96 to 170 are presented on a statutory basis which, under IFRS accounting principles, includes the financial results of the Group’s joint ventures using the equity accounting basis. As detailed in “Financial highlights” on page 3, this differs from the management basis used in the discussion of our results in the strategic report, which includes the results of the Group’s joint ventures on a proportionate basis, which is how the business is managed and operated and performance reported to management. See note 2 “Segmental analysis” to the consolidated financial statements for further information and reconciliations between the management and statutory basis.
87OverviewStrategy review Performance Governance Financials
Additional information
Contents
Financial statements and accounting recordsCompany law of England and Wales requires the directors to prepare financial statements for each financial year which give a true and fair view of the state of affairs of the Company and of the Group at the end of the financial year and of the profit or loss of the Group for that period. In preparing those financial statements the directors are required to:
a select suitable accounting policies and apply them consistently;
a make judgements and estimates that are reasonable and prudent;
a present information, including accounting policies, in a manner that provides relevant, reliable, comparable and understandable information;
a state whether the consolidated financial statements have been prepared in accordance with International Financial Reporting Standards (‘IFRS’) as adopted for use in the EU and Article 4 of the EU IAS Regulations. The directors also ensure that the consolidated financial statements have been prepared in accordance with IFRS as issued by the International Accounting Standards Board (‘IASB’);
a state for the Company financial statements whether applicable UK accounting standards have been followed; and
a prepare the financial statements on a going concern basis unless it is inappropriate to presume that the Company and the Group will continue in business.
The directors are responsible for keeping proper accounting records which disclose with reasonable accuracy at any time the financial position of the Company and of the Group and to enable them to ensure that the financial statements comply with the Companies Act 2006 and for the consolidated financial statements, Article 4 of the EU IAS Regulation. They are also responsible for the system of internal control, for safeguarding the assets of the Company and the Group and, hence, for taking reasonable steps for the prevention and detection of fraud and other irregularities.
Directors’ responsibility statementThe Board confirms to the best of its knowledge:
a the consolidated financial statements, prepared in accordance with IFRS as issued by the IASB and IFRS as adopted by the EU, give a true and fair view of the assets, liabilities, financial position and profit of the Group;
a the parent company financial statements, prepared in accordance with United Kingdom generally accepted accounting practice, give a true and fair view of the assets, liabilities, financial position and profit of the Company; and
a the directors’ report includes a fair review of the development and performance of the business and the position of the Group together with a description of the principal risks and uncertainties that it faces.
The directors are responsible for preparing the annual report in accordance with applicable law and regulations. Having taken advice from the Audit and Risk Committee, the Board considers the report and accounts, taken as a whole, as fair, balanced and understandable and that it provides the information necessary for shareholders to assess the Company’s performance, business model and strategy.
Neither the Company nor the directors accept any liability to any person in relation to the annual report except to the extent that such liability could arise under English law. Accordingly, any liability to a person who has demonstrated reliance on any untrue or misleading statement or omission shall be determined in accordance with section 90A and schedule 10A of the Financial Services and Markets Act 2000.
Disclosure of information to the auditorHaving made the requisite enquiries, so far as the directors are aware, there is no relevant audit information (as defined by section 418(3) of the Companies Act 2006) of which the Company’s auditor is unaware and the directors have taken all the steps they ought to have taken to make themselves aware of any relevant audit information and to establish that the Company’s auditor is aware of that information.
The directors are responsible for preparing the financial statements in accordance with applicable law and regulations and keeping proper accounting records. Detailed below are statements made by the directors in relation to their responsibilities, disclosure of information to the Company’s auditors, going concern and management’s report on internal control over financial reporting.
VodafoneGroupPlc Annual Report 201488
Directors’ statement of responsibility

Going concernThe Group’s business activities, performance, position and principal risks and uncertainties and how these are managed or mitigated are set out in the strategic report on pages 1 to 47.
In addition, the financial position of the Group is included within “Commentary on the consolidated statement of cash flows” on page 103, “Borrowings”, “Liquidity and capital resources” and “Capital and financial risk management” in notes 21, 22 and 23 respectively to the consolidated financial statements, which include disclosure in relation to the Group’s objectives, policies and processes for managing its capital; its financial risk management objectives; details of its financial instruments and hedging activities; and its exposures to credit risk and liquidity risk.
The Group has considerable financial resources, and the directors believe that the Group is well placed to manage its business risks successfully. After making enquiries, the directors have a reasonable expectation that the Company and the Group have adequate resources to continue in operational existence for the foreseeable future. Accordingly, the directors continue to adopt the going concern basis in preparing the annual report and accounts.
Further discussion on the basis of the going concern assessment by the directors is set out on page 200.
Management’s report on internal control over financial reportingAs required by section 404 of the Sarbanes-Oxley Act, management is responsible for establishing and maintaining adequate internal control over financial reporting for the Group. The Group’s internal control over financial reporting includes policies and procedures that:
a pertain to the maintenance of records that, in reasonable detail, accurately and fairly reflect transactions and dispositions of assets;
a are designed to provide reasonable assurance that transactions are recorded as necessary to permit the preparation of financial statements in accordance with IFRS, as adopted by the EU and IFRS as issued by the IASB, and that receipts and expenditures are being made only in accordance with authorisation of management and the directors of the Company; and
a provide reasonable assurance regarding prevention or timely detection of unauthorised acquisition, use or disposition of the Group’s assets that could have a material effect on the financial statements.
Any internal control framework, no matter how well designed, has inherent limitations including the possibility of human error and the circumvention or overriding of the controls and procedures, and may not prevent or detect misstatements. Also, projections of any evaluation of effectiveness to future periods are subject to the risk that controls may become inadequate because of changes in conditions or because the degree of compliance with the policies or procedures may deteriorate.
Management has assessed the effectiveness of the internal control over financial reporting at 31 March 2014 based on the original Internal Control – Integrated Framework, issued by the Committee of Sponsoring Organizations of the Treadway Commission (‘COSO’) in 1992. Based on management’s assessment, management has concluded that internal control over financial reporting was effective at 31 March 2014.
In 2013, COSO published an updated Internal Control – Integrated Framework which will supersede the original framework from 15 December 2014. Accordingly, the new framework will be implemented during the year ending 31 March 2015. The Group’s existing controls will be mapped to the five components and 17 principles in the updated Internal Control – Integrated Framework. Any gaps will be evaluated and, where required, additional controls identified, or existing controls enhanced.
The assessment excluded the internal controls over financial reporting relating to Kabel Deutschland Holding AG (‘KDG’) because it became a subsidiary during the year, as described in note 28 “Acquisitions and disposals”. KDG will be included in the Group’s assessment at 31 March 2015. Key amounts consolidated for KDG at 31 March 2014 are total assets of £9,741 million, net assets of £4,709 million and revenue and loss for the financial year of £735 million and £242 million, respectively.
During the period covered by this document, there were no changes in the Group’s internal control over financial reporting that have materially affected or are reasonably likely to materially affect the effectiveness of the internal controls over financial reporting.
The Group’s internal control over financial reporting at 31 March 2014 has been audited by Deloitte LLP, an independent registered public accounting firm who also audit the Group’s consolidated financial statements. Their audit report on internal control over financial reporting is on page 90.
By Order of the Board
RosemaryMartinCompany Secretary
20 May 2014
VodafoneGroupPlc Annual Report 201488 89Overview
Strategy review Performance Governance Financials
Additional information
Report of independent registered public accounting firm to the members of Vodafone Group Plc We have audited the internal control over financial reporting of Vodafone Group Plc and subsidiaries and applicable joint ventures (the “Group”) as of 31 March 2014, based on criteria established in Internal Control – Integrated Framework (1992) issued by the Committee of Sponsoring Organizations of the Treadway Commission. As described in management’s report on internal control over financial reporting, management excluded from its assessment the internal control over financial reporting at Kabel Deutschland Holding AG, which became a subsidiary during the year and which accounted for £9,741 million of total assets, £4,709 million of net assets, £735 million of revenue and £242 million of loss for the financial year of the consolidated financial statement amounts as of and for the year ended 31 March 2014. Accordingly our audit did not include the internal control over financial reporting at Kabel Deutschland Holding AG.
The Group’s management is responsible for maintaining effective internal control over financial reporting and for its assessment of the effectiveness of internal control over financial reporting, included in the accompanying management’s report on internal control over financial reporting. Our responsibility is to express an opinion on the Group’s internal control over financial reporting based on our audit.
We conducted our audit in accordance with the standards of the Public Company Accounting Oversight Board (United States). Those standards require that we plan and perform the audit to obtain reasonable assurance about whether effective internal control over financial reporting was maintained in all material respects. Our audit included obtaining an understanding of internal control over financial reporting, assessing the risk that a material weakness exists, testing and evaluating the design and operating effectiveness of internal control based on the assessed risk, and performing such other procedures as we considered necessary in the circumstances. We believe that our audit provides a reasonable basis for our opinion.
A company’s internal control over financial reporting is a process designed by, or under the supervision of, the company’s principal executive and principal financial officers, or persons performing similar functions, and effected by the company’s board of directors, management, and other personnel to provide reasonable assurance regarding the reliability of financial reporting and the preparation of financial statements for external purposes in accordance with generally accepted accounting principles. A company’s internal control over financial reporting includes those policies and procedures that (1) pertain to the maintenance of records that, in reasonable detail, accurately and fairly reflect the transactions and dispositions of the assets of the company; (2) provide reasonable assurance that transactions are recorded as necessary to permit preparation of financial statements in accordance with generally accepted accounting principles, and that receipts and expenditures of the company are being made only in accordance with authorisations of management and directors of the company; and (3) provide reasonable assurance regarding prevention or timely detection of unauthorised acquisition, use, or disposition of the company’s assets that could have a material effect on the financial statements.
Because of the inherent limitations of internal control over financial reporting, including the possibility of collusion or improper management override of controls, material misstatements due to error or fraud may not be prevented or detected on a timely basis. Also, projections of any evaluation of the effectiveness of the internal control over financial reporting to future periods are subject to the risk that the controls may become inadequate because of changes in conditions, or that the degree of compliance with the policies or procedures may deteriorate.
In our opinion, the Group maintained, in all material respects, effective internal control over financial reporting as of 31 March 2014, based on the criteria established in Internal Control – Integrated Framework (1992) issued by the Committee of Sponsoring Organizations of the Treadway Commission.
We have also audited, in accordance with the standards of the Public Company Accounting Oversight Board (United States), the consolidated financial statements of the Group as of and for the year ended 31 March 2014 prepared in conformity with International Financial Reporting Standards (‘IFRS’) as adopted by the European Union and IFRS as issued by the International Accounting Standards Board. Our report dated 20 May 2014 expressed an unqualified opinion on those financial statements.
DeloitteLLPLondon United Kingdom
20 May 2014
Please refer to our Form 20-F to be filed with the Securities and Exchange Commission in June 2014 for the audit opinion over the consolidated financial statements of the Group as of 31 March 2014 and 2013 and for each of the three years in the period ended 31 March 2014 issued in accordance with the standards of the Public Company Accounting Oversight Board (United States).
VodafoneGroupPlc Annual Report 201490
Audit report on internal control over financial reporting

VodafoneGroupPlc Annual Report 201490 91Overview
Strategy review Performance Governance Financials
Additional information
Audit report on the consolidated and parent company financial statements
Independent auditor’s report to the members of Vodafone Group PlcOpinionIn our opinion:
a the financial statements give a true and fair view of the state of the Group’s and of the parent company’s affairs as at 31 March 2014 and of the Group’s profit for the year then ended;
a the Group financial statements have been properly prepared in accordance with International Financial Reporting Standards (‘IFRSs’) as adopted by the European Union;
a the parent company financial statements have been properly prepared in accordance with United Kingdom Generally Accepted Accounting Practice; and
a the financial statements have been prepared in accordance with the requirements of the Companies Act 2006 and, as regards the Group financial statements, Article 4 of the IAS Regulation.
The financial statements comprise the consolidated statement of financial position and parent company balance sheet, the consolidated income statement, the consolidated statement of comprehensive income, the consolidated statement of changes in equity, the consolidated statement of cash flows, the related Group notes 1 to 34 and the related parent company notes 1 to 10. The financial reporting framework that has been applied in the preparation of the Group financial statements is applicable law and IFRSs as adopted by the European Union. The financial reporting framework that has been applied in the preparation of the parent company financial statements is applicable law and United Kingdom Accounting Standards (United Kingdom Generally Accepted Accounting Practice).
SeparateopinioninrelationtoIFRSsasissuedbytheIASBAs explained in Note 1 to the Group financial statements, in addition to complying with its legal obligation to apply IFRSs as adopted by the European Union, the Group has also applied IFRSs as issued by the International Accounting Standards Board (‘IASB’).
In our opinion the Group financial statements comply with IFRSs as issued by the IASB.
GoingconcernAs required by the Listing Rules we have reviewed the directors’ statement on page 89 that the Group is a going concern.
We confirm that:
a we have concluded that the directors’ use of the going concern basis of accounting in the preparation of the financial statements is appropriate; and
a we have not identified any material uncertainties that may cast significant doubt on the Group’s ability to continue as a going concern.
However, because not all future events or conditions can be predicted, this statement is not a guarantee as to the Group’s ability to continue as a going concern.
OurassessmentofrisksofmaterialmisstatementOur risk assessment process continues throughout the audit and, as a result, we have identified three additional risks of material misstatement in the current year that had a significant effect on our audit strategy. These relate to the disposal of the investment in Verizon Wireless, the acquisition of Kabel Deutschland Holding AG and judgements in respect of provisions and contingent liabilities. In addition, we identified deficiencies in IT controls in relation to privileged user access which also impacted our audit strategy. The remaining risks were assessed as continuing risks from our audit of the previous year’s financial statements.
The procedures described in our response to each risk are not exhaustive and we have focused on those procedures that we consider address areas of judgement or subjectivity. As part of our audit of the Group, in addition to substantive tests, we also test the design and operating effectiveness of internal controls over financial reporting in each of the risk areas.
The assessed risks of material misstatement described below are those that had the greatest effect on our audit strategy, the allocation of resources in the audit and directing the efforts of the engagement team:
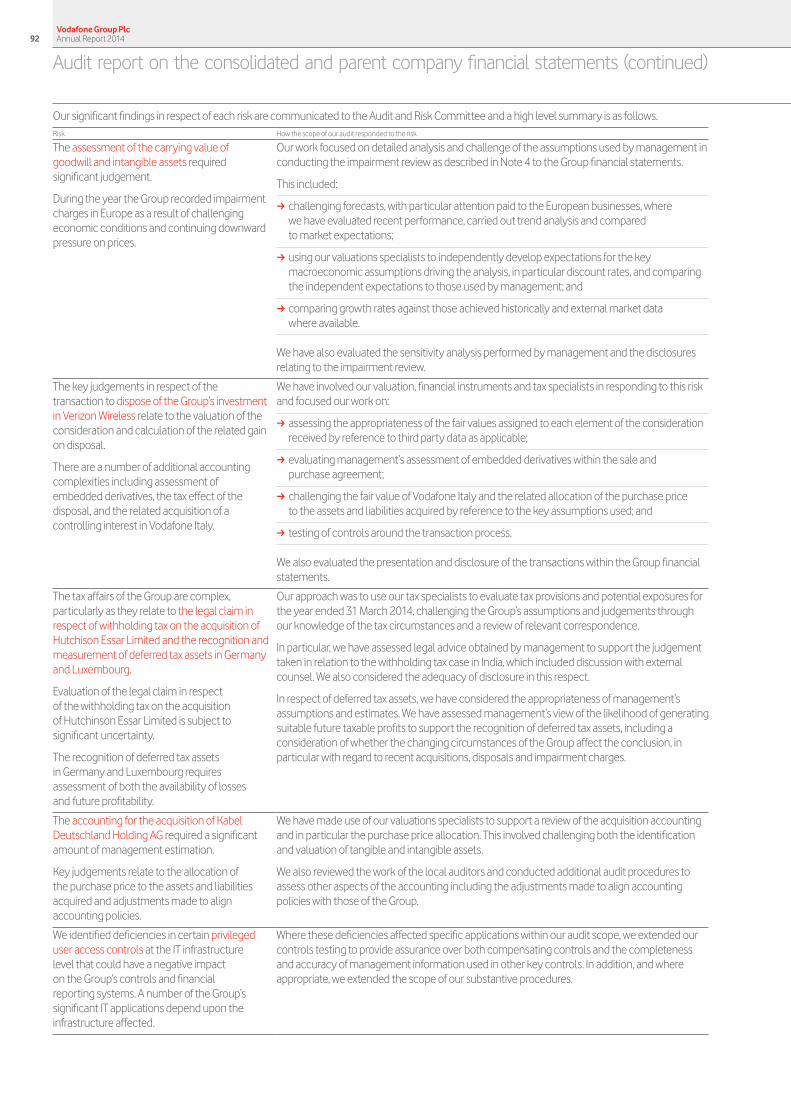
Our significant findings in respect of each risk are communicated to the Audit and Risk Committee and a high level summary is as follows.Risk How the scope of our audit responded to the risk
The assessment of the carrying value of goodwill and intangible assets required significant judgement.
During the year the Group recorded impairment charges in Europe as a result of challenging economic conditions and continuing downward pressure on prices.
Our work focused on detailed analysis and challenge of the assumptions used by management in conducting the impairment review as described in Note 4 to the Group financial statements.
This included:
a challenging forecasts, with particular attention paid to the European businesses, where we have evaluated recent performance, carried out trend analysis and compared to market expectations;
a using our valuations specialists to independently develop expectations for the key macroeconomic assumptions driving the analysis, in particular discount rates, and comparing the independent expectations to those used by management; and
a comparing growth rates against those achieved historically and external market data where available.
We have also evaluated the sensitivity analysis performed by management and the disclosures relating to the impairment review.
The key judgements in respect of the transaction to dispose of the Group’s investment in Verizon Wireless relate to the valuation of the consideration and calculation of the related gain on disposal.
There are a number of additional accounting complexities including assessment of embedded derivatives, the tax effect of the disposal, and the related acquisition of a controlling interest in Vodafone Italy.
We have involved our valuation, financial instruments and tax specialists in responding to this risk and focused our work on:
a assessing the appropriateness of the fair values assigned to each element of the consideration received by reference to third party data as applicable;
a evaluating management’s assessment of embedded derivatives within the sale and purchase agreement;
a challenging the fair value of Vodafone Italy and the related allocation of the purchase price to the assets and liabilities acquired by reference to the key assumptions used; and
a testing of controls around the transaction process.
We also evaluated the presentation and disclosure of the transactions within the Group financial statements.
The tax affairs of the Group are complex, particularly as they relate to the legal claim in respect of withholding tax on the acquisition of Hutchison Essar Limited and the recognition and measurement of deferred tax assets in Germany and Luxembourg.
Evaluation of the legal claim in respect of the withholding tax on the acquisition of Hutchinson Essar Limited is subject to significant uncertainty.
The recognition of deferred tax assets in Germany and Luxembourg requires assessment of both the availability of losses and future profitability.
Our approach was to use our tax specialists to evaluate tax provisions and potential exposures for the year ended 31 March 2014, challenging the Group’s assumptions and judgements through our knowledge of the tax circumstances and a review of relevant correspondence.
In particular, we have assessed legal advice obtained by management to support the judgement taken in relation to the withholding tax case in India, which included discussion with external counsel. We also considered the adequacy of disclosure in this respect.
In respect of deferred tax assets, we have considered the appropriateness of management’s assumptions and estimates. We have assessed management’s view of the likelihood of generating suitable future taxable profits to support the recognition of deferred tax assets, including a consideration of whether the changing circumstances of the Group affect the conclusion, in particular with regard to recent acquisitions, disposals and impairment charges.
The accounting for the acquisition of Kabel Deutschland Holding AG required a significant amount of management estimation.
Key judgements relate to the allocation of the purchase price to the assets and liabilities acquired and adjustments made to align accounting policies.
We have made use of our valuations specialists to support a review of the acquisition accounting and in particular the purchase price allocation. This involved challenging both the identification and valuation of tangible and intangible assets.
We also reviewed the work of the local auditors and conducted additional audit procedures to assess other aspects of the accounting including the adjustments made to align accounting policies with those of the Group.
We identified deficiencies in certain privileged user access controls at the IT infrastructure level that could have a negative impact on the Group’s controls and financial reporting systems. A number of the Group’s significant IT applications depend upon the infrastructure affected.
Where these deficiencies affected specific applications within our audit scope, we extended our controls testing to provide assurance over both compensating controls and the completeness and accuracy of management information used in other key controls. In addition, and where appropriate, we extended the scope of our substantive procedures.
VodafoneGroupPlc Annual Report 201492
Audit report on the consolidated and parent company financial statements (continued)
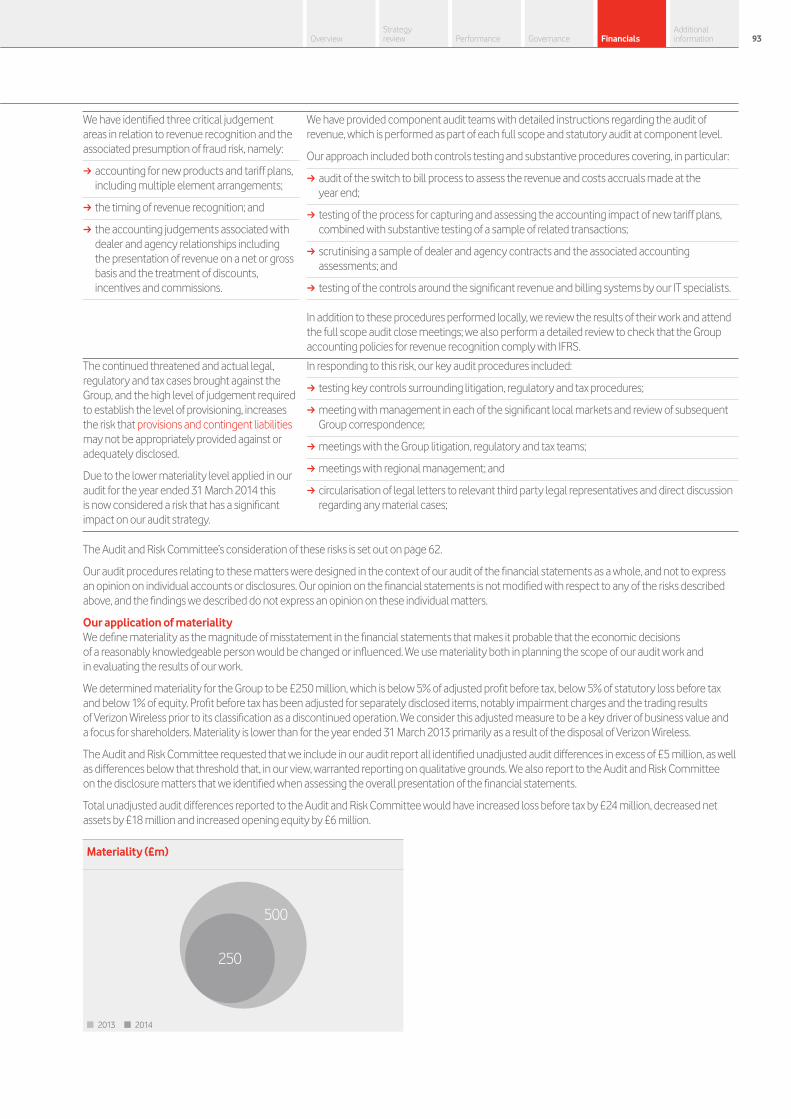
We have identified three critical judgement areas in relation to revenue recognition and the associated presumption of fraud risk, namely:
a accounting for new products and tariff plans, including multiple element arrangements;
a the timing of revenue recognition; and
a the accounting judgements associated with dealer and agency relationships including the presentation of revenue on a net or gross basis and the treatment of discounts, incentives and commissions.
We have provided component audit teams with detailed instructions regarding the audit of revenue, which is performed as part of each full scope and statutory audit at component level.
Our approach included both controls testing and substantive procedures covering, in particular:
a audit of the switch to bill process to assess the revenue and costs accruals made at the year end;
a testing of the process for capturing and assessing the accounting impact of new tariff plans, combined with substantive testing of a sample of related transactions;
a scrutinising a sample of dealer and agency contracts and the associated accounting assessments; and
a testing of the controls around the significant revenue and billing systems by our IT specialists.
In addition to these procedures performed locally, we review the results of their work and attend the full scope audit close meetings; we also perform a detailed review to check that the Group accounting policies for revenue recognition comply with IFRS.
The continued threatened and actual legal, regulatory and tax cases brought against the Group, and the high level of judgement required to establish the level of provisioning, increases the risk that provisions and contingent liabilities may not be appropriately provided against or adequately disclosed.
Due to the lower materiality level applied in our audit for the year ended 31 March 2014 this is now considered a risk that has a significant impact on our audit strategy.
In responding to this risk, our key audit procedures included:
a testing key controls surrounding litigation, regulatory and tax procedures;
a meeting with management in each of the significant local markets and review of subsequent Group correspondence;
a meetings with the Group litigation, regulatory and tax teams;
a meetings with regional management; and
a circularisation of legal letters to relevant third party legal representatives and direct discussion regarding any material cases;
The Audit and Risk Committee’s consideration of these risks is set out on page 62.
Our audit procedures relating to these matters were designed in the context of our audit of the financial statements as a whole, and not to express an opinion on individual accounts or disclosures. Our opinion on the financial statements is not modified with respect to any of the risks described above, and the findings we described do not express an opinion on these individual matters.
OurapplicationofmaterialityWe define materiality as the magnitude of misstatement in the financial statements that makes it probable that the economic decisions of a reasonably knowledgeable person would be changed or influenced. We use materiality both in planning the scope of our audit work and in evaluating the results of our work.
We determined materiality for the Group to be £250 million, which is below 5% of adjusted profit before tax, below 5% of statutory loss before tax and below 1% of equity. Profit before tax has been adjusted for separately disclosed items, notably impairment charges and the trading results of Verizon Wireless prior to its classification as a discontinued operation. We consider this adjusted measure to be a key driver of business value and a focus for shareholders. Materiality is lower than for the year ended 31 March 2013 primarily as a result of the disposal of Verizon Wireless.
The Audit and Risk Committee requested that we include in our audit report all identified unadjusted audit differences in excess of £5 million, as well as differences below that threshold that, in our view, warranted reporting on qualitative grounds. We also report to the Audit and Risk Committee on the disclosure matters that we identified when assessing the overall presentation of the financial statements.
Total unadjusted audit differences reported to the Audit and Risk Committee would have increased loss before tax by £24 million, decreased net assets by £18 million and increased opening equity by £6 million.
Materiality(£m)
500
250
n 2013 n 2014
VodafoneGroupPlc Annual Report 201492 93Overview
Strategy review Performance Governance Financials
Additional information
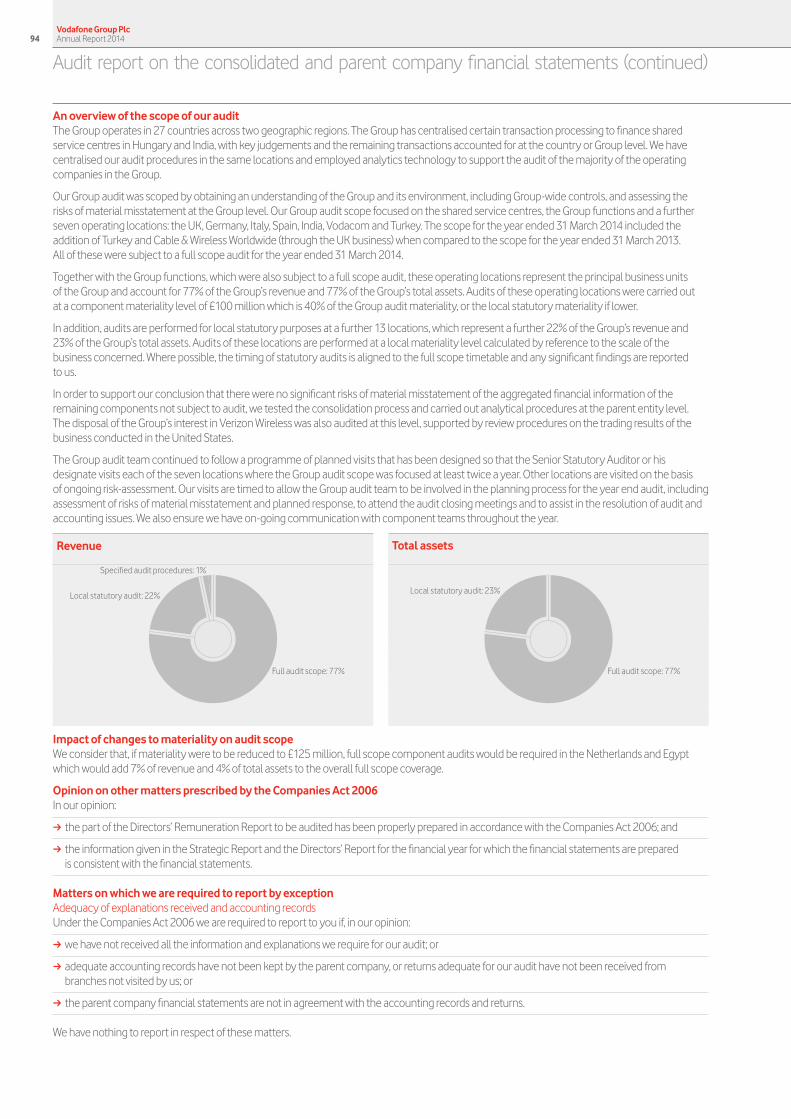
AnoverviewofthescopeofourauditThe Group operates in 27 countries across two geographic regions. The Group has centralised certain transaction processing to finance shared service centres in Hungary and India, with key judgements and the remaining transactions accounted for at the country or Group level. We have centralised our audit procedures in the same locations and employed analytics technology to support the audit of the majority of the operating companies in the Group.
Our Group audit was scoped by obtaining an understanding of the Group and its environment, including Group-wide controls, and assessing the risks of material misstatement at the Group level. Our Group audit scope focused on the shared service centres, the Group functions and a further seven operating locations: the UK, Germany, Italy, Spain, India, Vodacom and Turkey. The scope for the year ended 31 March 2014 included the addition of Turkey and Cable & Wireless Worldwide (through the UK business) when compared to the scope for the year ended 31 March 2013. All of these were subject to a full scope audit for the year ended 31 March 2014.
Together with the Group functions, which were also subject to a full scope audit, these operating locations represent the principal business units of the Group and account for 77% of the Group’s revenue and 77% of the Group’s total assets. Audits of these operating locations were carried out at a component materiality level of £100 million which is 40% of the Group audit materiality, or the local statutory materiality if lower.
In addition, audits are performed for local statutory purposes at a further 13 locations, which represent a further 22% of the Group’s revenue and 23% of the Group’s total assets. Audits of these locations are performed at a local materiality level calculated by reference to the scale of the business concerned. Where possible, the timing of statutory audits is aligned to the full scope timetable and any significant findings are reported to us.
In order to support our conclusion that there were no significant risks of material misstatement of the aggregated financial information of the remaining components not subject to audit, we tested the consolidation process and carried out analytical procedures at the parent entity level. The disposal of the Group’s interest in Verizon Wireless was also audited at this level, supported by review procedures on the trading results of the business conducted in the United States.
The Group audit team continued to follow a programme of planned visits that has been designed so that the Senior Statutory Auditor or his designate visits each of the seven locations where the Group audit scope was focused at least twice a year. Other locations are visited on the basis of ongoing risk-assessment. Our visits are timed to allow the Group audit team to be involved in the planning process for the year end audit, including assessment of risks of material misstatement and planned response, to attend the audit closing meetings and to assist in the resolution of audit and accounting issues. We also ensure we have on-going communication with component teams throughout the year.
Totalassets
Full audit scope: 77%
Local statutory audit: 23%
Revenue
Local statutory audit: 22%
Specified audit procedures: 1%
Full audit scope: 77%
ImpactofchangestomaterialityonauditscopeWe consider that, if materiality were to be reduced to £125 million, full scope component audits would be required in the Netherlands and Egypt which would add 7% of revenue and 4% of total assets to the overall full scope coverage.
OpiniononothermattersprescribedbytheCompaniesAct2006In our opinion:
a the part of the Directors’ Remuneration Report to be audited has been properly prepared in accordance with the Companies Act 2006; and
a the information given in the Strategic Report and the Directors’ Report for the financial year for which the financial statements are prepared is consistent with the financial statements.
MattersonwhichwearerequiredtoreportbyexceptionAdequacy of explanations received and accounting recordsUnder the Companies Act 2006 we are required to report to you if, in our opinion:
a we have not received all the information and explanations we require for our audit; or
a adequate accounting records have not been kept by the parent company, or returns adequate for our audit have not been received from branches not visited by us; or
a the parent company financial statements are not in agreement with the accounting records and returns.
We have nothing to report in respect of these matters.
VodafoneGroupPlc Annual Report 201494
Audit report on the consolidated and parent company financial statements (continued)

Directors’ remunerationUnder the Companies Act 2006 we are also required to report if in our opinion certain disclosures of directors’ remuneration have not been made or the part of the Directors’ Remuneration Report to be audited is not in agreement with the accounting records and returns. We have nothing to report arising from these matters.
Corporate Governance StatementUnder the Listing Rules we are also required to review the part of the Corporate Governance Statement relating to the Company’s compliance with nine provisions of the UK Corporate Governance Code. We have nothing to report arising from our review.
Our duty to read other information in the Annual ReportUnder International Standards on Auditing (UK and Ireland), we are required to report to you if, in our opinion, information in the Annual Report is:
a materially inconsistent with the information in the audited financial statements; or
a apparently materially incorrect based on, or materially inconsistent with, our knowledge of the Group acquired in the course of performing our audit; or
a otherwise misleading.
In particular, we are required to consider whether we have identified any inconsistencies between our knowledge acquired during the audit and the directors’ statement that they consider the Annual Report is fair, balanced and understandable and whether the Annual Report appropriately discloses those matters that we communicated to the Audit and Risk Committee which we consider should have been disclosed. We confirm that we have not identified any such inconsistencies or misleading statements.
Respective responsibilities of directors and auditorAs explained more fully in the Directors’ Responsibilities Statement, the directors are responsible for the preparation of the financial statements and for being satisfied that they give a true and fair view. Our responsibility is to audit and express an opinion on the financial statements in accordance with applicable law and International Standards on Auditing (UK and Ireland). Those standards require us to comply with the Auditing Practices Board’s Ethical Standards for Auditors. We also comply with International Standard on Quality Control 1 (UK and Ireland). Our audit methodology and tools aim to ensure that our quality control procedures are effective, understood and applied. Our quality controls and systems include our dedicated professional standards review team, strategically focused second partner reviews and independent partner reviews.
This report is made solely to the Company’s members, as a body, in accordance with Chapter 3 of Part 16 of the Companies Act 2006. Our audit work has been undertaken so that we might state to the Company’s members those matters we are required to state to them in an auditor’s report and for no other purpose. To the fullest extent permitted by law, we do not accept or assume responsibility to anyone other than the Company and the Company’s members as a body, for our audit work, for this report, or for the opinions we have formed.
Scope of the audit of the financial statementsAn audit involves obtaining evidence about the amounts and disclosures in the financial statements sufficient to give reasonable assurance that the financial statements are free from material misstatement, whether caused by fraud or error. This includes an assessment of: whether the accounting policies are appropriate to the Group’s and the parent company’s circumstances and have been consistently applied and adequately disclosed; the reasonableness of significant accounting estimates made by the directors; and the overall presentation of the financial statements. In addition, we read all the financial and non-financial information in the Annual Report to identify material inconsistencies with the audited financial statements and to identify any information that is apparently materially incorrect based on, or materially inconsistent with, the knowledge acquired by us in the course of performing the audit. If we become aware of any apparent material misstatements or inconsistencies we consider the implications for our report.
PanosKakoullisFCA(Seniorstatutoryauditor) forandonbehalfofDeloitteLLPChartered Accountants and Statutory Auditor London, United Kingdom
20 May 2014
VodafoneGroupPlc Annual Report 201494 95Overview
Strategy review Performance Governance Financials
Additional information

Consolidated income statement for the years ended 31 March
2014 Restated1
2013 Restated1
2012 Note £m £m £m
Revenue 2 38,346 38,041 38,821 Cost of sales (27,942) (26,567) (27,201)Gross profit 10,404 11,474 11,620 Selling and distribution expenses (3,033) (2,860) (2,755)Administrative expenses (4,245) (4,159) (4,031)Share of results of equity accounted associates and joint ventures 278 575 1,129Impairment losses 4 (6,600) (7,700) (4,050)Other income and expense (717) 468 3,705 Operating (loss)/profit 3 (3,913) (2,202) 5,618Non-operating income and expense (149) 10 (162)Investment income 5 346 305 456 Financing costs 5 (1,554) (1,596) (1,768)(Loss)/profit before taxation (5,270) (3,483) 4,144Income tax credit/(expense) 6 16,582 (476) (705)Profit/(loss) for the financial year from continuing operations 11,312 (3,959) 3,439Profit for the financial year from discontinued operations 7 48,108 4,616 3,555Profit for the financial year 59,420 657 6,994
Attributable to:– Equity shareholders 59,254 413 6,948 – Non-controlling interests2 166 244 46 Profit for the financial year 59,420 657 6,994
Earnings/(loss) per shareFrom continuing operations:– Basic 42.10p (15.66p) 12.28p– Diluted 41.77p (15.66p) 12.14pTotal Group:– Basic 8 223.84p 1.54p 25.15p– Diluted 8 222.07p 1.54p 24.87p
Notes:1 Restated to show the results of our US Group in discontinued operations, adoption of IFRS 11 and amendments to IAS 19. See note 1 “Basis of preparation” for further details.2 Profitattributabletonon-controllinginterestssolelyderivesfromcontinuingoperations.
Consolidated statement of comprehensive incomefor the years ended 31 March
2014 Restated1
2013 Restated1
2012 £m £m £m
Profit for the financial year 59,420 657 6,994Other comprehensive income:Itemsthatmaybereclassifiedtoprofitorlossinsubsequentperiods:Losses on revaluation of available-for-sale investments, net of tax (119) (73) (17)Foreign exchange translation differences, net of tax (4,104) 362 (3,673)Foreign exchange losses/(gains) transferred to the income statement 1,493 1 (681)Fair value gains transferred to the income statement (25) (12) –Other, net of tax – (4) (10)Total items that may be reclassified to profit or loss in subsequent years (2,755) 274 (4,381)Itemsthatwillnotbereclassifiedtoprofitorlossinsubsequentyears:Netactuarialgains/(losses)ondefinedbenefitpensionschemes,netoftax 37 (182) (263)
Total items that will not be reclassified to profit or loss in subsequent years 37 (182) (263)Other comprehensive (expense)/income (2,718) 92 (4,644)Total comprehensive income for the year 56,702 749 2,350
Attributable to:– Equity shareholders 56,711 604 2,383– Non-controlling interests (9) 145 (33) 56,702 749 2,350
Note:1 Restated to show the results of our US Group in discontinued operations, adoption of IFRS 11 and amendments to IAS 19. See note 1 “Basis of preparation” for further details.
Vodafone Group Plc Annual Report 201496

Commentary on the consolidated income statement and statement of comprehensive income
The consolidated income statement includes the majority of our income and expenses for the year with the remainder recorded in the consolidated statement of comprehensive income.Further details on the major movements in the year are set out below:
RevenueRevenue increased by 0.8% to £38.3 billion. The increase is driven by revenue growth in our AMAP region and business acquisitions, partially offset by revenue declines in Europe due to challenging trading conditions and by unfavourable exchange rate movements. Our operating results discussion on pages 40 to 45 provides further detail on our revenue performance.
Operating lossOur operating loss increased to £3.9 billion from £2.2 billion as lower impairment charges were offset by lower revenue, higher customer costs and higher amortisation. During the year we recorded goodwill impairment charges of £6.6 billion relating to our businesses in Germany, Spain, Portugal, Czech Republic and Romania (see note 4 “Impairment losses”).
Income tax expenseWe recorded an income tax credit on continuing operations of £16.6 billion compared with a £0.5 billion charge in 2013. The credit primarily arises from the recognition of £19.3 billion of deferred tax assets for tax losses in Germany and Luxembourg partly offset by taxes arising from the disposal of the Group’s investment in Verizon Wireless (see note 6 “Taxation”). Our adjusted effective tax rate, a non-GAAP measure used by management to measure the rate oftaxonouradjustedprofitbeforetax,increasedto27.3%from24.5%. Further information on how our adjusted effective tax charge is determined is provided within the operating results discussion on page 44.
Profit for the year from discontinued operationsDiscontinuedoperationsincludesthe£45.0billionprofitarisingonthedisposal of the Group’s investment in Verizon Wireless, £1.7 billion ofdividendsreceivablesincethedisposalandthepost-taxprofitsof the Group’s share of Verizon Wireless and entities in the US Group sold to Verizon Communications as part of the overall disposal transaction up until 2 September 2013 when the proposed disposal was announced.Theprofitfromdiscontinuedoperationsfortheyearended31 March 2014 has increased to £48.1 billion from £4.6 billion, primarily duetotheprofitarisingfromthedisposaloftheGroup’sinvestmentin Verizon Wireless. Further information is provided in note 7 “Discontinued operations” and note 28 “Acquisitions and disposals”.
Earnings per shareBasic earnings per share from continuing operations was 42.10 pence, an increase of 57.76 pence, driven by the recognition of £19.3 billion of deferred tax assets for losses in Germany and Luxembourg. TotalGroupbasicearningspershare,whichincludesprofitsfromdiscontinued operations, increased by 222.30 pence to 223.84 pence primarily as a result of the £45.0 billion gain recognised on the disposal of the US Group.
Adjusted earnings per share, which is a non-GAAP measure used by management and which excludes items that we do not view as being reflectiveofourperformance,was17.54pence,adecreaseof12.8%compared to the prior year. The reduction was primarily due to lower adjustedoperatingprofits,partiallyoffsetbyareductioninthenumberof the Group’s shares due to the Group’s share buyback programme.
Our calculation of the adjusted earnings on which we base our adjusted earnings per share calculation is set out within the operating results on page 45. Note 8 “Earnings per share” provides information on the number of shares used for determining earnings per share.
The consolidated statement of comprehensive income records all of the income and losses generated for the year. Further details on the major movements in the year are set out below:
Profit for the financial yearProfitforthefinancialyearof£59.4billionisrecognisedintheconsolidated income statement and the reasons underlying the £58.8 billion increase are provided above.
Foreign exchange differences, net of taxForeign exchange translation differences arise when we translate the results and net assets of our operating companies, joint arrangements and associates, which transact their operations in foreign currencies including the euro, South African rand and Indian rupee, into our presentation currency of sterling. The net movements in foreign exchange rates resulted in a loss of £4.1 billion for the year compared with a gain in the previous year of £0.4 billion.
Foreign exchange losses/(gains) transferred to the income statementThe foreign exchange losses transferred to the income statement in the year ended 31 March 2014 relate to the recycling of amounts in relation to our investment in Verizon Wireless and Vodafone Italy which were triggered, respectively, by the disposal and the acquisition of a controlling stake.
Net actuarial gains/(losses) on defined benefit schemes, net of taxWe realised a £37 million post-tax gain from the revaluation of the Group’sdefinedbenefitpensionschemesafterupdatingactuarialassumptions and revaluing scheme assets.
Thefinancialcommentaryonthispageisunaudited.
Vodafone Group Plc Annual Report 201496 97Overview
Strategy review Performance Governance Financials
Additional information
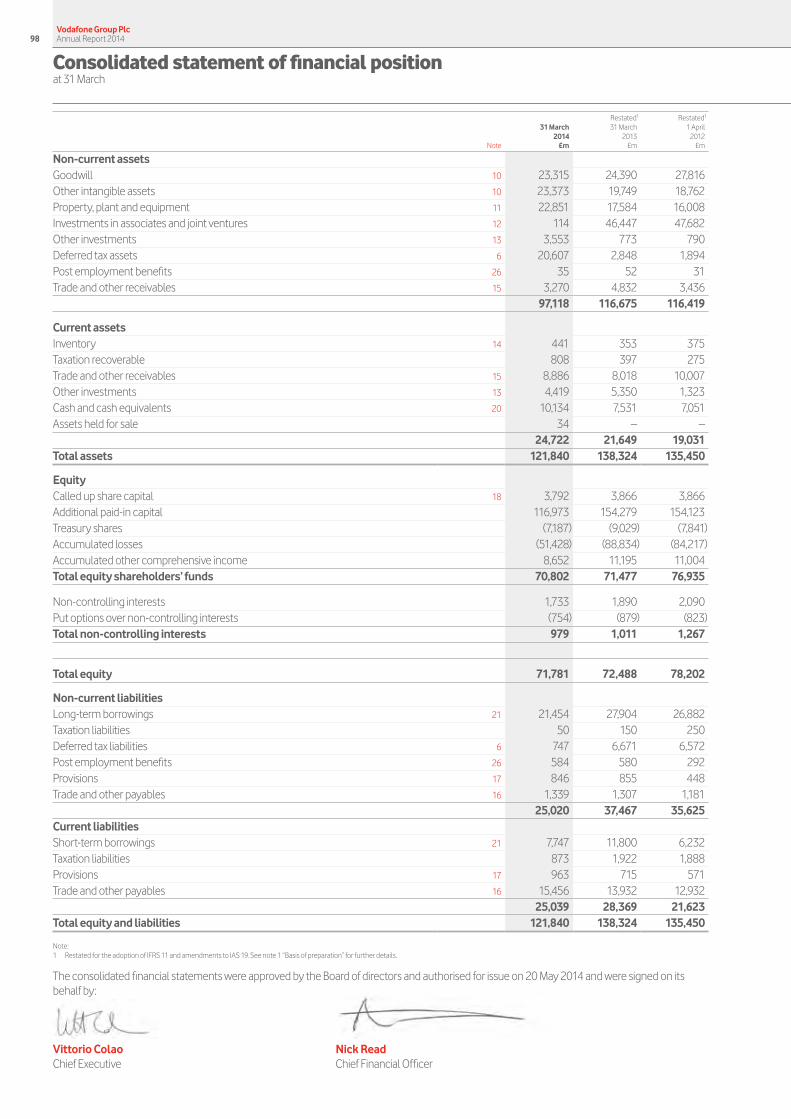
Consolidated statement of financial positionat 31 March
31 March
2014
Restated1
31 March2013
Restated1
1 April2012
Note £m £m £m
Non-current assets Goodwill 10 23,315 24,390 27,816 Other intangible assets 10 23,373 19,749 18,762 Property, plant and equipment 11 22,851 17,584 16,008 Investments in associates and joint ventures 12 114 46,447 47,682 Other investments 13 3,553 773 790 Deferred tax assets 6 20,607 2,848 1,894 Postemploymentbenefits 26 35 52 31 Trade and other receivables 15 3,270 4,832 3,436 97,118 116,675 116,419
Current assets Inventory 14 441 353 375 Taxation recoverable 808 397 275 Trade and other receivables 15 8,886 8,018 10,007 Other investments 13 4,419 5,350 1,323 Cash and cash equivalents 20 10,134 7,531 7,051 Assets held for sale 34 – – 24,722 21,649 19,031 Total assets 121,840 138,324 135,450
Equity Called up share capital 18 3,792 3,866 3,866 Additional paid-in capital 116,973 154,279 154,123 Treasury shares (7,187) (9,029) (7,841)Accumulated losses (51,428) (88,834) (84,217)Accumulated other comprehensive income 8,652 11,195 11,004 Total equity shareholders’ funds 70,802 71,477 76,935
Non-controlling interests 1,733 1,890 2,090 Put options over non-controlling interests (754) (879) (823)Total non-controlling interests 979 1,011 1,267
Total equity 71,781 72,488 78,202
Non-current liabilities Long-term borrowings 21 21,454 27,904 26,882 Taxation liabilities 50 150 250 Deferred tax liabilities 6 747 6,671 6,572 Postemploymentbenefits 26 584 580 292 Provisions 17 846 855 448 Trade and other payables 16 1,339 1,307 1,181 25,020 37,467 35,625 Current liabilities Short-term borrowings 21 7,747 11,800 6,232 Taxation liabilities 873 1,922 1,888 Provisions 17 963 715 571 Trade and other payables 16 15,456 13,932 12,932 25,039 28,369 21,623 Total equity and liabilities 121,840 138,324 135,450
Note:1 Restated for the adoption of IFRS 11 and amendments to IAS 19. See note 1 “Basis of preparation” for further details.
TheconsolidatedfinancialstatementswereapprovedbytheBoardofdirectorsandauthorisedforissueon20May2014andweresignedonitsbehalf by:
Vittorio Colao Nick ReadChiefExecutive ChiefFinancialOfficer
Vodafone Group Plc Annual Report 201498
Commentary on the consolidated statement of financial position
Theconsolidatedstatementoffinancialpositionshows all of our assets and liabilities at 31 March. Further details on the major movements of both our assets and liabilitiesintheyeararesetoutbelow.Ourstatementoffinancialposition has been materially impacted in the year by the sale of our interest in Verizon Wireless, the acquisition of Kabel Deutschland and the assumption of control over Vodafone Italy (jointly the ‘Group’s acquisitions’):
AssetsGoodwill and other intangible assets Our total intangible assets increased to £46.7 billion from £44.1 billion. The increase primarily arose as a result of £11.5 billion additions as a result of the Group’s acquisitions and other additions of £3.7 billion, including £1.9 billion of spectrum acquired in India, partially offset by £6.6 billion of goodwill impairments, reductions of £2.6 billion as a result of unfavourable movements in foreign exchange rates and £3.5 billion of amortisation.
Property, plant and equipmentProperty, plant and equipment increased to £22.9 billion from £17.6 billion, principally as a result of £6.4 billion additions in the year arising from Group acquisitions and a further £4.9 billion of purchases, partially offset by £4.0 billion of depreciation charges and £1.5 billion of adverse foreign exchange movements.
Investments in associates and joint venturesInvestments in associates and joint ventures decreased to £0.1 billion (2013:£46.4billion),primarilyreflectingareductionof£43.2billionon the disposal of the Group’s investment in Verizon Wireless and the transition of Vodafone Italy from a joint venture to a fully consolidated subsidiary. Our share of the trading results of associates and joint ventures was £3.5 billion, including £3.2 billion from Verizon Wireless classifiedwithindiscontinuedoperations.
Other non-current assets Other non-current assets increased by £19.0 billion to £27.5 billion, mainly due to a £17.8 billion increase in recognised deferred tax assets, primarily in respect of additional tax losses in Germany and Luxembourg (see note 6 “Taxation” for further details), and an increase of £2.8 billion in other investments as a result of loan notes received in respect of the disposal of the Group’s investment in Verizon Wireless, partly offset by a £1.6 billion reduction in receivables, which was primarily due to a reduction in amounts due from associates.
Total equity and liabilitiesTotal equityTotal equity decreased by £0.7 billion to £71.8 billion. Total comprehensive income for the year of £56.7 billion was offset by the return of value to shareholders of £51.0 billion and other dividends paid to equity shareholders and non-controlling interests of £5.1 billion.
BorrowingsTotal borrowings decreased to £29.2 billion from £39.7 billion, primarily as the result of the redemption of US$5.65 billion of bonds following the sale of our interest in Verizon Wireless and also due to £2.7 billion favourable foreign exchange movements. A net debt reconciliation is provided on page 103.
Deferred taxation liabilitiesDeferred tax liabilities reduced to £0.7 billion from £6.7 billion mainly due to the disposal of the US Group that held substantial deferred tax liabilities to Verizon Communications.
Other current liabilitiesOther current liabilities increased to £16.4 billion (2013: £14.6 billion). Trade payables at 31 March 2014 were equivalent to 40 days (2013:37 days)outstanding,calculatedbyreferencetotheamountowed to suppliers as a proportion of the amounts invoiced by suppliers during the year. It is our policy to agree terms of transactions, including payment terms, with suppliers and it is our normal practice that payment is made accordingly.
Contractual obligations and contingenciesAsummaryofourprincipalcontractualfinancialobligationsisshownbelow and details of the Group’s contingent liabilities are included in note 30 “Contingent liabilities”.
Payments due by period
£m
Contractual obligations1 Total <1year 1–3years 3–5years >5years
Borrowings2 35,721 8,642 5,506 9,825 11,748Operating lease commitments3 5,732 1,128 1,519 1,034 2,051Capital commitments3,4 2,335 2,093 215 20 7Purchase commitments 4,420 3,426 578 191 225Total 48,208 15,289 7,818 11,070 14,031
Notes:1 This table includes commitments in respect of options over interests in Group businesses held by non-
controllingshareholders(see“Potentialcashoutflowsfromoptionagreementsandsimilararrangements”on page 146) and obligations to pay dividends to non-controlling shareholders (see “Dividends from associates and to non-controlling shareholders” on page 146). The table excludes current and deferred tax liabilitiesandobligationsunderpostemploymentbenefitschemes,detailsofwhichareprovidedinnotes6“Taxation”and26“Postemploymentbenefits”respectively.Thetablealsoexcludesthecontractualobligations of associates and joint ventures.
2 See note 21 “Borrowings”.3 See note 29 “Commitments”.4 Primarily related to network infrastructure.
Thefinancialcommentaryonthispageisunaudited.
Vodafone Group Plc Annual Report 201498 99Overview
Strategy review Performance Governance Financials
Additional information
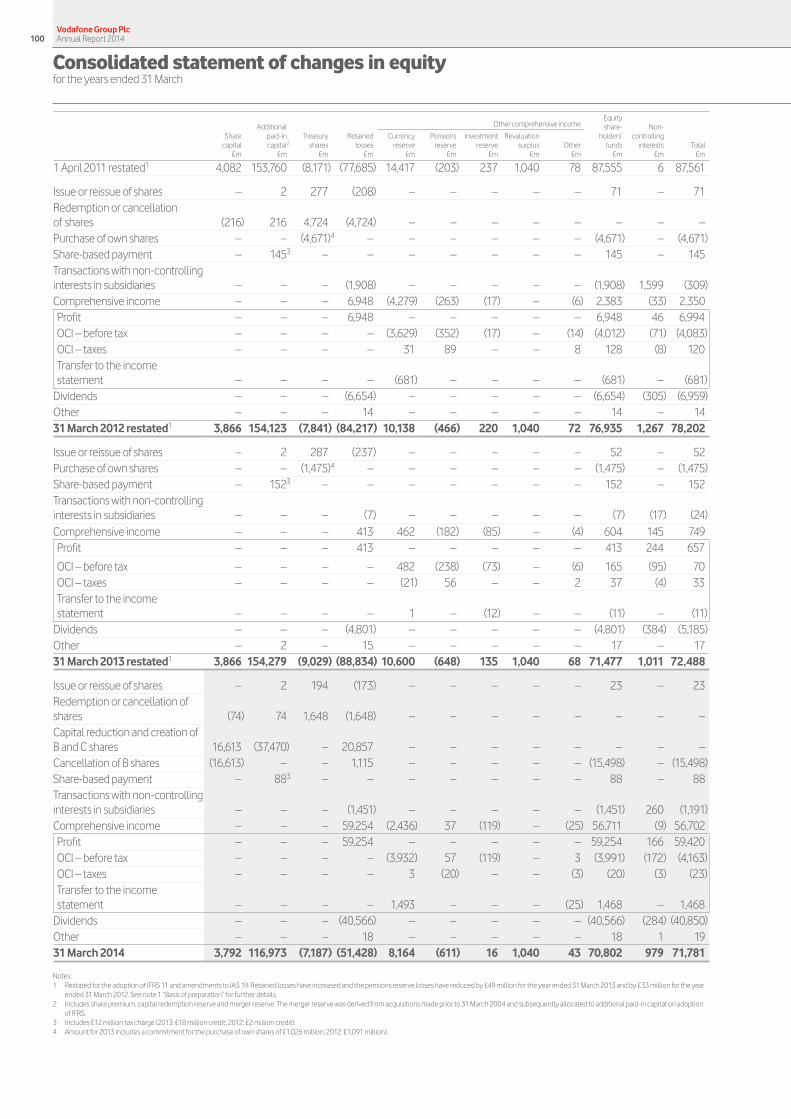
Consolidated statement of changes in equityfor the years ended 31 March
Other comprehensive income
Equity Additional share- Non- Share paid-in Treasury Retained Currency Pensions Investment Revaluation holders’ controlling capital capital2 shares losses reserve reserve reserve surplus Other funds interests Total £m £m £m £m £m £m £m £m £m £m £m £m
1 April 2011 restated1 4,082 153,760 (8,171) (77,685) 14,417 (203) 237 1,040 78 87,555 6 87,561
Issue or reissue of shares – 2 277 (208) – – – – – 71 – 71 Redemption or cancellation of shares (216) 216 4,724 (4,724) – – – – – – – – Purchase of own shares – – (4,671)4 – – – – – – (4,671) – (4,671)Share-based payment – 1453 – – – – – – – 145 – 145 Transactions with non-controlling interests in subsidiaries – – – (1,908) – – – – – (1,908) 1,599 (309)Comprehensive income – – – 6,948 (4,279) (263) (17) – (6) 2,383 (33) 2,350 Profit – – – 6,948 – – – – – 6,948 46 6,994 OCI – before tax – – – – (3,629) (352) (17) – (14) (4,012) (71) (4,083)OCI – taxes – – – – 31 89 – – 8 128 (8) 120 Transfer to the income statement – – – – (681) – – – – (681) – (681)
Dividends – – – (6,654) – – – – – (6,654) (305) (6,959)Other – – – 14 – – – – – 14 – 14 31 March 2012 restated1 3,866 154,123 (7,841) (84,217) 10,138 (466) 220 1,040 72 76,935 1,267 78,202
Issue or reissue of shares – 2 287 (237) – – – – – 52 – 52 Purchase of own shares – – (1,475)4 – – – – – – (1,475) – (1,475)Share-based payment – 1523 – – – – – – – 152 – 152 Transactions with non-controlling interests in subsidiaries – – – (7) – – – – – (7) (17) (24)Comprehensive income – – – 413 462 (182) (85) – (4) 604 145 749 Profit – – – 413 – – – – – 413 244 657
OCI – before tax – – – – 482 (238) (73) – (6) 165 (95) 70 OCI – taxes – – – – (21) 56 – – 2 37 (4) 33 Transfer to the income statement – – – – 1 – (12) – – (11) – (11)
Dividends – – – (4,801) – – – – – (4,801) (384) (5,185)Other – 2 – 15 – – – – – 17 – 17 31 March 2013 restated1 3,866 154,279 (9,029) (88,834) 10,600 (648) 135 1,040 68 71,477 1,011 72,488
Issue or reissue of shares – 2 194 (173) – – – – – 23 – 23 Redemption or cancellation of shares (74) 74 1,648 (1,648) – – – – – – – – Capital reduction and creation of B and C shares 16,613 (37,470) – 20,857 – – – – – – – – Cancellation of B shares (16,613) – – 1,115 – – – – – (15,498) – (15,498)Share-based payment – 883 – – – – – – – 88 – 88 Transactions with non-controlling interests in subsidiaries – – – (1,451) – – – – – (1,451) 260 (1,191)Comprehensive income – – – 59,254 (2,436) 37 (119) – (25) 56,711 (9) 56,702 Profit – – – 59,254 – – – – – 59,254 166 59,420 OCI – before tax – – – – (3,932) 57 (119) – 3 (3,991) (172) (4,163)OCI – taxes – – – – 3 (20) – – (3) (20) (3) (23)Transfer to the income statement – – – – 1,493 – – – (25) 1,468 – 1,468
Dividends – – – (40,566) – – – – – (40,566) (284) (40,850)Other – – – 18 – – – – – 18 1 19 31 March 2014 3,792 116,973 (7,187) (51,428) 8,164 (611) 16 1,040 43 70,802 979 71,781
Notes:1 Restated for the adoption of IFRS 11 and amendments to IAS 19. Retained losses have increased and the pensions reserve losses have reduced by £49 million for the year ended 31 March 2013 and by £33 million for the year
ended 31 March 2012. See note 1 “Basis of preparation” for further details.2 Includes share premium, capital redemption reserve and merger reserve. The merger reserve was derived from acquisitions made prior to 31 March 2004 and subsequently allocated to additional paid-in capital on adoption
of IFRS.3 Includes £12 million tax charge (2013: £18 million credit; 2012: £2 million credit).4 Amount for 2013 includes a commitment for the purchase of own shares of £1,026 million; 2012: £1,091 million).
Vodafone Group Plc Annual Report 2014100

Commentary on the consolidated statement of changes in equity
The consolidated statement of changes in equity shows the movements in equity shareholders’ funds and non-controlling interests. Equity shareholders’ fundsdecreasedby£0.7billionastheprofitsonthesale of our investment in Verizon Wireless (‘VZW’) and from the recognition of a large deferred tax asset were offset by the return of value to shareholders, regular ordinary dividends and goodwill impairment charges.The major movements in the year are described below:
Redemption and cancellation of sharesWe cancelled 1 billion ordinary shares that had been repurchased by the Company and held as treasury shares.
Purchase of own sharesWe initiated a £1.5 billion share buyback programme following the receipt of a US$3.8 billion (£2.4 billion) income dividend from VZW in December 2012. Under this programme, which was completed in June 2013, the Group placed irrevocable purchase instructions with a third party in the prior year to enable shares to be repurchased on our behalf when we may otherwise have been prohibited from buying in the market. This led to a total of 552,050 purchased shares being settled in the current year at an average price per share, including transaction costs, of 189 pence.
The movement in treasury shares during the year is shown below: Number Million £m
1 April 2013 4,902 9,029Reissue of shares (104) (194)Receipt of shares re-purchased in prior year 552 –Cancellation of shares (1,000) (1,648)Share consolidation (1,978) –31 March 2014 2,372 7,187
The reissue of shares in the year was to satisfy obligations under employee share schemes.
Issue of B and C sharesOn 2 September 2013 Vodafone announced that it had reached agreement to dispose of its US Group whose principal asset was its 45% interest in Verizon Wireless for a total consideration of US$130 billion (£79 billion).
Following completion on 21 February 2014, Vodafone shareholders received all of the Verizon shares and US$23.9 billion (£14.3 billion) of cash (the ‘Return of Value’) totalling US$85.2 billion (£51.0 billion).
The Return of Value was carried out through a B share and C share scheme. Eligible shareholders were able to elect between receiving one B share or one C share for each ordinary share that they held.
The B shares were cancelled by Vodafone in return for cash and Verizon shares with a value no greater than the aggregate nominal value of the B shares.
Holders of the C shares received a special dividend on their C shares, consisting of cash and Verizon shares with an aggregate value, for each C share, equal to the aggregate value of cash payable and Verizon shares receivable on the cancellation of each B share. The special B share distribution and C share dividend of £35.5 billion is included within the £40.6 billion of dividends described paid to equity shareholders in the year.
Transactions with non-controlling stakeholders in subsidiariesDuring the year we acquired further non-controlling interests in Vodafone India Limited and commenced the legal process of acquiring the remaining shares in Kabel Deutschland.
Comprehensive incomeThe Group generated £56.7 billion of total comprehensive income intheyear,primarilyaresultoftheprofitfortheyearattributableto equity shareholders of £59.3 billion. Total comprehensive income increased by £56.0 billion compared to the previous year; the primary reasonunderlyingtheincreasebeingtheprofitrealisedonthedisposalofourinvestmentinVZWof£45.0billionandtheprofitarisingfromtherecognitionofsignificantdeferredtaxassetsof£19.3billioninrelationto losses incurred in Germany and Luxembourg (further details are providedinnote6“Taxation”totheconsolidatedfinancialstatements).
DividendsDividends of £40.6 billion include the special £35.5 billion B share distribution and C share dividends distributed as part of the Return of Value to shareholders and £5.1 billion of equity dividends.
We provide returns to shareholders through equity dividends and historically have generally paid dividends in February and August in each year. The directors expect that we will continue to pay dividends semi-annually.
The £5.1 billion equity dividend in the current year comprises £3.4 billion inrelationtothefinaldividendfortheyearended31March2013and£1.7 billion for the interim dividend for the year ended 31 March 2014. This has increased from total dividends of £4.8 billion in the prior year, with increases in the dividend per share more than offsetting reductions in the number of shares in issue.
The interim dividend of 3.53 pence per share announced by the directors in November 2013 represented an 8% increase over last year’sinterimdividend.Thedirectorsareproposingafinaldividendof 7.47 pence per share. Total dividends for the year, excluding the Return of Value in relation to the VZW disposal increased by 8% to11.00 pencepershare.
Thefinancialcommentaryonthispageisunaudited.
Vodafone Group Plc Annual Report 2014100 101Overview
Strategy review Performance Governance Financials
Additional information

Consolidated statement of cash flowsfor the years ended 31 March
2014 Restated1
2013 Restated1
2012 Note £m £m £m
Net cash flow from operating activities 19 6,227 8,824 10,297
Cash flows from investing activities Purchase of interests in subsidiaries, net of cash acquired 28 (4,279) (1,432) (149)Other investing activities in relation to purchase of subsidiaries – – 310 Purchase of interests in associates and joint ventures (11) (6) (5)Purchase of intangible assets (2,327) (3,758) (1,876)Purchase of property, plant and equipment (4,396) (3,958) (4,071)Purchase of investments (214) (4,249) (417)Disposal of interests in subsidiaries, net of cash disposed – 27 784 Disposal of interests in associates and joint ventures 34,919 – 6,799 Disposal of property, plant and equipment 79 105 91Disposal of investments 1,483 1,523 66 Dividends received from associates and joint ventures 4,897 5,539 4,916Dividends received from investments 10 2 3 Interest received 582 461 336Taxation on investing activities – – (206)Net cash flow from investing activities 30,743 (5,746) 6,581
Cash flows from financing activities Issue of ordinary share capital and reissue of treasury shares 38 69 91Net movement in short-term borrowings (2,887) 1,581 1,517Proceeds from issue of long-term borrowings 1,060 5,422 1,578Repayment of borrowing (9,788) (1,720) (3,424)Purchase of treasury shares (1,033) (1,568) (3,583)B and C share payments (14,291) – –Equity dividends paid (5,076) (4,806) (6,643)Dividends paid to non-controlling shareholders in subsidiaries (264) (379) (304)Other transactions with non-controlling shareholders in subsidiaries (111) 15 (2,605)Other movements in loans with associates and joint ventures – 168 (792)Interest paid (1,897) (1,525) (1,504)Net cash flow from financing activities (34,249) (2,743) (15,669)
Net cash flow 2,721 335 1,209
Cashandcashequivalentsatbeginningofthefinancialyear 20 7,506 7,001 6,138 Exchange (loss)/gain on cash and cash equivalents (115) 170 (346)Cash and cash equivalents at end of the financial year 20 10,112 7,506 7,001
Duringtheyearended31March2014therewereanumberofmaterialnon-cashinvestingandfinancingactivitiesthataroseinrelationtoboththedisposal of our interest in Verizon Wireless, the acquisition of the remaining 23% of Vodafone Italy and the return of value to shareholders. Full details ofthesematerialnon-cashtransactionsareincludedinnote28totheconsolidatedfinancialstatements.Note:1 Restated for the adoption of IFRS 11 and amendments to IAS 19. See note 1 “Basis of preparation” for further details.
Vodafone Group Plc Annual Report 2014102

Commentary on the consolidated statement of cash flows
Theconsolidatedstatementofcashflowsshowsthecashflowsfromoperating,investingandfinancingactivities for the year. Closing net debt has reduced to £13.7 billion from £25.4 billion. The reduction has primarily been achieved as the result of cash retained from the sale of our interest in Verizon Wireless after the return of value to shareholders. Our liquidity and working capital may be affected by a material decrease incashflowduetoanumberoffactorsasoutlinedin“Principalrisk factors and uncertainties” on pages 196 to 200. We do not use non-consolidated special purpose entities as a source of liquidity or for otherfinancingpurposes.
Purchase of interests in subsidiaries, net of cash acquiredDuring the year we acquired Kabel Deutschland for net cash consideration of £4.3 billion. Further details on the assets and liabilities acquired are outlined in note 28 ”Acquisitions and disposals”.
Purchase of intangible assetsCash payments for the purchase of intangible assets comprise £1.4 billion for purchases of computer software and £0.9 billion for acquired spectrum.
Purchase of investmentsThe Group purchases short-term investments as part of its treasury strategy. See note 13 “Other investments”.
Disposal of interests in associates and joint venturesDuring the year, we disposed of our US Group whose principal asset was its 45% interest in Verizon Wireless for consideration which included net cashproceedsof£34.9billion.Therewerenosignificantdisposalsintheprior year.
Disposal of investmentsIn the prior year we received the remaining consideration of £1.5 billion from the disposal of our interests in SoftBank Mobile Corp.
Dividends received from joint ventures and associatesDividends received from associates reduced by 11.6% to £4.9 billion. Dividends received primarily comprise tax dividends and income dividends from Verizon Wireless of £4.8 billion in both the current and priorfinancialyears.
Movements in borrowingsFunds retained from the sale of our interest in Verizon Wireless, after the return of value to shareholders, has enabled us to reduce the overall amount of the Group’s borrowings.
Purchase of treasury sharesCash payments of £1.0 billion relate to the completion of a £1.5 billion share buyback programme that commenced following the receipt of a US$3.8 billion (£2.4 billion) income dividend from VZW in December 2012. Further details are provided on page 101.
B and C share paymentsB share payments formed part of the return of value to shareholders following the disposal of the Group’s interest in Verizon Wireless. Further details are provided on page 101.
Equity dividends paidEquity dividends paid during the year increased by 5.6%. A special dividend was paid during the year to 31 March 2012 following the receipt of an income dividend from VZW. Further details on the Group’s dividends are provided on page 101.
Other transactions with non-controlling shareholders in subsidiariesDuring the year we acquired the non-controlling interests in Vodafone India Limited and commenced the legal process of acquiring the remaining shares in Kabel Deutschland.
Cash flow reconciliationAreconciliationofcashgeneratedbyoperationstofreecashflowand net debt, two non-GAAP measures used by management, is shown below. Cash generated by operations increased by 5.7% to £12.1 billion, primarily driven by working capital improvements, partially offsetbyareductioninEBITDA.Freecashflowdecreasedby24%to£4.2 billion, the largest contributing factor being a £0.9 billion increase in tax payments principally arising from the early settlement of certain taxes payable in the United States due to the disposal of our US Group.
2014 Restated
2013 £m £m %
EBITDA 11,084 11,466 (3.3)Working capital 1,381 177 Other (318) (149) Cash generated by operations 12,147 11,494 5.7Cash capital expenditure (5,857) (5,217) Capital expenditure (6,313) (5,292) Working capital movement in respect of capital expenditure 456 75
Disposal of property, plant and equipment 79 105 Operating free cash flow 6,369 6,382 (0.2)Taxation (3,449) (2,570) Dividends received from associates and investments 2,842 3,132 Dividends paid to non-controlling shareholders in subsidiaries (264) (379) Interest received and paid (1,315) (1,064) Free cash flow 4,183 5,501 (24.0)Tax settlement (100) (100) Licence and spectrum payments (862) (2,499) Acquisitions and disposals 27,372 (1,723) Equity dividends paid (5,076) (4,806) Special return (14,291) –Purchase of treasury shares (1,033) (1,568) Foreign exchange 2,423 (716) Income dividend from VZW 2,065 2,409 Other (3,027) 1,149 Net debt decrease/(increase) 11,654 (2,353) Opening net debt (25,354) (23,001) Closing net debt (13,700) (25,354)
Net debtNet debt reduced by £11.7 billion to £13.7 billion, primarily as a result of cash we have retained from the sale of our interest Verizon Wireless after the return of value to shareholders, partially offset by cash payments for the acquisition of Kabel Deutschland and also as a result of the other cash movements discussed above.
Thefinancialcommentaryonthispageisunaudited.
Vodafone Group Plc Annual Report 2014102 103Overview
Strategy review Performance Governance Financials
Additional information
1. Basis of preparation
This section describes the critical accounting judgements that management has identified as having a potentially material impact on the Group’s consolidated financial statements and sets out our significant accounting policies that relate to the financial statements as a whole. Where an accounting policy is generally applicable to a specific note to the accounts, the policy is described within that note. We have also detailed below the new accounting pronouncements that we will adopt in future years and our current view of the impact they will have on our financial reporting. The consolidated financial statements are prepared in accordance with IFRS as issued by the International Accounting Standards Board and are also prepared in accordance with IFRS adopted by the European Union (‘EU’), the Companies Act 2006 and Article 4 of the EU IAS Regulations. The consolidated financial statements are prepared on a going concern basis.
The preparation of financial statements in conformity with IFRS requires management to make estimates and assumptions that affect the reported amounts of assets and liabilities and disclosure of contingent assets and liabilities at the date of the financial statements and the reported amounts of revenue and expenses during the reporting period. A discussion on the Group’s critical accounting judgements and key sources of estimation uncertainty is detailed below. Actual results could differ from those estimates. The estimates and underlying assumptions are reviewed on an ongoing basis. Revisions to accounting estimates are recognised in the period in which the estimate is revised if the revision affects only that period or in the period of the revision and future periods if the revision affects both current and future periods.
Amounts in the consolidated financial statements are stated in pounds sterling.
Vodafone Group Plc is registered in England and Wales (No. 1833679).
IFRS requires the directors to adopt accounting policies that are the most appropriate to the Group’s circumstances. In determining and applying accounting policies, directors and management are required to make judgements in respect of items where the choice of specific policy, accounting estimate or assumption to be followed could materially affect the Group’s reported financial position, results or cash flows; it may later be determined that a different choice may have been more appropriate.
Management has identified accounting estimates and assumptions relating to revenue, taxation, business combinations and goodwill, joint arrangements, finite lived intangible assets, property, plant and equipment, post employment benefits, provisions and contingent liabilities and impairment that it considers to be critical due to their impact on the Group’s financial statements. These critical accounting judgements, assumptions and related disclosures have been discussed with the Company’s Audit and Risk Committee (see page 62).
Critical accounting judgements and key sources of estimation uncertainty Revenue recognition
Arrangements with multiple deliverablesIn revenue arrangements where more than one good or service is provided to the customer, customer consideration is allocated between the goods and services using relative fair value principles. The fair values determined for deliverables may impact the timing of the recognition of revenue. Determining the fair value of each deliverable can require complex estimates. The Group generally determines the fair value of individual elements based on prices at which the deliverable is regularly sold on a standalone basis after considering volume discounts where appropriate.
Gross versus net presentationWhen the Group sells goods or services as a principal, income and payments to suppliers are reported on a gross basis in revenue and operating costs. If the Group sells goods or services as an agent, revenue and payments to suppliers are recorded in revenue on a net basis, representing the margin earned.
Whether the Group is considered to be the principal or an agent in the transaction depends on analysis by management of both the legal form and substance of the agreement between the Group and its business partners; such judgements impact the amount of reported revenue and operating expenses but do not impact reported assets, liabilities or cash flows.
TaxationThe Group’s tax charge on ordinary activities is the sum of the total current and deferred tax charges. The calculation of the Group’s total tax charge involves estimation and judgement in respect of certain matters where the tax impact is uncertain until a conclusion is reached with the relevant tax authority or through a legal process. The final resolution of some of these items may give rise to material profits, losses and/or cash flows.
Resolving tax issues can take many years as it is not always within the control of the Group and often depends on the efficiency of legal processes in the relevant tax jurisdiction.
Recognition of deferred tax assets The recognition of deferred tax assets is based upon whether it is more likely than not that there will be sufficient and suitable taxable profits in the relevant legal entity or tax group against which to utilise the assets in the future. Judgement is required when determining probable future taxable profits, which are estimated using the latest available profit forecasts. Prior to recording deferred tax assets for tax losses, relevant tax law is considered to determine the availability of the losses to offset against the future taxable profits.
Significant items on which the Group has exercised accounting estimation and judgement include the recognition of deferred tax assets in respect of losses in Luxembourg, Germany, India, and Turkey, capital allowances in the United Kingdom and the tax liability on the rationalisation and re-organisation of the Group prior to the disposal of our US group, whose principal asset was its 45% interest in Verizon Wireless (‘VZW’). See note 6 “Taxation” to the consolidated financial statements.
Notes to the consolidated financial statements
Vodafone Group Plc Annual Report 2014104

Business combinations and goodwillWhen a business combination occurs, the fair values of the identifiable assets and liabilities assumed, including intangible assets, are recognised. The determination of the fair values of acquired assets and liabilities is based, to a considerable extent, on management’s judgement. If the purchase consideration exceeds the fair value of the net assets acquired then the difference is recognised as goodwill. If the purchase price consideration is lower than the fair value of the assets acquired then a gain is recognised in the income statement.
Allocation of the purchase price between finite lived assets (discussed below) and indefinite lived assets such as goodwill affects the results of the Group as finite lived intangible assets are amortised, whereas indefinite lived intangible assets, including goodwill, are not amortised.
On transition to IFRS the Group elected not to apply IFRS 3, “Business combinations”, retrospectively as the difficulty in applying these requirements to business combinations completed by the Group from incorporation through to 1 April 2004 exceeded any potential benefits. Goodwill arising before the date of transition to IFRS amounted to £78,753 million.
If the Group had elected to apply the accounting for business combinations retrospectively it may have led to an increase or decrease in goodwill, licences, customer bases, brands and related deferred tax liabilities recognised on acquisition.
Joint arrangementsThe Group participates in a number of joint arrangements where control of the arrangement is shared with one or more other parties. A joint arrangement is classified as a joint operation or as a joint venture, depending on management’s assessment of the legal form and substance of the arrangement.
The classification can have a material impact on the consolidated financial statements. The Group’s share of assets, liabilities, revenue, expenses and cash flows of joint operations are included in the consolidated financial statements on a line-by-line basis, whereas the Group’s investment and share of results of joint ventures are shown within single line items in the consolidated statement of financial position and consolidated income statement respectively. See note 12 “Investments in associates and joint ventures” to the consolidated financial statements.
Finite lived intangible assetsOther intangible assets include amounts spent by the Group acquiring licences and spectrum, customer bases and brands and the costs of purchasing and developing computer software.
Where intangible assets are acquired through business combinations and no active market for the assets exists, the fair value of these assets is determined by discounting estimated future net cash flows generated by the asset. Estimates relating to the future cash flows and discount rates used may have a material effect on the reported amounts of finite lived intangible assets.
Estimation of useful lifeThe useful life over which intangible assets are amortised depends on management’s estimate of the period over which economic benefit will be derived from the asset. Reducing the useful life will increase the amortisation charge in the consolidated income statement. Useful lives are periodically reviewed to ensure that they remain appropriate. The basis for determining the useful life for the most significant categories of intangible assets is discussed below.
Licences and spectrum feesThe estimated useful life is generally the term of the licence unless there is a presumption of renewal at negligible cost; this is adjusted if necessary, for example taking into account the impact of any expected changes in technology.
Customer basesThe estimated useful life principally reflects management’s view of the average economic life of the customer base and is assessed by reference to customer churn rates. An increase in churn rates may lead to a reduction in the estimated useful life and an increase in the amortisation charge.
Capitalised softwareFor computer software, the useful life is based on management’s view, considering historical experience with similar products as well as anticipation of future events which may impact their life such as changes in technology. The useful life will not exceed the duration of a licence.
Property, plant and equipmentProperty, plant and equipment represents 18.8% (2013: 12.7%) of the Group’s total assets; estimates and assumptions made may have a material impact on their carrying value and related depreciation charge. See note 11 “Property, plant and equipment” for further details.
Estimation of useful lifeThe depreciation charge for an asset is derived using estimates of its expected useful life and expected residual value, which are reviewed annually. Increasing an asset’s expected life or residual value would result in a reduced depreciation charge in the consolidated income statement.
Management determines the useful lives and residual values for assets when they are acquired, based on experience with similar assets and taking into account other relevant factors such as any expected changes in technology. The useful life of network infrastructure is assumed not to exceed the duration of related operating licences unless there is a reasonable expectation of renewal or an alternative future use for the asset.
Post employment benefitsManagement judgement is exercised when determining the Group’s liabilities and expenses arising for defined benefit pension schemes. Management is required to make assumptions regarding future rates of inflation, salary increases, discount rates and longevity of members, each of which may have a material impact on the defined benefit obligations that are recorded. Sensitivity analysis is provided for these assumptions in note 26 “Post employment benefits” to the consolidated financial statements.
Vodafone Group Plc Annual Report 2014104 105Overview
Strategy review Performance Governance Financials
Additional information

Provisions and contingent liabilitiesThe Group exercises judgement in measuring and recognising provisions and the exposures to contingent liabilities related to pending litigation or other outstanding claims subject to negotiated settlement, mediation, arbitration or government regulation, as well as other contingent liabilities (see note 30 “Contingent liabilities” to the consolidated financial statements). Judgement is necessary to assess the likelihood that a pending claim will succeed, or a liability will arise, and to quantify the possible range of any financial settlement. The inherent uncertainty of such matters means that actual losses may materially differ from estimates.
Impairment reviewsIFRS requires management to perform impairment tests annually for indefinite lived assets and, for finite lived assets, if events or changes in circumstances indicate that their carrying amounts may not be recoverable.
Impairment testing requires management to judge whether the carrying value of assets can be supported by the net present value of future cash flows that they generate. Calculating the net present value of the future cash flows requires assumptions to be made in respect of highly uncertain matters including management’s expectations of:
a growth in EBITDA, calculated as adjusted operating profit before depreciation and amortisation;
a timing and amount of future capital expenditure;
a long-term growth rates; and
a appropriate discount rates to reflect the risks involved.
Management prepares formal five year forecasts for the Group’s operations, which are used to estimate their value in use. In certain developing markets ten year forecasts are used if it is considered that the fifth year of a forecast is not indicative of expected long-term future performance as operations may not have reached maturity.
For operations where five year forecasts are used for the Group’s value in use calculations, a long-term growth rate into perpetuity has been determined as the lower of:
a the nominal GDP growth rates for the country of operation; and
a the long-term compound annual growth rate in EBITDA in years six to ten estimated by management.
For operations where ten year forecasts are used for the Group’s value in use calculations, a long-term growth rate into perpetuity has been determined as the lower of:
a the nominal GDP growth rates for the country of operation; and
a the compound annual growth rate in EBITDA in years nine to ten of the management plan.
Changing the assumptions selected by management, in particular the discount rate and growth rate assumptions used in the cash flow projections, could significantly affect the Group’s impairment evaluation and hence reported assets and profits or losses. Further details, including a sensitivity analysis is included in note 4 “Impairment losses” to the consolidated financial statements.
Significant accounting policies applied in the current reporting period that relate to the financial statements as a wholeAccounting conventionThe consolidated financial statements are prepared on a historical cost basis except for certain financial and equity instruments that have been measured at fair value.
Basis of consolidationThe consolidated financial statements incorporate the financial statements of the Company, subsidiaries controlled by the Company (see note 32 “Principal subsidiaries”) and joint operations that are subject to joint control (see note 12 “Investments in associates and joint ventures”).
Foreign currenciesThe consolidated financial statements are presented in sterling, which is the parent company’s functional currency and the presentation currency of the Group. Each entity in the Group determines its own functional currency and items included in the financial statements of each entity are measured using that functional currency.
Transactions in foreign currencies are initially recorded at the functional currency rate prevailing at the date of the transaction. Monetary assets and liabilities denominated in foreign currencies are retranslated into the respective functional currency of the entity at the rates prevailing on the reporting period date. Non-monetary items carried at fair value that are denominated in foreign currencies are retranslated at the rates prevailing on the initial transaction dates. Non-monetary items measured in terms of historical cost in a foreign currency are not retranslated.
Changes in the fair value of monetary securities denominated in foreign currency classified as available-for-sale are analysed between translation differences and other changes in the carrying amount of the security. Translation differences are recognised in the income statement and other changes in carrying amount are recognised in equity.
Translation differences on non-monetary financial assets, such as investments in equity securities classified as available-for-sale, are reported as part of the fair value gain or loss and are included in equity.
Notes to the consolidated financial statements (continued)
1. Basis of preparation (continued)
Vodafone Group Plc Annual Report 2014106

For the purpose of presenting consolidated financial statements, the assets and liabilities of entities with a functional currency other than sterling are expressed in sterling using exchange rates prevailing at the reporting period date. Income and expense items and cash flows are translated at the average exchange rates for the period and exchange differences arising are recognised directly in equity. On disposal of a foreign entity, the cumulative amount previously recognised in equity relating to that particular foreign operation is recognised in profit or loss.
Goodwill and fair value adjustments arising on the acquisition of a foreign operation are treated as assets and liabilities of the foreign operation and translated accordingly.
In respect of all foreign operations, any exchange differences that have arisen before 1 April 2004, the date of transition to IFRS, are deemed to be nil and will be excluded from the determination of any subsequent profit or loss on disposal.
The net foreign exchange loss recognised in the consolidated income statement for the year ended 31 March 2014 is £1,688 million (31 March 2013: £117 million loss; 2012: £703 million gain). The net losses and net gains are recorded within operating profit (2014: £16 million charge; 2013: £21 million charge; 2012: £33 million charge), other income and expense and non-operating income and expense (2014: £1,493 million charge; 2013: £1 million charge; 2012: £681 million credit), investment and financing income (2014: £180 million charge; 2013: £91 million charge; 2012: £55 million credit) and income tax expense (2014: £1 million credit; 2013: £4 million charge; 2012: £nil). The foreign exchange gains and losses included within other income and expense and non-operating income and expense arise on the disposal of interests in joint ventures, associates and investments from the recycling of foreign exchange gains previously recorded in the consolidated statement of comprehensive income.
New accounting pronouncements adoptedOn 1 April 2013 the Group adopted new accounting policies where necessary to comply with amendments to IFRS. Accounting pronouncements considered by the Group as significant on adoption are:
a Amendments to IAS 19, “Employee benefits”, which requires revised accounting and disclosures for defined benefit pension schemes, including a different measurement basis for asset returns, replacing the expected return on plan assets and interest cost currently recorded in the consolidated income statement with net interest. This results in a revised allocation of costs between the income statement and other comprehensive income. The amendments also include a revised definition of short- and long-term benefits to employees and revised criteria for the recognition of termination benefits. The consolidated financial statements have been restated on the adoption of the amendments to IAS 19 (2013: reduced profit for the year by £16 million, 2012: £9 million).
a Changes to the standards governing the accounting for subsidiaries, joint arrangements and associates, including the introduction of IFRS 10, “Consolidated Financial Statements”, IFRS 11, “Joint Arrangements” and IFRS 12, “Disclosure of Interests in Other Entities” and amendments to IAS 28, “Investments in Associates and Joint Ventures”. IFRS 11 generally requires interests in jointly controlled entities to be recorded using the equity method, which is consistent with the accounting treatment applied to investments in associates. Under IFRS 11, the Group’s principal joint arrangements, excluding Cornerstone Telecommunications Infrastructure Limited (see note 12 “Investments in associates and joint ventures”, are incorporated into the consolidated financial statements using the equity method of accounting rather than proportionate consolidation. The consolidated financial statements have been restated on the adoption of IFRS 11; the other changes to the standards governing the accounting for subsidiaries, joint arrangements and associates do not have a material impact on the Group. Adoption on 1 April 2013 is considered to be early adoption for the purposes of complying with IFRS as endorsed by the European Union.
In addition, during the year the Group has early-adopted amendments to IAS 36, “Impairment of Assets”, relating to recoverable amounts disclosures, which corrects a previous amendment.
Other IFRS changes adopted on 1 April 2013, including the adoption of IFRS 13, “Fair Value Measurement”, have no material impact on the consolidated results, financial position or cash flows of the Group. The previously reported comparative periods have been restated in the consolidated financial statements for the amendments to IAS 19 and IFRS 11. The impact on key financial information is detailed in the following tables; the impact on earnings per share is immaterial.
2013 2012
As reported
£mAdjustments
£m
Discontinued operations1
£mRestated
£mAs reported
£mAdjustments
£m
Discontinued operations1
£mRestated
£m
Consolidated income statement and statement of comprehensive incomeRevenue 44,445 (6,404) – 38,041 46,417 (7,596) – 38,821Gross profit 13,940 (2,466) – 11,474 14,871 (3,251) – 11,620Share of results of equity accounted associates and joint ventures 6,477 520 (6,422) 575 4,963 1,033 (4,867) 1,129Operating profit/(loss) 4,728 (508) (6,422) (2,202) 11,187 (702) (4,867) 5,618Profit/(loss) before tax 3,255 (372) (6,366) (3,483) 9,549 (561) (4,844) 4,144Profit/(loss) for the financial year from continuing operations 673 (16) (4,616) (3,959) 7,003 (9) (3,555) 3,439Profit for the financial year from discontinued operations – – 4,616 4,616 – – 3,555 3,555Other comprehensive income/(expense) 76 16 – 92 (4,653) 9 – (4,644)Total comprehensive income 749 – – 749 2,350 – – 2,350
Note:1 Adjustments to disclose discontinued operations as a result of the disposal of the US Group, whose principal asset was its 45% interest in Verizon Wireless. See note 7 “Discontinued operations” for further details.
Vodafone Group Plc Annual Report 2014106 107Overview
Strategy review Performance Governance Financials
Additional information

2013 2012
As reported
£mAdjustments
£mRestated
£mAs reported
£mAdjustments
£mRestated
£m
Consolidated statement of financial positionNon-current assets 119,411 (2,736) 116,675 119,551 (3,132) 116,419Current assets 23,287 (1,638) 21,649 20,025 (994) 19,031Total assets 142,698 (4,374) 138,324 139,576 (4,126) 135,450Total equity 72,488 – 72,488 78,202 – 78,202Non-current liabilities 38,986 (1,519) 37,467 37,349 (1,724) 35,625
Current liabilities 31,224 (2,855) 28,369 24,025 (2,402) 21,623Total equity and liabilities 142,698 (4,374) 138,324 139,576 (4,126) 135,450
Consolidated statement of cash flowsNet cash flow from operating activities 10,694 (1,870) 8,824 12,755 (2,458) 10,297Net cash flow from investing activities (7,398) 1,652 (5,746) 3,843 2,738 6,581Net cash flow from financing activities (2,956) 213 (2,743) (15,369) (300) (15,669)Net cash flow 340 (5) 335 1,229 (20) 1,209
New accounting pronouncements to be adopted on 1 April 2014The following pronouncements which are potentially relevant to the Group have been issued by the IASB or the IFRIC, are effective for annual periods beginning on or after 1 January 2014 and have been endorsed for use in the EU unless otherwise stated:
a Amendment to IAS 32, “Offsetting financial assets and financial liabilities”.
a Amendments to IAS 39, “Novation of derivatives and continuation of hedge accounting”.
a “Improvements to IFRS 2010 to 2012 cycle”, elements are effective variously from 1 July 2014 and for annual periods beginning on or after 1 July 2014. All the amendments will be adopted by the Group from 1 April 2014, except an amendment to IFRS 8, “Operating Segments”, which will be adopted on 1 April 2014. These amendments have not yet been endorsed by the EU.
a IFRIC 21, “Levies”, which has not yet been endorsed by the EU.
For periods commencing on or after 1 April 2014, the Group’s financial reporting will be presented in accordance with the new standards above which are not expected to have a material impact on the consolidated results, financial position or cash flows of the Group.
New accounting pronouncements to be adopted on or after 1 April 2015On 1 April 2015 the Group will adopt Amendments to IAS 19 “Defined Benefit Plans: Employee Contributions” and “Improvements to IFRS 2011–2013 Cycle”, which are both effective for annual periods beginning on or after 1 July 2014. “Accounting for Acquisitions of Interests in Joint Operations, Amendments to IFRS 11” and “Clarification of Acceptable Methods of Depreciation and Amortisation, Amendment to IAS 16 and IAS 38”, which are effective for accounting periods on or after 1 January 2016, will be adopted by the Group on 1 April 2016.
Phase I of IFRS 9 “Financial Instruments” was issued in November 2009 and has subsequently been updated and amended. The effective date of the standard is to be confirmed and has not yet been endorsed for use in the EU. The standard introduces changes to the classification and measurement of financial assets, removes the restriction on electing to measure certain financial liabilities at fair value through the income statement from initial recognition and requires changes to the presentation of gains and losses relating to fair value changes.
The Group is currently assessing the impact of the above new pronouncements on its results, financial position and cash flows. None of the new pronouncements discussed above have been endorsed for use in the EU.
1. Basis of preparation (continued)
Notes to the consolidated financial statements (continued)
Vodafone Group Plc Annual Report 2014108

2. Segmental analysis
The Group’s businesses are managed on a geographical basis. Selected financial data is presented on this basis below. The Group’s operating segments are established on the basis of those components of the Group that are evaluated regularly by the chief operating decision maker in deciding how to allocate resources and in assessing performance. The Group has a single group of related services and products being the supply of communications services and products. Revenue is attributed to a country or region based on the location of the Group company reporting the revenue. Transactions between operating segments are charged at arm’s length prices.
Segment information is provided on the basis of geographic areas, being the basis on which the Group manages its worldwide interests, with each country in which the Group operates treated as an operating segment. The aggregation of operating segments into the Europe and AMAP regions reflects, in the opinion of management, the similar economic characteristics within each of those regions as well the similar products and services offered and supplied, classes of customers and the regulatory environment. In the case of the Europe region this largely reflects membership of the European Union, whilst for the AMAP region this largely includes emerging and developing economies that are in the process of rapid growth and industrialisation.
Certain financial information is provided separately within the Europe region for Germany, Italy, the UK and Spain and within the AMAP region for India and Vodacom, as these operating segments are individually material for the Group.
During the year ended 31 March 2014 the Group changed its organisational structure, merging its Northern and Central Europe and Southern Europe regions into one Europe region and moved its Turkish operating company into the AMAP region given its emerging market characteristics. The tables below present segmental information on the revised basis with prior years restated accordingly.
The management basis includes the results of the Group’s joint ventures, Vodafone Italy, Vodafone Hutchison Australia, Vodafone Fiji and Indus Towers, on a proportionate basis. The statutory basis includes the results of these joint ventures, using the equity accounting basis rather than on a proportionate consolidation basis.
Accounting policies
Revenue Revenue is recognised to the extent the Group has delivered goods or rendered services under an agreement, the amount of revenue can be measured reliably and it is probable that the economic benefits associated with the transaction will flow to the Group. Revenue is measured at the fair value of the consideration receivable, exclusive of sales taxes and discounts.
The Group principally obtains revenue from providing the following telecommunication services: access charges, airtime usage, messaging, interconnect fees, data services and information provision, connection fees and equipment sales. Products and services may be sold separately or in bundled packages.
Revenue for access charges, airtime usage and messaging by contract customers is recognised as services are performed, with unbilled revenue resulting from services already provided accrued at the end of each period and unearned revenue from services to be provided in future periods deferred. Revenue from the sale of prepaid credit is deferred until such time as the customer uses the airtime, or the credit expires.
Revenue from interconnect fees is recognised at the time the services are performed.
Revenue from data services and information provision is recognised when the Group has performed the related service and, depending on the nature of the service, is recognised either at the gross amount billed to the customer or the amount receivable by the Group as commission for facilitating the service.
Customer connection revenue is recognised together with the related equipment revenue to the extent that the aggregate equipment and connection revenue does not exceed the fair value of the equipment delivered to the customer. Any customer connection revenue not recognised together with related equipment revenue is deferred and recognised over the period in which services are expected to be provided to the customer.
Revenue for device sales is recognised when the device is delivered to the end customer and the sale is considered complete. For device sales made to intermediaries, revenue is recognised if the significant risks associated with the device are transferred to the intermediary and the intermediary has no general right of return. If the significant risks are not transferred, revenue recognition is deferred until sale of the device to an end customer by the intermediary or the expiry of the right of return.
In revenue arrangements including more than one deliverable, the arrangements are divided into separate units of accounting. Deliverables are considered separate units of accounting if the following two conditions are met: (1) the deliverable has value to the customer on a stand-alone basis and (2) there is evidence of the fair value of the item. The arrangement consideration is allocated to each separate unit of accounting based on its relative fair value.
CommissionsIntermediaries are given cash incentives by the Group to connect new customers and upgrade existing customers.
For intermediaries who do not purchase products and services from the Group, such cash incentives are accounted for as an expense. Such cash incentives to other intermediaries are also accounted for as an expense if:
a the Group receives an identifiable benefit in exchange for the cash incentive that is separable from sales transactions to that intermediary; and
a the Group can reliably estimate the fair value of that benefit.
Cash incentives that do not meet these criteria are recognised as a reduction of the related revenue.
109OverviewStrategy review Performance Governance Financials
Additional information

Segmental revenueManagement basis1 Statutory basis1
Segment Intra-region Regional Inter-region Group Presentation Discontinued revenue revenue revenue revenue Revenue adjustments2 operations2 Revenue £m £m £m £m £m £m £m £m
31 March 2014Germany 8,272 (9) 8,263 (11) 8,252 – – 8,252 Italy 4,312 (8) 4,304 (1) 4,303 (3,782) – 521 UK 6,427 (10) 6,417 (3) 6,414 (131) – 6,283 Spain 3,518 (17) 3,501 (2) 3,499 3 – 3,502 Other Europe 5,525 (13) 5,512 (4) 5,508 136 – 5,644 Europe 28,054 (57) 27,997 (21) 27,976 (3,774) – 24,202 India 4,394 – 4,394 (3) 4,391 (449) – 3,942 Vodacom 4,718 – 4,718 – 4,718 – – 4,718 Other AMAP 5,860 (1) 5,859 (12) 5,847 (1,047) – 4,800 AMAP 14,972 (1) 14,971 (15) 14,956 (1,496) – 13,460 Non-Controlled Interests and Common Functions 686 – 686 (2) 684 – – 684 Group 43,712 (58) 43,654 (38) 43,616 (5,270) – 38,346 Discontinued operationsVerizon Wireless3 9,955
31 March 2013 restatedGermany 7,857 (27) 7,830 (6) 7,824 2 – 7,826 Italy 4,755 (21) 4,734 (1) 4,733 (4,733) – – UK 5,150 (30) 5,120 (4) 5,116 (23) – 5,093 Spain 3,904 (40) 3,864 (2) 3,862 5 – 3,867 Other Europe 7,115 (61) 7,054 (6) 7,048 32 – 7,080 Europe 28,781 (179) 28,602 (19) 28,583 (4,717) – 23,866 India 4,324 – 4,324 (4) 4,320 (417) – 3,903 Vodacom 5,206 – 5,206 – 5,206 – – 5,206 Other AMAP 5,884 (1) 5,883 (28) 5,855 (1,270) – 4,585 AMAP 15,414 (1) 15,413 (32) 15,381 (1,687) – 13,694 Non-Controlled Interests and Common Functions 481 – 481 – 481 – – 481 Group 44,676 (180) 44,496 (51) 44,445 (6,404) – 38,041 Discontinued operationsVerizon Wireless3 21,972
31 March 2012 restatedGermany 8,233 (43) 8,190 (2) 8,188 5 – 8,193 Italy 5,658 (27) 5,631 (2) 5,629 (5,629) – – UK 5,397 (36) 5,361 (7) 5,354 5 – 5,359 Spain 4,763 (52) 4,711 (4) 4,707 7 – 4,714 Other Europe 6,469 (40) 6,429 (5) 6,424 8 – 6,432 Europe 30,520 (198) 30,322 (20) 30,302 (5,604) – 24,698 India 4,265 – 4,265 (6) 4,259 (295) – 3,964 Vodacom 5,638 – 5,638 (8) 5,630 1 – 5,631 Other AMAP 5,669 (1) 5,668 (54) 5,614 (1,456) – 4,158 AMAP 15,572 (1) 15,571 (68) 15,503 (1,750) – 13,753 Non-Controlled Interests and Common Functions 614 – 614 (2) 612 (242) – 370 Group 46,706 (199) 46,507 (90) 46,417 (7,596) – 38,821 Discontinued operationsVerizon Wireless3 20,187
Notes:1 Management basis includes the results of the Group’s joint ventures, Vodafone Italy, Vodafone Hutchison Australia, Vodafone Fiji and Indus Towers, on a proportionate basis. The statutory basis includes the results of these
joint ventures, using the equity accounting basis rather than on a proportionate consolidation basis.2 Presentation adjustments relate to the restatement of the Group’s joint ventures from a proportionate consolidation basis to an equity accounted basis. Discontinued items relate to the results of Verizon Wireless.3 Values shown for Verizon Wireless, which was an associate, are not included in the calculation of Group revenue.
Notes to the consolidated financial statements (continued)
2. Segmental analysis (continued)
Vodafone Group Plc Annual Report 2014110

Segmental profitThe reconciliation of management basis EBITDA to statutory adjusted operating profit is shown below.
Management basis1 Statutory basis1
Depreciation, Share of results inamortisation and associates
loss on disposal of and joint Adjusted operating Presentation Discontinued Adjusted operatingEBITDA2 fixed assets ventures profit adjustments4 operations4 profit
£m £m £m £m £m £m £m
31 March 2014Germany 2,698 (1,781) 1 918 – – 918 Italy 1,536 (810) – 726 (355) – 371 UK 1,418 (1,216) (15) 187 – – 187 Spain 787 (606) – 181 – – 181 Other Europe 1,736 (1,062) 2 676 – – 676 Europe 8,175 (5,475) (12) 2,688 (355) – 2,333 India 1,397 (1,043) – 354 (28) – 326 Vodacom 1,716 (488) – 1,228 – – 1,228 Other AMAP 1,567 (1,124) 67 510 (117) – 393 AMAP 4,680 (2,655) 67 2,092 (145) – 1,947 Non-Controlled Interests and Common Functions (24) (51) 3,169 3,094 105 (3,169) 30 Group 12,831 (8,181) 3,224 7,874 (395) (3,169) 4,310 Discontinued operationsVerizon Wireless 3 4,274
31 March 2013 restatedGermany 2,831 (1,430) – 1,401 – – 1,401 Italy 1,917 (745) – 1,172 (433) – 739 UK 1,210 (907) – 303 – – 303 Spain 1,021 (600) – 421 – – 421 Other Europe 2,120 (1,244) 2 878 – – 878 Europe 9,099 (4,926) 2 4,175 (433) – 3,742 India 1,240 (1,019) – 221 (63) – 158 Vodacom 1,891 (559) – 1,332 – – 1,332 Other AMAP 1,401 (1,113) 52 340 (105) – 235 AMAP 4,532 (2,691) 52 1,893 (168) – 1,725 Non-Controlled Interests and Common Functions (65) 74 6,500 6,509 114 (6,500) 123 Group 13,566 (7,543) 6,554 12,577 (487) (6,500) 5,590 Discontinued operationsVerizon Wireless 3 8,831
31 March 2012 restatedGermany 3,034 (1,473) – 1,561 – – 1,561 Italy 2,521 (779) – 1,742 (643) – 1,099 UK 1,294 (888) – 406 – – 406 Spain 1,210 (627) – 583 – – 583 Other Europe 2,160 (1,145) 3 1,018 – – 1,018 Europe 10,219 (4,912) 3 5,310 (643) – 4,667 India 1,122 (1,062) – 60 (68) – (8)Vodacom 1,933 (595) – 1,338 – – 1,338 Other AMAP 1,338 (1,015) 36 359 (78) – 281 AMAP 4,393 (2,672) 36 1,757 (146) – 1,611 Non-Controlled Interests and Common Functions (6) (41) 5,010 4,963 99 (4,953) 109 Group 14,606 (7,625) 5,049 12,030 (690) (4,953) 6,387 Discontinued operationsVerizon Wireless 3 7,689
Notes:1 Management basis includes the results of the Group’s joint ventures, Vodafone Italy, Vodafone Hutchison Australia, Vodafone Fiji and Indus Towers, on a proportionate basis, including a five month contribution from Verizon
Wireless. The statutory basis includes the results of these joint ventures, using the equity accounting basis rather than on a proportionate consolidation basis, and includes a five month contribution from Verizon Wireless which is treated as discontinued operations.
2 The Group’s measure of segment profit, EBITDA, excludes depreciation, amortisation and loss on disposal of fixed assets and the Group’s share of results in associates and joint ventures. EBITDA and adjusted operating profit have been restated to exclude restructuring costs.
3 Discontinued operations comprise our US Group whose principal asset was a 45% interest in Verizon Wireless. We sold our US Group on 21 February 2014. Refer to note 7 “Discontinued operations” for further details.4 Presentation adjustments relate to the restatement of the Group’s joint ventures from a proportionate consolidation basis to an equity accounted basis. Discontinued items relate to the results of Verizon Wireless.
Vodafone Group Plc Annual Report 2014110 111Overview
Strategy review Performance Governance Financials
Additional information

A reconciliation of adjusted operating profit to operating (loss)/profit is shown below. For a reconciliation of operating (loss)/profit to profit for the financial year, see the consolidated income statement on page 96.
2014 Restated
2013 Restated
2012 £m £m £m
Adjusted operating profit 4,310 5,590 6,387 Impairment loss (6,600) (7,700) (4,050)Restructuring costs (355) (311) (144)Amortisation of acquired customer base and brand intangible assets (551) (249) (280)Other income and expense (717) 468 3,705 Operating (loss)/profit (3,913) (2,202) 5,618
Segmental assetsOther
expenditure on DepreciationNon-current Capital intangible and
assets1 expenditure2 assets amortisation Impairment loss£m £m £m £m £m
31 March 2014Germany 22,780 1,312 3 2,036 4,900 Italy 7,984 180 – 164 – UK 8,031 932 – 1,290 – Spain 3,653 511 – 587 800 Other Europe 8,736 800 273 1,047 900 Europe 51,184 3,735 276 5,124 6,600 India 7,824 633 1,938 828 – Vodacom 4,560 663 3 593 – Other AMAP 4,850 711 11 932 – AMAP 17,234 2,007 1,952 2,353 – Non-Controlled Interests and Common Functions 1,121 571 – 83 – Group 69,539 6,313 2,228 7,560 6,600
31 March 2013 restated
Germany 19,109 1,073 2 1,423 – Italy – – – – 4,500 UK 8,365 601 863 888 – Spain 4,599 377 – 590 3,200 Other Europe 9,786 993 1,335 1,291 – Europe 41,859 3,044 2,200 4,192 7,700 India 7,388 462 130 914 – Vodacom 5,668 703 10 696 – Other AMAP 5,826 678 90 894 – AMAP 18,882 1,843 230 2,504 – Non-Controlled Interests and Common Functions 982 405 – (35) – Group 61,723 5,292 2,430 6,661 7,700
31 March 2012 restatedGermany 19,151 880 4 1,469 – Italy – – – – 2,450 UK 6,430 575 – 880 – Spain 8,069 429 71 626 900 Other Europe 8,543 823 313 1,122 700 Europe 42,193 2,707 388 4,097 4,050 India 7,847 710 – 967 – Vodacom 6,469 723 – 840 – Other AMAP 5,362 709 – 782 – AMAP 19,678 2,142 – 2,589 – Non-Controlled Interests and Common Functions 715 395 – 35 – Group 62,586 5,244 388 6,721 4,050
Notes:1 Comprises goodwill, other intangible assets and property, plant and equipment.2 Includes additions to property, plant and equipment and computer software, reported within intangibles. Excludes licences and spectrum additions.
Notes to the consolidated financial statements (continued)
2. Segmental analysis (continued)
Vodafone Group Plc Annual Report 2014112
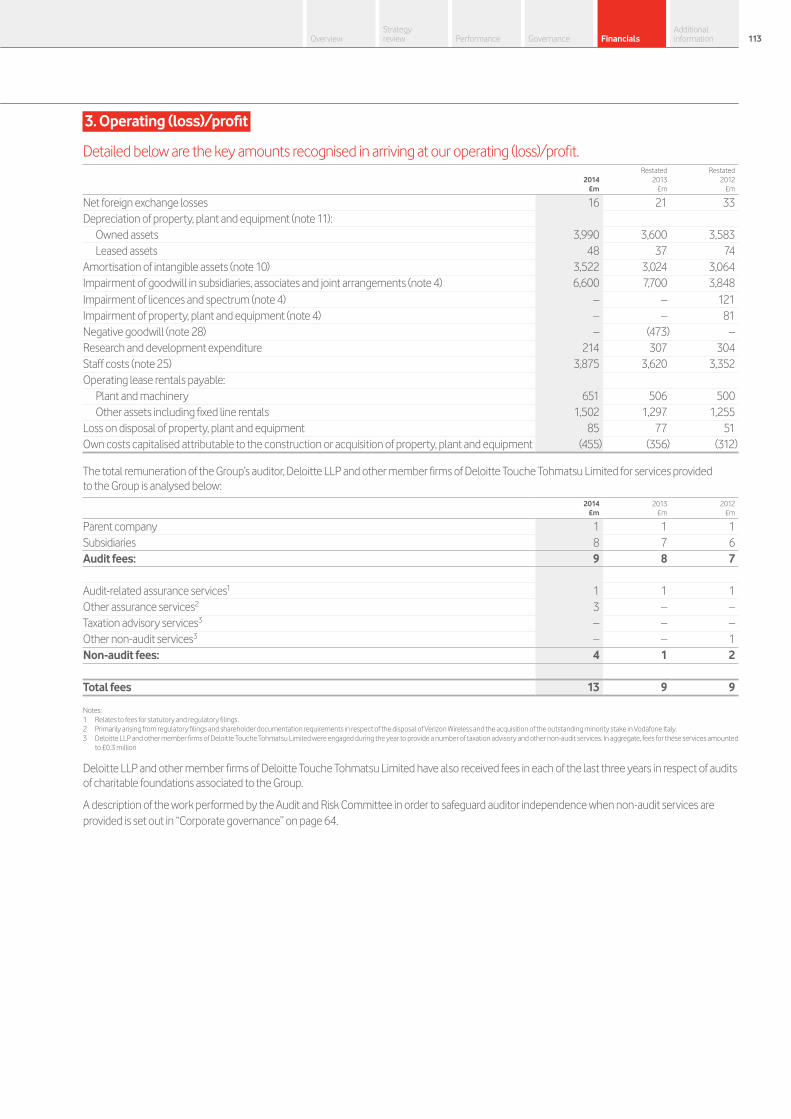
3. Operating (loss)/profit
Detailed below are the key amounts recognised in arriving at our operating (loss)/profit.
2014 Restated
2013 Restated
2012 £m £m £m
Net foreign exchange losses 16 21 33Depreciation of property, plant and equipment (note 11):
Owned assets 3,990 3,600 3,583Leased assets 48 37 74
Amortisation of intangible assets (note 10) 3,522 3,024 3,064Impairment of goodwill in subsidiaries, associates and joint arrangements (note 4) 6,600 7,700 3,848Impairment of licences and spectrum (note 4) – – 121Impairment of property, plant and equipment (note 4) – – 81Negative goodwill (note 28) – (473) –Research and development expenditure 214 307 304Staff costs (note 25) 3,875 3,620 3,352Operating lease rentals payable:
Plant and machinery 651 506 500Other assets including fixed line rentals 1,502 1,297 1,255
Loss on disposal of property, plant and equipment 85 77 51Own costs capitalised attributable to the construction or acquisition of property, plant and equipment (455) (356) (312)
The total remuneration of the Group’s auditor, Deloitte LLP and other member firms of Deloitte Touche Tohmatsu Limited for services provided to the Group is analysed below:
2014 2013 2012 £m £m £m
Parent company 1 1 1 Subsidiaries 8 7 6 Audit fees: 9 8 7
Audit-related assurance services1 1 1 1 Other assurance services2 3 – – Taxation advisory services3 – – – Other non-audit services3 – – 1 Non-audit fees: 4 1 2
Total fees 13 9 9
Notes:1 Relates to fees for statutory and regulatory filings. 2 Primarily arising from regulatory filings and shareholder documentation requirements in respect of the disposal of Verizon Wireless and the acquisition of the outstanding minority stake in Vodafone Italy. 3 Deloitte LLP and other member firms of Deloitte Touche Tohmatsu Limited were engaged during the year to provide a number of taxation advisory and other non-audit services. In aggregate, fees for these services amounted
to £0.3 million
Deloitte LLP and other member firms of Deloitte Touche Tohmatsu Limited have also received fees in each of the last three years in respect of audits of charitable foundations associated to the Group.
A description of the work performed by the Audit and Risk Committee in order to safeguard auditor independence when non-audit services are provided is set out in “Corporate governance” on page 64.
Vodafone Group Plc Annual Report 2014112 113Overview
Strategy review Performance Governance Financials
Additional information
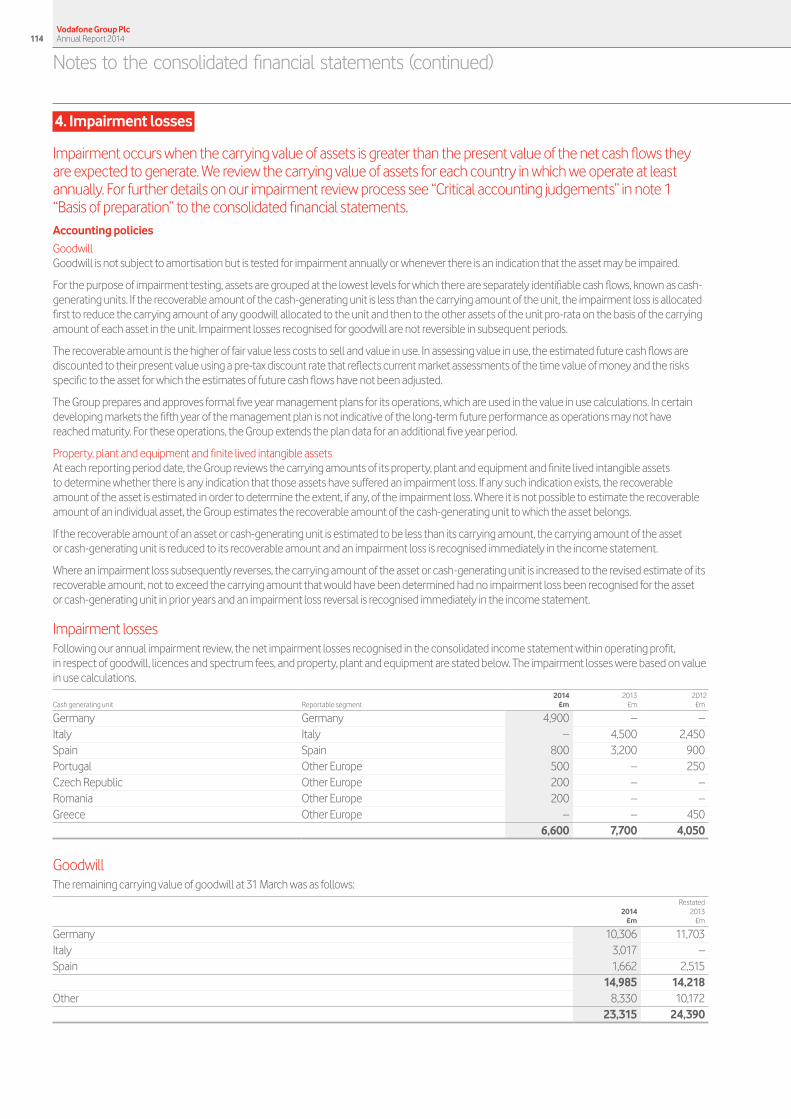
4. Impairment losses
Impairment occurs when the carrying value of assets is greater than the present value of the net cash flows they are expected to generate. We review the carrying value of assets for each country in which we operate at least annually. For further details on our impairment review process see “Critical accounting judgements” in note 1 “Basis of preparation” to the consolidated financial statements.Accounting policies
GoodwillGoodwill is not subject to amortisation but is tested for impairment annually or whenever there is an indication that the asset may be impaired.
For the purpose of impairment testing, assets are grouped at the lowest levels for which there are separately identifiable cash flows, known as cash-generating units. If the recoverable amount of the cash-generating unit is less than the carrying amount of the unit, the impairment loss is allocated first to reduce the carrying amount of any goodwill allocated to the unit and then to the other assets of the unit pro-rata on the basis of the carrying amount of each asset in the unit. Impairment losses recognised for goodwill are not reversible in subsequent periods.
The recoverable amount is the higher of fair value less costs to sell and value in use. In assessing value in use, the estimated future cash flows are discounted to their present value using a pre-tax discount rate that reflects current market assessments of the time value of money and the risks specific to the asset for which the estimates of future cash flows have not been adjusted.
The Group prepares and approves formal five year management plans for its operations, which are used in the value in use calculations. In certain developing markets the fifth year of the management plan is not indicative of the long-term future performance as operations may not have reached maturity. For these operations, the Group extends the plan data for an additional five year period.
Property, plant and equipment and finite lived intangible assetsAt each reporting period date, the Group reviews the carrying amounts of its property, plant and equipment and finite lived intangible assets to determine whether there is any indication that those assets have suffered an impairment loss. If any such indication exists, the recoverable amount of the asset is estimated in order to determine the extent, if any, of the impairment loss. Where it is not possible to estimate the recoverable amount of an individual asset, the Group estimates the recoverable amount of the cash-generating unit to which the asset belongs.
If the recoverable amount of an asset or cash-generating unit is estimated to be less than its carrying amount, the carrying amount of the asset or cash-generating unit is reduced to its recoverable amount and an impairment loss is recognised immediately in the income statement.
Where an impairment loss subsequently reverses, the carrying amount of the asset or cash-generating unit is increased to the revised estimate of its recoverable amount, not to exceed the carrying amount that would have been determined had no impairment loss been recognised for the asset or cash-generating unit in prior years and an impairment loss reversal is recognised immediately in the income statement.
Impairment lossesFollowing our annual impairment review, the net impairment losses recognised in the consolidated income statement within operating profit, in respect of goodwill, licences and spectrum fees, and property, plant and equipment are stated below. The impairment losses were based on value in use calculations.
2014 2013 2012Cash generating unit Reportable segment £m £m £m
Germany Germany 4,900 – – Italy Italy – 4,500 2,450Spain Spain 800 3,200 900 Portugal Other Europe 500 – 250Czech Republic Other Europe 200 – –Romania Other Europe 200 – – Greece Other Europe – – 450 6,600 7,700 4,050
GoodwillThe remaining carrying value of goodwill at 31 March was as follows:
2014 Restated
2013 £m £m
Germany 10,306 11,703Italy 3,017 –Spain 1,662 2,515 14,985 14,218Other 8,330 10,172
23,315 24,390
Notes to the consolidated financial statements (continued)
Vodafone Group Plc Annual Report 2014114
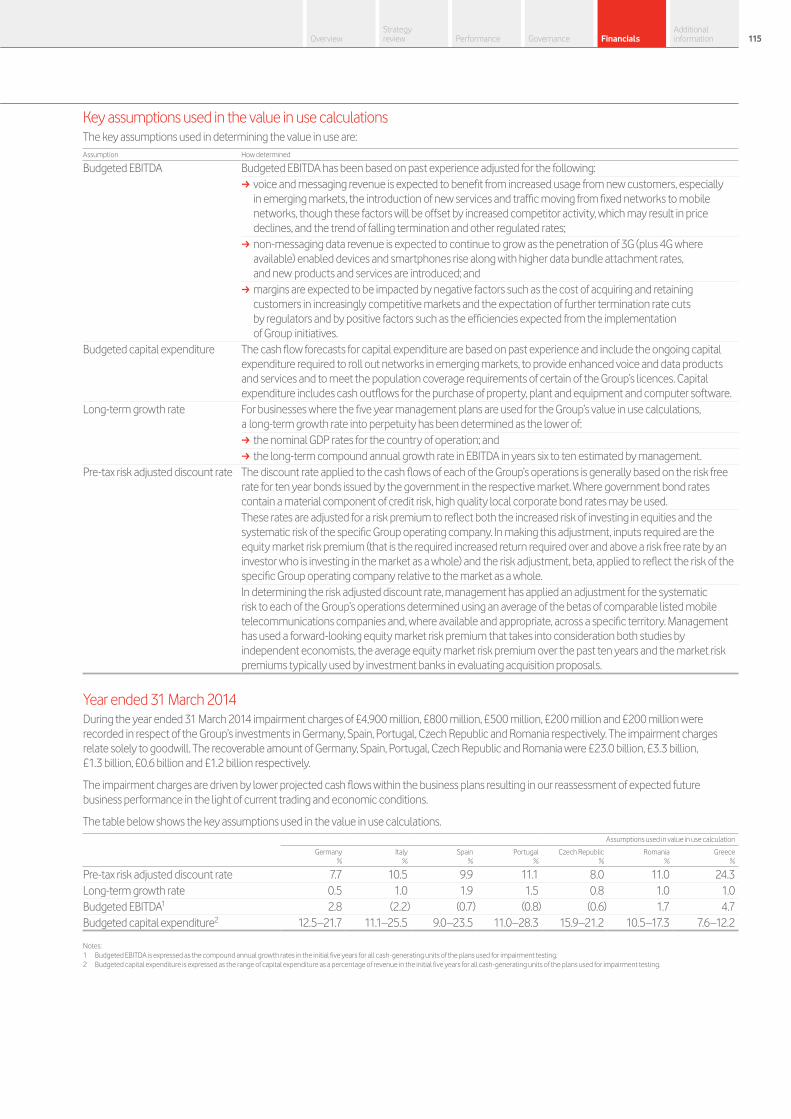
Key assumptions used in the value in use calculationsThe key assumptions used in determining the value in use are:Assumption How determined
Budgeted EBITDA Budgeted EBITDA has been based on past experience adjusted for the following: a voice and messaging revenue is expected to benefit from increased usage from new customers, especially in emerging markets, the introduction of new services and traffic moving from fixed networks to mobile networks, though these factors will be offset by increased competitor activity, which may result in price declines, and the trend of falling termination and other regulated rates;
a non-messaging data revenue is expected to continue to grow as the penetration of 3G (plus 4G where available) enabled devices and smartphones rise along with higher data bundle attachment rates, and new products and services are introduced; and
a margins are expected to be impacted by negative factors such as the cost of acquiring and retaining customers in increasingly competitive markets and the expectation of further termination rate cuts by regulators and by positive factors such as the efficiencies expected from the implementation of Group initiatives.
Budgeted capital expenditure The cash flow forecasts for capital expenditure are based on past experience and include the ongoing capital expenditure required to roll out networks in emerging markets, to provide enhanced voice and data products and services and to meet the population coverage requirements of certain of the Group’s licences. Capital expenditure includes cash outflows for the purchase of property, plant and equipment and computer software.
Long-term growth rate For businesses where the five year management plans are used for the Group’s value in use calculations, a long-term growth rate into perpetuity has been determined as the lower of:
a the nominal GDP rates for the country of operation; and a the long-term compound annual growth rate in EBITDA in years six to ten estimated by management.
Pre-tax risk adjusted discount rate The discount rate applied to the cash flows of each of the Group’s operations is generally based on the risk free rate for ten year bonds issued by the government in the respective market. Where government bond rates contain a material component of credit risk, high quality local corporate bond rates may be used.These rates are adjusted for a risk premium to reflect both the increased risk of investing in equities and the systematic risk of the specific Group operating company. In making this adjustment, inputs required are the equity market risk premium (that is the required increased return required over and above a risk free rate by an investor who is investing in the market as a whole) and the risk adjustment, beta, applied to reflect the risk of the specific Group operating company relative to the market as a whole.In determining the risk adjusted discount rate, management has applied an adjustment for the systematic risk to each of the Group’s operations determined using an average of the betas of comparable listed mobile telecommunications companies and, where available and appropriate, across a specific territory. Management has used a forward-looking equity market risk premium that takes into consideration both studies by independent economists, the average equity market risk premium over the past ten years and the market risk premiums typically used by investment banks in evaluating acquisition proposals.
Year ended 31 March 2014During the year ended 31 March 2014 impairment charges of £4,900 million, £800 million, £500 million, £200 million and £200 million were recorded in respect of the Group’s investments in Germany, Spain, Portugal, Czech Republic and Romania respectively. The impairment charges relate solely to goodwill. The recoverable amount of Germany, Spain, Portugal, Czech Republic and Romania were £23.0 billion, £3.3 billion, £1.3 billion, £0.6 billion and £1.2 billion respectively.
The impairment charges are driven by lower projected cash flows within the business plans resulting in our reassessment of expected future business performance in the light of current trading and economic conditions.
The table below shows the key assumptions used in the value in use calculations.
Assumptions used in value in use calculation
Germany Italy Spain Portugal Czech Republic Romania Greece % % % % % % %
Pre-tax risk adjusted discount rate 7.7 10.5 9.9 11.1 8.0 11.0 24.3Long-term growth rate 0.5 1.0 1.9 1.5 0.8 1.0 1.0Budgeted EBITDA1 2.8 (2.2) (0.7) (0.8) (0.6) 1.7 4.7Budgeted capital expenditure2 12.5–21.7 11.1–25.5 9.0–23.5 11.0–28.3 15.9–21.2 10.5–17.3 7.6–12.2
Notes:1 Budgeted EBITDA is expressed as the compound annual growth rates in the initial five years for all cash-generating units of the plans used for impairment testing.2 Budgeted capital expenditure is expressed as the range of capital expenditure as a percentage of revenue in the initial five years for all cash-generating units of the plans used for impairment testing.
Vodafone Group Plc Annual Report 2014114 115Overview
Strategy review Performance Governance Financials
Additional information
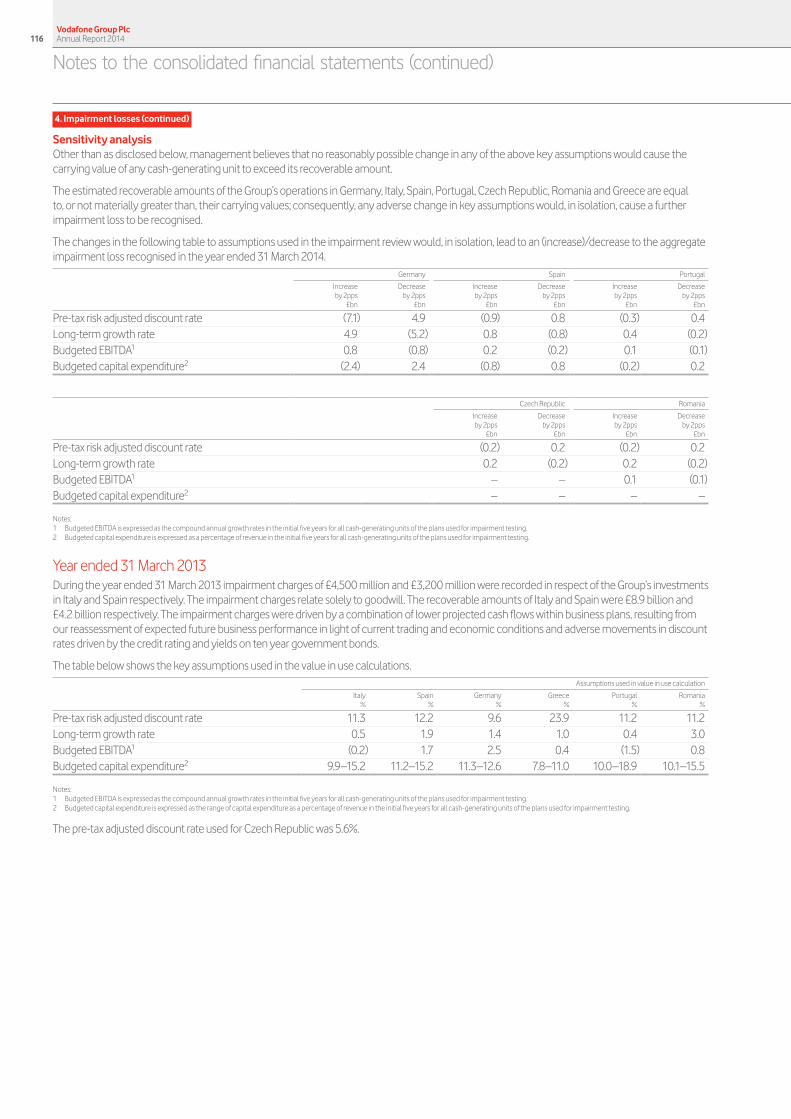
4. Impairment losses (continued)
Sensitivity analysisOther than as disclosed below, management believes that no reasonably possible change in any of the above key assumptions would cause the carrying value of any cash-generating unit to exceed its recoverable amount.
The estimated recoverable amounts of the Group’s operations in Germany, Italy, Spain, Portugal, Czech Republic, Romania and Greece are equal to, or not materially greater than, their carrying values; consequently, any adverse change in key assumptions would, in isolation, cause a further impairment loss to be recognised.
The changes in the following table to assumptions used in the impairment review would, in isolation, lead to an (increase)/decrease to the aggregate impairment loss recognised in the year ended 31 March 2014.
Germany Spain Portugal
Increase Decrease Increase Decrease Increase Decrease by 2pps by 2pps by 2pps by 2pps by 2pps by 2pps £bn £bn £bn £bn £bn £bn
Pre-tax risk adjusted discount rate (7.1) 4.9 (0.9) 0.8 (0.3) 0.4Long-term growth rate 4.9 (5.2) 0.8 (0.8) 0.4 (0.2)Budgeted EBITDA1 0.8 (0.8) 0.2 (0.2) 0.1 (0.1)Budgeted capital expenditure2 (2.4) 2.4 (0.8) 0.8 (0.2) 0.2
Czech Republic Romania
Increase Decrease Increase Decrease by 2pps by 2pps by 2pps by 2pps £bn £bn £bn £bn
Pre-tax risk adjusted discount rate (0.2) 0.2 (0.2) 0.2Long-term growth rate 0.2 (0.2) 0.2 (0.2)Budgeted EBITDA1 – – 0.1 (0.1)Budgeted capital expenditure2 – – – –
Notes:1 Budgeted EBITDA is expressed as the compound annual growth rates in the initial five years for all cash-generating units of the plans used for impairment testing.2 Budgeted capital expenditure is expressed as a percentage of revenue in the initial five years for all cash-generating units of the plans used for impairment testing.
Year ended 31 March 2013During the year ended 31 March 2013 impairment charges of £4,500 million and £3,200 million were recorded in respect of the Group’s investments in Italy and Spain respectively. The impairment charges relate solely to goodwill. The recoverable amounts of Italy and Spain were £8.9 billion and £4.2 billion respectively. The impairment charges were driven by a combination of lower projected cash flows within business plans, resulting from our reassessment of expected future business performance in light of current trading and economic conditions and adverse movements in discount rates driven by the credit rating and yields on ten year government bonds.
The table below shows the key assumptions used in the value in use calculations.
Assumptions used in value in use calculation
Italy Spain Germany Greece Portugal Romania % % % % % %
Pre-tax risk adjusted discount rate 11.3 12.2 9.6 23.9 11.2 11.2 Long-term growth rate 0.5 1.9 1.4 1.0 0.4 3.0 Budgeted EBITDA1 (0.2) 1.7 2.5 0.4 (1.5) 0.8 Budgeted capital expenditure2 9.9–15.2 11.2–15.2 11.3–12.6 7.8–11.0 10.0–18.9 10.1–15.5
Notes:1 Budgeted EBITDA is expressed as the compound annual growth rates in the initial five years for all cash-generating units of the plans used for impairment testing.2 Budgeted capital expenditure is expressed as the range of capital expenditure as a percentage of revenue in the initial five years for all cash-generating units of the plans used for impairment testing.
The pre-tax adjusted discount rate used for Czech Republic was 5.6%.
Notes to the consolidated financial statements (continued)
Vodafone Group Plc Annual Report 2014116
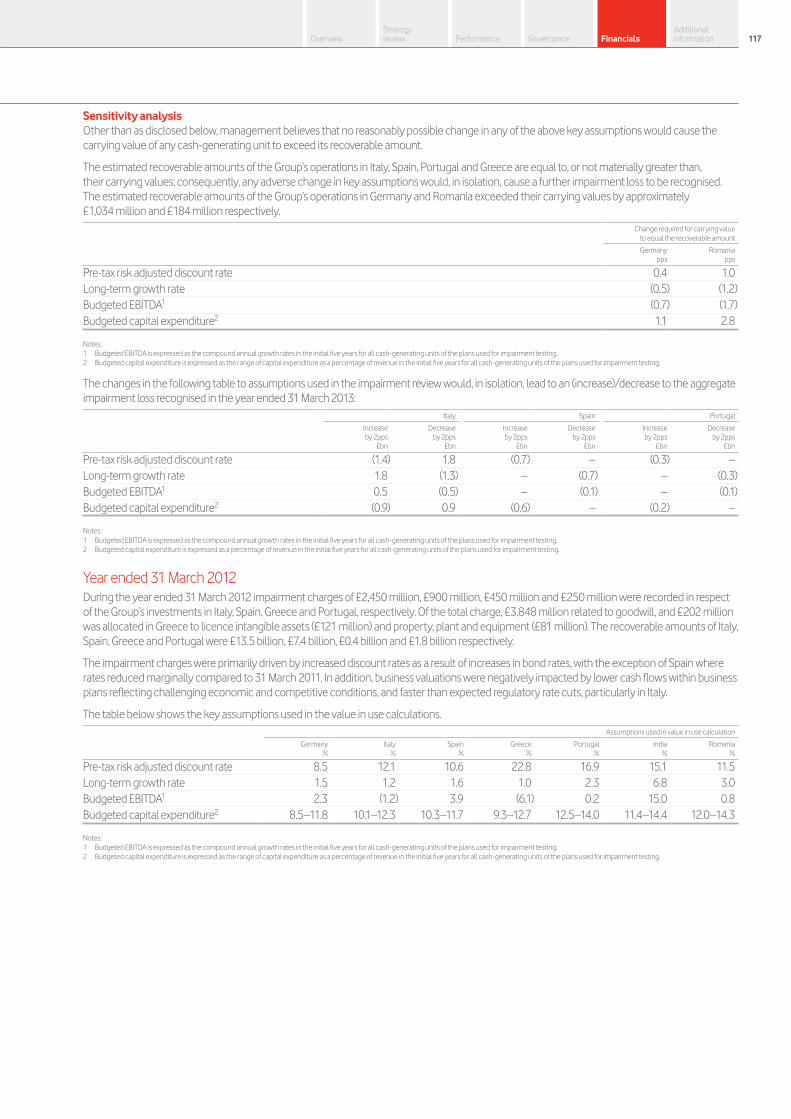
Sensitivity analysisOther than as disclosed below, management believes that no reasonably possible change in any of the above key assumptions would cause the carrying value of any cash-generating unit to exceed its recoverable amount.
The estimated recoverable amounts of the Group’s operations in Italy, Spain, Portugal and Greece are equal to, or not materially greater than, their carrying values; consequently, any adverse change in key assumptions would, in isolation, cause a further impairment loss to be recognised. The estimated recoverable amounts of the Group’s operations in Germany and Romania exceeded their carrying values by approximately £1,034 million and £184 million respectively.
Change required for carrying value to equal the recoverable amount
Germany Romania pps pps
Pre-tax risk adjusted discount rate 0.4 1.0 Long-term growth rate (0.5) (1.2) Budgeted EBITDA1 (0.7) (1.7) Budgeted capital expenditure2 1.1 2.8
Notes:1 Budgeted EBITDA is expressed as the compound annual growth rates in the initial five years for all cash-generating units of the plans used for impairment testing.2 Budgeted capital expenditure is expressed as the range of capital expenditure as a percentage of revenue in the initial five years for all cash-generating units of the plans used for impairment testing.
The changes in the following table to assumptions used in the impairment review would, in isolation, lead to an (increase)/decrease to the aggregate impairment loss recognised in the year ended 31 March 2013:
Italy Spain Portugal
Increase Decrease Increase Decrease Increase Decrease by 2pps by 2pps by 2pps by 2pps by 2pps by 2pps £bn £bn £bn £bn £bn £bn
Pre-tax risk adjusted discount rate (1.4) 1.8 (0.7) – (0.3) –Long-term growth rate 1.8 (1.3) – (0.7) – (0.3)Budgeted EBITDA1 0.5 (0.5) – (0.1) – (0.1)Budgeted capital expenditure2 (0.9) 0.9 (0.6) – (0.2) –
Notes:1 Budgeted EBITDA is expressed as the compound annual growth rates in the initial five years for all cash-generating units of the plans used for impairment testing.2 Budgeted capital expenditure is expressed as a percentage of revenue in the initial five years for all cash-generating units of the plans used for impairment testing.
Year ended 31 March 2012During the year ended 31 March 2012 impairment charges of £2,450 million, £900 million, £450 million and £250 million were recorded in respect of the Group’s investments in Italy, Spain, Greece and Portugal, respectively. Of the total charge, £3,848 million related to goodwill, and £202 million was allocated in Greece to licence intangible assets (£121 million) and property, plant and equipment (£81 million). The recoverable amounts of Italy, Spain, Greece and Portugal were £13.5 billion, £7.4 billion, £0.4 billion and £1.8 billion respectively.
The impairment charges were primarily driven by increased discount rates as a result of increases in bond rates, with the exception of Spain where rates reduced marginally compared to 31 March 2011. In addition, business valuations were negatively impacted by lower cash flows within business plans reflecting challenging economic and competitive conditions, and faster than expected regulatory rate cuts, particularly in Italy.
The table below shows the key assumptions used in the value in use calculations.
Assumptions used in value in use calculation
Germany Italy Spain Greece Portugal India Romania % % % % % % %
Pre-tax risk adjusted discount rate 8.5 12.1 10.6 22.8 16.9 15.1 11.5 Long-term growth rate 1.5 1.2 1.6 1.0 2.3 6.8 3.0Budgeted EBITDA1 2.3 (1.2) 3.9 (6.1) 0.2 15.0 0.8Budgeted capital expenditure2 8.5–11.8 10.1–12.3 10.3–11.7 9.3–12.7 12.5–14.0 11.4–14.4 12.0–14.3
Notes:1 Budgeted EBITDA is expressed as the compound annual growth rates in the initial five years for all cash-generating units of the plans used for impairment testing.2 Budgeted capital expenditure is expressed as the range of capital expenditure as a percentage of revenue in the initial five years for all cash-generating units of the plans used for impairment testing.
Vodafone Group Plc Annual Report 2014116 117Overview
Strategy review Performance Governance Financials
Additional information

5. Investment income and financing costs
Investment income comprises interest received from short-term investments, bank deposits, government bonds and gains from foreign exchange contracts which are used to hedge net debt. Financing costs mainly arise from interest due on bonds and commercial paper issued, bank loans and the results of hedging transactions used to manage foreign exchange and interest rate movements.
2014 Restated
2013 Restated
2012 £m £m £m
Investment income: Available-for-sale investments:
Dividends received 10 2 2 Loans and receivables at amortised cost 184 124 168 Fair value through the income statement (held for trading):
Derivatives – foreign exchange contracts 82 115 121 Other1 70 64 165
346 305 456 Financing costs: Items in hedge relationships:
Other loans 265 228 210Interest rate swaps (196) (184) (178)Fair value hedging instrument 386 (81) (539)Fair value of hedged item (363) 112 511
Other financial liabilities held at amortised cost:Bank loans and overdrafts2 557 584 628Other loans3 770 736 785Interest credit on settlement of tax issues4 (15) (91) 23Equity put rights and similar arrangements5 143 136 81
Fair value through the income statement (held for trading):Derivatives – forward starting swaps and futures 1 105 244Other1 6 51 3
1,554 1,596 1,768 Net financing costs 1,208 1,291 1,312
Notes:1 Amounts for 2014 include net foreign exchange gains of £21 million (2013 £91 million loss; 2012 £55 million gain) arising from net foreign exchange movements on certain intercompany balances. Amounts for 2012 include
foreign exchange gains arising on investments held following the disposal of Vodafone Japan to SoftBank Corp.2 The Group capitalised £3 million of interest expense in the year (2013: £8 million; 2012: £25 million). The interest rate used to determine the amount of borrowing costs eligible for capitalisation was 5.4%.3 Amounts for 2014 include foreign exchange losses of £201 million.4 Amounts for 2014 and 2013 include a reduction of the provision for potential interest on tax issues. 5 Includes amounts in relation to the Group’s arrangements with its non-controlling interest partners in India.
Notes to the consolidated financial statements (continued)
Vodafone Group Plc Annual Report 2014118

6. Taxation
This note explains how our Group tax charge arises. The deferred tax section of the note also provides information on our expected future tax charges and sets out the tax assets held across the Group together with our view on whether or not we expect to be able to make use of these in the future. Accounting policiesIncome tax expense represents the sum of the current tax payable and deferred tax.
Current tax payable or recoverable is based on taxable profit for the year. Taxable profit differs from profit as reported in the income statement because some items of income or expense are taxable or deductible in different years or may never be taxable or deductible. The Group’s liability for current tax is calculated using UK and foreign tax rates and laws that have been enacted or substantively enacted by the reporting period date.
Deferred tax is the tax expected to be payable or recoverable in the future arising from temporary differences between the carrying amounts of assets and liabilities in the financial statements and the corresponding tax bases used in the computation of taxable profit. It is accounted for using the statement of financial position liability method. Deferred tax liabilities are generally recognised for all taxable temporary differences and deferred tax assets are recognised to the extent that it is probable that temporary differences or taxable profits will be available against which deductible temporary differences can be utilised.
Such assets and liabilities are not recognised if the temporary difference arises from the initial recognition (other than in a business combination) of assets and liabilities in a transaction that affects neither the taxable profit nor the accounting profit. Deferred tax liabilities are not recognised to the extent they arise from the initial recognition of non-tax deductible goodwill.
Deferred tax liabilities are recognised for taxable temporary differences arising on investments in subsidiaries and associates, and interests in joint arrangements, except where the Group is able to control the reversal of the temporary difference and it is probable that the temporary difference will not reverse in the foreseeable future.
The carrying amount of deferred tax assets is reviewed at each reporting period date and adjusted to reflect changes in the Group’s assessment that sufficient taxable profits will be available to allow all or part of the asset to be recovered.
Deferred tax is calculated at the tax rates that are expected to apply in the period when the liability is settled or the asset realised, based on tax rates that have been enacted or substantively enacted by the reporting period date.
Tax assets and liabilities are offset when there is a legally enforceable right to set off current tax assets against current tax liabilities and when they either relate to income taxes levied by the same taxation authority on either the same taxable entity or on different taxable entities which intend to settle the current tax assets and liabilities on a net basis.
Tax is charged or credited to the income statement, except when it relates to items charged or credited to other comprehensive income or directly to equity, in which case the tax is recognised in other comprehensive income or in equity.
Income tax expense
2014 Restated
2013 Restated
2012 £m £m £m
United Kingdom corporation tax expense/(income): Current year – – –Adjustments in respect of prior years 17 24 (4)
17 24 (4)Overseas current tax expense/(income):
Current year 3,114 1,062 1,118Adjustments in respect of prior years (25) (249) (42)
3,089 813 1,076Total current tax expense 3,106 837 1,072
Deferred tax on origination and reversal of temporary differences: United Kingdom deferred tax 57 (52) (8)Overseas deferred tax (19,745) (309) (359)
Total deferred tax income (19,688) (361) (367)Total income tax (income)/expense (16,582) 476 705
UK operating profits are more than offset by statutory allowances for capital investment in the UK network and systems plus ongoing interest costs including those arising from the £6.8 billion of spectrum payments to the UK government in 2000 and 2013.
Vodafone Group Plc Annual Report 2014118 119Overview
Strategy review Performance Governance Financials
Additional information

6. Taxation (continued)
Tax on discontinued operations 2014 2013 2012 £m £m £m
Tax charge on profit from ordinary activities of discontinued operations 1,709 1,750 1,289Tax charge relating to the gain or loss of discontinuance – – –Total tax charge on discontinued operations 1,709 1,750 1,289
Tax charged/(credited) directly to other comprehensive income
2014 Restated
2013 Restated
2012 £m £m £m
Current tax charge/(credit) – 4 (4)Deferred tax charge/(credit) 23 (37) (116)Total tax charged/(credited) directly to other comprehensive income 23 (33) (120)
Tax charged/(credited) directly to equity
2014 Restated
2013 Restated
2012 £m £m £m
Current tax charge/(credit) 12 (17) (1)Deferred tax credit – (1) (1)Total tax charged/(credited) directly to equity 12 (18) (2)
Factors affecting the tax expense for the yearThe table below explains the differences between the expected tax expense at the UK statutory tax rate of 23% (2013: 24% and 2012: 26%), and the Group’s total tax expense for each year.
2014 Restated
2013 Restated
2012 £m £m £m
Continuing (loss)/profit before tax as shown in the consolidated income statement (5,270) (3,483) 4,144Expected income tax (income)/expense at UK statutory tax rate (1,212) (836) 1,077Effect of different statutory tax rates of overseas jurisdictions (328) (9) 456Impairment losses with no tax effect 1,958 2,664 1,053Disposal of Group investments1 211 (10) (718)Effect of taxation of associates and joint ventures, reported within operating profit 61 129 78Recognition of deferred tax assets in Luxembourg and Germany2 (19,318) – –Tax charge on rationalisation and re-organisation of non-US assets prior to VZW disposal3 1,365 – –Deferred tax impact of previously unrecognised temporary differences including losses (164) (625) (634)Current tax impact of previously unrecognised temporary differences including losses – (74) –Effect of unrecognised temporary differences 215 (184) (285)Adjustments in respect of prior years (43) (234) (110)Gain on acquisition of CWW with no tax effect – (164) –Effect of secondary and irrecoverable taxes 37 94 159Deferred tax on overseas earnings 4 (4) –Effect of current year changes in statutory tax rates 158 (2) (3)Expenses not deductible for tax purposes and other items 210 104 199Tax on income derived from discontinued operations 418 – –Exclude taxation of associates (154) (373) (567)Income tax (income)/expense (16,582) 476 705
Notes:1 2014 relates to deemed disposal of Italy. 2012 relates to the disposal of SFR and Polkomtel. 2 See commentary regarding deferred tax asset recognition on page 122.3 Includes the US tax charge of £2,210 million on the rationalisation and reorganisation of non-US assets prior to the disposal of our interest in Verizon Wireless.
Notes to the consolidated financial statements (continued)
Vodafone Group Plc Annual Report 2014120
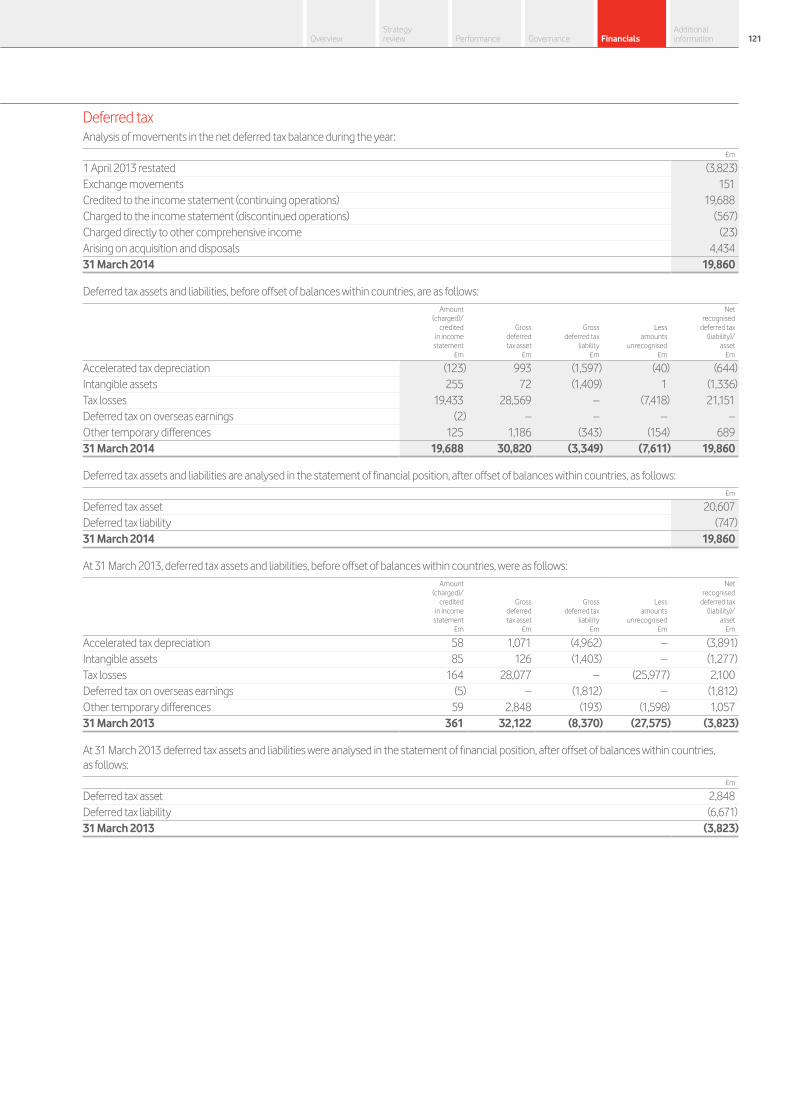
Deferred taxAnalysis of movements in the net deferred tax balance during the year:
£m
1 April 2013 restated (3,823)Exchange movements 151Credited to the income statement (continuing operations) 19,688Charged to the income statement (discontinued operations) (567)Charged directly to other comprehensive income (23)Arising on acquisition and disposals 4,43431 March 2014 19,860
Deferred tax assets and liabilities, before offset of balances within countries, are as follows: Amount Net (charged)/ recognised credited Gross Gross Less deferred tax in income deferred deferred tax amounts (liability)/ statement tax asset liability unrecognised asset £m £m £m £m £m
Accelerated tax depreciation (123) 993 (1,597) (40) (644)Intangible assets 255 72 (1,409) 1 (1,336)Tax losses 19,433 28,569 – (7,418) 21,151Deferred tax on overseas earnings (2) – – – –Other temporary differences 125 1,186 (343) (154) 68931 March 2014 19,688 30,820 (3,349) (7,611) 19,860
Deferred tax assets and liabilities are analysed in the statement of financial position, after offset of balances within countries, as follows: £m
Deferred tax asset 20,607Deferred tax liability (747)31 March 2014 19,860
At 31 March 2013, deferred tax assets and liabilities, before offset of balances within countries, were as follows: Amount Net (charged)/ recognised credited Gross Gross Less deferred tax in income deferred deferred tax amounts (liability)/ statement tax asset liability unrecognised asset £m £m £m £m £m
Accelerated tax depreciation 58 1,071 (4,962) – (3,891)Intangible assets 85 126 (1,403) – (1,277)Tax losses 164 28,077 – (25,977) 2,100Deferred tax on overseas earnings (5) – (1,812) – (1,812)Other temporary differences 59 2,848 (193) (1,598) 1,05731 March 2013 361 32,122 (8,370) (27,575) (3,823)
At 31 March 2013 deferred tax assets and liabilities were analysed in the statement of financial position, after offset of balances within countries, as follows:
£m
Deferred tax asset 2,848Deferred tax liability (6,671)31 March 2013 (3,823)
Vodafone Group Plc Annual Report 2014120 121Overview
Strategy review Performance Governance Financials
Additional information

6. Taxation (continued)
Factors affecting the tax charge in future yearsFactors that may affect the Group’s future tax charge include the impact of corporate restructurings, the resolution of open issues, future planning, corporate acquisitions and disposals, the use of brought forward tax losses and changes in tax legislation and tax rates.
The Group is routinely subject to audit by tax authorities in the territories in which it operates and, specifically, in India these are usually resolved through the Indian legal system. The Group considers each issue on its merits and, where appropriate, holds provisions in respect of the potential tax liability that may arise. However, the amount ultimately paid may differ materially from the amount accrued and could therefore affect the Group’s overall profitability and cash flows in future periods. See note 30 “Contingent liabilities” to the consolidated financial statements.
At 31 March 2014, the gross amount and expiry dates of losses available for carry forward are as follows: Expiring Expiring within within 5 years 6–10 years Unlimited Total £m £m £m £m
Losses for which a deferred tax asset is recognised 274 461 79,115 79,850Losses for which no deferred tax is recognised 1,281 519 26,318 28,118 1,555 980 105,433 107,968
At 31 March 2013, the gross amount and expiry dates of losses available for carry forward are as follows: Expiring Expiring within within 5 years 6–10 years Unlimited Total £m £m £m £m
Losses for which a deferred tax asset is recognised 343 – 8,423 8,766Losses for which no deferred tax is recognised 1,845 691 94,135 96,671 2,188 691 102,558 105,437
The losses arising on the write down of investments in Germany are available to use against both German federal and trade tax liabilities. Losses of £15,290 million (2013: £3,236 million) are included in the above table on which we have recognised a deferred tax asset as we expect the German business to continue to generate future taxable profits against which we can utilise these losses. In 2013 the Group did not recognise a deferred tax asset on £12,346 million of the losses as it was uncertain that these losses would be utilised.
Included above are losses amounting to £6,651 million (2013: £7,104 million) in respect of UK subsidiaries which are only available for offset against future capital gains and since it is uncertain whether these losses will be utilised, no deferred tax asset has been recognised. We have recognised a deferred tax asset against £442 million of these losses in the current year.
The losses above also include £73,734 million (2013: £70,644 million) that have arisen in overseas holding companies as a result of revaluations of those companies’ investments for local GAAP purposes. A deferred tax asset of £18,150 million (2013: £1,325 million) has been recognised in respect of £62,980 million (2013: £4,535 million) of these losses which relate to tax groups in Luxembourg where we expect the members of these tax groups to generate future taxable profits against which these losses will be used. No deferred tax asset is recognised in respect of the remaining £10,754 million of these losses as it is uncertain whether these losses will be utilised.
In addition to the above, we hold £7,642 million of losses in overseas holding companies from a former Cable & Wireless Worldwide Group company, for which no deferred tax asset has been recognised as it is uncertain whether these losses will be utilised.
The recognition of the additional deferred tax assets, which arose from losses in earlier years, was triggered by the agreement to dispose of the US Group whose principal asset was its 45% interest in Verizon Wireless, which removes significant uncertainty around both the availability of the losses in Germany and the future income streams in Luxembourg. The Group expects to use the losses over a significant number of years; the actual use of the losses is dependent on many factors which may change, including the level of profitability in both Germany and Luxembourg, changes in tax law and changes to the structure of the Group.
The remaining losses relate to a number of other jurisdictions across the Group. There are also £339 million (2013: £5,918 million) of unrecognised other temporary differences.
The Group holds no deferred tax liability (2013: £1,812 million) in respect of deferred taxation that would arise if temporary differences on investments in subsidiaries, associates and interests in joint arrangements were to be realised after the balance sheet date (see table above) following the Group’s disposal of its 45% stake in Verizon Wireless. No deferred tax liability has been recognised in respect of a further £22,985 million (2013: £47,978 million) of unremitted earnings of subsidiaries, associates and joint arrangements because the Group is in a position to control the timing of the reversal of the temporary difference and it is probable that such differences will not reverse in the foreseeable future. It is not practicable to estimate the amount of unrecognised deferred tax liabilities in respect of these unremitted earnings.
Notes to the consolidated financial statements (continued)
Vodafone Group Plc Annual Report 2014122

7. Discontinued operations
On 21 February 2014, we completed the sale of our US Group whose principal asset was its 45% interest in Verizon Wireless. The results of these discontinued operations are detailed below.Income statement and segment analysis of discontinued operations
2014 2013 2012£m £m £m
Share of result in associates 3,191 6,422 4,867Net financing income/(costs) 27 (56) (23)Profit before taxation 3,218 6,366 4,844Taxation relating to performance of discontinued operations (1,709) (1,750) (1,289)Post-tax profit from discontinued operations 1,509 4,616 3,555
Gain on disposal of discontinued operations2014 2013 2012
£m £m £m
Gain on disposal of discontinued operations before taxation (see note 28) 44,996 – –Other items arising from the disposal1 1,603 – –Net gain on disposal of discontinued operations 46,599 – –
Note:1 Includes dividends received from Verizon Wireless after the date of the announcement of the disposal
Profit for the financial year from discontinued operations 2014 2013 2012
£m £m £m
Profit for the financial year from discontinued operations 1,509 4,616 3,555Net gain on disposal of discontinued operations 46,599 – –Profit for the financial year from discontinued operations 48,108 4,616 3,555
Earnings per share from discontinued operations2014 2013 2012
Pence per share Pence per share Pence per share
– Basic 181.74p 17.20p 12.87p– Diluted 180.30p 17.20p 12.73p
Total comprehensive income for the financial year from discontinued operations2014 2013 2012
£m £m £m
Equity shareholders’ funds 48,108 4,616 3,555
Cash flows from discontinued operations2014 2013 2012
£m £m £m
Net cash flows from operating activities (2,617) (1,464) (175)Net cash flows from investing activities 4,830 4,798 4,318Net cash flows from financing activities (2,225) (5,164) (2,364)Net (decrease)/increase in cash and cash equivalents (12) (1,830) 1,779Cash and cash equivalents at the beginning of the financial year – 1,721 –Exchange gain/(loss) on cash and cash equivalents 12 109 (58)Cash and cash equivalents at the end of the financial year – – 1,721
Vodafone Group Plc Annual Report 2014122 123Overview
Strategy review Performance Governance Financials
Additional information
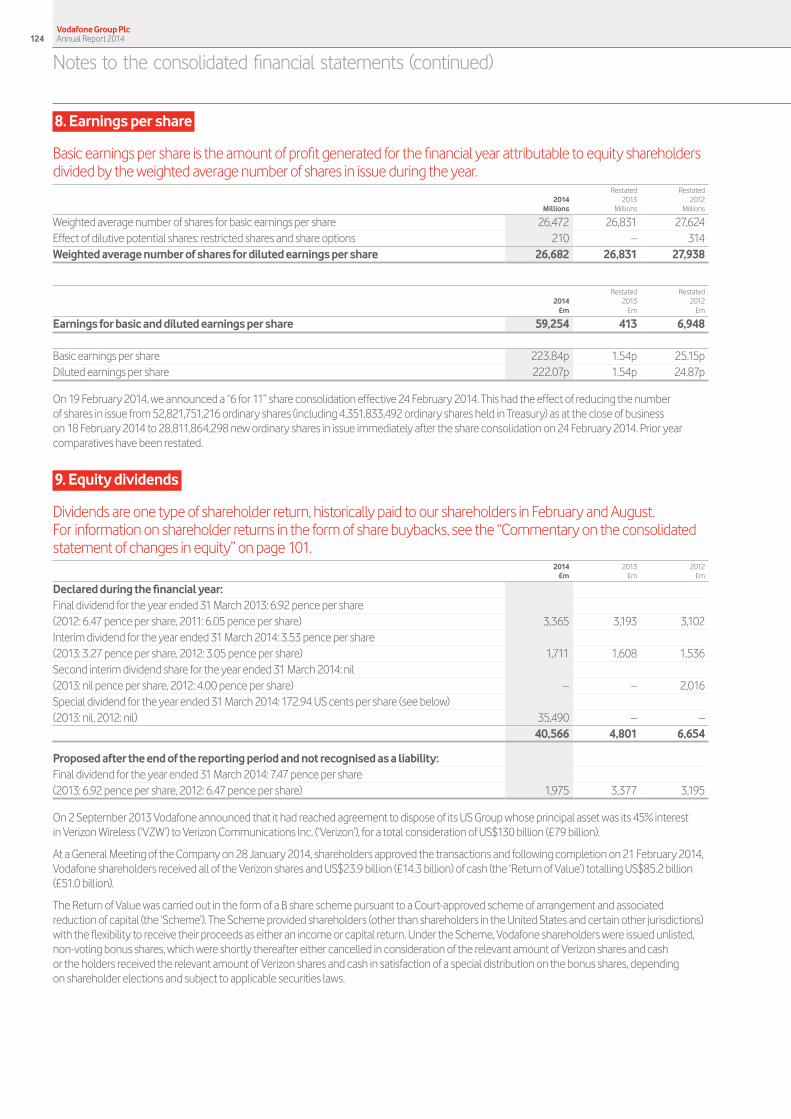
8. Earnings per share
Basic earnings per share is the amount of profit generated for the financial year attributable to equity shareholders divided by the weighted average number of shares in issue during the year.
2014 Restated
2013 Restated
2012 Millions Millions Millions
Weighted average number of shares for basic earnings per share 26,472 26,831 27,624Effect of dilutive potential shares: restricted shares and share options 210 – 314Weighted average number of shares for diluted earnings per share 26,682 26,831 27,938
2014£m
Restated2013
£m
Restated2012
£m
Earnings for basic and diluted earnings per share 59,254 413 6,948
Basic earnings per share 223.84p 1.54p 25.15pDiluted earnings per share 222.07p 1.54p 24.87p
On 19 February 2014, we announced a “6 for 11” share consolidation effective 24 February 2014. This had the effect of reducing the number of shares in issue from 52,821,751,216 ordinary shares (including 4,351,833,492 ordinary shares held in Treasury) as at the close of business on 18 February 2014 to 28,811,864,298 new ordinary shares in issue immediately after the share consolidation on 24 February 2014. Prior year comparatives have been restated.
9. Equity dividends
Dividends are one type of shareholder return, historically paid to our shareholders in February and August. For information on shareholder returns in the form of share buybacks, see the “Commentary on the consolidated statement of changes in equity” on page 101.
2014 2013 2012 £m £m £m
Declared during the financial year: Final dividend for the year ended 31 March 2013: 6.92 pence per share (2012: 6.47 pence per share, 2011: 6.05 pence per share) 3,365 3,193 3,102 Interim dividend for the year ended 31 March 2014: 3.53 pence per share (2013: 3.27 pence per share, 2012: 3.05 pence per share) 1,711 1,608 1,536 Second interim dividend share for the year ended 31 March 2014: nil(2013: nil pence per share, 2012: 4.00 pence per share) – – 2,016Special dividend for the year ended 31 March 2014: 172.94 US cents per share (see below) (2013: nil, 2012: nil) 35,490 – – 40,566 4,801 6,654
Proposed after the end of the reporting period and not recognised as a liability: Final dividend for the year ended 31 March 2014: 7.47 pence per share (2013: 6.92 pence per share, 2012: 6.47 pence per share) 1,975 3,377 3,195
On 2 September 2013 Vodafone announced that it had reached agreement to dispose of its US Group whose principal asset was its 45% interest in Verizon Wireless (‘VZW’) to Verizon Communications Inc. (‘Verizon’), for a total consideration of US$130 billion (£79 billion).
At a General Meeting of the Company on 28 January 2014, shareholders approved the transactions and following completion on 21 February 2014, Vodafone shareholders received all of the Verizon shares and US$23.9 billion (£14.3 billion) of cash (the ‘Return of Value’) totalling US$85.2 billion (£51.0 billion).
The Return of Value was carried out in the form of a B share scheme pursuant to a Court-approved scheme of arrangement and associated reduction of capital (the ‘Scheme’). The Scheme provided shareholders (other than shareholders in the United States and certain other jurisdictions) with the flexibility to receive their proceeds as either an income or capital return. Under the Scheme, Vodafone shareholders were issued unlisted, non-voting bonus shares, which were shortly thereafter either cancelled in consideration of the relevant amount of Verizon shares and cash or the holders received the relevant amount of Verizon shares and cash in satisfaction of a special distribution on the bonus shares, depending on shareholder elections and subject to applicable securities laws.
Notes to the consolidated financial statements (continued)
Vodafone Group Plc Annual Report 2014124

10. Intangible assets
Our statement of financial position contains significant intangible assets, mainly in relation to goodwill and licences and spectrum. Goodwill, which arises when we acquire a business and pay a higher amount than the fair value of its net assets primarily due to the synergies we expect to create, is not amortised but is subject to annual impairment reviews. Licences and spectrum are amortised over the life of the licence. For further details see “Critical accounting judgements” in note 1 “Basis of preparation” to the consolidated financial statements.Accounting policiesIdentifiable intangible assets are recognised when the Group controls the asset, it is probable that future economic benefits attributed to the asset will flow to the Group and the cost of the asset can be reliably measured.
GoodwillGoodwill arising on the acquisition of an entity represents the excess of the cost of acquisition over the Group’s interest in the net fair value of the identifiable assets, liabilities and contingent liabilities of the entity recognised at the date of acquisition.
Goodwill is initially recognised as an asset at cost and is subsequently measured at cost less any accumulated impairment losses. Goodwill is not subject to amortisation but is tested for impairment or whenever there is evidence that it may be required. Goodwill is denominated in the currency of the acquired entity and revalued to the closing exchange rate at each reporting period date.
Negative goodwill arising on an acquisition is recognised directly in the income statement.
On disposal of a subsidiary or a jointly controlled entity, the attributable amount of goodwill is included in the determination of the profit or loss recognised in the income statement on disposal.
Goodwill arising before the date of transition to IFRS, on 1 April 2004, has been retained at the previous UK GAAP amounts, subject to being tested for impairment at that date. Goodwill written off to reserves under UK GAAP prior to 1998 has not been reinstated and is not included in determining any subsequent profit or loss on disposal.
Finite lived intangible assetsIntangible assets with finite lives are stated at acquisition or development cost, less accumulated amortisation. The amortisation period and method is reviewed at least annually. Changes in the expected useful life or the expected pattern of consumption of future economic benefits embodied in the asset are accounted for by changing the amortisation period or method, as appropriate, and are treated as changes in accounting estimates.
Licence and spectrum feesAmortisation periods for licence and spectrum fees are determined primarily by reference to the unexpired licence period, the conditions for licence renewal and whether licences are dependent on specific technologies. Amortisation is charged to the income statement on a straight-line basis over the estimated useful lives from the commencement of related network services.
Computer softwareComputer software comprises computer software purchased from third parties as well as the cost of internally developed software. Computer software licences are capitalised on the basis of the costs incurred to acquire and bring into use the specific software. Costs that are directly associated with the production of identifiable and unique software products controlled by the Group, and are probable of producing future economic benefits are recognised as intangible assets. Direct costs include software development employee costs and directly attributable overheads.
Software integral to an item of hardware equipment is classified as property, plant and equipment.
Costs associated with maintaining computer software programs are recognised as an expense when they are incurred.
Internally developed software is recognised only if all of the following conditions are met:
a an asset is created that can be separately identified;
a it is probable that the asset created will generate future economic benefits; and
a the development cost of the asset can be measured reliably.
Amortisation is charged to the income statement on a straight-line basis over the estimated useful life from the date the software is available for use.
Other intangible assetsOther intangible assets, including brands and customer bases, are recorded at fair value at the date of acquisition. Amortisation is charged to the income statement, over the estimated useful lives of intangible assets from the date they are available for use, on a straight-line basis, with the exception of customer relationships which are amortised on a sum of digits basis. The amortisation basis adopted for each class of intangible asset reflects the Group’s consumption of the economic benefit from that asset.
Estimated useful livesThe estimated useful lives of finite lived intangible assets are as follows:
a Licence and spectrum fees 3–25 years a Computer software 3–5 years a Brands 1–10 years a Customer bases 2–7 years
125OverviewStrategy review Performance Governance Financials
Additional information

10. Intangible assets (continued)
Licences and Computer Goodwill spectrum software Other Total £m £m £m £m £m
Cost: 1 April 2012 restated 72,840 26,480 8,018 2,783 110,121 Exchange movements 417 (62) 49 (213) 191 Arising on acquisition 59 28 63 335 485 Additions – 2,430 1,307 – 3,737 Disposals of subsidiaries – (9) (554) – (563)Disposals – – (4) – (4)Other – 4 – – 4 31 March 2013 restated 73,316 28,871 8,879 2,905 113,971 Exchange movements (3,054) (1,757) (375) (434) (5,620)Arising on acquisition 6,859 1,319 464 2,861 11,503 Additions – 2,228 1,437 – 3,665 Disposals – (74) (296) – (370)Other – 5 103 – 108 31 March 2014 77,121 30,592 10,212 5,332 123,257
Accumulated impairment losses and amortisation: 1 April 2012 restated 45,024 10,886 5,471 2,162 63,543 Exchange movements 702 30 38 (153) 617 Amortisation charge for the year – 1,623 1,150 251 3,024 Impairment losses 3,200 – – – 3,200 Disposals of subsidiaries – (5) (545) – (550)Disposals – – (3) – (3)Other – – 1 – 1 31 March 2013 restated 48,926 12,534 6,112 2,260 69,832 Exchange movements (1,720) (732) (261) (338) (3,051)Amortisation charge for the year – 1,683 1,282 557 3,522 Impairment losses 6,600 – – – 6,600 Disposals – (65) (278) – (343)Other – – 9 – 9 31 March 2014 53,806 13,420 6,864 2,479 76,569
Net book value: 31 March 2013 restated 24,390 16,337 2,767 645 44,139 31 March 2014 23,315 17,172 3,348 2,853 46,688
For licences and spectrum and other intangible assets, amortisation is included within the cost of sales line within the consolidated income statement. Licences and spectrum with a net book value of £3,885 million (2013: £2,707 million) have been pledged as security against borrowings.
The net book value and expiry dates of the most significant licences are as follows:
2014 Restated
2013 Expiry date £m £m
Germany 2016/2020/2025 3,743 4,329Italy 2015/2021/2029 1,301 –UK 2021/2033 3,425 3,782India 2014–2030 3,885 2,702Qatar 2028 945 1,111Netherlands 2016/2029/2030 1,188 1,329
The remaining amortisation period for each of the licences in the table above corresponds to the expiry date of the respective licence. A summary of the Group’s most significant spectrum licences can be found on page 194.
Notes to the consolidated financial statements (continued)
Vodafone Group Plc Annual Report 2014126

11. Property, plant and equipment
We make significant investments in network equipment and infrastructure – the base stations and technology required to operate our networks – that form the majority of our tangible assets. All assets are depreciated over their useful economic lives. For further details on the estimation of useful economic lives, see “Critical accounting judgements” in note 1 “Basis of preparation” to the consolidated financial statements.Accounting policiesLand and buildings held for use are stated in the statement of financial position at their cost, less any subsequent accumulated depreciation and subsequent accumulated impairment losses.
Amounts for equipment, fixtures and fittings, which includes network infrastructure assets and which together comprise an all but insignificant amount of the Group’s property, plant and equipment, are stated at cost less accumulated depreciation and any accumulated impairment losses.
Assets in the course of construction are carried at cost, less any recognised impairment loss. Depreciation of these assets commences when the assets are ready for their intended use.
The cost of property, plant and equipment includes directly attributable incremental costs incurred in their acquisition and installation.
Depreciation is charged so as to write off the cost of assets, other than land, using the straight-line method, over their estimated useful lives, as follows:
Land and buildings a Freehold buildings 25–50 years a Leasehold premises the term of the lease
Equipment, fixtures and fittings a Network infrastructure 3–25 years a Other 3–10 years
Depreciation is not provided on freehold land.
Assets held under finance leases are depreciated over their expected useful lives on the same basis as owned assets or, where shorter, the term of the relevant lease.
The gain or loss arising on the disposal or retirement of an item of property, plant and equipment is determined as the difference between any sale proceeds and the carrying amount of the asset and is recognised in the income statement.
Vodafone Group Plc Annual Report 2014126 127Overview
Strategy review Performance Governance Financials
Additional information

11. Property, plant and equipment (continued)
Equipment, Land and fixtures buildings and fittings Total £m £m £m
Cost: 1 April 2012 restated 1,426 38,776 40,202 Exchange movements (20) (41) (61)Arising on acquisition 52 1,503 1,555 Additions 122 3,862 3,984 Disposals of subsidiaries (1) (28) (29)Disposals (18) (1,481) (1,499)Other 37 (143) (106)31 March 2013 restated 1,598 42,448 44,046 Exchange movements (99) (2,900) (2,999)Arising on acquisition 113 6,286 6,399 Additions 127 4,743 4,870 Disposals of subsidiaries – (15) (15)Disposals (93) (1,224) (1,317)Transfer of assets to joint operations – (672) (672)Other – (103) (103)31 March 2014 1,646 48,563 50,209
Accumulated depreciation and impairment: 1 April 2012 restated 584 23,610 24,194 Exchange movements 1 106 107 Charge for the year 97 3,540 3,637 Disposals of subsidiaries (1) (14) (15)Disposals (13) (1,329) (1,342)Other 31 (150) (119)31 March 2013 restated 699 25,763 26,462 Exchange movements (20) (1,477) (1,497)Charge for the year 99 3,939 4,038 Disposals of subsidiaries – (15) (15)Disposals (46) (1,099) (1,145)Transfer of assets to joint operations – (476) (476)Other – (9) (9)31 March 2014 732 26,626 27,358
Net book value: 31 March 2013 restated 899 16,685 17,584 31 March 2014 914 21,937 22,851
The net book value of land and buildings and equipment, fixtures and fittings includes £48 million and £413 million respectively (2013: £62 million and £281 million) in relation to assets held under finance leases. Included in the net book value of land and buildings and equipment, fixtures and fittings are assets in the course of construction, which are not depreciated, with a cost of £70 million and £1,617 million respectively (2013: £19 million and £1,399 million). Property, plant and equipment with a net book value of £1 million (2013: £357 million) has been pledged as security against borrowings.
Notes to the consolidated financial statements (continued)
Vodafone Group Plc Annual Report 2014128
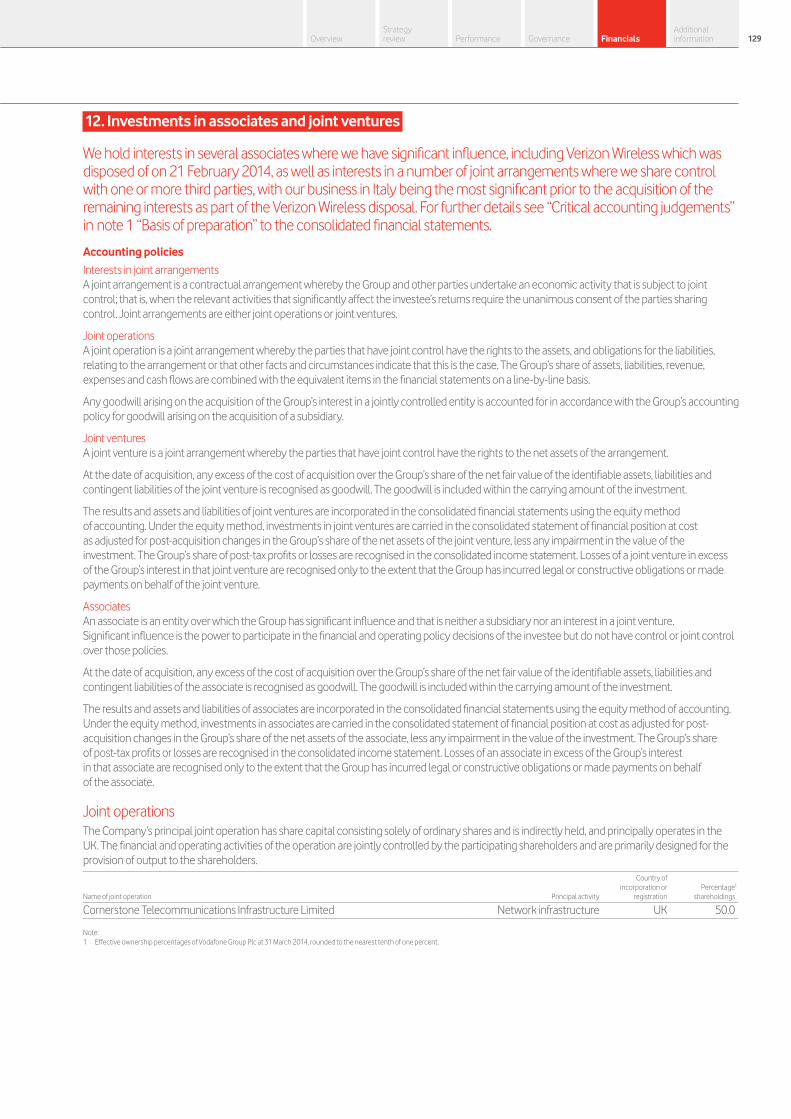
12. Investments in associates and joint ventures
We hold interests in several associates where we have significant influence, including Verizon Wireless which was disposed of on 21 February 2014, as well as interests in a number of joint arrangements where we share control with one or more third parties, with our business in Italy being the most significant prior to the acquisition of the remaining interests as part of the Verizon Wireless disposal. For further details see “Critical accounting judgements” in note 1 “Basis of preparation” to the consolidated financial statements.
Accounting policies
Interests in joint arrangementsA joint arrangement is a contractual arrangement whereby the Group and other parties undertake an economic activity that is subject to joint control; that is, when the relevant activities that significantly affect the investee’s returns require the unanimous consent of the parties sharing control. Joint arrangements are either joint operations or joint ventures.
Joint operationsA joint operation is a joint arrangement whereby the parties that have joint control have the rights to the assets, and obligations for the liabilities, relating to the arrangement or that other facts and circumstances indicate that this is the case. The Group’s share of assets, liabilities, revenue, expenses and cash flows are combined with the equivalent items in the financial statements on a line-by-line basis.
Any goodwill arising on the acquisition of the Group’s interest in a jointly controlled entity is accounted for in accordance with the Group’s accounting policy for goodwill arising on the acquisition of a subsidiary.
Joint venturesA joint venture is a joint arrangement whereby the parties that have joint control have the rights to the net assets of the arrangement.
At the date of acquisition, any excess of the cost of acquisition over the Group’s share of the net fair value of the identifiable assets, liabilities and contingent liabilities of the joint venture is recognised as goodwill. The goodwill is included within the carrying amount of the investment.
The results and assets and liabilities of joint ventures are incorporated in the consolidated financial statements using the equity method of accounting. Under the equity method, investments in joint ventures are carried in the consolidated statement of financial position at cost as adjusted for post-acquisition changes in the Group’s share of the net assets of the joint venture, less any impairment in the value of the investment. The Group’s share of post-tax profits or losses are recognised in the consolidated income statement. Losses of a joint venture in excess of the Group’s interest in that joint venture are recognised only to the extent that the Group has incurred legal or constructive obligations or made payments on behalf of the joint venture.
AssociatesAn associate is an entity over which the Group has significant influence and that is neither a subsidiary nor an interest in a joint venture. Significant influence is the power to participate in the financial and operating policy decisions of the investee but do not have control or joint control over those policies.
At the date of acquisition, any excess of the cost of acquisition over the Group’s share of the net fair value of the identifiable assets, liabilities and contingent liabilities of the associate is recognised as goodwill. The goodwill is included within the carrying amount of the investment.
The results and assets and liabilities of associates are incorporated in the consolidated financial statements using the equity method of accounting. Under the equity method, investments in associates are carried in the consolidated statement of financial position at cost as adjusted for post-acquisition changes in the Group’s share of the net assets of the associate, less any impairment in the value of the investment. The Group’s share of post-tax profits or losses are recognised in the consolidated income statement. Losses of an associate in excess of the Group’s interest in that associate are recognised only to the extent that the Group has incurred legal or constructive obligations or made payments on behalf of the associate.
Joint operationsThe Company’s principal joint operation has share capital consisting solely of ordinary shares and is indirectly held, and principally operates in the UK. The financial and operating activities of the operation are jointly controlled by the participating shareholders and are primarily designed for the provision of output to the shareholders.
Name of joint operation Principal activity
Country of incorporation or
registrationPercentage1
shareholdings
Cornerstone Telecommunications Infrastructure Limited Network infrastructure UK 50.0
Note:1 Effective ownership percentages of Vodafone Group Plc at 31 March 2014, rounded to the nearest tenth of one percent.
Vodafone Group Plc Annual Report 2014128 129Overview
Strategy review Performance Governance Financials
Additional information
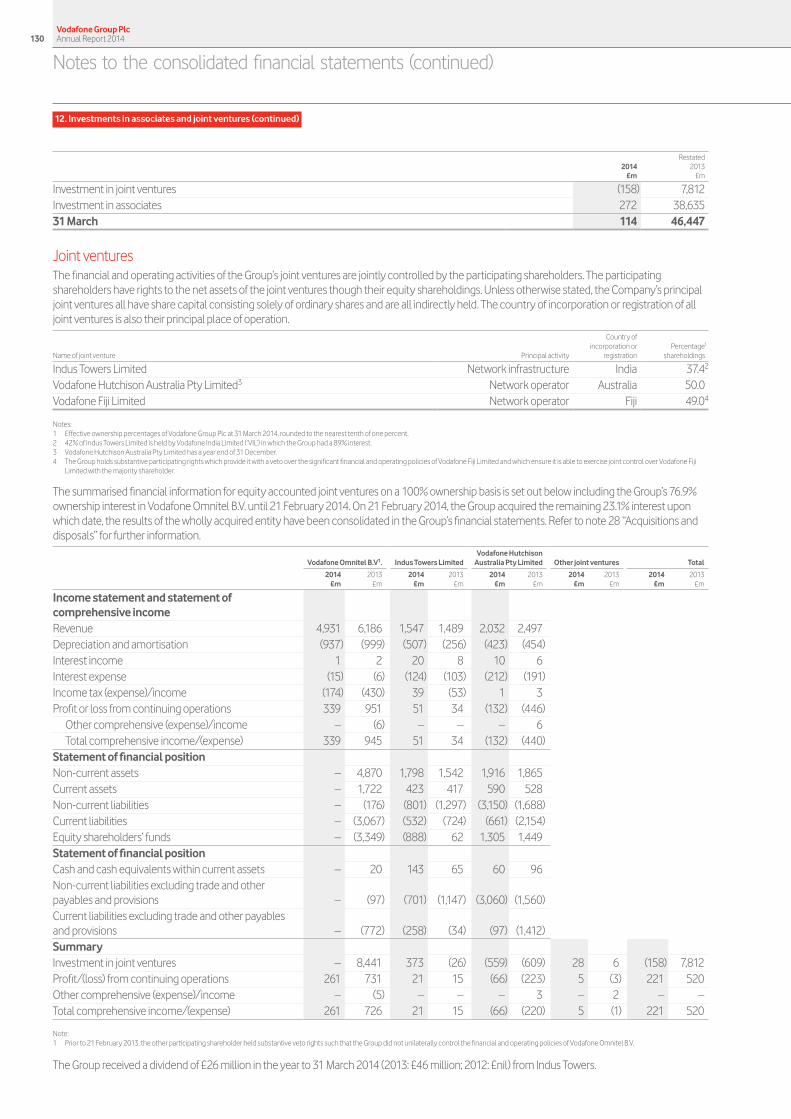
12. Investments in associates and joint ventures (continued)
2014 Restated
2013 £m £m
Investment in joint ventures (158) 7,812Investment in associates 272 38,63531 March 114 46,447
Joint venturesThe financial and operating activities of the Group’s joint ventures are jointly controlled by the participating shareholders. The participating shareholders have rights to the net assets of the joint ventures though their equity shareholdings. Unless otherwise stated, the Company’s principal joint ventures all have share capital consisting solely of ordinary shares and are all indirectly held. The country of incorporation or registration of all joint ventures is also their principal place of operation.
Name of joint venture Principal activity
Country of incorporation or
registrationPercentage1
shareholdings
Indus Towers Limited Network infrastructure India 37.42
Vodafone Hutchison Australia Pty Limited3 Network operator Australia 50.0 Vodafone Fiji Limited Network operator Fiji 49.04
Notes:1 Effective ownership percentages of Vodafone Group Plc at 31 March 2014, rounded to the nearest tenth of one percent.2 42% of Indus Towers Limited is held by Vodafone India Limited (‘VIL’) in which the Group had a 89% interest.3 Vodafone Hutchison Australia Pty Limited has a year end of 31 December.4 The Group holds substantive participating rights which provide it with a veto over the significant financial and operating policies of Vodafone Fiji Limited and which ensure it is able to exercise joint control over Vodafone Fiji
Limited with the majority shareholder.
The summarised financial information for equity accounted joint ventures on a 100% ownership basis is set out below including the Group’s 76.9% ownership interest in Vodafone Omnitel B.V. until 21 February 2014. On 21 February 2014, the Group acquired the remaining 23.1% interest upon which date, the results of the wholly acquired entity have been consolidated in the Group’s financial statements. Refer to note 28 “Acquisitions and disposals” for further information.
Vodafone Omnitel B.V1. Indus Towers LimitedVodafone Hutchison
Australia Pty Limited Other joint ventures Total
2014
£m2013
£m2014
£m2013
£m2014
£m2013
£m2014
£m2013
£m2014
£m2013
£m
Income statement and statement of comprehensive incomeRevenue 4,931 6,186 1,547 1,489 2,032 2,497Depreciation and amortisation (937) (999) (507) (256) (423) (454)Interest income 1 2 20 8 10 6Interest expense (15) (6) (124) (103) (212) (191)Income tax (expense)/income (174) (430) 39 (53) 1 3Profit or loss from continuing operations 339 951 51 34 (132) (446)
Other comprehensive (expense)/income – (6) – – – 6Total comprehensive income/(expense) 339 945 51 34 (132) (440)
Statement of financial positionNon-current assets – 4,870 1,798 1,542 1,916 1,865Current assets – 1,722 423 417 590 528Non-current liabilities – (176) (801) (1,297) (3,150) (1,688)Current liabilities – (3,067) (532) (724) (661) (2,154)Equity shareholders’ funds – (3,349) (888) 62 1,305 1,449Statement of financial positionCash and cash equivalents within current assets – 20 143 65 60 96Non-current liabilities excluding trade and other payables and provisions – (97) (701) (1,147) (3,060) (1,560)Current liabilities excluding trade and other payables and provisions – (772) (258) (34) (97) (1,412)SummaryInvestment in joint ventures – 8,441 373 (26) (559) (609) 28 6 (158) 7,812Profit/(loss) from continuing operations 261 731 21 15 (66) (223) 5 (3) 221 520Other comprehensive (expense)/income – (5) – – – 3 – 2 – –Total comprehensive income/(expense) 261 726 21 15 (66) (220) 5 (1) 221 520
Note:1 Prior to 21 February 2013, the other participating shareholder held substantive veto rights such that the Group did not unilaterally control the financial and operating policies of Vodafone Omnitel B.V.
The Group received a dividend of £26 million in the year to 31 March 2014 (2013: £46 million; 2012: £nil) from Indus Towers.
Notes to the consolidated financial statements (continued)
Vodafone Group Plc Annual Report 2014130

AssociatesUnless otherwise stated, the Company’s principal associates all have share capital consisting solely of ordinary shares and are all indirectly held. The country of incorporation or registration of all associates is also their principal place of operation.
Name of associate Principal activity
Country of incorporation or
registrationPercentage1
shareholdings
Safaricom Limited2,3 Network operator Kenya 40.0
Notes:1 Effective ownership percentages of Vodafone Group Plc at 31 March 2014, rounded to the nearest tenth of one percent.2 The Group also holds two non-voting shares.3 At 31 March 2014 the fair value of Safaricom Limited was KES 198 billion (£1,371 million) based on the closing quoted share price on the Nairobi Stock Exchange.
On 21 February 2014, the Group disposed of its 45% interest in Cellco Partnership which traded under the name Verizon Wireless. Consequently, comparative information has been restated to reflect the continuing operations of the business. Results from discontinued operations are disclosed in note 7 “Discontinued operations” to the consolidated financial statements. The summarised financial information showing the Group’s share of equity accounted associates is set out below.
Cellco Partnership Other associates Total
2014
£m2013
£m2014
£m2013
£m2014
£m2013
£m
Income statement and statement of comprehensive incomeRevenue 22,122 48,827
Depreciation and amortisation (2,186) (5,145)
Interest income 1 3
Interest expense (38) (60)
Income tax (expense)/income (111) 29
Post-tax profit of loss from discontinued operations 7,092 14,272
Other comprehensive expense (2) –
Total comprehensive income 7,090 14,272
Statement of financial positionNon-current assets – 72,755Current assets – 9,764Non-current liabilities – (6,328)Current liabilities – (9,267)Non-controlling interests – (1,366)Equity shareholders’ funds – (65,558)Statement of financial positionCash and cash equivalents within current assets – 2,894Non-current liabilities excluding trade and other payables and provisions – (5,034)Current liabilities excluding trade and other payables and provisions – (3,208)SummaryInvestment in associates – 38,373 272 262 272 38,635Profit or loss from continuing operations – – 57 55 57 55Post-tax profit from discontinued operations 3,191 6,422 – – 3,191 6,422Other comprehensive expense (1) – – – (1) –Total comprehensive income 3,190 6,422 57 55 3,247 6,477
The Group received £4,828 million of dividends in the year to 31 March 2014 (2013: £4,798 million, 2012: £3,820 million) from Cellco Partnership.
Vodafone Group Plc Annual Report 2014130 131Overview
Strategy review Performance Governance Financials
Additional information

13. Other investments
We hold a number of other listed and unlisted investments, mainly comprising US$5.25 billion of loan notes from Verizon Communications.Accounting policiesOther investments are recognised and derecognised on a trade date where a purchase or sale of an investment is under a contract whose terms require delivery of the investment within the timeframe established by the market concerned, and are initially measured at fair value, including transaction costs.
Other investments classified as held for trading and available-for-sale are stated at fair value. Where securities are held for trading purposes, gains and losses arising from changes in fair value are included in net profit or loss for the period. For available-for-sale investments, gains and losses arising from changes in fair value are recognised directly in equity, until the security is disposed of or is determined to be impaired, at which time the cumulative gain or loss previously recognised in equity, determined using the weighted average cost method, is included in the net profit or loss for the period.
Other investments classified as loans and receivables are stated at amortised cost using the effective interest method, less any impairment.
2014 Restated
2013 £m £m
Included within non-current assets: Listed securities:
Equity securities 13 3Unlisted securities:
Equity securities 228 570Public debt and bonds 141 134Other debt and bonds 3,171 66
3,553 773
The listed and unlisted securities are classified as available-for-sale. Public debt and bonds are classified as held for trading, and other debt and bonds which are not quoted in an active market, are classified as loans and receivables.
Unlisted equity investments are recorded at fair value where appropriate.
Other debt and bonds includes loan notes of US$5.25 billion (£3,151 million) issued by Verizon Communications Inc. as part of the Group’s disposal of its interest in Verizon Wireless.
Current other investments comprise the following, of which public debt and bonds are classified as held for trading.
2014 Restated
2013 £m £m
Included within current assets:Public debt and bonds 938 1,130Other debt and bonds 2,957 3,816Cash held in restricted deposits 524 404 4,419 5,350
Other debt and bonds includes £2,953 million of assets held for trading which include £1,979 million (2013: £3,000 million) of assets held in managed investment funds with liquidity of up to 90 days, £830 million (2013: £643 million) of short-term securitised investments with original maturities of up to six months, and collateral paid on derivative financial instruments of £144 million (2013: £169 million).
Current public debt and bonds include government bonds of £852 million (2013: £1,076 million) which consist of highly liquid index linked gilts with less than four years to maturity held on an effective floating rate basis.
For public debt and bonds, other debt and bonds and cash held in restricted deposits, the carrying amount approximates fair value.
Notes to the consolidated financial statements (continued)
Vodafone Group Plc Annual Report 2014132
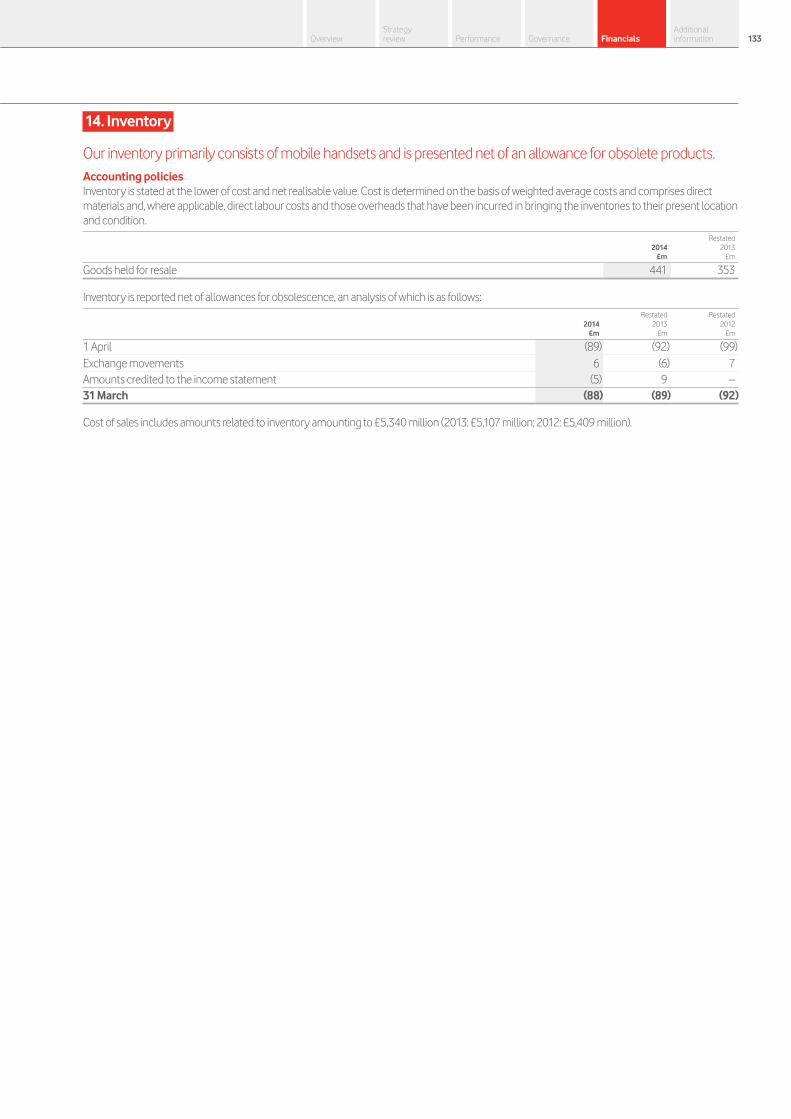
14. Inventory
Our inventory primarily consists of mobile handsets and is presented net of an allowance for obsolete products.Accounting policiesInventory is stated at the lower of cost and net realisable value. Cost is determined on the basis of weighted average costs and comprises direct materials and, where applicable, direct labour costs and those overheads that have been incurred in bringing the inventories to their present location and condition.
2014 Restated
2013 £m £m
Goods held for resale 441 353
Inventory is reported net of allowances for obsolescence, an analysis of which is as follows:
2014 Restated
2013 Restated
2012 £m £m £m
1 April (89) (92) (99)Exchange movements 6 (6) 7 Amounts credited to the income statement (5) 9 –31 March (88) (89) (92)
Cost of sales includes amounts related to inventory amounting to £5,340 million (2013: £5,107 million; 2012: £5,409 million).
Vodafone Group Plc Annual Report 2014132 133Overview
Strategy review Performance Governance Financials
Additional information
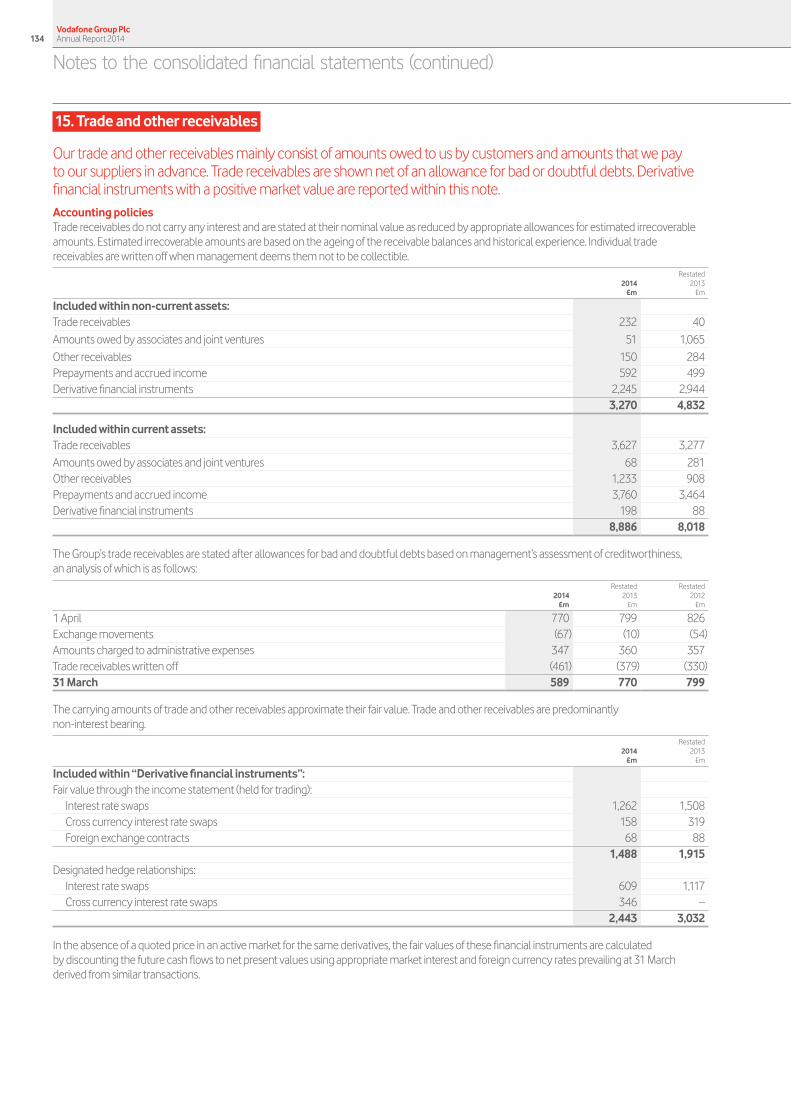
15. Trade and other receivables
Our trade and other receivables mainly consist of amounts owed to us by customers and amounts that we pay to our suppliers in advance. Trade receivables are shown net of an allowance for bad or doubtful debts. Derivative financial instruments with a positive market value are reported within this note.Accounting policiesTrade receivables do not carry any interest and are stated at their nominal value as reduced by appropriate allowances for estimated irrecoverable amounts. Estimated irrecoverable amounts are based on the ageing of the receivable balances and historical experience. Individual trade receivables are written off when management deems them not to be collectible.
2014 Restated
2013 £m £m
Included within non-current assets: Trade receivables 232 40Amounts owed by associates and joint ventures 51 1,065Other receivables 150 284Prepayments and accrued income 592 499Derivative financial instruments 2,245 2,944 3,270 4,832
Included within current assets:Trade receivables 3,627 3,277Amounts owed by associates and joint ventures 68 281Other receivables 1,233 908Prepayments and accrued income 3,760 3,464Derivative financial instruments 198 88 8,886 8,018
The Group’s trade receivables are stated after allowances for bad and doubtful debts based on management’s assessment of creditworthiness, an analysis of which is as follows:
2014 Restated
2013 Restated
2012 £m £m £m
1 April 770 799 826Exchange movements (67) (10) (54)Amounts charged to administrative expenses 347 360 357Trade receivables written off (461) (379) (330)31 March 589 770 799
The carrying amounts of trade and other receivables approximate their fair value. Trade and other receivables are predominantly non-interest bearing.
2014 Restated
2013 £m £m
Included within “Derivative financial instruments”: Fair value through the income statement (held for trading):
Interest rate swaps 1,262 1,508 Cross currency interest rate swaps 158 319Foreign exchange contracts 68 88
1,488 1,915 Designated hedge relationships:
Interest rate swaps 609 1,117 Cross currency interest rate swaps 346 –
2,443 3,032
In the absence of a quoted price in an active market for the same derivatives, the fair values of these financial instruments are calculated by discounting the future cash flows to net present values using appropriate market interest and foreign currency rates prevailing at 31 March derived from similar transactions.
Notes to the consolidated financial statements (continued)
Vodafone Group Plc Annual Report 2014134

16. Trade and other payables
Our trade and other payables mainly consist of amounts we owe to our suppliers that have been invoiced or are accrued. They also include taxes and social security amounts due in relation to our role as an employer. Derivative financial instruments with a negative market value are reported within this note.Accounting policiesTrade payables are not interest bearing and are stated at their nominal value.
2014 Restated
2013 £m £m
Included within non-current liabilities: Derivative financial instruments 811 982Other payables 72 105 Accruals and deferred income 456 220 1,339 1,307
Included within current liabilities: Trade payables 4,710 3,781 Amounts owed to associates and joint ventures 51 54 Other taxes and social security payable 1,047 1,059 Derivative financial instruments 70 119 Other payables 678 447 Accruals and deferred income 8,900 8,472 15,456 13,932
The carrying amounts of trade and other payables approximate their fair value. The fair values of the derivative financial instruments are calculated by discounting the future cash flows to net present values using appropriate market interest and foreign currency rates prevailing at 31 March.
2014 Restated
2013 £m £m
Included within “Derivative financial instruments”: Fair value through the income statement (held for trading):
Interest rate swaps 430 1,013 Cross currency interest rate swaps 12 –Foreign exchange contracts 29 44
471 1,057 Designated hedge relationships
Interest rate swaps 205 44 Cross currency interest rate swaps 205 –
881 1,101
Vodafone Group Plc Annual Report 2014134 135Overview
Strategy review Performance Governance Financials
Additional information
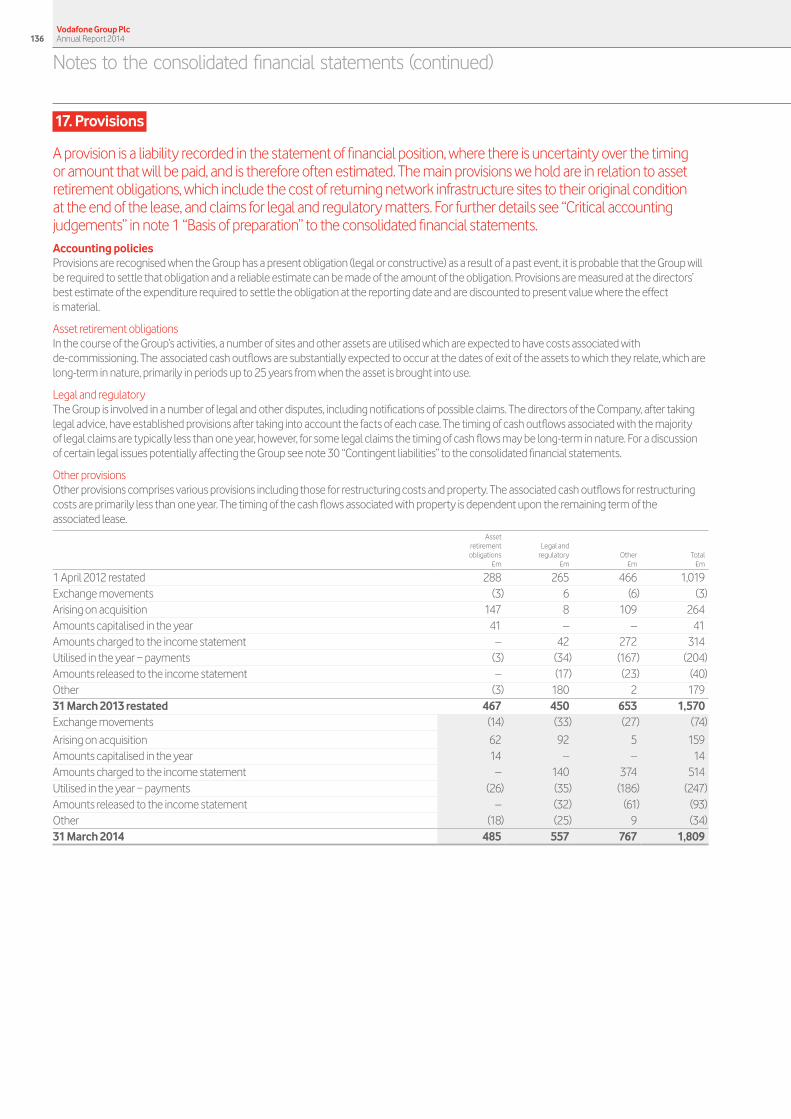
17. Provisions
A provision is a liability recorded in the statement of financial position, where there is uncertainty over the timing or amount that will be paid, and is therefore often estimated. The main provisions we hold are in relation to asset retirement obligations, which include the cost of returning network infrastructure sites to their original condition at the end of the lease, and claims for legal and regulatory matters. For further details see “Critical accounting judgements” in note 1 “Basis of preparation” to the consolidated financial statements.Accounting policiesProvisions are recognised when the Group has a present obligation (legal or constructive) as a result of a past event, it is probable that the Group will be required to settle that obligation and a reliable estimate can be made of the amount of the obligation. Provisions are measured at the directors’ best estimate of the expenditure required to settle the obligation at the reporting date and are discounted to present value where the effect is material.
Asset retirement obligationsIn the course of the Group’s activities, a number of sites and other assets are utilised which are expected to have costs associated with de-commissioning. The associated cash outflows are substantially expected to occur at the dates of exit of the assets to which they relate, which are long-term in nature, primarily in periods up to 25 years from when the asset is brought into use.
Legal and regulatoryThe Group is involved in a number of legal and other disputes, including notifications of possible claims. The directors of the Company, after taking legal advice, have established provisions after taking into account the facts of each case. The timing of cash outflows associated with the majority of legal claims are typically less than one year, however, for some legal claims the timing of cash flows may be long-term in nature. For a discussion of certain legal issues potentially affecting the Group see note 30 “Contingent liabilities” to the consolidated financial statements.
Other provisionsOther provisions comprises various provisions including those for restructuring costs and property. The associated cash outflows for restructuring costs are primarily less than one year. The timing of the cash flows associated with property is dependent upon the remaining term of the associated lease.
Asset retirement Legal and obligations regulatory Other Total £m £m £m £m
1 April 2012 restated 288 265 466 1,019Exchange movements (3) 6 (6) (3)Arising on acquisition 147 8 109 264Amounts capitalised in the year 41 – – 41Amounts charged to the income statement – 42 272 314Utilised in the year − payments (3) (34) (167) (204)Amounts released to the income statement – (17) (23) (40)Other (3) 180 2 17931 March 2013 restated 467 450 653 1,570 Exchange movements (14) (33) (27) (74)
Arising on acquisition 62 92 5 159Amounts capitalised in the year 14 – – 14Amounts charged to the income statement – 140 374 514Utilised in the year − payments (26) (35) (186) (247)Amounts released to the income statement – (32) (61) (93)Other (18) (25) 9 (34)31 March 2014 485 557 767 1,809
Notes to the consolidated financial statements (continued)
Vodafone Group Plc Annual Report 2014136

Provisions have been analysed between current and non-current as follows:
31 March 2014 Asset retirement Legal and obligations regulatory Other Total £m £m £m £m
Current liabilities 14 271 678 963Non-current liabilities 471 286 89 846 485 557 767 1,809
31 March 2013 Asset retirement Legal and obligations regulatory Other Total £m £m £m £m
Current liabilities 11 209 495 715 Non-current liabilities 456 241 158 855 467 450 653 1,570
18. Called up share capital
Called up share capital is the number of shares in issue at their par value. A number of shares were allotted during the year in relation to employee share schemes. Accounting policiesEquity instruments issued by the Group are recorded at the proceeds received, net of direct issuance costs
2014 2013
Number £m Number £m
Ordinary shares of 2020/21 US cents each allotted, issued and fully paid:1 1 April 53,820,386,309 3,866 53,815,007,289 3,866 Allotted during the year 1,423,737 – 5,379,020 – Consolidated during the year2 (24,009,886,918) – – –Cancelled during the year (1,000,000,000) (74) – – 31 March 28,811,923,128 3,792 53,820,386,309 3,866
Note:1 At 31 March 2014, the Group held 2,371,962,907 (2013: 4,901,767,844) treasury shares with a nominal value of £312 million (2013: £352 million). The market value of shares held was £5,225 million (2013: £9,147 million).
During the year 103,748,921 (2013: 161,289,620) treasury shares were reissued under Group share option schemes. 2 On 19 February 2014, we announced a “6 for 11” share consolidation effective 24 February 2014. This had the effect of reducing the number of shares in issue from 52,821,751,216 ordinary shares (including 4,351,833,492
ordinary shares held in Treasury) as at the close of business on 18 February 2014 to 28,811,864,298 new ordinary shares in issue immediately after the share consolidation on 24 February 2014.
During the year, we issued 14,732,741,283 B shares of US$1.88477 per share and 33,737,176,433 C shares of US$0.00001 per share as part of the Return of Value following the disposal of our US Group, whose principal asset was its 45% stake in Verizon Wireless. The B shares were cancelled as part of the Return of Value. The C shares were reclassified as deferred shares with no substantive rights as part of the Return of Value and transferred to LDC (Shares) Limited (‘LDC’). After 22 February 2015 and without prior notice we may repurchase, or be required by LDC to repurchase, and then subsequently cancel all deferred shares for a total price of not more than one cent for all deferred shares repurchased.
Allotted during the year Nominal Net value proceeds Number £m £m
UK share awards – – – US share awards 1,423,737 – – Total share awards 1,423,737 – –
Vodafone Group Plc Annual Report 2014136 137Overview
Strategy review Performance Governance Financials
Additional information
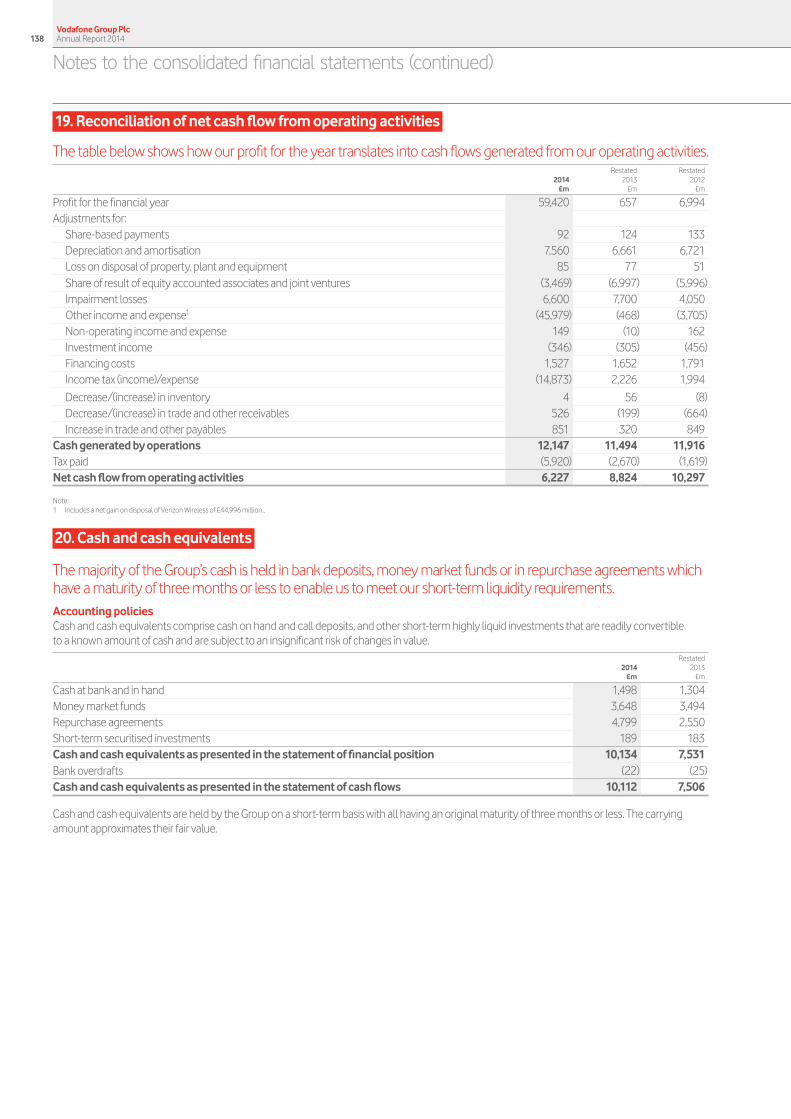
19. Reconciliation of net cash flow from operating activities
The table below shows how our profit for the year translates into cash flows generated from our operating activities.
2014 Restated
2013 Restated
2012 £m £m £m
Profit for the financial year 59,420 657 6,994Adjustments for:
Share-based payments 92 124 133Depreciation and amortisation 7,560 6,661 6,721Loss on disposal of property, plant and equipment 85 77 51Share of result of equity accounted associates and joint ventures (3,469) (6,997) (5,996)Impairment losses 6,600 7,700 4,050Other income and expense1 (45,979) (468) (3,705)Non-operating income and expense 149 (10) 162Investment income (346) (305) (456)Financing costs 1,527 1,652 1,791Income tax (income)/expense (14,873) 2,226 1,994
Decrease/(increase) in inventory 4 56 (8)Decrease/(increase) in trade and other receivables 526 (199) (664)Increase in trade and other payables 851 320 849
Cash generated by operations 12,147 11,494 11,916 Tax paid (5,920) (2,670) (1,619)Net cash flow from operating activities 6,227 8,824 10,297
Note: 1 Includes a net gain on disposal of Verizon Wireless of £44,996 million..
20. Cash and cash equivalents
The majority of the Group’s cash is held in bank deposits, money market funds or in repurchase agreements which have a maturity of three months or less to enable us to meet our short-term liquidity requirements.Accounting policiesCash and cash equivalents comprise cash on hand and call deposits, and other short-term highly liquid investments that are readily convertible to a known amount of cash and are subject to an insignificant risk of changes in value.
2014 Restated
2013 £m £m
Cash at bank and in hand 1,498 1,304Money market funds 3,648 3,494Repurchase agreements 4,799 2,550Short-term securitised investments 189 183Cash and cash equivalents as presented in the statement of financial position 10,134 7,531Bank overdrafts (22) (25)Cash and cash equivalents as presented in the statement of cash flows 10,112 7,506
Cash and cash equivalents are held by the Group on a short-term basis with all having an original maturity of three months or less. The carrying amount approximates their fair value.
Notes to the consolidated financial statements (continued)
Vodafone Group Plc Annual Report 2014138

21. Borrowings
The Group’s sources of borrowing for funding and liquidity purposes come from a range of committed bank facilities and through short-term and long-term issuances in the capital markets including bond and commercial paper issues and bank loans. We manage the basis on which we incur interest on debt between fixed interest rates and floating interest rates depending on market conditions using interest rate derivatives. The Group enters into foreign exchange contracts to mitigate the impact of exchange rate movements on certain monetary items.
Accounting policies
Capital market and bank borrowingsInterest bearing loans and overdrafts are initially measured at fair value (which is equal to cost at inception), and are subsequently measured at amortised cost, using the effective interest rate method, except where they are identified as a hedged item in a designated hedge relationship. Any difference between the proceeds net of transaction costs and the amount due on settlement or redemption of borrowings is recognised over the term of the borrowing.
Carrying value and fair value information
2014 Restated
2013
Short-term Long-term Short-term Long-term borrowings borrowings Total borrowings borrowings Total £m £m £m £m £m £m
Financial liabilities measured at amortised cost: Bank loans 1,263 4,647 5,910 2,440 3,077 5,517 Bank overdrafts 22 – 22 25 – 25 Redeemable preference shares – – – – 1,355 1,355 Commercial paper 950 – 950 4,054 – 4,054 Bonds 1,783 4,465 6,248 2,133 15,698 17,831 Other liabilities1,2 3,729 110 3,839 3,148 753 3,901
Bonds in designated hedge relationships – 12,232 12,232 – 7,021 7,021 7,747 21,454 29,201 11,800 27,904 39,704
Notes: 1 At 31 March 2014, amount includes £1,185 million (2013: £1,151 million) in relation to collateral support agreements. 2 At 31 March 2014, amount includes £882 million (2013: £899 million) in relation to the Piramal Healthcare option disclosed in note 22 “Liquidity and capital resources”.
Bank loans include INR 425 billion of loans held by Vodafone India Limited (‘VIL’) and its subsidiaries (the ‘VIL Group’). The VIL Group has a number of security arrangements supporting certain licences secured under the terms of agreements between the Group, the Department of Telecommunications, and the Government of India including certain share pledges of the shares within the VIL Group. The terms and conditions of the security arrangements mean that should members of the VIL Group not meet all of their loan payment and performance obligations, the lenders may sell the pledged shares and enforce rights over the certain licences under the terms of the tri-party agreements to recover their losses, with any remaining sales proceeds being returned to the VIL Group. Each of the eight legal entities within the VIL Group provide cross-guarantees to the lenders in respect of debt contracted by the other entities.
The fair value and carrying value of the Group’s short-term borrowings is as follows:
Sterling equivalent nominal value Fair value Carrying value
2014 Restated
2013 2014 Restated
2013 2014 Restated
2013 £m £m £m £m £m £m
Financial liabilities measured at amortised cost 5,655 9,385 5,964 9,790 5,964 9,667
Bonds: 1,756 2,094 1,771 2,150 1,783 2,133Czech koruna floating rate note due June 2013 – 18 – 18 – 18 Euro floating rate note due September 2013 – 646 – 647 – 645 5.0% US dollar 1,000 million bond due December 2013 – 658 – 679 – 678 6.875% euro 1,000 million bond due December 2013 – 772 – 806 – 792 Euro floating rate note due June 2014 929 – 930 – 930 –4.625% sterling 350 million bond due September 2014 302 – 307 – 315 –4.625% sterling 525 million bond due September 2014 525 – 534 – 538 –
Short-term borrowings 7,411 11,479 7,735 11,940 7,747 11,800
Vodafone Group Plc Annual Report 2014138 139Overview
Strategy review Performance Governance Financials
Additional information
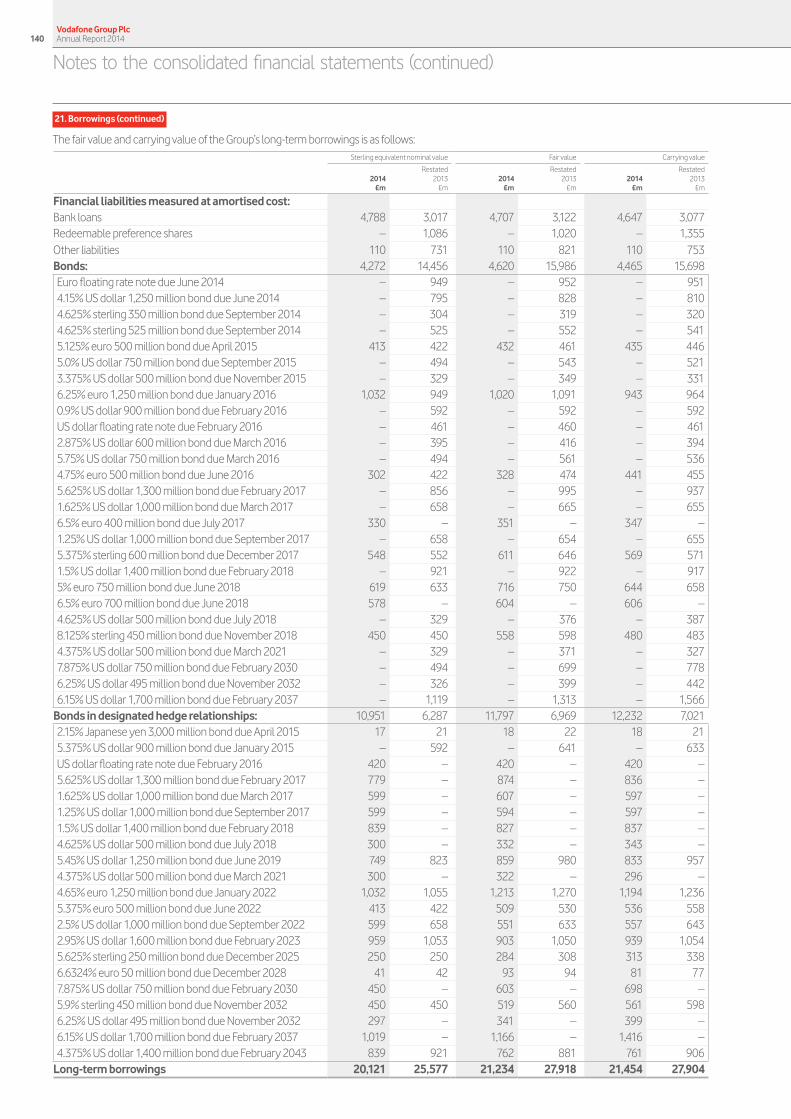
21. Borrowings (continued)
The fair value and carrying value of the Group’s long-term borrowings is as follows:
Sterling equivalent nominal value Fair value Carrying value
2014 Restated
2013 2014 Restated
2013 2014 Restated
2013 £m £m £m £m £m £m
Financial liabilities measured at amortised cost: Bank loans 4,788 3,017 4,707 3,122 4,647 3,077 Redeemable preference shares – 1,086 – 1,020 – 1,355 Other liabilities 110 731 110 821 110 753 Bonds: 4,272 14,456 4,620 15,986 4,465 15,698Euro floating rate note due June 2014 – 949 – 952 – 9514.15% US dollar 1,250 million bond due June 2014 – 795 – 828 – 8104.625% sterling 350 million bond due September 2014 – 304 – 319 – 3204.625% sterling 525 million bond due September 2014 – 525 – 552 – 5415.125% euro 500 million bond due April 2015 413 422 432 461 435 4465.0% US dollar 750 million bond due September 2015 – 494 – 543 – 5213.375% US dollar 500 million bond due November 2015 – 329 – 349 – 3316.25% euro 1,250 million bond due January 2016 1,032 949 1,020 1,091 943 9640.9% US dollar 900 million bond due February 2016 – 592 – 592 – 592US dollar floating rate note due February 2016 – 461 – 460 – 4612.875% US dollar 600 million bond due March 2016 – 395 – 416 – 3945.75% US dollar 750 million bond due March 2016 – 494 – 561 – 5364.75% euro 500 million bond due June 2016 302 422 328 474 441 4555.625% US dollar 1,300 million bond due February 2017 – 856 – 995 – 9371.625% US dollar 1,000 million bond due March 2017 – 658 – 665 – 6556.5% euro 400 million bond due July 2017 330 – 351 – 347 –1.25% US dollar 1,000 million bond due September 2017 – 658 – 654 – 6555.375% sterling 600 million bond due December 2017 548 552 611 646 569 5711.5% US dollar 1,400 million bond due February 2018 – 921 – 922 – 9175% euro 750 million bond due June 2018 619 633 716 750 644 6586.5% euro 700 million bond due June 2018 578 – 604 – 606 –4.625% US dollar 500 million bond due July 2018 – 329 – 376 – 3878.125% sterling 450 million bond due November 2018 450 450 558 598 480 4834.375% US dollar 500 million bond due March 2021 – 329 – 371 – 3277.875% US dollar 750 million bond due February 2030 – 494 – 699 – 7786.25% US dollar 495 million bond due November 2032 – 326 – 399 – 4426.15% US dollar 1,700 million bond due February 2037 – 1,119 – 1,313 – 1,566
Bonds in designated hedge relationships: 10,951 6,287 11,797 6,969 12,232 7,0212.15% Japanese yen 3,000 million bond due April 2015 17 21 18 22 18 215.375% US dollar 900 million bond due January 2015 – 592 – 641 – 633US dollar floating rate note due February 2016 420 – 420 – 420 –5.625% US dollar 1,300 million bond due February 2017 779 – 874 – 836 –1.625% US dollar 1,000 million bond due March 2017 599 – 607 – 597 –1.25% US dollar 1,000 million bond due September 2017 599 – 594 – 597 –1.5% US dollar 1,400 million bond due February 2018 839 – 827 – 837 –4.625% US dollar 500 million bond due July 2018 300 – 332 – 343 –5.45% US dollar 1,250 million bond due June 2019 749 823 859 980 833 9574.375% US dollar 500 million bond due March 2021 300 – 322 – 296 –4.65% euro 1,250 million bond due January 2022 1,032 1,055 1,213 1,270 1,194 1,2365.375% euro 500 million bond due June 2022 413 422 509 530 536 5582.5% US dollar 1,000 million bond due September 2022 599 658 551 633 557 6432.95% US dollar 1,600 million bond due February 2023 959 1,053 903 1,050 939 1,0545.625% sterling 250 million bond due December 2025 250 250 284 308 313 3386.6324% euro 50 million bond due December 2028 41 42 93 94 81 777.875% US dollar 750 million bond due February 2030 450 – 603 – 698 –5.9% sterling 450 million bond due November 2032 450 450 519 560 561 5986.25% US dollar 495 million bond due November 2032 297 – 341 – 399 –6.15% US dollar 1,700 million bond due February 2037 1,019 – 1,166 – 1,416 –4.375% US dollar 1,400 million bond due February 2043 839 921 762 881 761 906
Long-term borrowings 20,121 25,577 21,234 27,918 21,454 27,904
Notes to the consolidated financial statements (continued)
Vodafone Group Plc Annual Report 2014140

Fair values are calculated using quoted market prices or discounted cash flows with a discount rate based upon forward interest rates available to the Group at the reporting date.
Maturity of borrowingsThe maturity profile of the anticipated future cash flows including interest in relation to the Group’s non-derivative financial liabilities on an undiscounted basis which, therefore, differs from both the carrying value and fair value, is as follows:
Redeemable Loans in Bank preference Commercial Other designated hedge loans shares paper Bonds liabilities relationships Total £m £m £m £m £m £m £m
Within one year 1,286 – 954 2,191 3,758 453 8,642In one to two years 695 – – 1,709 11 890 3,305In two to three years 375 – – 591 7 1,228 2,201In three to four years 1,164 – – 1,075 8 2,468 4,715In four to five years 2,710 – – 1,724 8 668 5,110In more than five years 592 – – – 69 11,087 11,748 6,822 – 954 7,290 3,861 16,794 35,721Effect of discount/financing rates (912) – (4) (1,042) – (4,562) (6,520)31 March 2014 5,910 – 950 6,248 3,861 12,232 29,201
Within one year 2,269 56 4,070 2,946 2,263 277 11,881 In one to two years 402 56 – 3,313 138 870 4,779 In two to three years 305 56 – 4,753 1,101 266 6,481 In three to four years 230 56 – 1,636 599 245 2,766 In four to five years 1,007 56 – 3,156 72 245 4,536 In more than five years 1,835 1,212 – 5,877 52 7,913 16,889 6,048 1,492 4,070 21,681 4,225 9,816 47,332
Effect of discount/financing rates (531) (137) (16) (3,850) (299) (2,795) (7,628)31 March 2013 restated 5,517 1,355 4,054 17,831 3,926 7,021 39,704
The maturity profile of the Group’s financial derivatives (which include interest rate and foreign exchange swaps), using undiscounted cash flows, is as follows:
2014 2013
Payable Receivable Payable Receivable £m £m £m £m
Within one year 1,284 1,442 10,671 11,020 In one to two years 2,454 3,656 1,014 1,214 In two to three years 4,489 3,920 1,308 1,495 In three to four years 5,040 3,138 2,803 3,087 In four to five years 1,729 2,137 581 780In more than five years 14,799 12,737 3,579 4,454 29,795 27,030 19,956 22,050
The currency split of the Group’s foreign exchange derivatives is as follows:
2014 2013
Payable Receivable Payable Receivable £m £m £m £m
Sterling 8,955 9,222 2,365 4,477 Euro 5,342 11,364 6,583 602 US dollar 10,613 4,330 348 6,130 Japanese yen 589 17 669 1,296 Other 1,880 2,765 3,945 1,768 27,379 27,698 13,910 14,273
Payables and receivables are stated separately in the table above as settlement is on a gross basis. The £319 million (2013: £363 million) net receivable in relation to foreign exchange financial instruments in the table above is split £246 million (2013: £44 million) within trade and other payables and £565 million (2013: £407 million) within trade and other receivables.
The present value of minimum lease payments under finance lease arrangements under which the Group has leased certain of its equipment is analysed as follows:
2014 2013 £m £m
Within one year 21 37 In two to five years 34 42 In more than five years 69 53
Vodafone Group Plc Annual Report 2014140 141Overview
Strategy review Performance Governance Financials
Additional information

21. Borrowings (continued)
Interest rate and currency of borrowings Total Floating rate Fixed rate Other borrowings borrowings borrowings1 borrowings2
Currency £m £m £m £m
Sterling 2,801 885 1,910 6Euro 16,225 4,557 10,220 1,448US dollar 4,537 4,330 207 –Other 5,638 2,768 1,988 88231 March 2014 29,201 12,540 14,325 2,336
Sterling 2,915 955 1,951 9 Euro 10,810 5,271 5,539 – US dollar 20,991 8,019 12,866 106 Other 4,988 2,198 1,891 899 31 March 2013 restated 39,704 16,443 22,247 1,014
Notes:1 The weighted average interest rate for the Group’s sterling denominated fixed rate borrowings is 5.7% (2013: 5.7%). The weighted average time for which these rates are fixed is 2.5 years (2013: 3.5 years). The weighted average
interest rate for the Group’s euro denominated fixed rate borrowings is 4.4% (2013: 4.3%). The weighted average time for which the rates are fixed is 2.6 years (2013: 2.4 years). The weighted average interest rate for the Group’s US dollar denominated fixed rate borrowings is 2.9% (2013: 4.3%). The weighted average time for which the rates are fixed is 5.7 years (2013: 6.3 years). The weighted average interest rate for the Group’s other currency fixed rate borrowings is 10.2% (2013: 9.6%). The weighted average time for which the rates are fixed is 1.4 years (2013: 1.5 years).
2 At 31 March 2014 other borrowings of £2,336 million include liabilities for amounts payable under the domination agreement in relation to Kabel Deutschland. At 31 March 2013 other borrowings of £1,014 million include liabilities arising under options over direct and indirect interests in Vodafone India.
The figures shown in the tables above take into account interest rate swaps used to manage the interest rate profile of financial liabilities. Interest on floating rate borrowings is generally based on national LIBOR equivalents or government bond rates in the relevant currencies.
Additional protection from euro and US dollar interest rate movements is provided by fixing interest rates or reduced by floating interest rates using interest rate swaps or interest rate futures. Cross currency interest rate swaps are used to change the currency of certain fixed interest rate cash flows.
2014 2013 2014 2013
US$1 US$1 EUR1 EUR1
Interest rate
futures Interest rate
swaps2 Interest rate
futures Interest rate
swaps Interest rate
futures Interest rate
swaps2 Interest rate
futures Interest rate
swaps £m £m £m £m £m £m £m £m
Within one year – (5,722) (4,722) 2,073 (3,716) 5,814 1,677 696 In one to two years – (5,722) (823) 1,703 (619) 5,814 3,164 696 In two to three years – (5,722) (1,940) 1,621 1,726 5,814 5,525 696 In three to four years – (3,744) 2,222 148 4,979 3,806 4,254 422 In four to five years – (2,755) 2,632 (247) 103 2,802 6,123 105 In more than five years3 – (2,605) – (329) – 2,207 – –
Notes:1 In the table above, figures shown as positive indicate an increase in fixed interest debt and figures shown in brackets indicate a reduction in fixed interest debt.2 Includes cross currency interest rate swaps.3 Figures shown as “in more than five years” relate to the periods from March 2019 to December 2043 and March 2018 to December 2021, at March 2014 and March 2013 respectively.
Notes to the consolidated financial statements (continued)
Vodafone Group Plc Annual Report 2014142

Borrowing facilitiesCommitted facilities expiry
2014 Restated
2013
Drawn Undrawn Drawn Undrawn £m £m £m £m
Within one year 590 70 1,994 298 In one to two years 451 13 1,306 50
In two to three years 171 2,643 1,288 3,569 In three to four years 565 35 559 2,794 In four to five years – 3,188 – – In more than five years 1,728 582 1,037 422 31 March 3,505 6,531 6,184 7,133
At 31 March the Group’s most significant committed facilities comprised two revolving credit facilities which remain undrawn throughout the period of US$4,245 million (£2,545 million) and €3,860 million (£3,188 million) maturing in three and five years respectively. Under the terms of these bank facilities, lenders have the right, but not the obligation, to cancel their commitment 30 days from the date of notification of a change of control of the Company and have outstanding advances repaid on the last day of the current interest period. The facility agreements provide for certain structural changes that do not affect the obligations of the Company to be specifically excluded from the definition of a change of control. This is in addition to the rights of lenders to cancel their commitment if the Company has committed an event of default.
The terms and conditions of the drawn facilities in the Group’s Italian, German, Turkish and Romanian operations (€1,560 million in aggregate) and the undrawn facilities in the Group’s UK and Irish operations (totalling £450 million) are similar to those of the US dollar and euro revolving credit facilities. Further information on these facilities can be found in note 22 “Liquidity and capital resources”.
22. Liquidity and capital resources
This section includes an analysis of net debt, which we use to manage capital, and committed borrowing facilities.Net debtNet debt was £13.7 billion at 31 March 2014 and includes liabilities for amounts payable under the domination agreement in relation to Kabel Deutschland (£1.4 billion) and deferred spectrum licence costs in India (£1.5 billion). This decreased by £11.7 billion in the year as the proceeds from the disposal of the US sub-group including our interest in Verizon Wireless, positive free cash flow and favourable foreign exchange movements more than offset the impact of the acquisition of Kabel Deutschland, payments for licences and spectrum, equity shareholder dividends, the return of value and share buybacks.
Net debt represented 23.5% of our market capitalisation at 31 March 2014 compared to 27.8% at 31 March 2013. Average net debt at month end accounting dates over the 12 month period ended 31 March 2014 was £22.9 billion and ranged between net debt of £30.4 billion and a net surplus of funds of £2.7 billion.
Our consolidated net debt position at 31 March was as follows:
2014 Restated
2013 £m £m
Cash and cash equivalents 10,134 7,531
Short-term borrowings Bonds (1,783) (2,133)Commercial paper1 (950) (4,054)Put options over non-controlling interests (2,330) (938)Bank loans (1,263) (2,438)Other short-term borrowings2 (1,421) (2,237)
(7,747) (11,800)
Long-term borrowings Put options over non-controlling interests (6) (77)Bonds, loans and other long-term borrowings (21,448) (27,827)
(21,454) (27,904)Other financial instruments3 5,367 6,819 Net debt (13,700) (25,354)
Notes:1 At 31 March 2014 US$578 million was drawn under the US commercial paper programme and €731 million was drawn under the euro commercial paper programme.2 At 31 March 2014 the amount includes £1,185 million (2013: £1,151 million) in relation to cash received under collateral support agreements.3 Comprises mark-to-market adjustments on derivative financial instruments which are included as a component of trade and other receivables (2014: £2,443 million; 2013: £3,032 million) and trade and other payables
(2014: £881 million; 2013: £1,101 million) and short-term investments primarily in index linked government bonds and managed investment funds included as a component of other investments (2014: £3,805 million; 2013: £4,888 million).
Vodafone Group Plc Annual Report 2014142 143Overview
Strategy review Performance Governance Financials
Additional information

22. Liquidity and capital resources (continued)
At 31 March 2014 we had £10,134 million of cash and cash equivalents which are held in accordance with the counterparty and settlement risk limits of the Board approved treasury policy. The main forms of liquid investment at 31 March 2014 were managed investment funds, money market funds, UK index linked government bonds, tri-party repurchase agreements and bank deposits.
The cash received from collateral support agreements mainly reflects the value of our interest rate swap portfolio which is substantially net present value positive. See note 23 for further details on these agreements.
Commercial paper programmes We currently have US and euro commercial paper programmes of US$15 billion and £5 billion respectively which are available to be used to meet short-term liquidity requirements. At 31 March 2014 amounts external to the Group of €731 million (£604 million) were drawn under the euro commercial paper programme and US$578 million (£346 million) were drawn down under the US commercial paper programme, with such funds being provided by counterparties external to the Group. At 31 March 2013 amounts external to the Group of €2,006 million (£1,693 million), US$35 million (£23 million), £10 million and JPY 5 billion (£35 million) were drawn under the euro commercial paper programme and US$3,484 million (£2,293 million) was drawn down under the US commercial paper programme. The commercial paper facilities were supported by US$4.2 billion (£2.5 billion) and €3.9 billion (£3.2 billion) of syndicated committed bank facilities (see “Committed facilities” opposite). No amounts had been drawn under either bank facility.
BondsWe have a €30 billion euro medium-term note programme and a US shelf programme which are used to meet medium to long-term funding requirements. At 31 March 2014 the total amounts in issue under these programmes split by currency were US$14.6 billion, £2.6 billion and €6.2 billion.
At 31 March 2014 we had bonds outstanding with a nominal value of £16,979 million (2013: £22,837 million). No bonds were issued in the year ended 31 March 2014.
Share buyback programmesFollowing the receipt of a US$3.8 billion (£2.4 billion) dividend from Verizon Wireless in December 2012, we initiated a £1.5 billion share buyback programme under the authority granted by our shareholders at the 2012 annual general meeting. The Group placed irrevocable purchase instructions to enable shares to be repurchased on our behalf when we may otherwise have been prohibited from buying in the market. The share buyback programme concluded at the end of June 2013.
Details of the shares purchased under the programme, including those purchased under irrevocable instructions, are shown below:
Number of shares
purchased1, 4
Average price paid per share inclusive of
transaction costs
Total number of shares purchased under
publicly announced share buyback programme2
Maximum value of shares that may yet be purchased
under the programme3 Date of share purchase ’000 Pence ’000 £m
April 2013 43,000 192.54 314,651 968May 2013 204,750 196.09 519,401 567June 2013 304,300 180.52 823,701 –Total 552,050 187.23 823,701 –
Notes:1 The nominal value of shares purchased is 113/7 US cents each.2 No shares were purchased outside the publicly announced share buyback programme.3 In accordance with authorities granted by shareholders in general meeting.4 The total number of shares purchased represents 1.1% of our issued share capital, excluding treasury shares, at the end of June 2013.
The Group held a maximum of 5,099 million shares during the year which represents 9.5% of issued share capital at that time.
Notes to the consolidated financial statements (continued)
Vodafone Group Plc Annual Report 2014144
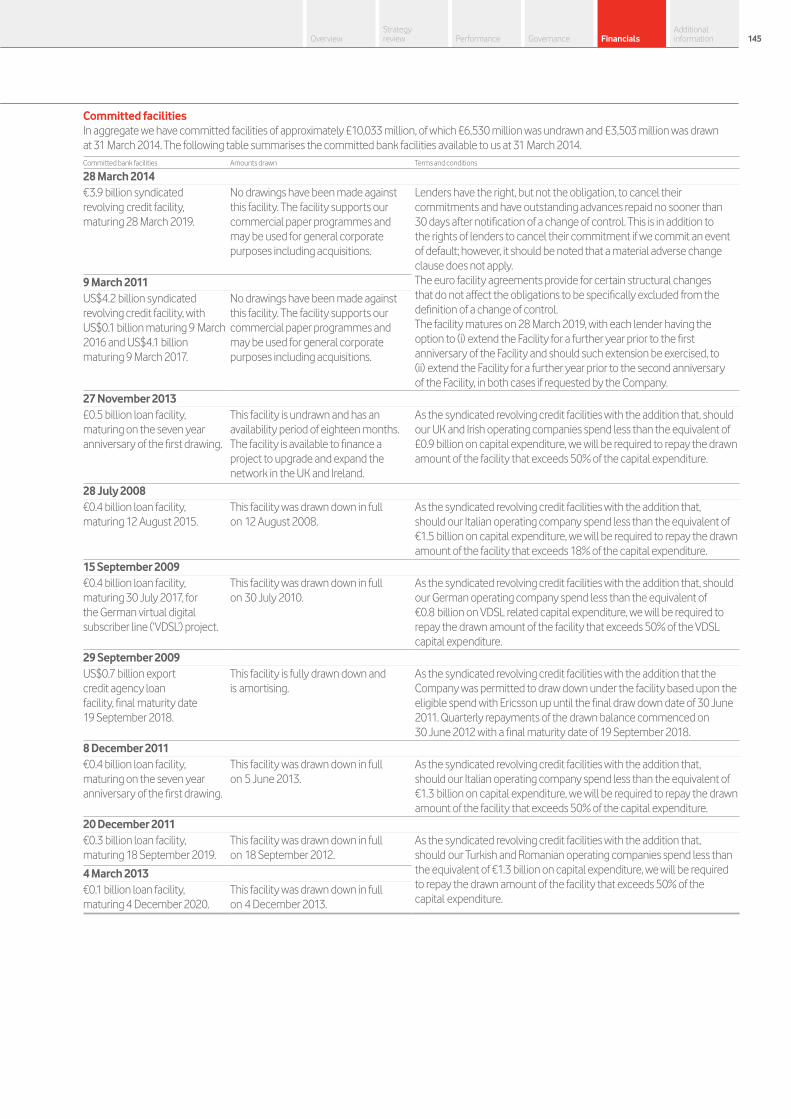
Committed facilitiesIn aggregate we have committed facilities of approximately £10,033 million, of which £6,530 million was undrawn and £3,503 million was drawn at 31 March 2014. The following table summarises the committed bank facilities available to us at 31 March 2014.Committed bank facilities Amounts drawn Terms and conditions
28 March 2014 €3.9 billion syndicated revolving credit facility, maturing 28 March 2019.
No drawings have been made against this facility. The facility supports our commercial paper programmes and may be used for general corporate purposes including acquisitions.
Lenders have the right, but not the obligation, to cancel their commitments and have outstanding advances repaid no sooner than 30 days after notification of a change of control. This is in addition to the rights of lenders to cancel their commitment if we commit an event of default; however, it should be noted that a material adverse change clause does not apply.The euro facility agreements provide for certain structural changes that do not affect the obligations to be specifically excluded from the definition of a change of control.The facility matures on 28 March 2019, with each lender having the option to (i) extend the Facility for a further year prior to the first anniversary of the Facility and should such extension be exercised, to (ii) extend the Facility for a further year prior to the second anniversary of the Facility, in both cases if requested by the Company.
9 March 2011 US$4.2 billion syndicated revolving credit facility, with US$0.1 billion maturing 9 March 2016 and US$4.1 billion maturing 9 March 2017.
No drawings have been made against this facility. The facility supports our commercial paper programmes and may be used for general corporate purposes including acquisitions.
27 November 2013 £0.5 billion loan facility, maturing on the seven year anniversary of the first drawing.
This facility is undrawn and has an availability period of eighteen months.The facility is available to finance a project to upgrade and expand the network in the UK and Ireland.
As the syndicated revolving credit facilities with the addition that, should our UK and Irish operating companies spend less than the equivalent of£0.9 billion on capital expenditure, we will be required to repay the drawn amount of the facility that exceeds 50% of the capital expenditure.
28 July 2008 €0.4 billion loan facility, maturing 12 August 2015.
This facility was drawn down in full on 12 August 2008.
As the syndicated revolving credit facilities with the addition that, should our Italian operating company spend less than the equivalent of €1.5 billion on capital expenditure, we will be required to repay the drawn amount of the facility that exceeds 18% of the capital expenditure.
15 September 2009 €0.4 billion loan facility, maturing 30 July 2017, for the German virtual digital subscriber line (‘VDSL’) project.
This facility was drawn down in full on 30 July 2010.
As the syndicated revolving credit facilities with the addition that, should our German operating company spend less than the equivalent of €0.8 billion on VDSL related capital expenditure, we will be required to repay the drawn amount of the facility that exceeds 50% of the VDSL capital expenditure.
29 September 2009 US$0.7 billion export credit agency loan facility, final maturity date 19 September 2018.
This facility is fully drawn down and is amortising.
As the syndicated revolving credit facilities with the addition that the Company was permitted to draw down under the facility based upon the eligible spend with Ericsson up until the final draw down date of 30 June 2011. Quarterly repayments of the drawn balance commenced on 30 June 2012 with a final maturity date of 19 September 2018.
8 December 2011 €0.4 billion loan facility, maturing on the seven year anniversary of the first drawing.
This facility was drawn down in full on 5 June 2013.
As the syndicated revolving credit facilities with the addition that, should our Italian operating company spend less than the equivalent of €1.3 billion on capital expenditure, we will be required to repay the drawn amount of the facility that exceeds 50% of the capital expenditure.
20 December 2011 €0.3 billion loan facility, maturing 18 September 2019.
This facility was drawn down in full on 18 September 2012.
As the syndicated revolving credit facilities with the addition that, should our Turkish and Romanian operating companies spend less than the equivalent of €1.3 billion on capital expenditure, we will be required to repay the drawn amount of the facility that exceeds 50% of the capital expenditure.
4 March 2013 €0.1 billion loan facility, maturing 4 December 2020.
This facility was drawn down in full on 4 December 2013.
Vodafone Group Plc Annual Report 2014144 145Overview
Strategy review Performance Governance Financials
Additional information
22. Liquidity and capital resources (continued)
Furthermore, certain of our subsidiaries are funded by external facilities which are non-recourse to any member of the Group other than the borrower. These facilities may only be used to fund their operations. At 31 March 2014 Vodafone India had facilities of INR 207 billion (£2.1 billion) of which INR 179 billion (£1.8 billion) was drawn. Vodafone Egypt had an undrawn revolving credit facility of US$120 million (£71 million) . Vodacom had fully drawn facilities of ZAR 1.0 billion (£57 million) and US$37 million (£22 million). Ghana had a facility of US$217 million (£130 million) which was fully drawn.
We believe that we have sufficient funding for our expected working capital requirements for at least the next 12 months. Further details regarding the maturity, currency and interest rates of the Group’s gross borrowings at 31 March 2014 are included in note 21 “Borrowings”.
Dividends from associates and to non-controlling shareholdersDividends from our associates are generally paid at the discretion of the Board of directors or shareholders of the individual operating and holding companies and we have no rights to receive dividends except where specified within certain of the Group’s shareholders’ agreements. Similarly, other than ongoing dividend obligations to the KDG minority shareholders should they continue to hold their minority stake, we do not have existing obligations under shareholders’ agreements to pay dividends to non-controlling interest partners of our subsidiaries or joint ventures.
The amount of dividends received and paid in the year are disclosed in the consolidated statement of cash flows.
Potential cash outflows from option agreements and similar arrangementsIn respect of our interest in Vodafone India Limited (‘VIL’), Piramal Healthcare (‘Piramal’) acquired approximately 11% shareholding in VIL from Essar during the 2012 financial year. In April 2014 Piramal sold its total shareholding in VIL to Vodafone Group. The combined consideration for these shares and the indirect equity interest held by Analjit Singh and Neelu Analjit Singh (completed in March 2014) was £1.0 billion.
Under the terms of the sale and purchase agreement governing the disposal of the US Group, including the 45% interest in Verizon Wireless, the Group retains the responsibility for any tax liabilities of the US Group, excluding those relating to the Verizon Wireless partnership, for periods up to the completion of the transaction on 21 February 2014.
Off-balance sheet arrangementsWe do not have any material off-balance sheet arrangements as defined in item 5.E.2. of the SEC’s Form 20-F. Please refer to notes 29 and 30 for a discussion of our commitments and contingent liabilities.
23. Capital and financial risk management
This note details our treasury management and financial risk management objectives and policies, as well as the exposure and sensitivity of the Group to credit, liquidity, interest and foreign exchange risk, and the policies in place to monitor and manage these risks. Accounting policies
Financial instrumentsFinancial assets and financial liabilities, in respect of financial instruments, are recognised on the Group’s statement of financial position when the Group becomes a party to the contractual provisions of the instrument.
Financial liabilities and equity instrumentsFinancial liabilities and equity instruments issued by the Group are classified according to the substance of the contractual arrangements entered into and the definitions of a financial liability and an equity instrument. An equity instrument is any contract that evidences a residual interest in the assets of the Group after deducting all of its liabilities and includes no obligation to deliver cash or other financial assets. The accounting policies adopted for specific financial liabilities and equity instruments are set out below.
Put option arrangementsThe potential cash payments related to put options issued by the Group over the equity of subsidiary companies are accounted for as financial liabilities when such options may only be settled by exchange of a fixed amount of cash or another financial asset for a fixed number of shares in the subsidiary.
The amount that may become payable under the option on exercise is initially recognised at present value within borrowings with a corresponding charge directly to equity. The charge to equity is recognised separately as written put options over non-controlling interests, adjacent to non-controlling interests in the net assets of consolidated subsidiaries. The Group recognises the cost of writing such put options, determined as the excess of the present value of the option over any consideration received, as a financing cost.
Such options are subsequently measured at amortised cost, using the effective interest rate method, in order to accrete the liability up to the amount payable under the option at the date at which it first becomes exercisable; the charge arising is recorded as a financing cost. In the event that the option expires unexercised, the liability is derecognised with a corresponding adjustment to equity.
Derivative financial instruments and hedge accountingThe Group’s activities expose it to the financial risks of changes in foreign exchange rates and interest rates which it manages using derivative financial instruments.
The use of financial derivatives is governed by the Group’s policies approved by the Board of directors, which provide written principles on the use of financial derivatives consistent with the Group’s risk management strategy. Changes in values of all derivatives of a financing nature are included within investment income and financing costs in the income statement. The Group does not use derivative financial instruments for speculative purposes.
Notes to the consolidated financial statements (continued)
Vodafone Group Plc Annual Report 2014146

Derivative financial instruments are initially measured at fair value on the contract date and are subsequently remeasured to fair value at each reporting date. The Group designates certain derivatives as:
a hedges of the change of fair value of recognised assets and liabilities (“fair value hedges”); or
a hedges of highly probable forecast transactions or hedges of foreign currency or interest rate risks of firm commitments (“cash flow hedges”); or
a hedges of net investments in foreign operations.
Hedge accounting is discontinued when the hedging instrument expires or is sold, terminated, or exercised, or no longer qualifies for hedge accounting, or if the Company chooses to end the hedging relationship.
Fair value hedgesThe Group’s policy is to use derivative instruments (primarily interest rate swaps) to convert a proportion of its fixed rate debt to floating rates in order to hedge the interest rate risk arising, principally, from capital market borrowings. The Group designates these as fair value hedges of interest rate risk with changes in fair value of the hedging instrument recognised in the income statement for the period together with the changes in the fair value of the hedged item due to the hedged risk, to the extent the hedge is effective. Gains or losses relating to any ineffective portion are recognised immediately in the income statement.
Cash flow hedgesCash flow hedging is used by the Group to hedge certain exposures to variability in future cash flows. The portion of gains or losses relating to changes in the fair value of derivatives that are designated and qualify as effective cash flow hedges is recognised in other comprehensive income; gains or losses relating to any ineffective portion are recognised immediately in the income statement.
When the hedged item is recognised in the income statement amounts previously recognised in other comprehensive income and accumulated in equity for the hedging instrument are reclassified to the income statement. However, when the hedged transaction results in the recognition of a non-financial asset or a non-financial liability, the gains and losses previously recognised in other comprehensive income and accumulated in equity are transferred from equity and included in the initial measurement of the cost of the non-financial asset or non-financial liability.
When hedge accounting is discontinued, any gain or loss recognised in other comprehensive income at that time remains in equity and is recognised in the income statement when the hedged transaction is ultimately recognised in the income statement. If a forecast transaction is no longer expected to occur, the gain or loss accumulated in equity is recognised immediately in the income statement.
Net investment hedgesExchange differences arising from the translation of the net investment in foreign operations are recognised directly in equity. Gains and losses on those hedging instruments (which include bonds, commercial paper, cross currency swaps and foreign exchange contracts) designated as hedges of the net investments in foreign operations are recognised in equity to the extent that the hedging relationship is effective; these amounts are included in exchange differences on translation of foreign operations as stated in the statement of comprehensive income. Gains and losses relating to hedge ineffectiveness are recognised immediately in the income statement for the period. Gains and losses accumulated in the translation reserve are included in the income statement when the foreign operation is disposed of.
Capital managementThe following table summarises the capital of the Group:
2014 Restated
2013 £m £m
Financial assets: Cash and cash equivalents (10,134) (7,531)Fair value through the income statement (held for trading) (5,293) (6,803)Derivative instruments in designated hedge relationships (955) (1,117)
Financial liabilities: Fair value through the income statements (held for trading) 471 1,057Derivative instruments in designated hedge relationships 410 44Financial liabilities held at amortised cost 29,201 39,704
Net debt 13,700 25,354Equity 71,781 72,488Capital 85,481 97,842
The Group’s policy is to borrow centrally using a mixture of long-term and short-term capital market issues and borrowing facilities to meet anticipated funding requirements. These borrowings, together with cash generated from operations, are loaned internally or contributed as equity to certain subsidiaries. The Board has approved three internal debt protection ratios being: net interest to operating cash flow (plus dividends from associates); retained cash flow (operating cash flow plus dividends from associates less interest, tax, dividends to non-controlling shareholders and equity dividends) to net debt; and operating cash flow (plus dividends from associates) to net debt. These internal ratios establish levels of debt that the Group should not exceed other than for relatively short periods of time and are shared with the Group’s debt rating agencies being Moody’s, Fitch Ratings and Standard & Poor’s. The Group complied with these ratios throughout the financial year and we expect these ratios to be complied with in the next 12 months.
Vodafone Group Plc Annual Report 2014146 147Overview
Strategy review Performance Governance Financials
Additional information

23. Capital and financial risk management (continued)
Financial risk managementThe Group’s treasury function provides a centralised service to the Group for funding, foreign exchange, interest rate management and counterparty risk management.
Treasury operations are conducted within a framework of policies and guidelines authorised and reviewed by the Board, most recently on 27 March 2012. A treasury risk committee comprising of the Group’s Chief Financial Officer, Group General Counsel and Company Secretary, Group Financial Controller, Group Treasury Director and Director of Financial Reporting meets three times a year to review treasury activities and its members receive management information relating to treasury activities on a quarterly basis. The Group’s accounting function, which does not report to the Group Treasury Director, provides regular update reports of treasury activity to the Board. The Group’s internal auditor reviews the internal control environment regularly.
The Group uses a number of derivative instruments for currency and interest rate risk management purposes only that are transacted by specialist treasury personnel. The Group mitigates banking sector credit risk by the use of collateral support agreements.
Credit riskThe Group considers its exposure to credit risk at 31 March to be as follows:
2014 Restated
2013 £m £m
Bank deposits 1,498 1,304Repurchase agreements 4,799 2,550Cash held in restricted deposits 524 404 UK government bonds 852 1,076Money market fund investments 3,648 3,494Derivative financial instruments 2,443 3,032Other investments – debt and bonds 5,525 3,427Trade receivables 3,859 3,317Other receivables 1,546 1,765Short-term securitised investments 1,019 826 25,713 21,195
The Group invested in UK index linked government bonds on the basis that they generated a floating rate return in excess of £ LIBOR and are amongst the most creditworthy of investments available.
The Group has a managed investment fund. This fund holds fixed income sterling securities and the average credit quality is high double A.
Money market investments are in accordance with established internal treasury policies which dictate that an investment’s long-term credit rating is no lower than mid BBB. Additionally, the Group invests in AAA unsecured money market mutual funds where the investment is limited to 7.5% of each fund.
The Group has investments in repurchase agreements which are fully collateralised investments. The collateral is sovereign and supranational debt of major EU countries with at least one AAA rating denominated in euros, sterling and US dollars and can be readily converted to cash. In the event of any default, ownership of the collateral would revert to the Group. Detailed below is the value of the collateral held by the Group at 31 March 2014.
2014Restated
2013 £m £m
Sovereign 4,464 2,081Supranational 335 469 4,799 2,550
In respect of financial instruments used by the Group’s treasury function, the aggregate credit risk the Group may have with one counterparty is limited by (i) reference to the long-term credit ratings assigned for that counterparty by Moody’s, Fitch Ratings and Standard & Poor’s, (ii) that counterparty’s five year credit default swap (‘CDS’) spread, and (iii) the sovereign credit rating of that counterparty’s principal operating jurisdiction. Furthermore, collateral support agreements were introduced from the fourth quarter of 2008. Under collateral support agreements the Group’s exposure to a counterparty with whom a collateral support agreement is in place is reduced to the extent that the counterparty must post cash collateral when there is value due to the Group under outstanding derivative contracts that exceeds a contractually agreed threshold amount. When value is due to the counterparty the Group is required to post collateral on identical terms. Such cash collateral is adjusted daily as necessary.
Notes to the consolidated financial statements (continued)
Vodafone Group Plc Annual Report 2014148

In the event of any default ownership of the cash collateral would revert to the respective holder at that point. Detailed below is the value of the cash collateral, which is reported within short-term borrowings, held by the Group at 31 March 2014:
2014 2013 £m £m
Cash collateral 1,185 1,151
The majority of the Group’s trade receivables are due for maturity within 90 days and largely comprise amounts receivable from consumers and business customers. At 31 March 2014 £2,360 million (2013: £1,733 million) of trade receivables were not yet due for payment. Total trade receivables consisted of £1,219 million (2013: £1,265 million) relating to the Europe region, and £280 million (2013: £319 million) relating to the AMAP region. Accounts are monitored by management and provisions for bad and doubtful debts raised where it is deemed appropriate.
The following table presents ageing of receivables that are past due and provisions for doubtful receivables that have been established.
2014 Restated
2013
Gross
receivablesLess
provisionsNet
receivables Gross
receivablesLess
provisionsNet
receivables £m £m £m £m £m £m
30 days or less 1,327 (356) 971 1,460 (390) 1,070Between 31–60 days 218 (27) 191 166 (14) 152Between 61–180 days 187 (53) 134 222 (44) 178Greater than 180 days 516 (313) 203 609 (424) 185 2,248 (749) 1,499 2,457 (872) 1,585
Concentrations of credit risk with respect to trade receivables are limited given that the Group’s customer base is large and unrelated. Due to this management believes there is no further credit risk provision required in excess of the normal provision for bad and doubtful receivables. Amounts charged to administrative expenses during the year ended 31 March 2014 were £347 million (2013: £360 million; 2012: £357 million) (see note 15 “Trade and other receivables”).
As discussed in note 30 “Contingent liabilities”, the Group has covenanted to provide security in favour of the Trustee of the Vodafone Group UK Pension Scheme in respect of the funding deficit in the scheme. The security takes the form of an English law pledge over UK index linked government bonds.
Liquidity riskAt 31 March 2014 the Group had €3.9 billion and US$4.2 billion syndicated committed undrawn bank facilities and US$15 billion and £5 billion commercial paper programmes, supported by the €3.9 billion and US$4.2 billion syndicated committed bank facilities, available to manage its liquidity. The Group uses commercial paper and bank facilities to manage short-term liquidity and manages long-term liquidity by raising funds in the capital markets.
The €3.9 billion syndicated committed facility has a maturity date of 28 March 2019 with the option to (i) extend the facility for a further year prior to the first anniversary of the facility and should such extension be exercised, to (ii) extend the Facility for a further year prior to the second anniversary of the Facility, in both cases if requested by the Company. The US$4.1 billion syndicated committed facility has a maturity of 9 March 2017; the remaining US$0.1 billion has a maturity of 9 March 2016. Both facilities have remained undrawn throughout the financial year and since year end and provide liquidity support.
The Group manages liquidity risk on long-term borrowings by maintaining a varied maturity profile with a cap on the level of debt maturing in any one calendar year, therefore minimising refinancing risk. Long-term borrowings mature between one and 29 years.
Liquidity is reviewed daily on at least a 12 month rolling basis and stress tested on the assumption that all commercial paper outstanding matures and is not reissued. The Group maintains substantial cash and cash equivalents which at 31 March 2014, amounted to £10,134 million (2013: £7,531 million).
Vodafone Group Plc Annual Report 2014148 149Overview
Strategy review Performance Governance Financials
Additional information

23. Capital and financial risk management (continued)
Market risk
Interest rate managementUnder the Group’s interest rate management policy, interest rates on monetary assets and liabilities denominated in euros, US dollars and sterling are maintained on a floating rate basis except for periods up to six years where interest rate fixing has to be undertaken in accordance with treasury policy. Where assets and liabilities are denominated in other currencies interest rates may also be fixed. In addition, fixing is undertaken for longer periods when interest rates are statistically low.
For each one hundred basis point fall or rise in market interest rates for all currencies in which the Group had borrowings at 31 March 2014 there would be a reduction or increase in profit before tax by approximately £42 million (2013: increase or reduce by £144 million) including mark-to-market revaluations of interest rate and other derivatives and the potential interest on outstanding tax issues. There would be no material impact on equity.
Foreign exchange managementAs Vodafone’s primary listing is on the London Stock Exchange its share price is quoted in sterling. Since the sterling share price represents the value of its future multi-currency cash flows, principally in euro, South African rand, Indian rupee and sterling, the Group maintains the currency of debt and interest charges in proportion to its expected future principal multi-currency cash flows and has a policy to hedge external foreign exchange risks on transactions denominated in other currencies above certain de minimis levels. As the Group’s future cash flows are increasingly likely to be derived from emerging markets it is likely that a greater proportion of debt in emerging market currencies will be drawn.
The disposal of our US Group in February 2014 necessitated a restructuring of the Group’s outstanding US dollar debt, which was achieved via i) the repayment of certain US dollar debt obligations and ii) the use of cross currency swaps to eliminate the US dollar currency risk on certain remaining US dollar debt items. Prior to the disposal date a significant proportion of the Group’s future value was derived from its US assets. Going forward the Group will only hold US dollar debt to hedge future US dollar receipts, which primarily consist of floating rate notes as issued by Verizon Communications, received as part of the disposal consideration.
At 31 March 2014, 164% of net debt was denominated in currencies other than sterling (96% euro, 37% India rupee 19% US dollar and 12% other) while 64% of net debt had been purchased forward in sterling in anticipation of sterling denominated shareholder returns via dividends. This allows euro, US dollar and other debt to be serviced in proportion to expected future cash flows and therefore provides a partial hedge against income statement translation exposure, as interest costs will be denominated in foreign currencies.
Under the Group’s foreign exchange management policy, foreign exchange transaction exposure in Group companies is generally maintained at the lower of €5 million per currency per month or €15 million per currency over a six month period.
The Group recognises foreign exchange movements in equity for the translation of net investment hedging instruments and balances treated as investments in foreign operations. However, there is no net impact on equity for exchange rate movements on net investment hedging instruments as there would be an offset in the currency translation of the foreign operation.
The following table details the Group’s sensitivity of the Group’s adjusted operating profit to a strengthening of the Group’s major currency in which it transacts. The percentage movement applied to the currency is based on the average movements in the previous three annual reporting periods. Amounts are calculated by retranslating the operating profit of each entity whose functional currency is euro.
2014 £m
Euro 3% change – Operating profit1 60
Note:1 Operating profit before impairment losses and other income and expense.
At 31 March 2013, sensitivity of the Group’s operating profit was analysed for a strengthening of the euro by 3% and the US dollar by 4%, which represented movements of £106 million and £257 million respectively.
Equity riskThe Group has equity investments, which are subject to equity risk. See note 13 “Other investments” for further details.
Notes to the consolidated financial statements (continued)
Vodafone Group Plc Annual Report 2014150

Fair value of financial instrumentsThe table below sets out the valuation basis1 of financial instruments held at fair value by the Group at 31 March 2014.
Level 12 Level 23 Total
2014 Restated
2013 2014 Restated
2013 2014 Restated
2013 £m £m £m £m £m £m
Financial assets: Fair value through the income statement (held for trading) – – 3,792 4,836 3,792 4,836Derivative financial instruments:
Interest rate swaps – – 1,871 2,625 1,871 2,625Cross currency interest rate swaps – – 504 319 504 319Foreign exchange contracts – – 68 88 68 88Interest rate futures – – 13 52 13 52
– – 6,248 7,920 6,248 7,920Financial investments available-for-sale:
Listed equity securities4 6 3 – – 6 3Unlisted equity securities4 – – 154 498 154 498
6 3 154 498 160 501 6 3 6,402 8,418 6,408 8,421Financial liabilities:
Derivative financial instruments: Interest rate swaps – – 635 1,060 635 1,057Cross currency interest rate swaps – – 217 – 217 –Foreign exchange contracts – – 29 44 29 44
– – 881 1,104 881 1,101
Notes:1 There were no changes made during the year to valuation methods or the processes to determine classification and no transfers were made between the levels in the fair value hierarchy.2 Level 1 classification comprises financial instruments where fair value is determined by unadjusted quoted prices in active markets for identical assets or liabilities.3 Level 2 classification comprises where fair value is determined from inputs other than quoted prices that are observable for the asset or liability, either directly or indirectly. Fair values for unlisted equity securities are derived
from observable quoted market prices for similar items. Derivative financial instrument fair values are present values determined from future cash flows discounted at rates derived from market sourced data.4 Details of listed and unlisted equity securities are included in note 13 “Other Investments”.
Offsetting of financial assets and financial liabilitiesFinancial assets and liabilities included in the table above do not meet the required criteria to offset in the balance sheet but derivative financial assets at 31 March of up to £678 million (2013: £857 million) would be settled net in certain circumstances under ISDA (International Swaps and Derivatives Association) agreements where each party has the option to settle amounts on a net basis in the event of default from the other. Under the Group’s collateral support agreements described above, under “credit risk” collateral has been posted of £130 million (2013: £117 million) and received of £1,185 million (2013: £1,151 million). Collateral may be offset and net settled against derivative financial instruments in the event of default by either party. The aforementioned collateral balances are recorded in “other short-term investments” or “short-term debt” respectively.
24. Directors and key management compensation
This note details the total amounts earned by the Company’s directors and members of the Executive Committee.
DirectorsAggregate emoluments of the directors of the Company were as follows:
2014 Restated
2013 Restated
2012 £m £m £m
Salaries and fees 4 5 5 Incentive schemes1 2 2 3 Other benefits2 1 1 1 7 8 9
Notes:1 Amounts payable under incentive schemes have been restated to exclude £5 million and £1 million of cash in lieu of long-term incentive scheme dividends for the years ended 31 March 2013 and 31 March 2012, respectively.2 Includes the value of the cash allowance taken by some individuals in lieu of pension contributions.
The aggregate gross pre-tax gain made on the exercise of share options in the year ended 31 March 2014 by directors who served during the year was £4 million (2013: £2 million; 2012: £nil).
Vodafone Group Plc Annual Report 2014150 151Overview
Strategy review Performance Governance Financials
Additional information

24. Directors and key management compensation (continued)
Key management compensationAggregate compensation for key management, being the directors and members of the Executive Committee, was as follows:
2014 Restated
2013 Restated
2012 £m £m £m
Short-term employee benefits1 17 17 16Share-based payments 21 23 26 38 40 42
Notes:1 Amounts payable under short-term employee benefits have been restated to exclude £8 million and £2 million of cash in lieu of long-term incentive scheme dividends for the years ended 31 March 2013 and 31 March 2012,
respectively.
25. Employees
This note shows the average number of people employed by the Group during the year, in which areas of our business our employees work and where they are based. It also shows total employment costs.
2014 Restated
2013 Restated
2012 Employees Employees Employees
By activity: Operations 14,947 13,736 12,952 Selling and distribution 31,342 29,658 27,190 Customer care and administration 42,857 39,198 37,003 89,146 82,592 77,145
By segment: Germany 10,623 11,088 12,115 Italy 1,123 – –Spain 3,552 4,223 4,379 UK 12,979 8,319 8,151 Other Europe 15,392 19,995 16,668 Europe 43,669 43,625 41,313
India 11,925 11,339 10,704 Vodacom 7,176 7,311 7,437 Other Africa, Middle East and Asia Pacific 16,002 12,659 11,431 Africa, Middle East and Asia Pacific 35,103 31,309 29,572
Non-Controlled Interests and Common Functions 10,374 7,658 6,260 Total 89,146 82,592 77,145
The cost incurred in respect of these employees (including directors) was:
2014 Restated
2013 Restated
2012 £m £m £m
Wages and salaries 3,261 2,989 2,774 Social security costs 364 350 323 Other pension costs (note 26) 158 157 122 Share-based payments (note 27) 92 124 133 3,875 3,620 3,352
Notes to the consolidated financial statements (continued)
Vodafone Group Plc Annual Report 2014152

26. Post employment benefits
We operate a number of defined benefit and defined contribution pension plans for our employees. The Group’s largest defined benefit schemes are in the UK. For further details see “Critical accounting judgements” in note 1 “Basis of preparation” to the consolidated financial statements.
Accounting policiesFor defined benefit retirement plans, the difference between the fair value of the plan assets and the present value of the plan liabilities is recognised as an asset or liability on the statement of financial position. Scheme liabilities are assessed using the projected unit funding method and applying the principal actuarial assumptions at the reporting period date. Assets are valued at market value.
Actuarial gains and losses are taken to the statement of comprehensive income as incurred. For this purpose, actuarial gains and losses comprise both the effects of changes in actuarial assumptions and experience adjustments arising because of differences between the previous actuarial assumptions and what has actually occurred.
Other movements in the net surplus or deficit are recognised in the income statement, including the current service cost, any past service cost and the effect of any curtailment or settlements. The interest cost less the expected return on assets is also charged to the income statement. The amount charged to the income statement in respect of these plans is included within operating costs or in the Group’s share of the results of equity accounted operations, as appropriate.
The Group’s contributions to defined contribution pension plans are charged to the income statement as they fall due.
Cumulative actuarial gains and losses at 1 April 2004, the date of transition to IFRS, were recognised in the statement of financial position.
BackgroundAt 31 March 2014 the Group operated a number of pension plans for the benefit of its employees throughout the world, with varying rights and obligations depending on the conditions and practices in the countries concerned. The Group’s pension plans are provided through both defined benefit and defined contribution arrangements. Defined benefit schemes provide benefits based on the employees’ length of pensionable service and their final pensionable salary or other criteria. Defined contribution schemes offer employees individual funds that are converted into benefits at the time of retirement.
The Group operates defined benefit schemes in Germany, Ghana, India, Ireland, Italy, the UK and the United States. Defined contribution pension schemes are currently provided in Australia, Egypt, Germany, Greece, Hungary, India, Ireland, Italy, the Netherlands, New Zealand, Portugal, South Africa, Spain and the UK.
Income statement expense
2014 Restated
2013 Restated
2012 £m £m £m
Defined contribution schemes 124 118 113Defined benefit schemes 34 39 9 Total amount charged to income statement (note 25) 158 157 122
Defined benefit schemesThe Group’s principal defined benefit pension schemes are in the UK (the ‘UK Schemes’), being the Vodafone Group Pension Scheme (‘Vodafone UK plan’) and the Cable & Wireless Worldwide Retirement Plan (‘CWWRP’). The Vodafone UK plan and the CWWRP plan closed to future accrual on 31 March 2010 and 30 November 2013, respectively. Until 30 November 2013 the CWWRP allowed employees to accrue a pension at a rate of 1/85th of their final salary for each year of service until the retirement age of 60 with a maximum pension of two thirds of final salary. Employees contributed 5% of their salary into the scheme. The CWWRP is expected to merge with the Vodafone UK plan during the second quarter of 2014.
The defined benefit plans are administered by Trustee Boards that are legally separated from the Group. The Trustee Board of each pension fund consists of representatives who are employees, former employees or are independent from the Company. The Board of the pension funds are required by law to act in the best interest of the plan participants and are responsible for setting certain policies, such as investment and contribution policies and the governance of the fund.
The defined benefit pension schemes expose the Group to actuarial risks such as longer than expected longevity of members, lower than expected return on investments and higher than expected inflation, which may increase the liabilities or reduce the value of assets of the plans.
Vodafone Group Plc Annual Report 2014152 153Overview
Strategy review Performance Governance Financials
Additional information
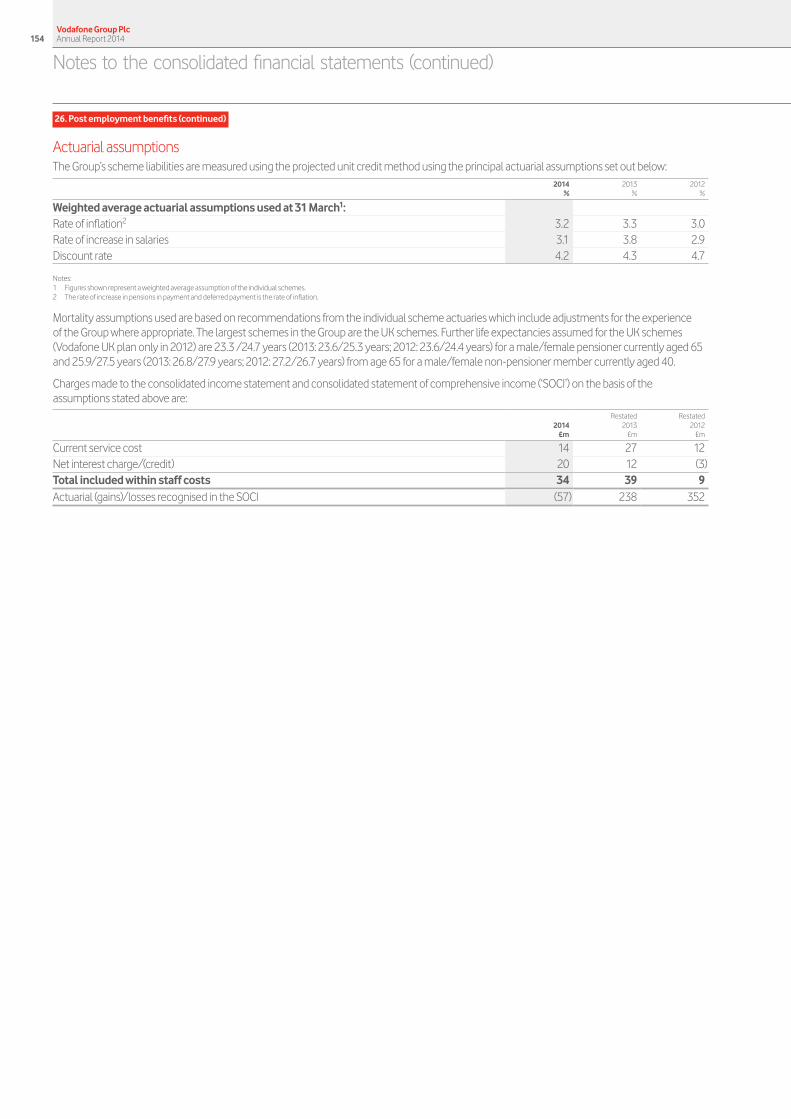
26. Post employment benefits (continued)
Actuarial assumptionsThe Group’s scheme liabilities are measured using the projected unit credit method using the principal actuarial assumptions set out below:
2014 2013 2012 % % %
Weighted average actuarial assumptions used at 31 March1: Rate of inflation2 3.2 3.3 3.0 Rate of increase in salaries 3.1 3.8 2.9 Discount rate 4.2 4.3 4.7
Notes:1 Figures shown represent a weighted average assumption of the individual schemes.2 The rate of increase in pensions in payment and deferred payment is the rate of inflation.
Mortality assumptions used are based on recommendations from the individual scheme actuaries which include adjustments for the experience of the Group where appropriate. The largest schemes in the Group are the UK schemes. Further life expectancies assumed for the UK schemes (Vodafone UK plan only in 2012) are 23.3 /24.7 years (2013: 23.6/25.3 years; 2012: 23.6/24.4 years) for a male/female pensioner currently aged 65 and 25.9/27.5 years (2013: 26.8/27.9 years; 2012: 27.2/26.7 years) from age 65 for a male/female non-pensioner member currently aged 40.
Charges made to the consolidated income statement and consolidated statement of comprehensive income (‘SOCI’) on the basis of the assumptions stated above are:
2014 Restated
2013 Restated
2012 £m £m £m
Current service cost 14 27 12Net interest charge/(credit) 20 12 (3)Total included within staff costs 34 39 9Actuarial (gains)/losses recognised in the SOCI (57) 238 352
Notes to the consolidated financial statements (continued)
Vodafone Group Plc Annual Report 2014154

Fair value of the assets and present value of the liabilities of the schemesThe amount included in the statement of financial position arising from the Group’s obligations in respect of its defined benefit schemes is as follows:
2014 Restated
2013 Restated
2012 £m £m £m
Movement in pension assets: 1 April 3,723 1,604 1,558Exchange rate movements (13) 6 (22)Interest income 162 125 86Return on plan assets excluding interest income (114) 210 (17)Employer cash contributions 51 100 31Member cash contributions 7 8 6Benefits paid (81) (60) (39)Assets assumed in business combinations – 1,730 –Other movements 107 – 131 March 3,842 3,723 1,604
Movement in pension liabilities: 1 April 4,251 1,865 1,501Exchange rate movements (17) 9 (30)Service cost 14 27 12Interest cost 182 137 83Member cash contributions 7 8 6Remeasurements:
Actuarial losses/(gains) arising from changes in demographic assumptions (35) – –Actuarial losses/(gains) arising from changes in financial assumptions (44) 441 314Actuarial losses/(gains) arising from experience adjustments (92) 7 21
Benefits paid (81) (60) (39)Liabilities assumed in business combinations 121 1,772 2Other movements 85 45 (5)31 March 4,391 4,251 1,865
An analysis of net (deficit)/assets is provided below for the Group’s two largest defined benefit pension schemes in the UK and for the Group as a whole.
CWWRP Vodafone UK plan Group
2014 2013 2014 2013 2012 2011 2010 2014 Restated
2013 Restated
2012 Restated
2011 Restated
2010 £m £m £m £m £m £m £m £m £m £m £m £m
Analysis of net (deficit)/assets: Total fair value of scheme assets 1,780 1,827 1,343 1,328 1,218 1,180 1,131 3,842 3,723 1,604 1,558 1,487 Present value of funded scheme liabilities (1,732) (1,874) (1,677) (1,647) (1,444) (1,127) (1,276) (4,325) (4,239) (1,853) (1,488) (1,625)Net (deficit)/assets for funded schemes 48 (47) (334) (319) (226) 53 (145) (483) (516) (249) 70 (138)Present value of unfunded scheme liabilities – – – – – – – (66) (12) (12) (13) (15)Net (deficit)/assets 48 (47) (334) (319) (226) 53 (145) (549) (528) (261) 57 (153)Net (deficit)/assets are analysed as: Assets 48 – – – – 53 – 35 52 31 97 34 Liabilities – (47) (334) (319) (226) – (145) (584) (580) (292) (40) (187)
Vodafone Group Plc Annual Report 2014154 155Overview
Strategy review Performance Governance Financials
Additional information
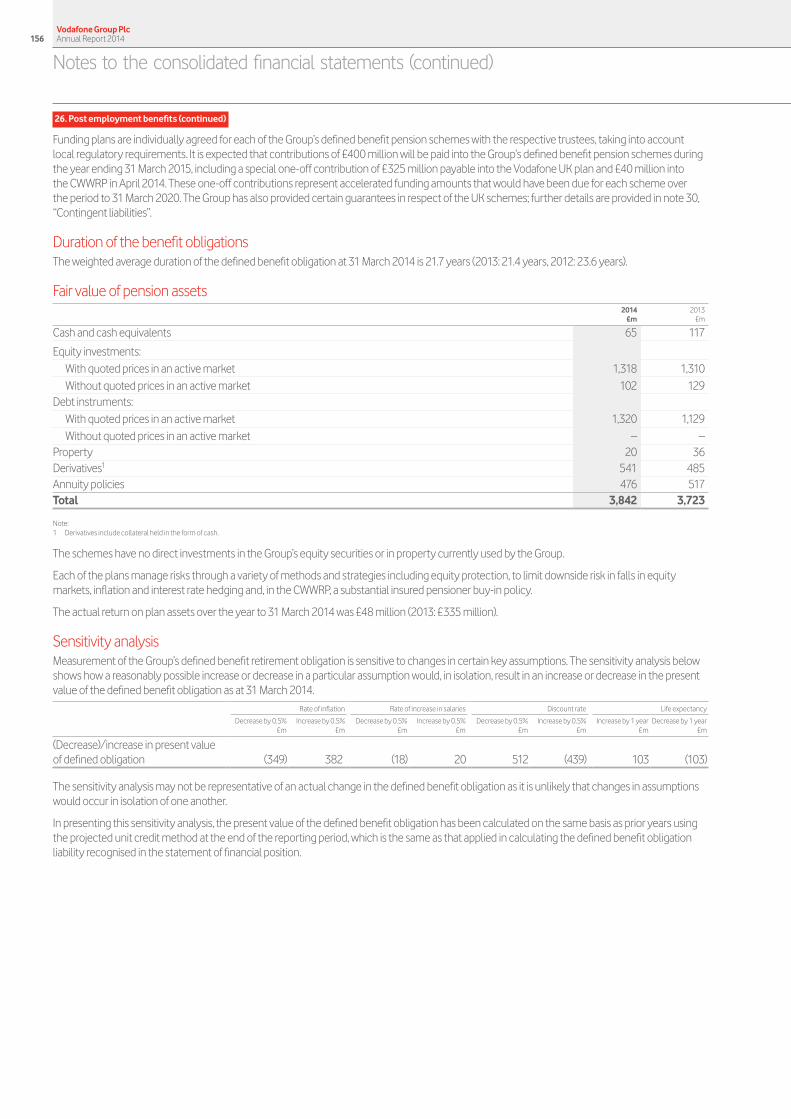
26. Post employment benefits (continued)
Funding plans are individually agreed for each of the Group’s defined benefit pension schemes with the respective trustees, taking into account local regulatory requirements. It is expected that contributions of £400 million will be paid into the Group’s defined benefit pension schemes during the year ending 31 March 2015, including a special one-off contribution of £325 million payable into the Vodafone UK plan and £40 million into the CWWRP in April 2014. These one-off contributions represent accelerated funding amounts that would have been due for each scheme over the period to 31 March 2020. The Group has also provided certain guarantees in respect of the UK schemes; further details are provided in note 30, “Contingent liabilities”.
Duration of the benefit obligationsThe weighted average duration of the defined benefit obligation at 31 March 2014 is 21.7 years (2013: 21.4 years, 2012: 23.6 years).
Fair value of pension assets 2014 2013 £m £m
Cash and cash equivalents 65 117
Equity investments:With quoted prices in an active market 1,318 1,310Without quoted prices in an active market 102 129
Debt instruments:With quoted prices in an active market 1,320 1,129Without quoted prices in an active market – –
Property 20 36Derivatives1 541 485Annuity policies 476 517Total 3,842 3,723
Note:1 Derivatives include collateral held in the form of cash.
The schemes have no direct investments in the Group’s equity securities or in property currently used by the Group.
Each of the plans manage risks through a variety of methods and strategies including equity protection, to limit downside risk in falls in equity markets, inflation and interest rate hedging and, in the CWWRP, a substantial insured pensioner buy-in policy.
The actual return on plan assets over the year to 31 March 2014 was £48 million (2013: £335 million).
Sensitivity analysisMeasurement of the Group’s defined benefit retirement obligation is sensitive to changes in certain key assumptions. The sensitivity analysis below shows how a reasonably possible increase or decrease in a particular assumption would, in isolation, result in an increase or decrease in the present value of the defined benefit obligation as at 31 March 2014.
Rate of inflation Rate of increase in salaries Discount rate Life expectancy
Decrease by 0.5%£m
Increase by 0.5%£m
Decrease by 0.5%£m
Increase by 0.5%£m
Decrease by 0.5%£m
Increase by 0.5%£m
Increase by 1 year£m
Decrease by 1 year£m
(Decrease)/increase in present value of defined obligation (349) 382 (18) 20 512 (439) 103 (103)
The sensitivity analysis may not be representative of an actual change in the defined benefit obligation as it is unlikely that changes in assumptions would occur in isolation of one another.
In presenting this sensitivity analysis, the present value of the defined benefit obligation has been calculated on the same basis as prior years using the projected unit credit method at the end of the reporting period, which is the same as that applied in calculating the defined benefit obligation liability recognised in the statement of financial position.
Notes to the consolidated financial statements (continued)
Vodafone Group Plc Annual Report 2014156

27. Share-based payments
We have a number of share plans used to award shares to directors and employees as part of their remuneration package. A charge is recognised over the vesting period in the consolidated income statement to record the cost of these, based on the fair value of the award on the grant date.Accounting policiesThe Group issues equity-settled share-based payments to certain employees. Equity-settled share-based payments are measured at fair value (excluding the effect of non-market-based vesting conditions) at the date of grant. The fair value determined at the grant date of the equity-settled share-based payments is expensed on a straight-line basis over the vesting period, based on the Group’s estimate of the shares that will eventually vest and adjusted for the effect of non-market-based vesting conditions. A corresponding increase in retained earnings is also recognised.
Fair value is measured by deducting the present value of expected dividend cash flows over the life of the awards from the share price as at the grant date.
Some share awards have an attached market condition, based on total shareholder return (‘TSR’), which is taken into account when calculating the fair value of the share awards. The valuation for the TSR is based on Vodafone’s ranking within the same group of companies, where possible, over the past five years.
The fair value of awards of non-vested shares is equal to the closing price of the Group’s shares on the date of grant, adjusted for the present value of future dividend entitlements where appropriate.
The maximum aggregate number of ordinary shares which may be issued in respect of share options or share plans will not (without shareholder approval) exceed:
a 10% of the ordinary share capital of the Company in issue immediately prior to the date of grant, when aggregated with the total number of ordinary shares which have been allocated in the preceding ten year period under all plans; and
a 5% of the ordinary share capital of the Company in issue immediately prior to the date of grant, when aggregated with the total number of ordinary shares which have been allocated in the preceding ten year period under all plans, other than any plans which are operated on an all-employee basis.
Share optionsVodafone Group executive plansNo share options have been granted to any directors or employees under the Company’s discretionary share option plans in the year ended 31 March 2014.
There are options outstanding under the Vodafone Group 1999 Long-Term Stock Incentive Plan and the Vodafone Global Incentive Plan. These options are normally exercisable between three and ten years from the date of grant. The vesting of some of these options was subject to satisfaction of performance conditions. Grants made to US employees are made in respect of ADSs.
Vodafone Group Sharesave PlanThe Vodafone Group 2008 Sharesave Plan enables UK staff to acquire shares in the Company through monthly savings of up to £250 over a three and/or five year period, at the end of which they may also receive a tax free bonus. The savings and bonus may then be used to purchase shares at the option price, which is set at the beginning of the invitation period and usually at a discount of 20% to the then prevailing market price of the Company’s shares.
Share plansVodafone Group executive plansUnder the Vodafone Global Incentive Plan awards of shares are granted to directors and certain employees. The release of these shares is conditional upon continued employment and for some awards achievement of certain performance targets measured over a three year period.
Vodafone Share Incentive PlanThe Vodafone Share Incentive Plan enables UK staff to acquire shares in the Company through monthly purchases of up to £125 per month or 5% of salary, whichever is lower. For each share purchased by the employee, the Company provides a free matching share.
Vodafone Group Plc Annual Report 2014156 157Overview
Strategy review Performance Governance Financials
Additional information

27. Share-based payments (continued)
Movements in outstanding ordinary share and ADS options ADS options Ordinary share options
2014 2013 2012 2014 2013 2012 Millions Millions Millions Millions Millions Millions
1 April – 1 1 40 84 171 Granted during the year – – – 12 7 5 Forfeited during the year – – – (1) (1) (1)Exercised during the year – (1) – (22) (41) (55)Expired during the year – – – (2) (9) (36)31 March – – 1 27 40 84
Weighted average exercise price: 1 April US$22.16 US$15.20 US$14.82 £1.41 £1.18 £1.32 Granted during the year – – – £1.49 £1.45 £1.31 Forfeited during the year – – – £1.34 £1.64 £1.07 Exercised during the year US$29.31 US$13.88 – £1.43 £1.05 £1.37 Expired during the year – – – £1.37 £0.98 £1.56 31 March – US$22.16 US$15.20 £1.42 £1.41 £1.18
Summary of options outstanding and exercisable at 31 March 2014 Outstanding Exercisable
Weighted Weighted average average Weighted remaining Weighted remaining Outstanding average contractual Exercisable average contractual shares exercise life shares exercise life Millions price Months Millions price Months
Vodafone Group savings related and Sharesave Plan: £0.01–£1.00 2 £0.94 11 – – –£1.01–£2.00 21 £1.43 37 – – – 23 £1.38 34 – – –Vodafone Group 1999 Long-Term Stock Incentive Plan:£1.01–£2.00 4 £1.60 34 4 £1.60 34
Share awardsMovements in non-vested shares are as follows:
2014 2013 2012
Weighted Weighted Weighted average fair average fair average fair value at value at value at Millions grant date Millions grant date Millions grant date
1 April 294 £1.27 352 £1.08 387 £1.00Granted 84 £1.58 91 £1.49 120 £1.29
Vested (81) £1.11 (118) £0.91 (116) £1.12Forfeited (54) £1.19 (31) £1.19 (39) £0.8131 March 243 £1.44 294 £1.27 352 £1.08
Other informationThe total fair value of shares vested during the year ended 31 March 2014 was £90 million (2013: £107 million; 2012: £130 million).
The compensation cost included in the consolidated income statement in respect of share options and share plans was £92 million (2013: £124 million; 2012: £133 million) which is comprised entirely of equity-settled transactions.
The average share price for the year ended 31 March 2014 was 212.2 pence (2013: 173.0 pence; 2012: 169.9 pence).
Notes to the consolidated financial statements (continued)
Vodafone Group Plc Annual Report 2014158

28. Acquisitions and disposals
We made a number of acquisitions during the year including the acquisition of a controlling interest in Kabel Deutschland Holding AG and the remaining interest in our business in Italy, Vodafone Omnitel B.V. thus obtaining control. The note below provides details of these transactions as well as those in the prior year. For further details see “Critical accounting judgements” in note 1 “Basis of preparation” to the consolidated financial statements.Accounting policiesBusiness combinationsAcquisitions of subsidiaries are accounted for using the acquisition method. The cost of the acquisition is measured at the aggregate of the fair values at the date of exchange of assets given, liabilities incurred or assumed and equity instruments issued by the Group. Acquisition-related costs are recognised in the income statement as incurred. The acquiree’s identifiable assets and liabilities are recognised at their fair values at the acquisition date. Goodwill is measured as the excess of the sum of the consideration transferred, the amount of any non-controlling interests in the acquiree and the fair value of the Group’s previously held equity interest in the acquiree, if any, over the net amounts of identifiable assets acquired and liabilities assumed at the acquisition date. The interest of the non-controlling shareholders in the acquiree may initially be measured either at fair value or at the non-controlling shareholders’ proportion of the net fair value of the identifiable assets acquired, liabilities and contingent liabilities assumed. The choice of measurement basis is made on an acquisition-by-acquisition basis.
Acquisition of interests from non-controlling shareholdersIn transactions with non-controlling parties that do not result in a change in control, the difference between the fair value of the consideration paid or received and the amount by which the non-controlling interest is adjusted is recognised in equity.
AcquisitionsThe aggregate cash consideration in respect of purchases of interests in subsidiaries, net of cash acquired, is as follows:
£m
Cash consideration paid: Kabel Deutschland Holding AG (including fees of £17 million) 4,872Other acquisitions completed during the year 6
4,878 Net cash acquired (599)
4,279
In addition, the Group acquired a 100% interest in Vodafone Omnitel B.V. as part of the disposal of the Group’s interest in Verizon Wireless for consideration of £7,121 million. The purchase consideration has been determined based on the acquisition-date fair value of the equity in Vodafone Omnitel B.V., being considered to be a more reliable method of determining fair value than estimating the attributable proportion of the fair value of the investment in Verizon Wireless. The equity value has been determined on a value in use basis using discounted estimated cash flows using the methodology and assumptions detailed in note 4 “Impairment losses”.
Total goodwill acquired was £6,859 million and included £3,848 million in relation to Kabel Deutschland Holding AG, £3,007 million in relation to Vodafone Omnitel B.V. and £4 million in relation to other acquisitions completed during the year. Acquisitions and disposals (continued)
159OverviewStrategy review Performance Governance Financials
Additional information
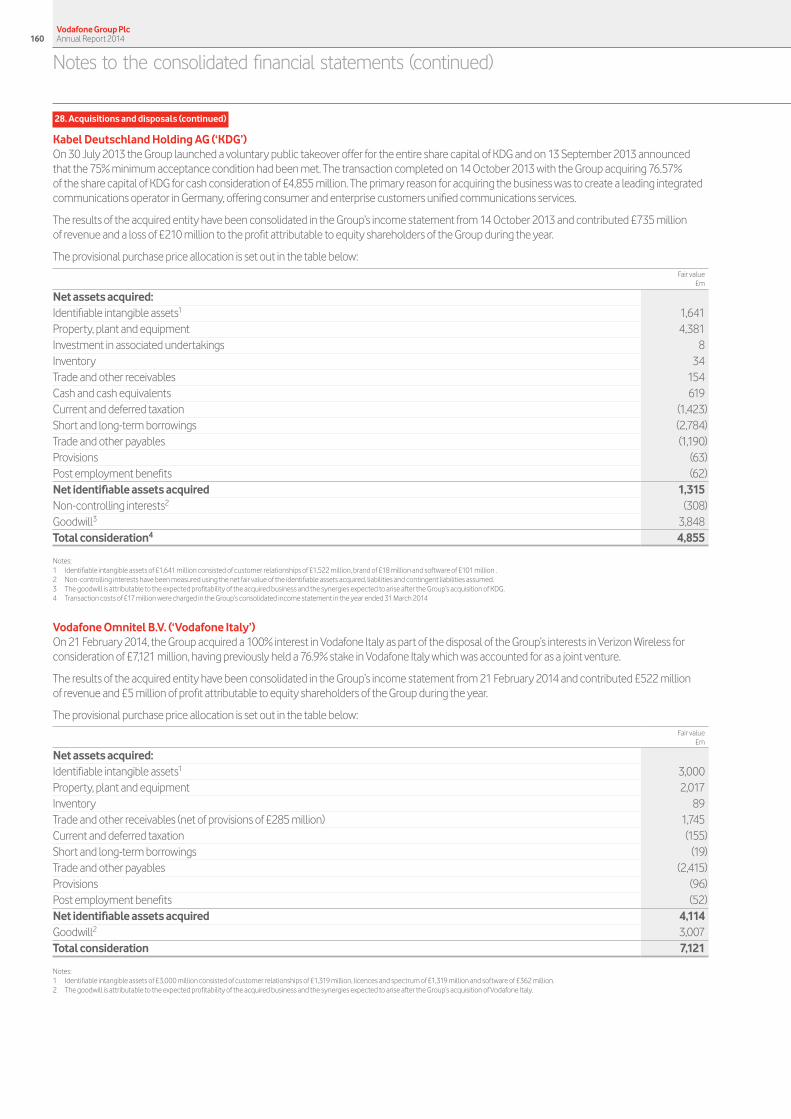
28. Acquisitions and disposals (continued)
Kabel Deutschland Holding AG (‘KDG’)On 30 July 2013 the Group launched a voluntary public takeover offer for the entire share capital of KDG and on 13 September 2013 announced that the 75% minimum acceptance condition had been met. The transaction completed on 14 October 2013 with the Group acquiring 76.57% of the share capital of KDG for cash consideration of £4,855 million. The primary reason for acquiring the business was to create a leading integrated communications operator in Germany, offering consumer and enterprise customers unified communications services.
The results of the acquired entity have been consolidated in the Group’s income statement from 14 October 2013 and contributed £735 million of revenue and a loss of £210 million to the profit attributable to equity shareholders of the Group during the year.
The provisional purchase price allocation is set out in the table below: Fair value £m
Net assets acquired: Identifiable intangible assets1 1,641Property, plant and equipment 4,381Investment in associated undertakings 8Inventory 34Trade and other receivables 154Cash and cash equivalents 619Current and deferred taxation (1,423)Short and long-term borrowings (2,784)Trade and other payables (1,190)Provisions (63)Post employment benefits (62)Net identifiable assets acquired 1,315Non-controlling interests2 (308)Goodwill3 3,848 Total consideration4 4,855
Notes:1 Identifiable intangible assets of £1,641 million consisted of customer relationships of £1,522 million, brand of £18 million and software of £101 million .2 Non-controlling interests have been measured using the net fair value of the identifiable assets acquired, liabilities and contingent liabilities assumed. 3 The goodwill is attributable to the expected profitability of the acquired business and the synergies expected to arise after the Group’s acquisition of KDG.4 Transaction costs of £17 million were charged in the Group’s consolidated income statement in the year ended 31 March 2014
Vodafone Omnitel B.V. (‘Vodafone Italy’)On 21 February 2014, the Group acquired a 100% interest in Vodafone Italy as part of the disposal of the Group’s interests in Verizon Wireless for consideration of £7,121 million, having previously held a 76.9% stake in Vodafone Italy which was accounted for as a joint venture.
The results of the acquired entity have been consolidated in the Group’s income statement from 21 February 2014 and contributed £522 million of revenue and £5 million of profit attributable to equity shareholders of the Group during the year.
The provisional purchase price allocation is set out in the table below: Fair value £m
Net assets acquired: Identifiable intangible assets1 3,000Property, plant and equipment 2,017Inventory 89Trade and other receivables (net of provisions of £285 million) 1,745Current and deferred taxation (155)Short and long-term borrowings (19)Trade and other payables (2,415)Provisions (96)Post employment benefits (52)Net identifiable assets acquired 4,114 Goodwill2 3,007Total consideration 7,121
Notes:1 Identifiable intangible assets of £3,000 million consisted of customer relationships of £1,319 million, licences and spectrum of £1,319 million and software of £362 million. 2 The goodwill is attributable to the expected profitability of the acquired business and the synergies expected to arise after the Group’s acquisition of Vodafone Italy.
Vodafone Group Plc Annual Report 2014160
Notes to the consolidated financial statements (continued)
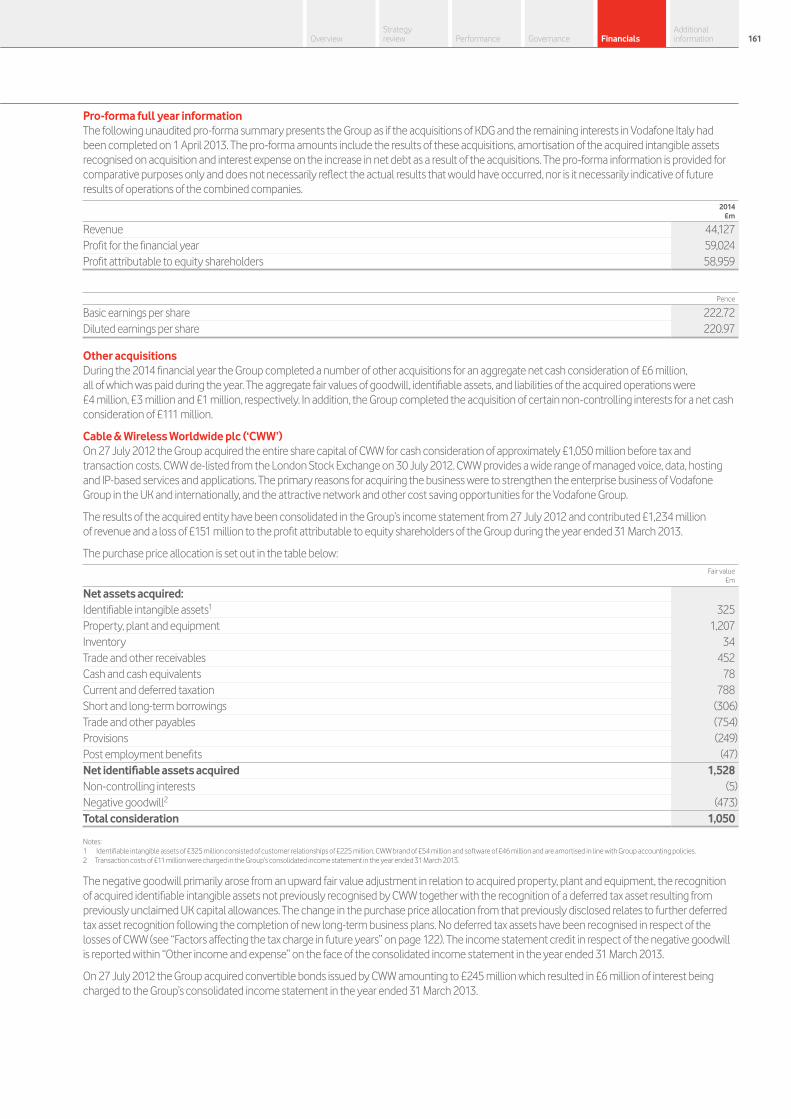
Pro-forma full year informationThe following unaudited pro-forma summary presents the Group as if the acquisitions of KDG and the remaining interests in Vodafone Italy had been completed on 1 April 2013. The pro-forma amounts include the results of these acquisitions, amortisation of the acquired intangible assets recognised on acquisition and interest expense on the increase in net debt as a result of the acquisitions. The pro-forma information is provided for comparative purposes only and does not necessarily reflect the actual results that would have occurred, nor is it necessarily indicative of future results of operations of the combined companies.
2014 £m
Revenue 44,127Profit for the financial year 59,024Profit attributable to equity shareholders 58,959
Pence
Basic earnings per share 222.72Diluted earnings per share 220.97
Other acquisitionsDuring the 2014 financial year the Group completed a number of other acquisitions for an aggregate net cash consideration of £6 million, all of which was paid during the year. The aggregate fair values of goodwill, identifiable assets, and liabilities of the acquired operations were £4 million, £3 million and £1 million, respectively. In addition, the Group completed the acquisition of certain non-controlling interests for a net cash consideration of £111 million.
Cable & Wireless Worldwide plc (‘CWW’) On 27 July 2012 the Group acquired the entire share capital of CWW for cash consideration of approximately £1,050 million before tax and transaction costs. CWW de-listed from the London Stock Exchange on 30 July 2012. CWW provides a wide range of managed voice, data, hosting and IP-based services and applications. The primary reasons for acquiring the business were to strengthen the enterprise business of Vodafone Group in the UK and internationally, and the attractive network and other cost saving opportunities for the Vodafone Group.
The results of the acquired entity have been consolidated in the Group’s income statement from 27 July 2012 and contributed £1,234 million of revenue and a loss of £151 million to the profit attributable to equity shareholders of the Group during the year ended 31 March 2013.
The purchase price allocation is set out in the table below: Fair value £m
Net assets acquired: Identifiable intangible assets1 325 Property, plant and equipment 1,207 Inventory 34 Trade and other receivables 452 Cash and cash equivalents 78 Current and deferred taxation 788 Short and long-term borrowings (306)Trade and other payables (754)Provisions (249)Post employment benefits (47)Net identifiable assets acquired 1,528 Non-controlling interests (5)Negative goodwill2 (473) Total consideration 1,050
Notes:1 Identifiable intangible assets of £325 million consisted of customer relationships of £225 million, CWW brand of £54 million and software of £46 million and are amortised in line with Group accounting policies.2 Transaction costs of £11 million were charged in the Group’s consolidated income statement in the year ended 31 March 2013.
The negative goodwill primarily arose from an upward fair value adjustment in relation to acquired property, plant and equipment, the recognition of acquired identifiable intangible assets not previously recognised by CWW together with the recognition of a deferred tax asset resulting from previously unclaimed UK capital allowances. The change in the purchase price allocation from that previously disclosed relates to further deferred tax asset recognition following the completion of new long-term business plans. No deferred tax assets have been recognised in respect of the losses of CWW (see “Factors affecting the tax charge in future years” on page 122). The income statement credit in respect of the negative goodwill is reported within “Other income and expense” on the face of the consolidated income statement in the year ended 31 March 2013.
On 27 July 2012 the Group acquired convertible bonds issued by CWW amounting to £245 million which resulted in £6 million of interest being charged to the Group’s consolidated income statement in the year ended 31 March 2013.
Vodafone Group Plc Annual Report 2014160 161Overview
Strategy review Performance Governance Financials
Additional information
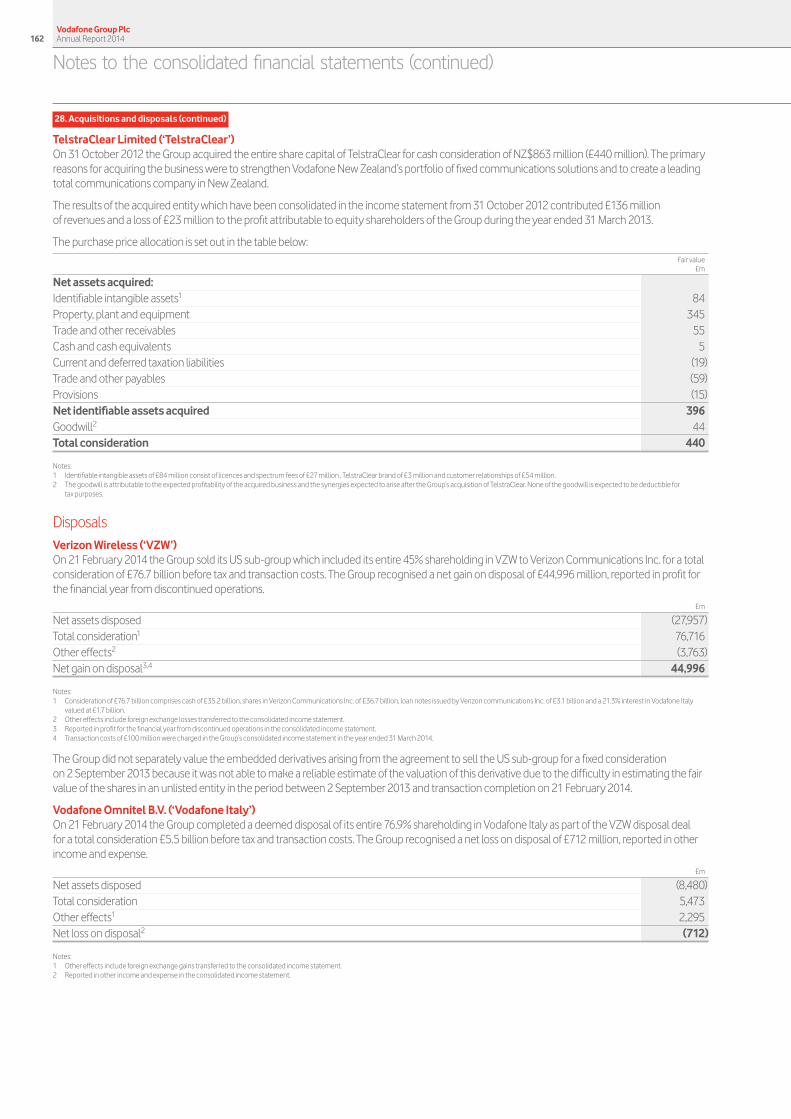
28. Acquisitions and disposals (continued)
TelstraClear Limited (‘TelstraClear’)On 31 October 2012 the Group acquired the entire share capital of TelstraClear for cash consideration of NZ$863 million (£440 million). The primary reasons for acquiring the business were to strengthen Vodafone New Zealand’s portfolio of fixed communications solutions and to create a leading total communications company in New Zealand.
The results of the acquired entity which have been consolidated in the income statement from 31 October 2012 contributed £136 million of revenues and a loss of £23 million to the profit attributable to equity shareholders of the Group during the year ended 31 March 2013.
The purchase price allocation is set out in the table below: Fair value £m
Net assets acquired: Identifiable intangible assets1 84 Property, plant and equipment 345 Trade and other receivables 55 Cash and cash equivalents 5 Current and deferred taxation liabilities (19)Trade and other payables (59)Provisions (15)Net identifiable assets acquired 396 Goodwill2 44 Total consideration 440
Notes:1 Identifiable intangible assets of £84 million consist of licences and spectrum fees of £27 million , TelstraClear brand of £3 million and customer relationships of £54 million.2 The goodwill is attributable to the expected profitability of the acquired business and the synergies expected to arise after the Group’s acquisition of TelstraClear. None of the goodwill is expected to be deductible for
tax purposes.
DisposalsVerizon Wireless (‘VZW’)On 21 February 2014 the Group sold its US sub-group which included its entire 45% shareholding in VZW to Verizon Communications Inc. for a total consideration of £76.7 billion before tax and transaction costs. The Group recognised a net gain on disposal of £44,996 million, reported in profit for the financial year from discontinued operations.
£m
Net assets disposed (27,957)Total consideration1 76,716Other effects2 (3,763)Net gain on disposal3,4 44,996
Notes:1 Consideration of £76.7 billion comprises cash of £35.2 billion, shares in Verizon Communications Inc. of £36.7 billion, loan notes issued by Verizon communications Inc. of £3.1 billion and a 21.3% interest in Vodafone Italy
valued at £1.7 billion.2 Other effects include foreign exchange losses transferred to the consolidated income statement.3 Reported in profit for the financial year from discontinued operations in the consolidated income statement.4 Transaction costs of £100 million were charged in the Group’s consolidated income statement in the year ended 31 March 2014.
The Group did not separately value the embedded derivatives arising from the agreement to sell the US sub-group for a fixed consideration on 2 September 2013 because it was not able to make a reliable estimate of the valuation of this derivative due to the difficulty in estimating the fair value of the shares in an unlisted entity in the period between 2 September 2013 and transaction completion on 21 February 2014.
Vodafone Omnitel B.V. (‘Vodafone Italy’)On 21 February 2014 the Group completed a deemed disposal of its entire 76.9% shareholding in Vodafone Italy as part of the VZW disposal deal for a total consideration £5.5 billion before tax and transaction costs. The Group recognised a net loss on disposal of £712 million, reported in other income and expense.
£m
Net assets disposed (8,480)Total consideration 5,473Other effects1 2,295Net loss on disposal2 (712)
Notes:1 Other effects include foreign exchange gains transferred to the consolidated income statement.2 Reported in other income and expense in the consolidated income statement.
Vodafone Group Plc Annual Report 2014162
Notes to the consolidated financial statements (continued)

29. Commitments
A commitment is a contractual obligation to make a payment in the future, mainly in relation to leases and agreements to buy assets such as network infrastructure and IT systems. These amounts are not recorded in the consolidated statement of financial position since we have not yet received the goods or services from the supplier. The amounts below are the minimum amounts that we are committed to pay.Accounting policiesLeases are classified as finance leases whenever the terms of the lease transfer substantially all the risks and rewards of ownership of the asset to the lessee. All other leases are classified as operating leases.
Assets held under finance leases are recognised as assets of the Group at their fair value at the inception of the lease or, if lower, at the present value of the minimum lease payments as determined at the inception of the lease. The corresponding liability to the lessor is included in the statement of financial position as a finance lease obligation. Lease payments are apportioned between finance charges and reduction of the lease obligation so as to achieve a constant rate of interest on the remaining balance of the liability. Finance charges are recognised in the income statement.
Rentals payable under operating leases are charged to the income statement on a straight-line basis over the term of the relevant lease. Benefits received and receivable as an incentive to enter into an operating lease are also spread on a straight-line basis over the lease term.
Operating lease commitmentsThe Group has entered into commercial leases on certain properties, network infrastructure, motor vehicles and items of equipment. The leases have various terms, escalation clauses, purchase options and renewal rights, none of which are individually significant to the Group.
Future minimum lease payments under non-cancellable operating leases comprise:
2014 Restated
2013 £m £m
Within one year 1,128 1,094 In more than one year but less than two years 841 914 In more than two years but less than three years 678 721 In more than three years but less than four years 557 612 In more than four years but less than five years 477 519 In more than five years 2,051 2,243 5,732 6,103
The total of future minimum sublease payments expected to be received under non-cancellable subleases is £313 million (2013: £314 million).
Capital commitmentsCompany and subsidiaries Share of joint operations Group
2014
£m
Restated2013
£m 2014
£m
Restated2013
£m 2014
£m
Restated2013
£m
Contracts placed for future capital expenditure not provided in the financial statements1 2,307 1,715 28 18 2,335 1,733
Note:1 Commitment includes contracts placed for property, plant and equipment and intangible assets.
Grupo Corporativo Ono, S.A. (‘Ono’)On 17 March 2014, Vodafone agreed to acquire Ono for a total consideration equivalent to €7.2 billion (£6.0 billion) on a debt and cash free basis. Ono has the largest next-generation network in Spain and the acquisition enables Vodafone to take advantage of the rapid increase in the adoption of unified communications products and services in the Spanish market. The acquisition, which is subject to customary terms and conditions including anti-trust clearances by the relevant authorities, is expected to complete in calendar Q3 2014.
Vodafone Group Plc Annual Report 2014162 163Overview
Strategy review Performance Governance Financials
Additional information

30. Contingent liabilities
Contingent liabilities are potential future cash outflows, where the likelihood of payment is considered more than remote, but is not considered probable or cannot be measured reliably.
2014 Restated
2013 £m £m
Performance bonds1 442 266 Other guarantees and contingent liabilities2 2,500 1,257
Notes:1 Performance bonds require the Group to make payments to third parties in the event that the Group does not perform what is expected of it under the terms of any related contracts or commercial arrangements.2 Other guarantees principally comprise Vodafone Group Plc’s guarantee of the Group’s 50% share of an AUD 1.7 billion loan facility and a US$3.5 billion loan facility of its joint venture, Vodafone Hutchison Australia Pty Limited.
UK pension schemesThe Group has covenanted to provide security in favour of the Trustee of the Vodafone Group Pension Scheme whilst there is a deficit in the scheme. The deficit is measured on a prescribed basis agreed between the Group and Trustee. In 2010 the Group and Trustee agreed security of a charge over UK index linked gilts (‘ILG’) held by the Group. In December 2011, the security was increased by an additional charge over further ILG due to a significant increase in the deficit at that time.
In April 2014, the security was reduced following a reduction in the deficit following the results of the 2013 valuation and a £325 million company contribution to the Scheme (see note 26 “Post employment benefits”). The scheme retains security over £186.5 million (notional value) 2017 ILGs. The security may be substituted either on a voluntary or mandatory basis. As and when alternative security is provided, the Group has agreed that the security cover should include additional headroom of 33%, although if cash is used as the security asset the ratio will revert to 100% of the relevant liabilities or where the proposed replacement security asset is listed on an internationally recognised stock exchange in certain core jurisdictions, the Trustee may decide to agree a lower ratio than 133%. The Company has also provided two guarantees to the scheme for a combined value up to €1.5 billion to provide security over the deficit under certain defined circumstances, including insolvency of the employers.
The Company has also agreed similar guarantees for the Trustees of the Cable & Wireless Worldwide Retirement Plan and THUS Plc Group Scheme up to £1.25 billion and £110 million respectively, following the acquisition of Cable & Wireless Worldwide plc.
Legal proceedings The Company and its subsidiaries are currently, and may be from time to time, involved in a number of legal proceedings including inquiries from, or discussions with, governmental authorities that are incidental to their operations. However, save as disclosed below, the Company and its subsidiaries are not currently involved in any legal or arbitration proceedings (including any governmental proceedings which are pending or known to be contemplated) which may have, or have had in the 12 months preceding the date of this report, a significant effect on the financial position or profitability of the Company and its subsidiaries. Due to inherent uncertainties, no accurate quantification of any cost, or timing of such cost, which may arise from any of the legal proceedings outlined below can be made.
Materiality is lower than for the year ended 31 March 2013 as a result of the disposal of the Group’s interest in Verizon Wireless and accordingly, certain matters discussed below were not disclosed in prior years.
Telecom Egypt arbitrationIn October 2009 Telecom Egypt commenced arbitration against Vodafone Egypt in Cairo alleging breach of non-discrimination provisions in an interconnection agreement as a result of lower interconnection rates paid to Vodafone Egypt by Mobinil. Telecom Egypt has also sought to join Vodafone International Holdings BV (‘VIHBV’), Vodafone Europe BV (‘VEBV’) and Vodafone Group Plc (which Telecom Egypt alleges should be held jointly liable with Vodafone Egypt) to the arbitration. VIHBV, VEBV and Vodafone Group Plc deny that they were subject to the interconnection agreement or any arbitration agreement with Telecom Egypt. Telecom Egypt initially quantified its claim at approximately €190 million in 2009. This was subsequently amended and increased to €551 million in January 2011 and further increased to its current value of just over €1.2 billion in November 2011. The Company disputes Telecom Egypt’s claim (and assertion of jurisdiction over VIHBV, VEBV and Vodafone Group Plc) and will continue to defend the Vodafone companies’ position vigorously. The arbitration hearing concluded in November 2013. The parties completed final written submissions in March 2014. A decision is now awaited from the tribunal during 2014.
Indian tax caseIn August 2007 and September 2007, Vodafone India Limited (‘VIL’) and VIHBV respectively received notices from the Indian tax authority alleging potential liability in connection with an alleged failure by VIHBV to deduct withholding tax from consideration paid to the Hutchison Telecommunications International Limited group (‘HTIL’) in respect of HTIL’s gain on its disposal to VIHBV of its interests in a wholly-owned subsidiary that indirectly holds interests in VIL. In January 2012 the Indian Supreme Court handed down its judgement, holding that VIHBV’s interpretation of the Income Tax Act 1961 was correct, that the HTIL transaction in 2007 was not taxable in India, and that consequently, VIHBV had no obligation to withhold tax from consideration paid to HTIL in respect of the transaction. The Indian Supreme Court quashed the relevant notices and demands issued to VIHBV in respect of withholding tax and interest. On 20 March 2012 the Indian Government returned VIHBV’s deposit of INR 25 billion and released the guarantee for INR 85 billion, which was based on the demand for payment issued by the Indian tax authority in October 2010, for tax of INR 79 billion plus interest.
On 16 March 2012, the Indian Government introduced proposed legislation (the ‘Finance Bill 2012’) purporting to overturn the Indian Supreme Court’s judgement with retrospective effect back to 1962. On 17 April 2012, Vodafone International Holdings BV (‘VIHBV’) filed a trigger notice under the Dutch-India Bilateral Investment Treaty (‘BIT’) signalling its intent to invoke arbitration under the BIT should the new laws be enacted. The Finance Bill 2012 received Presidential assent and became law on 28 May 2012 (the ‘Finance Act 2012’). The Finance Act 2012 is intended to tax any gain on transfer of shares in a non-Indian company, which derives substantial value from underlying Indian assets, such as VIHBV’s transaction with HTIL in 2007. Further it seeks to subject a purchaser, such as VIHBV, to a retrospective obligation to withhold tax.
Vodafone Group Plc Annual Report 2014164
Notes to the consolidated financial statements (continued)

The Indian Government commissioned a committee of experts (the ‘Shome committee’) consisting of academics, and current and former Indian government officials, to examine, and make recommendations in respect of, aspects of the Finance Act 2012 including the retrospective taxation of transactions such as VIHBV’s transaction with HTIL referred to above. On 10 October 2012, the Shome committee published its draft report for comment. The draft report concluded that tax legislation in the Finance Act 2012 should only be applied prospectively or, if applied retrospectively, that only a seller who made a gain should be liable and, in that case, without any liability for interest or penalties. The Shome committee’s final report was submitted to the Indian Government on 31 October 2012, but no final report has been published, and it remains unclear what the Indian Government intends to do with the Shome committee’s final report or its recommendations.
VIHBV has not received any formal demand for taxation following the Finance Act 2012, but it did receive a letter on 3 January 2013 reminding it of the tax demand raised prior to the Indian Supreme Court’s judgement and purporting to update the interest element of that demand to a total amount of INR 142 billion. The separate proceedings taken against VIHBV to seek to treat it as an agent of HTIL in respect of its alleged tax on the same transaction, as well as penalties of up to 100% of the assessed withholding tax for the alleged failure to have withheld such taxes, remain pending despite the issue having been ruled upon by the Indian Supreme Court. Should a further demand for taxation be received by VIHBV or any member of the Group as a result of the new retrospective legislation, we believe it is probable that we will be able to make a successful claim under the BIT. Although this would not result in any outflow of economic benefit from the Group, it could take several years for VIHBV to recover any deposit required by an Indian Court as a condition for any stay of enforcement of a tax demand pending the outcome of VIHBV’s BIT claim. However, VIHBV expects that it would be able to recover any such deposit. On 17 January 2014, VIHBV served on the Indian Government an amended trigger notice under the BIT, supplementing the trigger notice filed on 17 April 2012, to add claims relating to an attempt by the Indian Government to tax aspects of the transaction with Hutchison under transfer pricing rules. On 17 April 2014, VIHBV served its notice of arbitration under the BIT, formally commencing the BIT arbitration proceedings.
We did not carry a provision for this litigation or in respect of the retrospective legislation at 31 March 2014, or at previous reporting dates.
Other Indian tax casesVIL and Vodafone India Services Private Limited (‘VISPL’) (formerly 3GSPL) are involved in a number of tax cases with total claims exceeding £1 billion plus interest, and penalties of up to 300% of the principal.
VIL tax claimsThe claims against VIL range from disputes concerning transfer pricing and the applicability of value-added tax to SIM cards, to the disallowance of income tax holidays. The quantum of the tax claims against VIL is in the region of £0.9 billion. VIL is of the opinion that any finding of material liability to tax, is not probable.
VISPL tax claimsVISPL has been assessed to owe tax of approximately £240 million (plus interest of £190 million) in respect of (i) a transfer pricing margin charged for the international call centre of Hutchison prior to the transaction with Vodafone; (ii) the sale of the international call centre by VISPL to Hutchison and (iii) the alleged transfer of options held by VISPL for VIL equity shares. The first two of the three heads of tax are subject to an indemnity by Hutchison under the VIHBV Tax Deed of Indemnity. The larger part of the potential claim is not subject to any indemnity. VISPL unsuccessfully challenged the merits of the tax demand in the statutory tax tribunal and the jurisdiction of the tax office to make the demand in the High Court. The case is now in the Tax Appeal Tribunal after VISPL obtained a stay of the tax demand on a deposit of £20 million and a corporate guarantee by VIHBV for the balance. If VISPL loses the appeal, its terms of the stay of demand may be revisited (and could be increased) while VISPL pursues further appeals in the High Court and the Supreme Court.
Indian regulatory casesLitigation remains pending in the Telecommunications Dispute Settlement Appellate Tribunal (‘TDSAT’), High Courts and the Supreme Court in relation to a number of significant regulatory issues including mobile termination rates (‘MTRs’), spectrum and licence fees, licence extension and 3G intra-circle roaming (‘ICR’).
Public interest litigation: Yakesh Anand v Union of India, Vodafone and othersThe Petitioner has brought a special leave petition in the Indian Supreme Court on 30 January 2012 against the Government of India and mobile network operators, including VIL, seeking recovery of the alleged excess spectrum allocated to the operators, compensation for the alleged excess spectrum held in the amount of approximately €4.7 billion and a criminal investigation of an alleged conspiracy between government officials and the network operators. A claim with similar allegations was dismissed by the Supreme Court in March 2012, with an order that the Petitioner should pay a fine for abuse of process. The case is pending before the Supreme Court and is expected to be called for hearing at some uncertain future date.
One time spectrum charges: Vodafone India v Union of IndiaThe Government of India has sought to impose one time spectrum charges of approximately €525 million on certain operating subsidiaries of VIL. We filed a petition before the TDSAT challenging the one time spectrum charges on the basis that they are illegal, violate Vodafone’s licence terms and are arbitrary, unreasonable and discriminatory. The tribunal stayed enforcement of the Government’s spectrum demand pending resolution of the dispute. The case is now ready for trial.
3G inter-circle roaming: Vodafone India and others v Union of IndiaIn April 2013, the Indian Department of Telecommunications issued a stoppage notice to VIL’s operating subsidiaries and other mobile operators requiring the immediate stoppage of the provision of 3G services on other operators’ mobile networks in an alleged breach of licences. The regulator also imposed a fine of approximately €5.5 million. We applied to the Delhi High Court for an order quashing the regulator’s notice. Interim relief from the notice has been granted (but limited to existing customers at the time with the effect that VIL was not able to provide 3G services to new customers on other operators’ 3G networks pending a decision on the issue). The dispute was referred to the TDSAT for decision, which ruled on 28 April 2014 that VIL and the other operators were permitted to provide 3G services to their customers (current and future) on other operators’ networks. An appeal by the Department of Telecommunications is possible.
Vodafone Group Plc Annual Report 2014164 165Overview
Strategy review Performance Governance Financials
Additional information
30. Contingent liabilities (continued)
Extension of licences in Delhi, Mumbai and Kolkata: VIL and others v Union of IndiaWe sought an extension of our existing licences in Delhi, Mumbai and Kolkata along with existing licensed spectrum. That extension was denied by the Department of Telecommunications by order dated 21 March 2013. We appealed that decision to the TDSAT and by its order dated 31 January 2014, the TDSAT denied the extension. The Supreme Court has agreed to hear our appeal on an expedited basis.
Other cases in the Group
Italy
British Telecom (Italy) v Vodafone ItalyThe Italian Competition Authority concluded an investigation in 2007 when Vodafone Italy gave certain undertakings in relation to concerns it had abused its dominant position in the wholesale market for mobile termination. In 2010, British Telecom (Italy) brought a civil damages claim against Vodafone Italy on the basis of the Competition Authority’s investigation and Vodafone Italy’s undertakings. British Telecom (Italy) seeks damages in the amount of €280 million for abuse of dominant position by Vodafone Italy in the wholesale fixed to mobile termination market for the period 1999 to 2007. A court appointed expert has delivered an opinion to the Court that the range of damages in the case are in the region of €10 million to €25 million.
FASTWEB v Vodafone ItalyThe Italian Competition Authority concluded an investigation in 2007 when Vodafone Italy gave certain undertakings in relation to concerns it had abused its dominant position in the wholesale market for mobile termination. In 2010, FASTWEB brought a civil damages claim against Vodafone Italy on the basis of the Competition Authority’s investigation and Vodafone Italy’s undertakings. FASTWEB seeks damages in the amount of €360 million for abuse of dominant position by Vodafone Italy in the wholesale fixed to mobile termination market. A court appointed expert has delivered an opinion to the Court that the range of damages in the case are in the region of €0.5 million to €2.3 million.
Greece
Papistas Holdings SA, Mobile Trade Stores (formerly Papistas SA) and Athanasios and Loukia Papistas v Vodafone Greece, Vodafone Group Plc and certain Directors and Officers of VodafoneIn December 2013, Mr and Mrs Papistas, and companies owned or controlled by them, brought three claims in the Greek court in Athens against Vodafone Greece, Vodafone Group Plc and certain directors and officers of Vodafone Greece and Vodafone Group Plc for purported damage caused by the alleged abuse of dominance and wrongful termination of a franchise arrangement with a Papistas company. Approximately €1.0 billion of the claim is directed exclusively at one former and one current director of Vodafone Greece. The balance of the claim (approximately €285.5 million)is sought from Vodafone Greece and Vodafone Group Plc on a joint and several basis. The cases are scheduled to come to trial in November 2015 and April 2016.
Tanzania
Cats-Net Limited v Vodacom Tanzania LimitedIn 2012, Cats-Net Limited brought a claim for US$500 million (US$200 million compensatory and US$300 million punitive) in damages against Vodacom Tanzania Limited in the Tanzanian High Court. Cats-Net is also seeking an order cancelling Vodacom Tanzania’s mobile telecommunications licence. The claim is based on the actions of the Tanzanian Telecommunications Regulatory Authority (‘TTRA’) who, following complaints by Vodacom Tanzania of interference caused by transmissions of Cats-Net, allegedly shut down the operations of Cats-Net after conducting its own investigation. Cats-Net alleges collusion between the TTRA and Vodacom Tanzania. Vodacom Tanzania filed an application to strike out the claim. That application has been argued and the parties await a decision of the Court.
Vodafone Group Plc Annual Report 2014166
Notes to the consolidated financial statements (continued)
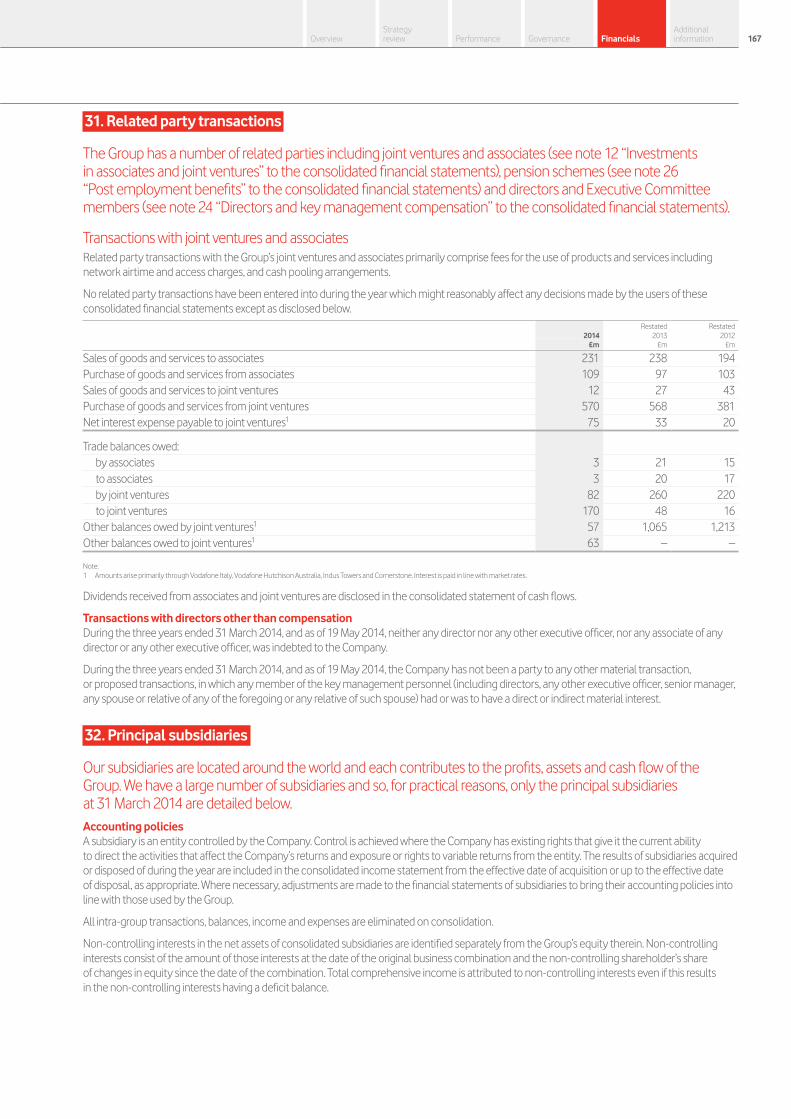
31. Related party transactions
The Group has a number of related parties including joint ventures and associates (see note 12 “Investments in associates and joint ventures” to the consolidated financial statements), pension schemes (see note 26 “Post employment benefits” to the consolidated financial statements) and directors and Executive Committee members (see note 24 “Directors and key management compensation” to the consolidated financial statements).
Transactions with joint ventures and associatesRelated party transactions with the Group’s joint ventures and associates primarily comprise fees for the use of products and services including network airtime and access charges, and cash pooling arrangements.
No related party transactions have been entered into during the year which might reasonably affect any decisions made by the users of these consolidated financial statements except as disclosed below.
2014 Restated
2013 Restated
2012 £m £m £m
Sales of goods and services to associates 231 238 194 Purchase of goods and services from associates 109 97 103 Sales of goods and services to joint ventures 12 27 43 Purchase of goods and services from joint ventures 570 568 381 Net interest expense payable to joint ventures1 75 33 20
Trade balances owed: by associates 3 21 15 to associates 3 20 17 by joint ventures 82 260 220 to joint ventures 170 48 16
Other balances owed by joint ventures1 57 1,065 1,213 Other balances owed to joint ventures1 63 – –
Note:1 Amounts arise primarily through Vodafone Italy, Vodafone Hutchison Australia, Indus Towers and Cornerstone. Interest is paid in line with market rates.
Dividends received from associates and joint ventures are disclosed in the consolidated statement of cash flows.
Transactions with directors other than compensationDuring the three years ended 31 March 2014, and as of 19 May 2014, neither any director nor any other executive officer, nor any associate of any director or any other executive officer, was indebted to the Company.
During the three years ended 31 March 2014, and as of 19 May 2014, the Company has not been a party to any other material transaction, or proposed transactions, in which any member of the key management personnel (including directors, any other executive officer, senior manager, any spouse or relative of any of the foregoing or any relative of such spouse) had or was to have a direct or indirect material interest.
32. Principal subsidiaries
Our subsidiaries are located around the world and each contributes to the profits, assets and cash flow of the Group. We have a large number of subsidiaries and so, for practical reasons, only the principal subsidiaries at 31 March 2014 are detailed below.Accounting policiesA subsidiary is an entity controlled by the Company. Control is achieved where the Company has existing rights that give it the current ability to direct the activities that affect the Company’s returns and exposure or rights to variable returns from the entity. The results of subsidiaries acquired or disposed of during the year are included in the consolidated income statement from the effective date of acquisition or up to the effective date of disposal, as appropriate. Where necessary, adjustments are made to the financial statements of subsidiaries to bring their accounting policies into line with those used by the Group.
All intra-group transactions, balances, income and expenses are eliminated on consolidation.
Non-controlling interests in the net assets of consolidated subsidiaries are identified separately from the Group’s equity therein. Non-controlling interests consist of the amount of those interests at the date of the original business combination and the non-controlling shareholder’s share of changes in equity since the date of the combination. Total comprehensive income is attributed to non-controlling interests even if this results in the non-controlling interests having a deficit balance.
Vodafone Group Plc Annual Report 2014166 167Overview
Strategy review Performance Governance Financials
Additional information

32. Principal subsidiaries (continued)
Principal subsidiariesA full list of subsidiaries, joint arrangements, associated undertakings and any significant holdings (as defined in the Large and Medium-sized Companies and Groups (Accounts and Reports) Regulations 2008) as at 15 August 2014 will be annexed to the Company’s next annual return filed with the Registrar of Companies. No subsidiaries are excluded from the Group consolidation. Unless otherwise stated the Company’s principal subsidiaries all have share capital consisting solely of ordinary shares and are indirectly held. The country of incorporation or registration of all subsidiaries is also their principal place of operation unless otherwise stated.
Name Principal activity Country of incorporation or
registration Percentage
shareholdings1
Vodafone GmbH Network operator Germany 100.0 Kabel Deutschland Holding AG2 Network operator Germany 76.6Vodafone Limited Network operator England 100.0 Vodafone Omnitel B.V.3,4,5 Network operator Netherlands 100.0Vodafone España S.A.U. Network operator Spain 100.0 Vodafone Albania Sh.A. Network operator Albania 99.9 Vodafone Czech Republic a.s. Network operator Czech Republic 100.0 Vodafone-Panafon Hellenic Telecommunications Company S.A. Network operator Greece 99.9 Vodafone Magyarorszag Mobile Tavkozlesi Zartkoruen Mukodo Reszvenytarsasag6 Network operator Hungary 100.0 Vodafone Ireland Limited Network operator Ireland 100.0 Vodafone Malta Limited Network operator Malta 100.0 Vodafone Libertel B.V. Network operator Netherlands 100.0 Vodafone Portugal-Comunicações Pessoais, S.A.7 Network operator Portugal 100.0 Vodafone Romania S.A. Network operator Romania 100.0 Vodafone India Limited Network operator India 89.0 Vodacom Group Limited Holding company South Africa 65.0 Vodacom (Pty) Limited8 Network operator South Africa 60.9
Vodacom Congo (RDC) s.p.r.l.8,9,10 Network operator The Democratic
Republic of Congo 33.2 Vodacom Tanzania Limited8,10 Network operator Tanzania 42.3 VM, S.A.8,11 Network operator Mozambique 55.3 Vodacom Lesotho (Pty) Limited8 Network operator Lesotho 52.0 Vodacom Business Africa Group (PTY) Limited8 Holding company South Africa 65.0 Vodafone Egypt Telecommunications S.A.E. Network operator Egypt 54.9 Ghana Telecommunications Company Limited Network operator Ghana 70.0 Vodafone New Zealand Limited Network operator New Zealand 100.0 Vodafone Qatar Q.S.C.10 Network operator Qatar 23.0 Vodafone Telekomunikasyon A.S. Network operator Turkey 100.0 Vodafone Group Services Limited12 Global products and services provider England 100.0 Vodafone Sales & Services Limited13 Group services provider England 100.0Vodafone 6 UK Holding company England 100.0Vodafone Holding GmbH Holding company Germany 100.0 Vodafone Holdings Europe S.L.U. Holding company Spain 100.0 Vodafone Europe B.V. Holding company Netherlands 100.0 Vodafone International Holdings B.V. Holding company Netherlands 100.0 Vodafone Investments Luxembourg S.a.r.l. Holding company Luxembourg 100.0 Vodafone Procurement Company S.a.r.l. Group services provider Luxembourg 100.0 Vodafone Roaming Services S.a.r.l. Group services provider Luxembourg 100.0
Notes:1 Effective ownership percentages of Vodafone Group Plc at 31 March 2014, rounded to nearest tenth of one percent.2 Kabel Deutschland Holding AG was acquired on 14 October 2013.3 Vodafone Omnitel B.V. changed its name on 16 December 2013 (previously Vodafone Omnitel N.V.).4 The principal place of operation of Vodafone Omnitel B.V. is Italy.5 Vodafone Omnitel B.V. became a 100% owned subsidiary on 21 February 2014.6 Trades as Vodafone Hungary Mobile Telecommunications Company Limited.7 38.6% of the issued share capital of Vodafone Portugal-Comunicações Pessoais, S.A. is directly held by Vodafone Group Plc.8 Shareholding is indirect through Vodacom Group Limited. The indirect shareholding is calculated using the 65.0% ownership interest in Vodacom.9 The share capital of Vodacom Congo (RDC) s.p.r.l. consists of 1,000,000 ordinary shares and 75,470,588 preference shares.10 The Group has rights that enable it to control the strategic and operating decisions of Vodafone Qatar Q.S.C., Vodacom Congo (RDC) s.p.r.l. and Vodacom Tanzania Limited.11 The share capital of VM, S.A. consists of 60,000,000 ordinary shares and 548,350,646 preference shares.12 Share capital consists of 1,190 ordinary shares and one deferred share, of which 100% of the shares are indirectly held by Vodafone Group Plc.13 Vodafone Sales & Services Limited is directly held by Vodafone Group Plc.
Vodafone Group Plc Annual Report 2014168
Notes to the consolidated financial statements (continued)

The tables below show selected financial data in respect of subsidiaries that have non-controlling interests that are material to the Group.
Vodacom Group LimitedVodafone Egypt
Telecommunications S.A.E. Vodafone Qatar Q.S.C.
2014
£m2013
£m2014
£m2013
£m2014
£m2013
£m
Summary comprehensive income informationRevenue 4,718 5,206 1,163 1,259 342 266Profit/(loss) for the financial year 730 819 165 183 (43) (70)Other comprehensive expense (9) (12) – – – –Total comprehensive income/(expense) 721 807 165 183 (43) (70)Other financial informationProfit/(loss) for the financial year allocated to non-controlling interests 273 298 75 83 (33) (54)Dividends paid to non-controlling interests 261 301 3 3 – –Summary financial position informationNon-current assets 4,681 5,766 1,259 1,412 1,197 1,382Current assets 1,275 1,503 405 298 52 73Total assets 5,956 7,269 1,664 1,710 1,249 1,455Non-current liabilities (360) (649) (33) (52) (6) (2)Current liabilities (2,005) (2,171) (721) (805) (267) (338)Total assets less total liabilities 3,591 4,449 910 853 976 1,115Equity shareholders’ funds 2,899 3,609 575 554 224 256Non-controlling interests 692 840 335 299 752 859Total equity 3,591 4,449 910 853 976 1,115
The voting rights held by the Group equal the Group’s percentage shareholding as shown on page 168.
Vodafone Group Plc Annual Report 2014168 169Overview
Strategy review Performance Governance Financials
Additional information
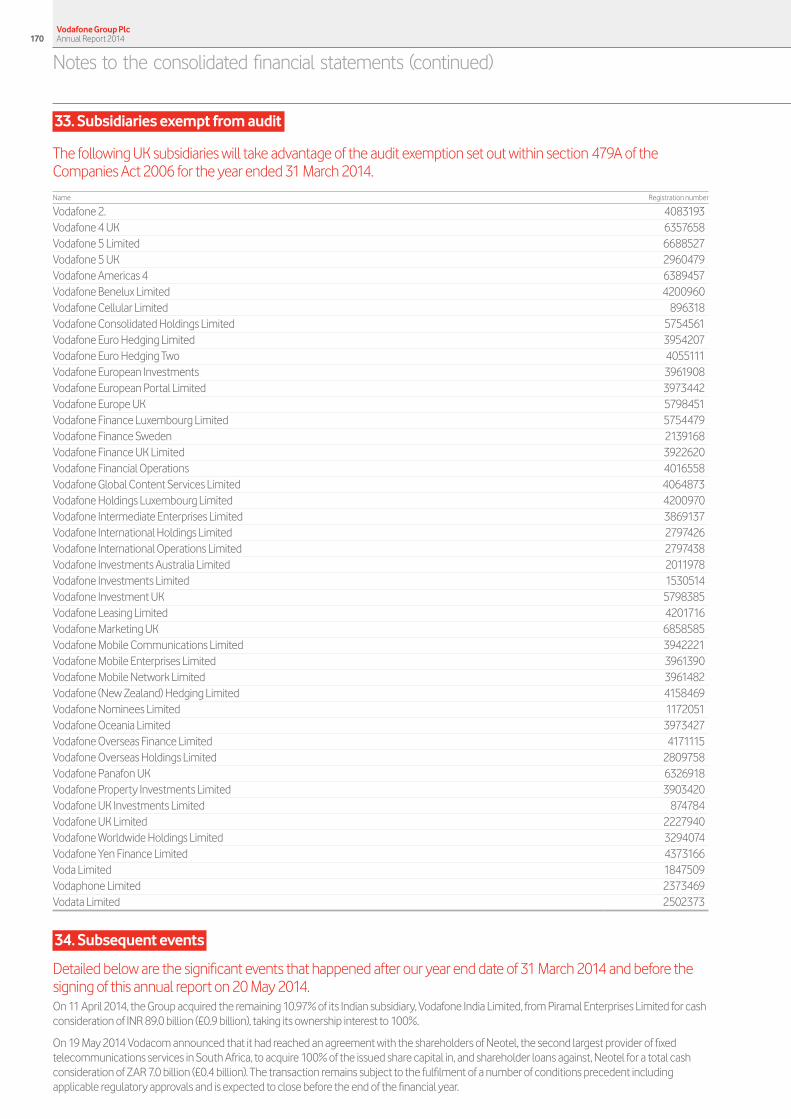
33. Subsidiaries exempt from audit
The following UK subsidiaries will take advantage of the audit exemption set out within section 479A of the Companies Act 2006 for the year ended 31 March 2014.
Name Registration number
Vodafone 2. 4083193Vodafone 4 UK 6357658Vodafone 5 Limited 6688527Vodafone 5 UK 2960479Vodafone Americas 4 6389457Vodafone Benelux Limited 4200960Vodafone Cellular Limited 896318Vodafone Consolidated Holdings Limited 5754561Vodafone Euro Hedging Limited 3954207Vodafone Euro Hedging Two 4055111Vodafone European Investments 3961908Vodafone European Portal Limited 3973442Vodafone Europe UK 5798451Vodafone Finance Luxembourg Limited 5754479Vodafone Finance Sweden 2139168Vodafone Finance UK Limited 3922620Vodafone Financial Operations 4016558Vodafone Global Content Services Limited 4064873Vodafone Holdings Luxembourg Limited 4200970Vodafone Intermediate Enterprises Limited 3869137Vodafone International Holdings Limited 2797426Vodafone International Operations Limited 2797438Vodafone Investments Australia Limited 2011978Vodafone Investments Limited 1530514Vodafone Investment UK 5798385Vodafone Leasing Limited 4201716Vodafone Marketing UK 6858585Vodafone Mobile Communications Limited 3942221Vodafone Mobile Enterprises Limited 3961390Vodafone Mobile Network Limited 3961482Vodafone (New Zealand) Hedging Limited 4158469Vodafone Nominees Limited 1172051Vodafone Oceania Limited 3973427Vodafone Overseas Finance Limited 4171115Vodafone Overseas Holdings Limited 2809758Vodafone Panafon UK 6326918Vodafone Property Investments Limited 3903420Vodafone UK Investments Limited 874784Vodafone UK Limited 2227940Vodafone Worldwide Holdings Limited 3294074Vodafone Yen Finance Limited 4373166Voda Limited 1847509Vodaphone Limited 2373469Vodata Limited 2502373
34. Subsequent events
Detailed below are the significant events that happened after our year end date of 31 March 2014 and before the signing of this annual report on 20 May 2014.On 11 April 2014, the Group acquired the remaining 10.97% of its Indian subsidiary, Vodafone India Limited, from Piramal Enterprises Limited for cash consideration of INR 89.0 billion (£0.9 billion), taking its ownership interest to 100%.
On 19 May 2014 Vodacom announced that it had reached an agreement with the shareholders of Neotel, the second largest provider of fixed telecommunications services in South Africa, to acquire 100% of the issued share capital in, and shareholder loans against, Neotel for a total cash consideration of ZAR 7.0 billion (£0.4 billion). The transaction remains subject to the fulfilment of a number of conditions precedent including applicable regulatory approvals and is expected to close before the end of the financial year.
Vodafone Group Plc Annual Report 2014170
Notes to the consolidated financial statements (continued)

Prior year operating results
This section presents our operating performance for the 2013 financial year compared to the 2012 financial year, providing commentary on the revenue and EBITDA performance of the Group and its regions. The results in this section are presented on a management basis, which includes the results of the Group’s joint ventures on a proportionate basis, consistent with how the business is managed, operated and reviewed by management. See note 2 “Segmental analysis” to the consolidated financial statements for further information and reconciliations between the management and statutory basis.
Group1,2
Europe
£mAMAP
£m
Non-Controlled Interests and
Common Functions3
£mEliminations
£m
Restated1 2013
£m
Restated1
2012£m
% change
£ Organic
Revenue 28,602 15,413 481 (51) 44,445 46,417 (4.2) (1.4)Service revenue 26,501 13,729 315 (50) 40,495 42,581 (4.9) (1.9)Other revenue 2,101 1,684 166 (1) 3,950 3,836 3.0 4.0
EBITDA 9,099 4,532 (65) – 13,566 14,606 (7.1) (1.9)Adjusted operating profit 4,175 1,893 6,509 – 12,577 12,030 4.5 9.5 Adjustments for:
Presentation adjustments4 (487) (690)Discontinued operations5 (6,500) (4,953)Impairment loss (7,700) (4,050)Restructuring costs and other one-off items (311) (144)Amortisation of acquired customer base and brand intangible assets (249) (280)Other income and expense 468 3,705
Operating (loss)/profit – statutory basis (2,202) 5,618
Notes:1 All amounts are presented on the Group’s revised segment basis. EBITDA and adjusted operating profit have been restated to exclude restructuring costs and amortisation of customer base and brand intangible assets.2 2013 results reflect average foreign exchange rates of £1:€1.23 and £1:US$1.58 (2012: £1:€1.16 and £1:US$1.60).3 Common Functions primarily represent the results of the partner markets and the net result of unallocated central Group costs4 Presentation adjustments relate to the restatement of the Group’s joint ventures from a proportionate consolidation basis to an equity accounting basis.5 Discontinued operations relate to the results of Verizon Wireless.
RevenueGroup revenue fell by 4.2% to £44.4 billion, with service revenue of £40.5 billion, a decline of 1.9%* on an organic basis. Our performance reflected continued strong demand for data services and good growth in our major emerging markets, offset by regulatory changes, challenging macroeconomic conditions, particularly in Europe, and continued competitive pressures.
In Europe service revenue declined by 5.8%* as growth in Germany was offset by increased competition, macroeconomic pressure and MTR cuts.
In AMAP service revenue increased by 5.5%* with continued growth in all of our markets apart from Australia and New Zealand.
EBITDA and profitGroup EBITDA decreased by 7.1% to £13.6 billion, primarily driven by lower revenue, partially offset by operating cost efficiencies.
Adjusted operating profit grew by 4.5%, driven by 31.2% growth in our share of profits of Verizon Wireless (‘VZW’) to £6.5 billion, partially offset by lower EBITDA.
The operating (loss)/profit decreased from a profit £5.6 billion in the prior year to a loss of £2.2 billion primarily due to the gains on the disposal of the Group’s interests in SFR and Polkomtel in the prior year and the higher impairment charges in the current year, partially offset by the gain on acquisition of CWW of £0.5 billion.
An impairment loss of £7.7 billion was recorded in relation to Italy and Spain, primarily driven by adverse performance against previous plans and adverse movements in discount rates.
171OverviewStrategy review Performance Governance Financials
Additional information
Other unaudited financial information
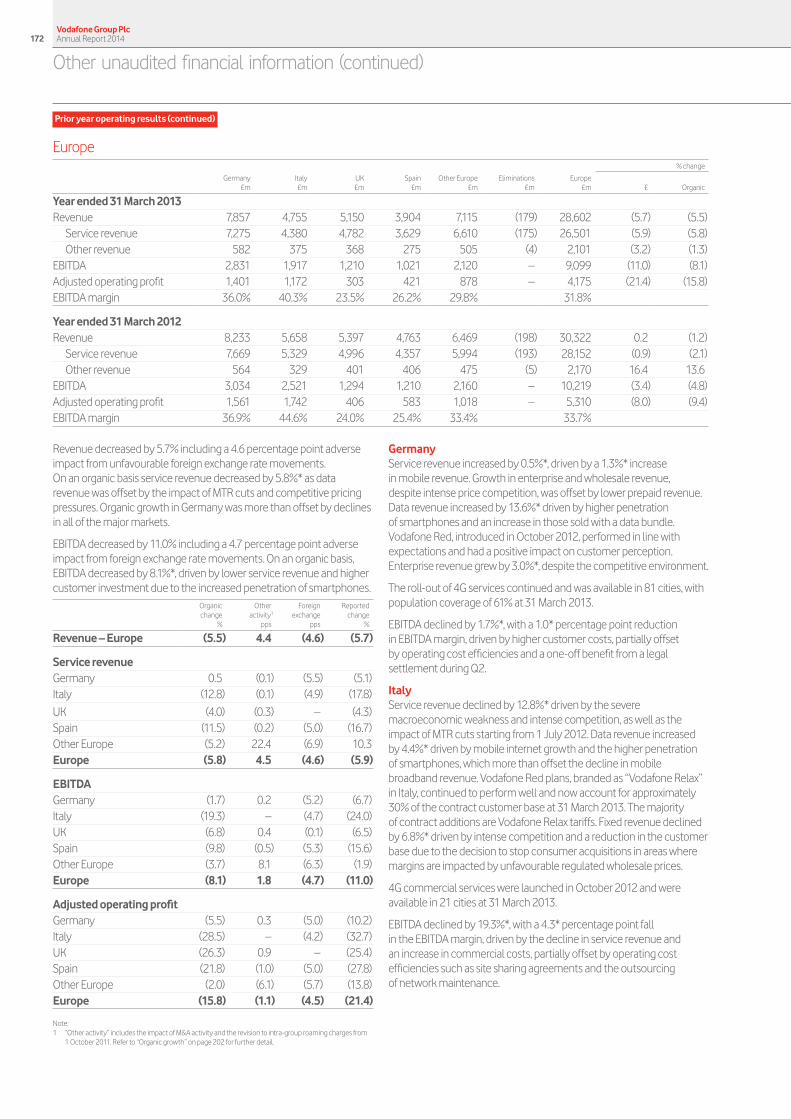
Prior year operating results (continued)
Europe% change
Germany£m
Italy£m
UK£m
Spain£m
Other Europe£m
Eliminations£m
Europe£m £ Organic
Year ended 31 March 2013Revenue 7,857 4,755 5,150 3,904 7,115 (179) 28,602 (5.7) (5.5)
Service revenue 7,275 4,380 4,782 3,629 6,610 (175) 26,501 (5.9) (5.8)Other revenue 582 375 368 275 505 (4) 2,101 (3.2) (1.3)
EBITDA 2,831 1,917 1,210 1,021 2,120 – 9,099 (11.0) (8.1)Adjusted operating profit 1,401 1,172 303 421 878 – 4,175 (21.4) (15.8)EBITDA margin 36.0% 40.3% 23.5% 26.2% 29.8% 31.8%
Year ended 31 March 2012Revenue 8,233 5,658 5,397 4,763 6,469 (198) 30,322 0.2 (1.2)
Service revenue 7,669 5,329 4,996 4,357 5,994 (193) 28,152 (0.9) (2.1)Other revenue 564 329 401 406 475 (5) 2,170 16.4 13.6
EBITDA 3,034 2,521 1,294 1,210 2,160 – 10,219 (3.4) (4.8)Adjusted operating profit 1,561 1,742 406 583 1,018 – 5,310 (8.0) (9.4)EBITDA margin 36.9% 44.6% 24.0% 25.4% 33.4% 33.7%
Revenue decreased by 5.7% including a 4.6 percentage point adverse impact from unfavourable foreign exchange rate movements. On an organic basis service revenue decreased by 5.8%* as data revenue was offset by the impact of MTR cuts and competitive pricing pressures. Organic growth in Germany was more than offset by declines in all of the major markets.
EBITDA decreased by 11.0% including a 4.7 percentage point adverse impact from foreign exchange rate movements. On an organic basis, EBITDA decreased by 8.1%*, driven by lower service revenue and higher customer investment due to the increased penetration of smartphones.
Organic change
%
Other activity1
pps
Foreign exchange
pps
Reported change
%
Revenue – Europe (5.5) 4.4 (4.6) (5.7)
Service revenueGermany 0.5 (0.1) (5.5) (5.1)Italy (12.8) (0.1) (4.9) (17.8)
UK (4.0) (0.3) – (4.3)Spain (11.5) (0.2) (5.0) (16.7)Other Europe (5.2) 22.4 (6.9) 10.3Europe (5.8) 4.5 (4.6) (5.9)
EBITDAGermany (1.7) 0.2 (5.2) (6.7)Italy (19.3) – (4.7) (24.0)UK (6.8) 0.4 (0.1) (6.5)Spain (9.8) (0.5) (5.3) (15.6)Other Europe (3.7) 8.1 (6.3) (1.9)Europe (8.1) 1.8 (4.7) (11.0)
Adjusted operating profitGermany (5.5) 0.3 (5.0) (10.2)Italy (28.5) – (4.2) (32.7)UK (26.3) 0.9 – (25.4)Spain (21.8) (1.0) (5.0) (27.8)Other Europe (2.0) (6.1) (5.7) (13.8)Europe (15.8) (1.1) (4.5) (21.4)
Note:1 “Other activity” includes the impact of M&A activity and the revision to intra-group roaming charges from
1 October 2011. Refer to “Organic growth” on page 202 for further detail.
GermanyService revenue increased by 0.5%*, driven by a 1.3%* increase in mobile revenue. Growth in enterprise and wholesale revenue, despite intense price competition, was offset by lower prepaid revenue. Data revenue increased by 13.6%* driven by higher penetration of smartphones and an increase in those sold with a data bundle. Vodafone Red, introduced in October 2012, performed in line with expectations and had a positive impact on customer perception. Enterprise revenue grew by 3.0%*, despite the competitive environment.
The roll-out of 4G services continued and was available in 81 cities, with population coverage of 61% at 31 March 2013.
EBITDA declined by 1.7%*, with a 1.0* percentage point reduction in EBITDA margin, driven by higher customer costs, partially offset by operating cost efficiencies and a one-off benefit from a legal settlement during Q2.
ItalyService revenue declined by 12.8%* driven by the severe macroeconomic weakness and intense competition, as well as the impact of MTR cuts starting from 1 July 2012. Data revenue increased by 4.4%* driven by mobile internet growth and the higher penetration of smartphones, which more than offset the decline in mobile broadband revenue. Vodafone Red plans, branded as “Vodafone Relax” in Italy, continued to perform well and now account for approximately 30% of the contract customer base at 31 March 2013. The majority of contract additions are Vodafone Relax tariffs. Fixed revenue declined by 6.8%* driven by intense competition and a reduction in the customer base due to the decision to stop consumer acquisitions in areas where margins are impacted by unfavourable regulated wholesale prices.
4G commercial services were launched in October 2012 and were available in 21 cities at 31 March 2013.
EBITDA declined by 19.3%*, with a 4.3* percentage point fall in the EBITDA margin, driven by the decline in service revenue and an increase in commercial costs, partially offset by operating cost efficiencies such as site sharing agreements and the outsourcing of network maintenance.
Vodafone Group Plc Annual Report 2014172
Other unaudited financial information (continued)
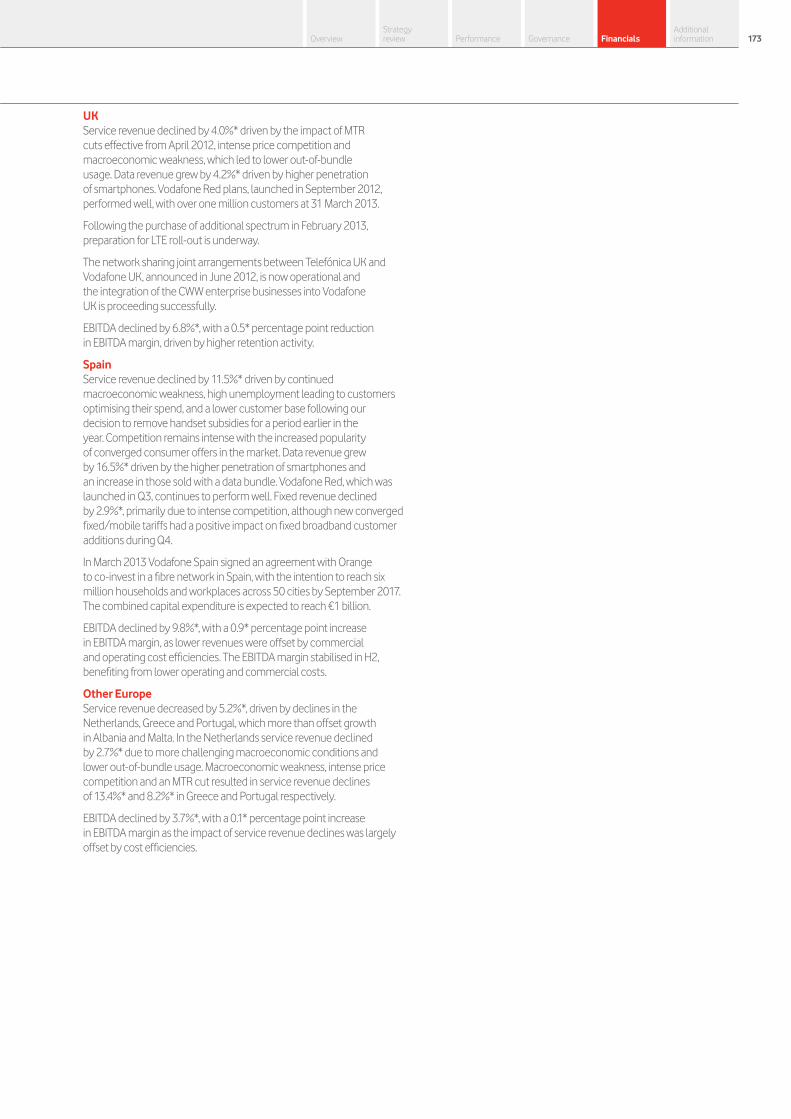
UKService revenue declined by 4.0%* driven by the impact of MTR cuts effective from April 2012, intense price competition and macroeconomic weakness, which led to lower out-of-bundle usage. Data revenue grew by 4.2%* driven by higher penetration of smartphones. Vodafone Red plans, launched in September 2012, performed well, with over one million customers at 31 March 2013.
Following the purchase of additional spectrum in February 2013, preparation for LTE roll-out is underway.
The network sharing joint arrangements between Telefónica UK and Vodafone UK, announced in June 2012, is now operational and the integration of the CWW enterprise businesses into Vodafone UK is proceeding successfully.
EBITDA declined by 6.8%*, with a 0.5* percentage point reduction in EBITDA margin, driven by higher retention activity.
SpainService revenue declined by 11.5%* driven by continued macroeconomic weakness, high unemployment leading to customers optimising their spend, and a lower customer base following our decision to remove handset subsidies for a period earlier in the year. Competition remains intense with the increased popularity of converged consumer offers in the market. Data revenue grew by 16.5%* driven by the higher penetration of smartphones and an increase in those sold with a data bundle. Vodafone Red, which was launched in Q3, continues to perform well. Fixed revenue declined by 2.9%*, primarily due to intense competition, although new converged fixed/mobile tariffs had a positive impact on fixed broadband customer additions during Q4.
In March 2013 Vodafone Spain signed an agreement with Orange to co-invest in a fibre network in Spain, with the intention to reach six million households and workplaces across 50 cities by September 2017. The combined capital expenditure is expected to reach €1 billion.
EBITDA declined by 9.8%*, with a 0.9* percentage point increase in EBITDA margin, as lower revenues were offset by commercial and operating cost efficiencies. The EBITDA margin stabilised in H2, benefiting from lower operating and commercial costs.
Other EuropeService revenue decreased by 5.2%*, driven by declines in the Netherlands, Greece and Portugal, which more than offset growth in Albania and Malta. In the Netherlands service revenue declined by 2.7%* due to more challenging macroeconomic conditions and lower out-of-bundle usage. Macroeconomic weakness, intense price competition and an MTR cut resulted in service revenue declines of 13.4%* and 8.2%* in Greece and Portugal respectively.
EBITDA declined by 3.7%*, with a 0.1* percentage point increase in EBITDA margin as the impact of service revenue declines was largely offset by cost efficiencies.
Vodafone Group Plc Annual Report 2014172 173Overview
Strategy review Performance Governance Financials
Additional information

Prior year operating results (continued)
Africa, Middle East and Asia PacificIndia
£mVodacom
£mOther AMAP
£mEliminations
£mAMAP
£m
% change
£ Organic
Year ended 31 March 2013Revenue 4,324 5,206 5,884 (1) 15,413 (1.0) 6.0
Service revenue 3,878 4,415 5,437 (1) 13,729 (2.3) 5.5 Other revenue 446 791 447 – 1,684 10.9 10.3
EBITDA 1,240 1,891 1,401 – 4,532 3.2 12.3 Adjusted operating profit 221 1,332 340 – 1,893 7.7 20.3 EBITDA margin 28.7% 36.3% 23.8% 29.4%
Year ended 31 March 2012Revenue 4,265 5,638 5,669 (1) 15,571 4.7 10.3
Service revenue 3,922 4,898 5,234 (1) 14,053 3.9 9.6 Other revenue 343 740 435 – 1,518 12.7 17.5
EBITDA 1,122 1,933 1,338 – 4,393 4.9 10.7 Adjusted operating profit 60 1,338 359 – 1,757 4.8 10.9 EBITDA margin 26.3% 34.3% 23.6% 28.2%
Revenue declined by 1.0% including a 7.7 percentage point adverse impact from foreign exchange rate movements, particularly the Indian rupee and the South African rand. On an organic basis service revenue grew by 5.5%* driven by customer and data revenue growth, partially offset by the impact of MTR reductions, competitive and regulatory pressures, and a general weakening in macroeconomic conditions. Growth was led by robust performances in India, Vodacom, Turkey, Egypt, Ghana and Qatar, offset by service revenue declines in Australia and New Zealand.
EBITDA increased by 3.2% after a 9.0 percentage point adverse impact from foreign exchange rate movements. On an organic basis, EBITDA grew by 12.3%* driven primarily by strong growth in India, Vodacom, Turkey and Egypt as well as improved contributions from Ghana and Qatar, offset in part by declines in Australia and New Zealand.
Organic change
%
Otheractivity1
pps
Foreign exchange
pps
Reported change
%
Revenue – AMAP 6.0 0.7 (7.7) (1.0)
Service revenueIndia 11.2 (0.1) (12.2) (1.1)Vodacom 3.1 (3.2) (9.8) (9.9)Other AMAP 3.8 2.1 (2.0) 3.9AMAP 5.5 (0.3) (7.5) (2.3)
EBITDAIndia 24.0 (0.1) (13.4) 10.5 Vodacom 10.1 (0.1) (12.2) (2.2)Other AMAP 6.2 (0.1) (1.4) 4.7AMAP 12.3 (0.1) (9.0) 3.2
Adjusted operating profit
India 291.1 (3.4) (19.4) 268.3 Vodacom 12.7 0.2 (13.3) (0.4)Other AMAP 2.1 (9.5) 2.1 (5.3)AMAP 20.3 (2.3) (10.3) 7.7
Note:1 “Other activity” includes the impact of M&A activity and the revision to intra-group roaming charges from
1 October 2011. Refer to “Organic growth” on page 202 for further detail.
IndiaService revenue grew by 11.2%* driven by strong growth in mobile voice minutes and data revenue, partially offset by the impact of regulatory changes. Average customer growth slowed in Q4, as Q3 regulatory changes affecting subscriber verification continued to impact gross additions, however customer acquisition costs remained low.
For the year as a whole, growth was negatively impacted by the introduction of new consumer protection regulations on the charging of access fees and the marketing of integrated tariffs and value-added services. However, in Q4 the customer base returned to growth and usage increased. Data revenue grew by 19.8%* driven by increased data customers and higher smartphone penetration. At 31 March 2013 active data customers totalled 37.3 million including approximately 3.3 million 3G data customers.
There was a lower rate of growth at Indus Towers, our network infrastructure joint venture, with a slow down in tenancies from smaller entrants, some operators exiting sites following licence cancellations and a change in the pricing structure for some existing customers in the first half of the year.
EBITDA grew by 24.0%*, with a 3.3* percentage point increase in EBITDA margin, driven by the higher revenue, operating cost efficiencies and the impact of lower customer acquisition costs, partially offset by inflationary pressure.
VodacomService revenue grew by 3.1%* mainly driven by growth in Tanzania, the Democratic Republic of Congo (‘DRC’) and Mozambique. In South Africa, service revenue decreased by 0.3%*, with the growth in data revenue and the success of new prepaid offers being more than offset by MTR reductions, macroeconomic weakness leading to customer spend optimisation with lower out-of-bundle usage, and a weaker performance from independent service providers. Data revenue in South Africa grew by 16.1%*, with higher smartphone penetration and data bundles offsetting continued pricing pressure. Vodafone Smart and Vodafone Red, our new range of integrated contract price plans, were introduced in South Africa during March 2013.
On 10 October 2012, Vodacom announced the commercial launch of South Africa’s first LTE network, with 601 LTE sites operational at 31 March 2013.
Vodafone Group Plc Annual Report 2014174
Other unaudited financial information (continued)

Vodacom’s mobile operations outside South Africa delivered strong service revenue growth of 23.4%*, excluding Vodacom Business Africa, driven by a larger customer base and increasing data take-up. M-Pesa continues to perform well in Tanzania, with approximately 4.9 million active users, and was launched in DRC in November 2012. During the year Vodacom DRC became the first operator to launch 3G services in the DRC.
EBITDA grew by 10.1%*, with a 1.5* percentage point increase in EBITDA margin, primarily driven by revenue growth in Vodacom’s mobile operations outside South Africa and savings in network costs in South Africa following investment in single RAN and transmission equipment.
Other AMAPOrganic service revenue grew by 3.8%* with growth in Turkey, Egypt, Ghana and Qatar more than offset by revenue declines in Australia and New Zealand. Service revenue in Turkey grew by 17.3%*, primarily driven by growth in the contract customer base and an increase in data revenue due to mobile internet and higher smartphone penetration. Australia continued to experience steep revenue declines on the back of ongoing service perception issues and a declining customer base. There has been a strong focus on network improvement and arresting the weakness in brand perception. In Egypt the launch of value management initiatives, take-up of data services and the increase in international incoming call volumes and rates drove service revenue growth of 3.7%*, despite competitive pressures and the uncertain political environment. Data revenue continued to show strong growth of 29.6%* and fixed line revenue grew by 29.0%*. In Qatar service revenue grew by 29.8%*, driven by the growth in the customer base, which is now over one million, supported by successful new propositions. In Ghana, continued strong growth in the customer base and the success of integrated tariffs led to service revenue growth of 24.5%*.
EBITDA increased by 6.2%*, with EBITDA margin increasing by 0.5* percentage points with the impact of service revenue growth in Turkey, Egypt, Qatar and Ghana offsetting declines in Australia and New Zealand.
Non-Controlled InterestsVerizon Wireless1
2013£m
2012 £m
% change
£ Organic
Revenue 21,972 20,187 8.8 7.8Service revenue 19,697 18,039 9.2 8.1Other revenue 2,275 2,148 5.9 5.2
EBITDA 8,831 7,689 14.9 13.6Interest (25) (212) (88.2)Tax2 13 (287) (104.5)Group’s share of result in VZW 6,500 4,953 31.2 29.8
In the United States VZW reported 5.9 million net mobile retail connection3 additions in the year, bringing its closing mobile retail connection base to 98.9 million, up 6.4%.
Service revenue growth of 8.1%* continued to be driven by the expanding number of accounts and ARPA4 growth from increased smartphone penetration and a higher number of connections per account.
EBITDA margin improved, with efficiencies in operating expenses and direct costs partially offset by higher acquisition and retention costs reflecting the increased new connections and demand for smartphones.
VZW’s net debt at 31 March 2013 totalled US$6.2 billion5 (2012: US$6.4 billion5). During the year VZW paid a US$8.5 billion income dividend to its shareholders and completed the acquisition of spectrum licences for US$3.7 billion (net). Notes:1 All amounts represent the Group’s share based on its 45% equity interest, unless otherwise stated.2 The Group’s share of the tax attributable to VZW relates only to the corporate entities held by the VZW
partnership and certain state taxes which are levied on the partnership. The tax attributable to the Group’s share of the partnership’s pre-tax profit is included within the Group tax charge.
3 The definition of “connections” reported by VZW is the same as “customers” as reported by Vodafone.4 Average monthly revenue per account.5 Net debt excludes pending credit card receipts.
Vodafone Group Plc Annual Report 2014174 175Overview
Strategy review Performance Governance Financials
Additional information
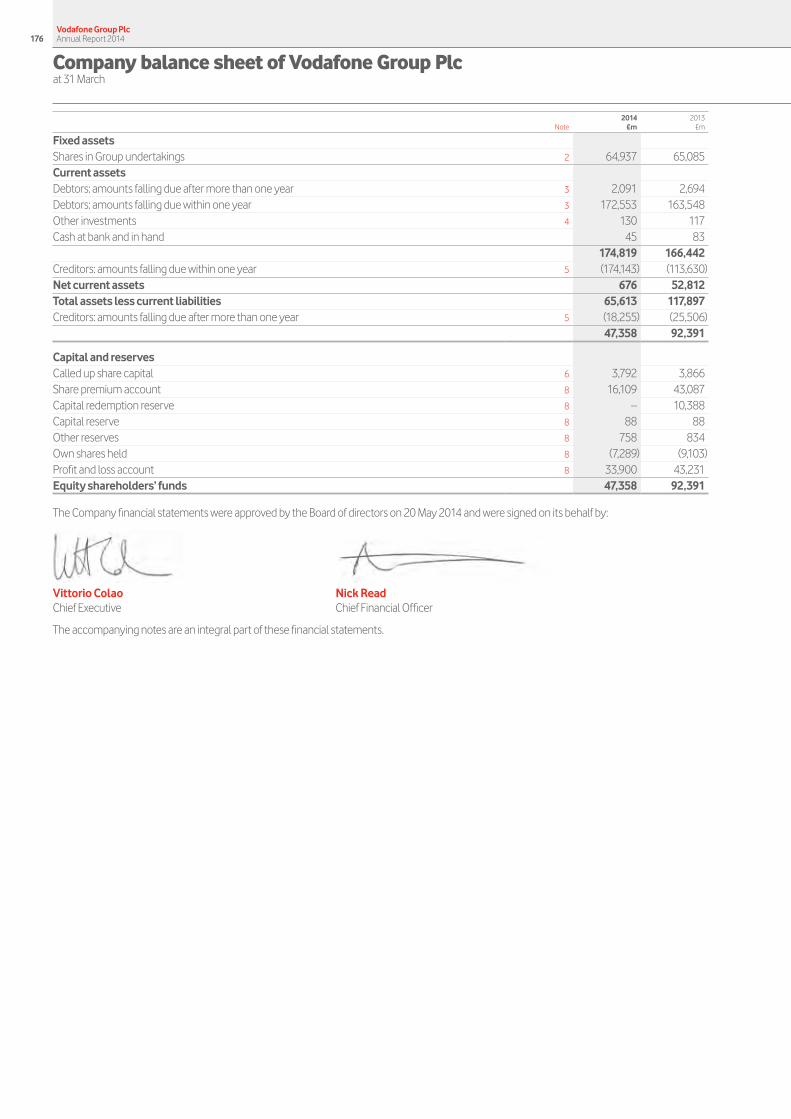
2014 2013 Note £m £m
Fixed assets Shares in Group undertakings 2 64,937 65,085 Current assets Debtors: amounts falling due after more than one year 3 2,091 2,694 Debtors: amounts falling due within one year 3 172,553 163,548 Other investments 4 130 117 Cash at bank and in hand 45 83 174,819 166,442Creditors: amounts falling due within one year 5 (174,143) (113,630)Net current assets 676 52,812Total assets less current liabilities 65,613 117,897Creditors: amounts falling due after more than one year 5 (18,255) (25,506) 47,358 92,391
Capital and reserves Called up share capital 6 3,792 3,866Share premium account 8 16,109 43,087Capital redemption reserve 8 – 10,388Capital reserve 8 88 88Other reserves 8 758 834Own shares held 8 (7,289) (9,103)Profit and loss account 8 33,900 43,231Equity shareholders’ funds 47,358 92,391
The Company financial statements were approved by the Board of directors on 20 May 2014 and were signed on its behalf by:
Vittorio Colao Nick ReadChief Executive Chief Financial Officer
The accompanying notes are an integral part of these financial statements.
Vodafone Group Plc Annual Report 2014176
Company balance sheet of Vodafone Group Plcat 31 March
1. Basis of preparationThe separate financial statements of the Company are drawn up in accordance with the Companies Act 2006 and UK GAAP.
The preparation of Company financial statements in conformity with generally accepted accounting principles requires management to make estimates and assumptions that affect the reported amounts of assets and liabilities and disclosure of contingent assets and liabilities at the date of the Company financial statements and the reported amounts of revenue and expenses during the reporting period. Actual results could differ from those estimates. The estimates and underlying assumptions are reviewed on an ongoing basis. Revisions to accounting estimates are recognised in the period in which the estimate is revised if the revision affects only that period or in the period of the revision and future periods if the revision affects both current and future periods.
As permitted by section 408(3) of the Companies Act 2006, the profit and loss account of the Company is not presented in this annual report. These separate financial statements are not intended to give a true and fair view of the profit or loss or cash flows of the Company. The Company has not published its individual cash flow statement as its liquidity, solvency and financial adaptability are dependent on the Group rather than its own cash flows.
The Company has taken advantage of the exemption contained in FRS 8 “Related Party Disclosures” and has not reported transactions with fellow Group undertakings.
The Company has taken advantage of the exemption contained in FRS 29 “Financial Instruments: Disclosures” and has not produced any disclosures required by that standard, as disclosures that comply with FRS 29 are available in the Vodafone Group Plc annual report for the year ended 31 March 2014.
Significant accounting policies applied in the current reporting period that relate to the financial statements as a whole Accounting conventionThe Company financial statements are prepared under the historical cost convention and in accordance with applicable accounting standards of the UK Accounting Standards Board and pronouncements of the Urgent Issues Task Force.
Foreign currencies Transactions in foreign currencies are initially recorded at the rates of exchange prevailing on the dates of the transactions. Monetary assets and liabilities denominated in foreign currencies are retranslated into the Company’s functional currency at the rates prevailing on the balance sheet date. Non-monetary items carried at fair value that are denominated in foreign currencies are retranslated at the rates prevailing on the initial transaction dates. Non-monetary items measured in terms of historical cost in a foreign currency are not retranslated.
Exchange differences arising on the settlement of monetary items, and on the retranslation of monetary items, are included in the profit and loss account for the period. Exchange differences arising on the retranslation of non-monetary items carried at fair value are included in the profit and loss account for the period.
Borrowing costsAll borrowing costs are recognised in the profit and loss account in the period in which they are incurred.
TaxationCurrent tax, including UK corporation tax and foreign tax, is provided at amounts expected to be paid (or recovered) using the tax rates and laws that have been enacted or substantively enacted by the balance sheet date.
Deferred tax is provided in full on timing differences that exist at the balance sheet date and that result in an obligation to pay more tax, or a right to pay less tax in the future. The deferred tax is measured at the rate expected to apply in the periods in which the timing differences are expected to reverse, based on the tax rates and laws that are enacted or substantively enacted at the balance sheet date. Timing differences arise from the inclusion of items of income and expenditure in taxation computations in periods different from those in which they are included in the Company financial statements. Deferred tax assets are recognised to the extent that it is regarded as more likely than not that they will be recovered. Deferred tax assets and liabilities are not discounted.
Financial instrumentsFinancial assets and financial liabilities, in respect of financial instruments, are recognised on the Company balance sheet when the Company becomes a party to the contractual provisions of the instrument.
Financial liabilities and equity instrumentsFinancial liabilities and equity instruments issued by the Company are classified according to the substance of the contractual arrangements entered into and the definitions of a financial liability and an equity instrument. An equity instrument is any contract that evidences a residual interest in the assets of the Company after deducting all of its liabilities and includes no obligation to deliver cash or other financial assets. The accounting policies adopted for specific financial liabilities and equity instruments are set out below.
Derivative financial instruments and hedge accountingThe Company’s activities expose it to the financial risks of changes in foreign exchange rates and interest rates.
The use of financial derivatives is governed by the Group’s policies approved by the Board of directors, which provide written principles on the use of financial derivatives consistent with the Group’s risk management strategy.
Derivative financial instruments are initially measured at fair value on the contract date and are subsequently remeasured to fair value at each reporting date. The Company designates certain derivatives as hedges of the change of fair value of recognised assets and liabilities (“fair value hedges”). Hedge accounting is discontinued when the hedging instrument expires or is sold, terminated or exercised, no longer qualifies for hedge accounting or the Company chooses to end the hedging relationship.
Vodafone Group Plc Annual Report 2014176 177Overview
Strategy review Performance Governance Financials
Additional information
Notes to the Company financial statements
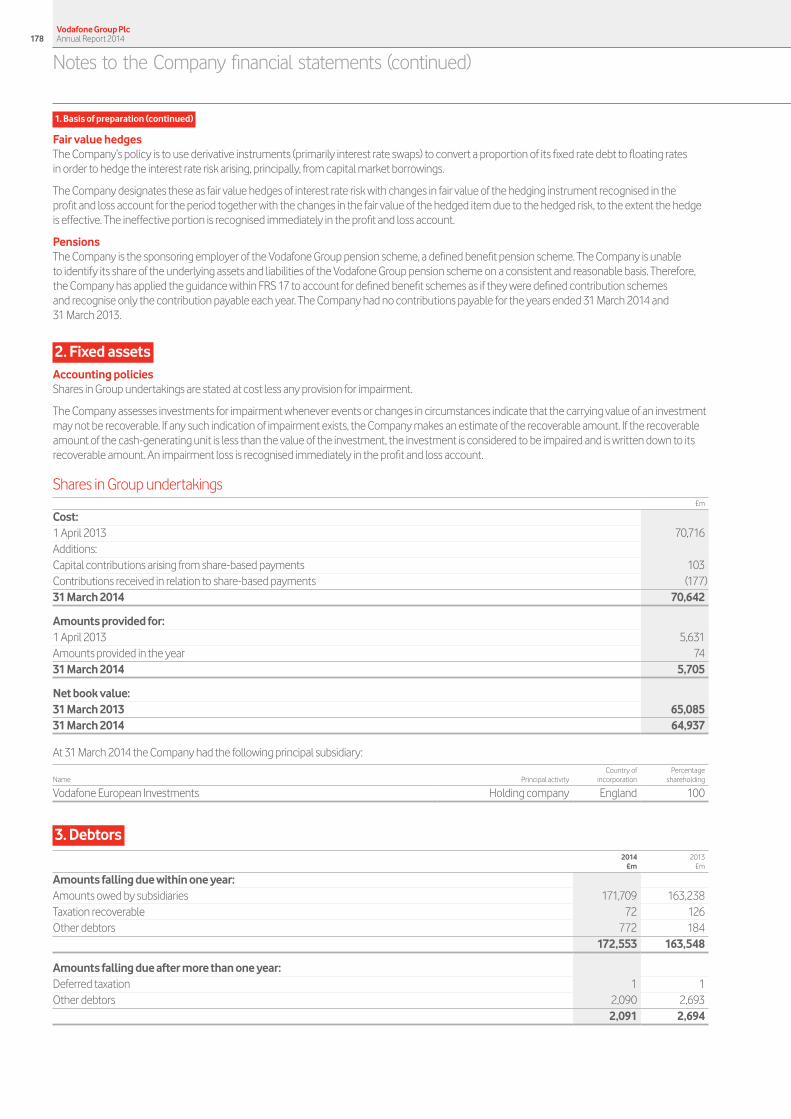
1. Basis of preparation (continued)
Fair value hedgesThe Company’s policy is to use derivative instruments (primarily interest rate swaps) to convert a proportion of its fixed rate debt to floating rates in order to hedge the interest rate risk arising, principally, from capital market borrowings.
The Company designates these as fair value hedges of interest rate risk with changes in fair value of the hedging instrument recognised in the profit and loss account for the period together with the changes in the fair value of the hedged item due to the hedged risk, to the extent the hedge is effective. The ineffective portion is recognised immediately in the profit and loss account.
PensionsThe Company is the sponsoring employer of the Vodafone Group pension scheme, a defined benefit pension scheme. The Company is unable to identify its share of the underlying assets and liabilities of the Vodafone Group pension scheme on a consistent and reasonable basis. Therefore, the Company has applied the guidance within FRS 17 to account for defined benefit schemes as if they were defined contribution schemes and recognise only the contribution payable each year. The Company had no contributions payable for the years ended 31 March 2014 and 31 March 2013.
2. Fixed assetsAccounting policiesShares in Group undertakings are stated at cost less any provision for impairment.
The Company assesses investments for impairment whenever events or changes in circumstances indicate that the carrying value of an investment may not be recoverable. If any such indication of impairment exists, the Company makes an estimate of the recoverable amount. If the recoverable amount of the cash-generating unit is less than the value of the investment, the investment is considered to be impaired and is written down to its recoverable amount. An impairment loss is recognised immediately in the profit and loss account.
Shares in Group undertakings £m
Cost: 1 April 2013 70,716Additions:Capital contributions arising from share-based payments 103Contributions received in relation to share-based payments (177)31 March 2014 70,642
Amounts provided for:1 April 2013 5,631Amounts provided in the year 7431 March 2014 5,705
Net book value: 31 March 2013 65,085 31 March 2014 64,937
At 31 March 2014 the Company had the following principal subsidiary:
Name Principal activityCountry of
incorporationPercentage
shareholding
Vodafone European Investments Holding company England 100
3. Debtors 2014 2013 £m £m
Amounts falling due within one year: Amounts owed by subsidiaries 171,709 163,238 Taxation recoverable 72 126 Other debtors 772 184 172,553 163,548
Amounts falling due after more than one year: Deferred taxation 1 1 Other debtors 2,090 2,693 2,091 2,694
Vodafone Group Plc Annual Report 2014178
Notes to the Company financial statements (continued)
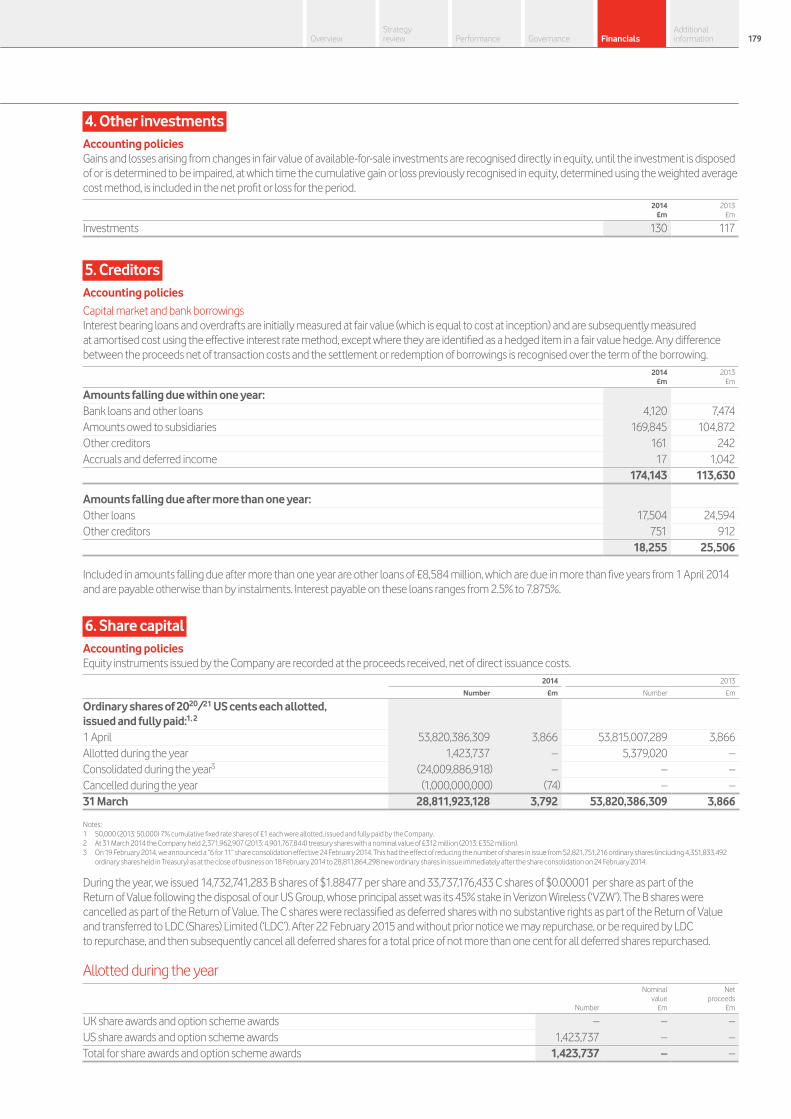
4. Other investmentsAccounting policiesGains and losses arising from changes in fair value of available-for-sale investments are recognised directly in equity, until the investment is disposed of or is determined to be impaired, at which time the cumulative gain or loss previously recognised in equity, determined using the weighted average cost method, is included in the net profit or loss for the period.
2014 2013 £m £m
Investments 130 117
5. CreditorsAccounting policies
Capital market and bank borrowingsInterest bearing loans and overdrafts are initially measured at fair value (which is equal to cost at inception) and are subsequently measured at amortised cost using the effective interest rate method, except where they are identified as a hedged item in a fair value hedge. Any difference between the proceeds net of transaction costs and the settlement or redemption of borrowings is recognised over the term of the borrowing.
2014 2013 £m £m
Amounts falling due within one year: Bank loans and other loans 4,120 7,474 Amounts owed to subsidiaries 169,845 104,872 Other creditors 161 242 Accruals and deferred income 17 1,042 174,143 113,630
Amounts falling due after more than one year: Other loans 17,504 24,594 Other creditors 751 912 18,255 25,506
Included in amounts falling due after more than one year are other loans of £8,584 million, which are due in more than five years from 1 April 2014 and are payable otherwise than by instalments. Interest payable on these loans ranges from 2.5% to 7.875%.
6. Share capitalAccounting policiesEquity instruments issued by the Company are recorded at the proceeds received, net of direct issuance costs.
2014 2013
Number £m Number £m
Ordinary shares of 2020/21 US cents each allotted, issued and fully paid:1, 2
1 April 53,820,386,309 3,866 53,815,007,289 3,866 Allotted during the year 1,423,737 – 5,379,020 – Consolidated during the year3 (24,009,886,918) – – – Cancelled during the year (1,000,000,000) (74) – –31 March 28,811,923,128 3,792 53,820,386,309 3,866
Notes:1 50,000 (2013: 50,000) 7% cumulative fixed rate shares of £1 each were allotted, issued and fully paid by the Company. 2 At 31 March 2014 the Company held 2,371,962,907 (2013: 4,901,767,844) treasury shares with a nominal value of £312 million (2013: £352 million). 3 On 19 February 2014, we announced a “6 for 11” share consolidation effective 24 February 2014. This had the effect of reducing the number of shares in issue from 52,821,751,216 ordinary shares (including 4,351,833,492
ordinary shares held in Treasury) as at the close of business on 18 February 2014 to 28,811,864,298 new ordinary shares in issue immediately after the share consolidation on 24 February 2014.
During the year, we issued 14,732,741,283 B shares of $1.88477 per share and 33,737,176,433 C shares of $0.00001 per share as part of the Return of Value following the disposal of our US Group, whose principal asset was its 45% stake in Verizon Wireless (‘VZW’). The B shares were cancelled as part of the Return of Value. The C shares were reclassified as deferred shares with no substantive rights as part of the Return of Value and transferred to LDC (Shares) Limited (‘LDC’). After 22 February 2015 and without prior notice we may repurchase, or be required by LDC to repurchase, and then subsequently cancel all deferred shares for a total price of not more than one cent for all deferred shares repurchased.
Allotted during the year Nominal Net value proceeds Number £m £m
UK share awards and option scheme awards – – –US share awards and option scheme awards 1,423,737 – –Total for share awards and option scheme awards 1,423,737 – –
Vodafone Group Plc Annual Report 2014178 179Overview
Strategy review Performance Governance Financials
Additional information

7. Share-based paymentsAccounting policiesThe Group operates a number of equity-settled share-based compensation plans for the employees of subsidiaries using the Company’s equity instruments. The fair value of the compensation given in respect of these share-based compensation plans is recognised as a capital contribution to the Company’s subsidiaries over the vesting period. The capital contribution is reduced by any payments received from subsidiaries in respect of these share-based payments.
The Company currently uses a number of equity settled share plans to grant options and shares to the directors and employees of its subsidiaries.
At 31 March 2014 the Company had 27 million ordinary share options outstanding (2013: 40 million) and no ADS options outstanding (2013: nil).
The Company has made a capital contribution to its subsidiaries in relation to share-based payments. At 31 March 2014 the cumulative capital contribution net of payments received from subsidiaries was £131 million (2013: £205 million). During the year ended 31 March 2014 the capital contribution arising from share-based payments was £103 million (2013: £134 million), with payments of £177 million (2013: £246 million) received from subsidiaries.
Full details of share-based payments, share option schemes and share plans are disclosed in note 27 “Share-based payments” to the consolidated financial statements.
8. Reserves and reconciliation of movements in equity shareholders’ funds Share Capital Own Profit Total equity Share premium redemption Capital Other shares and loss shareholders’ capital account reserve reserve reserves held account funds £m £m £m £m £m £m £m £m
1 April 2013 3,866 43,087 10,388 88 834 (9,103) 43,231 92,391 Allotment of shares – 2 – – – – – 2Own shares released on vesting of share awards – – – – – 194 – 194Profit for the financial year – – – – – – 10,970 10,970Dividends – – – – – – (40,566) (40,566)Capital contribution given relating to share-based payments – – – – 103 – – 103Contribution received relating to share-based payments – – – – (177) – – (177)Capital reduction and creation of B and C shares 16,613 (27,008) (10,462) – – – 20,857 –Cancellation of B shares (16,613) – – – – – 1,115 (15,498)Share cancellations (74) – 74 – – 1,648 (1,648) –Other movements – 28 – – (2) (28) (59) (61)31 March 2014 3,792 16,109 – 88 758 (7,289) 33,900 47,358
The profit for the financial year dealt with in the accounts of the Company is £10,970 million (2013: £7,153 million). Under English law, the amount available for distribution to shareholders is based upon the profit and loss reserve of the Company and is reduced by the amount of own shares held and is limited by statutory or other restrictions.
The auditor’s remuneration for the current year in respect of audit and audit-related services was £0.9 million (2013: £0.6 million) and for non-audit services was £3.5 million (2013: £0.1 million).
The directors are remunerated by the Company for their services to the Group as a whole. No remuneration was paid to them specifically in respect of their services to Vodafone Group Plc for either year. Full details of the directors’ remuneration are disclosed in “Directors’ remuneration” on pages 69 to 85.
There were no employees other than directors of the Company throughout the current or the preceding year.
Vodafone Group Plc Annual Report 2014180
Notes to the Company financial statements (continued)
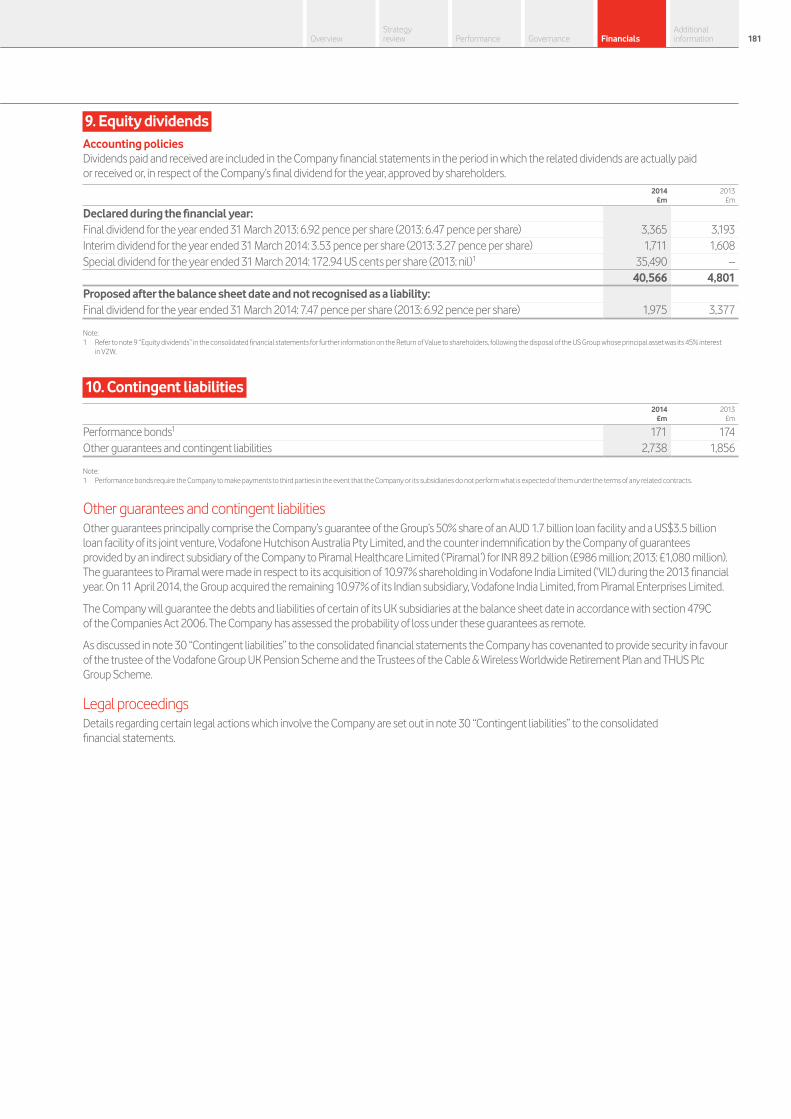
9. Equity dividendsAccounting policiesDividends paid and received are included in the Company financial statements in the period in which the related dividends are actually paid or received or, in respect of the Company’s final dividend for the year, approved by shareholders.
2014 2013 £m £m
Declared during the financial year: Final dividend for the year ended 31 March 2013: 6.92 pence per share (2013: 6.47 pence per share) 3,365 3,193 Interim dividend for the year ended 31 March 2014: 3.53 pence per share (2013: 3.27 pence per share) 1,711 1,608 Special dividend for the year ended 31 March 2014: 172.94 US cents per share (2013: nil)1 35,490 – 40,566 4,801 Proposed after the balance sheet date and not recognised as a liability:Final dividend for the year ended 31 March 2014: 7.47 pence per share (2013: 6.92 pence per share) 1,975 3,377
Note:1 Refer to note 9 “Equity dividends” in the consolidated financial statements for further information on the Return of Value to shareholders, following the disposal of the US Group whose principal asset was its 45% interest
in VZW.
10. Contingent liabilities 2014 2013 £m £m
Performance bonds1 171 174 Other guarantees and contingent liabilities 2,738 1,856
Note:1 Performance bonds require the Company to make payments to third parties in the event that the Company or its subsidiaries do not perform what is expected of them under the terms of any related contracts.
Other guarantees and contingent liabilitiesOther guarantees principally comprise the Company’s guarantee of the Group’s 50% share of an AUD 1.7 billion loan facility and a US$3.5 billion loan facility of its joint venture, Vodafone Hutchison Australia Pty Limited, and the counter indemnification by the Company of guarantees provided by an indirect subsidiary of the Company to Piramal Healthcare Limited (‘Piramal’) for INR 89.2 billion (£986 million; 2013: £1,080 million). The guarantees to Piramal were made in respect to its acquisition of 10.97% shareholding in Vodafone India Limited (‘VIL’) during the 2013 financial year. On 11 April 2014, the Group acquired the remaining 10.97% of its Indian subsidiary, Vodafone India Limited, from Piramal Enterprises Limited.
The Company will guarantee the debts and liabilities of certain of its UK subsidiaries at the balance sheet date in accordance with section 479C of the Companies Act 2006. The Company has assessed the probability of loss under these guarantees as remote.
As discussed in note 30 “Contingent liabilities” to the consolidated financial statements the Company has covenanted to provide security in favour of the trustee of the Vodafone Group UK Pension Scheme and the Trustees of the Cable & Wireless Worldwide Retirement Plan and THUS Plc Group Scheme.
Legal proceedingsDetails regarding certain legal actions which involve the Company are set out in note 30 “Contingent liabilities” to the consolidated financial statements.
Vodafone Group Plc Annual Report 2014180 181Overview
Strategy review Performance Governance Financials
Additional information

Investor calendar
Ex-dividend date for final dividend 11 June 2014Record date for final dividend 13 June 2014Interim management statement 25 July 2014Annual general meeting 29 July 2014Final dividend payment 6 August 2014Half-year financial results 11 November 2014Ex-dividend date for interim dividend 26 November 20141
Record date for interim dividend 28 November 20141
Interim dividend payment 4 February 20151
Note:1 Provisional dates.
DividendsSee pages 101 and 124 for details on dividend amount per share.
Payment of dividends by direct creditWe pay cash dividends directly to shareholders’ bank or building society accounts. This ensures secure delivery and means dividend payments are credited to shareholders’ bank or building society accounts on the same day as payment. A consolidated tax voucher covering both the interim and final dividends paid during the financial year is sent to shareholders at the time of the interim dividend in February.
ADS holders may alternatively have their cash dividends paid by cheque.
Overseas dividend paymentsHolders of ordinary shares resident in the Eurozone (defined for this purpose as a country that has adopted the euro as its national currency) automatically receive their dividends in euros. The sterling/euro exchange rate is determined by us in accordance with our articles of association up to 13 business days before the payment date.
Holders resident outside the UK and Eurozone automatically receive dividends in pounds sterling but may elect to receive dividends in local currency directly into their bank account by registering for our Registrar’s (Computershare) Global Payments Service. Visit investorcentre.co.uk for details and terms and conditions.
Cash dividends to ADS holders will be paid by the ADS depositary in US dollars. The sterling/US dollar exchange rate for this purpose is determined by us up to ten New York and London business days before the payment date.
See vodafone.com/dividends for further information about dividend payments or, alternatively, please contact our Registrar or the ADS depositary, as applicable. See page 183 for their contact information.
Dividend reinvestment planWe offer a dividend reinvestment plan which allows holders of ordinary shares, who choose to participate, to use their cash dividends to acquire additional shares in the Company. These are purchased on their behalf by the plan administrator through a low cost dealing arrangement.
For ADS holders BNY Mellon maintains a Global BuyDIRECT Plan which is a direct purchase and sale plan for depositary receipts with a dividend reinvestment facility.
Managing your shares via Investor CentreComputershare operates a portfolio service for investors in ordinary shares, called Investor Centre. This provides our shareholders with online access to information about their investments as well as a facility to help manage their holdings online, such as being able to:
a update dividend mandate bank instructions and review dividend payment history;
a update member details and address changes; and
a register to receive Company communications electronically.
Computershare also offers an internet and telephone share dealing service to existing shareholders.
The service can be obtained at investorcentre.co.uk. Shareholders with any queries regarding their holding should contact Computershare. See page 183 for their contact details.
Shareholders may also find the investors section of our corporate website, vodafone.com/investor, useful for general queries and information about the Company.
Shareholder communicationsA growing number of our shareholders have opted to receive their communications from us electronically using email and web-based communications. The use of electronic communications, rather than printed paper documents, means information about the Company can be received as soon as it is available and has the added benefit of reducing costs and our impact on the environment. Each time we issue a shareholder communication, shareholders registered for electronic communications will be sent an email alert containing a link to the relevant documents.
We encourage all our shareholders to sign up for this service by providing us with an email address. You can register your email address via our registrar at investorcentre.co.uk or contact them via the telephone number provided on page 183. See vodafone.com/investor for further information about this service.
Annual general meeting Our thirtieth AGM will be held at the Hilton Metropole Hotel, 225 Edgware Road, London W2 1JU on Tuesday 29 July 2014 at 11.00 a.m.
The AGM will be transmitted via a live webcast which can be viewed on our website at vodafone.com/agm on the day of the meeting. A recording will be available to view after that date.
Vodafone Group Plc Annual Report 2014182
Shareholder information
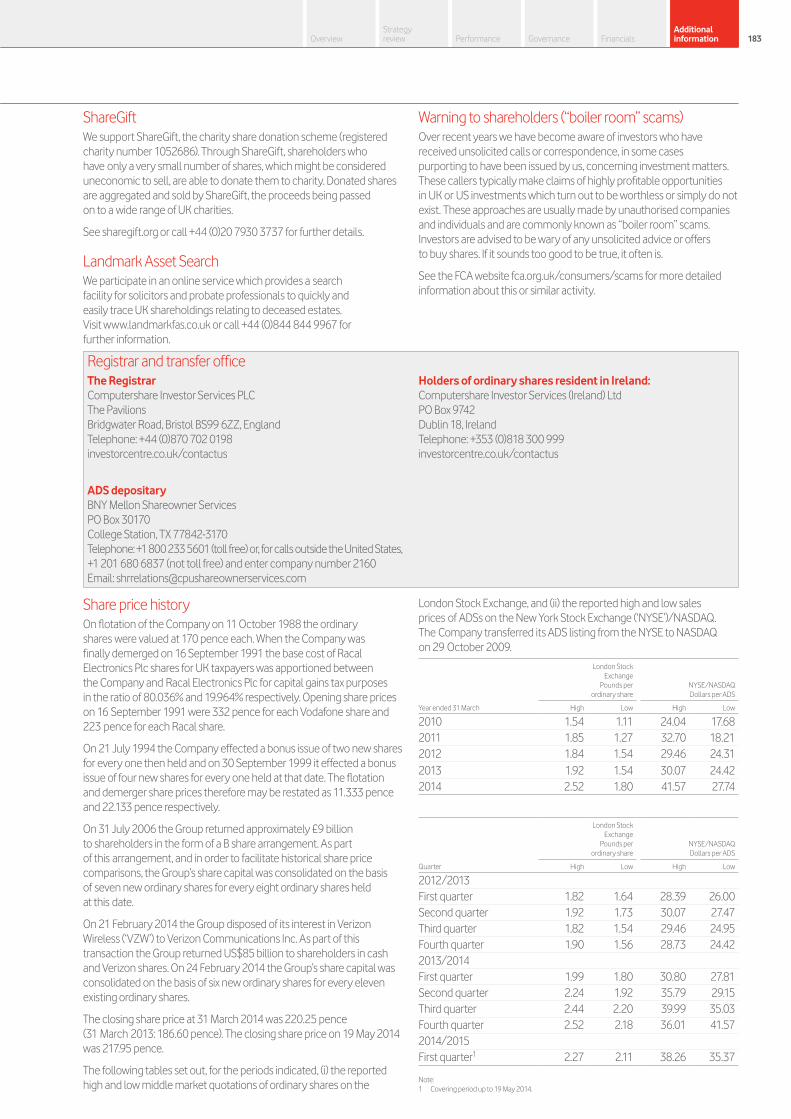
ShareGiftWe support ShareGift, the charity share donation scheme (registered charity number 1052686). Through ShareGift, shareholders who have only a very small number of shares, which might be considered uneconomic to sell, are able to donate them to charity. Donated shares are aggregated and sold by ShareGift, the proceeds being passed on to a wide range of UK charities.
See sharegift.org or call +44 (0)20 7930 3737 for further details.
Landmark Asset SearchWe participate in an online service which provides a search facility for solicitors and probate professionals to quickly and easily trace UK shareholdings relating to deceased estates. Visit www.landmarkfas.co.uk or call +44 (0)844 844 9967 for further information.
Warning to shareholders (“boiler room” scams)Over recent years we have become aware of investors who have received unsolicited calls or correspondence, in some cases purporting to have been issued by us, concerning investment matters. These callers typically make claims of highly profitable opportunities in UK or US investments which turn out to be worthless or simply do not exist. These approaches are usually made by unauthorised companies and individuals and are commonly known as “boiler room” scams. Investors are advised to be wary of any unsolicited advice or offers to buy shares. If it sounds too good to be true, it often is.
See the FCA website fca.org.uk/consumers/scams for more detailed information about this or similar activity.
Registrar and transfer office The RegistrarComputershare Investor Services PLC The Pavilions Bridgwater Road, Bristol BS99 6ZZ, England Telephone: +44 (0)870 702 0198 investorcentre.co.uk/contactus
ADS depositaryBNY Mellon Shareowner Services PO Box 30170 College Station, TX 77842-3170 Telephone: +1 800 233 5601 (toll free) or, for calls outside the United States, +1 201 680 6837 (not toll free) and enter company number 2160 Email: [email protected]
Holders of ordinary shares resident in Ireland:Computershare Investor Services (Ireland) Ltd PO Box 9742 Dublin 18, Ireland Telephone: +353 (0)818 300 999 investorcentre.co.uk/contactus
Share price historyOn flotation of the Company on 11 October 1988 the ordinary shares were valued at 170 pence each. When the Company was finally demerged on 16 September 1991 the base cost of Racal Electronics Plc shares for UK taxpayers was apportioned between the Company and Racal Electronics Plc for capital gains tax purposes in the ratio of 80.036% and 19.964% respectively. Opening share prices on 16 September 1991 were 332 pence for each Vodafone share and 223 pence for each Racal share.
On 21 July 1994 the Company effected a bonus issue of two new shares for every one then held and on 30 September 1999 it effected a bonus issue of four new shares for every one held at that date. The flotation and demerger share prices therefore may be restated as 11.333 pence and 22.133 pence respectively.
On 31 July 2006 the Group returned approximately £9 billion to shareholders in the form of a B share arrangement. As part of this arrangement, and in order to facilitate historical share price comparisons, the Group’s share capital was consolidated on the basis of seven new ordinary shares for every eight ordinary shares held at this date.
On 21 February 2014 the Group disposed of its interest in Verizon Wireless (‘VZW’) to Verizon Communications Inc. As part of this transaction the Group returned US$85 billion to shareholders in cash and Verizon shares. On 24 February 2014 the Group’s share capital was consolidated on the basis of six new ordinary shares for every eleven existing ordinary shares.
The closing share price at 31 March 2014 was 220.25 pence (31 March 2013: 186.60 pence). The closing share price on 19 May 2014 was 217.95 pence.
The following tables set out, for the periods indicated, (i) the reported high and low middle market quotations of ordinary shares on the
London Stock Exchange, and (ii) the reported high and low sales prices of ADSs on the New York Stock Exchange (‘NYSE’)/NASDAQ. The Company transferred its ADS listing from the NYSE to NASDAQ on 29 October 2009.
London StockExchange
Pounds perordinary share
NYSE/NASDAQDollars per ADS
Year ended 31 March High Low High Low
2010 1.54 1.11 24.04 17.682011 1.85 1.27 32.70 18.212012 1.84 1.54 29.46 24.312013 1.92 1.54 30.07 24.422014 2.52 1.80 41.57 27.74
London Stock Exchange
Pounds perordinary share
NYSE/NASDAQDollars per ADS
Quarter High Low High Low
2012/2013First quarter 1.82 1.64 28.39 26.00Second quarter 1.92 1.73 30.07 27.47Third quarter 1.82 1.54 29.46 24.95Fourth quarter 1.90 1.56 28.73 24.422013/2014First quarter 1.99 1.80 30.80 27.81Second quarter 2.24 1.92 35.79 29.15Third quarter 2.44 2.20 39.99 35.03Fourth quarter 2.52 2.18 36.01 41.572014/2015First quarter1 2.27 2.11 38.26 35.37
Note:1 Covering period up to 19 May 2014.
Vodafone Group Plc Annual Report 2014182 183Overview
Strategy review Performance Governance Financials
Additional information

London Stock Exchange
Pounds perordinary share
NASDAQ
Dollars per ADS
Month High Low High Low
November 2013 2.40 2.32 38.06 36.91December 2013 2.43 2.30 39.99 37.39January 2014 2.46 2.28 39.90 37.44February 2014 2.52 2.21 41.57 36.01March 2014 2.49 2.18 41.50 36.05April 2014 2.24 2.11 37.96 35.37May 20141 2.27 2.17 38.26 36.28
Note:1 Covering period up to 19 May 2014.
Inflation and foreign currency translationInflationInflation has not had a significant effect on the Group’s results of operations and financial condition during the three years ended 31 March 2014.
Foreign currency translationThe following table sets out the pound sterling exchange rates of the other principal currencies of the Group, being: “euros”, “€” or “eurocents”, the currency of the European Union (‘EU’) member states which have adopted the euro as their currency, and “US dollars”, “US$”, “cents” or “¢”, the currency of the US.
31 March %Currency (=£1) 2014 2013 Change
Average:Euro 1.19 1.23 (3.3)US dollar 1.59 1.58 0.6At 31 March:Euro 1.21 1.19 1.7US dollar 1.67 1.52 9.9
The following table sets out, for the periods and dates indicated, the period end, average, high and low exchanges rates for pound sterling expressed in US dollars per £1.00.Year ended 31 March 31 March Average High Low
2010 1.52 1.60 1.70 1.442011 1.61 1.56 1.64 1.432012 1.60 1.60 1.67 1.532013 1.52 1.58 1.63 1.492014 1.67 1.59 1.67 1.49
The following table sets out, for the periods indicated, the high and low exchange rates for pounds sterling expressed in US dollars per £1.00.Month High Low
November 2013 1.64 1.59December 2013 1.66 1.63January 2014 1.66 1.63February 2014 1.67 1.63March 2014 1.67 1.65 April 2014 1.69 1.66
MarketsOrdinary shares of Vodafone Group Plc are traded on the London Stock Exchange and in the form of ADSs on NASDAQ. We had a total market capitalisation of approximately £57 billion at 19 May 2014 making us the sixth largest listing in The Financial Times Stock Exchange 100 index and the 76th largest company in the world based on market capitalisation at that date.
ADSs, each representing ten ordinary shares, are traded on NASDAQ under the symbol “VOD”. The ADSs are evidenced by ADRs issued
by BNY Mellon, as depositary, under a deposit agreement, dated as of 12 October 1988, as amended and restated on 26 December 1989, 16 September 1991, 30 June 1999 and 31 July 2006 between the Company, the depositary and the holders from time to time of ADRs issued thereunder.
ADS holders are not members of the Company but may instruct BNY Mellon on the exercise of voting rights relative to the number of ordinary shares represented by their ADSs. See “Articles of association and applicable English law – Rights attaching to the Company’s shares – Voting rights” on page 185.
Shareholders at 31 March 2014
Number of ordinary shares heldNumber of
accounts% of total
issued shares
1–1,000 444,094 0.311,001–5,000 52,522 0.395,001–50,000 14,687 0.6050,001–100,000 513 0.12100,001–500,000 721 0.58More than 500,000 1,135 98.00
513,672 100.00
Major shareholdersBNY Mellon, as custodian of our ADR programme, held approximately 17.95% of our ordinary shares of 2020/21 US cents each at 19 May 2014 as nominee. The total number of ADRs outstanding at 19 May 2014 was 517,135,941. At this date 1,473 holders of record of ordinary shares had registered addresses in the United States and in total held approximately 0.007% of the ordinary shares of the Company.
At 31 March 2014 the following percentage interests in the ordinary share capital of the Company, disclosable under the Disclosure and Transparency Rules, (DTR 5), have been notified to the directors. No changes in the interests disclosed to the Company have been notified between 31 March 2014 and 19 May 2014.Shareholder Shareholding
Black Rock, Inc. 6.90%
The rights attaching to the ordinary shares of the Company held by this shareholder are identical in all respects to the rights attaching to all the ordinary shares of the Company. The directors are not aware, at 19 May 2014, of any other interest of 3% or more in the ordinary share capital of the Company. The Company is not directly or indirectly owned or controlled by any foreign government or any other legal entity. There are no arrangements known to the Company that could result in a change of control of the Company.
Articles of association and applicable English lawThe following description summarises certain provisions of the Company’s articles of association and applicable English law. This summary is qualified in its entirety by reference to the Companies Act 2006 of England and Wales and the Company’s articles of association. See “Documents on display” on page 187 for information on where copies of the articles of association can be obtained.
The Company is a public limited company under the laws of England and Wales. The Company is registered in England and Wales under the name Vodafone Group Public Limited Company with the registration number 1833679.
All of the Company’s ordinary shares are fully paid. Accordingly, no further contribution of capital may be required by the Company from the holders of such shares.
English law specifies that any alteration to the articles of association must be approved by a special resolution of the shareholders.
Vodafone Group Plc Annual Report 2014184
Shareholder information (continued)

Articles of associationBy a special resolution passed at the 2010 AGM the Company removed its object clause together with all other provisions of its memorandum of association which, by virtue of the Companies Act 2006, are treated as forming part of the Company’s articles of association. Accordingly, the Company’s articles of association do not specifically restrict the objects of the Company.
DirectorsThe Company’s articles of association provide for a Board of directors, consisting of not fewer than three directors, who shall manage the business and affairs of the Company.
The directors are empowered to exercise all the powers of the Company subject to any restrictions in the articles of association, the Companies Act (as defined in the articles of association) and any special resolution.
Under the Company’s articles of association a director cannot vote in respect of any proposal in which the director, or any person connected with the director, has a material interest other than by virtue of the director’s interest in the Company’s shares or other securities. However, this restriction on voting does not apply to resolutions (i) giving the director or a third party any guarantee, security or indemnity in respect of obligations or liabilities incurred at the request of or for the benefit of the Company, (ii) giving any guarantee, security or indemnity to the director or a third party in respect of obligations of the Company for which the director has assumed responsibility under an indemnity or guarantee, (iii) relating to an offer of securities of the Company in which the director is entitled to participate as a holder of shares or other securities or in the underwriting of such shares or securities, (iv) concerning any other company in which the director (together with any connected person) is a shareholder or an officer or is otherwise interested, provided that the director (together with any connected person) is not interested in 1% or more of any class of the Company’s equity share capital or the voting rights available to its shareholders, (v) relating to the arrangement of any employee benefit in which the director will share equally with other employees and (vi) relating to any insurance that the Company purchases or renews for its directors or any group of people including directors.
The directors are empowered to exercise all the powers of the Company to borrow money, subject to the limitation that the aggregate amount of all liabilities and obligations of the Group outstanding at any time shall not exceed an amount equal to 1.5 times the aggregate of the Group’s share capital and reserves calculated in the manner prescribed in the articles of association unless sanctioned by an ordinary resolution of the Company’s shareholders.
The Company can make market purchases of its own shares or agree to do so in the future provided it is duly authorised by its members in a general meeting and subject to and in accordance with section 701 of the Companies Act 2006.
At each AGM all directors who were elected or last re-elected at or before the AGM held in the third calendar year before the current year shall automatically retire. In 2005 the Company reviewed its policy regarding the retirement and re-election of directors and, although it is not intended to amend the Company’s articles of association in this regard, the Board has decided in the interests of good corporate governance that all of the directors wishing to continue in office should offer themselves for re-election annually.
Directors are not required under the Company’s articles of association to hold any shares of the Company as a qualification to act as a director, although executive directors participating in long-term incentive plans must comply with the Company’s share ownership guidelines. In accordance with best practice in the UK for corporate governance, compensation awarded to executive directors is decided by a Remuneration Committee consisting exclusively of non-executive directors.
In addition, as required by The Directors’ Remuneration Report Regulations, the Board has, since 2003, prepared a report to shareholders on the directors’ remuneration which complies with the regulations (see pages 69 to 85). The report is also subject to a shareholder vote.
Rights attaching to the Company’s sharesAt 31 March 2014 the issued share capital of the Company was comprised of 50,000 7% cumulative fixed rate shares of £1.00 each, 26,439,960,221 ordinary shares (excluding treasury shares) of 2020/21 US cents each and 33,737,176,433 deferred shares of US$0.00001 each.
Dividend rightsHolders of 7% cumulative fixed rate shares are entitled to be paid in respect of each financial year, or other accounting period of the Company, a fixed cumulative preferential dividend of 7% per annum on the nominal value of the fixed rate shares. A fixed cumulative preferential dividend may only be paid out of available distributable profits which the directors have resolved should be distributed. The fixed rate shares do not have any other right to share in the Company’s profits.
Holders of the Company’s ordinary shares may, by ordinary resolution, declare dividends but may not declare dividends in excess of the amount recommended by the directors. The Board of directors may also pay interim dividends. No dividend may be paid other than out of profits available for distribution. Dividends on ordinary shares can be paid to shareholders in whatever currency the directors decide, using an appropriate exchange rate for any currency conversions which are required. Holders of the Company’s deferred shares have no right to dividends.
If a dividend has not been claimed for one year after the date of the resolution passed at a general meeting declaring that dividend or the resolution of the directors providing for payment of that dividend, the directors may invest the dividend or use it in some other way for the benefit of the Company until the dividend is claimed. If the dividend remains unclaimed for 12 years after the relevant resolution either declaring that dividend or providing for payment of that dividend, it will be forfeited and belong to the Company.
Voting rightsThe Company’s articles of association provide that voting on substantive resolutions (i.e. any resolution which is not a procedural resolution) at a general meeting shall be decided on a poll. On a poll, each shareholder who is entitled to vote and is present in person or by proxy has one vote for every share held. Procedural resolutions (such as a resolution to adjourn a general meeting or a resolution on the choice of Chairman of a general meeting) shall be decided on a show of hands, where each shareholder who is present at the meeting has one vote regardless of the number of shares held, unless a poll is demanded. In addition, the articles of association allow persons appointed as proxies of shareholders entitled to vote at general meetings to vote on a show of hands, as well as to vote on a poll and attend and speak at general meetings. The articles of association also allow persons appointed as proxies by two or more shareholders entitled to vote at general meetings to vote for and against a resolution on a show of hands.
Under English law two shareholders present in person constitute a quorum for purposes of a general meeting unless a company’s articles of association specify otherwise. The Company’s articles of association do not specify otherwise, except that the shareholders do not need to be present in person and may instead be present by proxy to constitute a quorum.
Under English law shareholders of a public company such as the Company are not permitted to pass resolutions by written consent.
Vodafone Group Plc Annual Report 2014184 185Overview
Strategy review Performance Governance Financials
Additional information

Record holders of the Company’s ADSs are entitled to attend, speak and vote on a poll or a show of hands at any general meeting of the Company’s shareholders by the depositary’s appointment of them as corporate representatives with respect to the underlying ordinary shares represented by their ADSs. Alternatively holders of ADSs are entitled to vote by supplying their voting instructions to the depositary or its nominee who will vote the ordinary shares underlying their ADSs in accordance with their instructions.
Employees are able to vote any shares held under the Vodafone Group Share Incentive Plan and “My ShareBank” (a vested nominee share account) through the respective plan’s trustees.
Holders of the Company’s 7% cumulative fixed rate shares are only entitled to vote on any resolution to vary or abrogate the rights attached to the fixed rate shares. Holders have one vote for every fully paid 7% cumulative fixed rate share.
Holders of the Company’s deferred shares are not entitled to attend or vote at general meetings of the Company.
Liquidation rightsIn the event of the liquidation of the Company, after payment of all liabilities and deductions in accordance with English law, the holders of the Company’s 7% cumulative fixed rate shares would be entitled to a sum equal to the capital paid up on such shares, together with certain dividend payments, in priority to holders of the Company’s ordinary shares. The holders of the fixed rate shares do not have any other right to share in the Company’s surplus assets. The holders of ordinary shares have priority over holders of deferred shares.
Pre-emptive rights and new issues of sharesUnder section 549 of the Companies Act 2006 directors are, with certain exceptions, unable to allot the Company’s ordinary shares or securities convertible into the Company’s ordinary shares without the authority of the shareholders in a general meeting. In addition, section 561 of the Companies Act 2006 imposes further restrictions on the issue of equity securities (as defined in the Companies Act 2006 which include the Company’s ordinary shares and securities convertible into ordinary shares) which are, or are to be, paid up wholly in cash and not first offered to existing shareholders. The Company’s articles of association allow shareholders to authorise directors for a period specified in the relevant resolution to allot (i) relevant securities generally up to an amount fixed by the shareholders and (ii) equity securities for cash other than in connection with a pre-emptive offer up to an amount specified by the shareholders and free of the pre-emption restriction in section 561. At the 2013 AGM the amount of relevant securities fixed by shareholders under (i) above and the amount of equity securities specified by shareholders under (ii) above were both in line with corporate governance guidelines. The directors consider it desirable to have the maximum flexibility permitted by corporate governance guidelines to respond to market developments and to enable allotments to take place to finance business opportunities as they arise. In order to retain such maximum flexibility, the directors propose to renew the authorities granted by shareholders in 2013 at this year’s AGM. Further details of such proposals are provided in the 2014 notice of AGM.
Disclosure of interests in the Company’s sharesThere are no provisions in the articles of association whereby persons acquiring, holding or disposing of a certain percentage of the Company’s shares are required to make disclosure of their ownership percentage although such requirements exist under rules derived from the Disclosure and Transparency Rules (‘DTRs’).
The basic disclosure requirement upon a person acquiring or disposing of shares that are admitted to trading on a regulated market and carrying voting rights is an obligation to provide written notification to the Company, including certain details as set out in DTR 5, where the percentage of the person’s voting rights which he holds as shareholder or through his direct or indirect holding of financial instruments (falling within DTR 5.3.1R) reaches or exceeds 3% and reaches, exceeds or falls below each 1% threshold thereafter.
Under section 793 of the Companies Act 2006 the Company may, by notice in writing, require a person that the Company knows or has reasonable cause to believe is, or was during the preceding three years, interested in the Company’s shares to indicate whether or not that is correct and, if that person does or did hold an interest in the Company’s shares, to provide certain information as set out in the Companies Act 2006. DTR 3 deals with the disclosure by persons “discharging managerial responsibility” and their connected persons of the occurrence of all transactions conducted on their account in the shares of the Company. Part 28 of The Companies Act 2006 sets out the statutory functions of the Panel on Takeovers & Mergers (the ‘Panel’). The Panel is responsible for issuing and administering the Code on Takeovers & Mergers which includes disclosure requirements on all parties to a takeover with regard to dealings in the securities of an offeror or offeree company and also on their respective associates during the course of an offer period.
General meetings and noticesSubject to the articles of association, annual general meetings are held at such times and place as determined by the directors of the Company. The directors may also, when they think fit, convene other general meetings of the Company. General meetings may also be convened on requisition as provided by the Companies Act 2006.
An annual general meeting needs to be called by not less than 21 days’ notice in writing. Subject to obtaining shareholder approval on an annual basis, the Company may call other general meetings on 14 days’ notice. The directors may determine that persons entitled to receive notices of meetings are those persons entered on the register at the close of business on a day determined by the directors but not later than 21 days before the date the relevant notice is sent. The notice may also specify the record date, the time of which shall be determined in accordance with the articles of association and the Companies Act 2006.
Shareholders must provide the Company with an address or (so far as the Companies Act 2006 allows) an electronic address or fax number in the UK in order to be entitled to receive notices of shareholders’ meetings and other notices and documents. In certain circumstances the Company may give notices to shareholders by publication on the Company’s website and advertisement in newspapers in the UK. Holders of the Company’s ADSs are entitled to receive notices under the terms of the deposit agreement relating to the ADSs.
Under section 336 of the Companies Act 2006 the annual general meeting of shareholders must be held each calendar year and within six months of the Company’s year end.
Vodafone Group Plc Annual Report 2014186
Shareholder information (continued)

Electronic communicationsThe Company has previously passed a resolution allowing it to communicate all shareholder information by electronic means, including making such information available on the Company’s website. Those shareholders who have positively elected for website communication (or are deemed to have consented to receive electronic communication in accordance with the Companies Act 2006) will receive written notification whenever shareholder documentation is made available on the website.
Variation of rightsIf at any time the Company’s share capital is divided into different classes of shares, the rights attached to any class may be varied, subject to the provisions of the Companies Act 2006, either with the consent in writing of the holders of three quarters in nominal value of the shares of that class or at a separate meeting of the holders of the shares of that class.
At every such separate meeting all of the provisions of the articles of association relating to proceedings at a general meeting apply, except that (i) the quorum is to be the number of persons (which must be at least two) who hold or represent by proxy not less than one-third in nominal value of the issued shares of the class or, if such quorum is not present on an adjourned meeting, one person who holds shares of the class regardless of the number of shares he holds, (ii) any person present in person or by proxy may demand a poll and (iii) each shareholder will have one vote per share held in that particular class in the event a poll is taken. Class rights are deemed not to have been varied by the creation or issue of new shares ranking equally with or subsequent to that class of shares in sharing in profits or assets of the Company or by a redemption or repurchase of the shares by the Company.
Limitations on voting and shareholdingAs far as the Company is aware there are no limitations imposed on the transfer, holding or voting of the Company’s ordinary shares other than those limitations that would generally apply to all of the shareholders. No shareholder has any securities carrying special rights with regard to control of the Company.
Documents on displayThe Company is subject to the information requirements of the Exchange Act applicable to foreign private issuers. In accordance with these requirements the Company files its annual report on Form 20-F and other related documents with the SEC. These documents may be inspected at the SEC’s public reference rooms located at 100 F Street, NE Washington, DC 20549. Information on the operation of the public reference room can be obtained in the United States by calling the SEC on +1-800-SEC-0330. In addition, some of the Company’s SEC filings, including all those filed on or after 4 November 2002, are available on the SEC’s website (sec.gov). Shareholders can also obtain copies of the Company’s articles of association from our website at vodafone.com/governance or from the Company’s registered office.
Material contractsAt the date of this annual report the Group is not party to any contracts that are considered material to the Group’s results or operations except for its US$4.2 billion and €3.9 billion revolving credit facilities which are discussed in note 22 “Liquidity and capital resources” to the consolidated financial statements and the stock purchase agreement for the sale of the Group’s entire 45% shareholding in VZW to Verizon Communications Inc.
Exchange controlsThere are no UK government laws, decrees or regulations that restrict or affect the export or import of capital, including but not limited to, foreign exchange controls on remittance of dividends on the ordinary shares or on the conduct of the Group’s operations.
TaxationAs this is a complex area investors should consult their own tax advisor regarding the US federal, state and local, the UK and other tax consequences of owning and disposing of shares and ADSs in their particular circumstances.
This section describes, primarily for a US holder (as defined below), in general terms, the principal US federal income tax and UK tax consequences of owning or disposing of shares or ADSs in the Company held as capital assets (for US and UK tax purposes). This section does not, however, cover the tax consequences for members of certain classes of holders subject to special rules including, for example, US expatriates and former long-term residents of the US and officers of the Company, employees and holders that, directly or indirectly, hold 10% or more of the Company’s voting stock.
A US holder is a beneficial owner of shares or ADSs that is for US federal income tax purposes:
a a citizen or resident of the US;
a a US domestic corporation;
a an estate, the income of which is subject to US federal income tax regardless of its source; or
a a trust, if a US court can exercise primary supervision over the trust’s administration and one or more US persons are authorised to control all substantial decisions of the trust, or the trust has validly elected to be treated as a domestic trust for US federal income tax purposes.
If an entity treated as a partnership for US federal income tax purposes holds the shares or ADSs, the US federal income tax treatment of a partner will generally depend on the status of the partner and the tax treatment of the partnership. A partner in an entity treated as a partnership for US federal income tax purposes holding the shares or ADSs should consult its tax advisor with regard to the US federal income tax treatment of an investment in the shares or ADSs.
This section is based on the US Internal Revenue Code of 1986, as amended, its legislative history, existing and proposed regulations thereunder, published rulings and court decisions, and on the tax laws of the UK and the Double Taxation Convention between the US and the UK (the ‘treaty’), all as currently in effect. These laws are subject to change, possibly on a retroactive basis.
This section is further based in part upon the representations of the depositary and assumes that each obligation in the deposit agreement and any related agreement will be performed in accordance with its terms.
For purposes of the treaty and the US-UK double taxation convention relating to estate and gift taxes (the ‘Estate Tax Convention’), and for US federal income tax and UK tax purposes, this section is based on the assumption that a holder of ADRs evidencing ADSs will be treated as the owner of the shares in the Company represented by those ADSs. Investors should note that a ruling by the first-tier tax tribunal in the UK has cast doubt on this view, but HMRC have stated that they will continue to apply their long-standing practice of regarding the holder of such ADRs as holding the beneficial interest in the underlying shares. Investors should note, however, that this is an area of some uncertainty that may be subject to further developments in the future. Generally exchanges of shares for ADRs and ADRs for shares will not be subject to US federal income tax or to UK tax other than stamp duty or stamp duty reserve tax (see the section on these taxes on page 189).
Vodafone Group Plc Annual Report 2014186 187Overview
Strategy review Performance Governance Financials
Additional information
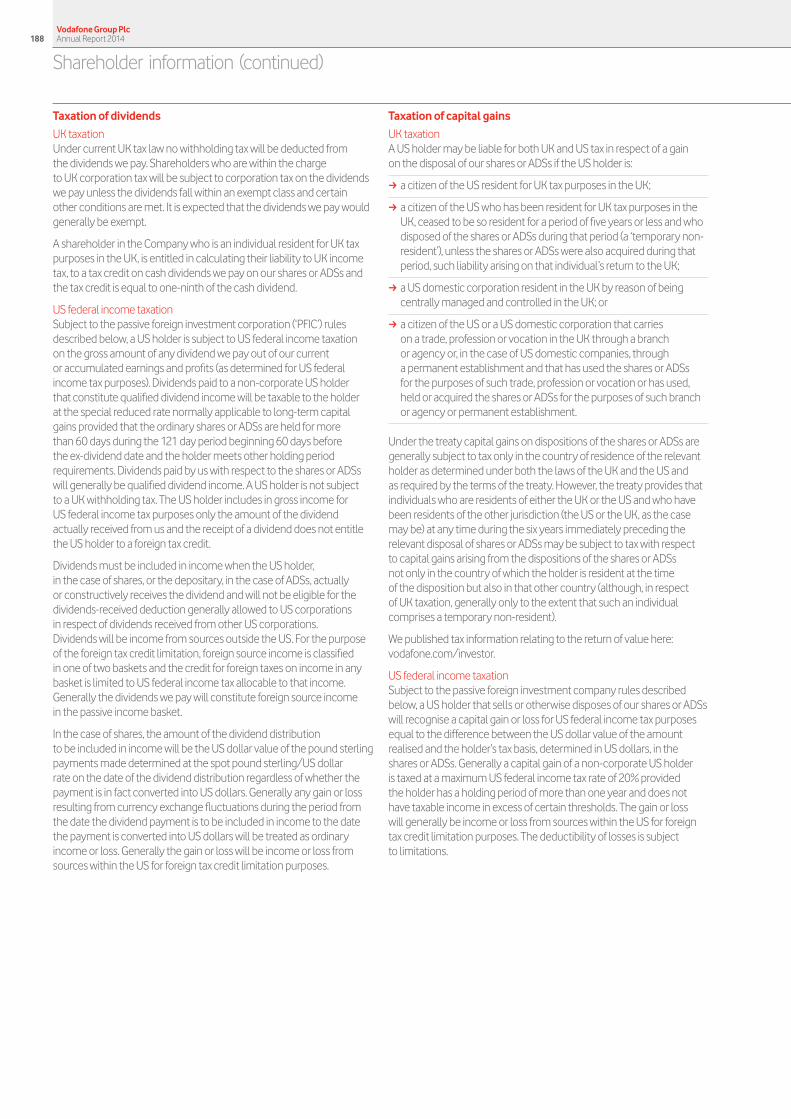
Taxation of dividends
UK taxationUnder current UK tax law no withholding tax will be deducted from the dividends we pay. Shareholders who are within the charge to UK corporation tax will be subject to corporation tax on the dividends we pay unless the dividends fall within an exempt class and certain other conditions are met. It is expected that the dividends we pay would generally be exempt.
A shareholder in the Company who is an individual resident for UK tax purposes in the UK, is entitled in calculating their liability to UK income tax, to a tax credit on cash dividends we pay on our shares or ADSs and the tax credit is equal to one-ninth of the cash dividend.
US federal income taxationSubject to the passive foreign investment corporation (‘PFIC’) rules described below, a US holder is subject to US federal income taxation on the gross amount of any dividend we pay out of our current or accumulated earnings and profits (as determined for US federal income tax purposes). Dividends paid to a non-corporate US holder that constitute qualified dividend income will be taxable to the holder at the special reduced rate normally applicable to long-term capital gains provided that the ordinary shares or ADSs are held for more than 60 days during the 121 day period beginning 60 days before the ex-dividend date and the holder meets other holding period requirements. Dividends paid by us with respect to the shares or ADSs will generally be qualified dividend income. A US holder is not subject to a UK withholding tax. The US holder includes in gross income for US federal income tax purposes only the amount of the dividend actually received from us and the receipt of a dividend does not entitle the US holder to a foreign tax credit.
Dividends must be included in income when the US holder, in the case of shares, or the depositary, in the case of ADSs, actually or constructively receives the dividend and will not be eligible for the dividends-received deduction generally allowed to US corporations in respect of dividends received from other US corporations. Dividends will be income from sources outside the US. For the purpose of the foreign tax credit limitation, foreign source income is classified in one of two baskets and the credit for foreign taxes on income in any basket is limited to US federal income tax allocable to that income. Generally the dividends we pay will constitute foreign source income in the passive income basket.
In the case of shares, the amount of the dividend distribution to be included in income will be the US dollar value of the pound sterling payments made determined at the spot pound sterling/US dollar rate on the date of the dividend distribution regardless of whether the payment is in fact converted into US dollars. Generally any gain or loss resulting from currency exchange fluctuations during the period from the date the dividend payment is to be included in income to the date the payment is converted into US dollars will be treated as ordinary income or loss. Generally the gain or loss will be income or loss from sources within the US for foreign tax credit limitation purposes.
Taxation of capital gains
UK taxationA US holder may be liable for both UK and US tax in respect of a gain on the disposal of our shares or ADSs if the US holder is:
a a citizen of the US resident for UK tax purposes in the UK;
a a citizen of the US who has been resident for UK tax purposes in the UK, ceased to be so resident for a period of five years or less and who disposed of the shares or ADSs during that period (a ‘temporary non-resident’), unless the shares or ADSs were also acquired during that period, such liability arising on that individual’s return to the UK;
a a US domestic corporation resident in the UK by reason of being centrally managed and controlled in the UK; or
a a citizen of the US or a US domestic corporation that carries on a trade, profession or vocation in the UK through a branch or agency or, in the case of US domestic companies, through a permanent establishment and that has used the shares or ADSs for the purposes of such trade, profession or vocation or has used, held or acquired the shares or ADSs for the purposes of such branch or agency or permanent establishment.
Under the treaty capital gains on dispositions of the shares or ADSs are generally subject to tax only in the country of residence of the relevant holder as determined under both the laws of the UK and the US and as required by the terms of the treaty. However, the treaty provides that individuals who are residents of either the UK or the US and who have been residents of the other jurisdiction (the US or the UK, as the case may be) at any time during the six years immediately preceding the relevant disposal of shares or ADSs may be subject to tax with respect to capital gains arising from the dispositions of the shares or ADSs not only in the country of which the holder is resident at the time of the disposition but also in that other country (although, in respect of UK taxation, generally only to the extent that such an individual comprises a temporary non-resident).
We published tax information relating to the return of value here: vodafone.com/investor.
US federal income taxationSubject to the passive foreign investment company rules described below, a US holder that sells or otherwise disposes of our shares or ADSs will recognise a capital gain or loss for US federal income tax purposes equal to the difference between the US dollar value of the amount realised and the holder’s tax basis, determined in US dollars, in the shares or ADSs. Generally a capital gain of a non-corporate US holder is taxed at a maximum US federal income tax rate of 20% provided the holder has a holding period of more than one year and does not have taxable income in excess of certain thresholds. The gain or loss will generally be income or loss from sources within the US for foreign tax credit limitation purposes. The deductibility of losses is subject to limitations.
Vodafone Group Plc Annual Report 2014188
Shareholder information (continued)

Additional tax considerations
UK inheritance taxAn individual who is domiciled in the US (for the purposes of the Estate Tax Convention) and is not a UK national will not be subject to UK inheritance tax in respect of our shares or ADSs on the individual’s death or on a transfer of the shares or ADSs during the individual’s lifetime, provided that any applicable US federal gift or estate tax is paid, unless the shares or ADSs are part of the business property of a UK permanent establishment or pertain to a UK fixed base used for the performance of independent personal services. Where the shares or ADSs have been placed in trust by a settlor they may be subject to UK inheritance tax unless, when the trust was created, the settlor was domiciled in the US and was not a UK national. Where the shares or ADSs are subject to both UK inheritance tax and to US federal gift or estate tax, the estate tax convention generally provides a credit against US federal tax liabilities for UK inheritance tax paid.
UK stamp duty and stamp duty reserve taxStamp duty will, subject to certain exceptions, be payable on any instrument transferring our shares to the custodian of the depositary at the rate of 1.5% on the amount or value of the consideration if on sale or on the value of such shares if not on sale. Stamp duty reserve tax (‘SDRT’), at the rate of 1.5% of the price or value of the shares, could also be payable in these circumstances and on issue to such a person but no SDRT will be payable if stamp duty equal to such SDRT liability is paid.
A ruling by the European Court of Justice has determined that the 1.5% SDRT charges on issue of shares to a clearance service is contrary to EU law. As a result of that ruling, HMRC indicated that where new shares are first issued to a clearance service or to a depositary within the EU, the 1.5% SDRT charge will not be levied. Subsequently, a decision by the first-tier tax tribunal in the UK extended this ruling to the issue of shares (or, where it is integral to the raising of new capital, the transfer of shares) to depositary receipts systems wherever located. HMRC have stated that they will not seek to appeal this decision and, as such, will no longer seek to impose 1.5% SDRT on the issue of shares (or, where it is integral to the raising of new capital, the transfer of shares) to a clearance service or to a depositary, wherever located. Investors should, however, be aware that this area may be subject to further developments in the future.
No stamp duty will be payable on any transfer of our ADSs provided that the ADSs and any separate instrument of transfer are executed and retained at all times outside the UK. A transfer of our shares in registered form will attract ad valorem stamp duty generally at the rate of 0.5% of the purchase price of the shares. There is no charge to ad valorem stamp duty on gifts.
SDRT is generally payable on an unconditional agreement to transfer our shares in registered form at 0.5% of the amount or value of the consideration for the transfer, but is repayable if, within six years of the date of the agreement, an instrument transferring the shares is executed or, if the SDRT has not been paid, the liability to pay the tax (but not necessarily interest and penalties) would be cancelled. However, an agreement to transfer our ADSs will not give rise to SDRT.
PFIC rulesWe do not believe that our shares or ADSs will be treated as stock of a PFIC for US federal income tax purposes. This conclusion is a factual determination that is made annually and thus is subject to change. If we are treated as a PFIC, any gain realised on the sale or other disposition of the shares or ADSs would in general not be treated as capital gain unless a US holder elects to be taxed annually on a mark-to-market basis with respect to the shares or ADSs. Otherwise a US holder would be treated as if he or she has realised such gain and certain “excess distributions” rateably over the holding period for the shares or ADSs and would be taxed at the highest tax rate in effect for each such year to which the gain was allocated. An interest charge in respect of the tax attributable to each such year would also apply. Dividends received from us would not be eligible for the preferential tax rate applicable to qualified dividend income for certain noncorporate holders.
Backup withholding and information reportingPayments of dividends and other proceeds to a US holder with respect to shares or ADSs, by a US paying agent or other US intermediary will be reported to the Internal Revenue Service (‘IRS’) and to the US holder as may be required under applicable regulations. Backup withholding may apply to these payments if the US holder fails to provide an accurate taxpayer identification number or certification of exempt status or fails to report all interest and dividends required to be shown on its US federal income tax returns. Certain US holders are not subject to backup withholding. US holders should consult their tax advisors as to their qualification for exemption from backup withholding and the procedure for obtaining an exemption.
Foreign financial asset reportingUS taxpayers that own certain foreign financial assets, including debt and equity of foreign entities, with an aggregate value in excess of US$50,000 at the end of the taxable year or US$75,000 at any time during the taxable year (or, for certain individuals living outside the United States and married individuals filing joint returns, certain higher thresholds) may be required to file an information report with respect to such assets with their tax returns. The shares constitute foreign financial assets subject to these requirements unless the shares are held in an account at a financial institution (in which case the account may be reportable if maintained by a foreign financial institution). US holders should consult their tax advisors regarding the application of the rules relating to foreign financial asset reporting.
Vodafone Group Plc Annual Report 2014188 189Overview
Strategy review Performance Governance Financials
Additional information

The Company was incorporated under English law in 1984 as Racal Strategic Radio Limited (registered number 1833679). After various name changes, 20% of Racal Telecom Plc share capital was offered to the public in October 1988. The Company was fully demerged from Racal Electronics Plc and became an independent company in September 1991, at which time it changed its name to Vodafone Group Plc.
Since then we have entered into various transactions which enhanced our international presence. The most significant of these transactions were as follows:
a the merger with AirTouch Communications, Inc. which completed on 30 June 1999. The Company changed its name to Vodafone AirTouch Plc in June 1999 but then reverted to its former name, Vodafone Group Plc, on 28 July 2000;
a the completion on 10 July 2000 of the agreement with Bell Atlantic and GTE to combine their US cellular operations to create the largest mobile operator in the United States, Verizon Wireless, resulting in the Group having a 45% interest in the combined entity;
a the acquisition of Mannesmann AG which completed on 12 April 2000. Through this transaction we acquired businesses in Germany and Italy and increased our indirect holding in Société Française du Radiotéléphone S.A. (‘SFR’);
a through a series of business transactions between 1999 and 2004 we acquired a 97.7% stake in Vodafone Japan. This was then disposed of on 27 April 2006;
a on 8 May 2007 we acquired companies with controlling interests in Vodafone India Limited (‘VIL’), formerly Vodafone Essar Limited, for US$10.9 billion (£5.5 billion); and
a on 20 April 2009 we acquired an additional 15.0% stake in Vodacom for cash consideration of ZAR 20.6 billion (£1.6 billion). On 18 May 2009 Vodacom became a subsidiary.
Other transactions that have occurred since 31 March 2010 are as follows:
10 September 2010 – China Mobile Limited: We sold our entire 3.2% interest in China Mobile Limited for cash consideration of £4.3 billion.
30/31 March 2011 – India: The Essar Group exercised its underwritten put option over 22.0% of VIL, following which we exercised our call option over the remaining 11.0% of VIL owned by the Essar Group. The total consideration due under these two options was US$5 billion (£3.1 billion).
16 June 2011 – SFR: We sold our entire 44% interest in SFR to Vivendi for a cash consideration of €7.75 billion (£6.8 billion) and received a final dividend from SFR of €200 million (£176 million).
1 June/1 July 2011 – India: We acquired an additional 22% stake in VIL from the Essar Group for a cash consideration of US$4.2 billion (£2.6 billion) including withholding tax.
18 August 2011/8 February 2012 – Vodafone assigned its rights to purchase 11% of VIL to Piramal Healthcare Limited (‘Piramal’). On 18 August 2011 Piramal purchased 5.5% of VIL from the Essar Group for a cash consideration of INR 28.6 billion (£368 million). On 8 February 2012, they purchased a further 5.5% of VIL from the Essar Group for a cash consideration of approximately INR 30.1 billion (£399 million) taking Piramal’s total shareholding in VIL to approximately 11%.
9 November 2011 – Poland: We sold our entire 24.4% interest in Polkomtel in Poland for cash consideration of approximately €920 million (£784 million) before tax and transaction costs.
27 July 2012 – UK: We acquired the entire share capital of Cable & Wireless Worldwide plc for a cash consideration of approximately £1,050 million.
31 October 2012 – New Zealand: We acquired TelstraClear Limited, for a cash consideration of NZ$840 million (£440 million).
13 September 2013 – Germany: We acquired a 76.57% interest in Kabel Deutschland Holding AG for a cash consideration of €5.8 billion (£4.9 billion).
21 February 2014 – On 2 September 2013 Vodafone announced that it had reached agreement to dispose of its US Group whose principal asset was its 45% interest in Verizon Wireless (‘VZW’) to Verizon Communications Inc. (‘Verizon’), Vodafone’s joint venture partner, for a total consideration of US$130 billion (£79 billion) including the remaining 23.1% minority interest in Vodafone Italy. Following completion on 21 February 2014, Vodafone shareholders received Verizon shares and cash totalling US$85 billion (£51 billion).
17 March 2014 – Spain: We agreed to acquire Group Corporativo Ono, S.A. (‘Ono’) for a total consideration equivalent to €7.2 billion (£6.0 billion) on a debt and cash free basis. The acquisition, which is subject to customary terms and conditions including anti-trust clearances by the relevant authorities, is expected to complete in calendar Q3 2014.
Vodafone Group Plc Annual Report 2014190
History and development

Our operating companies are generally subject to regulation governing the operation of their business activities. Such regulation typically takes the form of industry specific law and regulation covering telecommunications services and general competition (antitrust) law applicable to all activities.
The following section describes the regulatory frameworks and the key regulatory developments at the global and supranational level and in selected countries in which we have significant interests during the year ended 31 March 2014. Many of the regulatory developments reported in the following section involve ongoing proceedings or consideration of potential proceedings that have not reached a conclusion. Accordingly, we are unable to attach a specific level of financial risk to our performance from such matters.
European Union (‘EU’)In September 2013, the European Commission (the ‘Commission’) delivered major regulatory proposals aimed at building a telecoms single market and delivering a “Connected Continent”. These proposals have been amended by the European Parliament and will now be reviewed by the European Council. The Commission’s proposals include the following:
a a simplified notification process for telecommunications operators across the EU;
a removal of all roaming surcharges after June 2016;
a increased transparency requirements for consumers;
a harmonisation of Spectrum allocation rules; and
a net neutrality requirements, which include restrictions on blocking, slowing down or discriminating against any internet content.
RoamingThe current roaming regulation came into force in July 2012 and requires mobile operators to supply voice, text and data roaming services under retail price caps. Wholesale price caps also apply to voice, text and data roaming services.
The roaming regulation also requires a number of additional measures which are intended to increase competition in the retail market for roaming and thereby facilitate the withdrawal of price caps. These include a requirement that users be able, from July 2014, to purchase roaming services from a provider other than their current domestic provider and to retain the same phone number when roaming.
Fixed network regulationIn September 2013, the Commission published its recommendation on costing methodologies and non-discrimination which aims to encourage Next Generation Access (‘NGA’) investment. NGA networks of operators with Significant Market Power (‘SMP’) may be exempt from cost-oriented wholesale prices if access is provided on the basis of equivalence of inputs (i.e. exactly the same products, prices and processes are offered to competitors) with effective margin squeeze tests to ensure technical and economic replicability. Copper wholesale network prices are expected to remain within a guide price band of €8 to €10 per month.
Europe regionGermanyThe Federal Network Agency (‘BNetzA’) has indicated that the envisaged merger of Telefónica Deutschland and E-plus will have implications for spectrum allocation, and this is expected to impact the current proceedings on 700MHz, 900MHz, 1500MHz and 1800MHz licensing (Project 2016). BNetzA is unlikely to decide on the further procedure until the envisaged Telefónica Deutschland/E-plus merger is finally decided in mid-2014.
The national regulator is currently consulting on new mobile termination rates (‘MTR’s), with a decision due to be announced in December 2014.
ItalyVodafone Italy, along with other Italian mobile operators, is the subject of an investigation by the Italian Antitrust Authority following a dawn raid in November 2012. This followed a complaint from an MVNO that it had been excluded from the market. The investigation is ongoing and Vodafone Italy is cooperating with the Antitrust Authority.
Vodafone Italy has appealed against the injunction of the national regulator (‘AGCOM’) ordering them to adopt all measures required under the Roaming Regulation in relation to roaming charges within a tariff.
For information on litigation in Italy, see note 30 “Contingent liabilities”.
United KingdomIn October 2013, the national regulator (‘Ofcom’) began a consultation on revising the annual licence fees payable on licences for the use of spectrum in the 900MHz and 1800MHz bands, to reflect market value and with regard to the sums bid in the 4G auction. The 900MHz, 1800MHz and 2.1GHz licences have been made technology-neutral, allowing them to be used for 4G.
SpainIn June 2013, the Spanish Parliament adopted Act 3/2013 creating the National Markets and Competition Commission (‘CNMC’) as the new national regulator, responsible for both competition and regulatory matters.
In August 2013, Vodafone Spain filed a competition complaint with the competition authority against Telefónica and Yoigo for an alleged unauthorised transfer of the use of Yoigo’s spectrum to Telefónica with a parallel complaint filed to the Ministry in September 2013. The Ministry rejected that complaint in November 2013 and Vodafone Spain has submitted an administrative appeal against this decision in December 2013, stating that Yoigo and Telefónica are undertaking an unauthorised spectrum sharing arrangement. The Ministry has not yet announced its decision.
In February 2014, Vodafone Spain lodged a competition claim before the national regulator against Telefónica citing abuse of its dominant position in both its fibre roll-out and fibre retail offers as well as subscribing to anticompetitive agreements with Jazztel.
In March 2014, the national regulator concluded there were no sanctions to apply against Telefónica, Orange and Vodafone in the margin squeeze case that was originally brought to them by a MVNO in January 2012.
The fines applied to Telefónica, Orange and Vodafone Spain in December 2012 for abuse of dominant position by imposing excessive pricing of wholesale SMS/MMS services on MVNOs, remain suspended until the judicial review is concluded.
NetherlandsIn November 2013, the investigation of the Dutch competition authority (‘ACM’) into the three mobile operators (KPN, T-Mobile and Vodafone Netherlands) concluded without any fine being imposed. ACM determined that there were no price-fixing agreements in the mobile-telecommunications market. However, ACM did establish that public statements about future market behaviour could carry antitrust risks. The three operators have therefore made a commitment to ACM that they will refrain from making certain statements about future market behaviour in public to avoid any risk of illegal collusive behaviour in the future.
Vodafone Group Plc Annual Report 2014190 191Overview
Strategy review Performance Governance Financials
Additional information
Regulation

IrelandIn December 2012, Vodafone Ireland judicially challenged the decision of the Commission for Communications Regulation (‘ComReg’), to impose an interim MTR based on a BEREC benchmark rather than a MTR based on a full cost model. In August 2013, the Irish High Court found the decision to be unlawful and by Court order, set a maximum MTR rate for the Irish market of 2.60 eurocents per minute, to apply from 1 July 2013. This rate will apply until a MTR based on a fully modelled price is available which is expected in September 2014. ComReg has appealed the Irish High Court’s decision, to the Irish Supreme Court.
PortugalIn July 2013, following a complaint from Optimus, the Portuguese Competition Authority (‘PCA’) opened an administrative inquiry into TMN, Vodafone Portugal and Optimus to assess the existence of a potential abuse of individual dominant position by TMN and Vodafone Portugal or a potential abuse of collective dominant position by these companies on the mobile communications services retail markets, consisting of a rate discrimination (i.e. the application of dissimilar conditions to equivalent services) between the on-net prices of voice calls and SMS and the off-net prices of voice calls and SMS. The inquiry also covers the potential abuse of individual dominant position by TMN and Vodafone Portugal in their respective wholesale SMS termination markets. We submitted preliminary remarks in September 2013.
Romania An investigation by the Romanian Competition Council (‘RCA’) commenced in April 2011 for alleged margin squeeze by all MNOs between 2006 and 2011 on wholesale termination tariffs. In May 2012, at the request of the MNOs, the RCA accepted to enter into a commitment procedure in order to close the investigation. Their concerns on MTRs have been resolved by the national regulator’s decision on a new long-run incremental cost model that means from 1 April 2014, the maximum termination rates in Romania will decrease from 0.67 eurocents per minute to 0.14 eurocents per minute for fixed call termination and, respectively, from 3.07 eurocents per minute to 0.96 eurocents per minute for mobile call termination.
A cross-border spectrum coordination agreement with Ukraine was signed in June 2013, ensuring interference free use of the E-GSM 900MHz band at the border. Although the agreement entered into force on 1 January 2014, the Ukrainian operators are not currently fulfilling their obligations under the agreement, resulting in the Vodafone Romania E-GSM spectrum facing heavy interference in some areas, especially on the south-east side of the country. Vodafone Romania, with the help of the national regulator, is working to find a timely and efficient solution with the Ukrainian operators, before the entry into force of the new GSM licences.
New spectrum licenses comprising 2x10MHz in 800MHz, 2x10MHz in 900MHz, 2x30MHz in 1800MHz and 1x15MHz in 2.6GHz, came into force on 5 April 2014.
GreeceOffers for tender for the National Rural Broadband Network construction opened in February 2014. The fixed incumbent (OTE) and the consortium of Intrakat, Intracom Holdings and Hellas Online (Vodafone Greece has an 18.5% interest in Hellas Online) are the only two parties in the tender process.
In March 2014, the Hellenic Telecommunications & Post Commission (‘EETT’) announced that spectrum in the 800MHz and 2.6 GHz bands is expected to be auctioned after July 2014.
Czech RepublicThe Czech Telecommunications Office (‘CTU’), the national regulator, has not resolved the issues with their draft analysis on access and call origination published in 2012.
Vodafone Czech Republic acquired 2x10MHz of 800MHz spectrum, 2x4MHz of 1800MHz spectrum and 2x20MHz of 2.6GHz spectrum for CZK 3.1 billion in a spectrum auction in November 2013. The Czech Telecommunication Office plans to sell the remaining spectrum in the 1800MHz and 2.6GHz bands later in 2014. The 800MHz and 1800MHz frequencies reserved for a new entrant remain unsold. Using our technology neutral licence, we launched a 4G network on 2x3MHz in the 900MHz band, in November 2013.
HungaryFurther to the Commission withdrawing its initiative to prepare an infringement procedure against the Hungarian government’s telecommunications tax, in August 2013 the telecommunications tax was raised from HUF 2 to HUF 3 per voice minute and SMS and the cap on business subscriptions has been doubled from HUF 2,500 to HUF 5,000 per month. In the year ended 31 March 2014, Vodafone Hungary’s telecommunications tax liability is HUF 10 billion.
Vodafone Hungary’s original 900MHz and 1800MHz licences which were due to expire in July 2014, have been extended to 2022 following negotiations with the National Media and Infocommunications Authority Hungary (‘NMIAH’) in September 2013. The NMIAH is preparing to offer the 4G bands (800MHz and 2.6GHz) together with some remaining frequencies in the 900MHz and 1800MHz bands.
AlbaniaIn January 2014, the Albanian Competition Authority (‘ACA’) issued recommendations to the Electronic and Postal Communications Authority (‘AKEP’) for measures to reduce the differentiation between on-net and off-net calls. The AKEP has imposed new account separation rules, which apply to the mobile operators and fixed incumbent from 2014.
AKEP is also reviewing MTR rates, targeting pure long run incremental cost (‘LRIC’) benchmarking levels with glide-path reducing current MTRs to 1.0 eurocents per minute in 2015. Vodafone Albania is opposing the proposal to apply asymmetric rates for the two smaller players.
In February 2014, following an investigation into the potential abuse of dominance by Vodafone Albania in the telephony market, the ACA found that Vodafone was dominant in the retail market for the period from January 2011 to December 2012. No abuse of this status has been found and no charges were imposed.
MaltaIn March 2014, the MCA set the MTR at 0.40 eurocents per minute to which Vodafone has submitted an appeal to the Administrative Review Tribunal on the basis that there was a lack of transparency in the consultation process.
Africa, Middle East and Asia Pacific regionIndiaIn January 2013, Vodafone India’s application for a ten year extension to their existing 900MHz licences in Delhi, Mumbai and Kolkata was unsuccessful and the Department of Telecommunications (‘DoT’) included that spectrum in their 2013 auction plan. Vodafone India challenged this decision in the courts and in February 2014, the Supreme Court found in favour of the DoT. The 900MHz spectrum along with the 1800MHz spectrum was auctioned in February 2014 and Vodafone India acquired an aggregate of 2x23MHz of spectrum in the 900MHz band and 2x49MHz of spectrum in the 1800MHz band at a cost of INR 19.6 billion, which will be paid as an initial up-front payment followed by 10 annual instalments (following a two year moratorium).
Vodafone Group Plc Annual Report 2014192
Regulation (continued)
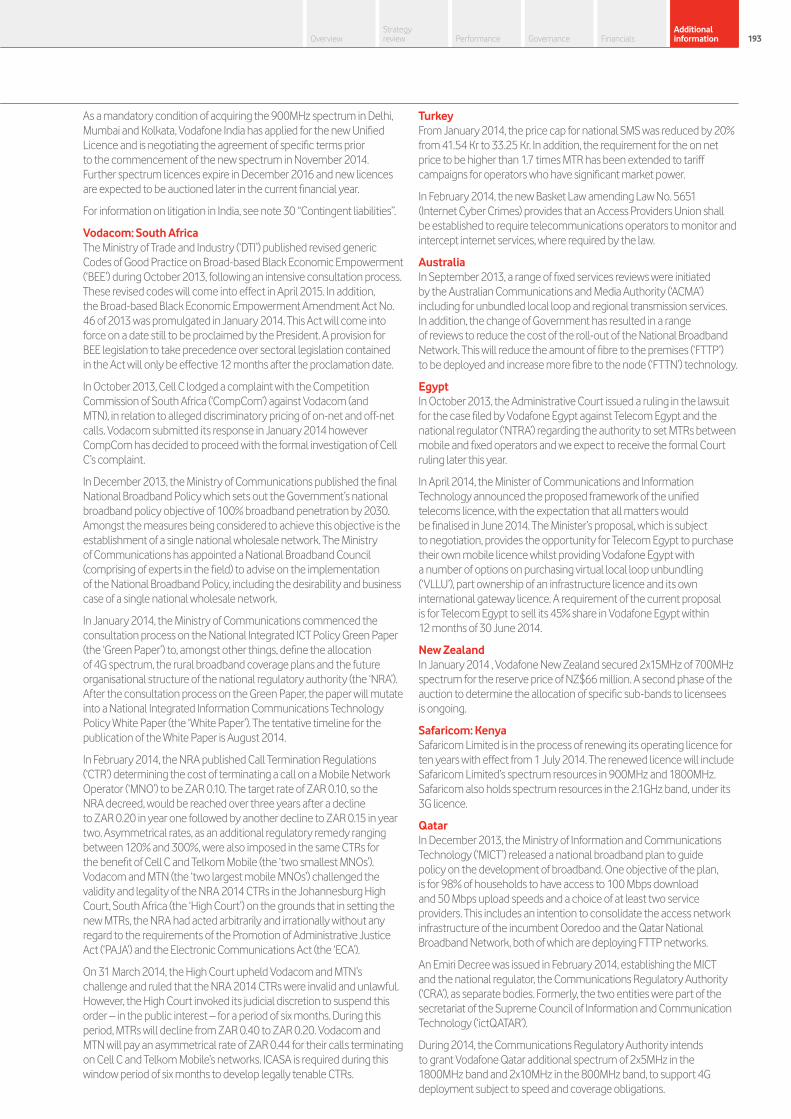
As a mandatory condition of acquiring the 900MHz spectrum in Delhi, Mumbai and Kolkata, Vodafone India has applied for the new Unified Licence and is negotiating the agreement of specific terms prior to the commencement of the new spectrum in November 2014. Further spectrum licences expire in December 2016 and new licences are expected to be auctioned later in the current financial year.
For information on litigation in India, see note 30 “Contingent liabilities”.
Vodacom: South AfricaThe Ministry of Trade and Industry (‘DTI’) published revised generic Codes of Good Practice on Broad-based Black Economic Empowerment (‘BEE’) during October 2013, following an intensive consultation process. These revised codes will come into effect in April 2015. In addition, the Broad-based Black Economic Empowerment Amendment Act No. 46 of 2013 was promulgated in January 2014. This Act will come into force on a date still to be proclaimed by the President. A provision for BEE legislation to take precedence over sectoral legislation contained in the Act will only be effective 12 months after the proclamation date.
In October 2013, Cell C lodged a complaint with the Competition Commission of South Africa (‘CompCom’) against Vodacom (and MTN), in relation to alleged discriminatory pricing of on-net and off-net calls. Vodacom submitted its response in January 2014 however CompCom has decided to proceed with the formal investigation of Cell C’s complaint.
In December 2013, the Ministry of Communications published the final National Broadband Policy which sets out the Government’s national broadband policy objective of 100% broadband penetration by 2030. Amongst the measures being considered to achieve this objective is the establishment of a single national wholesale network. The Ministry of Communications has appointed a National Broadband Council (comprising of experts in the field) to advise on the implementation of the National Broadband Policy, including the desirability and business case of a single national wholesale network.
In January 2014, the Ministry of Communications commenced the consultation process on the National Integrated ICT Policy Green Paper (the ‘Green Paper’) to, amongst other things, define the allocation of 4G spectrum, the rural broadband coverage plans and the future organisational structure of the national regulatory authority (the ‘NRA’). After the consultation process on the Green Paper, the paper will mutate into a National Integrated Information Communications Technology Policy White Paper (the ‘White Paper’). The tentative timeline for the publication of the White Paper is August 2014.
In February 2014, the NRA published Call Termination Regulations (‘CTR’) determining the cost of terminating a call on a Mobile Network Operator (‘MNO’) to be ZAR 0.10. The target rate of ZAR 0.10, so the NRA decreed, would be reached over three years after a decline to ZAR 0.20 in year one followed by another decline to ZAR 0.15 in year two. Asymmetrical rates, as an additional regulatory remedy ranging between 120% and 300%, were also imposed in the same CTRs for the benefit of Cell C and Telkom Mobile (the ‘two smallest MNOs’). Vodacom and MTN (the ‘two largest mobile MNOs’) challenged the validity and legality of the NRA 2014 CTRs in the Johannesburg High Court, South Africa (the ‘High Court’) on the grounds that in setting the new MTRs, the NRA had acted arbitrarily and irrationally without any regard to the requirements of the Promotion of Administrative Justice Act (‘PAJA’) and the Electronic Communications Act (the ‘ECA’).
On 31 March 2014, the High Court upheld Vodacom and MTN’s challenge and ruled that the NRA 2014 CTRs were invalid and unlawful. However, the High Court invoked its judicial discretion to suspend this order – in the public interest – for a period of six months. During this period, MTRs will decline from ZAR 0.40 to ZAR 0.20. Vodacom and MTN will pay an asymmetrical rate of ZAR 0.44 for their calls terminating on Cell C and Telkom Mobile’s networks. ICASA is required during this window period of six months to develop legally tenable CTRs.
TurkeyFrom January 2014, the price cap for national SMS was reduced by 20% from 41.54 Kr to 33.25 Kr. In addition, the requirement for the on net price to be higher than 1.7 times MTR has been extended to tariff campaigns for operators who have significant market power.
In February 2014, the new Basket Law amending Law No. 5651 (Internet Cyber Crimes) provides that an Access Providers Union shall be established to require telecommunications operators to monitor and intercept internet services, where required by the law.
AustraliaIn September 2013, a range of fixed services reviews were initiated by the Australian Communications and Media Authority (‘ACMA’) including for unbundled local loop and regional transmission services. In addition, the change of Government has resulted in a range of reviews to reduce the cost of the roll-out of the National Broadband Network. This will reduce the amount of fibre to the premises (‘FTTP’) to be deployed and increase more fibre to the node (‘FTTN’) technology.
EgyptIn October 2013, the Administrative Court issued a ruling in the lawsuit for the case filed by Vodafone Egypt against Telecom Egypt and the national regulator (‘NTRA’) regarding the authority to set MTRs between mobile and fixed operators and we expect to receive the formal Court ruling later this year.
In April 2014, the Minister of Communications and Information Technology announced the proposed framework of the unified telecoms licence, with the expectation that all matters would be finalised in June 2014. The Minister’s proposal, which is subject to negotiation, provides the opportunity for Telecom Egypt to purchase their own mobile licence whilst providing Vodafone Egypt with a number of options on purchasing virtual local loop unbundling (‘VLLU’), part ownership of an infrastructure licence and its own international gateway licence. A requirement of the current proposal is for Telecom Egypt to sell its 45% share in Vodafone Egypt within 12 months of 30 June 2014.
New ZealandIn January 2014 , Vodafone New Zealand secured 2x15MHz of 700MHz spectrum for the reserve price of NZ$66 million. A second phase of the auction to determine the allocation of specific sub-bands to licensees is ongoing.
Safaricom: KenyaSafaricom Limited is in the process of renewing its operating licence for ten years with effect from 1 July 2014. The renewed licence will include Safaricom Limited’s spectrum resources in 900MHz and 1800MHz. Safaricom also holds spectrum resources in the 2.1GHz band, under its 3G licence.
QatarIn December 2013, the Ministry of Information and Communications Technology (‘MICT’) released a national broadband plan to guide policy on the development of broadband. One objective of the plan, is for 98% of households to have access to 100 Mbps download and 50 Mbps upload speeds and a choice of at least two service providers. This includes an intention to consolidate the access network infrastructure of the incumbent Ooredoo and the Qatar National Broadband Network, both of which are deploying FTTP networks.
An Emiri Decree was issued in February 2014, establishing the MICT and the national regulator, the Communications Regulatory Authority (‘CRA’), as separate bodies. Formerly, the two entities were part of the secretariat of the Supreme Council of Information and Communication Technology (‘ictQATAR’).
During 2014, the Communications Regulatory Authority intends to grant Vodafone Qatar additional spectrum of 2x5MHz in the 1800MHz band and 2x10MHz in the 800MHz band, to support 4G deployment subject to speed and coverage obligations.
Vodafone Group Plc Annual Report 2014192 193Overview
Strategy review Performance Governance Financials
Additional information

Overview of spectrum licences 800MHz 900MHz 1800MHz 2.1GHz 2.6GHz
Country by region Quantity1 Expiry date Quantity1 Expiry date Quantity1 Expiry date Quantity1 Expiry date Quantity1 Expiry date
Europe regionGermany 2x10 2025 2x12.4 2016 2x5.4 2016 2x10+ 5 20202 2x20 + 25 2025
2x5 2025Italy 2x10 2029 2x10 2015 2x15 20153 2x15 + 5 2021 2x15 2029
2x5 2029UK 2x10 2033 2x17.4 See note4 2x5.8 See note4 2x15 See note4 2x20 + 25 2033Spain 2x10 2030 2x11 2028 2x20 2030 2x15 + 5 2030 2x20 + 20 2030Netherlands 2x10 2029 2x10 2030 2x20 2030 2x20 + 5 2030 2x10 2030Ireland 2x10 2030 2x10 2030 2x25 2015 2X15 + 5 2022 n/a
2x15 20305
Portugal 2x10 2027 2x10 20216 2x6 20216 2x20 2016 2x20 + 25 20272x3 2015 2x14 2027
Romania 2x10 2029 2x10 2029 2x30 2029 2x15 + 5 2020 1x15 2029Greece n/a 2x15 2027 2x10 20267 2x20 + 5 2021 n/a
2x15 2016Czech Republic 2x10 2029 2x10 2021 2x18 2021 2x20 2025 2x20 2029
2x4 20298
Hungary n/a 2x10 20229 2x15 20229 2x15 + 5 2019 n/aAlbania n/a 8.2 2016 2x9 2016 2x15 + 5 2025 n/aMalta n/a 2x15 2026 2x25 2026 2x20 + 5 2020 n/aAfrica, Middle East and Asia PacificIndia10 n/a 2014–2024 2014–2027 2030 n/aVodacom: South Africa n/a 2x11 See note11 2x24 See note11 2x15 + 5 See note11 n/aTurkey n/a 2x11 2023 n/a 2x15 + 5 2029 n/aAustralia12 2x10
(850MHz band)
2028 2x8 2028 2x30 annual 2x25 + 5 2016 n/a
Egypt n/a 2x12.5 2020 2x10 2020 2x15 2020 n/aNew Zealand 2x15
(700MHz band)
TBD 2x15.2 2031 2x25 2021 2x25 + 10 2021 2x15 + 5 2028
Safaricom: Kenya n/a 2x10 2024 2x10 2024 2x10 2022 n/aGhana n/a 2x8 2019 2x10 2019 2x15 202313 n/aQatar n/a 2x11 2028 2x20 2028 2x15 2028 n/a
Notes:1 Single (or unpaired) blocks of spectrum are used for asymmetric data (non-voice) use.2 Germany – 2x5MHz (out of 2x15MHz) of 2.1GHz spectrum will expire in December 2025.3 Italy – 2x5MHz (out of 2x20MHz) of 1800MHz spectrum will expire in 2029.4 UK – 900MHz, 1800MHz and 2.1GHz – indefinite licence with a five year notice of revocation.5 Ireland – The licence for 2x25MHz spectrum commences in 2015.6 Portugal – 2x3MHz (out of 2x13MHz) of 900MHz must be released by December 2015 and 2x14MHz (out of 2x20MHz) of 1800MHz spectrum does not expire until March 2027. 7 Greece – 2x15MHz (out of 2x25MHz) of the 1800MHz spectrum will expire in August 2016.8 Czech Republic – The licence for 2x4MHz commences in 2014.9 Hungary – 900MHz and 1800MHz – options to extend these licences.10 India comprises 22 separate service area licences with a variety of expiry dates.11 Vodacom’s South African spectrum licences are renewed annually. As part of the migration to a new licensing regime the national regulator has issued Vodacom a service licence and a network licence which will permit
Vodacom to offer mobile and fixed services. The service and network licences have a 20 year duration and will expire in 2028. Vodacom also holds licences to provide 2G and/or 3G services in the Democratic Republic of Congo, Lesotho, Mozambique and Tanzania.
12 Australia – VHA has 2x5MHz in 850MHz rural; 2x25MHz in 1800MHz and 2x20MHz in 2.1GHz in Brisbane/Adelaide/Perth; 2x5MHz in 1800MHz and 2.1GHz in Canberra/Darwin/Hobart; 2x5MHz in 2.1GHz in rural.13 Ghana – The national regulator has issued provisional licences with the intention of converting these to full licences once the national regulator board has been reconvened.
Vodafone Group Plc Annual Report 2014194
Regulation (continued)

Mobile Termination Rates (‘MTRs’)National regulators are required to take utmost account of the Commission’s existing recommendation on the regulation of fixed and mobile termination rates. This recommendation requires MTRs to be set using a long run incremental cost methodology. At March 2014, the MTRs effective for our subsidiaries within the EU, were as follows:
Country by region 20121 20131 20141 1 April 20142
EuropeGermany (€ cents) 3.33 1.84 1.79 Italy (€ cents) 5.30 1.50 0.98UK (GB £ pence) 3.02 1.50 0.85Spain (€ cents) 3.16 2.89 1.09Netherlands (€ cents) 2.70 2.40 1.86Ireland (€ cents) 4.04 2.60 2.60Portugal (€ cents) 2.77 1.27 1.27Romania (€ cents) 4.05 3.07 0.96Greece (€ cents) 4.95 1.27 1.19Czech Republic (CZK) 1.08 0.41 0.27Hungary (HUF) 9.46 7.06 7.06Albania (ALL) 7.57 6.10 4.57 2.66Malta (€ cents) 4.18 2.07 2.07 0.40Africa, Middle East and Asia PacificIndia (rupees) 0.20 0.20 0.20Vodacom: South Africa (ZAR) 0.64 0.49 0.40 0.203
Turkey (lira) 0.032 0.0258 0.0258Australia (AUD cents) 6.00 4.80 3.60Egypt (PTS/piastres) 10.00 10.00 10.00New Zealand (NZD cents) 5.88 3.97 3.72 3.56Safaricom: Kenya (shilling) 1.44 1.44 1.15Ghana (peswas) 5.00 4.50 4.00Qatar (dirhams) 16.60 16.60 16.60
Notes: 1 All MTRs are based on end of financial year values.2 MTRs established from 1 April 2014 are included where a glide path or a final decision has been determined by the regulatory authority. 3 Please see Vodacom on page 193.
Vodafone Group Plc Annual Report 2014194 195Overview
Strategy review Performance Governance Financials
Additional information
Identification and assessment of the Group’s key risksThe Board acknowledges it is responsible for determining the nature and extent of the significant risks it is willing to take in achieving its strategic objectives. A Group wide risk assessment exercise is formally conducted annually to help fulfil this responsibility.
Local market risk assessmentRisk coordinators in each local market facilitate the identification of the “top 10” risks and associated mitigating actions for their entity. With the oversight and approval of local executive teams and Audit Committees, these risks are assessed for their likelihood and impact after consideration is given to existing mitigating controls.
An overall market view of the major risks is obtained by identifying similar risks that are then aggregated and categorised into the following risk categories:
a strategy;
a reputational damage;
a legal and regulatory compliance;
a financial;
a operational; and
a malicious events.
Assess the current risk exposure for the GroupUsing the market view of the major risks, an exercise is conducted with Group executives and functional leaders to determine the top Group risks and identify the current net risk exposure level for each risk.
Compare the current risk exposure to the acceptable level of riskThe exposure from each of the Group’s top risks is then compared with the desired level of acceptable risk. The result of this assessment highlights the perceived “tolerance” for the exposure associated with a particular risk and indicates whether specific, additional action is required.
Three “tolerance” categories are used:
1. We don’t believe that Vodafone should do more;
2. We believe that Vodafone should do more and has plans in place to reduce the net risk to an acceptable level; and
3. We are not sufficiently prepared and immediate action is necessary.
Confirmation of key risks and mitigations commensurate with Vodafone’s risk tolerancesThe risk exposure assessment and comparison to the acceptable level of risk identifies the key risks and associated mitigations that are reviewed and approved by the Group Executive Committee, the Audit and Risk Committee and the Board.
Changes from prior year risk assessmentOne new risk for 2014 has been added:
a “The integration of newly acquired businesses does not provide the benefits anticipated at the time of acquisition”. The risk is that we do not deliver the revenue benefits and/or the cost synergies expected from recently acquired businesses and that, as a consequence of this, we subsequently need to write down the carrying value of the assets.
Revised existing risksTwo existing risks from prior year have been revised into a single combined risk:
a “Our business could be adversely affected by a failure or significant interruption to our telecommunications networks or IT systems” and “Failure to deliver enterprise service offerings may adversely affect our business” have been combined into the former risk: “Our business could be adversely affected by a failure or significant interruption to our telecommunications networks or IT systems”.
The description of the risk has been revised to more specifically reflect the level of dependence enterprise customers have on our telecommunications infrastructure to provide their services and the resilience needed in our infrastructure to meet our committed service level agreements.
The Group’s key risks are outlined below:1. Our business could be adversely affected by a failure or significant interruption to our telecommunications networks or IT systems.Risk: We are dependent on the continued operation of our telecommunications networks. The importance of mobile and fixed communication in everyday life is increasing, especially during times of crisis. Individuals and organisations who rely on our networks and systems 24 hours per day, 365 days per year to provide their products and services, look to us to maintain service. Major failures in the network, our IT systems or a failure to maintain our infrastructure to the required levels of resilience (and associated service level agreement) may result in our services being interrupted, resulting in serious damage to our reputation, a consequential customer and revenue loss and the risk of financial penalties.
There is a risk that an attack by a malicious individual or group could be successful on our networks and impact the availability of critical systems. Our network is also susceptible to interruption due to a physical attack and theft of our network components as the value and market for network components increases (for example copper, batteries, generators and fuel).
Assessment: This risk is possible in all markets in which we operate and has the potential for significant impact. Given the geographically dispersed nature of our networks, both mobile and fixed, the impacts of a wide spread and long lasting outage should be primarily restricted to the market involved.
Mitigation: Specific back-up and resilience requirements are built into our networks. We monitor our ability to replace strategic equipment quickly in event of failure, and for high risk components, we maintain dedicated back-up equipment ready for use. Dedicated access network equipment is installed on trucks ready to be moved on site if required.
Our critical infrastructure has been enhanced to prevent unauthorised access and reduce the likelihood and impact of a successful attack. Network contingency plans are linked with our business continuity and disaster recovery plans which are in place to cover the residual risks that cannot be mitigated. A crisis management team and escalation processes are in place both nationally and internationally, and crisis simulations are conducted annually.
We also manage the risk of malicious attacks on our infrastructure using our global security operations centre that provides 24/7 monitoring of our network in many countries.
Vodafone Group Plc Annual Report 2014196
Principal risk factors and uncertainties

2. We could suffer loss of consumer confidence and/or legal action due to a failure to protect our customer information. Risk: Our networks carry and store large volumes of confidential personal and business voice traffic and data. We host increasing quantities and types of customer data in both enterprise and consumer segments. We need to ensure our service environments are sufficiently secure to protect us from loss or corruption of customer information. Failure to adequately protect customer information could have a material adverse effect on our reputation and may lead to legal action against the Group.
Assessment: This risk is possible in all markets in which we operate. The impacts of this risk have the potential to be major in mature markets, with robust data protection regulations and a higher proportion of customers paying their bills by automated bank transfer or credit card, than in some of the emerging markets who have a more cash based pre-pay customer population.
Mitigation: Both the hardware and software applications which hold or transmit confidential personal and business voice and data traffic include security features. Security related reviews are conducted according to our policies and security standards. Security governance and compliance is managed and monitored through software tools that are deployed to all local markets and selected partner markets. Our data centres are managed to international information security standards. Third party data security reviews are conducted jointly with our technology security and corporate security functions.
3. Increased competition may reduce our market share and profitability.Risk: We face intensifying competition; in particular competing with established competitors in mature markets and competing with new entrants in emerging markets, where all operators are looking to secure a share of the potential customer base. Competition could lead to a reduction in the rate at which we add new customers, a decrease in the size of our market share and a decline in our average revenue per customer, if customers choose to receive telecommunications services or other competing services from alternate providers. Competition can also lead to an increase in customer acquisitions and retention costs. The focus of competition in many of our markets has shifted from acquiring new customers to retaining existing customers, as the market for mobile telecommunications has become increasingly mature.
Assessment: This is a major risk that is relevant to all markets. The source of the risk varies depending upon the maturity of each market as mentioned above.
Mitigation: We will continue to promote our differentiated propositions by focusing on our points of strength such as network quality, capacity and coverage, quality of customer service and the value of our products and services. We are enhancing distribution channels to get closer to customers and using targeted promotions where appropriate to attract and retain specific customers. We closely monitor and model competitor behaviour, network builds and product offerings to understand future intentions so that we are able to react in a timely manner.
4. Regulatory decisions and changes in the regulatory environment could adversely affect our business.Risk: We have ventures in both emerging and mature markets, spanning a broad geographical area including Europe, Africa, Middle East, and Asia Pacific. We need to comply with an extensive range of requirements that regulate and supervise the licensing, construction and operation of our telecommunications networks and services. Pressure on political and regulatory institutions both to deliver direct consumer benefit and protect consumers’ interests, particularly in recessionary periods, can lead to adverse impacts on our business. Financial pressures on smaller competitors can drive them to call for regulators to protect them. Increased financial pressures on governments may lead them to target foreign investors for further taxes or licence fees.
Assessment: This risk is highly likely in emerging markets, where there is experience of regulation being used as a revenue gathering mechanism that has the potential for a significant impact in that market.
Mitigation: We monitor political developments in our existing and potential markets closely, identifying risks in our current and proposed commercial propositions. Regular reports are made to our Executive Committee on current political and regulatory risks. These risks are considered in our business planning process, including the importance of competitive commercial pricing and appropriate product strategies. Authoritative and timely intervention is made at both national and international level in respect of legislative, fiscal and regulatory proposals which we feel are not in the interests of the Group. We have regular dialogue with trade groups that represent network operators and other industry bodies to understand underlying political pressures.
5. Our existing service offerings could become disadvantaged as compared to those offered by converged competitors or other technology providers (“over the top” – OTT competitors).Risk: In a number of markets, we face competition from providers who have the ability to sell converged services (combinations of fixed line, broadband, public Wi-Fi, TV and mobile) on their existing infrastructure which we cannot either replicate or cannot provide at a similar price point. Additionally, the combination of services may allow competitors to subsidise the mobile component of their offering. This could lead to an erosion of our customer base and reduce the demand for our core mobile services and impact our future profitability.
Advances in smartphone technology places more focus on applications, operating systems, and devices, rather than the underlying services provided by mobile operators. The development of applications which make use of the internet as a substitute for some of our more traditional services, such as messaging and voice, could erode revenue. Reduced demand for our core services of voice, messaging and data and the development of services by application developers, operating system providers, and handset suppliers (commonly referred to as “over the top” or OTT competition) could significantly impact our future profitability.
Assessment: This risk is likely in mature markets where more competitors have the assets to offer converged offers and where, in high density population areas, alternative data services are commonly available and has the potential for a major impact on service revenues.
Mitigation: In some markets we are already providing fixed line telecommunication services (voice and broadband). In other existing markets we actively look for opportunities to provide services beyond mobile through acquisition, partnerships, or joint ventures.
We have also developed strategies which strengthen our relationships with customers by accelerating the introduction of integrated voice, messaging and data price plans to avoid customers reducing their out of bundle usage through internet/Wi-Fi based substitution.
Vodafone Group Plc Annual Report 2014196 197Overview
Strategy review Performance Governance Financials
Additional information
6. Continuing weak economic conditions could impact one or more of our markets.Risk: Economic conditions in many of the markets we operate, especially in Europe, continue to stagnate or show nominal levels of growth. These conditions combined with the impact of continuing austerity measures results in lower levels of disposable income and may result in significantly lower revenues as customers give up their mobile phones or move to cheaper tariffs.
There is also a possibility of adverse economic conditions impacting currency exchange rates in countries where the Group has operations, leading to a reduction in our revenue and impairment of our financial and non-financial assets.
Assessment: This risk is evident across a number of our markets and in particular within our southern European markets where it may continue to have a significant impact.
Mitigation: We are closely monitoring international economic and currency situations. Executive Committee briefings have been provided with specific actions identified to reduce the impact of the risk. We have developed a detailed business continuity plan in the event of a country economic crisis leading to a banking system freeze and a need to transition to a “cash based” operating system for a number of months.
7. Our business may be impacted by actual or perceived health risks associated with the transmission of radio waves from mobile telephones, transmitters and associated equipment. Risk: Concerns have been expressed that electromagnetic signals emitted by mobile telephone handsets and base stations may pose health risks. Authorities including the World Health Organization (‘WHO’) agree there is no evidence that convinces experts that exposure to radio frequency fields from mobile devices and base stations operated within guideline limits has any adverse health effects. A change to this view could result in a range of impacts from a change to national legislation, to a major reduction in mobile phone usage or to major litigation.
Assessment: This is an unlikely risk; however, it would have a major impact on services consumed by our customers in all our markets – particularly in countries that have a very low tolerance for environmental and health related risks.
Mitigation: We have a global health and safety policy that includes standards for electromagnetic fields (‘EMF’) that are mandated in all our operating companies. We have a Group EMF Board that manages potential risks through cross sector initiatives and which oversees a coordinated global programme to respond to public concern, and develop appropriate advocacy related to possible precautionary legislation. We monitor scientific developments and engage with relevant bodies to support the delivery and transparent communication of the scientific research agenda set by the WHO.
8. The integration of newly acquired businesses do not provide the benefits anticipated at the time of acquisition.Risk: In line with its strategy to be a scale data player, a strong player in Enterprise, a leader in emerging markets and a selective innovator in services; we have acquired, and will continue to acquire, new businesses. The price paid for these businesses is based upon their current cash flows, as well as the expected incremental cash flows that will be generated from increased revenues and lower costs that being part of the Vodafone Group will generate. There is a risk that we fail to deliver these expected benefits and synergies which could result in an impairment of the carrying value of the acquired business.
Assessment: This risk is possible in markets where major acquisitions have occurred (e.g. Cable & Wireless Worldwide in the UK and Kabel Deutschland in Germany) and has the potential to impact forecast profitability and cash flows.
Mitigation: We have experience of acquiring and integrating businesses into the Group and for all significant transactions we develop and implement a structured integration plan, led by a senior business leader. Integration plans are systematically implemented and executed to ensure that revenue benefits and cost synergies are delivered and that the acquired businesses are successfully integrated through the alignment of policies, processes and systems. The progress against acquisition business cases and the status of integration plans is monitored and reviewed as part of the Group’s governance and performance management procedures.
9. We depend on a number of key suppliers to operate our business.Risk: We depend on a limited number of suppliers for strategically important network and IT infrastructure and associated support services to operate and upgrade our networks and provide key services to our customers. Our operations could be adversely impacted by the failure of a key supplier who could no longer support our existing infrastructure; from a key supplier commercially exploiting their monopolistic/oligopolistic position in a product area following the corporate failures of, or the withdrawal from, a specific market by competitors; or from major suppliers significantly increasing prices on long term programmes where the cost or technical feasibility of switching supplier becomes a significant barrier.
Assessment: This risk is possible in all markets in which we operate. It is a common business strategy to consolidate major purchases of equipment and services amongst a select group of international suppliers in order to negotiate better commercial terms and level of service; so this risk has the potential to significantly impact operations or profitability.
Mitigation: We regularly review the performance of key suppliers, both operationally and financially, across individual markets and from the Group perspective. Other processes are in place to regularly identify and manage “suppliers at risk”. Most supplier categories have business continuity plans in place in the event of single supplier failure.
Vodafone Group Plc Annual Report 2014198
Principal risk factors and uncertainties (continued)

10. We may not satisfactorily resolve major tax disputes.Risk: We operate in many jurisdictions around the world and from time to time have disputes on the amount of tax due. In particular, in spite of the positive India Supreme Court decision relating to an on-going tax case in India, the Indian Government has introduced retroactive tax legislation which would in effect overturn the Court’s decision and has raised challenges around the pricing of capital transactions. Such or similar types of action in other jurisdictions, including changes in local or international tax rules or new challenges by tax authorities, may expose us to significant additional tax liabilities which would affect the results of the business.
Assessment: This is a risk that could occur in any market but is currently more relevant for emerging markets where the disputed tax payable and any related penalties could be significant.
Mitigation: We maintain constructive but robust engagement with the tax authorities and relevant government representatives, as well as active engagement with a wide range of international companies and business organisations with similar issues. Where appropriate we engage advisors and legal counsel to obtain opinions on tax legislation and principles.
11. Changes in assumptions underlying the carrying value of certain Group assets could result in impairment.Risk: Due to the substantial carrying value of goodwill, revisions to the assumptions used in assessing its recoverability, including discount rates, estimated future cash flows or anticipated changes in operations, could lead to the impairment of certain Group assets. While impairment does not impact reported cash flows, it does result in a non-cash charge in the consolidated income statement and thus no assurance can be given that any future impairment would not affect our reported distributable reserves and therefore, our ability to make dividend distributions to our shareholders or repurchase our shares.
Assessment: This risk is relevant for the markets facing tough economic conditions and increasing competition; where an impairment may have a significant impact on reported earnings.
Mitigation: We review the carrying value of the Group’s property, plant and equipment, goodwill and other intangible assets at least annually, or more frequently where the circumstances require, to assess whether carrying values can be supported by the net present value of future cash flows derived from such assets. This review considers the continued appropriateness of the assumptions used in assessing for impairment, including an assessment of discount rates and long-term growth rates, future technological developments, and the timing and amount of future capital expenditure. Other factors which may affect revenue and profitability (for example intensifying competition, pricing pressures, regulatory changes and the timing for introducing new products or services) are also considered. Discount rates are in part derived from yields on government bonds, the level of which may change substantially period to period and which may be affected by political, economic and legal developments which are beyond our control. For further details see “Critical accounting judgements and key sources of estimation uncertainty” in note 1 “Basis of preparation” to the consolidated financial statements.
Currency related risksThe Group continues to face currency, operational and financial risks resulting from the challenging economic conditions particularly in the Eurozone. We continue to keep our policies and procedures under review to endeavour to minimise the Group’s economic exposure and to preserve our ability to operate in a range of potential conditions that may exist in the future.
Our ability to manage these risks needs to take appropriate account of our needs to deliver a high quality service to our customers, meet licence obligations and the significant capital investments we may have made and may need to continue to make in the markets most impacted.
While our share price is denominated in sterling, the majority of our financial results are generated in other currencies. As a result the Group’s operating profit is sensitive to either a relative strengthening or weakening of the major currencies in which we transact.
The “Operating results” section of the annual report on pages 40 to 45 sets out a discussion and analysis of the relative contributions from each of our regions and the major geographical markets within each, to the Group’s service revenue and EBITDA performance. On a management basis our markets in Greece, Ireland, Italy, Portugal and Spain continue to be the most directly impacted by the current market conditions and in order of contribution represent 12% (Italy), 6% (Spain), 3% (Ireland and Greece combined) and 2% (Portugal) of the Group’s EBITDA for the year ended 31 March 2014. An average 3% decline in the sterling equivalent of these combined geographical markets due to currency revaluation would reduce the Group’s EBITDA by approximately £0.1 billion. Our foreign currency earnings were for the year ended 31 March 2014, diversified through our 45% equity interest in Verizon Wireless (‘VZW’), which operates in the United States and generates its earnings in US dollars. Our interest in VZW, which was equity accounted to 2 September 2013, contributed 40% of the Group’s adjusted operating profit for the year ended 31 March 2014. Our interest in VZW was disposed of on 21 February 2014.
We employ a number of mechanisms to manage elements of exchange rate risk at a transaction, translation and economic level. At the transaction level our policies require foreign exchange risks on transactions denominated in other currencies above certain de minimis levels to be hedged. Further, since the Company’s sterling share price represents the value of its future multi-currency cash flows, principally in euro and to a lesser extent sterling, the Indian rupee and South African rand following the disposal of our interest in VZW, we aim to align the currency of our debt and interest charges in proportion to our expected future principal multi-currency cash flows, thereby providing an economic hedge in terms of reduced volatility in the sterling equivalent value of the Group and a partial hedge against income statement translation exposure, as interest costs will be denominated in foreign currencies.
In the event of a country’s exit from the Eurozone, this may necessitate changes in one or more of our entities’ functional currency and potentially higher volatility of those entities’ trading results when translated into sterling, potentially adding further currency risk.
A summary of this sensitivity of our operating results and our foreign exchange risk management policies is set out within note 23 “Capital and financial risk management” to the consolidated financial statements.
Vodafone Group Plc Annual Report 2014198 199Overview
Strategy review Performance Governance Financials
Additional information

Risk of change in carrying amount of assets and liabilitiesThe main potential short-term financial statement impact of the current economic uncertainties is the potential impairment of non-financial and financial assets.
We have significant amounts of goodwill, other intangible assets and plant, property and equipment allocated to, or held by, companies operating in the Eurozone.
We have performed impairment testing for each country in Europe as at 31 March 2014 and identified aggregate impairment charges of £6.6 billion in relation to Vodafone Germany, Spain, Portugal, Czech Republic and Romania. See note 4 “Impairment losses” to the consolidated financial statements for further detail on this exercise, together with the sensitivity of the results to reasonably possible adverse assumptions.
Our operating companies in Italy, Ireland, Greece, Portugal and Spain have billed and unbilled trade receivables totalling £2.1 billion. IFRS contains specific requirements for impairment assessments of financial assets. We have a range of credit exposures and provisions for doubtful debts that are generally made by reference to consistently applied methodologies overlaid with judgements determined on a case-by-case basis reflecting the specific facts and circumstances of the receivable. See note 23 “Capital and financial risk management” to the consolidated financial statements for detailed disclosures on provisions against loans and receivables as well as disclosures about any loans and receivables that are past due at the end of the period, concentrations of risk and credit risk more generally.
Additional riskThe significant areas of additional risk for the Group are investment risk, particularly in relation to the management of the counterparties holding our cash and liquid investments; trading risks primarily in relation to procurement and related contractual matters; and business continuity risks focused on cash management in the event of disruption to banking systems.
Financial/investment risk: We remain focused on counterparty risk management and in particular the protection and availability of cash deposits and investments. We carefully manage counterparty limits with financial institutions holding the Group’s liquid investments and maintain a significant proportion of liquid investments in sterling and US dollar denominated holdings. Our policies require cash sweep arrangements, to ensure no operating company has more than €5 million on deposit on any one day. Further, we have had collateral support agreements in place for a number of years, with a significant number of counterparties, to pass collateral to the Group under certain circumstances. We have a net £1,055 million of collateral assets in our statement of financial position at 31 March 2014. For further details see note 13 “Other investments” and note 23 “Capital and financial risk management” to the consolidated financial statements.
Trading risks: We continue to monitor and assess the structure of certain procurement contracts to place the Group in a better position in the event of the exit of a country from the Eurozone.
Business continuity risks: Key business continuity priorities are focused on planning to facilitate migration to a more cash-based business model in the event banking systems are frozen, developing dual currency capability in contract customer billing systems or ensuring the ability to move these contract customers to prepaid methods of billing, and the consequential impacts to tariff structures. We also have in place contingency plans with key suppliers that would assist us to continue to support our network infrastructure, retail operations and employees.
We continue to maintain appropriate levels of cash and short-term investments in many currencies, with a carefully controlled group of counterparties, to minimise the risks to the ongoing access to that liquidity and therefore our ability to settle debts as they become due. For further details see “Capital and financial risk management” in note 23 to the consolidated financial statements.
Going concernThe Group believes it adequately manages or mitigates its solvency and liquidity risks through two primary processes, described below.
Business planning process and performance managementThe Group’s forecasting and planning cycle consists of three in year forecasts, a budget and a long range plan. These cycles all consist of a bottom up process whereby the Group’s operating companies submit income statement, cash flow and net debt projections. These are then consolidated and the results assessed by Group management and the Board.
Each forecast is compared with prior forecasts and actual results so as to identify variances and understand the drivers of the changes and their future impact so as to allow management to take action where appropriate. Additional analysis is undertaken to review and sense check the key assumptions underpinning the forecasts as well as stress-testing the results through sensitivity analysis.
Cash flow and liquidity reviewsThe business planning process provides outputs for detailed cash flow and liquidity reviews, to ensure that the Group maintains adequate liquidity throughout the forecast periods. The prime output is a two year liquidity forecast which is prepared and updated on a daily basis which highlights the extent of the Group’s liquidity based on controlled cash flows and the headroom under the Group’s undrawn revolving credit facility (‘RCF’).
The key inputs into this forecast are:
a free cash flow forecasts, with the first three months inputs being sourced directly from the operating companies (analysed on a daily basis), with information beyond this taken from the latest forecast/budget cycle;
a bond and other debt maturities; and
a expectations for shareholder returns, spectrum auctions and M&A activity.
The liquidity forecast shows two scenarios assuming either maturing commercial paper is refinanced or no new commercial paper issuance. The liquidity forecast is reviewed by the Group CFO and included in each of his reports to the Board.
In addition, the Group continues to manage its foreign exchange and interest rate risks within the framework of policies and guidelines authorised and reviewed by the Board, with oversight provided by the Treasury Risk Committee.
Vodafone Group Plc Annual Report 2014200
Principal risk factors and uncertainties (continued)
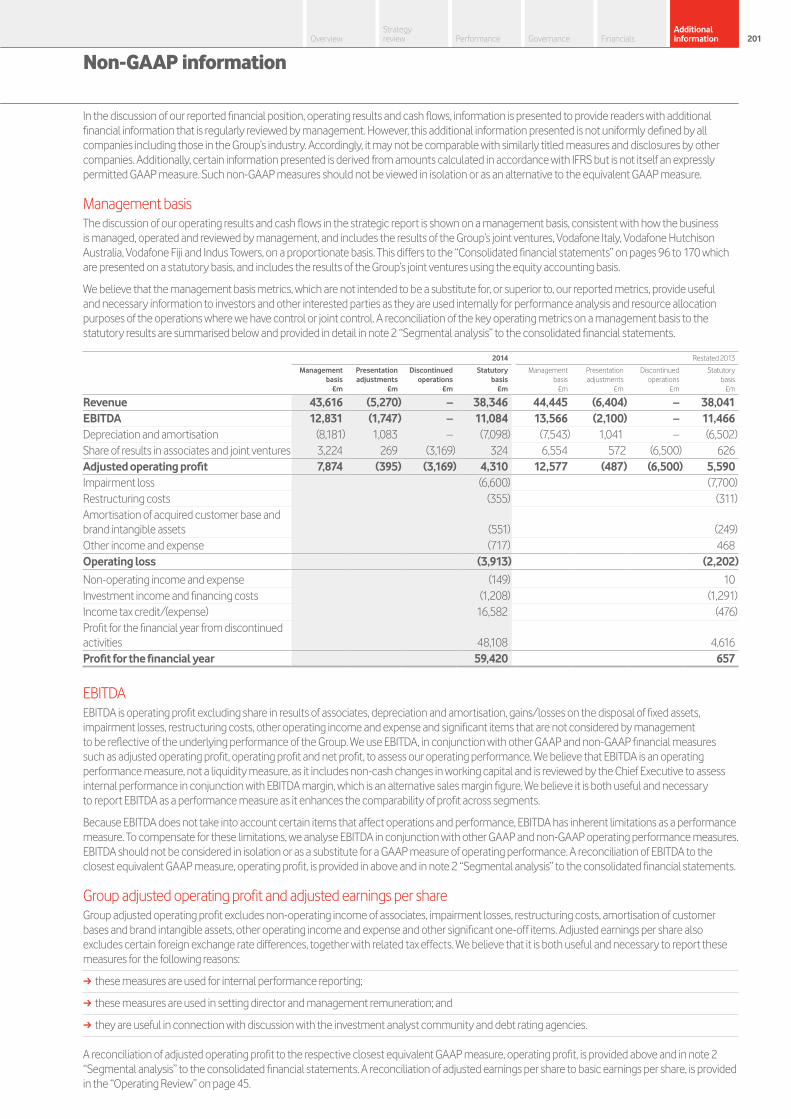
In the discussion of our reported financial position, operating results and cash flows, information is presented to provide readers with additional financial information that is regularly reviewed by management. However, this additional information presented is not uniformly defined by all companies including those in the Group’s industry. Accordingly, it may not be comparable with similarly titled measures and disclosures by other companies. Additionally, certain information presented is derived from amounts calculated in accordance with IFRS but is not itself an expressly permitted GAAP measure. Such non-GAAP measures should not be viewed in isolation or as an alternative to the equivalent GAAP measure.
Management basisThe discussion of our operating results and cash flows in the strategic report is shown on a management basis, consistent with how the business is managed, operated and reviewed by management, and includes the results of the Group’s joint ventures, Vodafone Italy, Vodafone Hutchison Australia, Vodafone Fiji and Indus Towers, on a proportionate basis. This differs to the “Consolidated financial statements” on pages 96 to 170 which are presented on a statutory basis, and includes the results of the Group’s joint ventures using the equity accounting basis.
We believe that the management basis metrics, which are not intended to be a substitute for, or superior to, our reported metrics, provide useful and necessary information to investors and other interested parties as they are used internally for performance analysis and resource allocation purposes of the operations where we have control or joint control. A reconciliation of the key operating metrics on a management basis to the statutory results are summarised below and provided in detail in note 2 “Segmental analysis” to the consolidated financial statements.
2014 Restated 2013
Management
basisPresentation adjustments
Discontinued operations
Statutory basis
Management basis
Presentation adjustments
Discontinued operations
Statutory basis
£m £m £m £m £m £m £m £m
Revenue 43,616 (5,270) – 38,346 44,445 (6,404) – 38,041EBITDA 12,831 (1,747) – 11,084 13,566 (2,100) – 11,466Depreciation and amortisation (8,181) 1,083 – (7,098) (7,543) 1,041 – (6,502)Share of results in associates and joint ventures 3,224 269 (3,169) 324 6,554 572 (6,500) 626Adjusted operating profit 7,874 (395) (3,169) 4,310 12,577 (487) (6,500) 5,590Impairment loss (6,600) (7,700)Restructuring costs (355) (311)Amortisation of acquired customer base and brand intangible assets (551) (249)Other income and expense (717) 468Operating loss (3,913) (2,202)
Non-operating income and expense (149) 10Investment income and financing costs (1,208) (1,291)Income tax credit/(expense) 16,582 (476)Profit for the financial year from discontinued activities 48,108 4,616Profit for the financial year 59,420 657
EBITDAEBITDA is operating profit excluding share in results of associates, depreciation and amortisation, gains/losses on the disposal of fixed assets, impairment losses, restructuring costs, other operating income and expense and significant items that are not considered by management to be reflective of the underlying performance of the Group. We use EBITDA, in conjunction with other GAAP and non-GAAP financial measures such as adjusted operating profit, operating profit and net profit, to assess our operating performance. We believe that EBITDA is an operating performance measure, not a liquidity measure, as it includes non-cash changes in working capital and is reviewed by the Chief Executive to assess internal performance in conjunction with EBITDA margin, which is an alternative sales margin figure. We believe it is both useful and necessary to report EBITDA as a performance measure as it enhances the comparability of profit across segments.
Because EBITDA does not take into account certain items that affect operations and performance, EBITDA has inherent limitations as a performance measure. To compensate for these limitations, we analyse EBITDA in conjunction with other GAAP and non-GAAP operating performance measures. EBITDA should not be considered in isolation or as a substitute for a GAAP measure of operating performance. A reconciliation of EBITDA to the closest equivalent GAAP measure, operating profit, is provided in above and in note 2 “Segmental analysis” to the consolidated financial statements.
Group adjusted operating profit and adjusted earnings per shareGroup adjusted operating profit excludes non-operating income of associates, impairment losses, restructuring costs, amortisation of customer bases and brand intangible assets, other operating income and expense and other significant one-off items. Adjusted earnings per share also excludes certain foreign exchange rate differences, together with related tax effects. We believe that it is both useful and necessary to report these measures for the following reasons:
a these measures are used for internal performance reporting;
a these measures are used in setting director and management remuneration; and
a they are useful in connection with discussion with the investment analyst community and debt rating agencies.
A reconciliation of adjusted operating profit to the respective closest equivalent GAAP measure, operating profit, is provided above and in note 2 “Segmental analysis” to the consolidated financial statements. A reconciliation of adjusted earnings per share to basic earnings per share, is provided in the “Operating Review” on page 45.
Vodafone Group Plc Annual Report 2014200 201Overview
Strategy review Performance Governance Financials
Additional information
Non-GAAP information
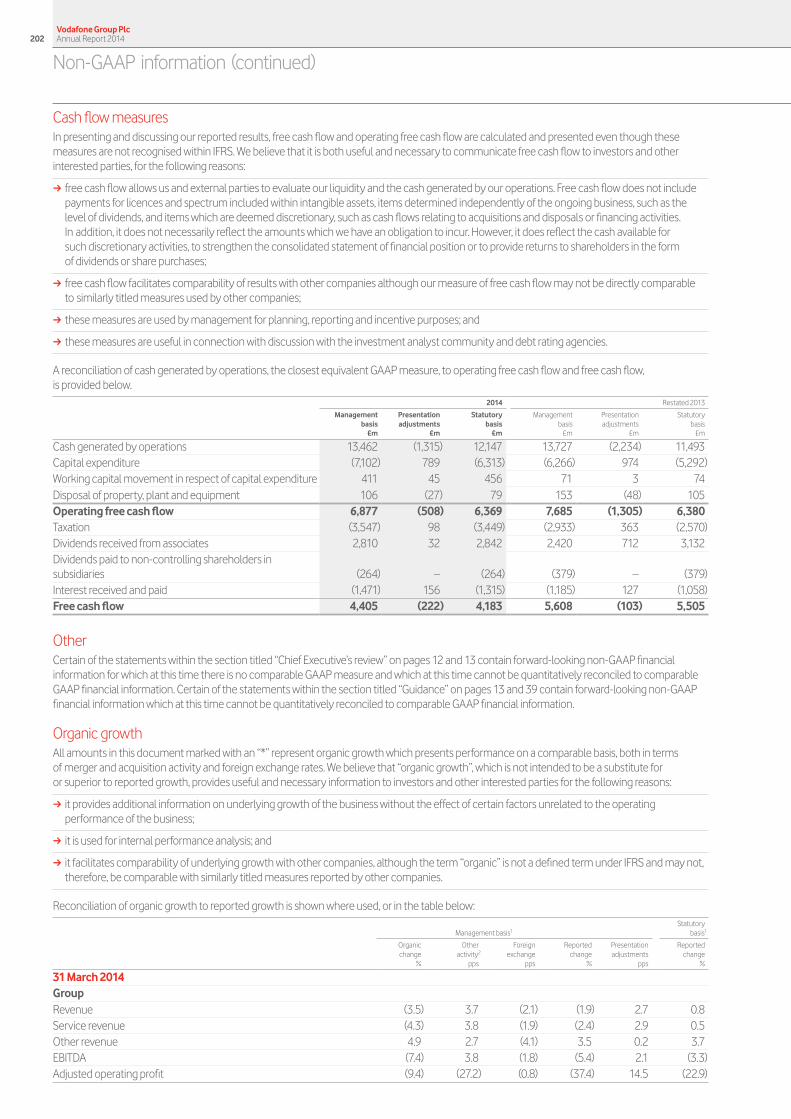
Cash flow measuresIn presenting and discussing our reported results, free cash flow and operating free cash flow are calculated and presented even though these measures are not recognised within IFRS. We believe that it is both useful and necessary to communicate free cash flow to investors and other interested parties, for the following reasons:
a free cash flow allows us and external parties to evaluate our liquidity and the cash generated by our operations. Free cash flow does not include payments for licences and spectrum included within intangible assets, items determined independently of the ongoing business, such as the level of dividends, and items which are deemed discretionary, such as cash flows relating to acquisitions and disposals or financing activities. In addition, it does not necessarily reflect the amounts which we have an obligation to incur. However, it does reflect the cash available for such discretionary activities, to strengthen the consolidated statement of financial position or to provide returns to shareholders in the form of dividends or share purchases;
a free cash flow facilitates comparability of results with other companies although our measure of free cash flow may not be directly comparable to similarly titled measures used by other companies;
a these measures are used by management for planning, reporting and incentive purposes; and
a these measures are useful in connection with discussion with the investment analyst community and debt rating agencies.
A reconciliation of cash generated by operations, the closest equivalent GAAP measure, to operating free cash flow and free cash flow, is provided below.
2014 Restated 2013
Management
basisPresentation adjustments
Statutory basis
Management basis
Presentation adjustments
Statutory basis
£m £m £m £m £m £m
Cash generated by operations 13,462 (1,315) 12,147 13,727 (2,234) 11,493Capital expenditure (7,102) 789 (6,313) (6,266) 974 (5,292)Working capital movement in respect of capital expenditure 411 45 456 71 3 74Disposal of property, plant and equipment 106 (27) 79 153 (48) 105Operating free cash flow 6,877 (508) 6,369 7,685 (1,305) 6,380Taxation (3,547) 98 (3,449) (2,933) 363 (2,570)Dividends received from associates 2,810 32 2,842 2,420 712 3,132Dividends paid to non-controlling shareholders in subsidiaries (264) – (264) (379) – (379)Interest received and paid (1,471) 156 (1,315) (1,185) 127 (1,058)Free cash flow 4,405 (222) 4,183 5,608 (103) 5,505
OtherCertain of the statements within the section titled “Chief Executive’s review” on pages 12 and 13 contain forward-looking non-GAAP financial information for which at this time there is no comparable GAAP measure and which at this time cannot be quantitatively reconciled to comparable GAAP financial information. Certain of the statements within the section titled “Guidance” on pages 13 and 39 contain forward-looking non-GAAP financial information which at this time cannot be quantitatively reconciled to comparable GAAP financial information.
Organic growthAll amounts in this document marked with an “*” represent organic growth which presents performance on a comparable basis, both in terms of merger and acquisition activity and foreign exchange rates. We believe that “organic growth”, which is not intended to be a substitute for or superior to reported growth, provides useful and necessary information to investors and other interested parties for the following reasons:
a it provides additional information on underlying growth of the business without the effect of certain factors unrelated to the operating performance of the business;
a it is used for internal performance analysis; and
a it facilitates comparability of underlying growth with other companies, although the term “organic” is not a defined term under IFRS and may not, therefore, be comparable with similarly titled measures reported by other companies.
Reconciliation of organic growth to reported growth is shown where used, or in the table below:
Management basis1Statutory
basis1
Organic change
%
Otheractivity2
pps
Foreign exchange
pps
Reportedchange
%
Presentationadjustments
pps
Reportedchange
%
31 March 2014GroupRevenue (3.5) 3.7 (2.1) (1.9) 2.7 0.8 Service revenue (4.3) 3.8 (1.9) (2.4) 2.9 0.5 Other revenue 4.9 2.7 (4.1) 3.5 0.2 3.7 EBITDA (7.4) 3.8 (1.8) (5.4) 2.1 (3.3)Adjusted operating profit (9.4) (27.2) (0.8) (37.4) 14.5 (22.9)
Vodafone Group Plc Annual Report 2014202
Non-GAAP information (continued)
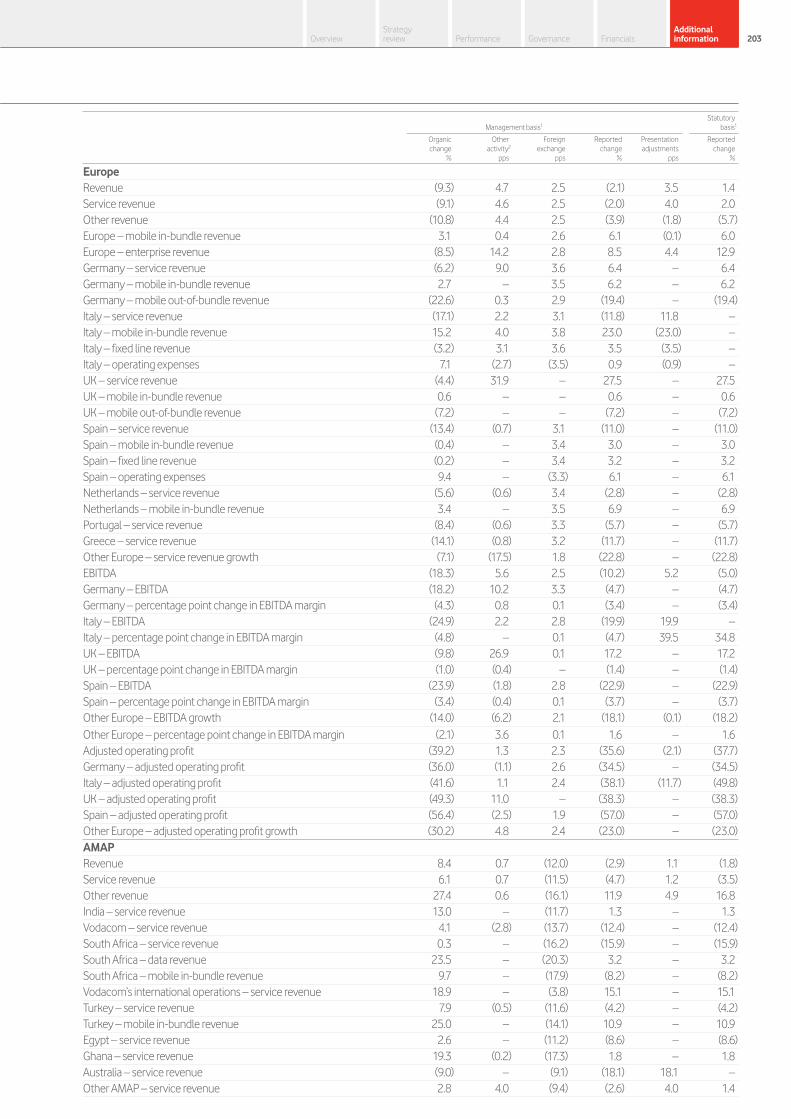
Management basis1Statutory
basis1
Organic change
%
Otheractivity2
pps
Foreign exchange
pps
Reportedchange
%
Presentationadjustments
pps
Reportedchange
%
EuropeRevenue (9.3) 4.7 2.5 (2.1) 3.5 1.4 Service revenue (9.1) 4.6 2.5 (2.0) 4.0 2.0 Other revenue (10.8) 4.4 2.5 (3.9) (1.8) (5.7)Europe – mobile in-bundle revenue 3.1 0.4 2.6 6.1 (0.1) 6.0Europe – enterprise revenue (8.5) 14.2 2.8 8.5 4.4 12.9Germany – service revenue (6.2) 9.0 3.6 6.4 – 6.4 Germany – mobile in-bundle revenue 2.7 – 3.5 6.2 – 6.2 Germany – mobile out-of-bundle revenue (22.6) 0.3 2.9 (19.4) – (19.4)Italy – service revenue (17.1) 2.2 3.1 (11.8) 11.8 –Italy – mobile in-bundle revenue 15.2 4.0 3.8 23.0 (23.0) –Italy – fixed line revenue (3.2) 3.1 3.6 3.5 (3.5) –Italy – operating expenses 7.1 (2.7) (3.5) 0.9 (0.9) –UK – service revenue (4.4) 31.9 – 27.5 – 27.5 UK – mobile in-bundle revenue 0.6 – – 0.6 – 0.6 UK – mobile out-of-bundle revenue (7.2) – – (7.2) – (7.2)Spain – service revenue (13.4) (0.7) 3.1 (11.0) – (11.0)Spain – mobile in-bundle revenue (0.4) – 3.4 3.0 – 3.0 Spain – fixed line revenue (0.2) – 3.4 3.2 – 3.2 Spain – operating expenses 9.4 – (3.3) 6.1 – 6.1 Netherlands – service revenue (5.6) (0.6) 3.4 (2.8) – (2.8)Netherlands – mobile in-bundle revenue 3.4 – 3.5 6.9 – 6.9 Portugal – service revenue (8.4) (0.6) 3.3 (5.7) – (5.7)Greece – service revenue (14.1) (0.8) 3.2 (11.7) – (11.7)Other Europe – service revenue growth (7.1) (17.5) 1.8 (22.8) – (22.8)EBITDA (18.3) 5.6 2.5 (10.2) 5.2 (5.0)Germany – EBITDA (18.2) 10.2 3.3 (4.7) – (4.7)Germany – percentage point change in EBITDA margin (4.3) 0.8 0.1 (3.4) – (3.4)Italy – EBITDA (24.9) 2.2 2.8 (19.9) 19.9 –Italy – percentage point change in EBITDA margin (4.8) – 0.1 (4.7) 39.5 34.8 UK – EBITDA (9.8) 26.9 0.1 17.2 – 17.2 UK – percentage point change in EBITDA margin (1.0) (0.4) – (1.4) – (1.4)Spain – EBITDA (23.9) (1.8) 2.8 (22.9) – (22.9)Spain – percentage point change in EBITDA margin (3.4) (0.4) 0.1 (3.7) – (3.7)Other Europe – EBITDA growth (14.0) (6.2) 2.1 (18.1) (0.1) (18.2)Other Europe – percentage point change in EBITDA margin (2.1) 3.6 0.1 1.6 – 1.6 Adjusted operating profit (39.2) 1.3 2.3 (35.6) (2.1) (37.7)Germany – adjusted operating profit (36.0) (1.1) 2.6 (34.5) – (34.5)Italy – adjusted operating profit (41.6) 1.1 2.4 (38.1) (11.7) (49.8)UK – adjusted operating profit (49.3) 11.0 – (38.3) – (38.3)Spain – adjusted operating profit (56.4) (2.5) 1.9 (57.0) – (57.0)Other Europe – adjusted operating profit growth (30.2) 4.8 2.4 (23.0) – (23.0)AMAPRevenue 8.4 0.7 (12.0) (2.9) 1.1 (1.8)Service revenue 6.1 0.7 (11.5) (4.7) 1.2 (3.5)Other revenue 27.4 0.6 (16.1) 11.9 4.9 16.8 India – service revenue 13.0 – (11.7) 1.3 – 1.3 Vodacom – service revenue 4.1 (2.8) (13.7) (12.4) – (12.4)South Africa – service revenue 0.3 – (16.2) (15.9) – (15.9)South Africa – data revenue 23.5 – (20.3) 3.2 – 3.2 South Africa – mobile in-bundle revenue 9.7 – (17.9) (8.2) – (8.2)Vodacom’s international operations – service revenue 18.9 – (3.8) 15.1 – 15.1 Turkey – service revenue 7.9 (0.5) (11.6) (4.2) – (4.2)Turkey – mobile in-bundle revenue 25.0 – (14.1) 10.9 – 10.9 Egypt – service revenue 2.6 – (11.2) (8.6) – (8.6)Ghana – service revenue 19.3 (0.2) (17.3) 1.8 – 1.8 Australia – service revenue (9.0) – (9.1) (18.1) 18.1 –Other AMAP – service revenue 2.8 4.0 (9.4) (2.6) 4.0 1.4
Vodafone Group Plc Annual Report 2014202 203Overview
Strategy review Performance Governance Financials
Additional information

Non-GAAP information (continued)
Management basis1Statutory
basis1
Organic change
%
Otheractivity2
pps
Foreign exchange
pps
Reportedchange
%
Presentationadjustments
pps
Reportedchange
%
EBITDA 16.2 1.0 (13.9) 3.3 (4.5) (1.2)India – EBITDA 26.4 – (13.7) 12.7 (5.1) 7.6 India – percentage point change in EBITDA margin 3.3 (0.1) (0.1) 3.1 (1.3) 1.8 Vodacom – EBITDA 6.6 0.2 (16.1) (9.3) – (9.3)Vodacom – percentage point change in EBITDA margin (0.3) 0.8 (0.4) 0.1 – 0.1 Other AMAP – EBITDA 19.3 3.2 (10.7) 11.8 (8.3) 3.5 Other AMAP – percentage point change in EBITDA margin 3.1 (0.2) – 2.9 (3.2) (0.3)Australia – percentage point change in EBITDA margin 14.8 – (0.2) 14.6 (14.6) –Adjusted operating profit 28.6 (0.2) (17.9) 10.5 2.4 12.9 India – adjusted operating profit 83.3 – (23.1) 60.2 46.1 106.3 Vodacom – adjusted operating profit 8.9 0.3 (17.0) (7.8) – (7.8)Other AMAP – adjusted operating profit 66.5 (2.6) (13.9) 50.0 17.2 67.2
31 March 2013GroupRevenue (1.4) 2.8 (5.6) (4.2) 2.2 (2.0)Service revenue (1.9) 2.6 (5.6) (4.9) 2.8 (2.1)Other revenue 4.0 5.3 (6.3) 3.0 (4.1) (1.1)EBITDA (1.9) 0.6 (5.8) (7.1) 4.8 (2.3)Adjusted operating profit 9.5 (1.5) (3.5) 4.5 2.1 6.6 EuropeRevenue (5.5) 4.4 (4.6) (5.7) 2.3 (3.4)Service revenue (5.8) 4.5 (4.6) (5.9) 2.8 (3.1)Other revenue (1.3) 2.4 (4.3) (3.2) (3.0) (6.2)Germany – service revenue 0.5 (0.1) (5.5) (5.1) – (5.1)Germany – mobile service revenue 1.3 (0.2) (5.5) (4.4) – (4.4)Germany – data revenue 13.6 – (6.0) 7.6 – 7.6 Germany – enterprise revenue 3.0 – (5.6) (2.6) – (2.6)Italy – service revenue (12.8) (0.1) (4.9) (17.8) 17.8 –Italy – data revenue 4.4 – (5.7) (1.3) 1.3 –Italy – fixed line revenue (6.8) – (5.1) (11.9) 11.9 –UK – service revenue (4.0) (0.3) – (4.3) – (4.3)UK – data revenue 4.2 – – 4.2 – 4.2 Spain – service revenue (11.5) (0.2) (5.0) (16.7) – (16.7)Spain – data revenue 16.5 – (6.1) 10.4 – 10.4 Spain – fixed line revenue (2.9) – (5.0) (7.9) – (7.9)Netherlands – service revenue (2.7) (0.2) (5.4) (8.3) – (8.3)Greece – service revenue (13.4) (0.4) (5.0) (18.8) – (18.8)Portugal – service revenue (8.2) (0.2) (5.2) (13.6) – (13.6)Other Europe – service revenue growth (5.2) 22.4 (6.9) 10.3 – 10.3 EBITDA (8.1) 1.8 (4.7) (11.0) 4.3 (6.7)Germany – EBITDA (1.7) 0.2 (5.2) (6.7) – (6.7)Germany – percentage point change in EBITDA margin (1.0) 0.1 – (0.9) – (0.9)Italy – EBITDA (19.3) – (4.7) (24.0) 24.0 –Italy – percentage point change in EBITDA margin (4.3) – – (4.3) 4.2 (0.1)UK – EBITDA (6.8) 0.4 (0.1) (6.5) – (6.5)UK – percentage point change in EBITDA margin (0.5) – – (0.5) – (0.5)Spain – EBITDA (9.8) (0.5) (5.3) (15.6) – (15.6)Spain – percentage point change in EBITDA margin 0.9 (0.1) 0.0 0.8 – 0.8 Other Europe – EBITDA (3.7) 8.1 (6.3) (1.9) – (1.9)Other Europe – percentage point change in EBITDA margin 0.1 (3.6) (0.1) (3.6) – (3.6)Adjusted operating profit (15.8) (1.1) (4.5) (21.4) 1.6 (19.8)Germany – adjusted operating profit (5.5) 0.3 (5.0) (10.2) – (10.2)Italy – adjusted operating profit (28.5) – (4.2) (32.7) (0.2) (32.9)UK – adjusted operating profit (26.3) 0.9 – (25.4) – (25.4)Spain – adjusted operating profit (21.8) (1.0) (5.0) (27.8) – (27.8)Other Europe – adjusted operating profit (2.0) (6.1) (5.7) (13.8) 0.1 (13.7)
Vodafone Group Plc Annual Report 2014204

Management basis1Statutory
basis1
Organic change
%
Otheractivity2
pps
Foreign exchange
pps
Reportedchange
%
Presentationadjustments
pps
Reportedchange
%
AMAPRevenue 6.0 0.7 (7.7) (1.0) 0.3 (0.7)Service revenue 5.5 (0.3) (7.5) (2.3) 1.1 (1.2)Other revenue 10.3 10.3 (9.7) 10.9 (5.3) 5.6 India – service revenue 11.2 (0.1) (12.2) (1.1) – (1.1)India – data revenue 19.8 – (13.5) 6.3 – 6.3 Vodacom – service revenue 3.1 (3.2) (9.8) (9.9) – (9.9)South Africa – service revenue (0.3) – (11.7) (12.0) – (12.0)South Africa – data revenue 16.1 – (13.8) 2.3 – 2.3 Vodacom’s international operations – service revenue 23.4 – (1.2) 22.2 – 22.2 Turkey – service revenue 17.3 (1.8) (3.1) 12.4 – 12.4 Egypt – service revenue 3.7 – (3.0) 0.7 – 0.7 Egypt – data revenue 29.6 – (4.2) 25.4 – 25.4 Egypt – fixed line revenue 29.0 – (2.9) 26.1 – 26.1 Ghana – service revenue 24.5 – (19.2) 5.3 – 5.3 Qatar – service revenue 29.8 – 1.7 31.5 – 31.5 Other AMAP – service revenue 3.8 2.1 (2.0) 3.9 5.7 9.6 EBITDA 12.3 (0.1) (9.0) 3.2 1.1 4.3 India – EBITDA 24.0 (0.1) (13.4) 10.5 2.6 13.1 India – percentage point change in EBITDA margin 3.3 (1.0) 0.1 2.4 1.1 3.5 Vodacom – EBITDA 10.1 (0.1) (12.2) (2.2) – (2.2)Vodacom – percentage point change in EBITDA margin 1.5 1.0 (0.5) 2.0 – 2.0 Other AMAP – EBITDA 6.2 (0.1) (1.4) 4.7 3.2 7.9 Other AMAP – percentage point change in EBITDA margin 0.5 (0.4) 0.1 0.2 (0.5) (0.3)Adjusted operating profit 20.3 (2.3) (10.3) 7.7 (0.6) 7.1 India – adjusted operating profit 291.1 (3.4) (19.4) 268.3 1,806.7 2,075.0 Vodacom – adjusted operating profit 12.7 0.2 (13.3) (0.4) – (0.4)Other AMAP – adjusted operating profit 2.1 (9.5) 2.1 (5.3) (11.1) (16.4)Verizon Wireless (‘VZW’)Revenue 7.8 – 1.0 8.8 (8.8) –Service revenue 8.1 – 1.1 9.2 (9.2) –EBITDA 13.6 0.1 1.2 14.9 (14.9) –Group’s share of result of VZW 29.8 – 1.4 31.2 – 31.2
31 March 2012GroupRevenue 2.2 (0.3) (0.7) 1.2 0.8 2.0 Service revenue 1.4 (0.4) (0.7) 0.3 0.8 1.1 Other revenue 12.3 0.9 (1.3) 11.9 1.2 13.1 EBITDA – (0.3) (0.4) (0.7) 1.9 1.2 Adjusted operating profit 1.1 (4.1) (0.7) (3.7) 0.4 (3.3)EuropeRevenue (1.2) 0.1 1.3 0.2 0.3 0.5 Service revenue (2.1) – 1.2 (0.9) 0.2 (0.7)Other revenue 13.6 1.8 1.0 16.4 0.5 16.9 EBITDA (4.8) – 1.4 (3.4) 0.4 (3.0)Adjusted operating profit (9.4) (0.1) 1.5 (8.0) (0.9) (8.9)AMAPRevenue 10.3 (0.1) (5.5) 4.7 0.7 5.4 Service revenue 9.6 (0.2) (5.5) 3.9 0.6 4.5 Other revenue 17.5 – (4.8) 12.7 4.0 16.7 EBITDA 10.7 (0.3) (5.5) 4.9 2.8 7.7 Adjusted operating profit 10.9 (0.9) (5.2) 4.8 5.3 10.1
Notes:1 Management basis includes the results of the Group’s joint ventures, Vodafone Italy, Vodafone Hutchison Australia, Vodafone Fiji and Indus Towers, on a proportionate basis. The statutory basis includes the results of these
joint ventures, using the equity accounting basis rather than on a proportionate consolidation basis.2 “Other activity” includes the impact of M&A activity, the revision to intra-group roaming charges from 1 October 2011, and the impact of Indus Towers revising its accounting for energy cost recharges. Refer to “Organic
growth” on page 202 for further detail.
Vodafone Group Plc Annual Report 2014204 205Overview
Strategy review Performance Governance Financials
Additional information
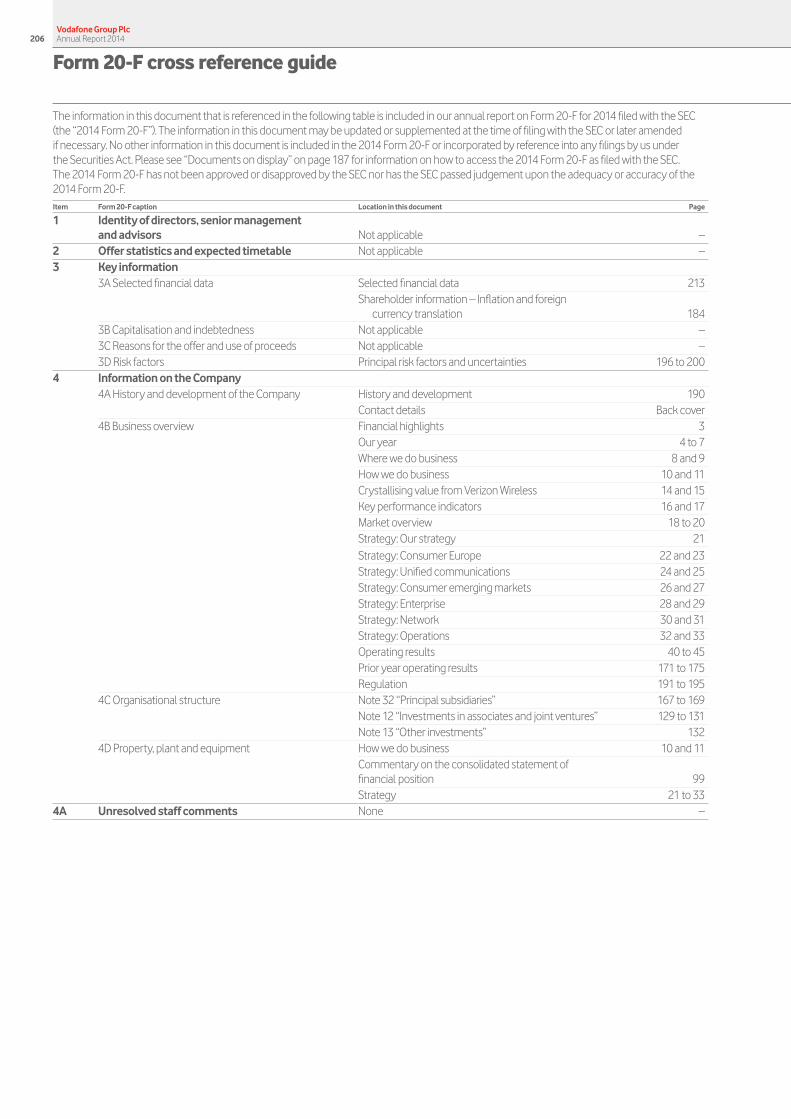
The information in this document that is referenced in the following table is included in our annual report on Form 20-F for 2014 filed with the SEC (the “2014 Form 20-F”). The information in this document may be updated or supplemented at the time of filing with the SEC or later amended if necessary. No other information in this document is included in the 2014 Form 20-F or incorporated by reference into any filings by us under the Securities Act. Please see “Documents on display” on page 187 for information on how to access the 2014 Form 20-F as filed with the SEC. The 2014 Form 20-F has not been approved or disapproved by the SEC nor has the SEC passed judgement upon the adequacy or accuracy of the 2014 Form 20-F.Item Form 20-F caption Location in this document Page
1 Identity of directors, senior management and advisors Not applicable –
2 Offer statistics and expected timetable Not applicable –3
Key information3A Selected financial data Selected financial data 213
Shareholder information – Inflation and foreign currency translation 184
3B Capitalisation and indebtedness Not applicable –3C Reasons for the offer and use of proceeds Not applicable –3D Risk factors Principal risk factors and uncertainties 196 to 200
4 Information on the Company4A History and development of the Company History and development 190
Contact details Back cover4B Business overview Financial highlights 3
Our year 4 to 7Where we do business 8 and 9How we do business 10 and 11Crystallising value from Verizon Wireless 14 and 15Key performance indicators 16 and 17Market overview 18 to 20Strategy: Our strategy 21Strategy: Consumer Europe 22 and 23Strategy: Unified communications 24 and 25Strategy: Consumer emerging markets 26 and 27Strategy: Enterprise 28 and 29Strategy: Network 30 and 31Strategy: Operations 32 and 33Operating results 40 to 45Prior year operating results 171 to 175Regulation 191 to 195
4C Organisational structure Note 32 “Principal subsidiaries” 167 to 169Note 12 “Investments in associates and joint ventures” 129 to 131Note 13 “Other investments” 132
4D Property, plant and equipment How we do business 10 and 11Commentary on the consolidated statement of financial position 99Strategy 21 to 33
4A Unresolved staff comments None –
Vodafone Group Plc Annual Report 2014206
Form 20-F cross reference guide
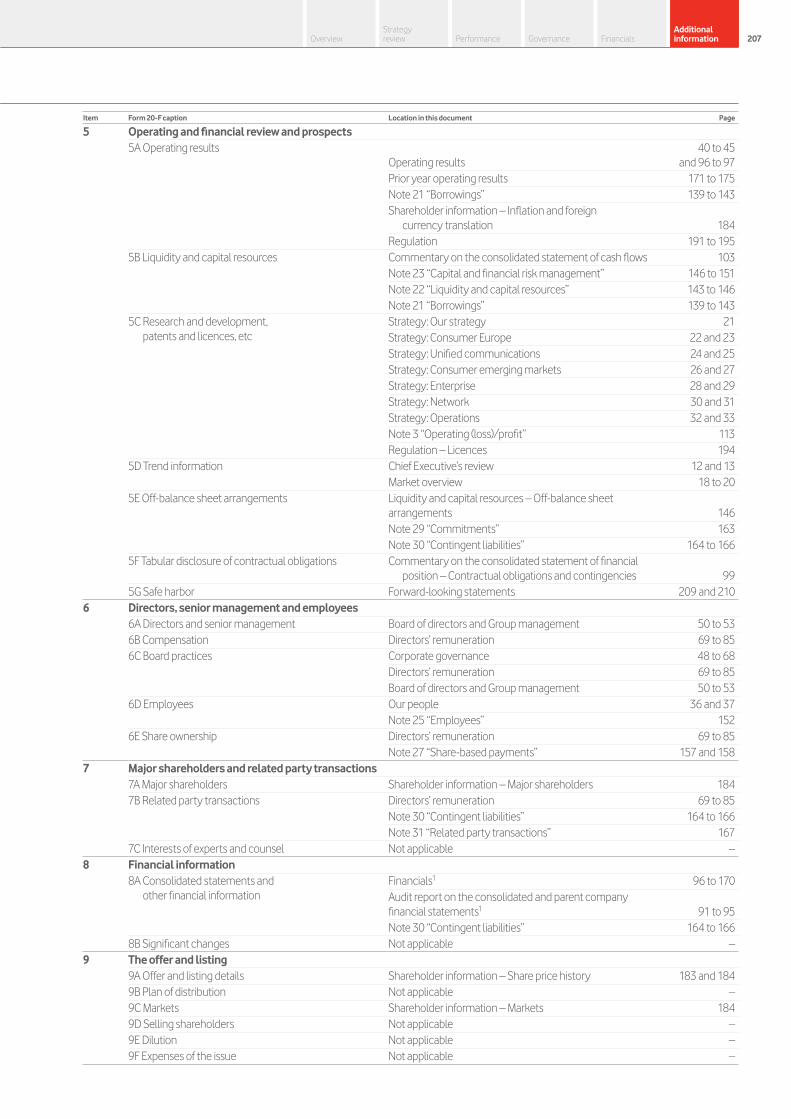
Item Form 20-F caption Location in this document Page
5 Operating and financial review and prospects5A Operating results
Operating results40 to 45
and 96 to 97Prior year operating results 171 to 175Note 21 “Borrowings” 139 to 143Shareholder information – Inflation and foreign
currency translation 184Regulation 191 to 195
5B Liquidity and capital resources Commentary on the consolidated statement of cash flows 103Note 23 “Capital and financial risk management” 146 to 151Note 22 “Liquidity and capital resources” 143 to 146Note 21 “Borrowings” 139 to 143
5C Research and development, patents and licences, etc
Strategy: Our strategy 21Strategy: Consumer Europe 22 and 23Strategy: Unified communications 24 and 25Strategy: Consumer emerging markets 26 and 27Strategy: Enterprise 28 and 29Strategy: Network 30 and 31Strategy: Operations 32 and 33Note 3 “Operating (loss)/profit” 113Regulation – Licences 194
5D Trend information Chief Executive’s review 12 and 13Market overview 18 to 20
5E Off-balance sheet arrangements Liquidity and capital resources – Off-balance sheet arrangements 146Note 29 “Commitments” 163Note 30 “Contingent liabilities” 164 to 166
5F Tabular disclosure of contractual obligations Commentary on the consolidated statement of financial position – Contractual obligations and contingencies 99
5G Safe harbor Forward-looking statements 209 and 2106 Directors, senior management and employees
6A Directors and senior management Board of directors and Group management 50 to 536B Compensation Directors’ remuneration 69 to 856C Board practices Corporate governance 48 to 68
Directors’ remuneration 69 to 85Board of directors and Group management 50 to 53
6D Employees Our people 36 and 37Note 25 “Employees” 152
6E Share ownership Directors’ remuneration 69 to 85Note 27 “Share-based payments” 157 and 158
7 Major shareholders and related party transactions7A Major shareholders Shareholder information – Major shareholders 1847B Related party transactions Directors’ remuneration 69 to 85
Note 30 “Contingent liabilities” 164 to 166Note 31 “Related party transactions” 167
7C Interests of experts and counsel Not applicable –8 Financial information
8A Consolidated statements and other financial information
Financials1 96 to 170Audit report on the consolidated and parent company financial statements1 91 to 95Note 30 “Contingent liabilities” 164 to 166
8B Significant changes Not applicable –9 The offer and listing
9A Offer and listing details Shareholder information – Share price history 183 and 1849B Plan of distribution Not applicable –9C Markets Shareholder information – Markets 1849D Selling shareholders Not applicable –9E Dilution Not applicable –9F Expenses of the issue Not applicable –
Vodafone Group Plc Annual Report 2014206 207Overview
Strategy review Performance Governance Financials
Additional information

Item Form 20-F caption Location in this document Page
10 Additional information10A Share capital Not applicable –10B Memorandum and articles of association Shareholder information – Articles of association and
applicable English law 184 to 18710C Material contracts Shareholder information – Material contracts 18710D Exchange controls Shareholder information – Exchange controls 18710E Taxation Shareholder information – Taxation 187 to 18910F Dividends and paying agents Not applicable –10G Statement by experts Not applicable –10H Documents on display Shareholder information – Documents on display 18710I Subsidiary information Not applicable –
11 Quantitative and qualitative disclosures about market risk Note 23 “Capital and financial risk management” 146 to 151
12 Description of securities other than equity securities12A Debt securities Not applicable –12B Warrants and rights Not applicable –12C Other securities Not applicable –12D American depositary shares Filed with the SEC –
13 Defaults, dividend arrearages and delinquencies Not applicable –14 Material modifications to the rights of security
holders and use of proceeds Not applicable –15 Controls and procedures Corporate governance 48 to 68
Directors’ statement of responsibility – Management’s report on internal control over financial reporting 88 and 89
Audit report on internal control over financial reporting 9016 16A Audit Committee financial expert Corporate governance – Board committees 58
16B Code of ethics Corporate governance – US listing requirements 6816C Principal accountant fees and services Note 3 “Operating (loss)/profit” 113
Corporate governance – Audit and Risk Committee – External audit 61
16D Exemptions from the listing standards for audit committees Not applicable –
16E Purchase of equity securities by the issuer and affiliated purchasers
Commentary on the consolidated statement of changes in equity – Purchase of own shares 101
Note 22 “Liquidity and capital resources” – Share buyback programmes 144
16F Change in registrant’s certifying accountant Not applicable –16G Corporate governance Corporate governance – US listing requirements 6816H Mine safety disclosure Not applicable –
17 Financial statements Not applicable –18 Financial statements Financials1 96 to 17019 Exhibits Filed with the SEC –
Note:1 The parent company financial statements together with the associated notes and the audit report relating thereto, on pages 176 to 181 and pages 91 to 95 respectively, should not be considered to form part of the
Company’s annual report on Form 20-F.
Vodafone Group Plc Annual Report 2014208
Form 20-F cross reference guide (continued)
This document contains “forward-looking statements” within the meaning of the US Private Securities Litigation Reform Act of 1995 with respect to the Group’s financial condition, results of operations and businesses and certain of the Group’s plans and objectives.
In particular, such forward-looking statements include statements with respect to:
a the Group’s expectations and guidance regarding its financial and operating performance, including statements contained within the Chief Executive’s review on pages 12 to 13, statements regarding the Group’s future dividends and the guidance statement for the 2015 financial year and free cash flow guidance on page 13 and 39, the performance of associates and joint ventures, other investments and newly acquired businesses including CWW, KDG, Ono and Neotel and expectations regarding the Project Spring organic investment programme;
a intentions and expectations regarding the development of products, services and initiatives introduced by, or together with, Vodafone or by third parties, including new mobile technologies, such as the Vodafone M-Pesa money transfer service, M2M connections, Vodafone Red, cloud hosting, tablets and an increase in download speeds, Vodafone One-Net, mWallet, Smartpass and 4G/3G services;
a expectations regarding the global economy and the Group’s operating environment and market position, including future market conditions, growth in the number of worldwide mobile phone users and other trends, including increased mobile data usage and increased mobile penetration in emerging markets;
a revenue and growth expected from the Group’s enterprise and total communications strategy, including data revenue growth, and its expectations with respect to long-term shareholder value growth;
a mobile penetration and coverage rates, mobile termination rate cuts, the Group’s ability to acquire spectrum, expected growth prospects in the Europe and AMAP regions and growth in customers and usage generally, and plans for sustained investment in high speed data networks and the anticipated Group standardisation and simplification programme;
a anticipated benefits to the Group from cost efficiency programmes;
a possible future acquisitions, including increases in ownership in existing investments, the timely completion of pending acquisition transactions and pending offers for investments, including licence and spectrum acquisitions, and the expected funding required to complete such acquisitions or investments;
a expectations and assumptions regarding the Group’s future revenue, operating profit, EBITDA, EBITDA margin, free cash flow, depreciation and amortisation charges, foreign exchange rates, tax rates and capital expenditure;
a expectations regarding the Group’s access to adequate funding for its working capital requirements and share buyback programmes, and the Group’s future dividends or its existing investments; and
a the impact of regulatory and legal proceedings involving the Group and of scheduled or potential regulatory changes.
Forward-looking statements are sometimes, but not always, identified by their use of a date in the future or such words as “will”, “anticipates”, “aims”, “could”, “may”, “should”, “expects”, “believes”, “intends”, “plans” or “targets”. By their nature, forward-looking statements are inherently predictive, speculative and involve risk and uncertainty because they relate to events and depend on circumstances that will occur in the future. There are a number of factors that could cause actual results and developments to differ materially from those expressed or implied by these forward-looking statements. These factors include, but are not limited to, the following:
a general economic and political conditions in the jurisdictions in which the Group operates and changes to the associated legal, regulatory and tax environments;
a increased competition, from both existing competitors and new market entrants, including mobile virtual network operators;
a levels of investment in network capacity and the Group’s ability to deploy new technologies, products and services in a timely manner, particularly data content and services;
a rapid changes to existing products and services and the inability of new products and services to perform in accordance with expectations, including as a result of third-party or vendor marketing efforts;
a the ability of the Group to integrate new technologies, products and services with existing networks, technologies, products and services;
a the Group’s ability to generate and grow revenue from both voice and non-voice services and achieve expected cost savings;
a a lower than expected impact of new or existing products, services or technologies on the Group’s future revenue, cost structure and capital expenditure outlays;
a slower than expected customer growth, reduced customer retention, reductions or changes in customer spending and increased pricing pressure;
a the Group’s ability to expand its spectrum position, win 3G and 4G allocations and realise expected synergies and benefits associated with 3G and 4G;
Vodafone Group Plc Annual Report 2014208 209Overview
Strategy review Performance Governance Financials
Additional information
Forward-looking statements
a the Group’s ability to secure the timely delivery of high quality, reliable handsets, network equipment and other key products from suppliers;
a loss of suppliers, disruption of supply chains and greater than anticipated prices of new mobile handsets;
a changes in the costs to the Group of, or the rates the Group may charge for, terminations and roaming minutes;
a the impact of a failure or significant interruption to the Group’s telecommunications, networks, IT systems or data protection systems;
a the Group’s ability to realise expected benefits from acquisitions, partnerships, joint ventures, franchises, brand licences, platform sharing or other arrangements with third parties, particularly those related to the development of data and internet services;
a acquisitions and divestments of Group businesses and assets and the pursuit of new, unexpected strategic opportunities which may have a negative impact on the Group’s financial condition and results of operations;
a the Group’s ability to integrate acquired business or assets and the imposition of any unfavourable conditions, regulatory or otherwise, on any pending or future acquisitions or dispositions;
a the extent of any future write-downs or impairment charges on the Group’s assets, or restructuring charges incurred as a result of an acquisition or disposition;
a developments in the Group’s financial condition, earnings and distributable funds and other factors that the Board takes into account in determining the level of dividends;
a the Group’s ability to satisfy working capital requirements through borrowing in capital markets, bank facilities and operations;
a changes in foreign exchange rates, including particularly the exchange rate of pounds sterling to the euro, Indian rupee, South African rand and the US dollar;
a changes in the regulatory framework in which the Group operates, including the commencement of legal or regulatory action seeking to regulate the Group’s permitted charging rates;
a the impact of legal or other proceedings against the Group or other companies in the communications industry; and
a changes in statutory tax rates and profit mix, the Group’s ability to resolve open tax issues and the timing and amount of any payments in respect of tax liabilities.
Furthermore, a review of the reasons why actual results and developments may differ materially from the expectations disclosed or implied within forward-looking statements can be found under “Principal risk factors and uncertainties” on pages 196 to 200 of this document. All subsequent written or oral forward-looking statements attributable to the Company or any member of the Group or any persons acting on their behalf are expressly qualified in their entirety by the factors referred to above. No assurances can be given that the forward-looking statements in this document will be realised. Subject to compliance with applicable law and regulations, Vodafone does not intend to update these forward-looking statements and does not undertake any obligation to do so.
Vodafone Group Plc Annual Report 2014210
Forward-looking statements (continued)

2G 2G networks are operated using global system for mobile (‘GSM’) technology which offer services such as voice, text messaging and low speed data. In addition, all the Group’s controlled networks support general packet radio services (‘GPRS’), often referred to as 2.5G. GPRS allows mobile devices to access IP based data services such as the internet and email.
3G A cellular technology based on wide band CDMA delivering voice and faster data services.4G/LTE 4G or long-term evolution (‘LTE’) technology offers even faster data transfer speeds than 3G/HSPA.Acquisition costs The total of connection fees, trade commissions and equipment costs relating to new customer connections.ADR American depositary receipts is a mechanism designed to facilitate trading in shares of non-US companies
in the US stock markets. The main purpose is to create an instrument which can easily be settled through US stock market clearing systems.
ADS American depositary shares are shares evidenced by American depositary receipts. ADSs are issued by a depositary bank and represent one or more shares of a non-US issuer held by the depositary bank. The main purpose of ADSs is to facilitate trading in shares of non-US companies in the US markets and, accordingly, ADRs which evidence ADSs are in a form suitable for holding in US clearing systems.
AGM Annual general meeting.AMAP The Group’s region: Africa, Middle East and Asia Pacific.Applications (‘apps’) Apps are software applications usually designed to run on a smartphone or tablet device and provide a
convenient means for the user to perform certain tasks. They cover a wide range of activities including banking, ticket purchasing, travel arrangements, social networking and games. For example, the My Vodafone app lets customers check their bill totals on their smartphone and see the minutes, texts and data allowance remaining.
ARPU Average revenue per user, defined as mobile in-bundle customer revenue plus mobile out-of-bundle customer revenue and mobile incoming revenue divided by average customers.
Capital expenditure (‘capex’) This measure includes the aggregate of capitalised property, plant and equipment additions and capitalised software costs.
CDMA This is a channel access method used by various radio communication technologies.Churn Total gross customer disconnections in the period divided by the average total customers in the period.Cloud services This means the customer has little or no equipment at their premises and all the equipment and capability
associated with the service is run from the Vodafone network and data centres instead. This removes the need for customers to make capital investments and instead they have an operating cost model with a recurring monthly fee.
Controlled and jointly controlled Controlled and jointly controlled measures include 100% for the Group’s mobile operating subsidiaries and the Group’s share for joint ventures. and the Group’s proportionate share for joint operations.
Customer costs Customer costs include acquisition costs and retention costs.Depreciation and other amortisation
The accounting charge that allocates the cost of a tangible or intangible asset to the income statement over its useful life. This measure includes the profit or loss on disposal of property, plant and equipment and computer software.
Direct costs Direct costs include interconnect costs and other direct costs of providing services.Enterprise The Group’s customer segment for businesses.EBITDA Operating profit excluding share of results in associates, depreciation and amortisation, gains/losses on the
disposal of fixed assets, impairment losses, restructuring costs and other operating income and expense. The Group’s definition of EBITDA may not be comparable with similarly titled measures and disclosures by other companies.
Fixed broadband customer A fixed broadband customer is defined as a customer with a connection or access point to a fixed line data network.
FRC Financial Reporting Council.Free cash flow Operating free cash flow after cash flows in relation to taxation, interest, dividends received from associates and
investments and dividends paid to non-controlling shareholders in subsidiaries but before licence and spectrum payments. For the year ended 31 March 2014 and 31 March 2013 other items excluded the income dividends received from Verizon Wireless and payments in respect of a tax case settlement.
FCA Financial Conduct Authority (previously Financial Services Authority).HSPA+ An evolution of high speed packet access (‘HSPA’) or third generation (‘3G’) technology that enhances the
existing 3G network with higher speeds for the end user.Impairment A downward revaluation of an asset.Interconnect costs A charge paid by Vodafone to other fixed line or mobile operators when a Vodafone customer calls
a customer connected to a different network.ICT Information and communications technology.IFRS International Financial Reporting StandardsIP Internet protocol (‘IP’) is the format in which data is sent from one computer to another on the internet.IP-VPN A virtual private network (‘VPN’) is a network that uses a shared telecommunications infrastructure, such as
the internet, to provide remote offices or individual users with secure access to their organisation’s network.M2M Machine-to-machine. M2M communications, or telemetry, enable devices to communicate with one another
via built-in mobile SIM cards.Mark-to-market Mark-to-market or fair value accounting refers to accounting for the value of an asset or liability based on the
current market price of the asset or liability.
Vodafone Group Plc Annual Report 2014210 211Overview
Strategy review Performance Governance Financials
Additional information
Definition of terms

Mobile broadband Also known as mobile internet (see below).Mobile customer A mobile customer is defined as a subscriber identity module (‘SIM’), or in territories where SIMs do not exist,
a unique mobile telephone number, which has access to the network for any purpose, including data only usage.
Mobile internet Mobile internet allows internet access anytime, anywhere through a browser or a native application using any portable or mobile device such as smartphone, tablet, laptop connected to a wireless network.
Mobile termination rate (‘MTR’) A per minute charge paid by a telecommunications network operator when a customer makes a call to another mobile or fixed line network operator.
MVNO Mobile virtual network operators, companies that provide mobile phone services under wholesale contracts with a mobile network operator, but do not have their own licence of spectrum or the infrastructure required to operate a network.
Net debt Long-term borrowings, short-term borrowings and mark-to-market adjustments on financing instruments less cash and cash equivalents.
Net promoter score (‘NPS’) Net promoter score is a customer loyalty metric used to monitor customer satisfaction.Operating expenses Operating expenses comprise primarily network and IT related expenditure, support costs from HR and
finance and certain intercompany items.Operating free cash flow Cash generated from operations after cash payments for capital expenditure (excludes capital licence and
spectrum payments) and cash receipts from the disposal of intangible assets and property, plant and equipment.Organic growth All amounts marked with an “*” represent organic growth which presents performance on a comparable
basis, both in terms of merger and acquisition activity and movements in foreign exchange rates. From 1 April 2013 the Group revised its intra-group roaming charges. These changes have had an impact on reported service revenue for the Group and by country and regionally since 1 April 2013. Whilst prior period reported revenue has not been restated, to ensure comparability in organic growth rates, Group, country and regional revenue in the prior financial periods have been recalculated based on the new pricing structure to form the basis for our organic calculations.
Partner markets Markets in which the Group has entered into a partner agreement with a local mobile operator enabling a range of Vodafone’s global products and services to be marketed in that operator’s territory and extending Vodafone’s reach into such markets.
Penetration Number of SIMs in a country as a percentage of the country’s population. Penetration can be in excess of 100% due to customers’ owning more than one SIM.
Petabyte A petabyte is a measure of data usage. One petabyte is a million gigabytes.Pps Percentage points.Reported growth Reported growth is based on amounts reported in pound sterling as determined under IFRS.RAN Radio access network is the part of a mobile telecommunications system which provides cellular coverage to
mobile phones via a radio interface, managed by thousands of base stations installed on towers and rooftops across the coverage area, and linked to the core nodes through a backhaul infrastructure which can be owned, leased or a mix of both.
Retention costs The total of trade commissions, loyalty scheme and equipment costs relating to customer retention and upgrade.
Roaming Allows customers to make calls, send and receive texts and data on other operators’ mobile networks while travelling abroad.
Service revenue Service revenue comprises all revenue related to the provision of ongoing services including, but not limited to, monthly access charges, airtime usage, roaming, incoming and outgoing network usage by non-Vodafone customers and interconnect charges for incoming calls.
Smartphone devices A smartphone is a mobile phone offering advanced capabilities including access to email and the internet.Smartphone penetration The number of smartphone devices divided by the number of registered SIMs (excluding data only SIMs) and
telemetric applications.SME Small to medium-sized enterprises.SoHo Small-office home-office.Spectrum The radio frequency bands and channels assigned for telecommunication services.Supranational An international organisation, or union, whereby member states go beyond national boundaries or interests to
share in the decision-making and vote on issues pertaining to the wider grouping.Tablets A tablet is a slate shaped, mobile or portable computing device equipped with a finger operated touchscreen
or stylus, for example, the Apple iPad.Telemetrics Telemetric applications include, but are not limited to, asset and equipment tracking, mobile payment and
billing functionality, e.g. vending machines and meter readings, and include voice enabled customers whose usage is limited to a central service operation, e.g. emergency response applications in vehicles. Telemetric customers are not included in mobile customers.
VZW Verizon Wireless, the Group’s former associate in the United States.VZW income dividends Distributions (other than tax distributions) by Verizon Wireless as agreed from time to time by the Board of
Verizon Wireless.VZW tax distributions Specific distributions made by the Verizon Wireless to its partners based on the taxable income.
Definition of terms (continued)
Vodafone Group Plc Annual Report 2014212
Glue area
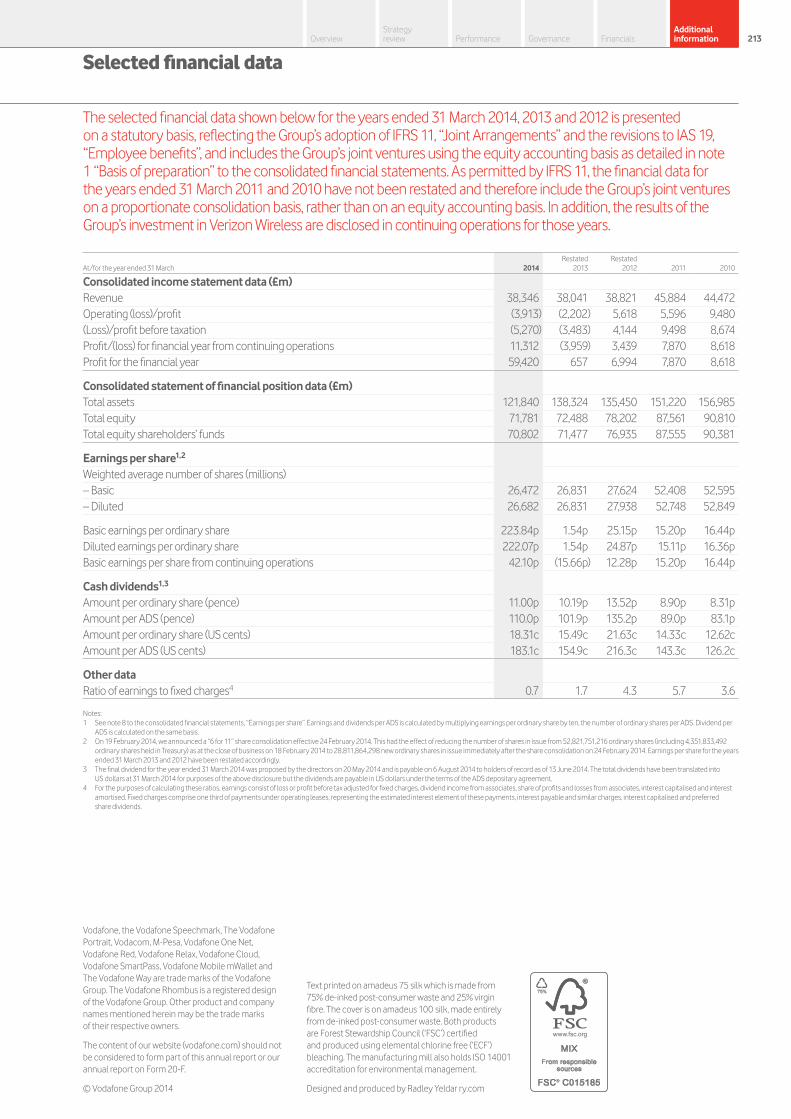
The selected financial data shown below for the years ended 31 March 2014, 2013 and 2012 is presented on a statutory basis, reflecting the Group’s adoption of IFRS 11, “Joint Arrangements” and the revisions to IAS 19, “Employee benefits”, and includes the Group’s joint ventures using the equity accounting basis as detailed in note 1 “Basis of preparation” to the consolidated financial statements. As permitted by IFRS 11, the financial data for the years ended 31 March 2011 and 2010 have not been restated and therefore include the Group’s joint ventures on a proportionate consolidation basis, rather than on an equity accounting basis. In addition, the results of the Group’s investment in Verizon Wireless are disclosed in continuing operations for those years.
At/for the year ended 31 March 2014Restated
2013Restated
2012 2011 2010
Consolidated income statement data (£m)Revenue 38,346 38,041 38,821 45,884 44,472Operating (loss)/profit (3,913) (2,202) 5,618 5,596 9,480(Loss)/profit before taxation (5,270) (3,483) 4,144 9,498 8,674Profit/(loss) for financial year from continuing operations 11,312 (3,959) 3,439 7,870 8,618Profit for the financial year 59,420 657 6,994 7,870 8,618
Consolidated statement of financial position data (£m)Total assets 121,840 138,324 135,450 151,220 156,985Total equity 71,781 72,488 78,202 87,561 90,810Total equity shareholders’ funds 70,802 71,477 76,935 87,555 90,381
Earnings per share1,2
Weighted average number of shares (millions)– Basic 26,472 26,831 27,624 52,408 52,595– Diluted 26,682 26,831 27,938 52,748 52,849
Basic earnings per ordinary share 223.84p 1.54p 25.15p 15.20p 16.44pDiluted earnings per ordinary share 222.07p 1.54p 24.87p 15.11p 16.36pBasic earnings per share from continuing operations 42.10p (15.66p) 12.28p 15.20p 16.44p
Cash dividends1,3
Amount per ordinary share (pence) 11.00p 10.19p 13.52p 8.90p 8.31pAmount per ADS (pence) 110.0p 101.9p 135.2p 89.0p 83.1pAmount per ordinary share (US cents) 18.31c 15.49c 21.63c 14.33c 12.62cAmount per ADS (US cents) 183.1c 154.9c 216.3c 143.3c 126.2c
Other dataRatio of earnings to fixed charges4 0.7 1.7 4.3 5.7 3.6
Notes: 1 See note 8 to the consolidated financial statements, “Earnings per share”. Earnings and dividends per ADS is calculated by multiplying earnings per ordinary share by ten, the number of ordinary shares per ADS. Dividend per
ADS is calculated on the same basis. 2 On 19 February 2014, we announced a “6 for 11” share consolidation effective 24 February 2014. This had the effect of reducing the number of shares in issue from 52,821,751,216 ordinary shares (including 4,351,833,492
ordinary shares held in Treasury) as at the close of business on 18 February 2014 to 28,811,864,298 new ordinary shares in issue immediately after the share consolidation on 24 February 2014. Earnings per share for the years ended 31 March 2013 and 2012 have been restated accordingly.
3 The final dividend for the year ended 31 March 2014 was proposed by the directors on 20 May 2014 and is payable on 6 August 2014 to holders of record as of 13 June 2014. The total dividends have been translated into US dollars at 31 March 2014 for purposes of the above disclosure but the dividends are payable in US dollars under the terms of the ADS depositary agreement.
4 For the purposes of calculating these ratios, earnings consist of loss or profit before tax adjusted for fixed charges, dividend income from associates, share of profits and losses from associates, interest capitalised and interest amortised. Fixed charges comprise one third of payments under operating leases, representing the estimated interest element of these payments, interest payable and similar charges, interest capitalised and preferred share dividends.
Vodafone, the Vodafone Speechmark, The Vodafone Portrait, Vodacom, M-Pesa, Vodafone One Net, Vodafone Red, Vodafone Relax, Vodafone Cloud, Vodafone SmartPass, Vodafone Mobile mWallet and The Vodafone Way are trade marks of the Vodafone Group. The Vodafone Rhombus is a registered design of the Vodafone Group. Other product and company names mentioned herein may be the trade marks of their respective owners.
The content of our website (vodafone.com) should not be considered to form part of this annual report or our annual report on Form 20-F.
© Vodafone Group 2014
Text printed on amadeus 75 silk which is made from 75% de-inked post-consumer waste and 25% virgin fibre. The cover is on amadeus 100 silk, made entirely from de-inked post-consumer waste. Both products are Forest Stewardship Council (‘FSC’) certified and produced using elemental chlorine free (‘ECF’) bleaching. The manufacturing mill also holds ISO 14001 accreditation for environmental management.
Designed and produced by Radley Yeldar ry.com
Vodafone Group Plc Annual Report 2014212 213Overview
Strategy review Performance Governance Financials
Additional information
Selected financial data
Glue area
Empowering everybody to be confidently connectedVodafone Group Plc Annual Report 2014
Vodafone Group Plc Annual Report for the year ended 31 M
arch 2014
Vodafone Group Plc
Registered Office: Vodafone House The Connection Newbury Berkshire RG14 2FN England
Registered in England No. 1833679
Telephone: +44 (0) 1635 33251 Fax: +44 (0) 1635 238080
vodafone.com Contact details:
Shareholder helpline Telephone: +44 (0) 870 702 0198 (In Ireland): +353 (0) 818 300 999
Investor Relations [email protected] vodafone.com/investor
Media Relations vodafone.com/media/contact
Sustainability [email protected] vodafone.com/sustainability
Access our online Annual Report at:vodafone.com/ar2014