
NERLYNE ST. PIERREWILBERTA WILLIAM
EDUCATION 7202T – SPRING 2011
A Combination of Teacher-Centered and Student-Centered Classroom
Management Approaches will Improve Students’ Reading Scores.

Table of Contents
AbstractIntroduction
Statement of the Problem Review of Related Literature Statement of the Hypothesis
Method Participants Instrument (s) Experimental Design Procedure
Results Discussion Implication References

Abstract
This action research project investigated the effect of implementing a hybrid of teacher-centered and student-centered classroom management approaches in ensuring an academically successfully classroom. The study took place over a period of six weeks, and focused on the instruction of guided reading in a 1st grade classroom at Charter School X located in Brooklyn, N.Y., and Public School X located in New York, N.Y. The action researchers utilized actionable techniques, to manage the students’ behavior, and the students had procedures to follow during daily 30 minute guided reading lessons. The post test reading results showed an increase in reading level for each participant. A comparative study of the findings showed participants in Charter School X saw the most jumps in reading level than participants in P.S. X. The results indicated that the intervention was significantly successfully. Establishing procedures and routines during guided reading instruction in a 1st grade classroom will increase students reading levels.

Statement of the Problem
Classroom management is currently the number one problem for teachers in America.
There is a lack of classroom management being effectively enforced in elementary schools which makes daily instruction more challenging for teachers and learning more challenging for students.

Review of Related Literature
I. Pros: Supporters of an Authoritative Teacher-Centered Approach to Classroom Management.Arguments Increase Academic achievement Safe learning environment Decrease drop out rate Stop teacher attrition Theorists/Practitioners: Allen (2010); Clement(2010); Martin, Mayall, Yin (2006); Lewis-Palmer, Merrell,
Reinke (2008); Walker (2009).
II. Cons: Supporters of Progressive Student-Centered Approach to Classroom Management Arguments Restricts students ability to self-direct and self-discipline Fails to create a balance between the wants of the teacher and the efforts of the students Not culturally responsive Students have little or no voice Theorists/Practitioners: Montessori(1912); Dewey (1916); Kilpatrick, (1918); Freiberg & Lamb (2009);
Doyle (1916); Milner & Tenore (2010).
III. Hybrid: Supporters of a combination of Teacher-centered and Student-centeredArguments PBS Teach like a champion - 49 techniques to classroom management Theorist/Practitioners : Lemov (2010); Trussell (2008).
E.D. Hirsch Diane Ravitch
Statement of the Hypothesis
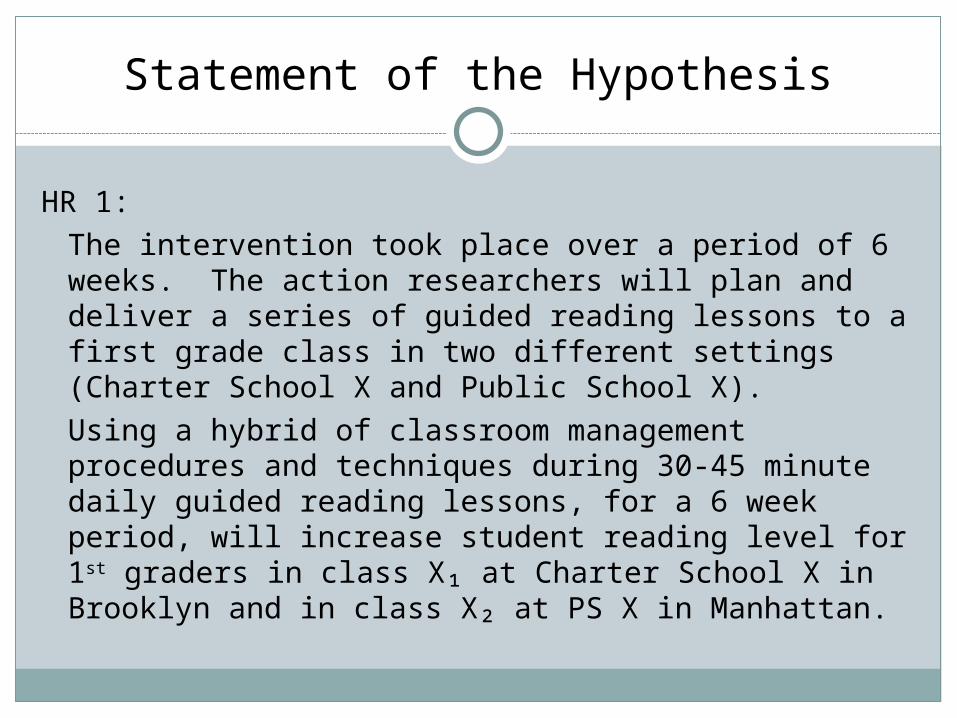
HR 1:The intervention took place over a period of 6 weeks. The action researchers will plan and deliver a series of guided reading lessons to a first grade class in two different settings (Charter School X and Public School X). Using a hybrid of classroom management procedures and techniques during 30-45 minute daily guided reading lessons, for a 6 week period, will increase student reading level for 1st graders in class X₁ at Charter School X in Brooklyn and in class X₂ at PS X in Manhattan.

Class X₁ Class X₁ Class X₂ Class X₂
ParticipantsFirst grade class25 students12 girls/13 boysAge: 6-7
ParticipantsFirst grade class22 students11 girls/11 boysAge: 6-7
Method
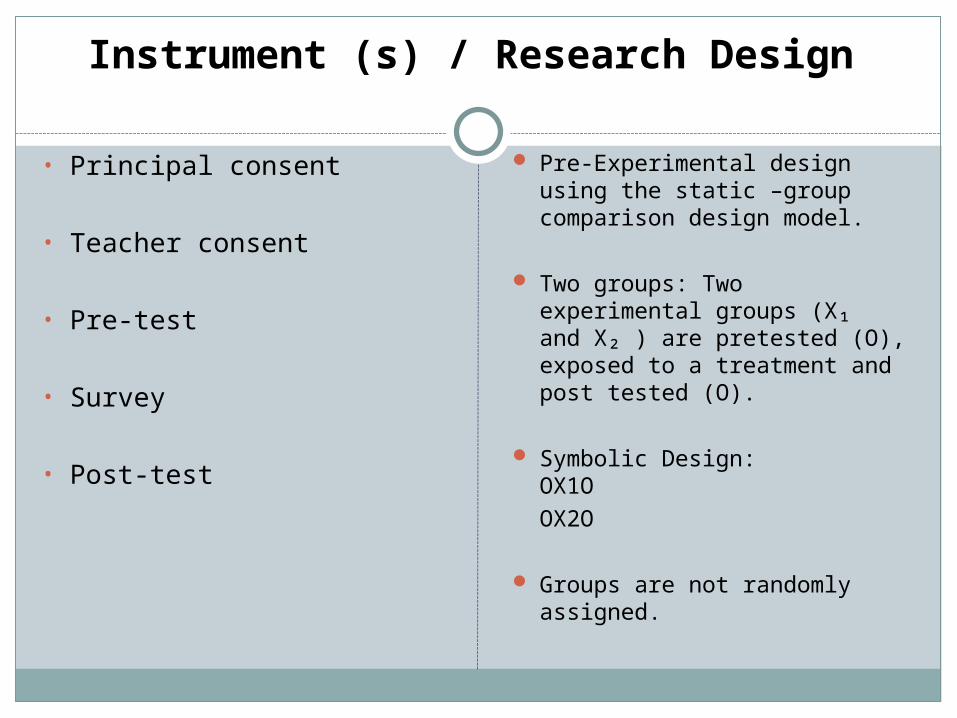
Instrument (s) / Research Design
• Principal consent
• Teacher consent
• Pre-test
• Survey
• Post-test
Pre-Experimental design using the static –group comparison design model.
Two groups: Two experimental groups (X₁ and X₂ ) are pretested (O), exposed to a treatment and post tested (O).
Symbolic Design:OX1O
OX2O
Groups are not randomly assigned.

InternalInternal ExternalExternal
History: lateness was a threat to internal validity.
Instrumentation:
Mortality:
Selection-Maturation Interaction: participants maturity levels was a threat to internal validity.
Ecological:
Generalizable Conditions:
Specificity of Variables:
Threats to Validity
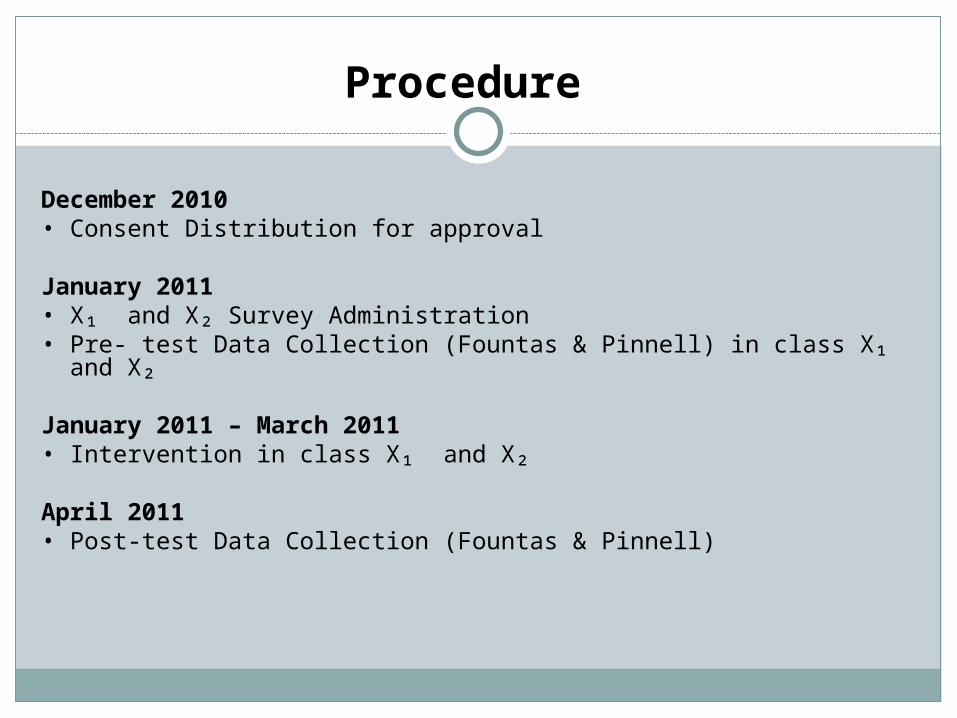
Procedure
December 2010 • Consent Distribution for approval
January 2011 • X₁ and X₂ Survey Administration• Pre- test Data Collection (Fountas & Pinnell) in class X₁ and X₂
January 2011 – March 2011• Intervention in class X₁ and X₂
April 2011• Post-test Data Collection (Fountas & Pinnell)

Bar GraphBar Graph Statistical AnalysisStatistical Analysis
X₁ Pre-Test /Fountas & Pinnell
X₁ Post-Test /Fountas & Pinnell
Mean 163 / F 222 / H
Median 175 / F 200 / G
Mode 175 / F 200/ G
Minimum 50 / B 125 / E
Maximum 275 / I 350 / K
Range 225 / H 225 / H
Bar Graph Results
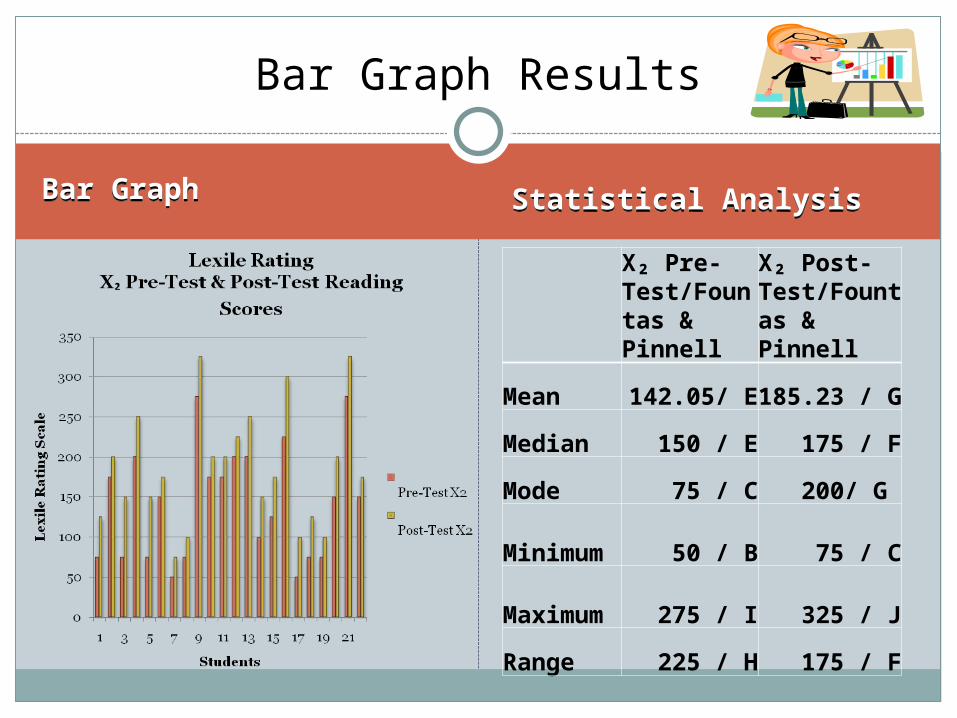
Bar GraphBar Graph Statistical AnalysisStatistical Analysis
Bar Graph Results
X₂ Pre-Test/Fountas & Pinnell
X₂ Post-Test/Fountas & Pinnell
Mean 142.05/ E 185.23 / G
Median 150 / E 175 / F
Mode 75 / C 200/ G
Minimum 50 / B 75 / C
Maximum 275 / I 325 / J
Range 225 / H 175 / F
X₁ Post-test ScoresX₁ Post-test Scores
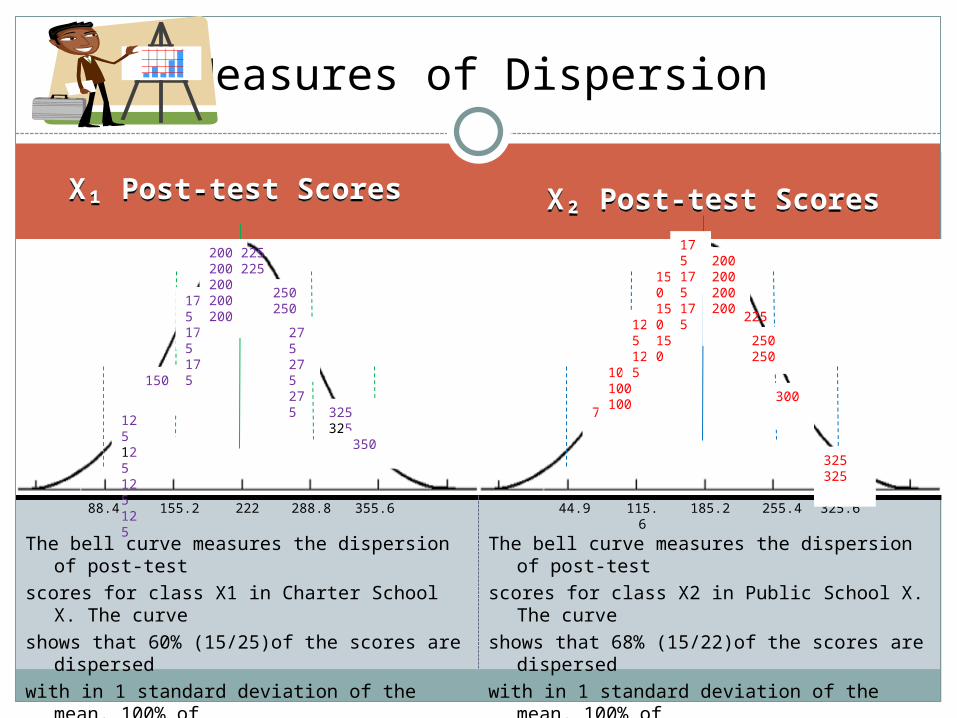
Measures of Dispersion
X₂ Post-test ScoresX₂ Post-test Scores
The bell curve measures the dispersion of post-test
scores for class X1 in Charter School X. The curve
shows that 60% (15/25)of the scores are dispersed
with in 1 standard deviation of the mean. 100% of
the post test scores are dispersed with in 1 to 2
standard deviation from the mean.
88.4 155.2 222 288.8 355.6
125125125125
150
175175175
200200200200200
225225
250250
275275275 325
325350
44.9 115.6
185.2 255.4 325.6
The bell curve measures the dispersion of post-test
scores for class X2 in Public School X. The curve
shows that 68% (15/22)of the scores are dispersed
with in 1 standard deviation of the mean. 100% of
the post test scores are also dispersed with in 1 to 2
standard deviation from the mean.
75
100100100
125125
150150150
175175175
200200200200
225
250250
300
325325
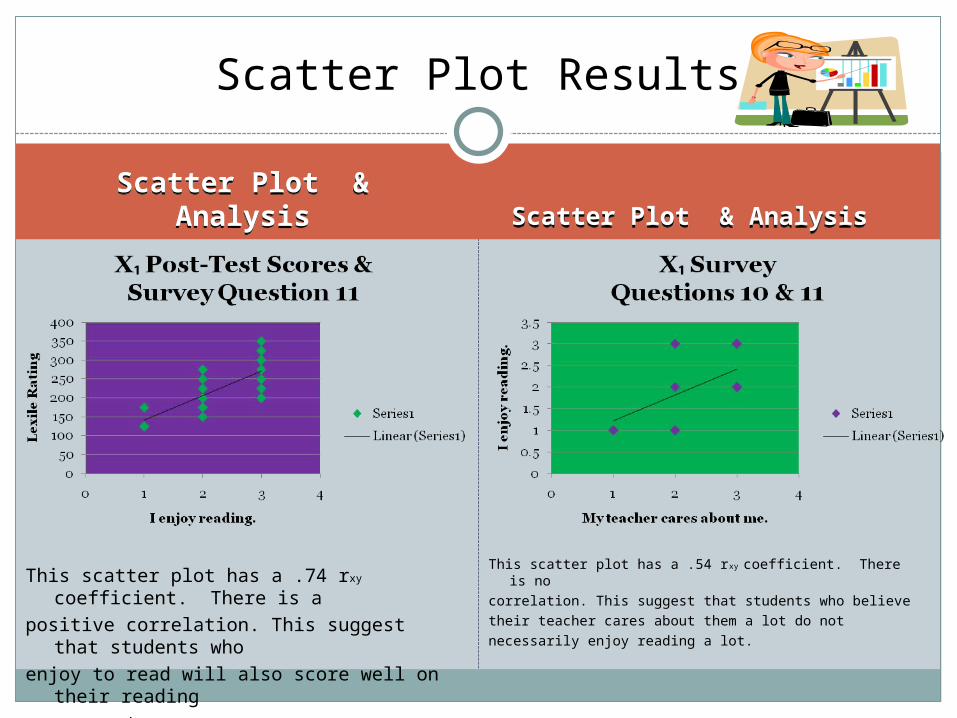
Scatter Plot & AnalysisScatter Plot & Analysis
This scatter plot has a .54 rxy coefficient. There is no
correlation. This suggest that students who believe
their teacher cares about them a lot do not
necessarily enjoy reading a lot.
Scatter Plot Results
Scatter Plot & AnalysisScatter Plot & Analysis
This scatter plot has a .74 rxy coefficient. There is a
positive correlation. This suggest that students who
enjoy to read will also score well on their reading
assessment.

Scatter Plot & AnalysisScatter Plot & Analysis
This scatter plot has a .78 rxy coefficient. There is
strong positive correlation. This suggest that
students who believe their teacher cares about them
a lot also enjoys reading a lot.
Scatter Plot Results
Scatter Plot & AnalysisScatter Plot & Analysis
This scatter plot has a .64 rxy coefficient. There is a
positive correlation. This suggest that students who
enjoy to read will also score well on their reading
assessment.

Discussion
There is a link to teacher’s classroom management style to student academic
achievement.
The findings in the action research project indicates that when teachers utilize classroom management techniques that take into consideration the teacher’s authority as well as the student’s emotions, a hybrid, there is an increase in the academic success of the students.
The results support the research: - Class X₁ and X₂ had the same intervention using classroom
management style, lesson plans, and assessments. - Pre-test: Class X₁ and Class X₂ had an average that was
similar.- Post-test: Class X₁ had an overall increase of 59 points in
reading levels. Class X₂ had an overall increase of 43.18 points. Class X₁ did slightly better than Class X₂ .

• Although the action research shows that a change in classroom management techniques improved reading levels in Class X₁ and X₂ :
- More research needs to be done.
- More participants are needed.
- A longer study needs to be conducted.
Implication

The End!


