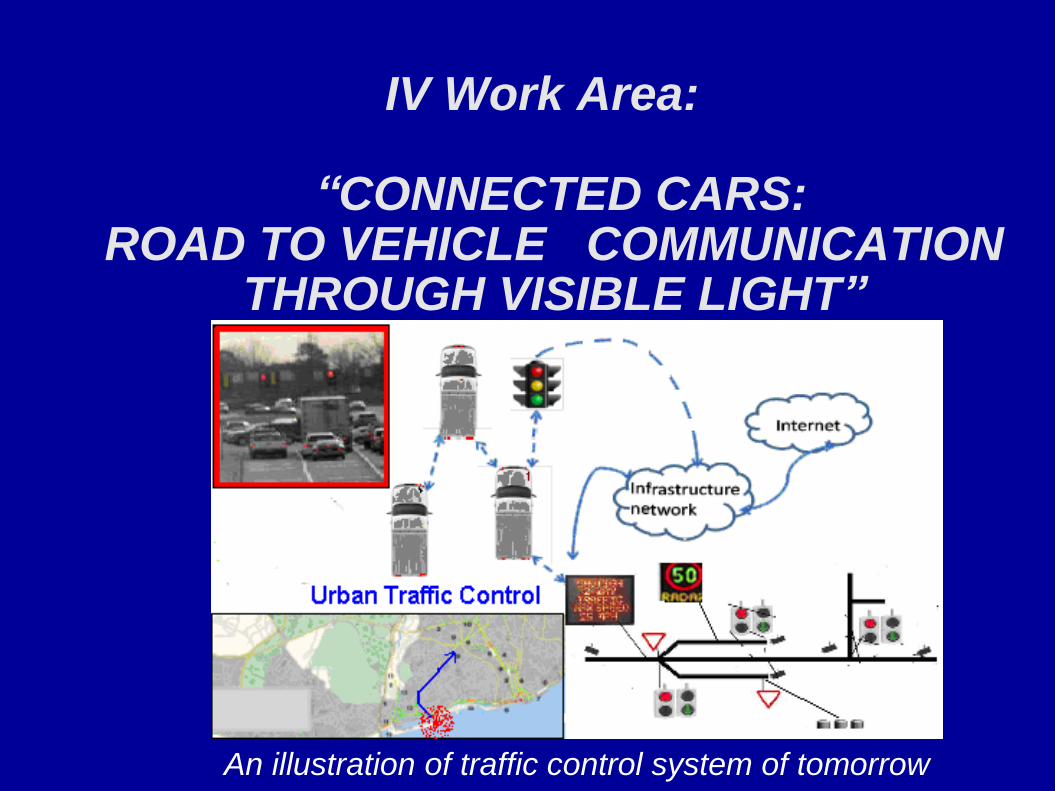
IV Work Area:
“CONNECTED CARS: ROAD TO VEHICLE COMMUNICATION
THROUGH VISIBLE LIGHT”
An illustration of traffic control system of tomorrow

Transmitters V1
V2
001 010 011
Receivers
001 010 011
001 010 011
I2V
V2VV2I
V3
I2V, V2V, V2I optoelectronic WDM cooperative vehicular system enables direct communication between vehicles, roadside infrastructure and traffic lights control
Motivation and Objectives

Outline
• Connected vehicles model Transmitters and Receivers
• Cooperative VLC System Evaluation and proof of concept.
• Conclusions and future trends.
• I2V, V2V and V2I communications

0.0 0.5 1.0 1.5 2.0 2.5
0.5
1.0
#7
#9
#1d
15d14
d13d
12
d11d
10
d9d
8
d7d
6
d5
d4d
3d2d
1d0
V
B
G
R
0 0 0 00 0 0 10 0 1 00 0 1 10 1 0 00 1 0 1
0 1 1 00 1 1 1
1 0 0 01 0 0 1
1 0 1 01 0 1 1
1 1 0 01 1 0 1
1 1 1 01 1 1 1
R G B V
Norm
alized M
UX
sig
nal
Time (ms)
0.0 0.5 1.0 1.5 2.0 2.50.0
0.5
1.0
0101 (#7)
1100 (#9)
1111 (#1)
RGBV
IDSync Payload data
V2,3
B2,4
G3,3
R3,4
Norm
alized M
UX
sig
nal
Time (ms)
State of art: MUX/DEMUX techniques
•The output presents 24 ordered levels each one related with RGBV bit sequences
RG
V B
12
4
5
67
8
9
3
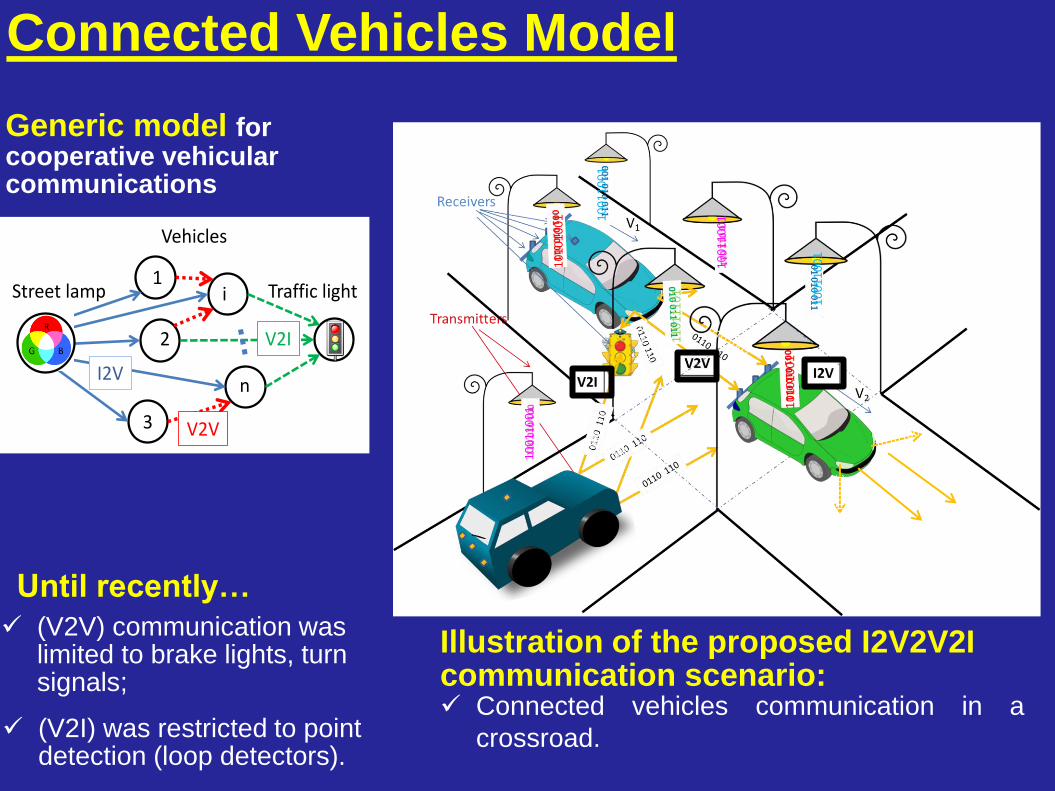
Connected Vehicles Model
1
2
3
i
n
Street lamp Traffic light
I2V
V2V
V2I
Vehicles
Generic model for cooperative vehicular communications
Illustration of the proposed I2V2V2I communication scenario: Connected vehicles communication in a
crossroad.
Until recently…
(V2V) communication was limited to brake lights, turn signals;
(V2I) was restricted to point detection (loop detectors).
10
01
10
01
11
01
11
01
10
01
10
01
10
10
10
01
10
01
10
01
10
01
10
01
10
10
10
01
10
10
10
01

Generated joint footprints
RG
V B
12
4
5
67
8
9
3
Unit cell
•Four modulated LEDs (RGBV) located •at the corners of a square grid.
R1,2G1,1
V2,3V2,1
R1,4
B2,2
G1,3
R3,2G3,1 G3,3
V4,3V4,1 B4,2
G1,5
V2,5
G3,5
V4,5
R5,2G5,1 R5,4G5,3 G5,5
B4,4
B2,4
R3,4
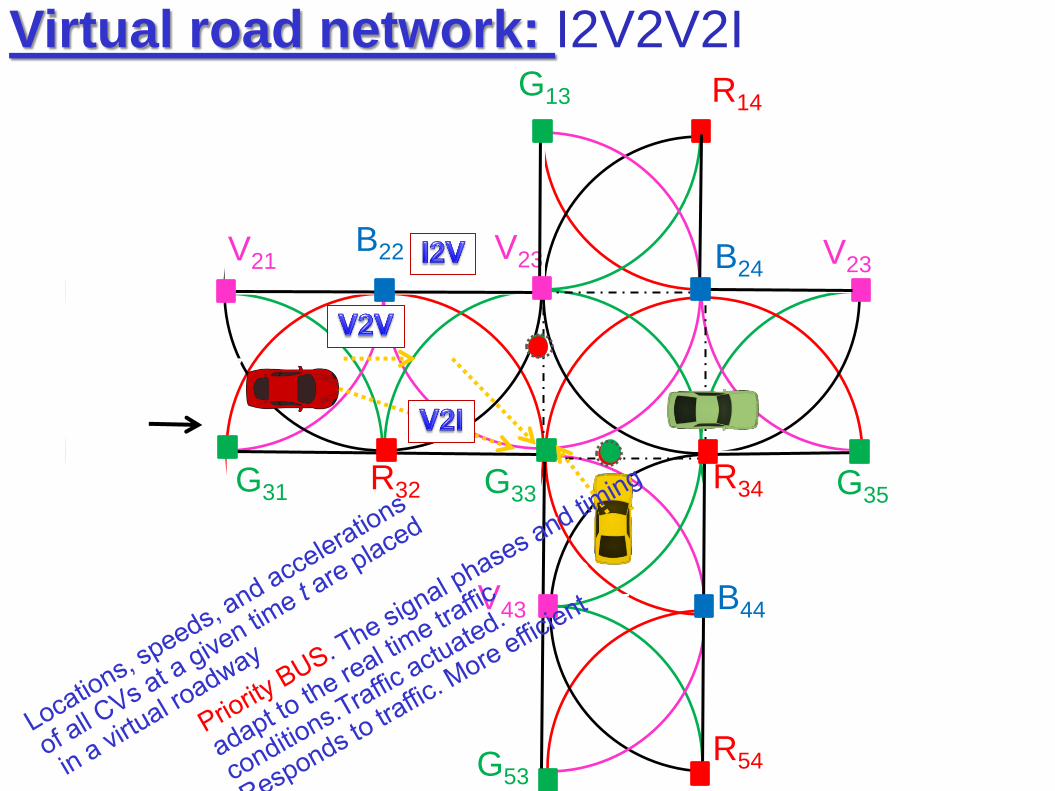
Promising benefits expected from safety and mobility improvements at the road network
Lighting plan

0.0 0.5 1.0 1.5 2.0 2.5
payload dataIDSync.
[data transmission][10101] [r r r: c c c]
V2,3
B2,4
G3,3
R3,4
Codew
ord
(R
GB
V)
Time (ms)
I2V : the street lamp (transmitter) sends a message to the SiC receiver, located at the rooftop. V2V: the information is resent to a leader vehicle, using the headlights as transmitters, .
Receiver SiC pinpin
Transmitter RGB-LED
400 500 600 700 8000.0
0.2
0.4
0.6
0.8
1.0
B
G
R
Inte
nsity (
a.u
.)
Wavelength (nm)
I2V2V system design
Representation of the I2V2V communication (working principle for the prototype)
Relative speed???
I
V
V
The structure of the frame is a classical one
The message begins with 5 synchronization bits The rest of the frame consists of 6 ID´s bits, data bits and stop bit.
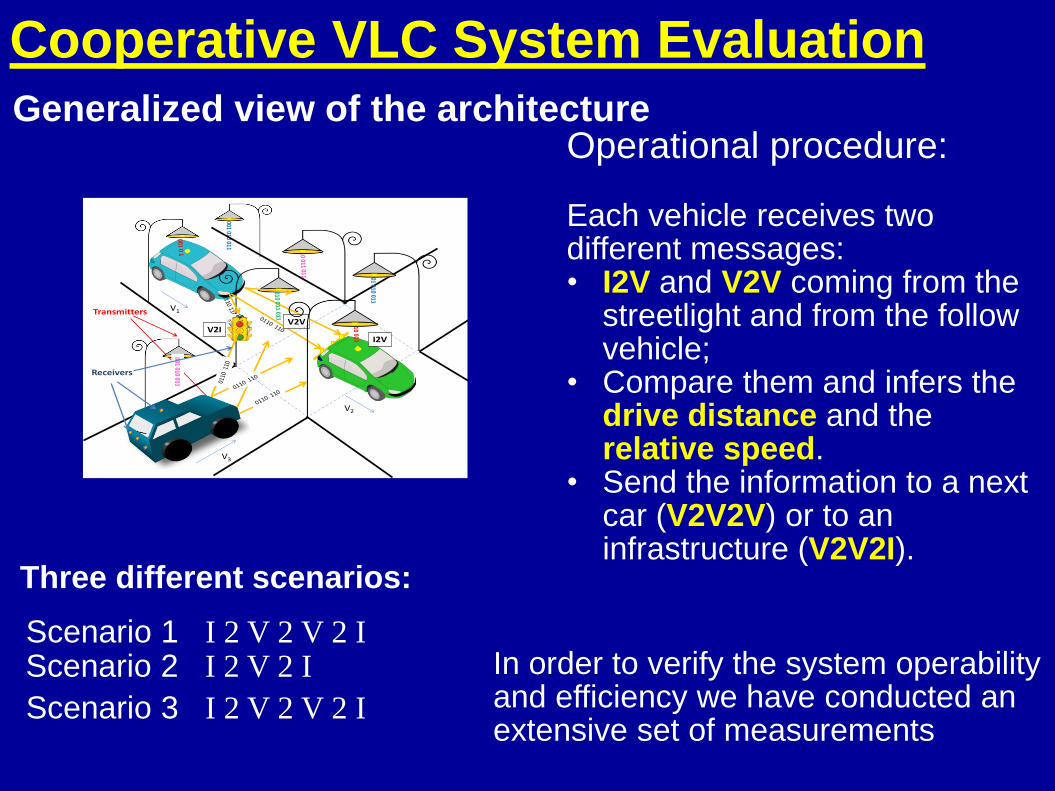
Cooperative VLC System Evaluation
Three different scenarios:
Scenario 1 I 2 V 2 V 2 I Scenario 2 I 2 V 2 I
Scenario 3 I 2 V 2 V 2 I
In order to verify the system operability and efficiency we have conducted an extensive set of measurements
Operational procedure: Each vehicle receives two different messages: • I2V and V2V coming from the
streetlight and from the follow vehicle;
• Compare them and infers the drive distance and the relative speed.
• Send the information to a next car (V2V2V) or to an infrastructure (V2V2I).
Generalized view of the architecture
Transmitters V1
V2
001 010 011
Receivers
001 010 011
001 010 011
I2V
V2VV2I
V3

Dv=…. Dt=….
0.0 0.5 1.0 1.5 2.0 2.50
1
2
3
4
5
RGBV
[0101]
[1010]
[1111]
I2V
IDSync Payload data
#3
#7
#1
V2,3
B2,2
G3,3
R3,2
MU
X (
A)
Time (ms)
Scenario 1: I2V2V2I
0.0 0.5 1.0 1.5 2.0 2.50.0
0.5
1.0
S
W
B2,2
R3,2
RGBV
[0011]
[1010]
V2I
IDSync Payload data
#3 (W, t1)
#5 (S, t2)
V4,3
B4,4
MU
X (
A)
Time (ms)
0.0 0.5 1.0 1.5 2.0 2.50.0
0.5
1.0
1010#P3 (W, t
3)
0101
1111
RGBV
IDSync Payload data
#P7 (W, t1)
#P1 (W, t2)
V2,1
B2,2
G3,1
R3,2
V2V
MU
X (
A)
Time (ms)
Request time: t1
Vehicle 1 sends the request message to the infrastructure (V2I) and informs the signal controller that this vehicle desires service (often called “demand” for service).
Data collected from connected vehicles provides a
much more complete picture of the traffic states near an intersection
Dv=…. Dt=….
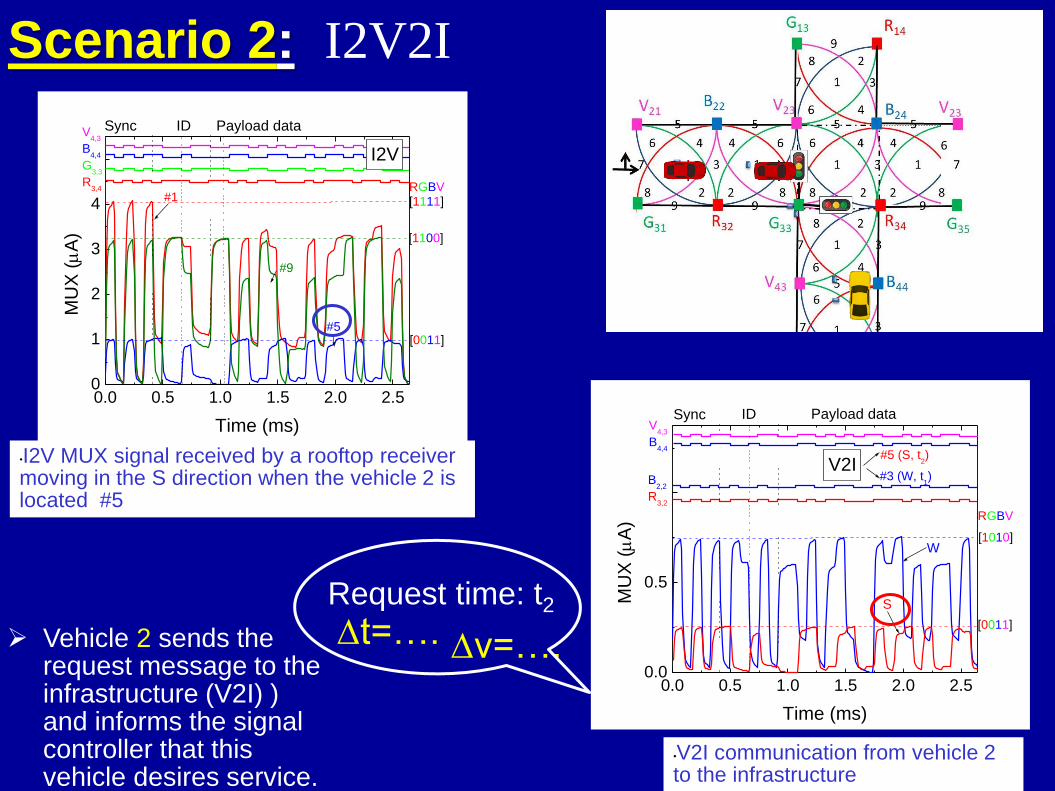
Scenario 2: I2V2I
Request time: t2
0.0 0.5 1.0 1.5 2.0 2.50.0
0.5
1.0
S
W
B2,2
R3,2
RGBV
[0011]
[1010]
V2I
IDSync Payload data
#3 (W, t1)
#5 (S, t2)
V4,3
B4,4
MU
X (
A)
Time (ms)
0.0 0.5 1.0 1.5 2.0 2.50
1
2
3
4
5 I2V
[0011]
[1100]
[1111]RGBV
IDSync Payload data
#9
#5
#1
V4,3
B4,4
G3,3
R3,4
MU
X (
A)
Time (ms)
•I2V MUX signal received by a rooftop receiver moving in the S direction when the vehicle 2 is located #5
•V2I communication from vehicle 2 to the infrastructure
Vehicle 2 sends the request message to the infrastructure (V2I) ) and informs the signal controller that this vehicle desires service.

0.0 0.5 1.0 1.5 2.0 2.50.0
0.5
1.0
1010#P3 (W, t
3)
0101
1111
RGBV
IDSync Payload data
#P7 (W, t1)
#P1 (W, t2)
V2,1
B2,2
G3,1
R3,2
V2V
MU
X (
A)
Time (ms)
Dv=…. Dt=….
Scenario 3: I2V2V2I
Request time: t3
Pedestrian-only stage (01 phase) two single-lane road phases
Phasing of traffic flows
Vehicle 3 sends the request message to the infrastructure (V2I) and to the leader (V2V)
Vehicle’s intersection access time is defined as the time at which the head of the vehicle enters the intersection area
From a capacity point of view is more efficient, if Vehicle 3 is given access before Vehicle 2
G13
1
1
2
4 5
6
8
9 8
4
6
2
3
3
4
2 9
1 1
1
7
4 6 6
8 8
8
5
7
2
2
6 4
7
R14
3
3
1
B22 V21 V23 V23 B24
7
5 5 5
9
V43 B44
G33 R32 G31 R34 9
G35
7
6 4
1
3
3
2 8 R54 9
4 6
7
2 8
G53
9
Virtual road network: I2V2V2I NETWORK

13
Horizon 2020
Transport virtual info day
The event will present the following 2019 calls for funding making available a total of nearly €355 million Mobility for Growth Automated Road Transport Green Vehicles Next Generation Batteries

Light-activated pi’n/pin a-SiC:H devices combines the demultiplexing operation with the simultaneous photodetection and self amplification.
Connected vehicles information from the network (I2V), vehicular interaction (V2V) and infrastructure (V2I) is analyzed.
A generic model of cooperative transmissions for vehicular communications services is established.
Conclusions
The experimental results, confirmed that the proposed cooperative VLC architecture is appropriate for the control and management of a traffic light controlled crossroad network. Two-level optimization: phase sequence and duration.
1
2
3
i
n
Street lamp Traffic light
I2V
V2V
V2I
Vehicles
Transmitters V1
V2
001 010 011
Receivers
001 010 011
001 010 011
I2V
V2VV2I
V3

DIGITAL CITY The place for
● innovation strategies framework ● product development ● continued growth
even in difficult times
Optical communications strategies Future research directions
Examples of visualizations of urban dynamics
-Representation of traffic flows a) b)
-Aggregated data from cell phones during two special event c) d)
The Heartbeat of a smarter Society


