FINAL REPORT
Secure Automated Microgrid Energy System (SAMES)
ESTCP Project EW-201340
DECEMBER 2016
Kevin Meagher Power Analytics Corporation
Distribution Statement A
This document has been cleared for public release

Page Intentionally Left Blank

This report was prepared under contract to the Department of Defense Environmental Security Technology Certification Program (ESTCP). The publication of this report does not indicate endorsement by the Department of Defense, nor should the contents be construed as reflecting the official policy or position of the Department of Defense. Reference herein to any specific commercial product, process, or service by trade name, trademark, manufacturer, or otherwise, does not necessarily constitute or imply its endorsement, recommendation, or favoring by the Department of Defense.

Page Intentionally Left Blank

REPORT DOCUMENTATION PAGE Form Approved
OMB No. 0704-0188 Public reporting burden for this collection of information is estimated to average 1 hour per response, including the time for reviewing instructions, searching existing data sources, gathering and maintaining the data needed, and completing and reviewing this collection of information. Send comments regarding this burden estimate or any other aspect of this collection of information, including suggestions for reducing this burden to Department of Defense, Washington Headquarters Services, Directorate for Information Operations and Reports (0704-0188), 1215 Jefferson Davis Highway, Suite 1204, Arlington, VA 22202-4302. Respondents should be aware that notwithstanding any other provision of law, no person shall be subject to any penalty for failing to comply with a collection of information if it does not display a currently valid OMB control number. PLEASE DO NOT RETURN YOUR FORM TO THE ABOVE ADDRESS. 1. REPORT DATE (DD-MM-YYYY) 04-20-2017
2. REPORT TYPE Final Technical Report
3. DATES COVERED (From - To) 07/2013-04/2017
4. TITLE AND SUBTITLE
5a. CONTRACT NUMBER
Secure Automated Microgrid Energy System (SAMES)
5b. GRANT NUMBER
5c. PROGRAM ELEMENT NUMBER
6. AUTHOR(S)
5d. PROJECT NUMBER EW-201340
5e. TASK NUMBER 5f. WORK UNIT NUMBER 7. PERFORMING ORGANIZATION NAME(S) AND ADDRESS(ES)
Power Analytics 9208 Falls of Neuse Rd #215 Raleigh, NC 27615
8. PERFORMING ORGANIZATION REPORT NUMBER
9. SPONSORING / MONITORING AGENCY NAME(S) AND ADDRESS(ES) 10. SPONSOR/MONITOR’S ACRONYM(S)
Environmental Security Technology Certification Program 4800 Mark Center Drive, Suite 17D03 Alexandria, VA 22350
ESTCP 11. SPONSOR/MONITOR’S REPORT NUMBER(S) EW-201340
12. DISTRIBUTION / AVAILABILITY STATEMENT Unlimited
13. SUPPLEMENTARY NOTES
14. ABSTRACT The sound bite: The objective of SAMES is the creation and operation of a secure microgrid cluster. The cluster maximizes energy security and efficiency at the lowest possible operating cost. The microgrids are at three geographically separated naval bases in San Diego, with their monitoring and control combined in an enterprise-level system at the Naval Base San Diego Utility and Energy Operations Center. 15. SUBJECT TERMS
16. SECURITY CLASSIFICATION OF:
17. LIMITATION OF ABSTRACT
18. NUMBER OF PAGES
19a. NAME OF RESPONSIBLE PERSON Stephen C. Knapp
a. REPORT U
b. ABSTRACT U
c. THIS PAGE U
U 101
19b. TELEPHONE NUMBER (include area code) (919) 719-1753 Standard Form 298 (Rev. 8-98)
Prescribed by ANSI Std. Z39.18

Page Intentionally Left Blank
i
FINAL REPORT Project: EW-201340
TABLE OF CONTENTS
Page
EXECUTIVE SUMMARY ...................................................................................................... ES-1
1.0 MICROGRID CLUSTER INTRODUCTION ....................................................................... 1 1.1 BACKGROUND .......................................................................................................... 1 1.2 OBJECTIVES OF THE DEMONSTRATION ............................................................. 2 1.3 REGULATORY DRIVERS ......................................................................................... 2
1.3.1 Executive Order 13514 of October 2009...................................................................... 2 1.3.2 Executive Order 13423 of January 2007 ...................................................................... 3 1.3.3 SECNAV Instruction 4101.3 ........................................................................................ 3 1.3.4 Department of the Navy Smart Power Partnership Initiative (SPPI) ........................... 5
2.0 TECHNOLOGY DESCRIPTION ......................................................................................... 7 2.1 TECHNOLOGY DEVELOPMENT ............................................................................. 7 2.2 ADVANTAGES AND LIMITATIONS OF THE TECHNOLOGY .......................... 12
2.2.1 Cost Advantages ......................................................................................................... 12 2.2.2 Performance Limitations ............................................................................................ 12 2.2.3 Cost Limitations ......................................................................................................... 13 2.2.4 Social Acceptance ...................................................................................................... 13 2.2.5 Comparison to Existing Technology .......................................................................... 13
3.0 PERFORMANCE OBJECTIVES ....................................................................................... 15 3.1 QUANTITATIVE PERFORMANCE OBJECTIVES ................................................ 17
3.1.1 Use Case A: Operating the Microgrid While Connected to the Utility ...................... 17 3.1.2 Use Case B: Separating the Microgrid from the Utility ............................................. 18 3.1.3 Use Case C: Operating the Microgrid while Separated from the Utility .................... 19 3.1.4 Use Case D: Connecting the Microgrid to the Utility ................................................ 20 3.1.5 Performance Objective Area 1: Critical Event or Demand Reduction Event ............ 21 3.1.6 Performance Objective Area 2: Non-critical microgrid energy management ............ 21 3.1.7 Performance Objective Area 3: Peak Shedding ......................................................... 21 3.1.8 Performance Objective Area 4: Data Collection during testing period ...................... 21 3.1.9 Performance Objective Area 5: Microgrid Uptime .................................................... 21 3.1.10 Performance Objective Area 6: Island Operations .................................................... 21
4.0 SITE/FACILITY DESCRIPTION ....................................................................................... 23 4.1 SITE/FACILITY LOCATION & OPERATIONS ..................................................... 23
4.1.1 Naval Base San Diego, San Diego, CA ...................................................................... 23 4.1.2 Naval Base Coronado, San Diego, CA ....................................................................... 24 4.1.3 Naval Base Point Loma, San Diego, CA .................................................................... 24
4.2 SITE/FACILITY IMPLEMENTATION CRITERIA ................................................. 25
TABLE OF CONTENTS (Continued)
Page
ii
4.2.1 Site-Related Permits & Regulations ........................................................................... 25
5.0 TEST DESIGN & ISSUE RESOLUTION .......................................................................... 27 5.1 CONCEPTUAL EXPERIMENTAL DESIGN ........................................................... 27
5.1.1 Study Hypothesis ........................................................................................................ 27 5.2 BASELINE CHARACTERIZATION ........................................................................ 29
5.2.1 Baseline & Operational Data Collection .................................................................... 29 5.3 SAMPLING METHODS & PROTOCOL.................................................................. 30
5.3.1 Data Description ......................................................................................................... 30 5.3.2 Data Collectors ........................................................................................................... 31
5.4 SAMPLING RESULTS .............................................................................................. 31 5.4.1 Scenarios & Relevant Time-Series Analysis .............................................................. 31 5.4.2 Equations Used: .......................................................................................................... 44
5.5 NAVAL BASE SCENARIOS: ................................................................................... 44 5.5.1 Scenario 1: .................................................................................................................. 44 5.5.2 Scenario 2: .................................................................................................................. 47 5.5.3 Scenario 3: .................................................................................................................. 51 5.5.4 Scenario 4: .................................................................................................................. 52 5.5.5 Scenario 5: .................................................................................................................. 55 5.5.6 Scenario 6: .................................................................................................................. 56 5.5.7 Conclusion .................................................................................................................. 58 5.5.8 Discussion .................................................................................................................. 59
5.6 DATA STORAGE & BACKUP ................................................................................. 59 5.7 EQUIPMENT CALIBRATION & DATA QUALITY ISSUES ................................ 60
5.7.1 Equipment Calibration ............................................................................................... 60
6.0 COST ASSESSMENT ......................................................................................................... 61 6.1 COST ANALYSIS & COMPARISON ...................................................................... 62
7.0 IMPLEMENTATION ISSUES ........................................................................................... 63 7.1 CONNECTING TO THE REAL-TIME DATA ......................................................... 63 7.2 DEMONSTRATING CONTROL .............................................................................. 63 7.3 DATA ACCESS ......................................................................................................... 63 7.4 HOST COOPERATION ............................................................................................. 63
8.0 TECHNOLOGY TRANSFER ............................................................................................. 65
9.0 RESULTS PRESENTATIONS ........................................................................................... 67 A-1 INTRODUCTION MIRRORED SITE – COLORADO STATE UNIVERSITY,
FORT COLLINS ........................................................................................................ 67 A 1.1 Background.................................................................................................................... 67 A 1.2 Objectives of the Demonstration ................................................................................... 67 A 1.3 Regulatory Drivers ........................................................................................................ 68
A 2.0 TECHNOLOGY DESCRIPTION ............................................................................. 68
TABLE OF CONTENTS (Continued)
Page
iii
A 2.1 Technology Development ............................................................................................. 68 A 2.3 Advantages and Limitations of the Technology ............................................................ 68
A 3.0 PERFORMANCE OBJECTIVES .............................................................................. 68 A 4.0 SITE/FACILITY DESCRIPTION ............................................................................. 72 A 5.0 TEST DESIGN .......................................................................................................... 73
10.0 REFERENCES .................................................................................................................... 85
APPENDIX A MANAGEMENT AND STAFFING ............................................................. A-1
APPENDIX B SAMES CONFIGURATION USED AT FIELD SITES ............................... B-1
APPENDIX C PATENTS OR SCIENTIFIC/TECHNICAL AWARDS/ HONORS/ PROTOCOLS/ USER-GUIDES ........................................................................................ C-1
APPENDIX D OVERVIEW OF POWER ANALYTICS CORPORATION ........................ D-3
APPENDIX E INTEGRATION METHODOLOGY .............................................................. E-1
APPENDIX F DESCRIPTION OF DATA ............................................................................. F-7

iv
LIST OF FIGURES
Page
Figure 1. Components of Microgrid Mission Surety ...................................................................... 2 Figure 2. Naval Base Coronado, One Line Power Model .............................................................. 4 Figure 3. Naval Base Coronado, Real-Time Operations Desk ....................................................... 5 Figure 4. NAVFAC ICS Support Network ..................................................................................... 8 Figure 5. NAVFAC SW Server Room - Building 121 ................................................................... 9 Figure 6. NAVFAC SW Main Dashboard Screen ........................................................................ 11 Figure 7. Microgrid Use Cases ..................................................................................................... 16 Figure 8. Aerial View of the Three Naval Bases .......................................................................... 23 Figure 9. Naval Base San Diego, Aerial View ............................................................................. 24 Figure 10. Naval Base Coronado, Aerial View ............................................................................ 24 Figure 11. Naval Base Point Loma, Aerial View ......................................................................... 25 Figure 12. SAMES, Software Architecture .................................................................................. 28 Figure 13. Data Collection Timeline ............................................................................................ 30 Figure 14. Energy Consumption at Buildings 1-7, Naval Medical Center ................................... 35 Figure 15. kWh Hourly Breakdown, Naval Medical Center ........................................................ 35 Figure 16. Energy Consumption by Month, Naval Medical Hospital .......................................... 36 Figure 17. Energy Consumption Medical Center vs. San Diego Daily Temp .............................. 36 Figure 18. Naval Base Point Loma Energy Consumption. – Dec 2014 and Jan 2015 ................. 37 Figure 19. Naval Base Point Loma, Meters Consumption kWh................................................... 38 Figure 20. Naval Base Point Loma, Hourly Energy Consumption............................................... 38 Figure 21. Point Loma Consumption. vs. Average Daily SD Temp, Rain, Wind ........................ 39 Figure 22. Point Loma, Box and Whisker Plot, Hourly Sum of Consumption ............................ 40 Figure 23. Naval Base Coronado, Daily Energy Consumption .................................................... 41 Figure 24. Coronado, Box & Whisker Plot, Hourly Sum of Consumption .................................. 42 Figure 25. Coronado, Hourly Sum of Consumption by Month .................................................... 43 Figure 26. Coronado, Distribution of Energy Consumption......................................................... 43 Figure 27. Coronado, Consumption vs Average Daily SD Temp, Rainfall, Wind ....................... 44 Figure 28. Naval Base Point Loma, One Line, Solar Panel Array ............................................... 45 Figure 29. Naval Base Point Loma, Aerial View ......................................................................... 45 Figure 30. Building 66 Point Loma .............................................................................................. 46 Figure 31. Point Loma Solar Production ...................................................................................... 47 Figure 32. Naval Medical Center, One Line, Building 8, Solar Panels ........................................ 47 Figure 33. Naval Medical Center, Aerial View ............................................................................ 48 Figure 34. Naval Medical Center, Building 8, Aerial View ......................................................... 49 Figure 35. Naval Medical Center, Building 8, Solar Panel Performance ..................................... 50 Figure 36. Naval Medical Center, Building 8, Solar Panel Performance ..................................... 50 Figure 37. Naval Medical Center, Building 1, Aerial View ......................................................... 51
LIST OF FIGURES
Page
v
Figure 38. Naval Medical Center, Building 1, One Line .............................................................. 52 Figure 39. Med Center, Build 1, Average Daily Consumption vs. Daily Solar ........................... 52 Figure 40. One Line Grace Murray Hopper Service Center - (L13) ............................................ 53 Figure 41. Scenario 4, Power Factor ............................................................................................. 54 Figure 42. Scenario 4, Daily Energy Usage .................................................................................. 54 Figure 43. Hospital, Building 7, Consumption and Solar Prod. ................................................... 55 Figure 44. Medical Building 7, Actual. vs Decrease in Consumption w/Microgrid .................... 56 Figure 45. Damage from Hurricane Odile, San Diego, 2014 ....................................................... 56 Figure 46. Naval Medical Center, Energy Consumption, September 2014.................................. 57 Figure 47. Integrid Lab at the CSU Power House ........................................................................ 72 Figure 48. Integrid Lab at the CSU Power House Control Room ................................................ 73 Figure 49. CSU Power House Equipment .................................................................................... 73 Figure 50. Dashboard Monitoring Screen CSU ............................................................................ 74 Figure 51. Scenario 1: Utility (no SGs, no DERs) ....................................................................... 74 Figure 52. Scenario 2: Utility + DERs (no SGs) ......................................................................... 75 Figure 53. Scenario 3: Utility + SGs + DERs .............................................................................. 75 Figure 54. Scenario 4: Loss of Utility .......................................................................................... 76 Figure 55. Scenario 5 - Load Shedding (no Utility, no DERs) ..................................................... 76 Figure 56. Scenario 6: 100% DERs ............................................................................................. 77 Figure 57. CSU Power House One Line, Dashboard View .......................................................... 77 Figure 58. Power Flow Study Based on Power Scenarios ............................................................ 78 Figure 59. Power Generated by the Various Scenarios ................................................................ 79 Figure 60. 3Ph short circuit Current (kA) ANSI/IEEE Method ................................................... 80 Figure 61. Impact of Short Circuit on Scenarios .......................................................................... 80 Figure 62. Arc Flash Analysis CSU Power House ....................................................................... 81 Figure 63. N-1 Contingency Screening & Voltage Stability ........................................................ 82 Figure 64. Most Secure Scenario (N-1) ........................................................................................ 82 Figure 65. Optimized for Most Control, Most Savings ................................................................ 83 Figure 66. Advanced Transient Stability, Modeling ................................................................... D-4 Figure 67- Advanced Transient Stability, Motor Starting Simulation ........................................ D-5 Figure 68. Advanced Transient Stability, Results ...................................................................... D-6
vi
LIST OF TABLES
Page
Table 1. Performance Objectives .................................................................................................. 15 Table 2. Cost Assessment ............................................................................................................. 61 Table 3 - Cost Comparison ........................................................................................................... 62 Table 4. Technology Transfer ....................................................................................................... 66 Table A 5. Scenario linkage to power analysis ............................................................................. 70 Table A 6. Use Case Results - CSU .............................................................................................. 71

vii
ACRONYMS AND ABBREVIATIONS
AAA authentication, authorization and accounting AMI Advanced Metering Infrastructure ATO authority to operate ATS Automatic Transfer Switches C&A certification and accreditation CA SGIP California Self Generation Incentive Program CAC common access card CAISO California Independent Service Operator CEC California Energy Commission CHP Combined Heat and Power CIO Chief Information Officer DCS Distributed Control System DER Distributed Energy Resources DIACAP Defense Information Assurance Certification and Accreditation Process DoD Department of Defense DoDI Department of Defense Instruction DOE Department of Energy DoN Department of Navy FAA Federal Aviation Administration ESTCP Environmental Security Technology Certification Program HBSS host-based security system IA information assurance ISO Independent Service Operator IT Information Technology MPMS Microgrid Power Management System NAVFAC SW Naval Facilities Engineering Command Southwest NBC Naval Base Coronado NBPL Naval Base Point Loma NBSD Naval Base San Diego NIDS network intrusion detection system NMCI Navy/Marine Corps Intranet PCC point(s) of common coupling PKI public key infrastructure PV PhotoVoltaic

viii
RBAC role-based access control RESCO Renewable Energy Secure Community ROI Return on Investment SAMES Secure Automated Microgrid Energy System SCADA supervisor control and data acquisition systems SCED Security Constrained Economic Dispatch SDG&E San Diego Gas and Electric SDOSB Secure Distributed Operations Service Bus SGM Secure Grid Management SIEM Security Information and Event Managers SOA Service Oriented Architecture SPMS SmartGrid™ Power Management System SPPI Smart Power Purchase Initiative UEOC Utility and Energy Operations Center UCSD University of California San Diego

ix
ACKNOWLEDGEMENTS
The SAMES project would not have been possible without the help of the team at NAVFAC South West, the support of the ESTCP Committee and the team members, Spirae, Conner Networks, OSI Soft, and Viridity Energy.
In particular, the SAMES team wants to thank Stephen C. Knapp (PE, Executive Director, Power Analytics), Melissa Wiel (Senior Data Scientist), John Arterberry (Program Manager), N. Taylor Brockman (Chief Technology Officer), Sean McGovern (North Carolina State University Intern), Dr. Laura Baker (NAVFAC), Dr. Vahid Salehi (Senior Power Engineer), Oliver Pacific (CTO, Spirae) and Joan Ward (Markets & Financial Consultant)

x
Page Intentionally Left Blank

xi
ABSTRACT
The objective of SAMES is the creation and operation of a secure microgrid cluster. The cluster maximizes energy security and efficiency at the lowest possible operating cost. The project study microgrids are at three geographically separated naval bases in San Diego, with their monitoring and control combined in an enterprise-level system at the Naval Base San Diego Utility and Operations Center.

xii
Page Intentionally Left Blank
ES-1
EXECUTIVE SUMMARY
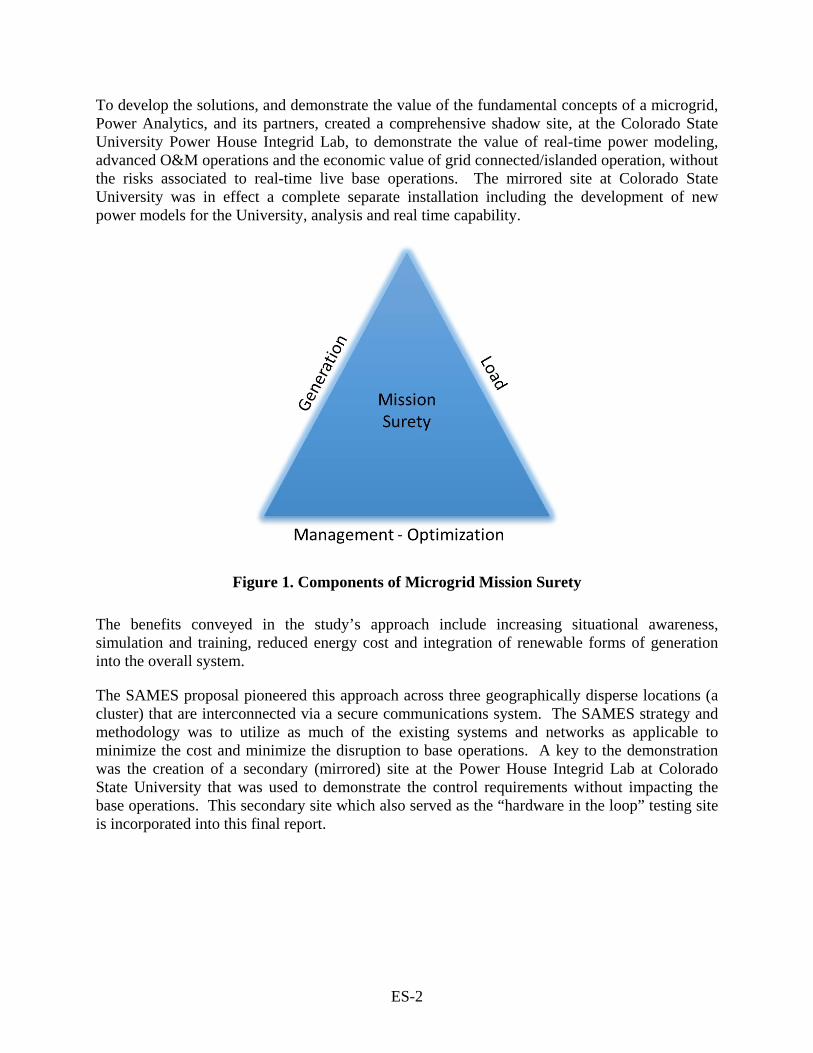
Local operational control over the production of energy is a priority throughout both military and civilian agencies. This control can be accomplished through the use of renewable energy generation organized within a microgrid. The single driving emerging technology today, at the core of the overall trend worldwide, is the development of distributed generation and renewable generation. Distributed generation, in the form of emergency standby generation, is an integral part of the current military war-readiness mission. The ability to incorporate existing generation, both in the form of emergency standby generation and other forms of renewable generation, including, but not limited to, photovoltaic and energy storage, comprise one side of the triad that is the integrated Microgrid (see Figure 1 below). Load management is another side of the triad, and the ability to manage and optimize the system for mission surety is the third side of the triad and the goal of the integrated resource Microgrid.
This report is comprised of two main focus areas:
A. All aspects associated with the three microgrid circuits on the bases in San Diego; including scenario analysis based on data acquired during the operational phases in San Diego, augmented with relevant time series data for weather.
B. The parallel (mirrored) effort at Colorado State University Power House.
To the best of the SAMES team's knowledge, this secure microgrid project is the first proposed cluster of microgrids ever attempted. The cluster concept was possible, in part, due to the existence of a secure fiber optic network covering all three bases. The application for wheeling of power was not proposed, nor practical, given the time constraints of the ESTCP process. Additional factors considered in this decision were the cost and intrusive nature that would require reconfiguring circuits to wheel power. Wheeling is defined as the transportation of electric energy (megawatt-hours) from within an electrical grid to an electrical load outside the grid boundaries. Two types of wheeling are 1) a wheel-through, where the electrical power generation and the load are both outside the boundaries of the transmission system and 2) a wheel-out, where the generation resource is inside the boundaries of the transmission system but the load is outside.
The system design was also heavily dependent on the creation and use of a very detailed power model, created off line, but implemented in a secure real-time environment. Critical power analysis, such as security constrained load flows, short circuit and real-time arc flash, were also key elements of the approach that have never been previously attempted. The fundamental value of the power system is, in fact, derived from real time power modeling to determine what is possible, how to continually optimize the system and how to integrate the inherent value of a real-time power model into the O&M (Operations and Maintenance) of base operations.
Lastly, while automated control is currently used in certain aspects of the base power operations, automated control logic requires extensive safety and security measures be addressed prior to implementation and integration into the automated control schemes.
ES-2
To develop the solutions, and demonstrate the value of the fundamental concepts of a microgrid, Power Analytics, and its partners, created a comprehensive shadow site, at the Colorado State University Power House Integrid Lab, to demonstrate the value of real-time power modeling, advanced O&M operations and the economic value of grid connected/islanded operation, without the risks associated to real-time live base operations. The mirrored site at Colorado State University was in effect a complete separate installation including the development of new power models for the University, analysis and real time capability.
Figure 1. Components of Microgrid Mission Surety
The benefits conveyed in the study’s approach include increasing situational awareness, simulation and training, reduced energy cost and integration of renewable forms of generation into the overall system.
The SAMES proposal pioneered this approach across three geographically disperse locations (a cluster) that are interconnected via a secure communications system. The SAMES strategy and methodology was to utilize as much of the existing systems and networks as applicable to minimize the cost and minimize the disruption to base operations. A key to the demonstration was the creation of a secondary (mirrored) site at the Power House Integrid Lab at Colorado State University that was used to demonstrate the control requirements without impacting the base operations. This secondary site which also served as the “hardware in the loop” testing site is incorporated into this final report.
1
1.0 MICROGRID CLUSTER INTRODUCTION
1.1 BACKGROUND
The Department of Defense (DoD) goal of improving energy security while reducing cost has been an ongoing mission. In 2012, the Department of the Navy (DoN), through its Smart Power Partnership Initiative (SPPI), looked to create a pilot regional smartgrid in San Diego. SPPI goals were to enhance energy security, reduce costs, integrate renewable power, and export the regional smartgrid concept to other regions. As noted by SPPI, military bases which have a high power demand or a high need for uninterrupted power are ideal candidates for microgrids. However, because of concerns about operational risks, DoD had not fully realized the potential value of its electrical infrastructure. A few stand-alone microgrids had been installed, and many emergency generation locations installed. In SAMES, we were able to demonstrate that a clustered microgrid can offer significant benefits and, in the process, identify areas of focus and challenges to address going forward.
There is significant dscussion throughout this report on the creation and use of a power model as the center of the SAMES system. The creation of a power model is very common in any power system design in order to verify that the design will support the anticiated power loads and generation. In addition, a power model is used for safety related analysis and study for protective devices (circuit breakers, relays and fuses for example). It was the case at the SAMES installations in San Diego that an existing power model was available to convert to the Power Analytics DesignBase model. The existing model(s) were created and modified over many years as the electrical infrastructure changed and was modified. The availability of the existing model significantly reduces the time and effort to create a unified power model as used by SAMES. The unified power model provides immediate feedback to identify any portion of the model under review where the previous model is either out of date or not accurate. The new unified model is also used to validate the real time data sources ensuring the real time values are consistent with the expected data from the model. This itterative process of model review and analysis is part of additional site visits to corrrect any equipment, cable, protective device data that is clearly inaccurate now that a unified power model is being reviewed.
The granularity of the real time data is used varies depending on the existing infrastruture (ie SCADA data, meter data, building management data) but the minimum resolution desired is samples of 15 minutes or less for analog values (voltage, current etc) and if possible less than 1 minute for protective device data (breakers, fuses, relays).
The cost and complexity of achieving a cyber secure microgrid, cluster of microgrids or advanced renewable generation requires integration with a variety of existing systems deployed.
To support its missions in cyberspace, the Defense Department conducts a range of activities outside of cyberspace to improve collective cybersecurity and protect U.S. interests. For example, the Defense Department cooperates with agencies of the U.S government, with the private sector, and with our international partners to share information, build alliances and partnerships, and foster norms of responsible behavior to improve global strategic stability.
2
1.2 OBJECTIVES OF THE DEMONSTRATION
This focus of the project is the three interconnected locations, based on existing circuits selected by NAVFAC SW, and using existing communications infrastructure (secure fiber optic), existing SCADA system (Telvent), existing building management system (Johnson Controls Metasys) and existing metering. One controllable SCADA system for the low voltage system was not integrated (Iconics) because of cyber security concerns, but data was used from the system for the development of scenarios for the site. The objectives of the demonstration were:
• Creating a centralized microgrid cluster for monitoring and control of power generation and consumption for the three noncontiguous naval bases: San Diego, Coronado, and Point Loma (see Figure 6);
• Providing comprehensive, real-time situational awareness so regional and base commanders can manage power as they manage other critical aspects of their missions. Situational awareness included the creation of three detailed power models for the selected circuits;
• Obtain existing power model(s), unify the models and integrate the models in Paladin DesignBase (detailed discussion in SECNAV Instruction 4101.3);
• Using information from the real-time cluster monitoring to optimize the use of assets (generation and load) and to create a baseline power model for the three bases updating with real time power flows;
• Demonstrating, through market participant simulations at the Colorado State University Power House Integrid Lab, the technology and processes needed to participate in the commercial (Wholesale) electric market, including workable communication protocols between the microgrid, the utility and the Independent System Operator (ISO);
• Developing an energy security model, for validating clustered microgrids. Power Analytics provided a detailed Request for Information of the Navy ICS based on the SAMES architecture;
• Integrating energy management functions on a cyber-secure platform to meet current Navy security standards and be adaptable and scalable for future requirements; and
• Assessing the challenges to create a technology roadmap for rapid global implementation of clustered military microgrids. − Leveraging technology to maximize the benefit of existing equipment; − Creating a flexible, scalable solution with alternative energy sources and energy storage.
1.3 REGULATORY DRIVERS
1.3.1 Executive Order 13514 of October 2009
This Executive Order mandates that federal agencies increase their energy efficiency and reduce greenhouse gas emissions. Specific goals include: increasing the use of renewable energy sources; developing and implementing innovative policies and practices to reduce greenhouse gas emissions; and increasing the effectiveness of local planning for locally generated renewable energy.
3
1.3.2 Executive Order 13423 of January 2007
This Executive Order mandates that Federal agencies conduct their energy-related activities in an environmentally, economically and fiscally sound, integrated, efficient, and sustainable manner. It also requires that agencies implement: renewable energy generation projects on their property; sustainable practices for energy efficiency and greenhouse gas emissions avoidance or reduction; and renewable energy sources.
The SAMES project contributes to achieving these goals by providing an enterprise system which can integrate power related activities across a cluster of geographically separated microgrids. The SAMES team developed documentation of benefits and options for additional analysis and control, as well as determine alternatives for the networks and software that provide monitoring, analyzing, control capabilities, assigning micro-grid power source, and sustainable practices for energy efficiency and greenhouse gas emissions avoidance or reduction.
1.3.3 SECNAV Instruction 4101.3
This Secretary of the Navy Instruction mandates the DoN to effectively manage energy consumption and lead in energy innovation. The foundation of SAMES is a key facilitator to the ability to integrate existing resources to the greatest extent possible for reliable, resilient, and redundant energy sources for critical assets. The Instruction notes that naval force success will depend greatly on the ability to make use of renewable and alternative energy sources, and requires installations to mitigate the risks posed from vulnerable energy supply systems by adopting and deploying energy efficient technologies and processes. The bases must reduce vulnerabilities to the electric grid by lowering their energy dependence and integrating security technologies which enable greater control of distribution.
The SAMES project was able to directionally show how adopting and deploying energy efficient technologies and processes satisfied several of these requirements. The innovations of this project increased the reliability of the existing electrical infrastructure by detecting potential failure points, thus allowing technical staff to correct the potential failure point before an outage occurred. The development of the baseline power model for each of the sites was a critical first step. The power models were developed based on existing power engineering data used for recent arc flash studies, and/or other related reports, made available to Power Analytics from NAVFAC SW (e.g., protective device coordination and short circuit studies).
Name plate data specific to significant consumers and producers of power were reviewed for the target circuits. The data collection included, but was not limited to, the subsets of the overall power distribution system, equipment types, network items, etc. Significant time was allocated to verify, validate and modify assumptions, based on results of interim analytics, which were key to the development of the model.
The previous power models included limited information on producers and consumers of power in the target circuits. The existing data was used to compare to the actual nameplate on the devices if access was possible. If access was not possible, manufacturer model information was used. Successive model iterations were run and available historical data used to compare predicted model results with historical data. Ultimately, this process produces a power model that is very accurate and remains accurate because the eventual integration of real time data from the various systems continuously updates the power model.
4
In effect, the power model becomes a real time “as built” record for all purposes. The concept of “as built” drawings is common in any power system installation to address changes in the system. It is also common that “as built” information and drawings are not correct or current over time because there is no process to ensure changes in equipment or infrastructure are documented and verified the way the combination of the power model and real time data is designed.
A power model can accurately determine if existing information is up to date, based on the results of the interim analytics. The SAMES project used available time series data from base facilities and real-time sources. Utilizing the power model, the SAMES team was able to demonstrate how renewable energy sources can be easily integrated into an existing base infrastructure. The microgrid management analytics of SAMES allows the bases to island from the local utility and/or contribute power back to the utility when the bases produce an excess energy source. The physical testing for these capabilities was demonstrated at the Colorado State University Power House in Fort Collins (Mirrored Site). The role of the microgrid in meeting the expectations of the military war readiness mission, and a good power citizen to the overall power grid, are embedded in the power model approach to operations. This improves the power grid for both the military installations and the local community, and allows the naval bases greater control over their electric power supply. In addition, the SAMES enterprise system provides the Navy command structure the same visibility over their power systems assets as they have over other aspects of their operational missions.
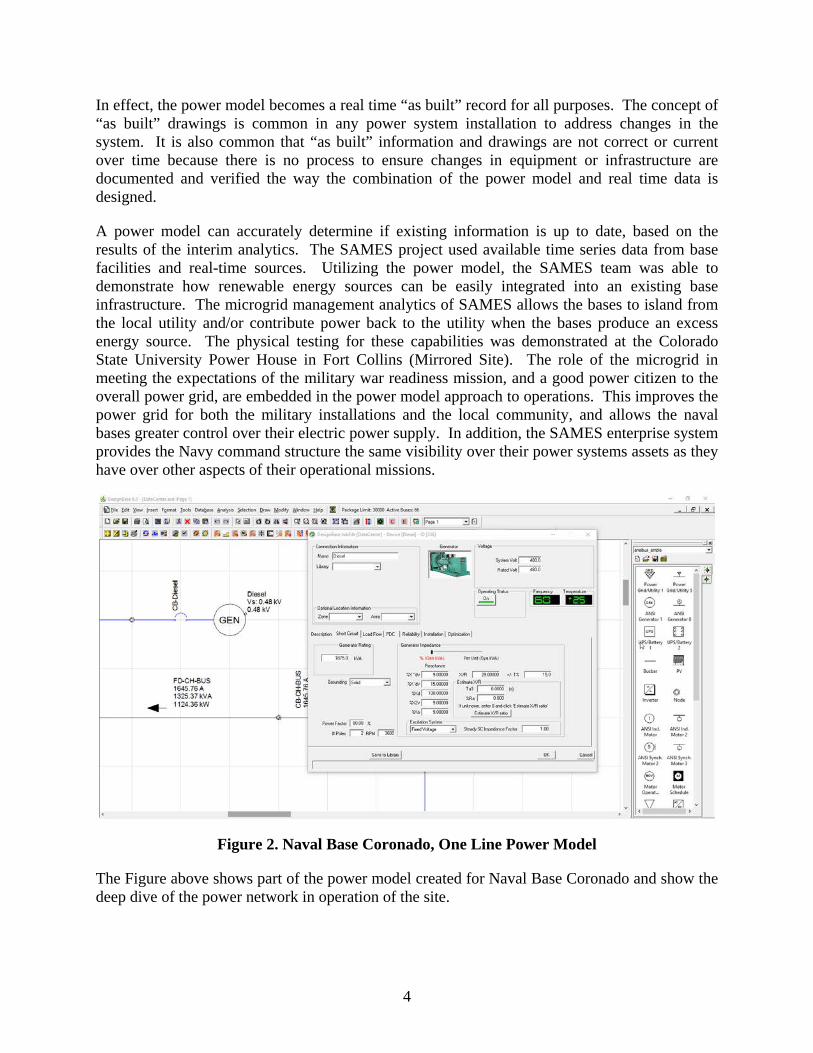
Figure 2. Naval Base Coronado, One Line Power Model
The Figure above shows part of the power model created for Naval Base Coronado and show the deep dive of the power network in operation of the site.
5
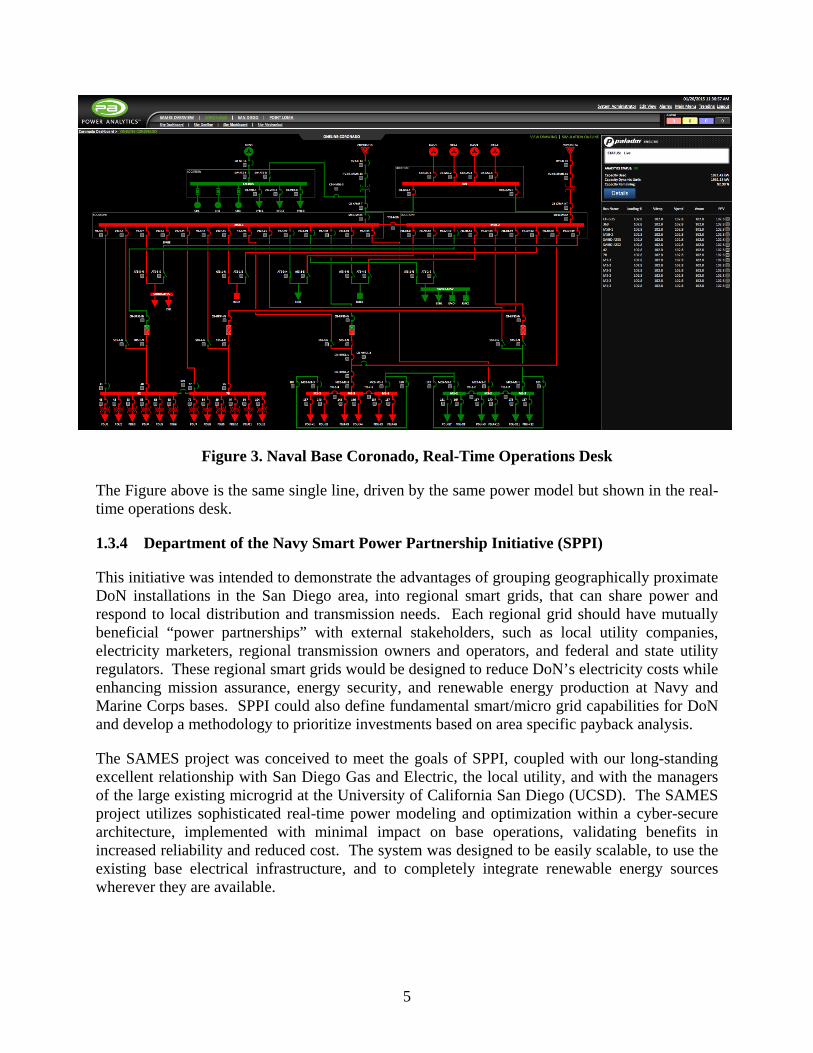
Figure 3. Naval Base Coronado, Real-Time Operations Desk
The Figure above is the same single line, driven by the same power model but shown in the real-time operations desk.
1.3.4 Department of the Navy Smart Power Partnership Initiative (SPPI)
This initiative was intended to demonstrate the advantages of grouping geographically proximate DoN installations in the San Diego area, into regional smart grids, that can share power and respond to local distribution and transmission needs. Each regional grid should have mutually beneficial “power partnerships” with external stakeholders, such as local utility companies, electricity marketers, regional transmission owners and operators, and federal and state utility regulators. These regional smart grids would be designed to reduce DoN’s electricity costs while enhancing mission assurance, energy security, and renewable energy production at Navy and Marine Corps bases. SPPI could also define fundamental smart/micro grid capabilities for DoN and develop a methodology to prioritize investments based on area specific payback analysis.
The SAMES project was conceived to meet the goals of SPPI, coupled with our long-standing excellent relationship with San Diego Gas and Electric, the local utility, and with the managers of the large existing microgrid at the University of California San Diego (UCSD). The SAMES project utilizes sophisticated real-time power modeling and optimization within a cyber-secure architecture, implemented with minimal impact on base operations, validating benefits in increased reliability and reduced cost. The system was designed to be easily scalable, to use the existing base electrical infrastructure, and to completely integrate renewable energy sources wherever they are available.

6
Page Intentionally Left Blank
7
2.0 TECHNOLOGY DESCRIPTION
2.1 TECHNOLOGY DEVELOPMENT
The Power Analytics, Secure Automated Microgrid Energy System (SAMES), was intended to support the SPPI objectives by creating a cluster of microgrids across Naval Bases San Diego, Coronado and Point Loma. This concept of a cluster of microgrids is currently of great interest to other stakeholders in civilian and military planning. A cluster can build partnerships with the local utility, such as San Diego Gas & Electric (SDG&E), and regional energy marketers to share power, respond to transmission and distribution needs, and participate in the growing energy markets. The Power Analytics team is currently building upon this concept in wholesale and retail markets as a registered market participant in the North American energy markets. SAMES demonstrates that these changes can be made without compromising system security and while increasing system reliability and energy surety. At the conclusion of this demonstration, NAVFAC SW has a wealth of knowledge that directly translated to TOPR CT 16-1297, Navy Enterprise Smart Grid Solution Naval Facilities Engineering Command (NAVFAC) / Public Works (PW).
The SAMES approach was based on technologies being demonstrated at the UCSD microgrid, the Federal Aviation Administration (FAA), and several mission critical data centers. The three Navy bases were linked via an existing fiber optic network at enterprise-level command and control system into the existing Utility and Energy Operation Center (UEOC) at Naval Base San Diego. Within SAMES, as shown in the Figures below, Power Analytics provides the overall real-time control and reliability management of the microgrid. Viridity Energy provides real-time demand management, energy asset optimization and load management. Spirae provides the real-time control. OSIsoft provides real-time data historian from the existing building management system (Johnson Controls Metasys), medium voltage SCADA system (Telvent SCADA) and supported smart meters. The security architecture incorporates the Honeywell Niagara system to facilitate the original DIACAP process, as well as the transition to Risk Management Framework. Conner Networks provided network cyber security and related verification and validation of the installed virtual servers.
8
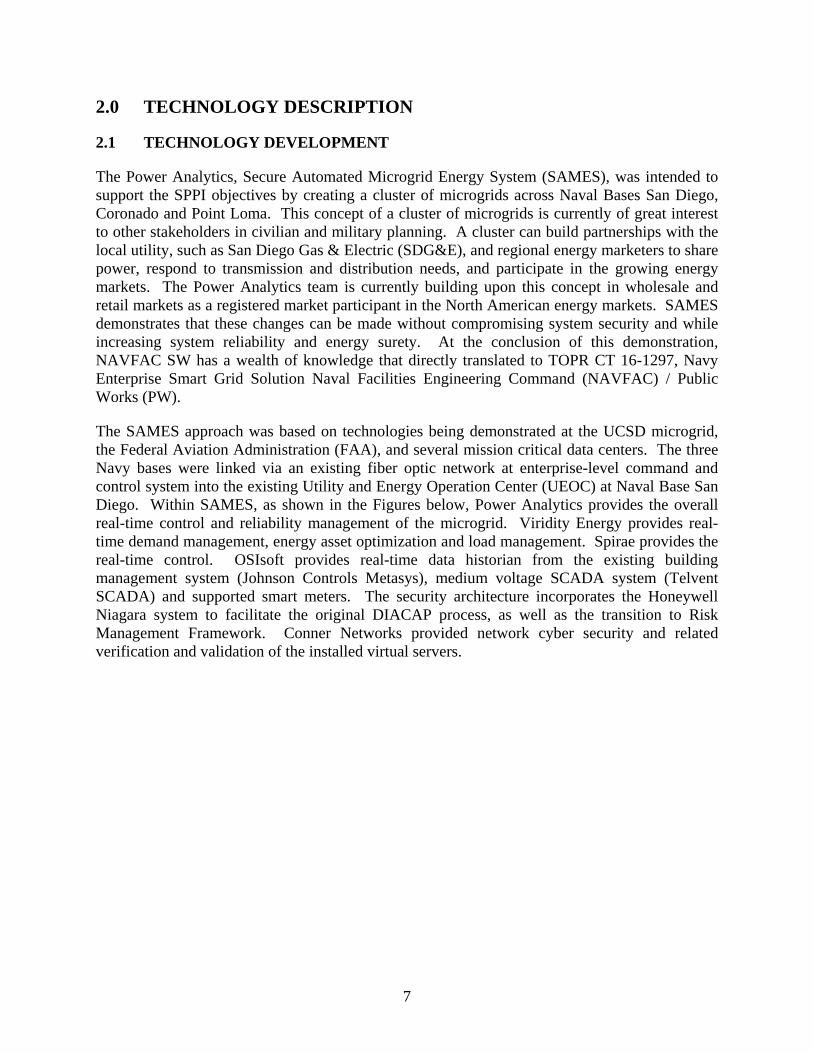
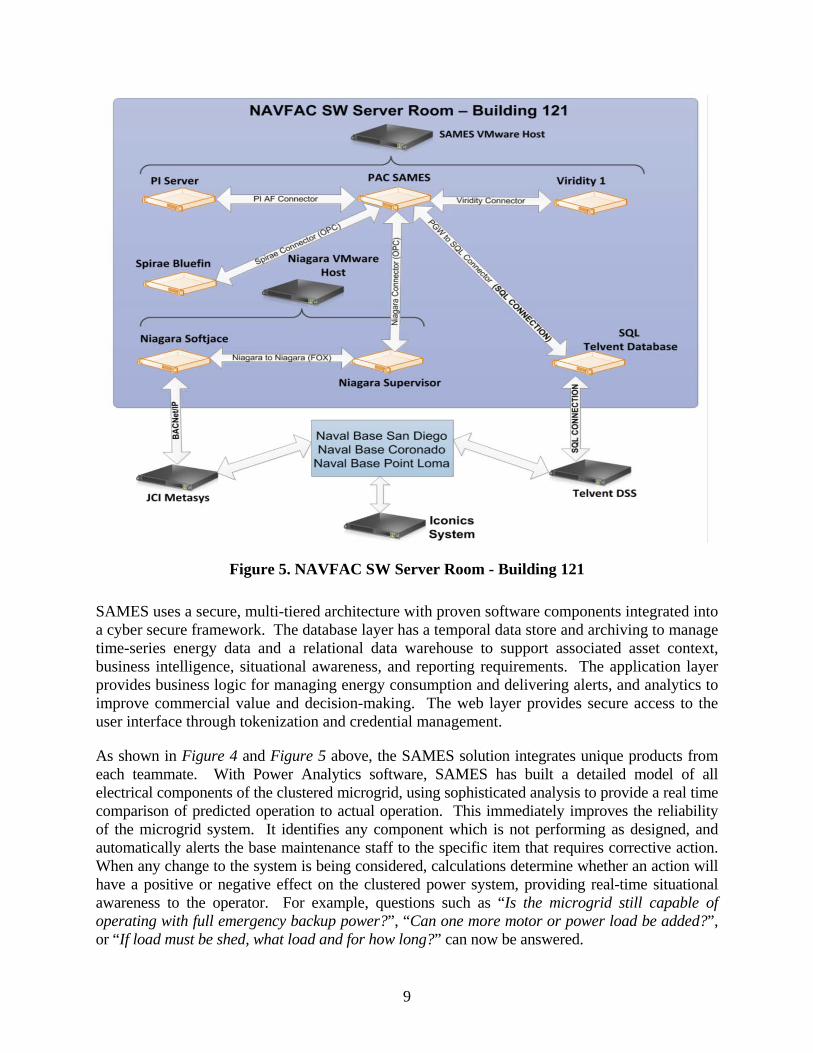
Figure 4. NAVFAC ICS Support Network
9
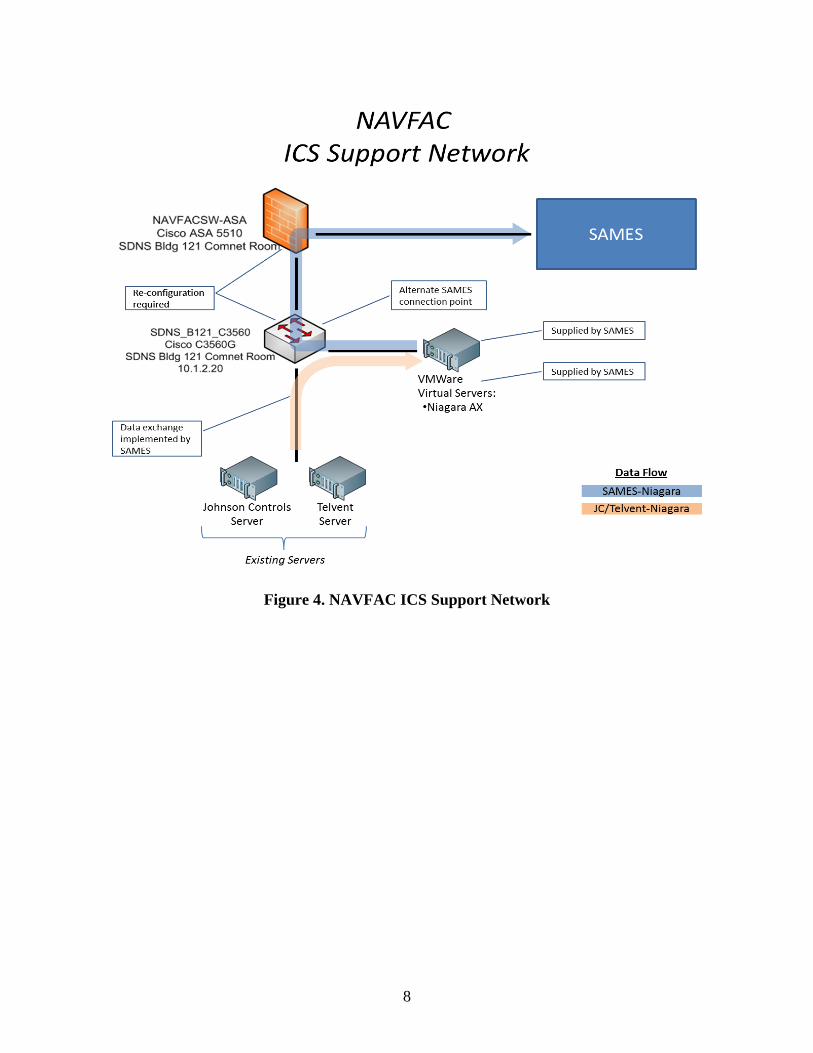
Figure 5. NAVFAC SW Server Room - Building 121
SAMES uses a secure, multi-tiered architecture with proven software components integrated into a cyber secure framework. The database layer has a temporal data store and archiving to manage time-series energy data and a relational data warehouse to support associated asset context, business intelligence, situational awareness, and reporting requirements. The application layer provides business logic for managing energy consumption and delivering alerts, and analytics to improve commercial value and decision-making. The web layer provides secure access to the user interface through tokenization and credential management.
As shown in Figure 4 and Figure 5 above, the SAMES solution integrates unique products from each teammate. With Power Analytics software, SAMES has built a detailed model of all electrical components of the clustered microgrid, using sophisticated analysis to provide a real time comparison of predicted operation to actual operation. This immediately improves the reliability of the microgrid system. It identifies any component which is not performing as designed, and automatically alerts the base maintenance staff to the specific item that requires corrective action. When any change to the system is being considered, calculations determine whether an action will have a positive or negative effect on the clustered power system, providing real-time situational awareness to the operator. For example, questions such as “Is the microgrid still capable of operating with full emergency backup power?”, “Can one more motor or power load be added?”, or “If load must be shed, what load and for how long?” can now be answered.
10
Using Viridity Energy VPower™ software, SAMES optimizes and schedules an installation’s energy assets and compares that schedule to the Power Analytics model of the base’s power infrastructure to determine if the power network can perform as desired. If it cannot, new constraints are passed to VPower and the process is repeated. SAMES can integrate traditional and renewable generation resources, considers any run-time restrictions or intermittent availability, and can work with any electric or thermal storage units. It considers overall load and generation forecasts, energy costs, and the attributes of the facilities. Using VPower, it co-optimizes the loads, distributed generation and storage assets to meet economic and reliability objectives both in connected mode and when islanded, and it matches the cluster’s operations with cost savings or revenue generation opportunities selected by the operator. These include: utility rate optimization, demand or load factor charge cost savings, wholesale energy market revenues, ancillary services, emergency demand response events, security constrained economic dispatch, and energy security and reliability dispatch.
While these capabilities exist in the system, we note that the microgrid cluster of circuits are not market participants in utility and/or ISO demand response market programs. Currently, the base supported demand response is a voluntary program that compensates end-use (retail/commercial) customers for reducing their electricity use (load), when requested by utility and/or ISO, during periods of high power prices or when the reliability of the grid is threatened. Manual operations to demand response from utility requests, (load reduction), is currently the only voluntary program supported on the bases. Power Analytics demonstrated net zero and market/power optimization at the Colorado State facility (Mirrored Site). In utility-connected or islanded mode, SAMES optimizes distributed generation, renewables, storage, and loads to maximize the microgrid’s ability to serve critical loads. The system predicts microgrid uptime, which is the forecasted time that the microgrid can reliably sustain operations, and uses additional dynamic load prioritization and generation optimization to allow the facilities to run as long as possible in case of a prolonged outage. To do this, our models consider generator efficiency, the availability of renewable energy and storage, fuel supplies/capacities, and load criticality.
When the resource schedule from VPower has been validated and market commitments are finalized, the resource schedule is passed to the Distributed Resource Dispatch and Supervisory Control module for execution (Spirae control at Colorado State Power House). The device controllers can rapidly shed non-critical load to maintain the stability of the microgrid when islanded and interface to the Building Management System (Johnson Controls Metasys) to manage demand both in islanded operation for fuel conservation and when grid connected for economic advantage. The distributed controls also coordinate separation from and resynchronization to the utility grid, and can manage the multiple points of common coupling (PCC) that are typical in military installations and other critical infrastructure.
While not enabled in the SAMES microgrid cluster, SAMES communication connection with the utility and as the military’s agent to the grid, SAMES can also bid into the wholesale energy market to minimize costs or generate revenue, participate in coincident peak power management, and other markets depending on the location and market availability Our solution allows a base to behave as a Virtual Power Plant (VPP), responding to the grid operator’s call for demand-side resources and working with other installations as desired. The information from the demonstration was used in a microgrid commercial and energy security model to determine the prospective value for individual or clustered installations.

11
In addition to these power management functions, SAMES demonstrated two other critical technologies: a comprehensive data warehouse (OSI Pi Historian) and cyber-secure operation in a military environment using existing procedures and infrastructure. Historical data was saved throughout the test period to validate the clustered microgrid metrics and the parameters in the benchmark models and used for the analysis.
Figure 6. NAVFAC SW Main Dashboard Screen
These innovative technologies, in the context of SAMES, include:
• An energy command and control platform, providing comprehensive, real-time power system situational awareness. This enables senior decision makers to manage the energy infrastructure of multiple bases from a single, centralized control center;
• Use of Security Constrained Economic Dispatch (SCED) to optimize the local generation, storage, and demand response against pricing, environmental constraints, and mission constraints;
• Provide rapid secure communications about power among the microgrid operators and the UEOC;
• Permit the cluster of microgrids to operate as a Virtual Power Plant to be leveraged back to the utility or the Independent System Operator for commercial value; and,
• Improve the base power infrastructure by using sophisticated modeling tools to compare the as-designed system to the actual system, allowing electrical issues to be corrected before the system fails.
12
2.2 ADVANTAGES AND LIMITATIONS OF THE TECHNOLOGY
The SAMES system increases the efficiency of the operations of the base circuits, eases the integration of renewable sources of generation into the power system, and improves the organizational performance by increasing situational awareness. At the core of the performance improvements is a granular baseline power model that draws from a detailed power system analysis. This level of accuracy and capability is, in most circumstances, not available or not accurate in the existing systems. It is this fundamental baseline analysis that determines what is possible, and which also defines critical components of the dynamic analysis in live operation. This underlying model has two major elements: programmatic, automated optimization and control; and, user simulation based on the actual physical state of the power network which can be used for operations and maintenance (O&M), training and advanced planning. Each provides a key capability which is not present in the existing infrastructure.
2.2.1 Cost Advantages
The approach of managing power as a network is the basis for the optimization of generation and load. This system level understanding is fundamental to real time decisions about energy cost such as demand reduction for demand response as either increased generation or decreased load.
• Direct cost reduction opportunities include demand response up to “net zero” and the opportunity to participate beyond net zero in market based generation programs such as Direct Access in California.
• Indirect cost reductions are perhaps more important because they include real time operational decisions such as wheeling of generation assets on the individual bases or O&M planning that have specific impacts on power availability.
The SAMES demonstration provides empirical data on the optimization of the three bases including tactical operational decision support, baseline efficiency comparisons and planning scenarios. While noted earlier in this report, it is not currently possible to wheel power across the bases, it is possible to optimize energy use for maximum benefits in simulated market participant demand response programs and provide relevant energy data.
2.2.2 Performance Limitations
The risks to the existing base infrastructure from the SAMES technology was minimized because core COTS (commercial off the shelf) technology was installed at several secure and commercial sites in North America and Europe.
The principal limitation of a demonstration of this magnitude was, and is, the need to work within the existing command structure and base activity to facilitate a fundamental innovative and disruptive technology. Over the course of the demonstration it became apparent that changes in command and leadership can compromise the real and perceived value of a system as demonstrated. The team attempted to minimize this issue by working with proposed circuits that do not encompass the entire microgrid or bases, and by creating a fully functional shadow system at the Colorado State University facility. These representative circuits were selected to provide empirical data and to show how the system can expand and extrapolate the information to the entire base.
13
SAMES is not overly complex but it does rely on the accuracy and availability of real time data. The SAMES system approach to managing and understanding the state of the power network requires that problems such as loss of communications with sources of data (meters, sensors etc.) be addressed as a high priority.
2.2.3 Cost Limitations
The principal advantage to the use of representative circuits for the SAMES demonstration was reduced cost. However, this is also the principal cost disadvantage because it is by definition a trade off with respect to the available infrastructure (controllable generation and load as well as metering and sensors) that can be used to optimize performance.
2.2.4 Social Acceptance
Whenever new technology is introduced it inevitably meets with initial resistance. In this instance, management of the power systems to balance energy cost versus energy availability met with resistance. This was most evident where human resources are required to validate information, provide access to systems or data, and integrate existing systems. The challenge of working with civilian personnel was by far the greatest challenge. The demands placed on civilian personnel time, and the concerns surrounding automation and analytics, were perceived as a threat to their respective roles on the bases. This was compounded in-part, to some extent, based on the previously mentioned change in leadership resulting from rotations and retirement.
2.2.5 Comparison to Existing Technology
The existing bases, with respect to power infrastructures, were not well-documented and the base staff did not fully trust the information of record. This reality is certainly not unique to any military base, nor is it unique to commercial or civilian infrastructure. The value of using the underlying power model to determine the capability of the system, and to operate the decision-making process, far outweighs the existing technology and directly leads to the type of program currently underway at NAVFAC ICS (TOPR CT 16-1297). The iterative process of developing the SAMES infrastructure model and comparing it to actual base operations is central to the approach demonstrated in SAMES and other civilian and military installations.

14
Page Intentionally Left Blank
15
3.0 PERFORMANCE OBJECTIVES
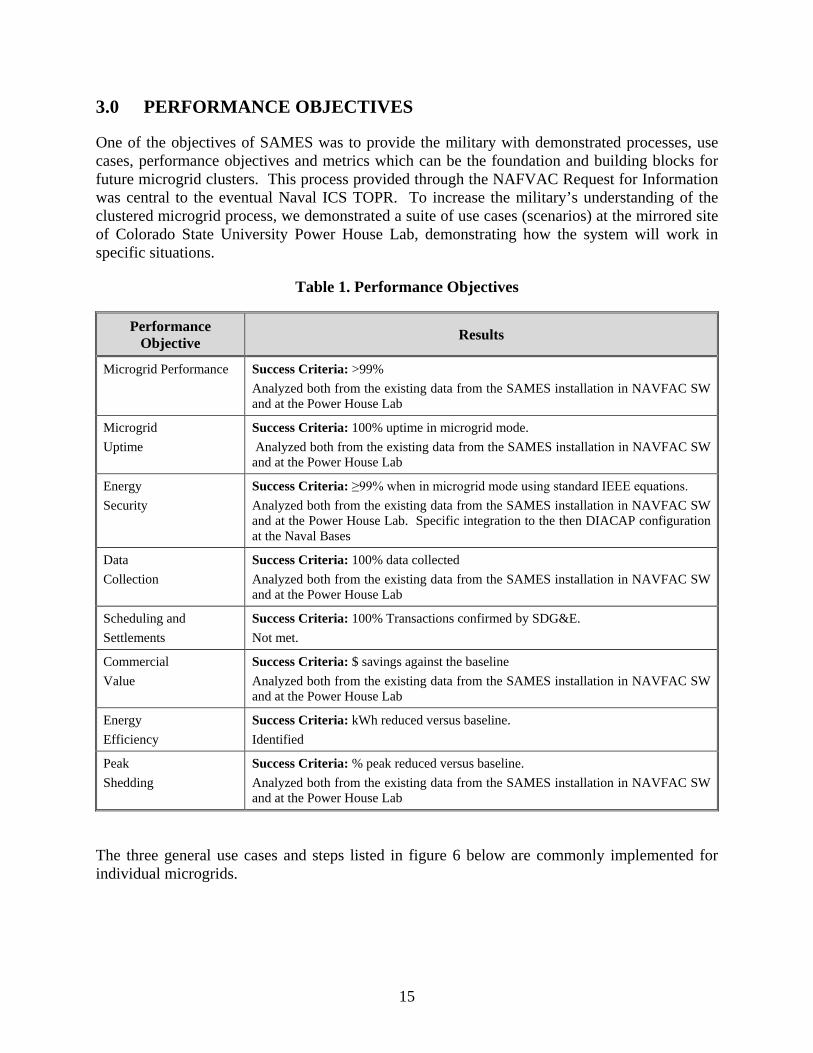
One of the objectives of SAMES was to provide the military with demonstrated processes, use cases, performance objectives and metrics which can be the foundation and building blocks for future microgrid clusters. This process provided through the NAFVAC Request for Information was central to the eventual Naval ICS TOPR. To increase the military’s understanding of the clustered microgrid process, we demonstrated a suite of use cases (scenarios) at the mirrored site of Colorado State University Power House Lab, demonstrating how the system will work in specific situations.
Table 1. Performance Objectives
Performance Objective Results
Microgrid Performance Success Criteria: >99% Analyzed both from the existing data from the SAMES installation in NAVFAC SW and at the Power House Lab
Microgrid Uptime
Success Criteria: 100% uptime in microgrid mode. Analyzed both from the existing data from the SAMES installation in NAVFAC SW and at the Power House Lab
Energy Security
Success Criteria: ≥99% when in microgrid mode using standard IEEE equations. Analyzed both from the existing data from the SAMES installation in NAVFAC SW and at the Power House Lab. Specific integration to the then DIACAP configuration at the Naval Bases
Data Collection
Success Criteria: 100% data collected Analyzed both from the existing data from the SAMES installation in NAVFAC SW and at the Power House Lab
Scheduling and Settlements
Success Criteria: 100% Transactions confirmed by SDG&E. Not met.
Commercial Value
Success Criteria: $ savings against the baseline Analyzed both from the existing data from the SAMES installation in NAVFAC SW and at the Power House Lab
Energy Efficiency
Success Criteria: kWh reduced versus baseline. Identified
Peak Shedding
Success Criteria: % peak reduced versus baseline. Analyzed both from the existing data from the SAMES installation in NAVFAC SW and at the Power House Lab
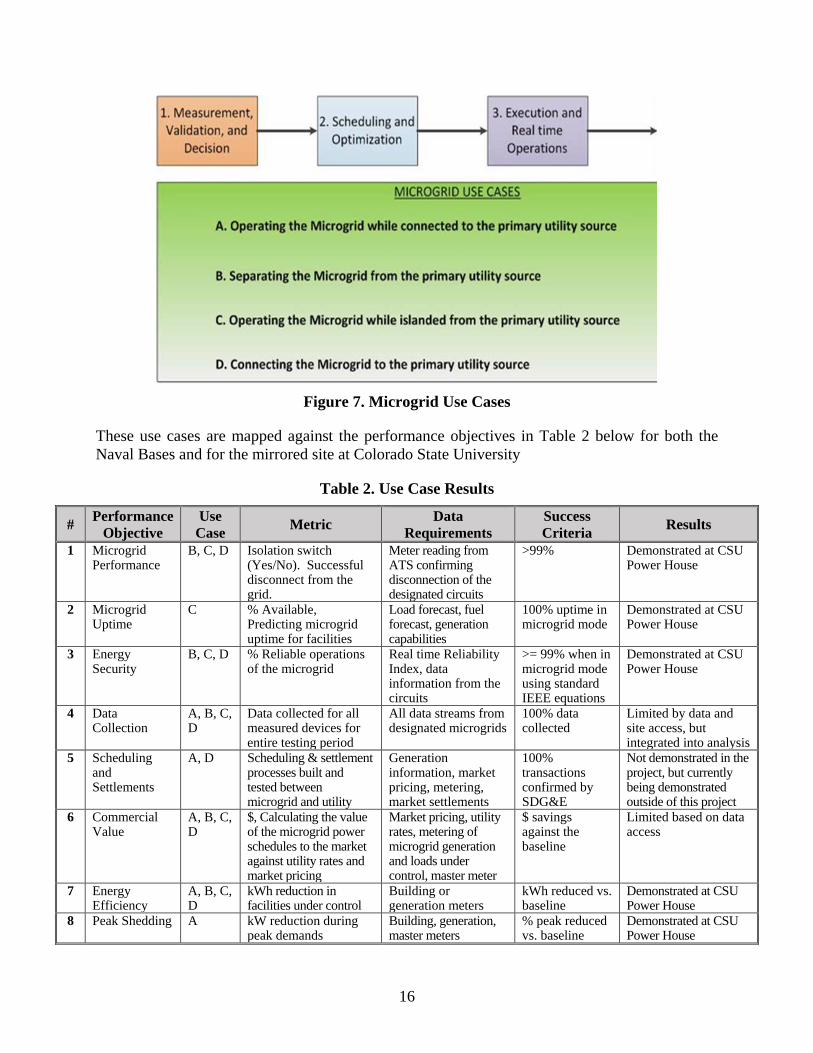
The three general use cases and steps listed in figure 6 below are commonly implemented for individual microgrids.
16
Figure 7. Microgrid Use Cases
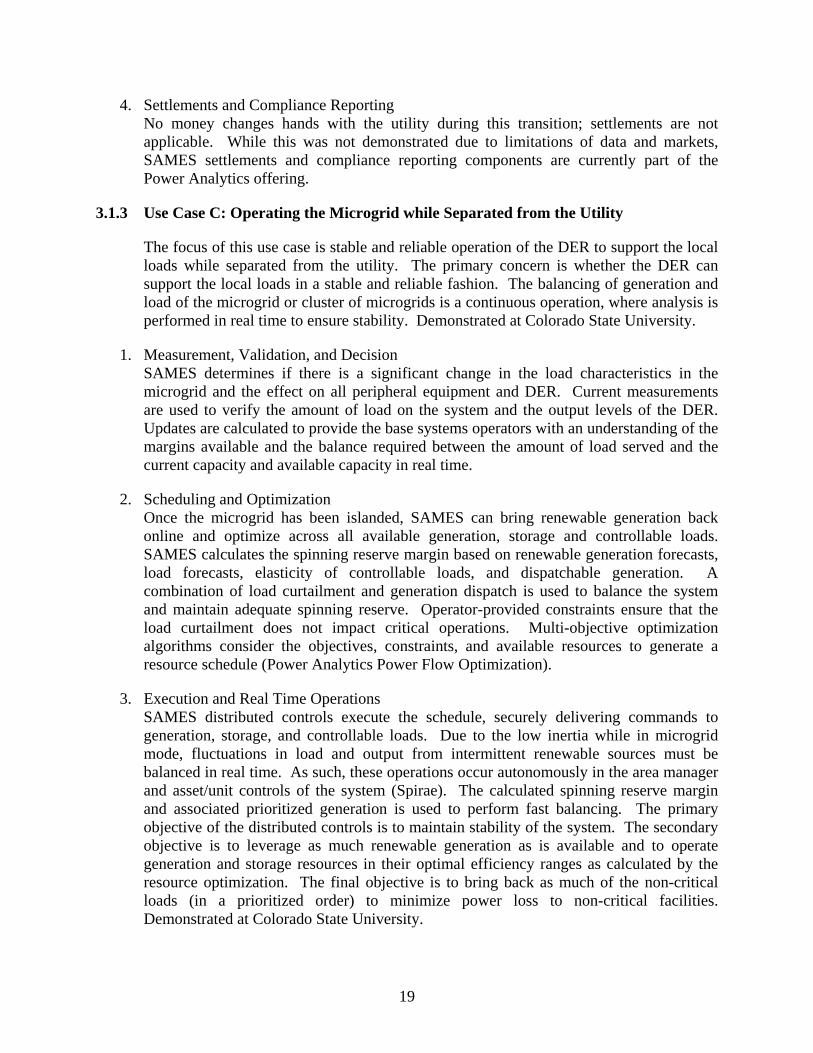
These use cases are mapped against the performance objectives in Table 2 below for both the Naval Bases and for the mirrored site at Colorado State University
Table 2. Use Case Results
# Performance Objective
Use Case Metric Data
Requirements Success Criteria Results
1 Microgrid Performance
B, C, D Isolation switch (Yes/No). Successful disconnect from the grid.
Meter reading from ATS confirming disconnection of the designated circuits
>99% Demonstrated at CSU Power House
2 Microgrid Uptime
C % Available, Predicting microgrid uptime for facilities
Load forecast, fuel forecast, generation capabilities
100% uptime in microgrid mode
Demonstrated at CSU Power House
3 Energy Security
B, C, D % Reliable operations of the microgrid
Real time Reliability Index, data information from the circuits
>= 99% when in microgrid mode using standard IEEE equations
Demonstrated at CSU Power House
4 Data Collection
A, B, C, D
Data collected for all measured devices for entire testing period
All data streams from designated microgrids
100% data collected
Limited by data and site access, but integrated into analysis
5 Scheduling and Settlements
A, D Scheduling & settlement processes built and tested between microgrid and utility
Generation information, market pricing, metering, market settlements
100% transactions confirmed by SDG&E
Not demonstrated in the project, but currently being demonstrated outside of this project
6 Commercial Value
A, B, C, D
$, Calculating the value of the microgrid power schedules to the market against utility rates and market pricing
Market pricing, utility rates, metering of microgrid generation and loads under control, master meter
$ savings against the baseline
Limited based on data access
7 Energy Efficiency
A, B, C, D
kWh reduction in facilities under control
Building or generation meters
kWh reduced vs. baseline
Demonstrated at CSU Power House
8 Peak Shedding A kW reduction during peak demands
Building, generation, master meters
% peak reduced vs. baseline
Demonstrated at CSU Power House

17
3.1 QUANTITATIVE PERFORMANCE OBJECTIVES
3.1.1 Use Case A: Operating the Microgrid While Connected to the Utility
The focus of this use case was the availability of local generation and curtailable loads, also termed Distributed Energy Resources (DER), to offset electrical demand from the utility in return for financial compensation and energy security. There are four levels of DER:
• No DER available (this provides baseline costs for the loads on the microgrid); • Some DER available to support local loads, but importing power from the utility; • Excess DER, exporting power to the utility; and, • “Net Zero” DER, with local generation resulting in no power being imported from the utility.
When local generation was available, each level was demonstrated at the hardware in the looped Colorado State University facility and included in the commercial and energy security model. Commercial value was dependent on a number of factors during the demonstration periods, including renewable output, testing times, and prices of energy in the wholesale market. For each of the tests, the commercial value was offset by the baseline costs.
1. Measurement, Validation, and Decision The Measurement, Validation, and Decision components are: the amount of DER available, the current pricing of electricity from the utility, any emergency conditions, load and weather forecasts, and any other base related circumstances that impact the operations of the microgrid while connected to the utility. Based on these inputs a decision is made on how to use the DER within the microgrid. Demonstrated at Colorado State University.
2. Scheduling and Optimization Once a decision is made about the DER available, the SAMES scheduling and optimization component determines how the controllable loads and the generators could best meet the optimized planned solution. Generator output can be adjusted, load may be curtailed, or a combination of load curtailment and generation adjustment may take place. Finally, all the input parameters go into the economic, energy security and reliability models to confirm that no constraints are violated. If no constraints are violated, the controls are deployed. Demonstrated at Colorado State University.
3. Execution and Real Time Operations The SAMES execution and real time operations component runs the appropriate real-time analytics to confirm reliable operations and commercial value. In real time, the analytics continuously optimize current operations to obtain the maximum value from each microgrid without compromising the reliability of the bases. Demonstrated at Colorado State University.
4. Settlements and Compliance Reporting The SAMES settlements and compliance reporting components will store the DER metering information, set points, deviations from set points, and any real time alarms, and create shadow settlements (the internal validation of meter and billing information against a utility bill) and compliance reports to be submitted to the utility or the ISO for payment. While this was not demonstrated due to limitations of data and markets, SAMES settlements and compliance reporting components are currently part of the Power Analytics offering.

18
3.1.2 Use Case B: Separating the Microgrid from the Utility
The focus of this case is clean separation of the microgrid from the utility, which can occur for two reasons:
• The utility system operator and/or base systems control operator requests to separate the microgrid from the utility;
• An unplanned event occurs where utility power is lost (including frequency or voltage deviations) and the microgrid separates. − For clean separation to occur, there must be sufficient DER available to support the
critical load of the microgrid, or the load must be curtailed per a prioritization scheme that ensures the critical load will be served. The main function of this use case is energy security, energy surety, and reliability. There is no commercial value attached to this use case; however, it is a critical transition step between steady state operations while connected to the utility and when disconnected from the utility. Demonstrated at Colorado State University.
1. Measurement, Validation, and Decision SAMES analyzes the network to determine whether there is enough DER to support the local critical load. Real time measurements verify the amount of load on the system and the output potential of the DER. Load and DER forecasts simulate the operability of the microgrid and uncover any potential issues. Separation simulations are performed against real time data to quantify the risks.
2. Scheduling and Optimization SAMES determines how the DER can serve the local critical load before the microgrid is separated from the utility grid. In some cases, generation output levels may be adjusted. In other cases, native loads may be curtailed, or a combination of load curtailment and DER adjustment may take place. Renewable sources will typically go offline during the transition unless there is a battery present. The resource and load schedules are validated against reliability and energy security models before microgrid separation occurs. Further evaluations which determine the effects on equipment outside the microgrid are also simulated to confirm that there are no peripheral interactions or network degradation.
3. Execution and Real Time Operations SAMES runs the appropriate power scenarios to verify that the DER can service the local loads. Once the system studies are verified, commands are sent to the DER dispatch and supervisory control subsystem to bring the generation online at the calculated set-points and to curtail load as required to balance the system. Once the local generation is supporting the local load and there is no power flow across the point(s) of common coupling, the breaker at the PCC is opened to confirm disconnection. For unplanned separation from the grid, the critical loads can be supported by a local Uninterruptible Power Supply (UPS), and then local generation started and balanced against current loads. In real time, the balance between load and generation is continuously updated to ensure there is no loss of power.
19
4. Settlements and Compliance Reporting No money changes hands with the utility during this transition; settlements are not applicable. While this was not demonstrated due to limitations of data and markets, SAMES settlements and compliance reporting components are currently part of the Power Analytics offering.
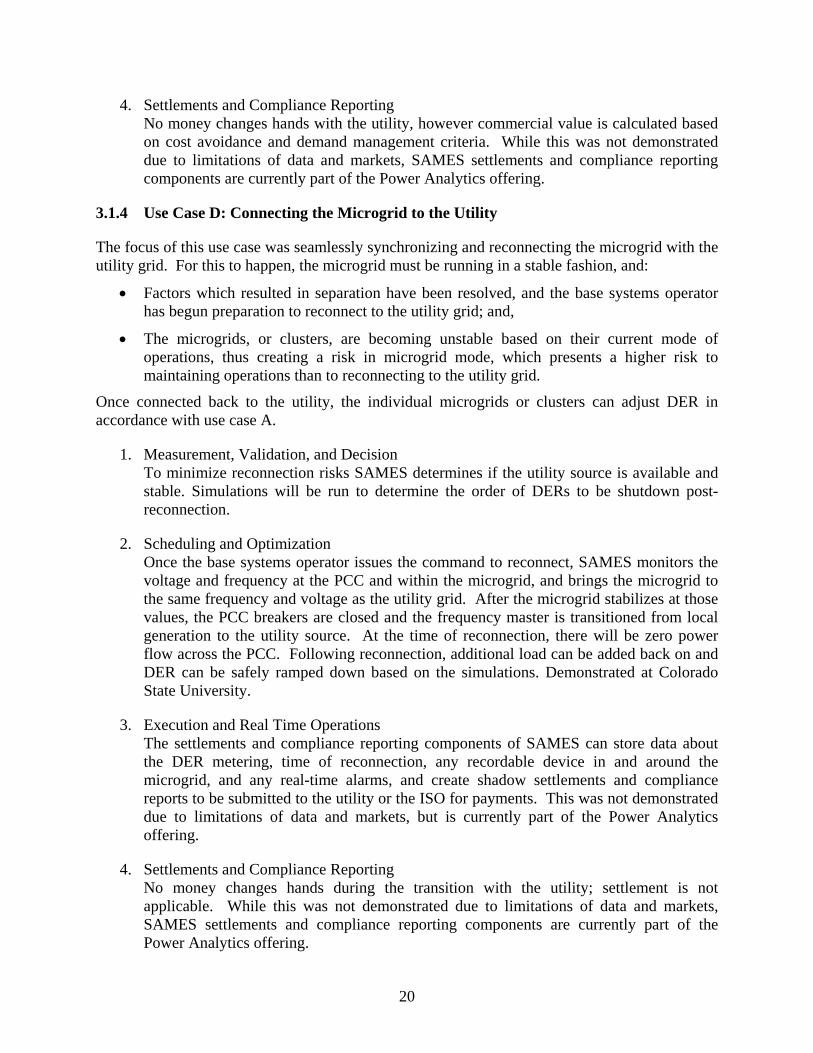
3.1.3 Use Case C: Operating the Microgrid while Separated from the Utility
The focus of this use case is stable and reliable operation of the DER to support the local loads while separated from the utility. The primary concern is whether the DER can support the local loads in a stable and reliable fashion. The balancing of generation and load of the microgrid or cluster of microgrids is a continuous operation, where analysis is performed in real time to ensure stability. Demonstrated at Colorado State University.
1. Measurement, Validation, and Decision SAMES determines if there is a significant change in the load characteristics in the microgrid and the effect on all peripheral equipment and DER. Current measurements are used to verify the amount of load on the system and the output levels of the DER. Updates are calculated to provide the base systems operators with an understanding of the margins available and the balance required between the amount of load served and the current capacity and available capacity in real time.
2. Scheduling and Optimization Once the microgrid has been islanded, SAMES can bring renewable generation back online and optimize across all available generation, storage and controllable loads. SAMES calculates the spinning reserve margin based on renewable generation forecasts, load forecasts, elasticity of controllable loads, and dispatchable generation. A combination of load curtailment and generation dispatch is used to balance the system and maintain adequate spinning reserve. Operator-provided constraints ensure that the load curtailment does not impact critical operations. Multi-objective optimization algorithms consider the objectives, constraints, and available resources to generate a resource schedule (Power Analytics Power Flow Optimization).
3. Execution and Real Time Operations SAMES distributed controls execute the schedule, securely delivering commands to generation, storage, and controllable loads. Due to the low inertia while in microgrid mode, fluctuations in load and output from intermittent renewable sources must be balanced in real time. As such, these operations occur autonomously in the area manager and asset/unit controls of the system (Spirae). The calculated spinning reserve margin and associated prioritized generation is used to perform fast balancing. The primary objective of the distributed controls is to maintain stability of the system. The secondary objective is to leverage as much renewable generation as is available and to operate generation and storage resources in their optimal efficiency ranges as calculated by the resource optimization. The final objective is to bring back as much of the non-critical loads (in a prioritized order) to minimize power loss to non-critical facilities. Demonstrated at Colorado State University.
20
4. Settlements and Compliance Reporting No money changes hands with the utility, however commercial value is calculated based on cost avoidance and demand management criteria. While this was not demonstrated due to limitations of data and markets, SAMES settlements and compliance reporting components are currently part of the Power Analytics offering.
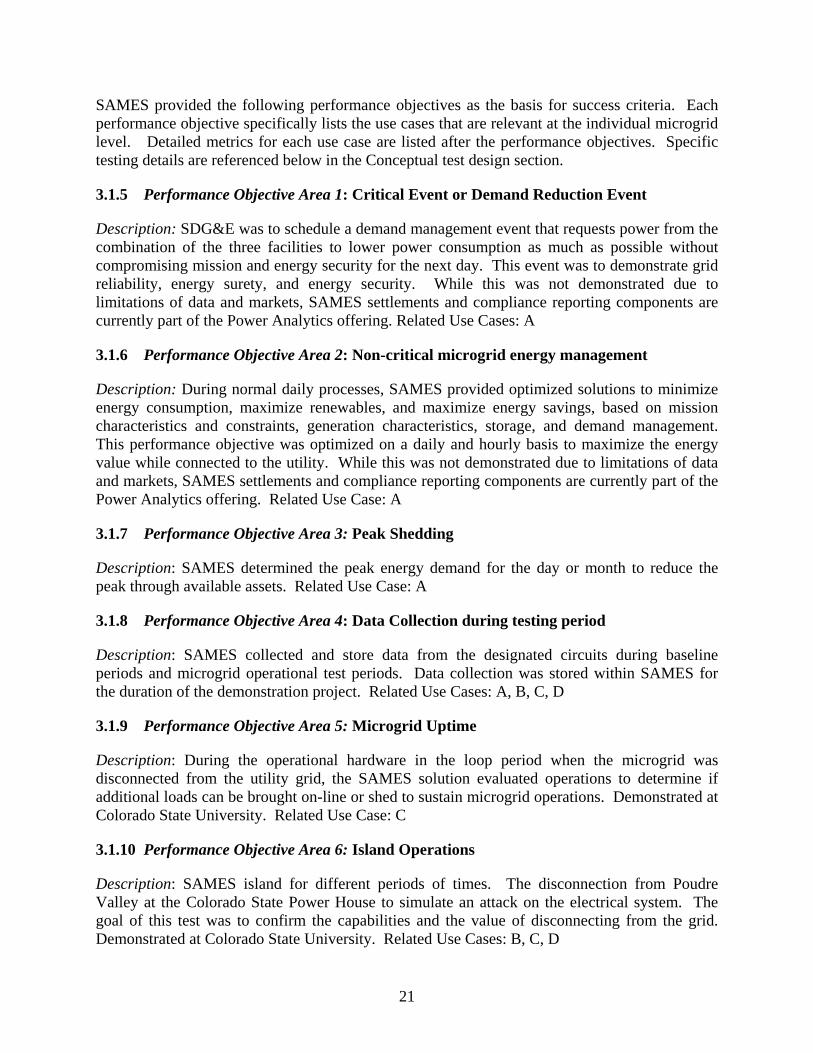
3.1.4 Use Case D: Connecting the Microgrid to the Utility
The focus of this use case was seamlessly synchronizing and reconnecting the microgrid with the utility grid. For this to happen, the microgrid must be running in a stable fashion, and:
• Factors which resulted in separation have been resolved, and the base systems operator has begun preparation to reconnect to the utility grid; and,
• The microgrids, or clusters, are becoming unstable based on their current mode of operations, thus creating a risk in microgrid mode, which presents a higher risk to maintaining operations than to reconnecting to the utility grid.
Once connected back to the utility, the individual microgrids or clusters can adjust DER in accordance with use case A.
1. Measurement, Validation, and Decision To minimize reconnection risks SAMES determines if the utility source is available and stable. Simulations will be run to determine the order of DERs to be shutdown post-reconnection.
2. Scheduling and Optimization Once the base systems operator issues the command to reconnect, SAMES monitors the voltage and frequency at the PCC and within the microgrid, and brings the microgrid to the same frequency and voltage as the utility grid. After the microgrid stabilizes at those values, the PCC breakers are closed and the frequency master is transitioned from local generation to the utility source. At the time of reconnection, there will be zero power flow across the PCC. Following reconnection, additional load can be added back on and DER can be safely ramped down based on the simulations. Demonstrated at Colorado State University.
3. Execution and Real Time Operations The settlements and compliance reporting components of SAMES can store data about the DER metering, time of reconnection, any recordable device in and around the microgrid, and any real-time alarms, and create shadow settlements and compliance reports to be submitted to the utility or the ISO for payments. This was not demonstrated due to limitations of data and markets, but is currently part of the Power Analytics offering.
4. Settlements and Compliance Reporting No money changes hands during the transition with the utility; settlement is not applicable. While this was not demonstrated due to limitations of data and markets, SAMES settlements and compliance reporting components are currently part of the Power Analytics offering.
21
SAMES provided the following performance objectives as the basis for success criteria. Each performance objective specifically lists the use cases that are relevant at the individual microgrid level. Detailed metrics for each use case are listed after the performance objectives. Specific testing details are referenced below in the Conceptual test design section.
3.1.5 Performance Objective Area 1: Critical Event or Demand Reduction Event
Description: SDG&E was to schedule a demand management event that requests power from the combination of the three facilities to lower power consumption as much as possible without compromising mission and energy security for the next day. This event was to demonstrate grid reliability, energy surety, and energy security. While this was not demonstrated due to limitations of data and markets, SAMES settlements and compliance reporting components are currently part of the Power Analytics offering. Related Use Cases: A
3.1.6 Performance Objective Area 2: Non-critical microgrid energy management
Description: During normal daily processes, SAMES provided optimized solutions to minimize energy consumption, maximize renewables, and maximize energy savings, based on mission characteristics and constraints, generation characteristics, storage, and demand management. This performance objective was optimized on a daily and hourly basis to maximize the energy value while connected to the utility. While this was not demonstrated due to limitations of data and markets, SAMES settlements and compliance reporting components are currently part of the Power Analytics offering. Related Use Case: A
3.1.7 Performance Objective Area 3: Peak Shedding
Description: SAMES determined the peak energy demand for the day or month to reduce the peak through available assets. Related Use Case: A
3.1.8 Performance Objective Area 4: Data Collection during testing period
Description: SAMES collected and store data from the designated circuits during baseline periods and microgrid operational test periods. Data collection was stored within SAMES for the duration of the demonstration project. Related Use Cases: A, B, C, D
3.1.9 Performance Objective Area 5: Microgrid Uptime
Description: During the operational hardware in the loop period when the microgrid was disconnected from the utility grid, the SAMES solution evaluated operations to determine if additional loads can be brought on-line or shed to sustain microgrid operations. Demonstrated at Colorado State University. Related Use Case: C
3.1.10 Performance Objective Area 6: Island Operations
Description: SAMES island for different periods of times. The disconnection from Poudre Valley at the Colorado State Power House to simulate an attack on the electrical system. The goal of this test was to confirm the capabilities and the value of disconnecting from the grid. Demonstrated at Colorado State University. Related Use Cases: B, C, D

22
Page Intentionally Left Blank

23
4.0 SITE/FACILITY DESCRIPTION
4.1 SITE/FACILITY LOCATION & OPERATIONS
Field Studies were conducted at the following three locations in addition to the work done at Colorado State University for the hardware in the loop testing and microgrid verification:
• Naval Base San Diego, San Diego, CA • Naval Base Coronado, San Diego, CA • Naval Base Point Loma, San Diego, CA
Figure 8. Aerial View of the Three Naval Bases
4.1.1 Naval Base San Diego, San Diego, CA
Naval Base San Diego (NBSD) is one of the largest Navy bases in the region, and the primary regional docking station for ships, excluding aircraft carriers and submarines. The SAMES circuit, for the demonstration, was Circuit 10 (referenced in the green circle in Figure 9). NBSD housed the enterprise cluster and has one of the three microgrid circuits. The NBSD circuit at the Naval Hospital includes gas turbine and diesel generation.
The target circuit was Station D, which supports Pier 5 & Pier 6. The ships at these piers provided the load and steam cogeneration. NBSD will also house the SAMES enterprise solution for the clustered environment in the existing server room at the Utility and Energy Operations Center (UEOC). The existing infrastructure was adequate to support the demonstration.
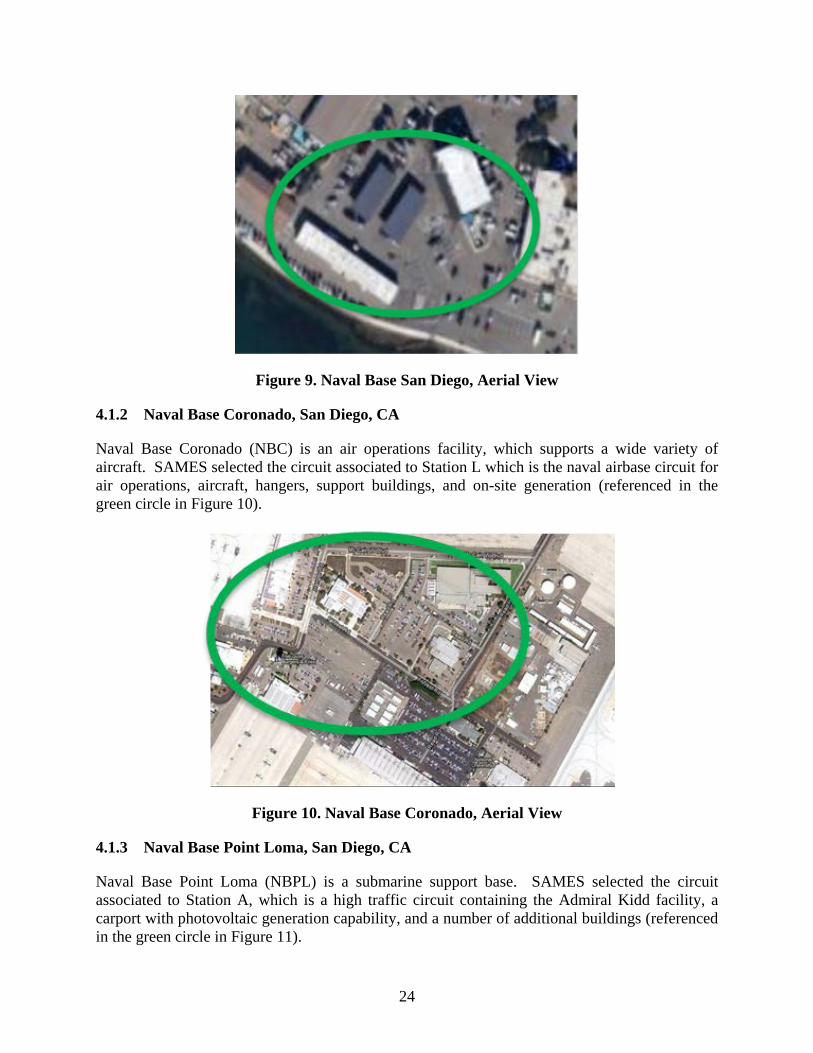
24
Figure 9. Naval Base San Diego, Aerial View
4.1.2 Naval Base Coronado, San Diego, CA
Naval Base Coronado (NBC) is an air operations facility, which supports a wide variety of aircraft. SAMES selected the circuit associated to Station L which is the naval airbase circuit for air operations, aircraft, hangers, support buildings, and on-site generation (referenced in the green circle in Figure 10).
Figure 10. Naval Base Coronado, Aerial View
4.1.3 Naval Base Point Loma, San Diego, CA
Naval Base Point Loma (NBPL) is a submarine support base. SAMES selected the circuit associated to Station A, which is a high traffic circuit containing the Admiral Kidd facility, a carport with photovoltaic generation capability, and a number of additional buildings (referenced in the green circle in Figure 11).
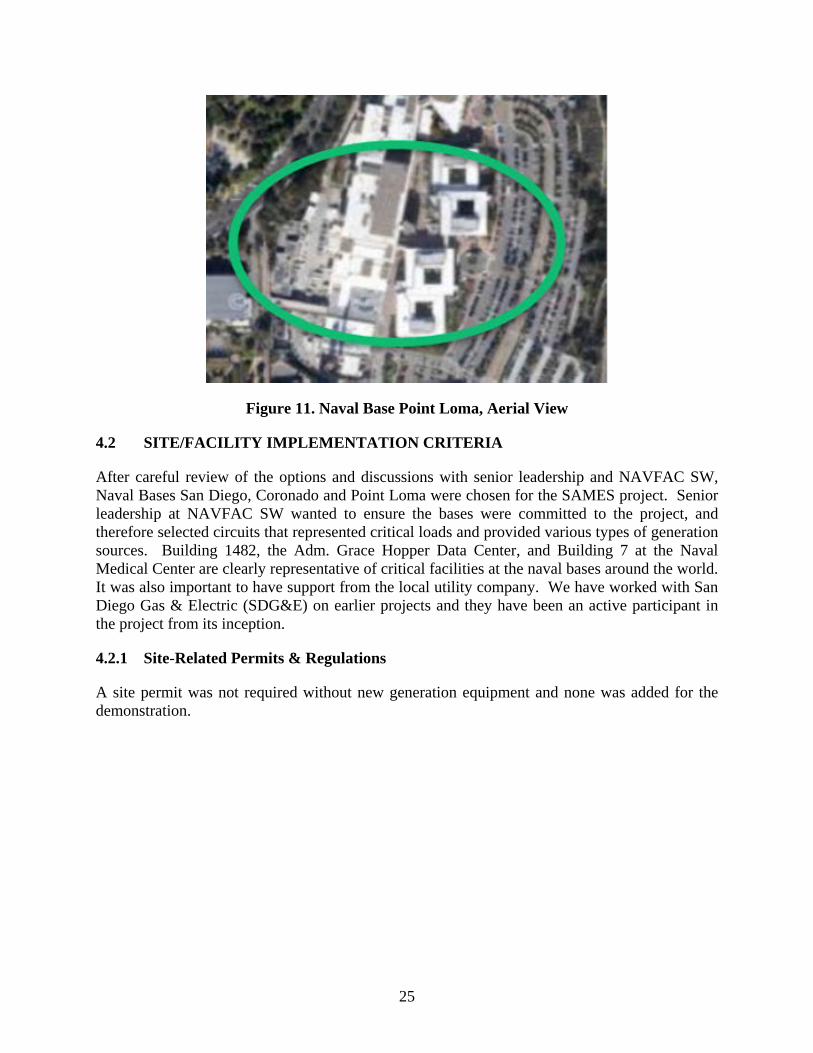
25
Figure 11. Naval Base Point Loma, Aerial View
4.2 SITE/FACILITY IMPLEMENTATION CRITERIA
After careful review of the options and discussions with senior leadership and NAVFAC SW, Naval Bases San Diego, Coronado and Point Loma were chosen for the SAMES project. Senior leadership at NAVFAC SW wanted to ensure the bases were committed to the project, and therefore selected circuits that represented critical loads and provided various types of generation sources. Building 1482, the Adm. Grace Hopper Data Center, and Building 7 at the Naval Medical Center are clearly representative of critical facilities at the naval bases around the world. It was also important to have support from the local utility company. We have worked with San Diego Gas & Electric (SDG&E) on earlier projects and they have been an active participant in the project from its inception.
4.2.1 Site-Related Permits & Regulations
A site permit was not required without new generation equipment and none was added for the demonstration.

26
Page Intentionally Left Blank

27
5.0 TEST DESIGN & ISSUE RESOLUTION
5.1 CONCEPTUAL EXPERIMENTAL DESIGN
Study Variables
• Independent Variable(s): − The independent variables were the operation of the target circuits while connected or
disconnected from the primary circuit or grid (connection status) including the Colorado State University facility.
• Dependent Variable(s): − In the two operating states (connected and paralleled with the primary circuit or grid)
and disconnected (islanded) from the primary circuit or grid, we measured the stability of the system, including: when and how it becomes unstable; what contingency plans are appropriate for the state; how stability relates to the capacity for both generation and load; and, how energy cost (kWh) is affected by the operating states.
• Controlled Variable(s):
− The controlled variables are the uninterrupted flow of power for each circuit. Power flow within the circuit will vary based on the environmental and operational conditions, but it should never be zero.
5.1.1 Study Hypothesis
Can the microgrid reduce demand on the utility and optimize existing generation and controllable load assets? The demonstration included the use of renewable energy sources, along with increases in situational awareness, stability and reliability, to ultimately lower overall cost to the Navy.
The problem: Improve energy surety and cost through a secure microgrid which can be managed from a central location.
5.1.1.1 Study Phases
• Baseline Model – The initial phase was the creation of a Paladin® DesignBase™ power systems model based on available electrical one line and site survey information. This pre-operational study for the bases and the Colorado State University lab define the first order of expected power related key indicators (i.e., voltage, voltage drop, frequency, resilience and stability).
• Lab Integration/Pre-Installation Staging – The compute environment with the required software applications were integrated in validated for completeness and integration within the applications (Power Analytics, Spirae, OSI, Viridity and Niagara Cyber portal). Controllable loads and generation were tested in the ‘hardware in the loop’ pre-staging prior to installation at Naval Base San Diego. Paralleling with the utility and islanding to and from the utility were tested in the lab.
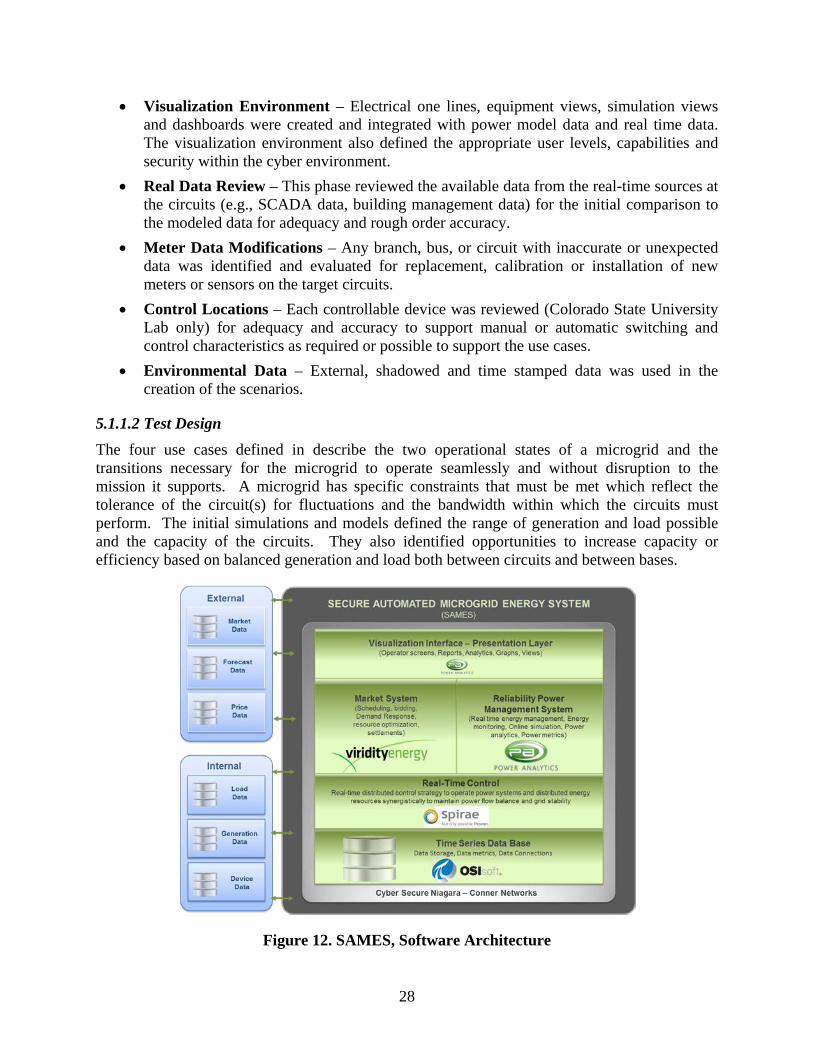
28
• Visualization Environment – Electrical one lines, equipment views, simulation views and dashboards were created and integrated with power model data and real time data. The visualization environment also defined the appropriate user levels, capabilities and security within the cyber environment.
• Real Data Review – This phase reviewed the available data from the real-time sources at the circuits (e.g., SCADA data, building management data) for the initial comparison to the modeled data for adequacy and rough order accuracy.
• Meter Data Modifications – Any branch, bus, or circuit with inaccurate or unexpected data was identified and evaluated for replacement, calibration or installation of new meters or sensors on the target circuits.
• Control Locations – Each controllable device was reviewed (Colorado State University Lab only) for adequacy and accuracy to support manual or automatic switching and control characteristics as required or possible to support the use cases.
• Environmental Data – External, shadowed and time stamped data was used in the creation of the scenarios.
5.1.1.2 Test Design The four use cases defined in describe the two operational states of a microgrid and the transitions necessary for the microgrid to operate seamlessly and without disruption to the mission it supports. A microgrid has specific constraints that must be met which reflect the tolerance of the circuit(s) for fluctuations and the bandwidth within which the circuits must perform. The initial simulations and models defined the range of generation and load possible and the capacity of the circuits. They also identified opportunities to increase capacity or efficiency based on balanced generation and load both between circuits and between bases.
Figure 12. SAMES, Software Architecture
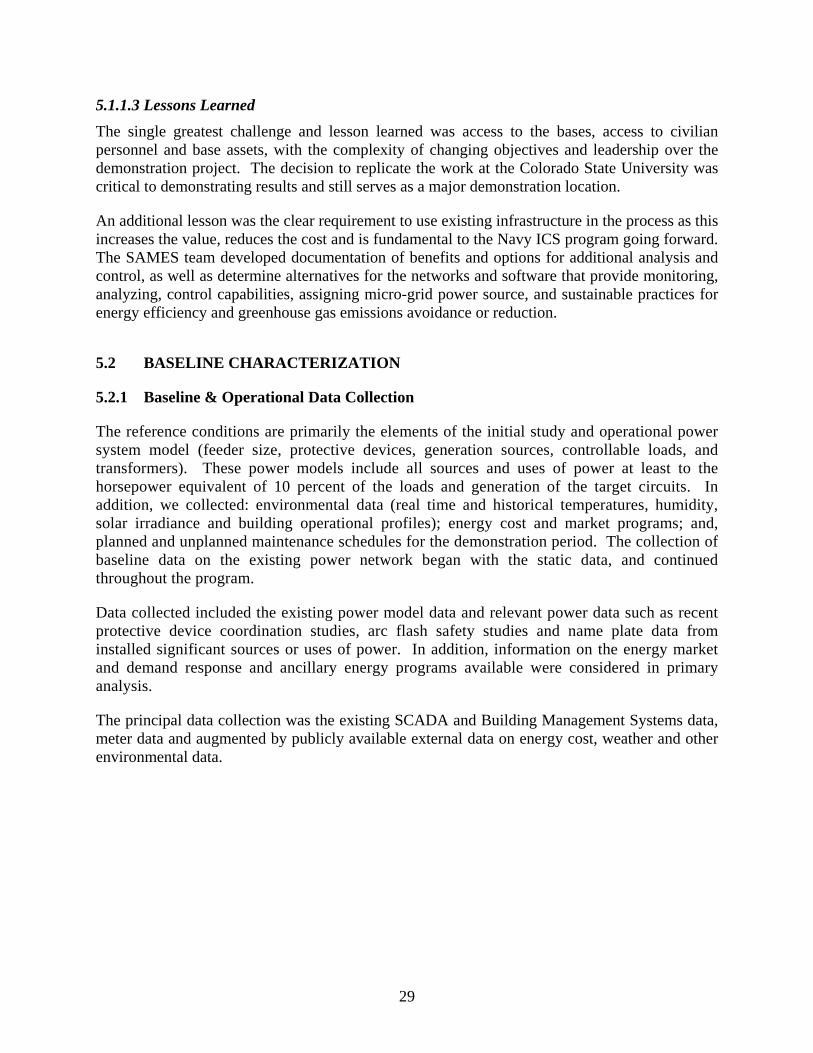
29
5.1.1.3 Lessons Learned The single greatest challenge and lesson learned was access to the bases, access to civilian personnel and base assets, with the complexity of changing objectives and leadership over the demonstration project. The decision to replicate the work at the Colorado State University was critical to demonstrating results and still serves as a major demonstration location.
An additional lesson was the clear requirement to use existing infrastructure in the process as this increases the value, reduces the cost and is fundamental to the Navy ICS program going forward. The SAMES team developed documentation of benefits and options for additional analysis and control, as well as determine alternatives for the networks and software that provide monitoring, analyzing, control capabilities, assigning micro-grid power source, and sustainable practices for energy efficiency and greenhouse gas emissions avoidance or reduction.
5.2 BASELINE CHARACTERIZATION
5.2.1 Baseline & Operational Data Collection
The reference conditions are primarily the elements of the initial study and operational power system model (feeder size, protective devices, generation sources, controllable loads, and transformers). These power models include all sources and uses of power at least to the horsepower equivalent of 10 percent of the loads and generation of the target circuits. In addition, we collected: environmental data (real time and historical temperatures, humidity, solar irradiance and building operational profiles); energy cost and market programs; and, planned and unplanned maintenance schedules for the demonstration period. The collection of baseline data on the existing power network began with the static data, and continued throughout the program.
Data collected included the existing power model data and relevant power data such as recent protective device coordination studies, arc flash safety studies and name plate data from installed significant sources or uses of power. In addition, information on the energy market and demand response and ancillary energy programs available were considered in primary analysis.
The principal data collection was the existing SCADA and Building Management Systems data, meter data and augmented by publicly available external data on energy cost, weather and other environmental data.
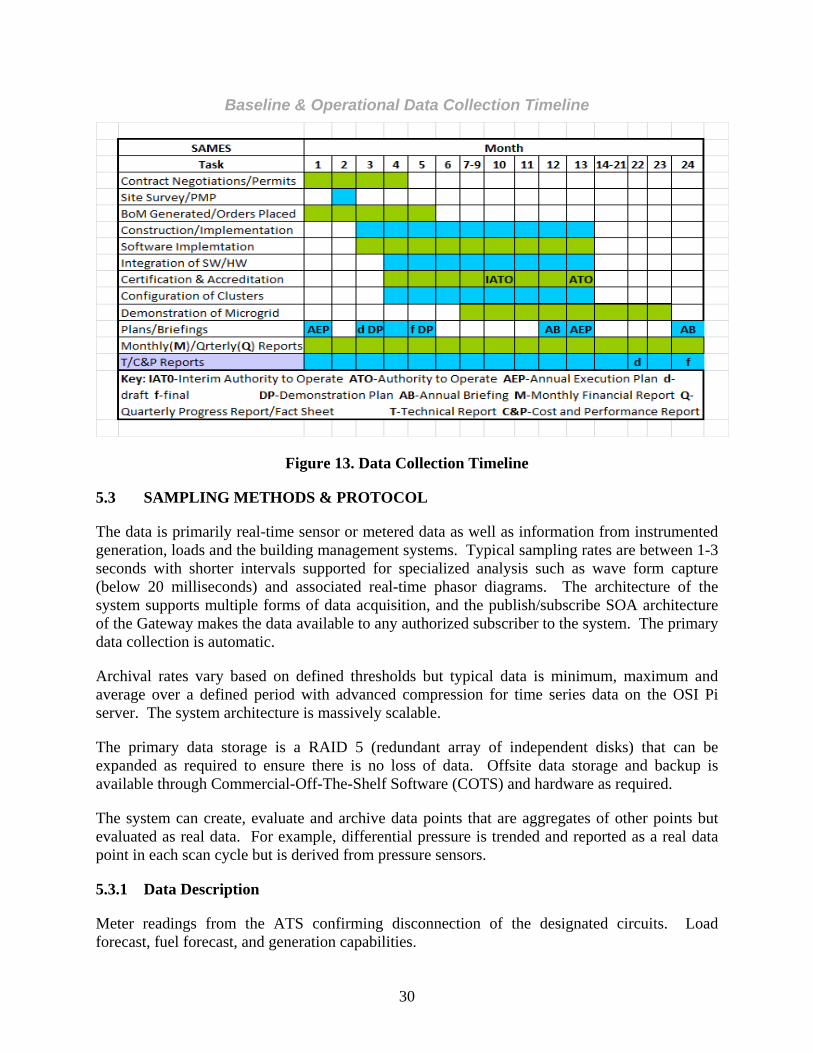
30
Baseline & Operational Data Collection Timeline
Figure 13. Data Collection Timeline
5.3 SAMPLING METHODS & PROTOCOL
The data is primarily real-time sensor or metered data as well as information from instrumented generation, loads and the building management systems. Typical sampling rates are between 1-3 seconds with shorter intervals supported for specialized analysis such as wave form capture (below 20 milliseconds) and associated real-time phasor diagrams. The architecture of the system supports multiple forms of data acquisition, and the publish/subscribe SOA architecture of the Gateway makes the data available to any authorized subscriber to the system. The primary data collection is automatic.
Archival rates vary based on defined thresholds but typical data is minimum, maximum and average over a defined period with advanced compression for time series data on the OSI Pi server. The system architecture is massively scalable.
The primary data storage is a RAID 5 (redundant array of independent disks) that can be expanded as required to ensure there is no loss of data. Offsite data storage and backup is available through Commercial-Off-The-Shelf Software (COTS) and hardware as required.
The system can create, evaluate and archive data points that are aggregates of other points but evaluated as real data. For example, differential pressure is trended and reported as a real data point in each scan cycle but is derived from pressure sensors.
5.3.1 Data Description
Meter readings from the ATS confirming disconnection of the designated circuits. Load forecast, fuel forecast, and generation capabilities.
31
5.3.2 Data Collectors
5.3.2.1 Iconics
• Areas of Monitoring: Naval Medical Center (NMC). Iconics is low voltage control (SCADA) interface including generation. This is the most important control interface in the microgrid. The Iconics system was not integrated into the demonstration because of cyber security limitations of the system at the time. That was being addressed by the operations staff but not in sufficient time to be part of the demonstration. The time series data from Iconics was included in the analysis. − Also of note, the Spirae hardware at the Colorado State demonstration facility was the
source of high resolution control data as the Iconics would have been but the Spirae system is several generations advanced over the existing Iconics system.
• Status: Connectivity was never achieved. Some historical data was provided
5.3.2.2 Johnson Controls (Niagara)
• Areas of Monitoring: North Island and Point Loma (mechanical data source—crack detection, etc.). JCL (Niagara) is the building management system.
• Status: Integration with the Niagara BMS server was critical to obtaining authority to operate. Integration was complete, but not expanded over initial point set.
5.3.2.3 Telvent
• Areas of Monitoring: North Island and Point Loma (main source of medium voltage electrical data). Telvent is the medium voltage SCADA system.
• Status: JCI and Telvent provide real-time data to the SAMES system; however, connectivity was intermittent due to changes being made by IT to network security.
5.4 SAMPLING RESULTS
5.4.1 Scenarios & Relevant Time-Series Analysis
As described earlier, the data for the following was acquired through the real-time system and other relevant unstructured data sources for the three Naval Base’s in the SAMES project. The unstructured time series data was normalized to dates of the demonstration, and multiple hypotheses and scenarios were evaluated and reported on.
All of the locations demonstrate seasonality due to weather and time-of-use during the day. Several outliers exist primarily as the result of bad data reads that are addressed in the analysis. Weather variables are monitored on an interval basis. The initial step is to identify any missing value for a measured interval and infer it using interpolation (this is done to implement a system capable of working in real time). Then, air temperature, average wind speed, average wind direction, solar radiation, relative humidity and pressure are averaged into intervals to obtain hourly measures. Precipitation is not averaged, but accumulated. Then, daily average values are calculated for all the variables.

32
Once calculations were performed, load curves, including the technical outliers detected, hourly weather variable values, and the averaged weather variable values for each day were part of the data set analyzed. The next step in this process was to examine all patterns (full days) excluding patterns with load curves marked as technical outliers, and patterns with too many missing values for a weather variable to be interpolated.
For the statistics and probability, a correlation measuring the strength of the relationship between two variables was applied. Among the several coefficients measuring this correlation degree, the one chosen for this study as the most widespread and commonly employed is the Pearson's linear correlation coefficient. It is obtained by dividing the covariance of two variables by the product of their standard deviations. Pearson's correlation can be defined as an index that measures to what extent two quantitative variables are linearly related.
Correlation coefficients can range from −1.00 to +1.00:
r = +1 represents a perfect positive linear correlation;
0.0 < |r| < 0.09 represents no correlation;
0.1 < |r| < 0.25 represents a small linear correlation;
0.26 < |r| < 0.40 represents a medium linear correlation;
0.41 < |r| < 1.0 represents a strong linear correlation;
r = 0 indicates that both variables are not linearly related;
−1 < r < 0 represents a negative linear correlation; and,
r = −1 represents a perfect negative linear correlation.
This study focused on the direct relationship between electric power demand and the set of weather variables considered for the locations.
5.4.1.1 The Naval Base Coronado – Naval Medical Center – Point Loma Data sets included meter data from twelve meters at the Naval Medical Center, two meters from the North Island Coronado Naval Base, and three meters from the anti-submarine Point Loma Naval Base. The dataset includes two quantitative variables for each meter: one for time and one for the kW consumption. The values were recorded every fifteen minutes. Where applicable, the data was corrected using a corresponding meter multiplier value.
The data range consists of data collections during a period of 452 days starting March 1, 2014 through May 27, 2015. The lowest reading noted in the 15-minute data intervals collected, during this 452-day period, was 0, and the highest reading obtained was 154,536 kW. From the data sets, the Naval Medical Hospital was the largest consumer of energy, which measured at 16,144,828 kWh during this 452-day collection period. Point Loma’s meter data includes a solar panel array for the meter labeled ‘carport.’ Coronado’s data was the most inconsistent with a baseline at zero interspersed with random spikes.
33
A second data set consists of near real-time weather composites. The weather sets come from NASA’s Langley Research Center’s (LARC) Prediction of Worldwide Energy Resource (POWER). NASA’s weather sets consists of near real-time daily global radiation and weather forecasting. Solar Data Warehouse estimates the average percent error in NASA’s satellite data, comparing it to 13 high-quality reference stations, to be about 20 percent for solar radiation measurements. Of the three data sets utilized in this study, (Solar Data Warehouse, SUNY Satellite-to-Solar, and NASA), the NASA data set is the only data set that is available at no cost to the public. SUNY satellite to solar data is estimated to have an average percent error of approximately 20 percent, and Solar Data Warehouse is estimated to have an average percent error of approximately 10 percent. NASA estimates their ground-measured data to be more accurate than the satellite-derived data. NASA’s data for daily mean all sky irradiance, compared to Baseline Surface Radiation Network (BSRN) daily mean irradiance, has a root mean square error of 20.57 percent. For NASA’s temperature and wind speed data, compared to National Centers for Environmental Information (NCEI) data, the root mean square error was 1-3 percent; 2.13 percent for average temperature, and 1.3 percent for average wind speed.
World Radiation Monitoring Center (WRMC), is the central archive for the Baseline Surface Radiation Network (BSRN). All radiation measurements are stored together with collocated surface and upper-air meteorological observations and station metadata in an integrated database. NASA’s error calculations compared to the BSRN irradiation data, and the NCEI temperature and wind data, is estimated using a linear least squares regression analysis.
The data set used for evaluations include five quantitative variables: date, solar radiation (kWh/m^2/day), amount of rain (mm/day), temperature (degrees Celsius - two meters from Earth’s surface), and wind speed (m/s - ten meters from Earth’s surface).
A third data set was collected from the Telvent SCADA system. Telvent is a highly distributed real-time platform for supervisory control and data acquisition (SCADA). The Telvent platform has a comprehensive SCADA solution that applies a combined-technology approach. It creates a single infrastructure and user interface for enterprise consistency and efficiency. Integrated with the SAMES platform, the Telvent SCADA system’s set of tools, along with the SAMES power model, can perform monitoring, analysis, control, dispatch, planning and training for distribution networks, using real-time, planning, or simulation modes.
The fourth data set is the Iconics data set. Iconics is an automation software SCADA software product that is used for the low voltage control at the three San Diego Navy bases part of SAMES and used by many other Navy installations in North America. Iconics was founded in 1986, but was not part of the cyber secure architecture of NAVAFAC SW during the period of the demonstration. This data set was provided as time series data not part of the real-time system and includes Solar gas turbine (a Caterpillar company) located at the Naval Medical Center. This data set contains fourteen quantitative variables recorded every fifteen minutes. Three of those variables are date, time, and date and time. The other quantitative variables are the kW and kWh of the main and alternate utility lines, as well as the lines coming out of the solar gas turbine CGT1 and CGT4. The values range from 1e-10 to 1e10.
34
Most-advanced power analysis technology must support both three-phase balanced and unbalanced state estimation. With it, the microgrid can take advantage of advanced load management, closed-loop control for self-healing automation, and distributed energy resource modeling that supports economic decisions and reliability management. This data set is integrated to the real-time data from the Power Analytics power model created using Power Analytics DesignBase. A fundamental design of the microgrid is to feed real time data into the power model to continuously evaluate the power network (security constrained power flow, voltage stability, short circuit). The results of the real-time analytics are compared to the real time metered data to identify potential issues and when appropriate to re-calibrate the power model based on dynamic conditions.
The visualization of this power model is typically in the single-line or one-line of the power model from installed software that records values passing through the DesignBase one-line. The dataset includes five quantitative variables, and eleven qualitative variables. The quantitative variables are alarm severity, analog current value, foreground color, last time stamp, and time interval. The qualitative variables are analog breaker, breaker in alarm, flash, fresh, in error, manual, message, off-scan, SCADA system, and tag attribute. Of those variables, the analog breaker denotes which base, line, and measurement is being recorded; breaker in alarm is always false; flash and fresh are true or false; in error and manual are always false; off-scan is always false; SCADA system is either backup, main, or dss; and tag attribute is always null.
5.4.1.2 Naval Medical Center The San Diego Naval Medical Center consumed 16,144,828 kWh over the time period of March 1, 2014 to May 27, 2015. The maximum consumption for one day was 85,573.38 kWh, which occurred on September 15, 2014. The entire campus exhibits a time of day sensitivity with larger kWh values occurring between the hours of 8am and 5pm PST. There does not appear to be any outliers in this data, as seen from the box and whisker plots. Additionally, the campus is time-of-year sensitive, as it has greater kWh consumption in the summer months of July, August, and September, corresponding to the historical warmer months of the region. The buildings on the campus that consume the most energy are building 1, the main hospital; and building 7. Their consumption values have a range from 0 kWh to 40,000 kWh; whereas, the other buildings have far less variation and under 10,000 kWh. The average daily energy consumption for the Naval Medical Center is 35,640 kWh, however, that appears to be skewed by the problematic fact that there are many recorded zero values for different buildings within the Naval Medical Center complex.
Figure 14 below is a graph of the different meters of the San Diego Naval Medical Center. We can see that buildings 1 and 7 consume a great portion of the total energy.
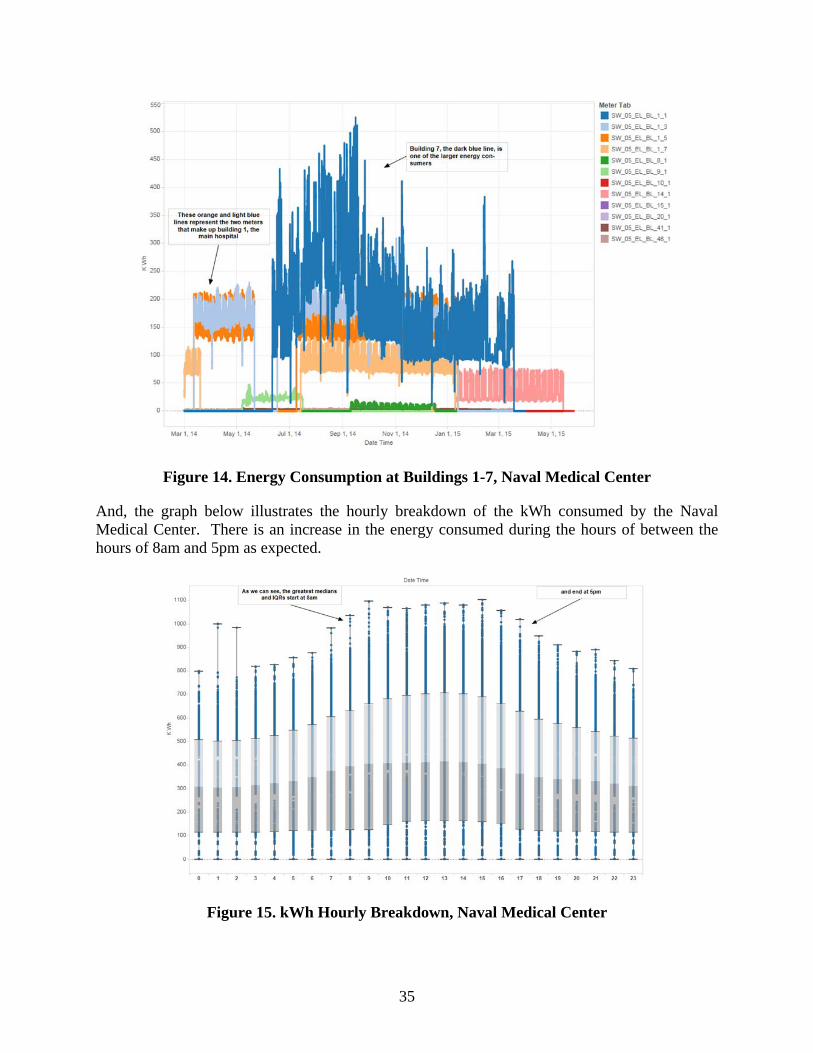
35
Figure 14. Energy Consumption at Buildings 1-7, Naval Medical Center
And, the graph below illustrates the hourly breakdown of the kWh consumed by the Naval Medical Center. There is an increase in the energy consumed during the hours of between the hours of 8am and 5pm as expected.
Figure 15. kWh Hourly Breakdown, Naval Medical Center
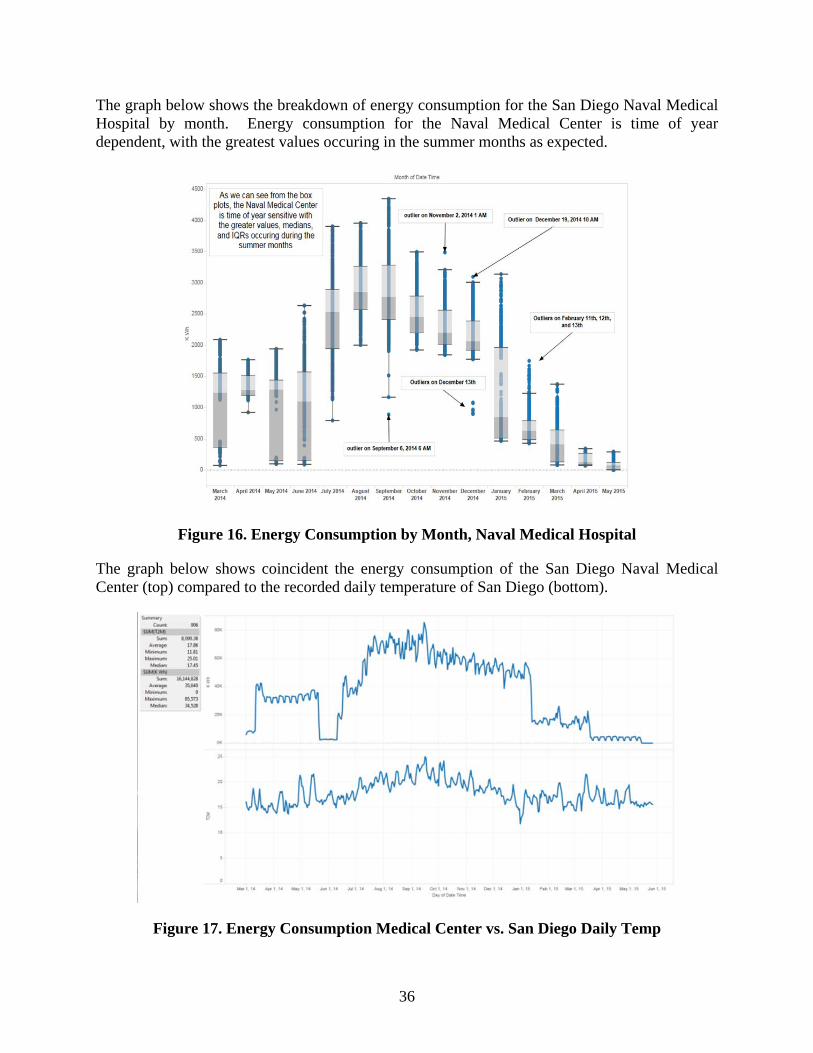
36
The graph below shows the breakdown of energy consumption for the San Diego Naval Medical Hospital by month. Energy consumption for the Naval Medical Center is time of year dependent, with the greatest values occuring in the summer months as expected.
Figure 16. Energy Consumption by Month, Naval Medical Hospital
The graph below shows coincident the energy consumption of the San Diego Naval Medical Center (top) compared to the recorded daily temperature of San Diego (bottom).
Figure 17. Energy Consumption Medical Center vs. San Diego Daily Temp
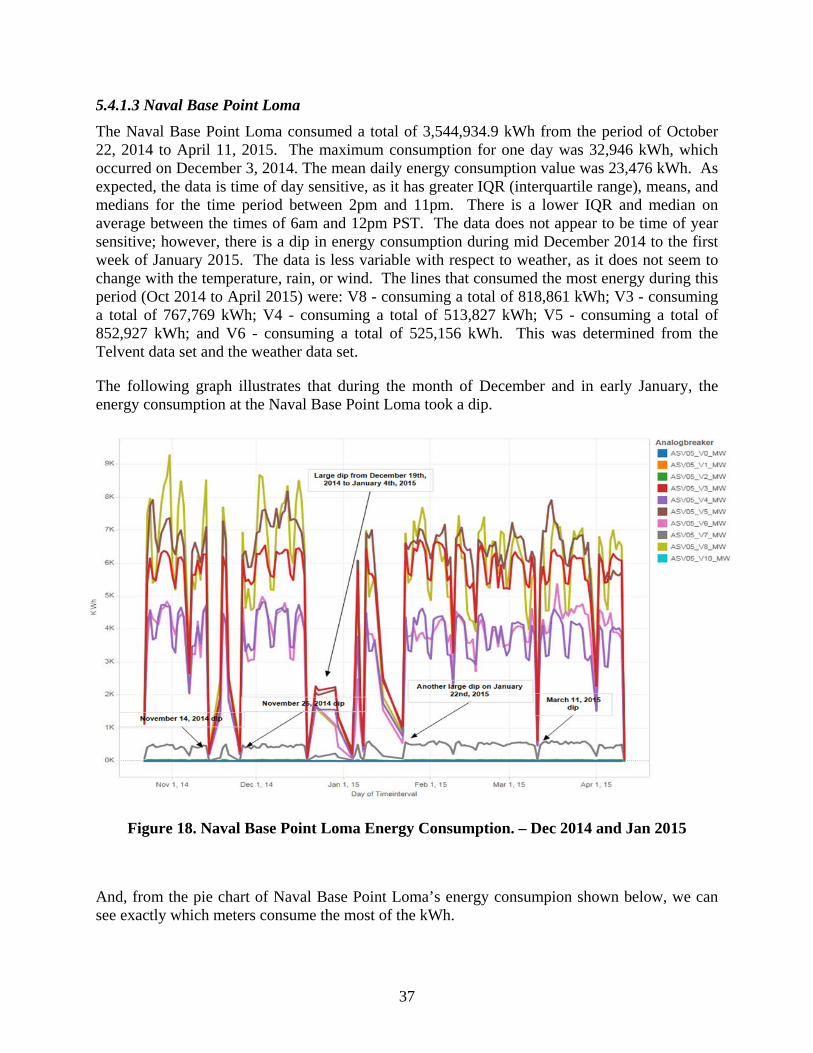
37
5.4.1.3 Naval Base Point Loma The Naval Base Point Loma consumed a total of 3,544,934.9 kWh from the period of October 22, 2014 to April 11, 2015. The maximum consumption for one day was 32,946 kWh, which occurred on December 3, 2014. The mean daily energy consumption value was 23,476 kWh. As expected, the data is time of day sensitive, as it has greater IQR (interquartile range), means, and medians for the time period between 2pm and 11pm. There is a lower IQR and median on average between the times of 6am and 12pm PST. The data does not appear to be time of year sensitive; however, there is a dip in energy consumption during mid December 2014 to the first week of January 2015. The data is less variable with respect to weather, as it does not seem to change with the temperature, rain, or wind. The lines that consumed the most energy during this period (Oct 2014 to April 2015) were: V8 - consuming a total of 818,861 kWh; V3 - consuming a total of 767,769 kWh; V4 - consuming a total of 513,827 kWh; V5 - consuming a total of 852,927 kWh; and V6 - consuming a total of 525,156 kWh. This was determined from the Telvent data set and the weather data set.
The following graph illustrates that during the month of December and in early January, the energy consumption at the Naval Base Point Loma took a dip.
Figure 18. Naval Base Point Loma Energy Consumption. – Dec 2014 and Jan 2015
And, from the pie chart of Naval Base Point Loma’s energy consumpion shown below, we can see exactly which meters consume the most of the kWh.
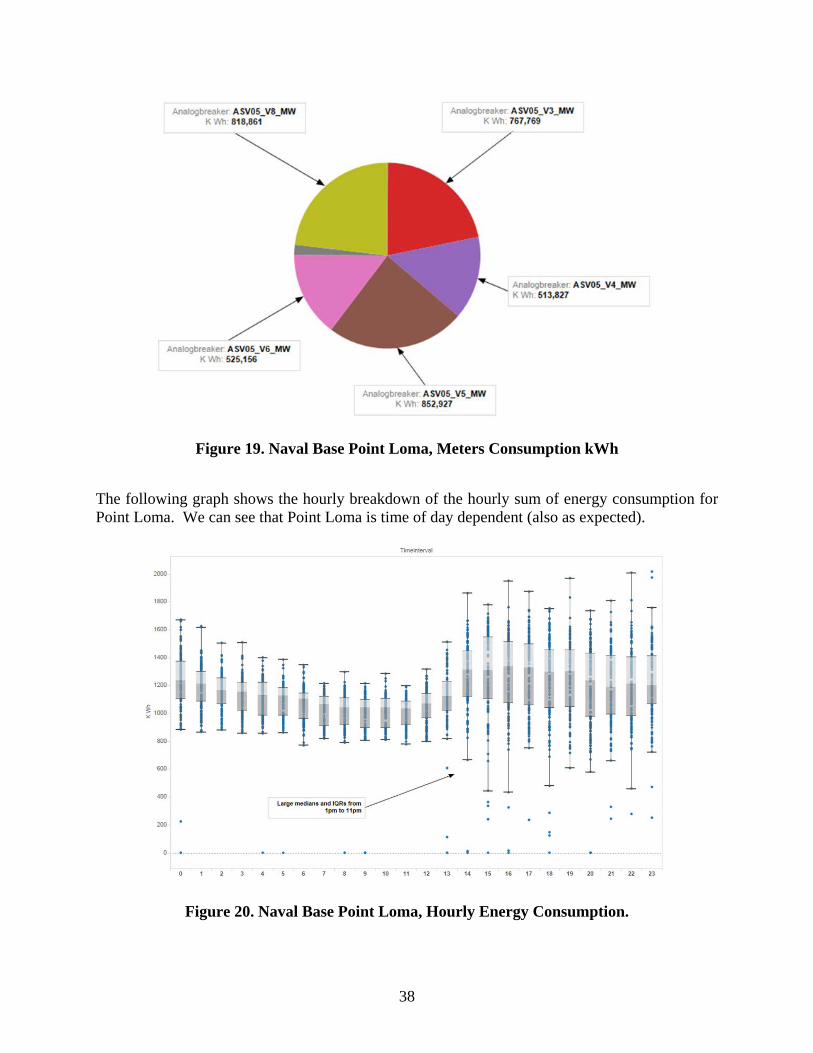
38
Figure 19. Naval Base Point Loma, Meters Consumption kWh
The following graph shows the hourly breakdown of the hourly sum of energy consumption for Point Loma. We can see that Point Loma is time of day dependent (also as expected).
Figure 20. Naval Base Point Loma, Hourly Energy Consumption.
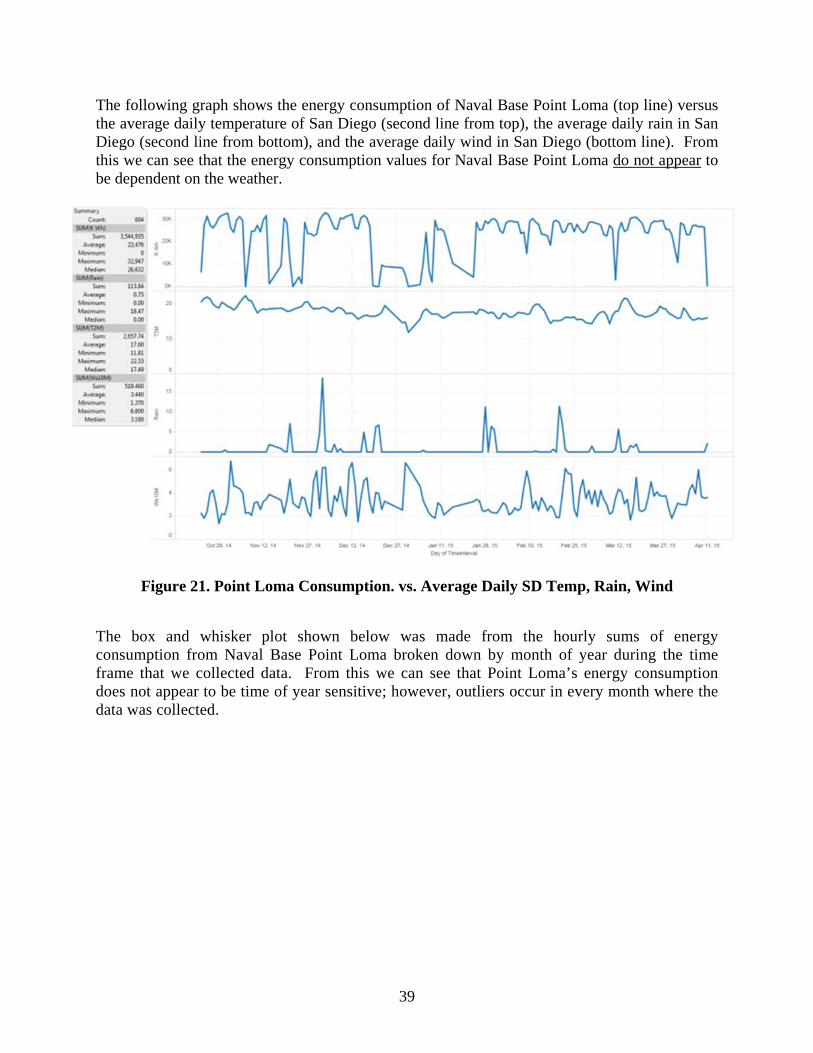
39
The following graph shows the energy consumption of Naval Base Point Loma (top line) versus the average daily temperature of San Diego (second line from top), the average daily rain in San Diego (second line from bottom), and the average daily wind in San Diego (bottom line). From this we can see that the energy consumption values for Naval Base Point Loma do not appear to be dependent on the weather.
Figure 21. Point Loma Consumption. vs. Average Daily SD Temp, Rain, Wind
The box and whisker plot shown below was made from the hourly sums of energy consumption from Naval Base Point Loma broken down by month of year during the time frame that we collected data. From this we can see that Point Loma’s energy consumption does not appear to be time of year sensitive; however, outliers occur in every month where the data was collected.
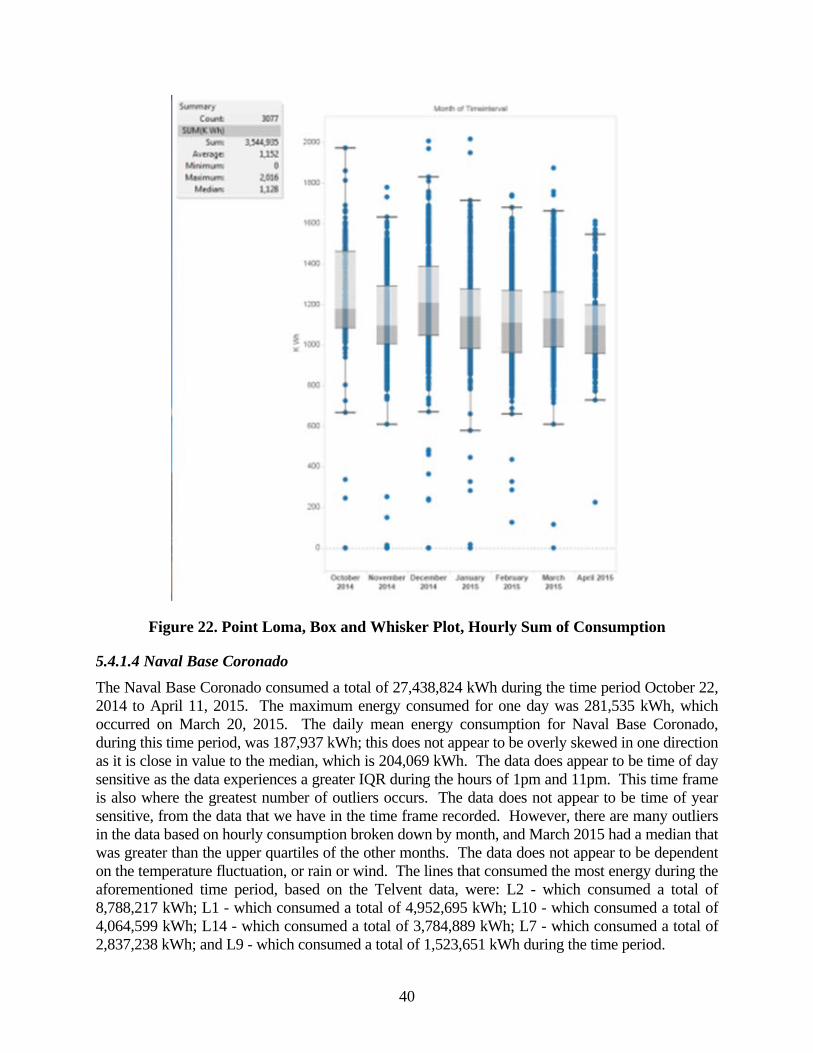
40
Figure 22. Point Loma, Box and Whisker Plot, Hourly Sum of Consumption
5.4.1.4 Naval Base Coronado The Naval Base Coronado consumed a total of 27,438,824 kWh during the time period October 22, 2014 to April 11, 2015. The maximum energy consumed for one day was 281,535 kWh, which occurred on March 20, 2015. The daily mean energy consumption for Naval Base Coronado, during this time period, was 187,937 kWh; this does not appear to be overly skewed in one direction as it is close in value to the median, which is 204,069 kWh. The data does appear to be time of day sensitive as the data experiences a greater IQR during the hours of 1pm and 11pm. This time frame is also where the greatest number of outliers occurs. The data does not appear to be time of year sensitive, from the data that we have in the time frame recorded. However, there are many outliers in the data based on hourly consumption broken down by month, and March 2015 had a median that was greater than the upper quartiles of the other months. The data does not appear to be dependent on the temperature fluctuation, or rain or wind. The lines that consumed the most energy during the aforementioned time period, based on the Telvent data, were: L2 - which consumed a total of 8,788,217 kWh; L1 - which consumed a total of 4,952,695 kWh; L10 - which consumed a total of 4,064,599 kWh; L14 - which consumed a total of 3,784,889 kWh; L7 - which consumed a total of 2,837,238 kWh; and L9 - which consumed a total of 1,523,651 kWh during the time period.
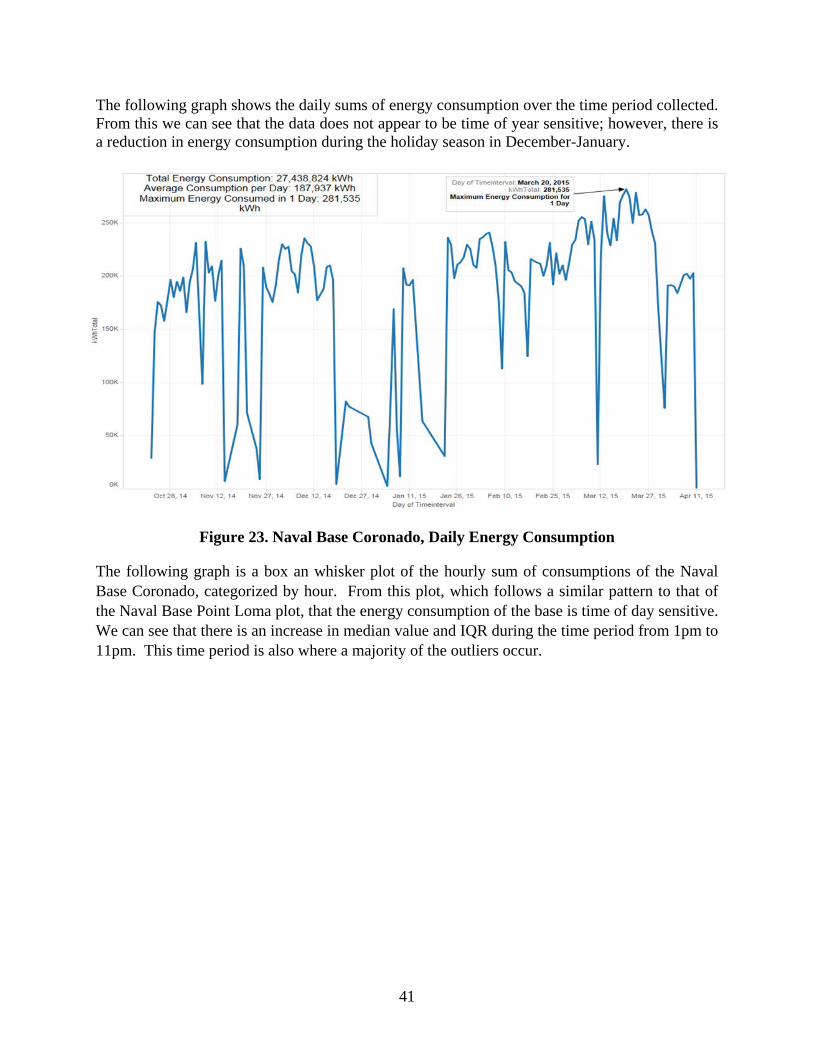
41
The following graph shows the daily sums of energy consumption over the time period collected. From this we can see that the data does not appear to be time of year sensitive; however, there is a reduction in energy consumption during the holiday season in December-January.
Figure 23. Naval Base Coronado, Daily Energy Consumption
The following graph is a box an whisker plot of the hourly sum of consumptions of the Naval Base Coronado, categorized by hour. From this plot, which follows a similar pattern to that of the Naval Base Point Loma plot, that the energy consumption of the base is time of day sensitive. We can see that there is an increase in median value and IQR during the time period from 1pm to 11pm. This time period is also where a majority of the outliers occur.
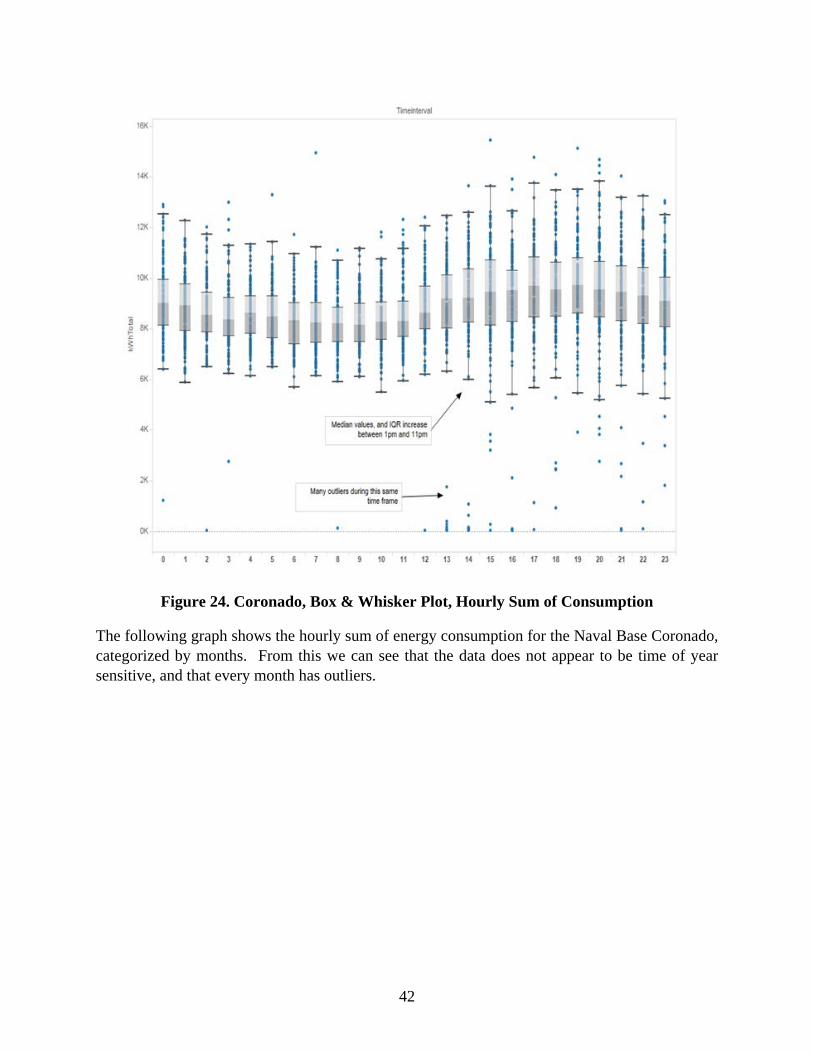
42
Figure 24. Coronado, Box & Whisker Plot, Hourly Sum of Consumption
The following graph shows the hourly sum of energy consumption for the Naval Base Coronado, categorized by months. From this we can see that the data does not appear to be time of year sensitive, and that every month has outliers.
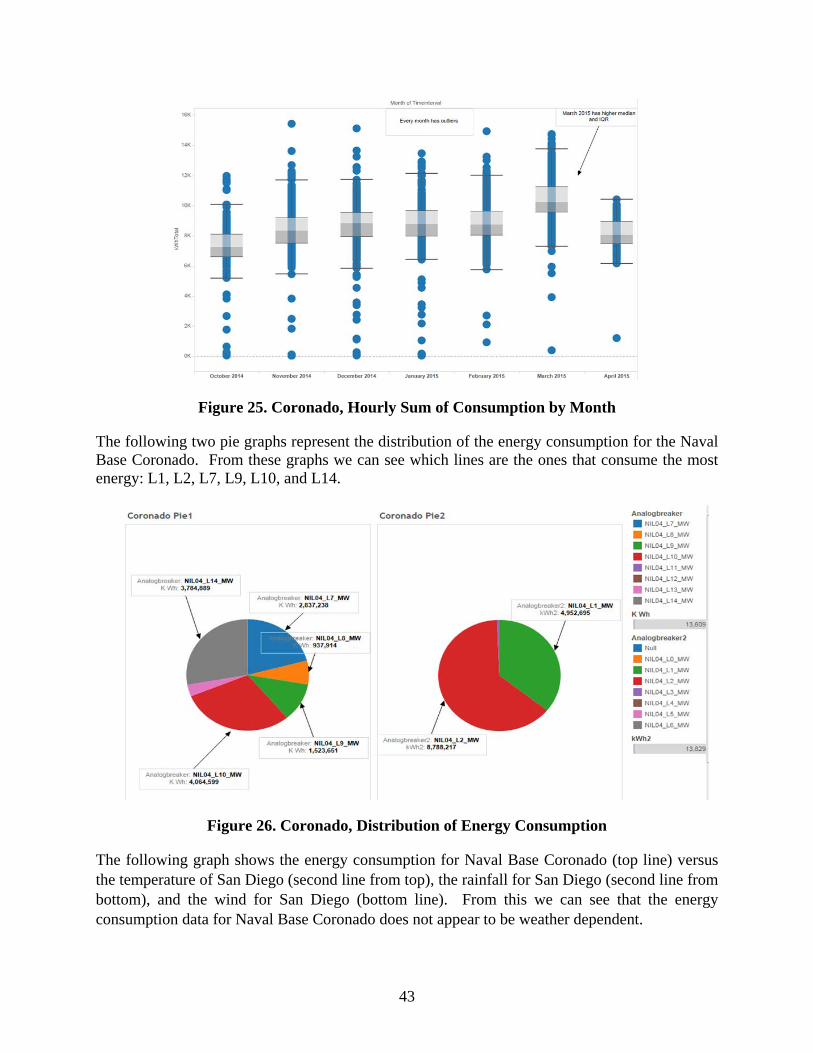
43
Figure 25. Coronado, Hourly Sum of Consumption by Month
The following two pie graphs represent the distribution of the energy consumption for the Naval Base Coronado. From these graphs we can see which lines are the ones that consume the most energy: L1, L2, L7, L9, L10, and L14.
Figure 26. Coronado, Distribution of Energy Consumption
The following graph shows the energy consumption for Naval Base Coronado (top line) versus the temperature of San Diego (second line from top), the rainfall for San Diego (second line from bottom), and the wind for San Diego (bottom line). From this we can see that the energy consumption data for Naval Base Coronado does not appear to be weather dependent.
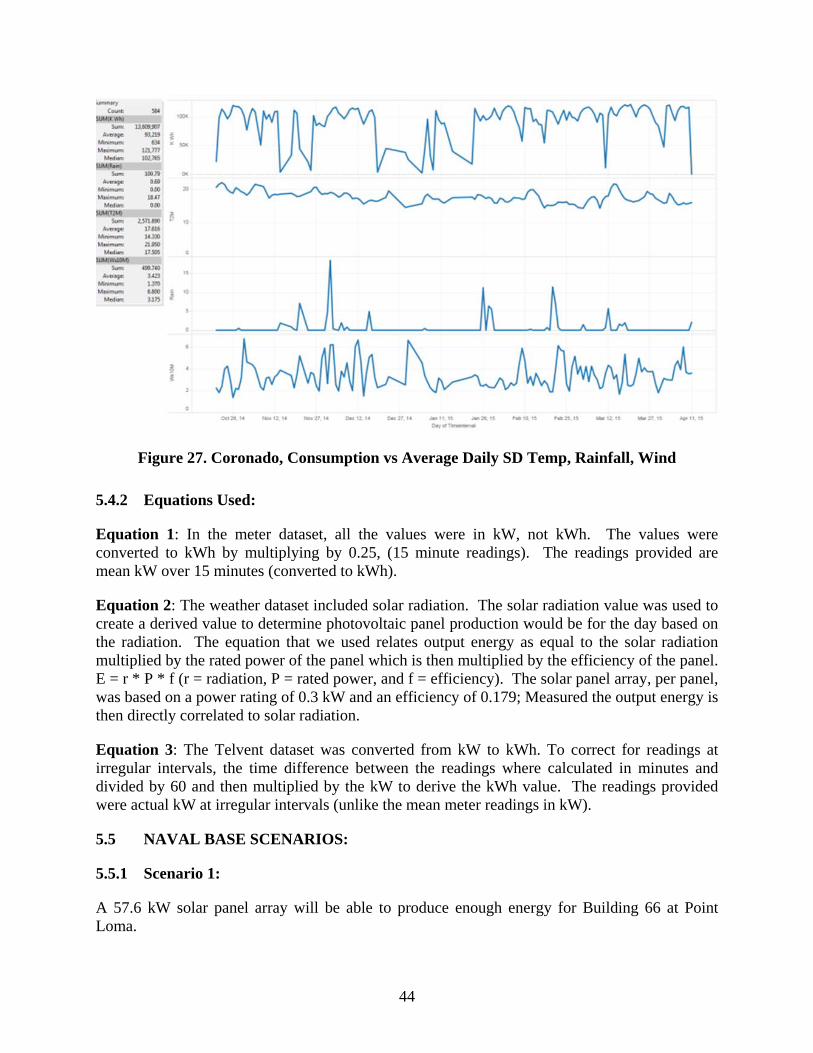
44
Figure 27. Coronado, Consumption vs Average Daily SD Temp, Rainfall, Wind
5.4.2 Equations Used:
Equation 1: In the meter dataset, all the values were in kW, not kWh. The values were converted to kWh by multiplying by 0.25, (15 minute readings). The readings provided are mean kW over 15 minutes (converted to kWh).
Equation 2: The weather dataset included solar radiation. The solar radiation value was used to create a derived value to determine photovoltaic panel production would be for the day based on the radiation. The equation that we used relates output energy as equal to the solar radiation multiplied by the rated power of the panel which is then multiplied by the efficiency of the panel. E = r * P * f (r = radiation, P = rated power, and f = efficiency). The solar panel array, per panel, was based on a power rating of 0.3 kW and an efficiency of 0.179; Measured the output energy is then directly correlated to solar radiation.
Equation 3: The Telvent dataset was converted from kW to kWh. To correct for readings at irregular intervals, the time difference between the readings where calculated in minutes and divided by 60 and then multiplied by the kW to derive the kWh value. The readings provided were actual kW at irregular intervals (unlike the mean meter readings in kW).
5.5 NAVAL BASE SCENARIOS:
5.5.1 Scenario 1:
A 57.6 kW solar panel array will be able to produce enough energy for Building 66 at Point Loma.
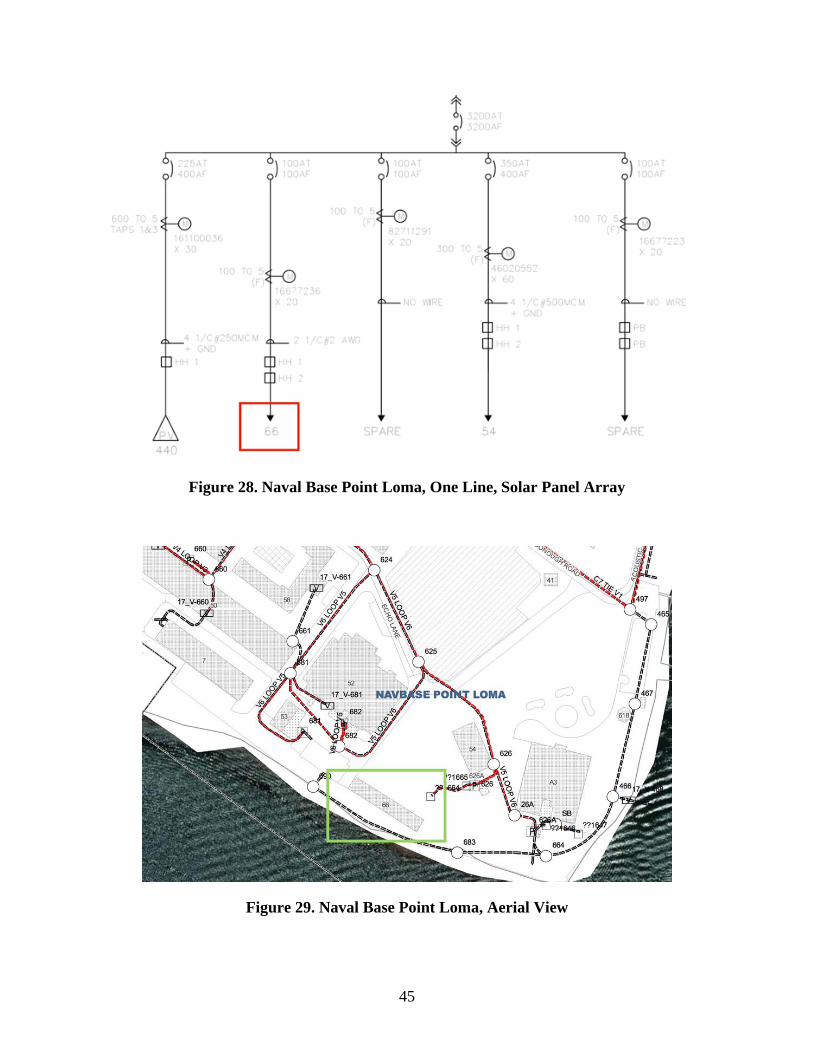
45
Figure 28. Naval Base Point Loma, One Line, Solar Panel Array
Figure 29. Naval Base Point Loma, Aerial View
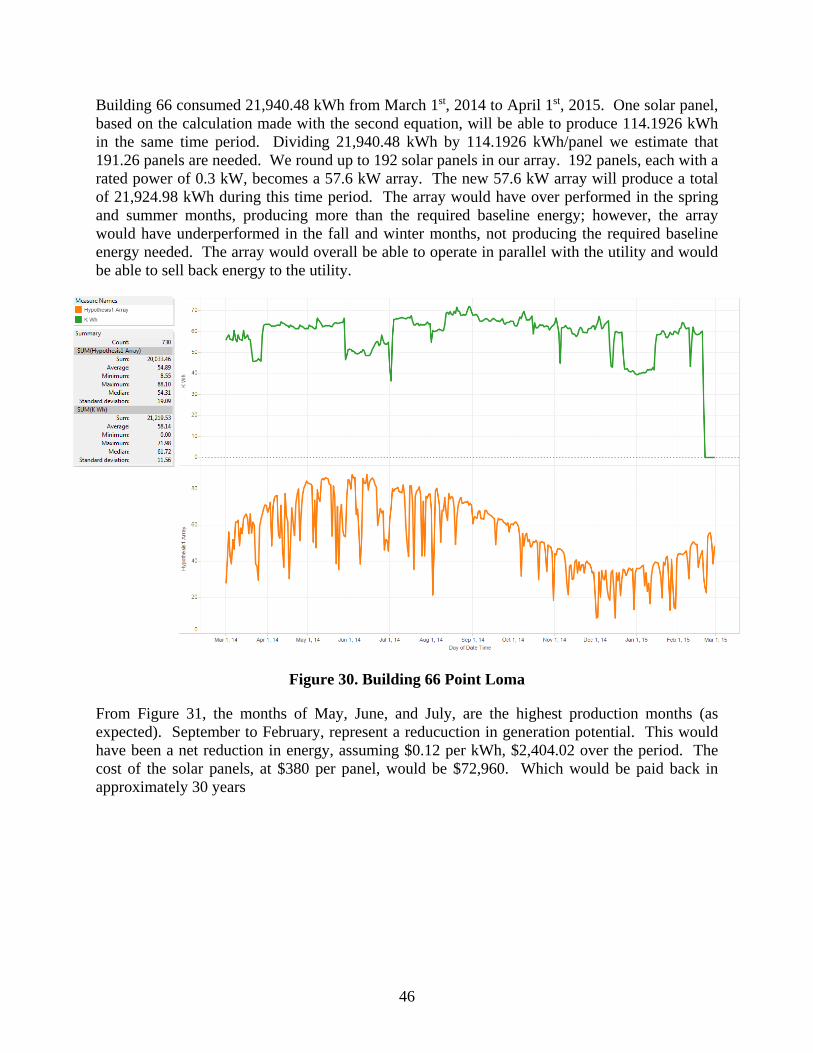
46
Building 66 consumed 21,940.48 kWh from March 1st, 2014 to April 1st, 2015. One solar panel, based on the calculation made with the second equation, will be able to produce 114.1926 kWh in the same time period. Dividing 21,940.48 kWh by 114.1926 kWh/panel we estimate that 191.26 panels are needed. We round up to 192 solar panels in our array. 192 panels, each with a rated power of 0.3 kW, becomes a 57.6 kW array. The new 57.6 kW array will produce a total of 21,924.98 kWh during this time period. The array would have over performed in the spring and summer months, producing more than the required baseline energy; however, the array would have underperformed in the fall and winter months, not producing the required baseline energy needed. The array would overall be able to operate in parallel with the utility and would be able to sell back energy to the utility.
Figure 30. Building 66 Point Loma
From Figure 31, the months of May, June, and July, are the highest production months (as expected). September to February, represent a reducuction in generation potential. This would have been a net reduction in energy, assuming $0.12 per kWh, $2,404.02 over the period. The cost of the solar panels, at $380 per panel, would be $72,960. Which would be paid back in approximately 30 years
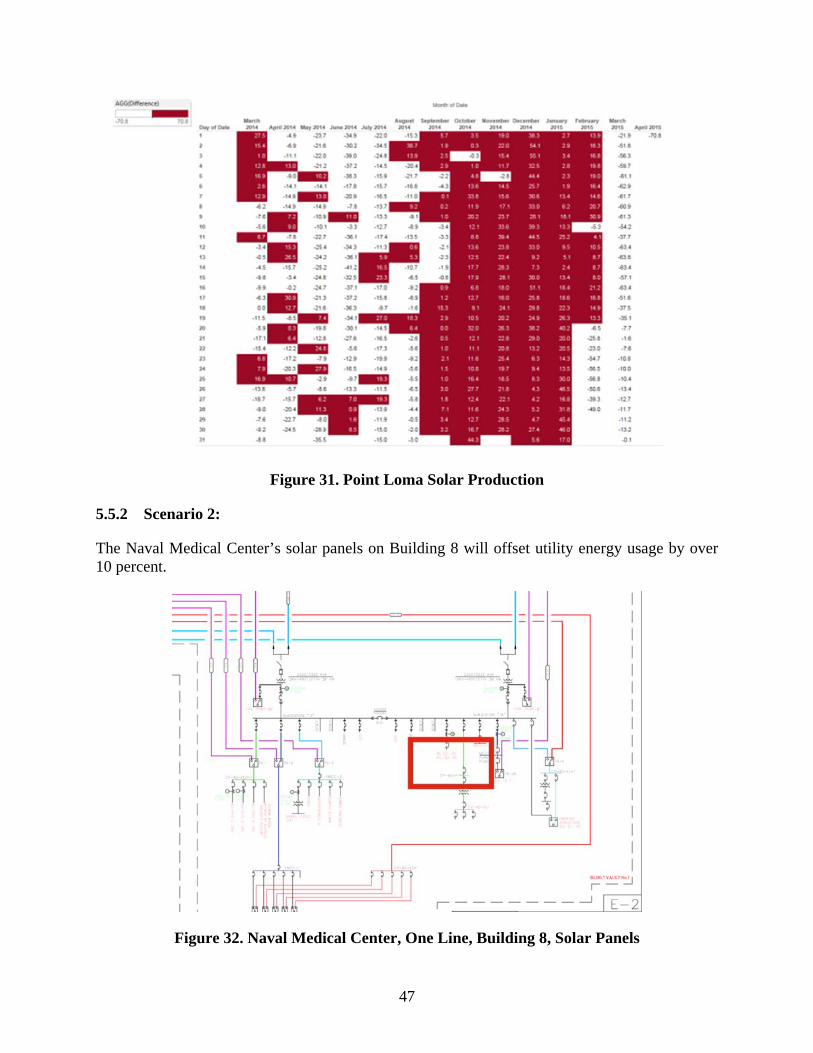
47
Figure 31. Point Loma Solar Production
5.5.2 Scenario 2:
The Naval Medical Center’s solar panels on Building 8 will offset utility energy usage by over 10 percent.
Figure 32. Naval Medical Center, One Line, Building 8, Solar Panels
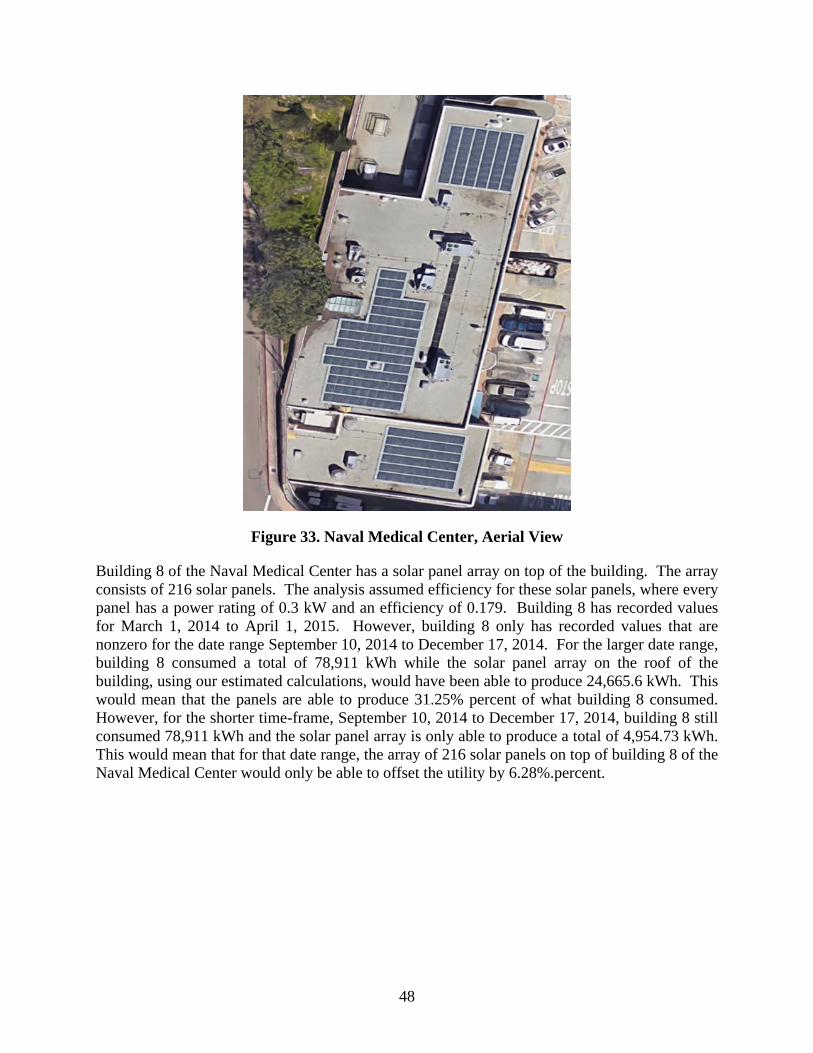
48
Figure 33. Naval Medical Center, Aerial View
Building 8 of the Naval Medical Center has a solar panel array on top of the building. The array consists of 216 solar panels. The analysis assumed efficiency for these solar panels, where every panel has a power rating of 0.3 kW and an efficiency of 0.179. Building 8 has recorded values for March 1, 2014 to April 1, 2015. However, building 8 only has recorded values that are nonzero for the date range September 10, 2014 to December 17, 2014. For the larger date range, building 8 consumed a total of 78,911 kWh while the solar panel array on the roof of the building, using our estimated calculations, would have been able to produce 24,665.6 kWh. This would mean that the panels are able to produce 31.25% percent of what building 8 consumed. However, for the shorter time-frame, September 10, 2014 to December 17, 2014, building 8 still consumed 78,911 kWh and the solar panel array is only able to produce a total of 4,954.73 kWh. This would mean that for that date range, the array of 216 solar panels on top of building 8 of the Naval Medical Center would only be able to offset the utility by 6.28%.percent.
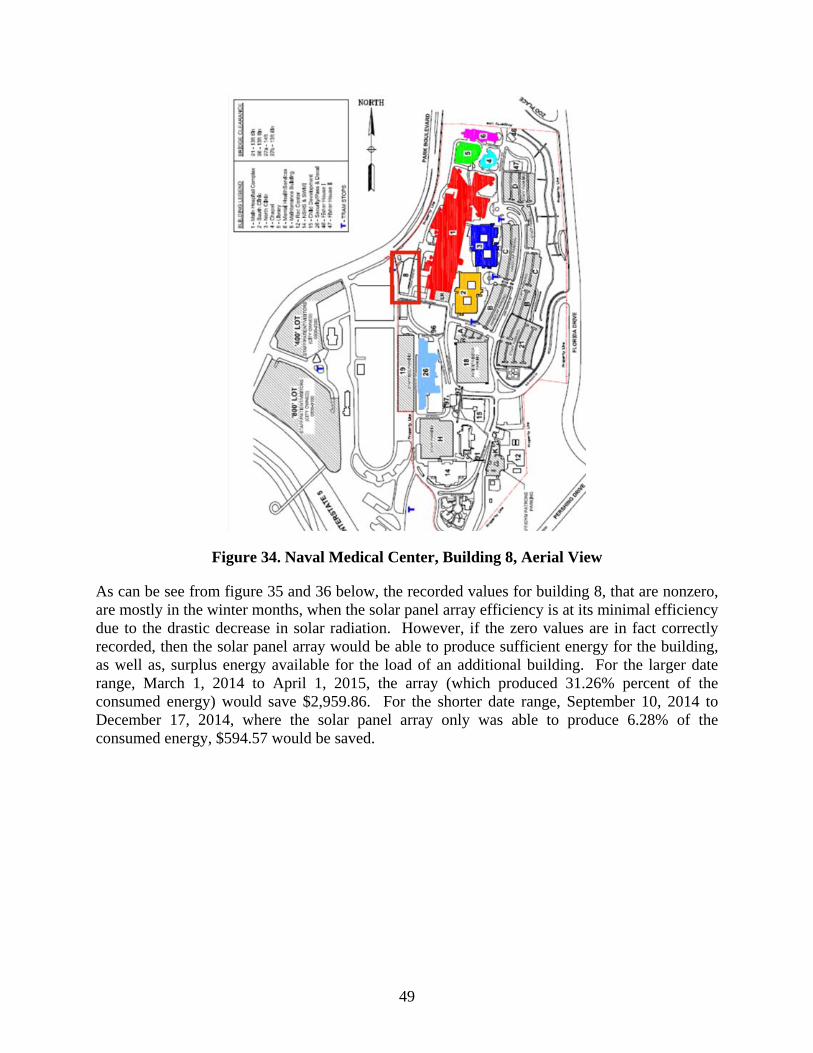
49
Figure 34. Naval Medical Center, Building 8, Aerial View
As can be see from figure 35 and 36 below, the recorded values for building 8, that are nonzero, are mostly in the winter months, when the solar panel array efficiency is at its minimal efficiency due to the drastic decrease in solar radiation. However, if the zero values are in fact correctly recorded, then the solar panel array would be able to produce sufficient energy for the building, as well as, surplus energy available for the load of an additional building. For the larger date range, March 1, 2014 to April 1, 2015, the array (which produced 31.26% percent of the consumed energy) would save $2,959.86. For the shorter date range, September 10, 2014 to December 17, 2014, where the solar panel array only was able to produce 6.28% of the consumed energy, $594.57 would be saved.
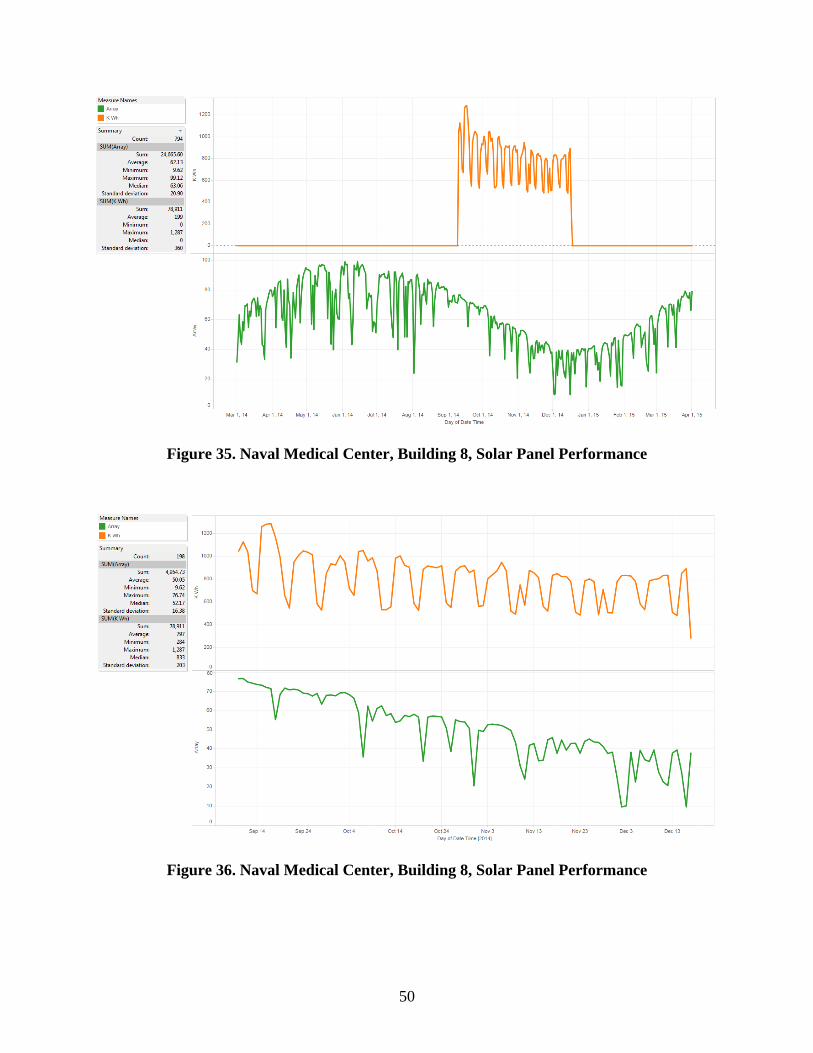
50
Figure 35. Naval Medical Center, Building 8, Solar Panel Performance
Figure 36. Naval Medical Center, Building 8, Solar Panel Performance
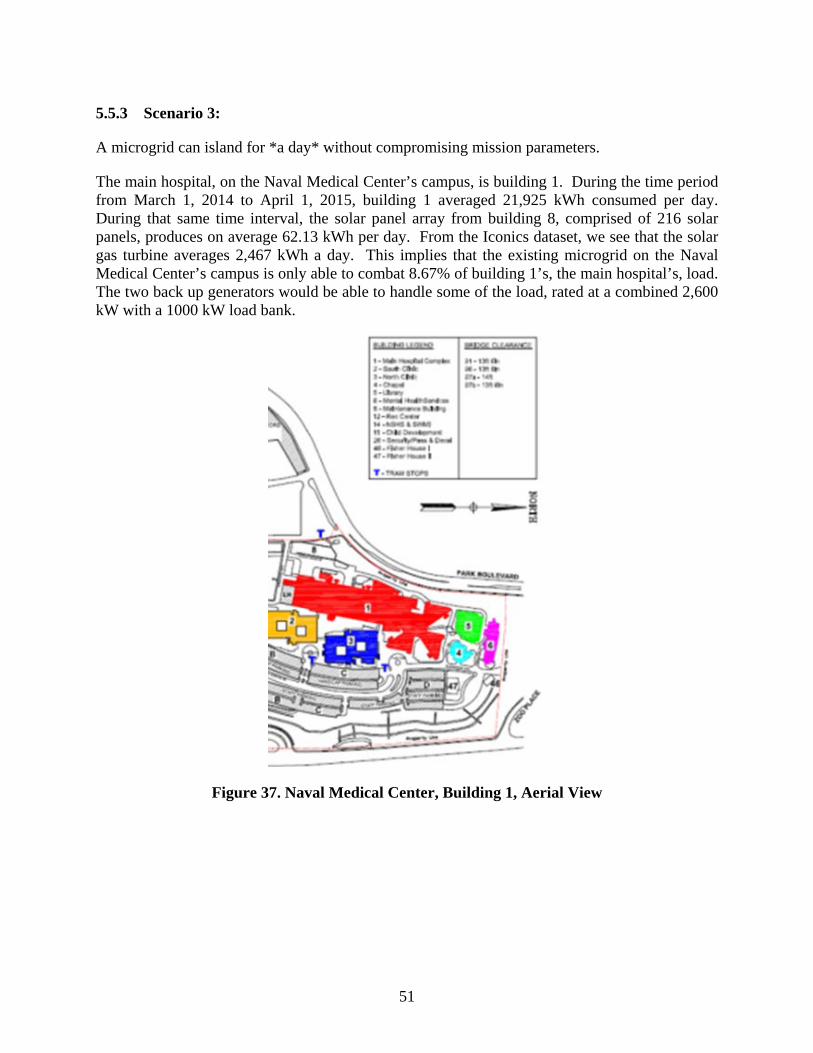
51
5.5.3 Scenario 3:
A microgrid can island for *a day* without compromising mission parameters.
The main hospital, on the Naval Medical Center’s campus, is building 1. During the time period from March 1, 2014 to April 1, 2015, building 1 averaged 21,925 kWh consumed per day. During that same time interval, the solar panel array from building 8, comprised of 216 solar panels, produces on average 62.13 kWh per day. From the Iconics dataset, we see that the solar gas turbine averages 2,467 kWh a day. This implies that the existing microgrid on the Naval Medical Center’s campus is only able to combat 8.67% of building 1’s, the main hospital’s, load. The two back up generators would be able to handle some of the load, rated at a combined 2,600 kW with a 1000 kW load bank.
Figure 37. Naval Medical Center, Building 1, Aerial View
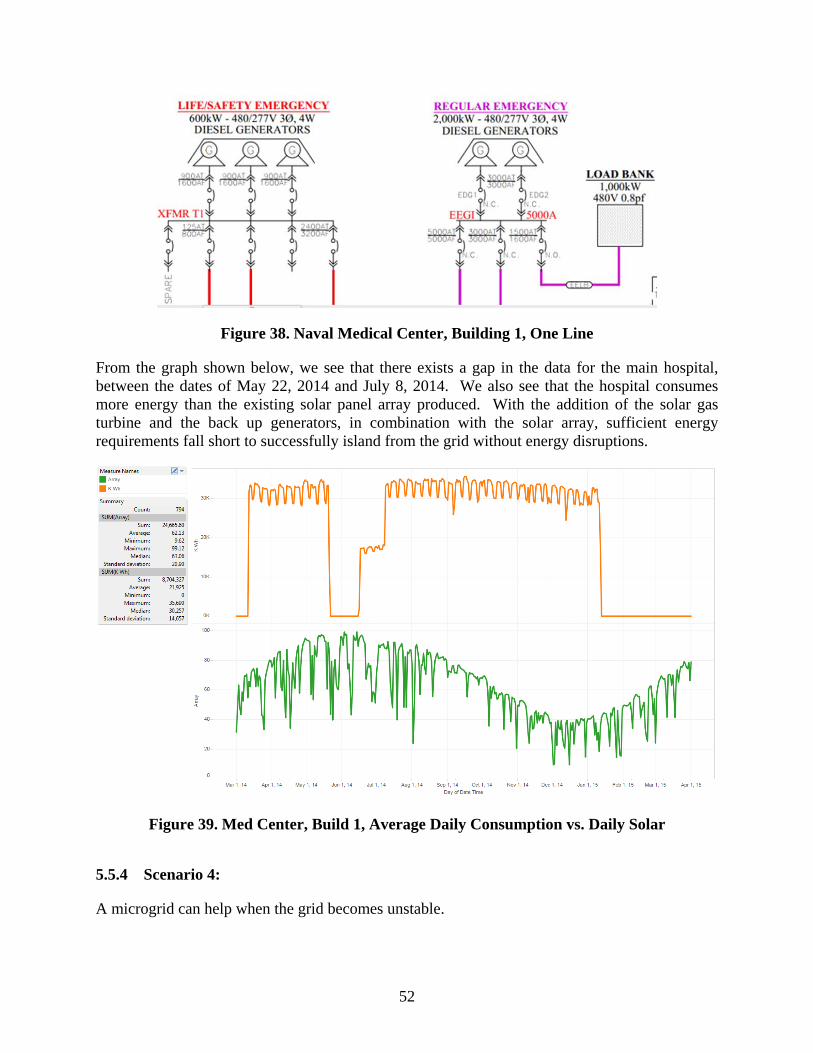
52
Figure 38. Naval Medical Center, Building 1, One Line
From the graph shown below, we see that there exists a gap in the data for the main hospital, between the dates of May 22, 2014 and July 8, 2014. We also see that the hospital consumes more energy than the existing solar panel array produced. With the addition of the solar gas turbine and the back up generators, in combination with the solar array, sufficient energy requirements fall short to successfully island from the grid without energy disruptions.
Figure 39. Med Center, Build 1, Average Daily Consumption vs. Daily Solar
5.5.4 Scenario 4:
A microgrid can help when the grid becomes unstable.
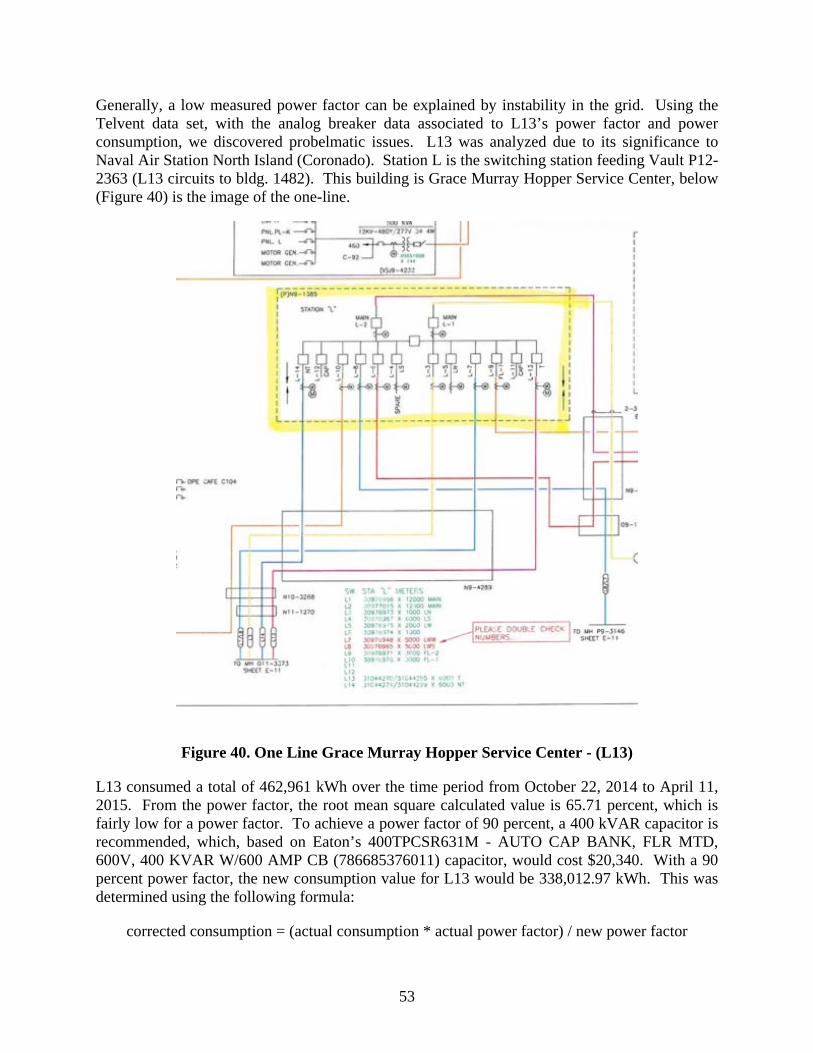
53
Generally, a low measured power factor can be explained by instability in the grid. Using the Telvent data set, with the analog breaker data associated to L13’s power factor and power consumption, we discovered probelmatic issues. L13 was analyzed due to its significance to Naval Air Station North Island (Coronado). Station L is the switching station feeding Vault P12-2363 (L13 circuits to bldg. 1482). This building is Grace Murray Hopper Service Center, below (Figure 40) is the image of the one-line.
Figure 40. One Line Grace Murray Hopper Service Center - (L13)
L13 consumed a total of 462,961 kWh over the time period from October 22, 2014 to April 11, 2015. From the power factor, the root mean square calculated value is 65.71 percent, which is fairly low for a power factor. To achieve a power factor of 90 percent, a 400 kVAR capacitor is recommended, which, based on Eaton’s 400TPCSR631M - AUTO CAP BANK, FLR MTD, 600V, 400 KVAR W/600 AMP CB (786685376011) capacitor, would cost $20,340. With a 90 percent power factor, the new consumption value for L13 would be 338,012.97 kWh. This was determined using the following formula:
corrected consumption = (actual consumption * actual power factor) / new power factor
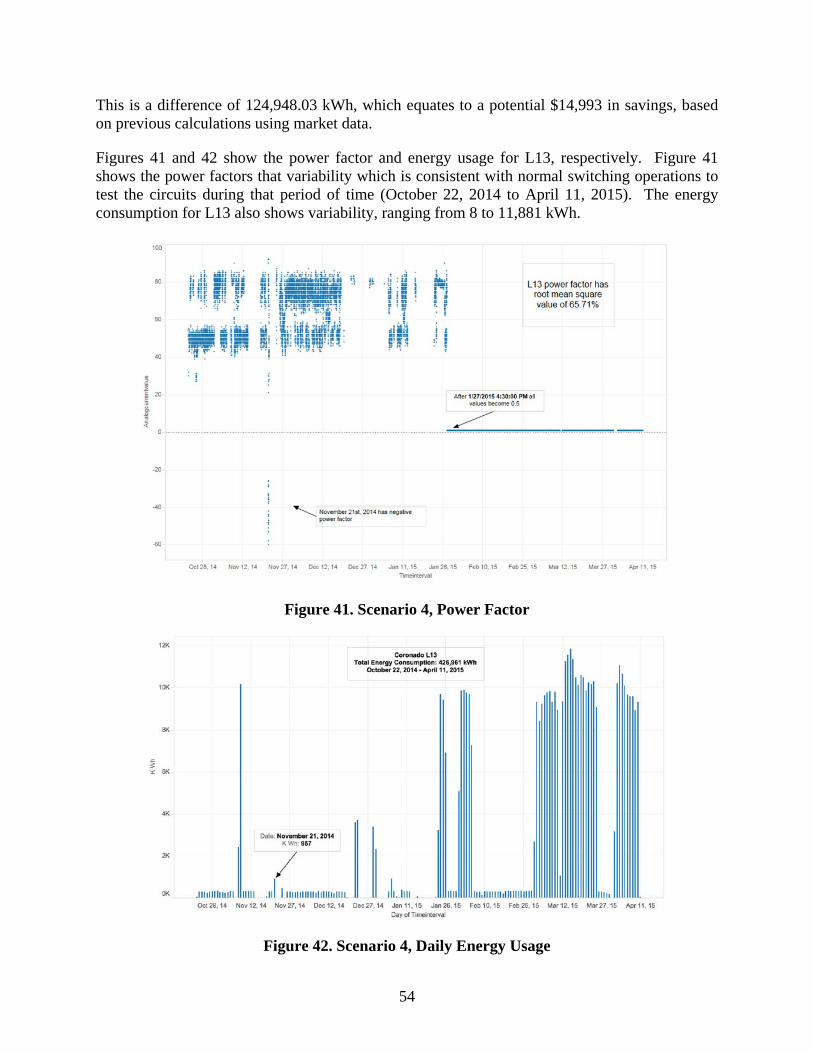
54
This is a difference of 124,948.03 kWh, which equates to a potential $14,993 in savings, based on previous calculations using market data.
Figures 41 and 42 show the power factor and energy usage for L13, respectively. Figure 41 shows the power factors that variability which is consistent with normal switching operations to test the circuits during that period of time (October 22, 2014 to April 11, 2015). The energy consumption for L13 also shows variability, ranging from 8 to 11,881 kWh.
Figure 41. Scenario 4, Power Factor
Figure 42. Scenario 4, Daily Energy Usage
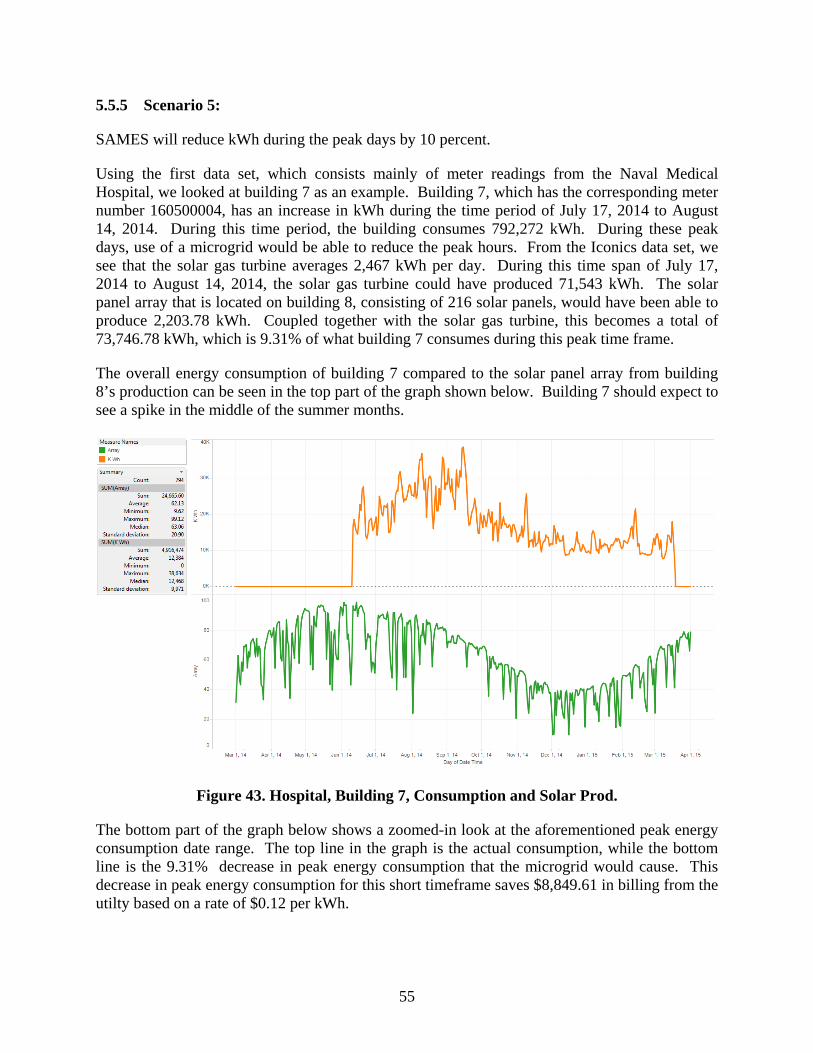
55
5.5.5 Scenario 5:
SAMES will reduce kWh during the peak days by 10 percent.
Using the first data set, which consists mainly of meter readings from the Naval Medical Hospital, we looked at building 7 as an example. Building 7, which has the corresponding meter number 160500004, has an increase in kWh during the time period of July 17, 2014 to August 14, 2014. During this time period, the building consumes 792,272 kWh. During these peak days, use of a microgrid would be able to reduce the peak hours. From the Iconics data set, we see that the solar gas turbine averages 2,467 kWh per day. During this time span of July 17, 2014 to August 14, 2014, the solar gas turbine could have produced 71,543 kWh. The solar panel array that is located on building 8, consisting of 216 solar panels, would have been able to produce 2,203.78 kWh. Coupled together with the solar gas turbine, this becomes a total of 73,746.78 kWh, which is 9.31% of what building 7 consumes during this peak time frame.
The overall energy consumption of building 7 compared to the solar panel array from building 8’s production can be seen in the top part of the graph shown below. Building 7 should expect to see a spike in the middle of the summer months.
Figure 43. Hospital, Building 7, Consumption and Solar Prod.
The bottom part of the graph below shows a zoomed-in look at the aforementioned peak energy consumption date range. The top line in the graph is the actual consumption, while the bottom line is the 9.31% decrease in peak energy consumption that the microgrid would cause. This decrease in peak energy consumption for this short timeframe saves $8,849.61 in billing from the utilty based on a rate of $0.12 per kWh.
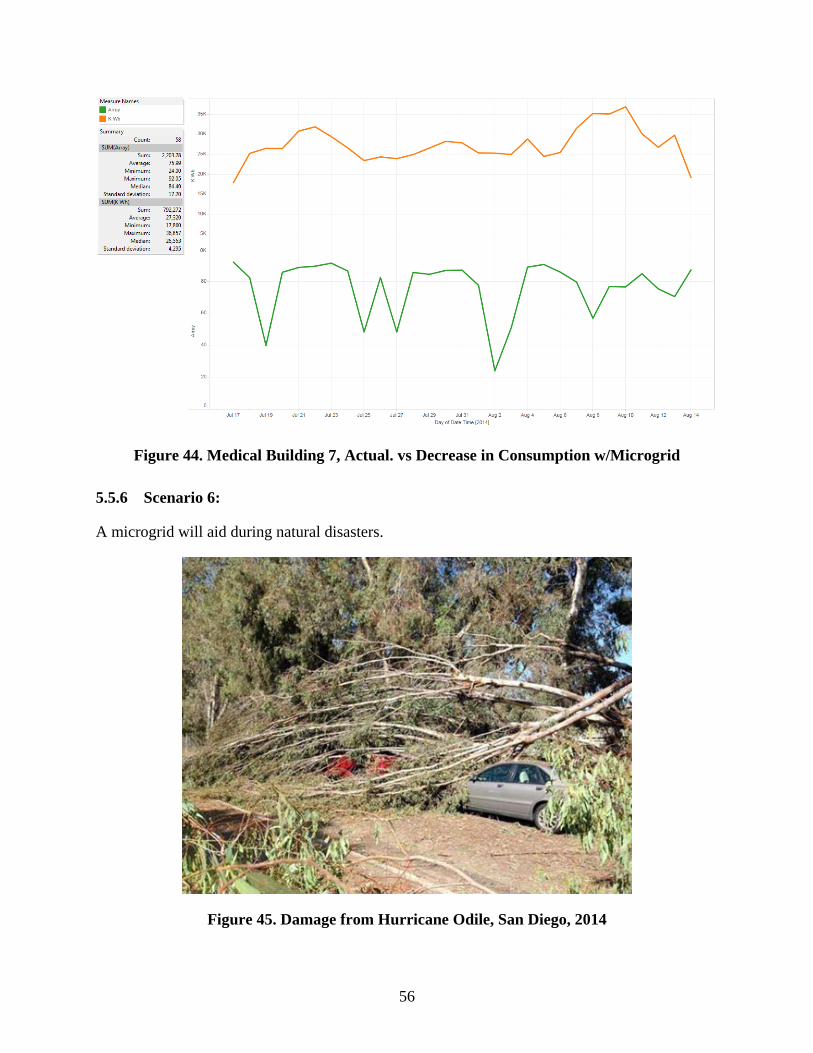
56
Figure 44. Medical Building 7, Actual. vs Decrease in Consumption w/Microgrid
5.5.6 Scenario 6:
A microgrid will aid during natural disasters.
Figure 45. Damage from Hurricane Odile, San Diego, 2014
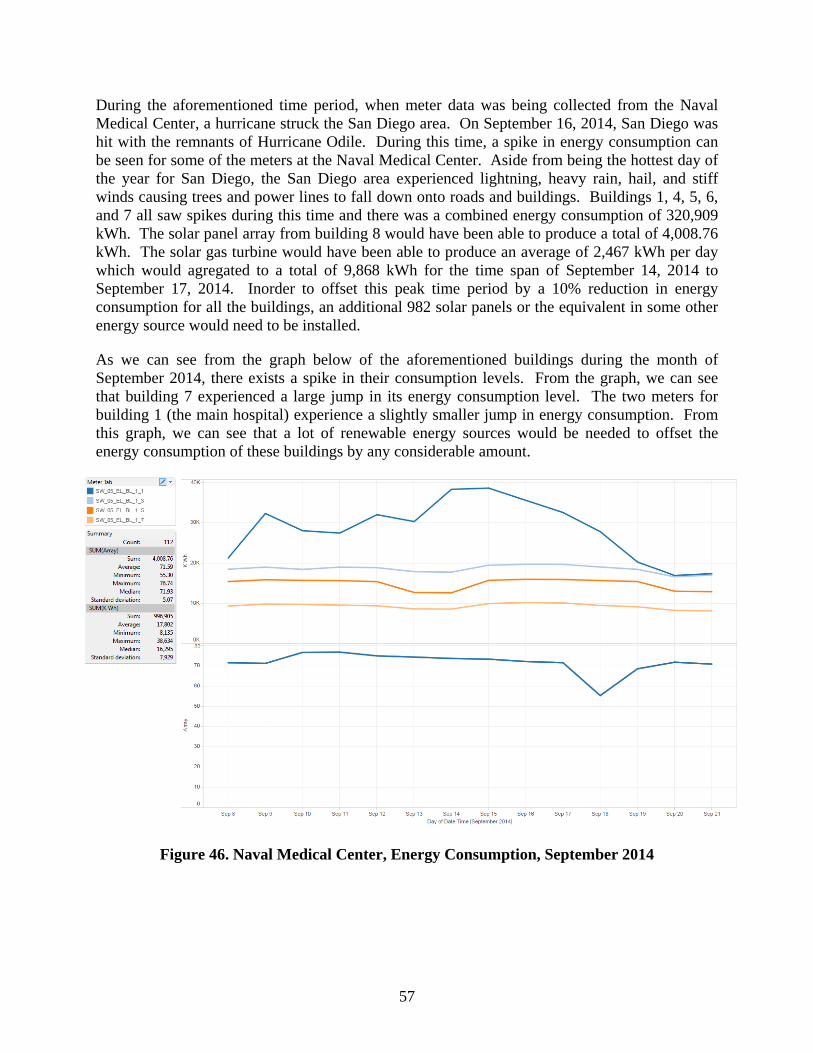
57
During the aforementioned time period, when meter data was being collected from the Naval Medical Center, a hurricane struck the San Diego area. On September 16, 2014, San Diego was hit with the remnants of Hurricane Odile. During this time, a spike in energy consumption can be seen for some of the meters at the Naval Medical Center. Aside from being the hottest day of the year for San Diego, the San Diego area experienced lightning, heavy rain, hail, and stiff winds causing trees and power lines to fall down onto roads and buildings. Buildings 1, 4, 5, 6, and 7 all saw spikes during this time and there was a combined energy consumption of 320,909 kWh. The solar panel array from building 8 would have been able to produce a total of 4,008.76 kWh. The solar gas turbine would have been able to produce an average of 2,467 kWh per day which would agregated to a total of 9,868 kWh for the time span of September 14, 2014 to September 17, 2014. Inorder to offset this peak time period by a 10% reduction in energy consumption for all the buildings, an additional 982 solar panels or the equivalent in some other energy source would need to be installed.
As we can see from the graph below of the aforementioned buildings during the month of September 2014, there exists a spike in their consumption levels. From the graph, we can see that building 7 experienced a large jump in its energy consumption level. The two meters for building 1 (the main hospital) experience a slightly smaller jump in energy consumption. From this graph, we can see that a lot of renewable energy sources would be needed to offset the energy consumption of these buildings by any considerable amount.
Figure 46. Naval Medical Center, Energy Consumption, September 2014

58
5.5.7 Conclusion
In conclusion, the data collected during the aforementioned 452-day study period, (March 1, 2014 through May 27, 2015), established the profiles for the energy consumption levels for the three bases. These profiles were utilized in developing the study Scenarios and assumptions derived below.
From the Telvent data set, Naval Base Point Loma consumed 3,544,935 kWh during the time period of October 28, 2014 to April 11, 2015. The calculated energy cost to Naval Base Point Loma during that time period is $425,392.20, assuming $0.12 per kWh. In Scenario 1, by utilizing a 57.6 kW solar panel array, building 66 would achieve a potential saving of $2,404.02 annually.
From the metered data set, the Naval Medical Center consumed 16,144,828 kWh during the time period of March 1, 2014 to May 27, 2015. The calculated energy cost to the Naval Medical Center during that time period is $1,937,379.36, assuming $0.12 per kWh. In Scenario 2, utilizing the meter data received from building 8, the solar panel array would produce 6.279% energy efficiency. Utilizing this solar power efficiency demonstrates an estimated savings of $2,959.86.
From the metered data set, the Naval Medical Hospital averaged a daily consumption of 21,925 kWh. In Scenario 3, the existing solar panels and solar gas turbine produced an average of 2,529.13 kWh daily. Two backup generators and a load bank located at the Naval Medical Center produce 3,600 kW. In order to power the main hospital, without the utility, additional renewable and/or distributed resources would be required. An integrated microgrid solution would enable the Naval Medical Center to have the ability to peak shave, thus lowering cost on utility demand charges.
From the Telvent data set, Naval Base Coronado consumed 27,438,824 kWh during the time period of October 28, 2014 to April 11, 2015. The calculated energy cost to Naval Base Coronado during that time period is $3,292,658.88, assuming $0.12 per kWh. In Scenario 4, installing a 400 KVAR capacitor onto L13 would achieve a potential saving of $29,986 annually
From the metered data set, building 7, on the Naval Medical Center campus, indicated an increase in energy consumed during the time period of July 17, 2014 to August 14, 2014. In Scenario 5, building 7 consumed 792,272 kWh during that time period. With an integrated microgrid solution, operating in parallel with the utility, 9.13% of the peak energy usage could be reduced. Utilizing the existing solar gas turbine, the current solar panel array, and the addition of a second solar panel array, the microgrid would be able to produce 73,746.78 kWh, which is slightly less than 10% of what building 7 used during this peak time period. This would indicate a saving of approximately $8,849.61 in energy usage from the utility, minus the cost of powering the gas turbine.
The conclusions drawn in all these studies suggest that environmental indicators and weather variables should be monitored, as they might be used as input in a set of specific applications, such as electric load forecasting However, while the aforementioned presents several studies of the relationship between weather variables and electric load, they are usually focused on large areas and regions and are not directly portable to smaller environments like microgrids.
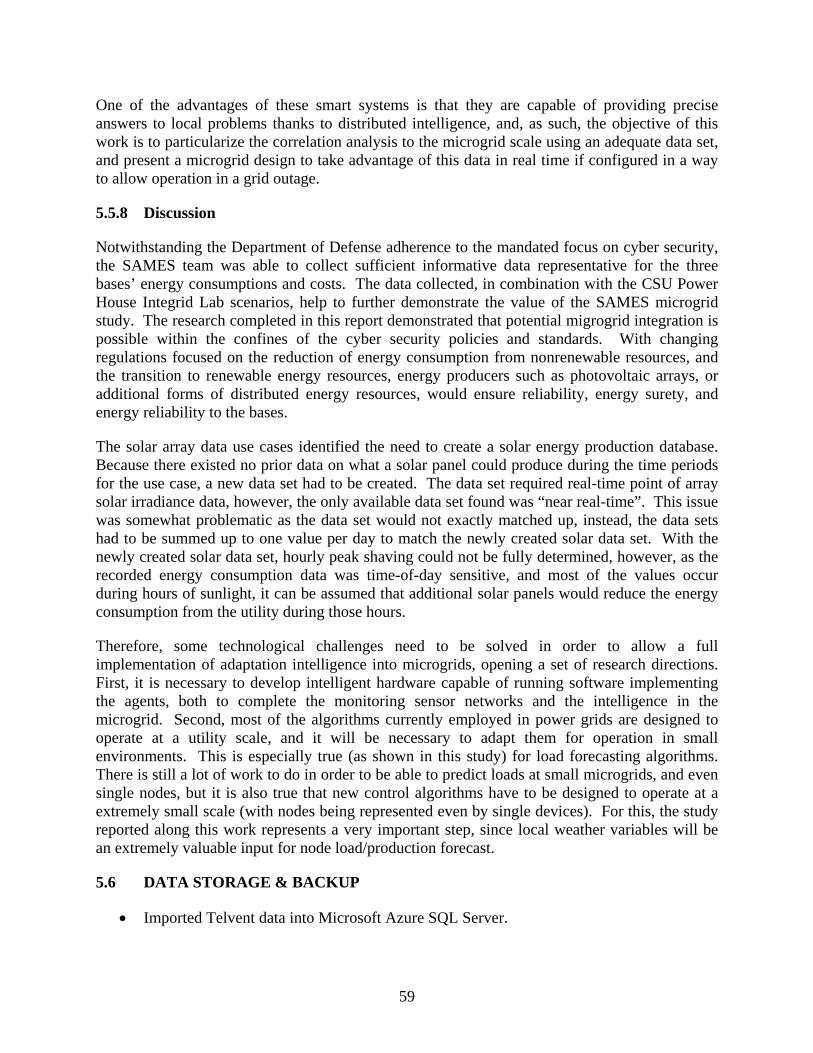
59
One of the advantages of these smart systems is that they are capable of providing precise answers to local problems thanks to distributed intelligence, and, as such, the objective of this work is to particularize the correlation analysis to the microgrid scale using an adequate data set, and present a microgrid design to take advantage of this data in real time if configured in a way to allow operation in a grid outage.
5.5.8 Discussion
Notwithstanding the Department of Defense adherence to the mandated focus on cyber security, the SAMES team was able to collect sufficient informative data representative for the three bases’ energy consumptions and costs. The data collected, in combination with the CSU Power House Integrid Lab scenarios, help to further demonstrate the value of the SAMES microgrid study. The research completed in this report demonstrated that potential migrogrid integration is possible within the confines of the cyber security policies and standards. With changing regulations focused on the reduction of energy consumption from nonrenewable resources, and the transition to renewable energy resources, energy producers such as photovoltaic arrays, or additional forms of distributed energy resources, would ensure reliability, energy surety, and energy reliability to the bases.
The solar array data use cases identified the need to create a solar energy production database. Because there existed no prior data on what a solar panel could produce during the time periods for the use case, a new data set had to be created. The data set required real-time point of array solar irradiance data, however, the only available data set found was “near real-time”. This issue was somewhat problematic as the data set would not exactly matched up, instead, the data sets had to be summed up to one value per day to match the newly created solar data set. With the newly created solar data set, hourly peak shaving could not be fully determined, however, as the recorded energy consumption data was time-of-day sensitive, and most of the values occur during hours of sunlight, it can be assumed that additional solar panels would reduce the energy consumption from the utility during those hours.
Therefore, some technological challenges need to be solved in order to allow a full implementation of adaptation intelligence into microgrids, opening a set of research directions. First, it is necessary to develop intelligent hardware capable of running software implementing the agents, both to complete the monitoring sensor networks and the intelligence in the microgrid. Second, most of the algorithms currently employed in power grids are designed to operate at a utility scale, and it will be necessary to adapt them for operation in small environments. This is especially true (as shown in this study) for load forecasting algorithms. There is still a lot of work to do in order to be able to predict loads at small microgrids, and even single nodes, but it is also true that new control algorithms have to be designed to operate at a extremely small scale (with nodes being represented even by single devices). For this, the study reported along this work represents a very important step, since local weather variables will be an extremely valuable input for node load/production forecast.
5.6 DATA STORAGE & BACKUP
• Imported Telvent data into Microsoft Azure SQL Server.
60
• Used VMWare Fusion virtual machine to launch Microsoft SQL Server Management Studio.
• Performed first pass of statistical analysis on each data set in SQL Studio to find the min, max, mean, mode, median, standard deviation, and variance.
• Reviewed one-line drawings to confirm the position of each metering point. • Loaded data into Tableau statistical analysis package to evaluate patterns and trends
(included in the analysis). • Performed identification of trends and anomalies.
5.7 EQUIPMENT CALIBRATION & DATA QUALITY ISSUES
5.7.1 Equipment Calibration
Calibration of the power systems model is based on annual weather changes or significant variation in predicted power variables and through state estimation from known calibrated data sources. Variation can be an early source of identification of potential equipment failure, so automatic power model calibration is only done on a seasonal basis.
The primary source of data sampling for quality in the operational system is the real-time comparison of key power metrics (real-time values compared to dynamic model simulations and the associated variables).
The demonstrated commercial accuracy embodied in the power systems model that is dynamically updated is a fundamental method for identification of both reasonableness of data and faulty data.

61
6.0 COST ASSESSMENT
SAMES allows bases or microgrids to operate as virtual power plants, gaining from market sales, demand response incentives, optimization of renewables, and energy efficiency improvements. When resources are available for optimization, it can curtail 10-30 percent of normal load through reduced consumption, energy storage, and onsite generation, creating demand savings without comprising reliability. Using SAMES, the military can trade in the energy and capacity markets through the California ISO Direct Access program, processing revenue to benefit the installation, and overcoming commercial barriers for government-related clients. SAMES savings to investment ratio is: for 5 years, 2.5; for 10 years, 4.1; and for 20 years, 5.6 per 1MW of capacity. In general, for southern California, a cluster of bases with advanced load and generation control capabilities can accrue savings as noted in the table below:
Table 2. Cost Assessment
Commercial Value Category Commercial Value Assumptions
Reduced Demand and Consumption
$100,000 - $200,000/MW per yr. Energy asset optimization & load management
Demand Response (Capacity) $50,000 - $70,000/MW per yr. $7/MW capacity clearing price
Frequency Regulation $252,000/MW per yr. $16/MWh based on FERC 755 Demand Bidding (SDG&E Program)
$500,000 - $1,000,000/MW per yr. $500/MWh for called events
Supply Side Energy Trading $625,000 - $1,125,000/MW per yr. $7.5/MWh Ancillary Service and $250/MWh energy clearing price
Simple Payback Period 1.3 yrs.
Additional DoD benefits include:
• First ever centralized command for energy at a regional level; • Increased situational awareness and delivery of automated alerts about potential
problems; • Proactive power outage communications and management with the utility and ISO; • Optimized microgrid management in islanded mode to maximize critical facility uptime; • Better understanding of electric capabilities to leverage for future power purchase,
commodity agreements, or market entry; • Information on the feasibility, efficiencies, and roadmap for clustering solutions across
DoD; • Integration of energy information into a common data warehouse; • Development of an Energy Security Return on Investment (ROI) model; • Possible future participation in Demand Response (DR) requests from the utility resulting
in financial compensation; and, • Centralized management of generation and load resources to reduce Peak Load charges
during periods of high demand resulting in cost savings.
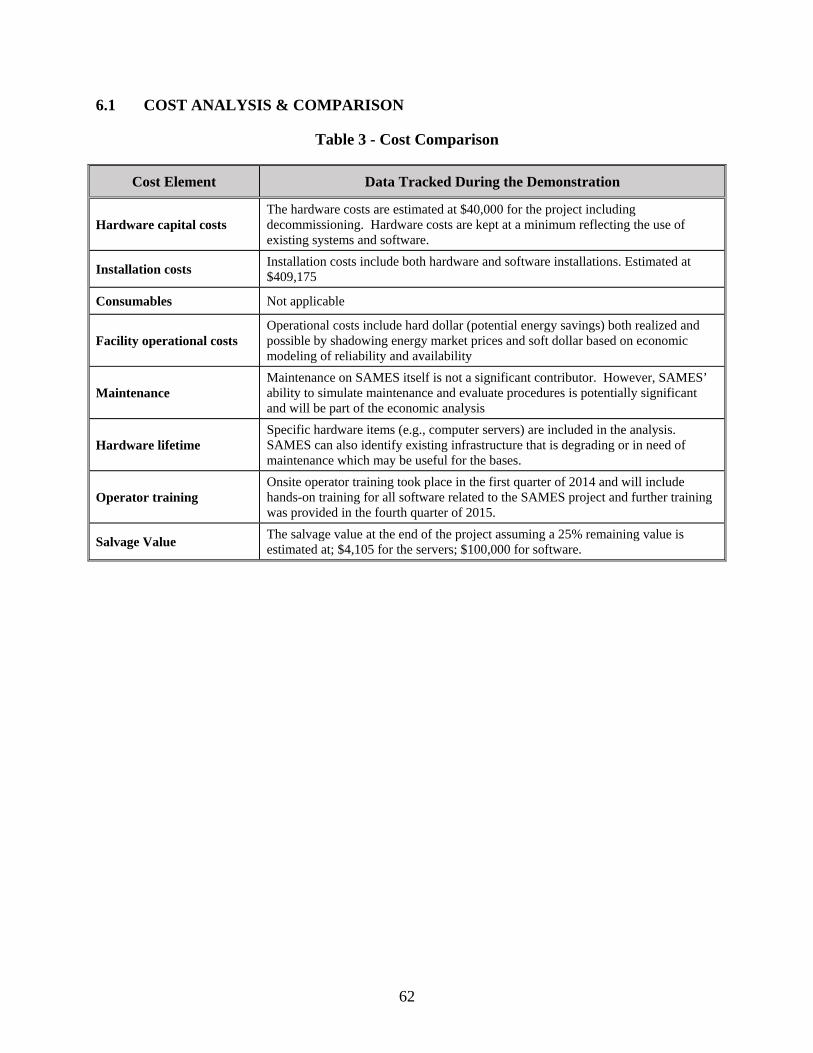
62
6.1 COST ANALYSIS & COMPARISON
Table 3 - Cost Comparison
Cost Element Data Tracked During the Demonstration
Hardware capital costs The hardware costs are estimated at $40,000 for the project including decommissioning. Hardware costs are kept at a minimum reflecting the use of existing systems and software.
Installation costs Installation costs include both hardware and software installations. Estimated at $409,175
Consumables Not applicable
Facility operational costs Operational costs include hard dollar (potential energy savings) both realized and possible by shadowing energy market prices and soft dollar based on economic modeling of reliability and availability
Maintenance Maintenance on SAMES itself is not a significant contributor. However, SAMES’ ability to simulate maintenance and evaluate procedures is potentially significant and will be part of the economic analysis
Hardware lifetime Specific hardware items (e.g., computer servers) are included in the analysis. SAMES can also identify existing infrastructure that is degrading or in need of maintenance which may be useful for the bases.
Operator training Onsite operator training took place in the first quarter of 2014 and will include hands-on training for all software related to the SAMES project and further training was provided in the fourth quarter of 2015.
Salvage Value The salvage value at the end of the project assuming a 25% remaining value is estimated at; $4,105 for the servers; $100,000 for software.

63
7.0 IMPLEMENTATION ISSUES
7.1 CONNECTING TO THE REAL-TIME DATA
• Issue: It is essential that we have access to real-time data. − Johnson Controls Metasys (Building Management System) – Read and control access
but no agreed process for control. − Schneider Telvent (SCADA system) – Read-only access. − Iconics SCADA (secondary) – Historical access only.
• Status: Connectivity has been established and real-time data is being collected and stored from the Johnson Controls Metasys and Schneider Telvent system. Iconics data is being providing monthly and used in the data analysis. − Analysis of the current real-time and historical data showed the need for connectivity
to additional data points in all three systems. − No access to real-time weather info, etc., except at the Colorado State University Lab.
7.2 DEMONSTRATING CONTROL
• Issue: Limited access to data or read-only access affects what can be shown on the bases.
• Impact: While this restricts what can be shown on the bases, we demonstrated both SAMES capabilities and the microgrid’s performance using base data at the Colorado State Lab.
• Status: Developed simulations that were demonstrated on the bases using the Blackboard feature of the software. This uses real-time data in an off-line, simulated environment to show the control features in the system. The same simulations were demonstrated at the Colorado State Lab using live equipment that is representative of the base circuits.
7.3 DATA ACCESS
• Issue: Limited access for personnel to Naval Bases Coronado and San Diego and the availability of accurate data on the base power system models. Although this is not uncommon at operational sites, it slowed model development and reduced the accuracy of our initial information.
• Status: The initial models were completed and were updated based on the real-time data collected during the demonstration. We have obtained base credentials for our staff. Accuracy and completeness of data remains a challenge.
7.4 HOST COOPERATION
• Issue: NAVFAC personnel participation in the demonstration at the Colorado State University Lab in July of 2015 was not possible due to available resources and other demands on the base operations personnel

64
NAVFAC personnel did have two participants on the virtual portion of the demonstration (WebEx)
65
8.0 TECHNOLOGY TRANSFER
The SAMES team is considering technology transfer in every step of the demonstration plan. We have specifically addressed it in conversations already with NAVFAC SW and the three naval bases. We included the Marine Corps as advisors to the project so that we can also address their concerns during the demonstration.
• Functional and Technical Requirements; • Design and implementation documentation; • Cost/benefits models for implementation; • Commercial and energy security models; • Processes for set up and installation of SAMES at bases; • Information on project risks and benefits; and, • Test results and lessons learned from the SAMES demonstration.
The DoD audiences for SAMES technology transfer outreach include base energy managers, IT personnel, facilities managers and other personnel working with the electrical infrastructure, and financial managers. To reach these diverse organizations and enhance their support for microgrid projects, we can provide sample briefings and whitepapers that clearly explain the technology, its benefits and the implementation process. For the utilities and energy providers, whose support is needed to implement microgrids, we developed documentation to lay out the SAMES concept in language that will be familiar to that constituency.
A second audience for information from this project is senior military management that has mandated commercial and energy security goals for all the services. During this ESTCP project, we demonstrated that the SAMES system can be rapidly implemented at other bases and assist in achieving these goals including NAVFAC headquarters, NAFVAC Mid Atlantic. Although potential first users are large bases with substantial power demands and a source of alternative generation, the concept can benefit a wide variety of facilities. For example, within the United States and other industrialized countries, clustered and islanded microgrids offer substantial economic advantages and increased reliability. In less developed areas of the world, SAMES can offer some freedom from unreliable or non-existent electricity grids. In these areas in particular, the integration of renewables into the base electrical infrastructure can be a key factor in increasing system reliability and reducing the military’s logistics tail.
Although the SAMES use cases are the same, each location will vary in the amount of useful legacy equipment, controllable resources, and weather information needed to create a functional microgrid. Similarly, the commercial value of the base’s electrical infrastructure as predicted in the model will also be unique. Power Analytics has developed a road map (an Energy Alignment Plan) as a direct result of experience with the SAMES program and is introducing this road map through the Defense Logistics Agency, the General Services Administration, and a strategic partner for a “whole microgrid program.” For a new implementation, either at a single base or a cluster, the following information is required:
• Site survey data about the power network including all significant loads, storage, and generators of 50hp equivalency. Preferably, the survey will go to the HVAC circuit level;
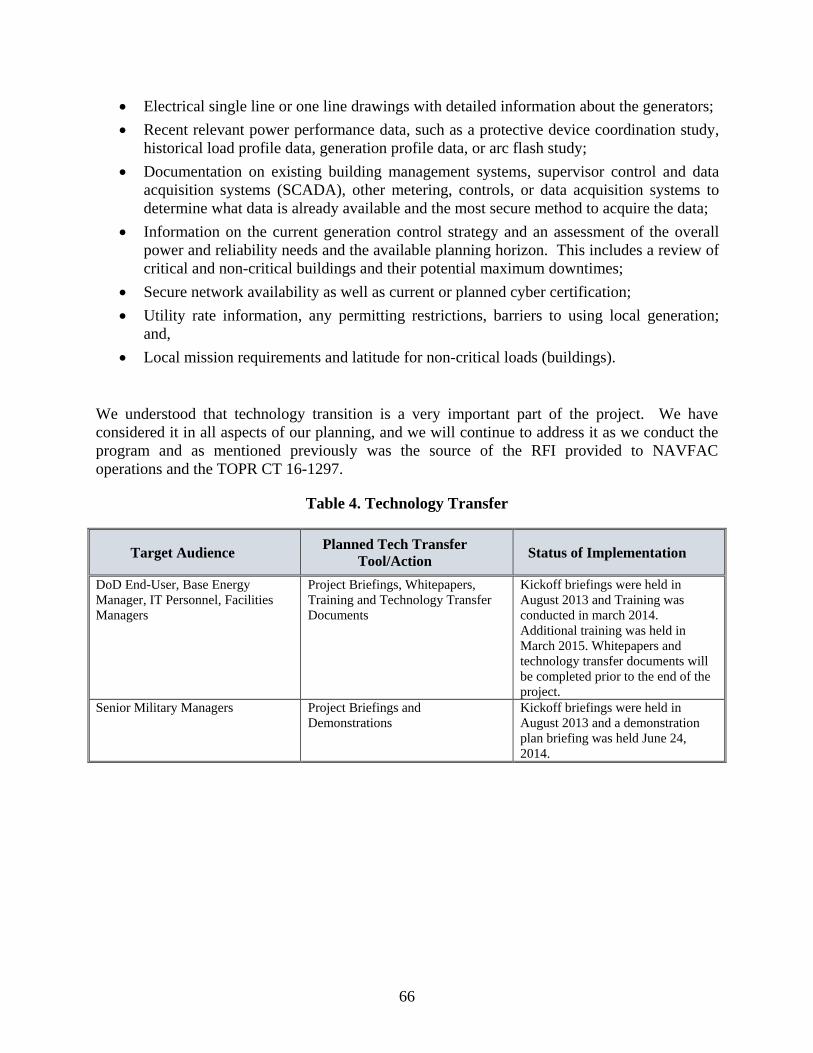
66
• Electrical single line or one line drawings with detailed information about the generators; • Recent relevant power performance data, such as a protective device coordination study,
historical load profile data, generation profile data, or arc flash study; • Documentation on existing building management systems, supervisor control and data
acquisition systems (SCADA), other metering, controls, or data acquisition systems to determine what data is already available and the most secure method to acquire the data;
• Information on the current generation control strategy and an assessment of the overall power and reliability needs and the available planning horizon. This includes a review of critical and non-critical buildings and their potential maximum downtimes;
• Secure network availability as well as current or planned cyber certification; • Utility rate information, any permitting restrictions, barriers to using local generation;
and, • Local mission requirements and latitude for non-critical loads (buildings).
We understood that technology transition is a very important part of the project. We have considered it in all aspects of our planning, and we will continue to address it as we conduct the program and as mentioned previously was the source of the RFI provided to NAVFAC operations and the TOPR CT 16-1297.
Table 4. Technology Transfer
Target Audience Planned Tech Transfer Tool/Action Status of Implementation
DoD End-User, Base Energy Manager, IT Personnel, Facilities Managers
Project Briefings, Whitepapers, Training and Technology Transfer Documents
Kickoff briefings were held in August 2013 and Training was conducted in march 2014. Additional training was held in March 2015. Whitepapers and technology transfer documents will be completed prior to the end of the project.
Senior Military Managers Project Briefings and Demonstrations
Kickoff briefings were held in August 2013 and a demonstration plan briefing was held June 24, 2014.
67
9.0 RESULTS PRESENTATIONS
• IEEE PES Conference on Innovation SmartGrid Technology, Feb 19, 2015, Kevin Meagher, Presenter
• Navy Gold Coast, August 25 & 26, 2015
A-1 INTRODUCTION MIRRORED SITE – COLORADO STATE UNIVERSITY, FORT COLLINS
CSU Power House – Integrid Lab
The CSU facility was critical to the overall SAMES project. The logistical challenges and implementation issues were significantly greater than anticipated in the initial demonstration and development. It was anticipated that the CSU facility would be critical to demonstrate the control required for the uses cases in the program (including islanding, load shedding and optimization) as well as providing remote access not possible on the base. These challenges became more pronounced with changes within NAVFAC SW and difficulty obtaining data beyond the original power model and software integration.
The work at the mirrored site required creation of a new power model to reflect the equipment at the site and the additional integration with the hardware control, Spirae BlueFin. The Spirae hardware provides nearly identical access to real time data and control interface as would be provided by the Iconics and Telvent software at the target Navy Bases.
In addition to a real world test environment, the ability to include market data as envisioned in the CAISO/SDGE market was important in the use case testing and validation.
A 1.1 Background
Power Analytics and the SAMES team work in Colorado included staging, testing and verification of the SAMES software at the Colorado State University Power House – Integrid Lab. This facility operated by Colorado State University’s (CSU) Engines and Energy Conversion Lab (EECL) and SAMES subcontractor Spirae. The lab is grid interconnected with a 13.2 kV utility feed and provides a “hardware in the loop” test and simulation environment. The Lab simulates each base and, where possible, substituted real data and control decisions as a staging and demonstration location prior to installing the SAMES software on the bases. Power Analytics replicated the exact computer environment as the SAMES installation and, where possible, used hardware, metering and control to approximate the SAMES environment. Control and hardware in the loop demonstrations were developed in parallel at the lab.
A 1.2 Objectives of the Demonstration
The CSU site was used to integrate and test software prior to deployment at the main SAMES location. A nearly identical server configuration was included with the differences being:
• The SCADA interconnect was Spirae BlueFin • No connection was required to building management

68
• No independent connection was required to stand alone meters or other SCADA systems.
The version of software was identical to the version installed at main server in NBSD along with all the site specific information installed at NBSD. The additional equipment and interfaces at CSU were required to demonstrate control, load shedding, islanding and market participation through both paralleling with the utility and load shedding.
A 1.3 Regulatory Drivers
There were no regulatory drivers for the mirrored site beyond those of the primary site at NBSD.
A 2.0 TECHNOLOGY DESCRIPTION
A 2.1 Technology Development
The mirrored site at CSU Power House used an identical server, operating system and release versions of Power Analytics software as that deployed at NBSD. The mirrored site was the test site so all configurations changes were tested and validated at CSU prior to installation at NBSD. The physical connections (network addresses, devices) and real time power model were different because the site at CSU Power House is not identical to NBSD or the interconnected sites of Point Loma and Coronado. Access to the CSU site provided secure remote access via virtual private networks but there was no remote access to NBSD.
A 2.3 Advantages and Limitations of the Technology
As discussed in 2.3, there are two significant advantages to the SAMES system. The first is the use of a power model that accurately reflects the actual physical site, and is continuously updated and calibrated based on the real-time data. The second is the ability to use existing SCADA, building management systems and other existing systems.
The limitations include the requirement to create a power model (typically from existing power data) for each site and the need to create additional user and data screens for the site. The benefits and advantages are much greater especially the ability to demonstrate control and the scalability of the SAMES architecture.
A 3.0 PERFORMANCE OBJECTIVES
The objectives of SAMES were identical at CSU. The requirement to create another power model reflecting the physical infrastructure at CSU Power House was also the basis for detailed power scenario development and the optimization that is unique to the real-time power model approach.
The power model analysis included:
• Power flow – (security constrained) • Contingency analysis (N-1) • Transient Analysis • Short circuit
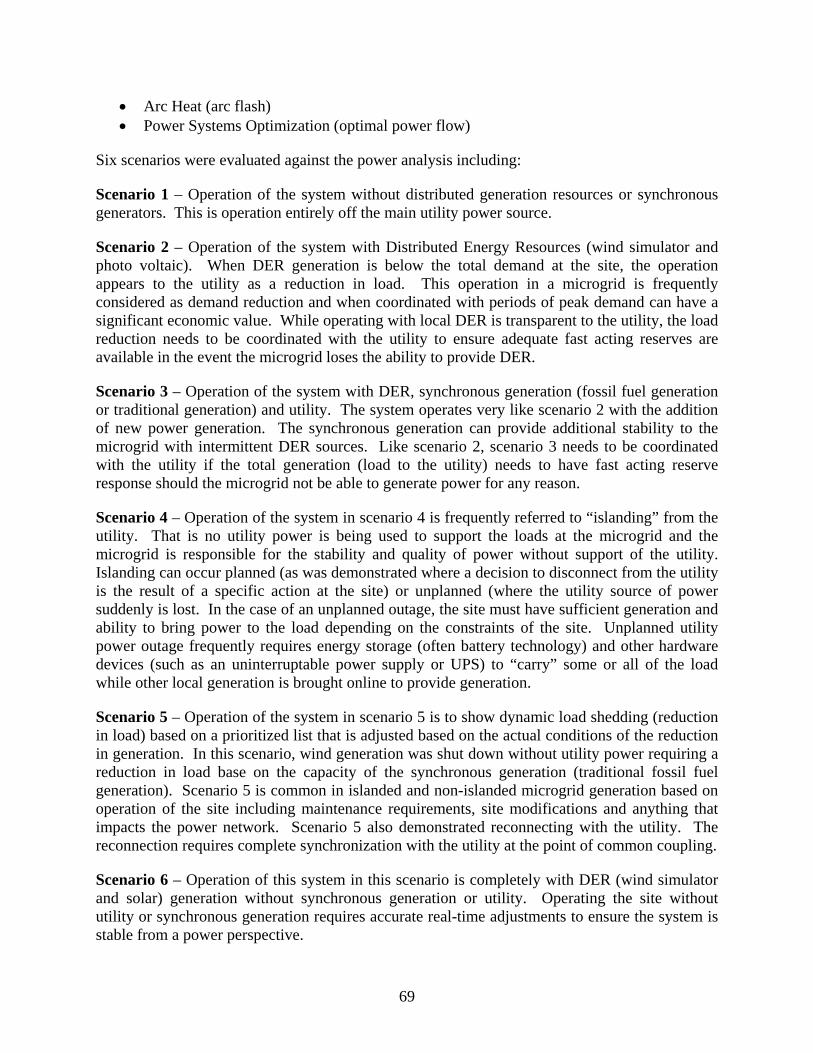
69
• Arc Heat (arc flash) • Power Systems Optimization (optimal power flow)
Six scenarios were evaluated against the power analysis including:
Scenario 1 – Operation of the system without distributed generation resources or synchronous generators. This is operation entirely off the main utility power source.
Scenario 2 – Operation of the system with Distributed Energy Resources (wind simulator and photo voltaic). When DER generation is below the total demand at the site, the operation appears to the utility as a reduction in load. This operation in a microgrid is frequently considered as demand reduction and when coordinated with periods of peak demand can have a significant economic value. While operating with local DER is transparent to the utility, the load reduction needs to be coordinated with the utility to ensure adequate fast acting reserves are available in the event the microgrid loses the ability to provide DER.
Scenario 3 – Operation of the system with DER, synchronous generation (fossil fuel generation or traditional generation) and utility. The system operates very like scenario 2 with the addition of new power generation. The synchronous generation can provide additional stability to the microgrid with intermittent DER sources. Like scenario 2, scenario 3 needs to be coordinated with the utility if the total generation (load to the utility) needs to have fast acting reserve response should the microgrid not be able to generate power for any reason.
Scenario 4 – Operation of the system in scenario 4 is frequently referred to “islanding” from the utility. That is no utility power is being used to support the loads at the microgrid and the microgrid is responsible for the stability and quality of power without support of the utility. Islanding can occur planned (as was demonstrated where a decision to disconnect from the utility is the result of a specific action at the site) or unplanned (where the utility source of power suddenly is lost. In the case of an unplanned outage, the site must have sufficient generation and ability to bring power to the load depending on the constraints of the site. Unplanned utility power outage frequently requires energy storage (often battery technology) and other hardware devices (such as an uninterruptable power supply or UPS) to “carry” some or all of the load while other local generation is brought online to provide generation.
Scenario 5 – Operation of the system in scenario 5 is to show dynamic load shedding (reduction in load) based on a prioritized list that is adjusted based on the actual conditions of the reduction in generation. In this scenario, wind generation was shut down without utility power requiring a reduction in load base on the capacity of the synchronous generation (traditional fossil fuel generation). Scenario 5 is common in islanded and non-islanded microgrid generation based on operation of the site including maintenance requirements, site modifications and anything that impacts the power network. Scenario 5 also demonstrated reconnecting with the utility. The reconnection requires complete synchronization with the utility at the point of common coupling.
Scenario 6 – Operation of this system in this scenario is completely with DER (wind simulator and solar) generation without synchronous generation or utility. Operating the site without utility or synchronous generation requires accurate real-time adjustments to ensure the system is stable from a power perspective.
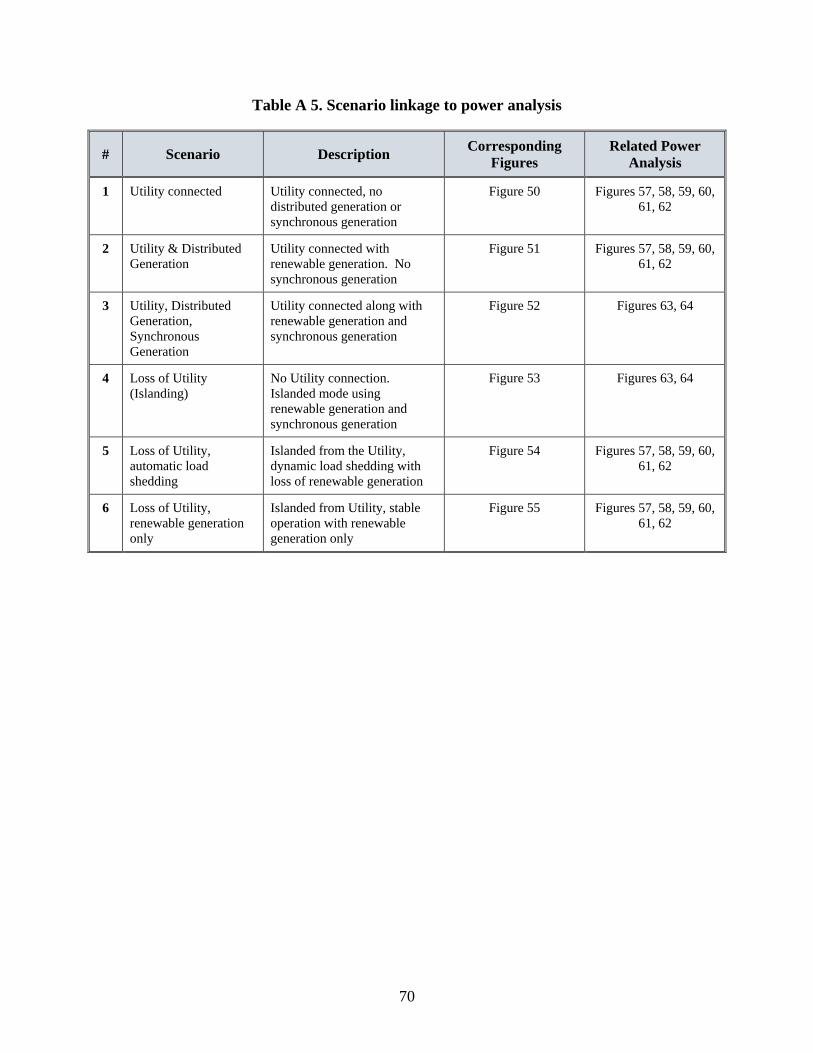
70
Table A 5. Scenario linkage to power analysis
# Scenario Description Corresponding Figures
Related Power Analysis
1 Utility connected Utility connected, no distributed generation or synchronous generation
Figure 50 Figures 57, 58, 59, 60, 61, 62
2 Utility & Distributed Generation
Utility connected with renewable generation. No synchronous generation
Figure 51 Figures 57, 58, 59, 60, 61, 62
3 Utility, Distributed Generation, Synchronous Generation
Utility connected along with renewable generation and synchronous generation
Figure 52 Figures 63, 64
4 Loss of Utility (Islanding)
No Utility connection. Islanded mode using renewable generation and synchronous generation
Figure 53 Figures 63, 64
5 Loss of Utility, automatic load shedding
Islanded from the Utility, dynamic load shedding with loss of renewable generation
Figure 54 Figures 57, 58, 59, 60, 61, 62
6 Loss of Utility, renewable generation only
Islanded from Utility, stable operation with renewable generation only
Figure 55 Figures 57, 58, 59, 60, 61, 62
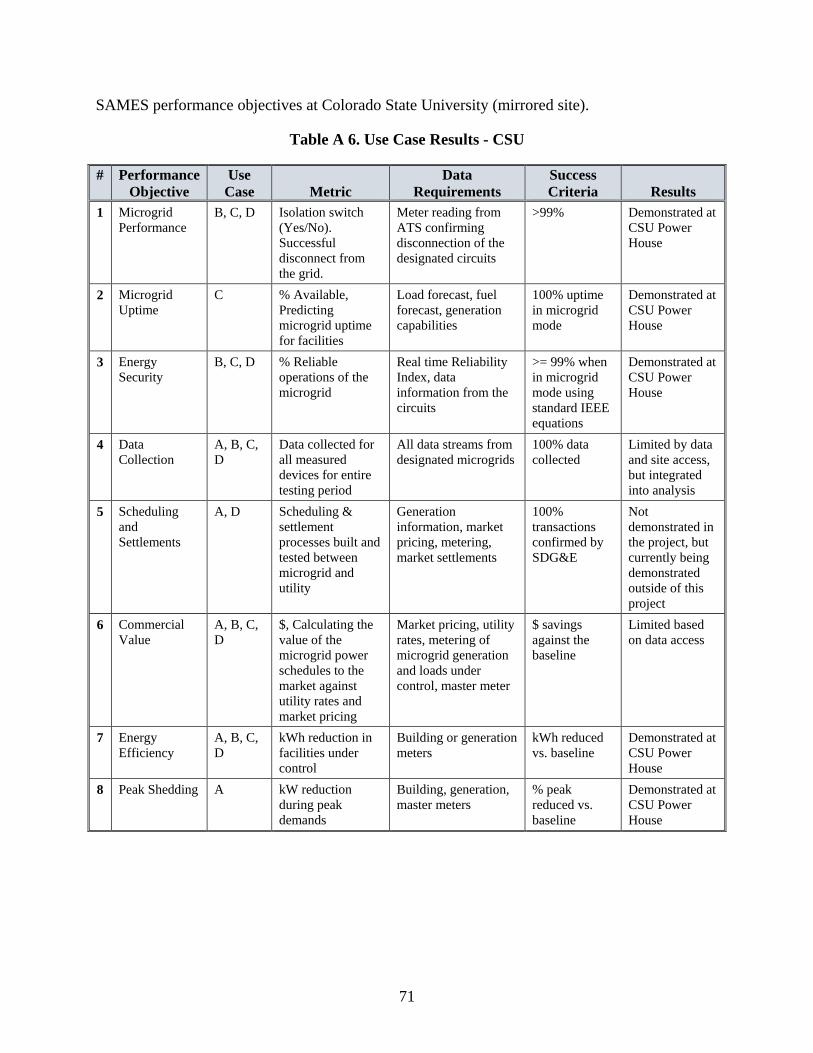
71
SAMES performance objectives at Colorado State University (mirrored site).
Table A 6. Use Case Results - CSU
# Performance Objective
Use Case
Metric
Data Requirements
Success Criteria
Results
1 Microgrid Performance
B, C, D Isolation switch (Yes/No). Successful disconnect from the grid.
Meter reading from ATS confirming disconnection of the designated circuits
>99% Demonstrated at CSU Power House
2 Microgrid Uptime
C % Available, Predicting microgrid uptime for facilities
Load forecast, fuel forecast, generation capabilities
100% uptime in microgrid mode
Demonstrated at CSU Power House
3 Energy Security
B, C, D % Reliable operations of the microgrid
Real time Reliability Index, data information from the circuits
>= 99% when in microgrid mode using standard IEEE equations
Demonstrated at CSU Power House
4 Data Collection
A, B, C, D
Data collected for all measured devices for entire testing period
All data streams from designated microgrids
100% data collected
Limited by data and site access, but integrated into analysis
5 Scheduling and Settlements
A, D Scheduling & settlement processes built and tested between microgrid and utility
Generation information, market pricing, metering, market settlements
100% transactions confirmed by SDG&E
Not demonstrated in the project, but currently being demonstrated outside of this project
6 Commercial Value
A, B, C, D
$, Calculating the value of the microgrid power schedules to the market against utility rates and market pricing
Market pricing, utility rates, metering of microgrid generation and loads under control, master meter
$ savings against the baseline
Limited based on data access
7 Energy Efficiency
A, B, C, D
kWh reduction in facilities under control
Building or generation meters
kWh reduced vs. baseline
Demonstrated at CSU Power House
8 Peak Shedding A kW reduction during peak demands
Building, generation, master meters
% peak reduced vs. baseline
Demonstrated at CSU Power House

72
A 4.0 SITE/FACILITY DESCRIPTION
The Colorado State University Power House – Integrid lab is located in Fort Collins, Colorado and is the largest large engine generation facility in North America. The CSU microgrid includes:
• Utility Connection Switchgear @ 13.2 kV; • Utility Transformer, 13.2/0.48 kV, 2 MVA; • Two Natural Gas Generator Sets 2×125 kVA, 480 V, Voltage Regulated, Active Power
Dispatch Controllable with embedded algorithm to share power between each other; • Wind Turbine (WT) Simulator, max 80 kW (4×20 kW), 480 V, Running Wind
Generation Profile; • Synchronous Condenser, 250 kVA, 480 V, Source of constant reactive power when WT’s
are connected (max ± 100 kVar), no voltage control; • Solar PV emulator, 480 V, max 23 kW, running Solar PV profile, no voltage control; • Solar PV emulator, 240 V, max 3.5 kW, out of service; • Load Simulator, max 200 kW, min PF=80%, running load profile; • Secondary Load Controller, control frequency of the system under 100% renewable
connection, max operation time 30 min; and, • Breakers, controllable switching action remotely
Figure 47. Integrid Lab at the CSU Power House

73
Figure 48. Integrid Lab at the CSU Power House Control Room
Figure 49. CSU Power House Equipment
A 5.0 TEST DESIGN
The test design and scenarios in A 3, are represented here as traditional “one lines” or “single lines” of each test scenario. The single lines are created in Power Analytics DesignBase software and are then integrated into the SAMES system/software in the manner described above.
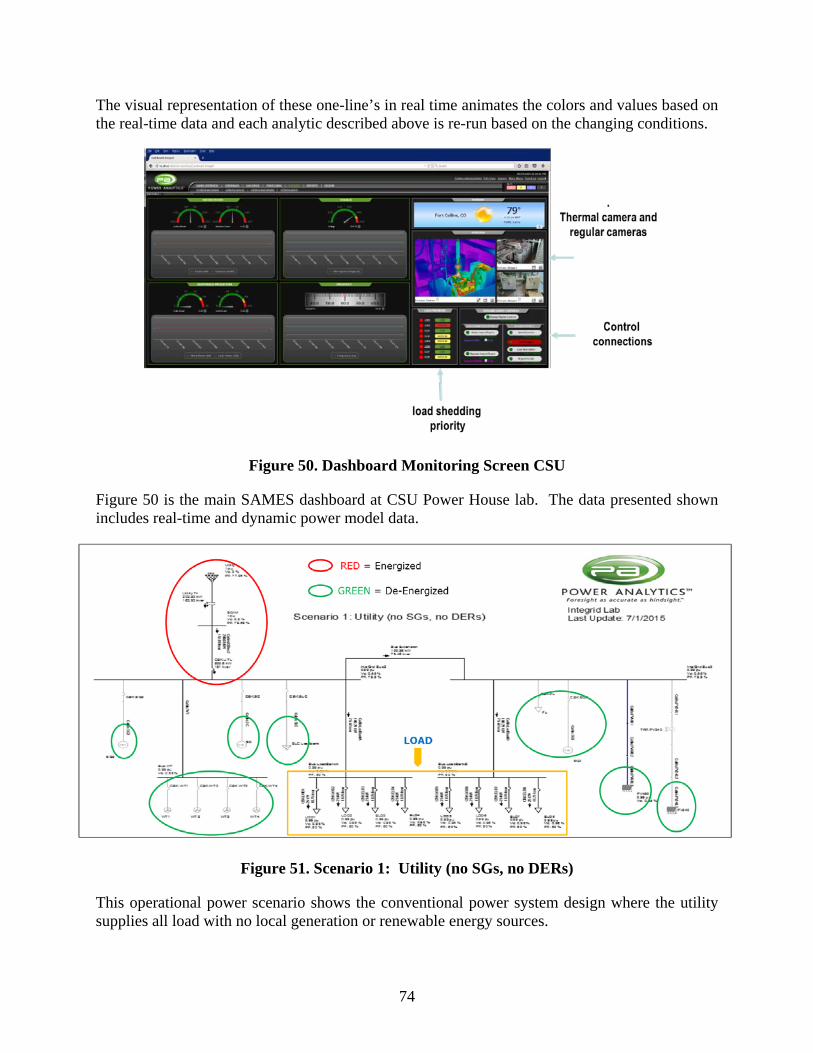
74
The visual representation of these one-line’s in real time animates the colors and values based on the real-time data and each analytic described above is re-run based on the changing conditions.
Figure 50. Dashboard Monitoring Screen CSU
Figure 50 is the main SAMES dashboard at CSU Power House lab. The data presented shown includes real-time and dynamic power model data.
Figure 51. Scenario 1: Utility (no SGs, no DERs)
This operational power scenario shows the conventional power system design where the utility supplies all load with no local generation or renewable energy sources.
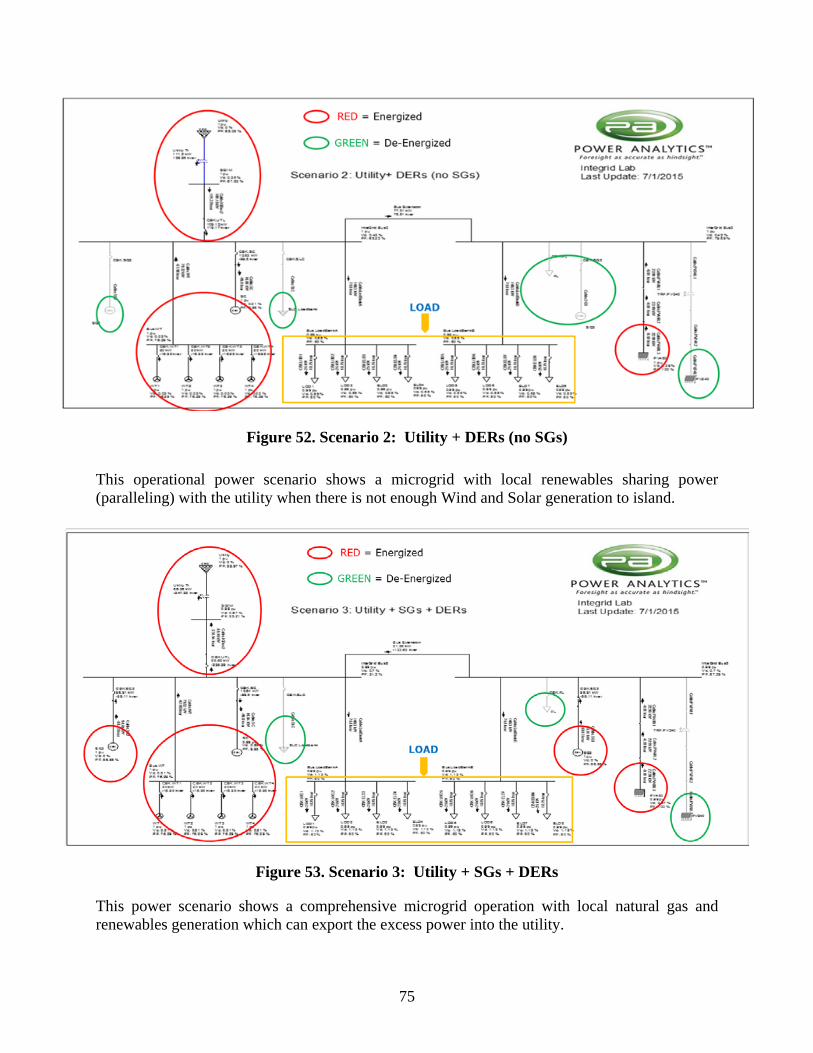
75
Figure 52. Scenario 2: Utility + DERs (no SGs)
This operational power scenario shows a microgrid with local renewables sharing power (paralleling) with the utility when there is not enough Wind and Solar generation to island.
Figure 53. Scenario 3: Utility + SGs + DERs
This power scenario shows a comprehensive microgrid operation with local natural gas and renewables generation which can export the excess power into the utility.
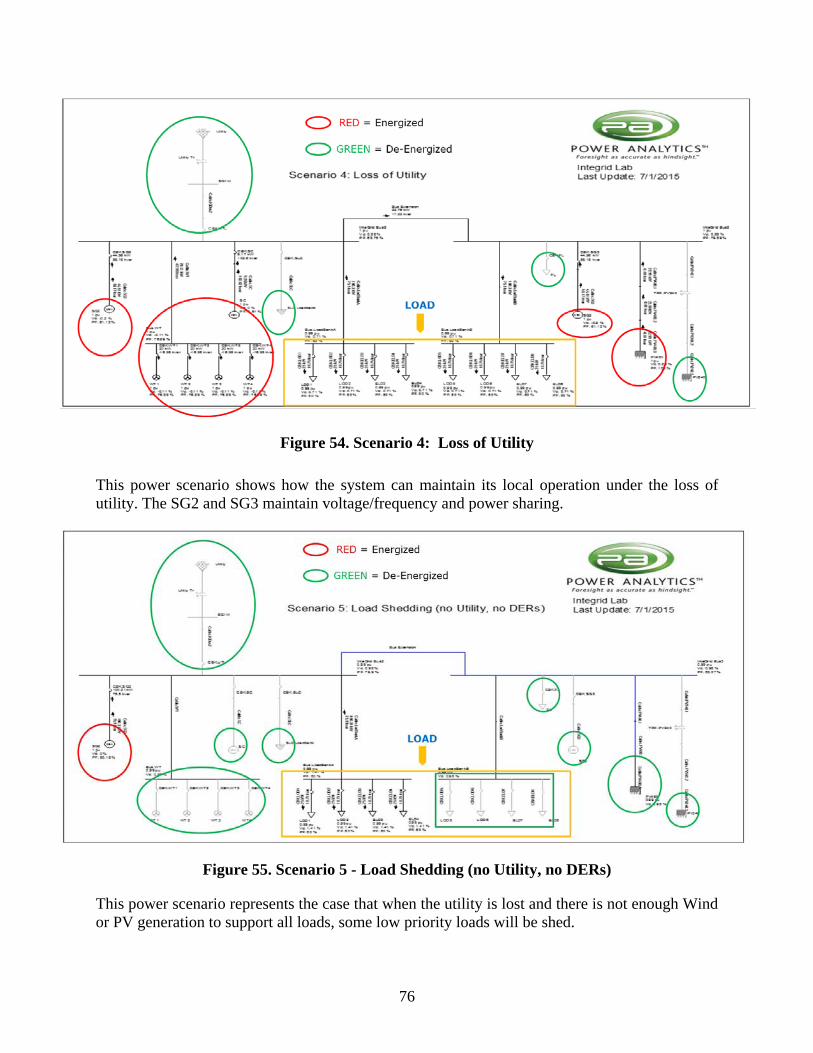
76
Figure 54. Scenario 4: Loss of Utility
This power scenario shows how the system can maintain its local operation under the loss of utility. The SG2 and SG3 maintain voltage/frequency and power sharing.
Figure 55. Scenario 5 - Load Shedding (no Utility, no DERs)
This power scenario represents the case that when the utility is lost and there is not enough Wind or PV generation to support all loads, some low priority loads will be shed.
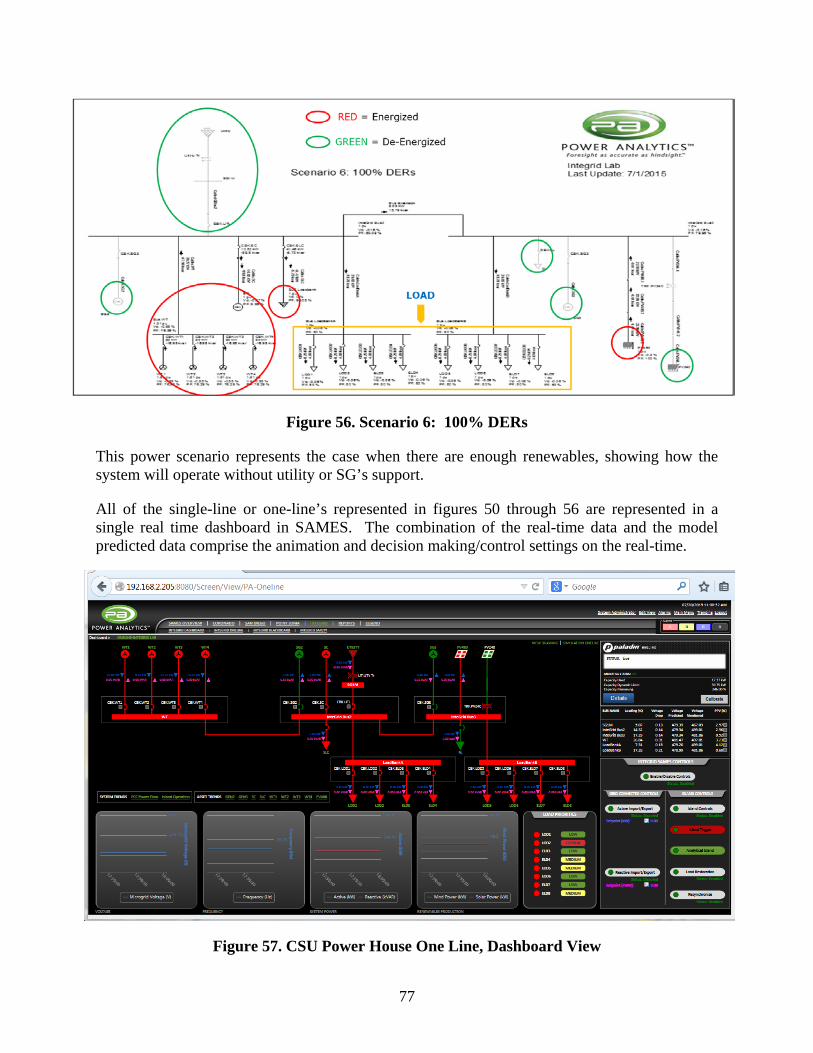
77
Figure 56. Scenario 6: 100% DERs
This power scenario represents the case when there are enough renewables, showing how the system will operate without utility or SG’s support.
All of the single-line or one-line’s represented in figures 50 through 56 are represented in a single real time dashboard in SAMES. The combination of the real-time data and the model predicted data comprise the animation and decision making/control settings on the real-time.
Figure 57. CSU Power House One Line, Dashboard View
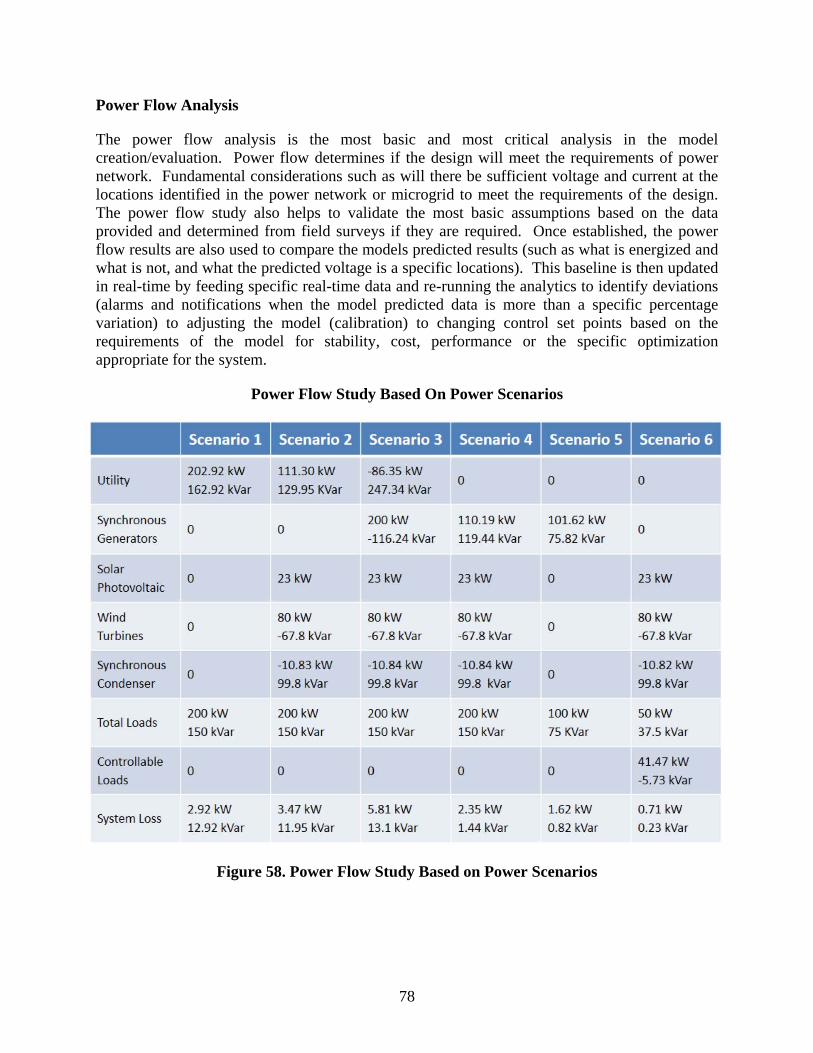
78
Power Flow Analysis
The power flow analysis is the most basic and most critical analysis in the model creation/evaluation. Power flow determines if the design will meet the requirements of power network. Fundamental considerations such as will there be sufficient voltage and current at the locations identified in the power network or microgrid to meet the requirements of the design. The power flow study also helps to validate the most basic assumptions based on the data provided and determined from field surveys if they are required. Once established, the power flow results are also used to compare the models predicted results (such as what is energized and what is not, and what the predicted voltage is a specific locations). This baseline is then updated in real-time by feeding specific real-time data and re-running the analytics to identify deviations (alarms and notifications when the model predicted data is more than a specific percentage variation) to adjusting the model (calibration) to changing control set points based on the requirements of the model for stability, cost, performance or the specific optimization appropriate for the system.
Power Flow Study Based On Power Scenarios
Figure 58. Power Flow Study Based on Power Scenarios
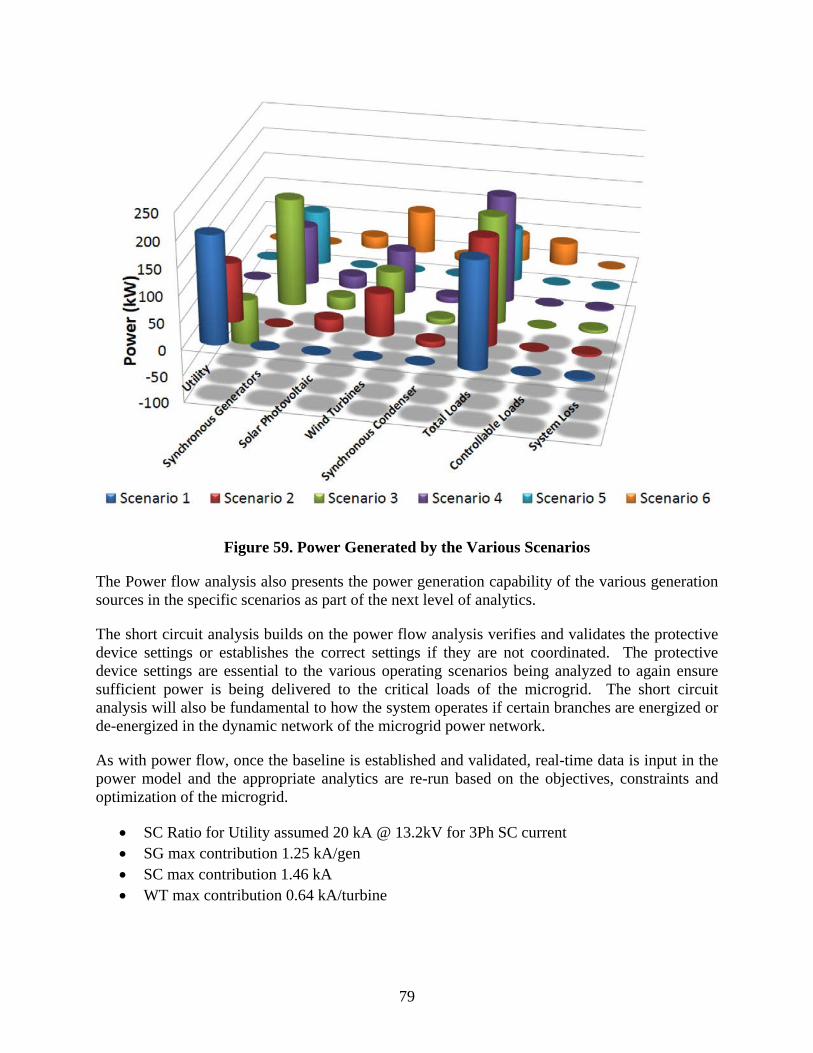
79
Figure 59. Power Generated by the Various Scenarios
The Power flow analysis also presents the power generation capability of the various generation sources in the specific scenarios as part of the next level of analytics.
The short circuit analysis builds on the power flow analysis verifies and validates the protective device settings or establishes the correct settings if they are not coordinated. The protective device settings are essential to the various operating scenarios being analyzed to again ensure sufficient power is being delivered to the critical loads of the microgrid. The short circuit analysis will also be fundamental to how the system operates if certain branches are energized or de-energized in the dynamic network of the microgrid power network.
As with power flow, once the baseline is established and validated, real-time data is input in the power model and the appropriate analytics are re-run based on the objectives, constraints and optimization of the microgrid.
• SC Ratio for Utility assumed 20 kA @ 13.2kV for 3Ph SC current • SG max contribution 1.25 kA/gen • SC max contribution 1.46 kA • WT max contribution 0.64 kA/turbine
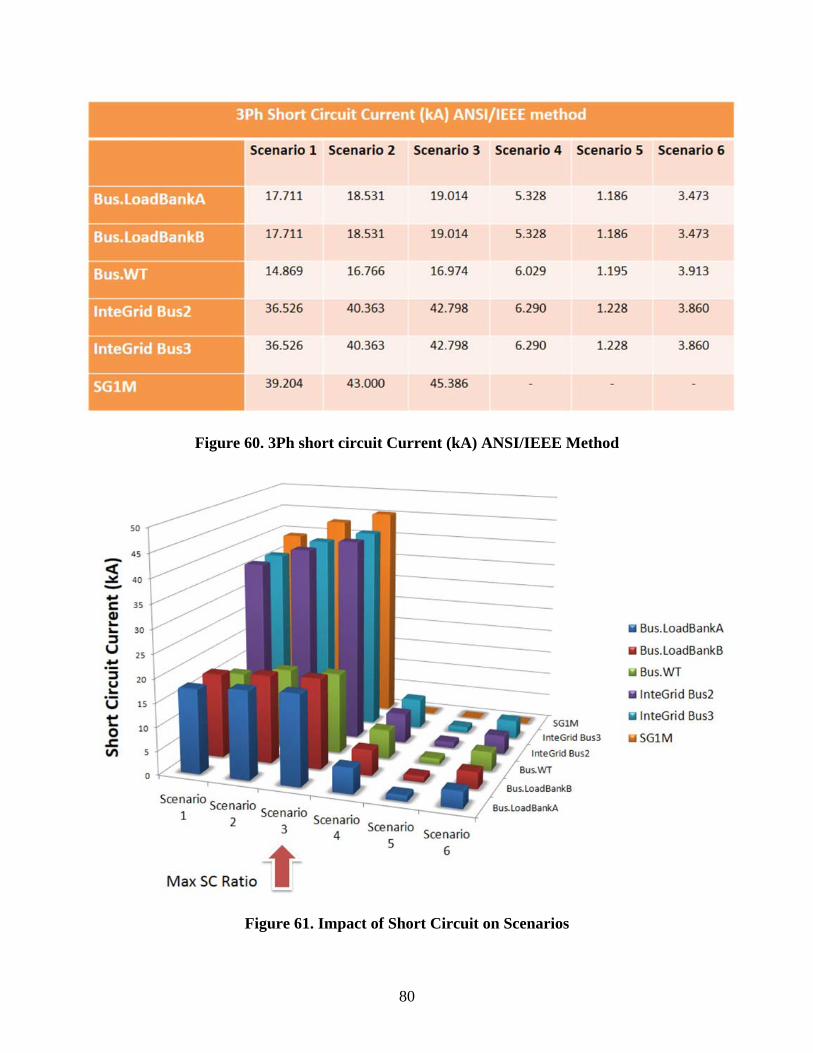
80
Figure 60. 3Ph short circuit Current (kA) ANSI/IEEE Method
Figure 61. Impact of Short Circuit on Scenarios
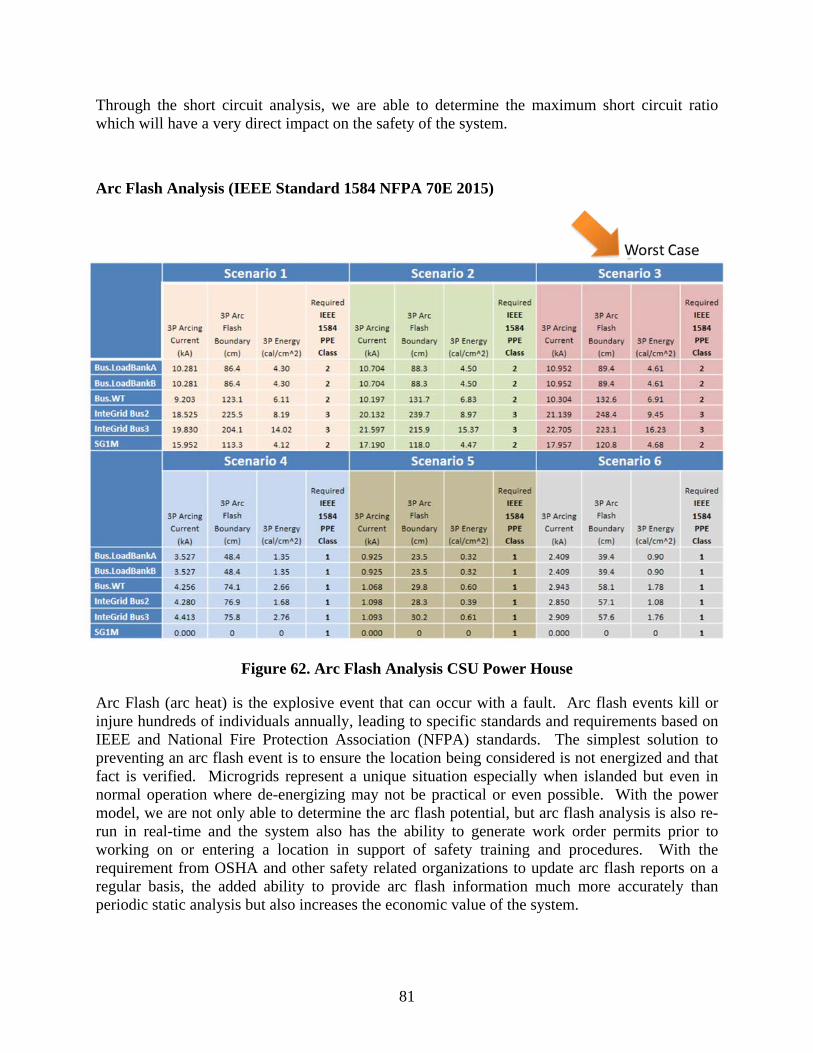
81
Through the short circuit analysis, we are able to determine the maximum short circuit ratio which will have a very direct impact on the safety of the system.
Arc Flash Analysis (IEEE Standard 1584 NFPA 70E 2015)
Figure 62. Arc Flash Analysis CSU Power House
Arc Flash (arc heat) is the explosive event that can occur with a fault. Arc flash events kill or injure hundreds of individuals annually, leading to specific standards and requirements based on IEEE and National Fire Protection Association (NFPA) standards. The simplest solution to preventing an arc flash event is to ensure the location being considered is not energized and that fact is verified. Microgrids represent a unique situation especially when islanded but even in normal operation where de-energizing may not be practical or even possible. With the power model, we are not only able to determine the arc flash potential, but arc flash analysis is also re-run in real-time and the system also has the ability to generate work order permits prior to working on or entering a location in support of safety training and procedures. With the requirement from OSHA and other safety related organizations to update arc flash reports on a regular basis, the added ability to provide arc flash information much more accurately than periodic static analysis but also increases the economic value of the system.
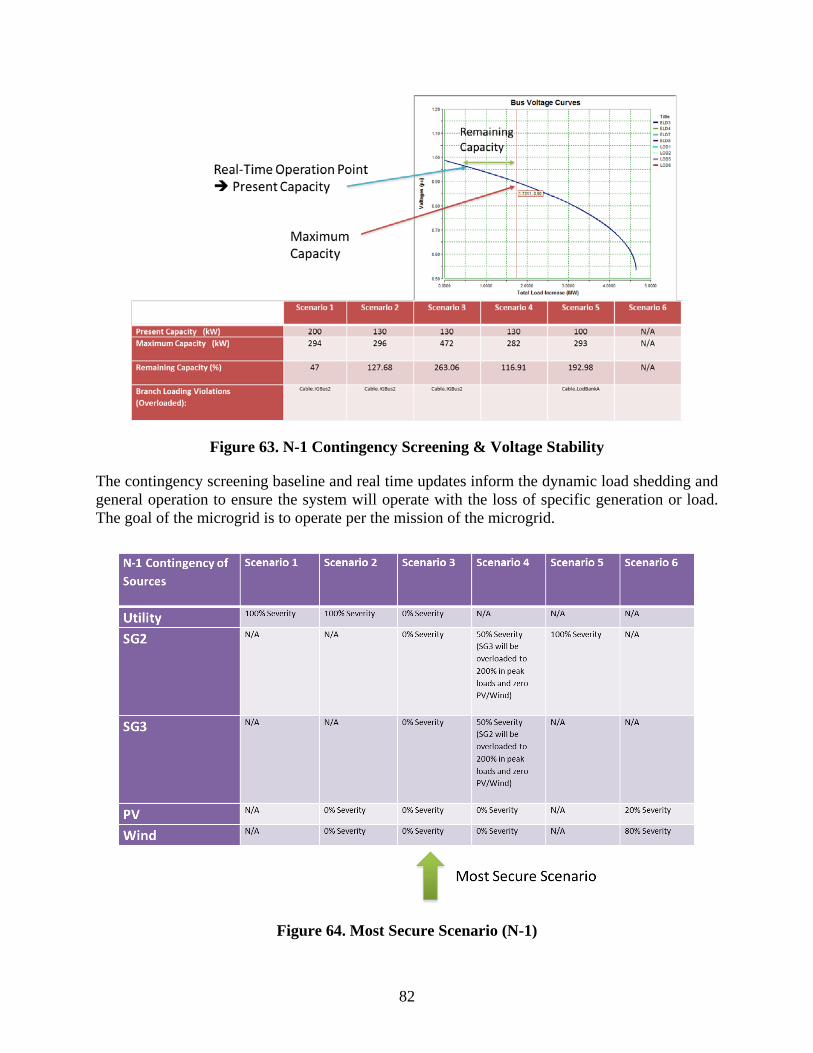
82
Figure 63. N-1 Contingency Screening & Voltage Stability
The contingency screening baseline and real time updates inform the dynamic load shedding and general operation to ensure the system will operate with the loss of specific generation or load. The goal of the microgrid is to operate per the mission of the microgrid.
Figure 64. Most Secure Scenario (N-1)
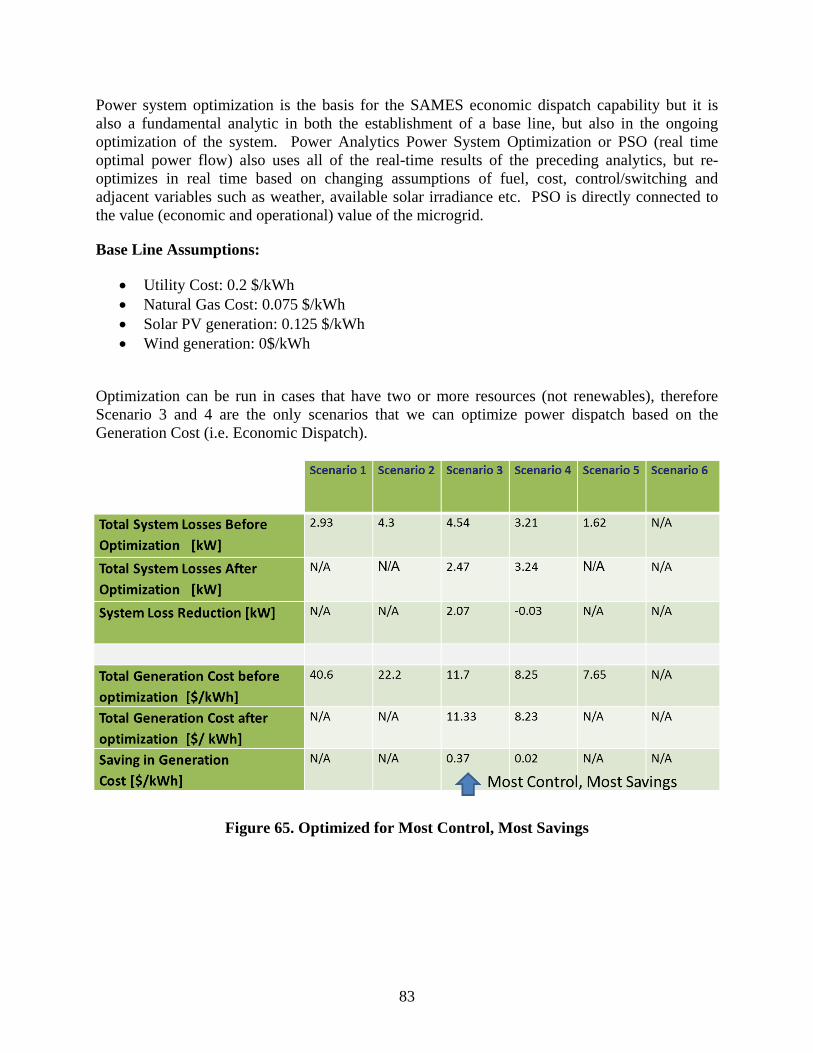
83
Power system optimization is the basis for the SAMES economic dispatch capability but it is also a fundamental analytic in both the establishment of a base line, but also in the ongoing optimization of the system. Power Analytics Power System Optimization or PSO (real time optimal power flow) also uses all of the real-time results of the preceding analytics, but re-optimizes in real time based on changing assumptions of fuel, cost, control/switching and adjacent variables such as weather, available solar irradiance etc. PSO is directly connected to the value (economic and operational) value of the microgrid.
Base Line Assumptions:
• Utility Cost: 0.2 $/kWh • Natural Gas Cost: 0.075 $/kWh • Solar PV generation: 0.125 $/kWh • Wind generation: 0$/kWh
Optimization can be run in cases that have two or more resources (not renewables), therefore Scenario 3 and 4 are the only scenarios that we can optimize power dispatch based on the Generation Cost (i.e. Economic Dispatch).
Figure 65. Optimized for Most Control, Most Savings

84
Page Intentionally Left Blank
85
10.0 REFERENCES
YouTube video: California’s Microgrids: Demonstrating Self-Reliant Energy. http://www.youtube.com/watch?v=8XksxOZSJOU&feature=plcp
YouTube video: The UCSD Microgrid – Showing the Future of Electricity… Today. http://www.youtube.com/watch?v=TEx4gm3523I
Power Analytics Whitepaper, Uptime Institute Symposium, The Enterprise Data Center as a Microgrid. Kevin Meagher, Chief Technology Officer, EDSA, 2010. http://www.poweranalytics.com/pa_articles/pdf/Uptime2010.pdf
Power Analytics Whitepaper: Unlocking Microgrids, Taming the Beast: Microgrid Strategies for Effective Cost Management of Your Electrical Infrastructure, Raj Chudgar, Principal, SunGuard Global Services, and Kevin Meagher, CTO, Power Analytics Corporation, May, 2011. http://www.poweranalytics.com/pa_articles/pdf/Unlocking Microgrids.pdf
AGO Research: Energy Management Driven by Power Analytics, Barry Needle. http://www.poweranalytics.com/pa_articles/pdf/Power%20Analytics%20Energy%20Management%20-%20final.pdf
Presentation Video, OSIsoft-Microsoft Executive Summit: Microgrid Innovation, The Living Laboratory at UCSD, Byron Washom, 2011. http://www.osisoft.com/templates/item-abstract.aspx?id=7688&terms=microgrid
Presentation Video, The Smart Grid Observer, Microgrids Virtual Summit: The UCSD Microgrid – A Case Study in Success. Byron Washom, Director of Strategic Energy Initiatives, 2012. http://www.smartgridobserver.com/ucsd-abstract.htm
OSIsoft, LLC User Conference Presentation, San Francisco: Securing PI and Using PI to Detect Cyber Attacks, Dale Peterson, 2009. http://www.osisoft.com/templates/item-abstract.aspx?id=3948&terms=Security
OSIsoft, LLC User Conference Presentation, San Francisco, CA: Emergency Response Data System (ERDS) - Replacement for the U.S. Nuclear Regulatory Commission (NRC), Patrick Murphy, Principle Analyst at the Project Performance Corporation, 2010. http://www.osisoft.com/templates/item-abstract.aspx?id=5113&terms=nuclear
OSIsoft, LLC: OSIsoft and Power Analytics Corporation to Provide Infrastructure for Net Zero Facility Initiatives, San Leandro, CA, October 18, 2011. http://www.osisoft.com/templates/overview-2.aspx?id=7600&terms=microgrid
OSIsoft, LLC .pdf file: The Power of PI, Real-Time Information Throughout the Enterprise, 2010. http://www.osisoft.com/workarea/DownloadAsset.aspx?id=4993
OSIsoft, LLC .pdf file: Smart Grid Roundtable, Two-way Conversation. http://www.osisoft.com/workarea/DownloadAsset.aspx?id=4900

86
OSIsoft, LLC User Conference Presentation: San Francisco, CA, Migration of the Manufacturing to the Information Age, Dr. J. Patrick Kennedy, 2009. http://www.osisoft.com/resources/presentations/presentation_abstracts/2009_-_User_Conference_-_San_Francisco/Migration_of_the_Manufacturing_to_the_Information_Age.aspx
OSIsoft, LLC: OSIsoft in Power & Utilities. http://www.osisoft.com/value/industry/PowerUtilities/
Platts, insight eZine: Smart Grid Special Issue, June, 2009. http://viewer.zmags.com/publication/a1a7bf6e#/a1a7bf6e/11
YouTube video, GreenMonk: The Blog, Smart Grid Heavy Hitter Series, Kevin Meagher, CTO, EDSA, March 18, 2010. http://greenmonk.net/smart-grid-heavy-hitter-series-kevin-meagher-cto-edsa/
Links to Video Clips: Uptime Institute Symposium Santa Clara, CA, May 9-12, 2011. http://symposium.uptimeinstitute.com/component/content/article/35/1312-symposium-2011-video-clips
Power Magazine: Smart Power Generated at UCSD, CA, November 1, 2010. http://www.powermag.com/gas/Smart-Power-Generation-at-UCSD_3104.html
Forbes: Smart Grids Highlight Innovation’s Promise, and Where America Leads the World, Even China, Mark P. Mills, August 15, 2011. http://www.forbes.com/sites/markpmills/2011/08/15/smart-grids-highlight-innovations-promise-and-where-america-leads-the-world-even-china/4/
Slide Presentation: Local Impact, National Influence, Global Reach: US San Diego’s Leadership in Energy Sustainability Overview of UCSD Microgrid, Byron Washron, April 7, 2010. http://www.slideshare.net/UCSD-Strategic-Energy/byron-washoms-guest-lecture-to-mae-124-eyse-103-on-4411
YouTube Video: UCSD Students Tout Campus Greenness, December, 2008. http://www.youtube.com/watch?v=9_WiZO2MvZU
CA.gov Web Page: The California Energy Commission, Research Meetings, Notices, Workshops, Symposiums 2012. http://www.energy.ca.gov/research/notices/#03262012.
University of California, San Diego Web Page: 2.0, A Living Laboratory, 2012. http://sustainability.ucsd.edu/
DoD Study, by ICF International, ESTCP: Solar Energy Development on Department of Defense Installations in the Mojave and Colorado Deserts, Extractions: 6.3.3 Island Mode Operation, 6.3.4 Black-Start Capability, 6.6 Traditional Emergency Generation Technology, 6.7 Potential Role of Solar Energy for Emergency Backup Supply, 8.2.4 Clarify and Develop Programs to Achieve Energy Security Goals, January, 2012.

87
Power Analytics Web Site – Whitepapers, Slide Presentation: Powersystems World, Power Analytics, The Business of Power Analytics - Power Qualities New Frontier, Kevin P. Meagher, EDSA Micro Corporation, October 25-27, 2005. http://www.poweranalytics.com/pa_articles/pdf/PQ%20conf.pdf
Power Analytics Web Site – Whitepapers, Slide Presentation: Reliability, Availability & Reliability Centered Maintenance (RCM), The Mission Critical Triangle, EDSA Micro Corporation, Power Quality and Reliability 2006 Conference, Kevin P. Meagher. http://www.poweranalytics.com/pa_articles/pdf/PQM.pdf

88
Page Intentionally Left Blank

A-1
APPENDIX A MANAGEMENT AND STAFFING
Point of Contact Name
Organization Name
Phone Email Role in Project
Kevin Meagher Power Analytics 919-719-3153 [email protected]
Principal Investigator
Stephen C. Knapp Power Analytics 919-719-1753 [email protected]
Program Manager
John Arterberry Power Analytics 858-675-9794 [email protected]
Program Manager - Subcontractor
Ben Motten Connor Networks 619-279-4709 [email protected]
Subcontractor
Chad Von Eck Viridity Energy 610-636-3881 [email protected]
Subcontractor
Oliver Pacific Spirae 281-380-2186 [email protected]
Subcontractor
Byron Washam University of California, San Diego
925-788-9196 [email protected]
Advisor
Ray Robeson San Diego Gas & Electric
858-654-8208 [email protected]
Advisor
Dr. Laura Baker (Juette)
NAVFAC SW 619-207-9131 [email protected]
Sponsor

A-2
Page Intentionally Left Blank
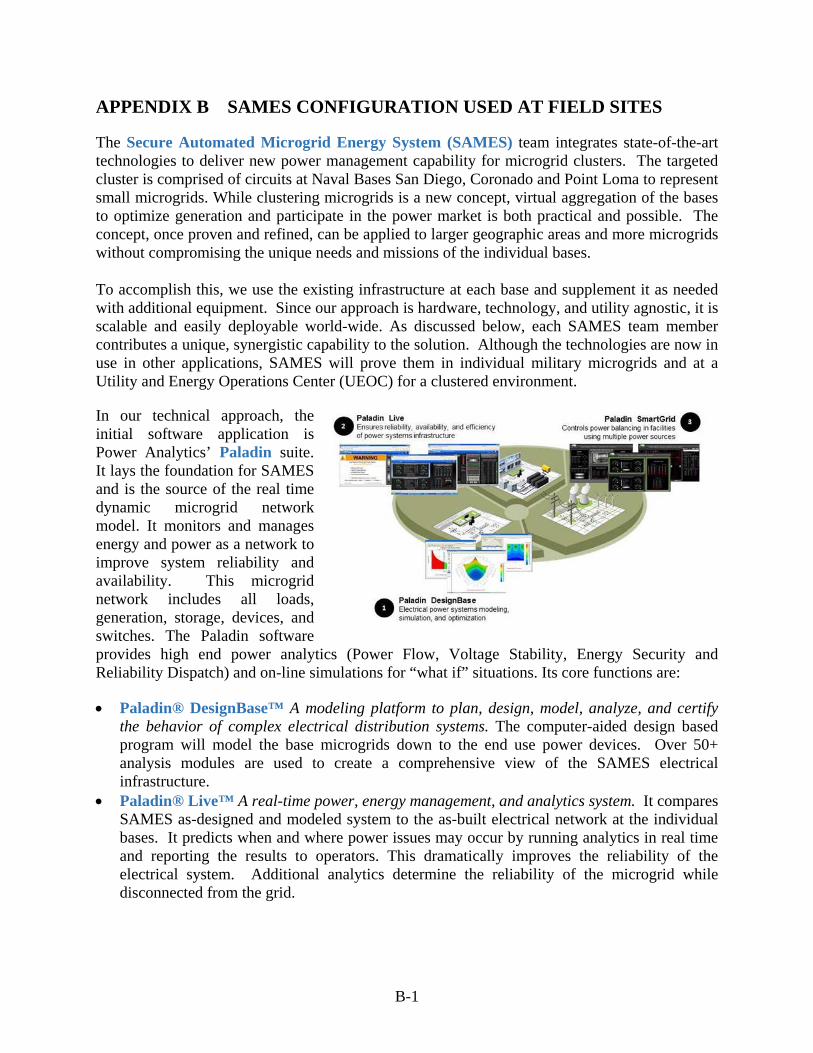
B-1
APPENDIX B SAMES CONFIGURATION USED AT FIELD SITES
The Secure Automated Microgrid Energy System (SAMES) team integrates state-of-the-art technologies to deliver new power management capability for microgrid clusters. The targeted cluster is comprised of circuits at Naval Bases San Diego, Coronado and Point Loma to represent small microgrids. While clustering microgrids is a new concept, virtual aggregation of the bases to optimize generation and participate in the power market is both practical and possible. The concept, once proven and refined, can be applied to larger geographic areas and more microgrids without compromising the unique needs and missions of the individual bases.
To accomplish this, we use the existing infrastructure at each base and supplement it as needed with additional equipment. Since our approach is hardware, technology, and utility agnostic, it is scalable and easily deployable world-wide. As discussed below, each SAMES team member contributes a unique, synergistic capability to the solution. Although the technologies are now in use in other applications, SAMES will prove them in individual military microgrids and at a Utility and Energy Operations Center (UEOC) for a clustered environment.
In our technical approach, the initial software application is Power Analytics’ Paladin suite. It lays the foundation for SAMES and is the source of the real time dynamic microgrid network model. It monitors and manages energy and power as a network to improve system reliability and availability. This microgrid network includes all loads, generation, storage, devices, and switches. The Paladin software provides high end power analytics (Power Flow, Voltage Stability, Energy Security and Reliability Dispatch) and on-line simulations for “what if” situations. Its core functions are:
• Paladin® DesignBase™ A modeling platform to plan, design, model, analyze, and certify the behavior of complex electrical distribution systems. The computer-aided design based program will model the base microgrids down to the end use power devices. Over 50+ analysis modules are used to create a comprehensive view of the SAMES electrical infrastructure.
• Paladin® Live™ A real-time power, energy management, and analytics system. It compares SAMES as-designed and modeled system to the as-built electrical network at the individual bases. It predicts when and where power issues may occur by running analytics in real time and reporting the results to operators. This dramatically improves the reliability of the electrical system. Additional analytics determine the reliability of the microgrid while disconnected from the grid.
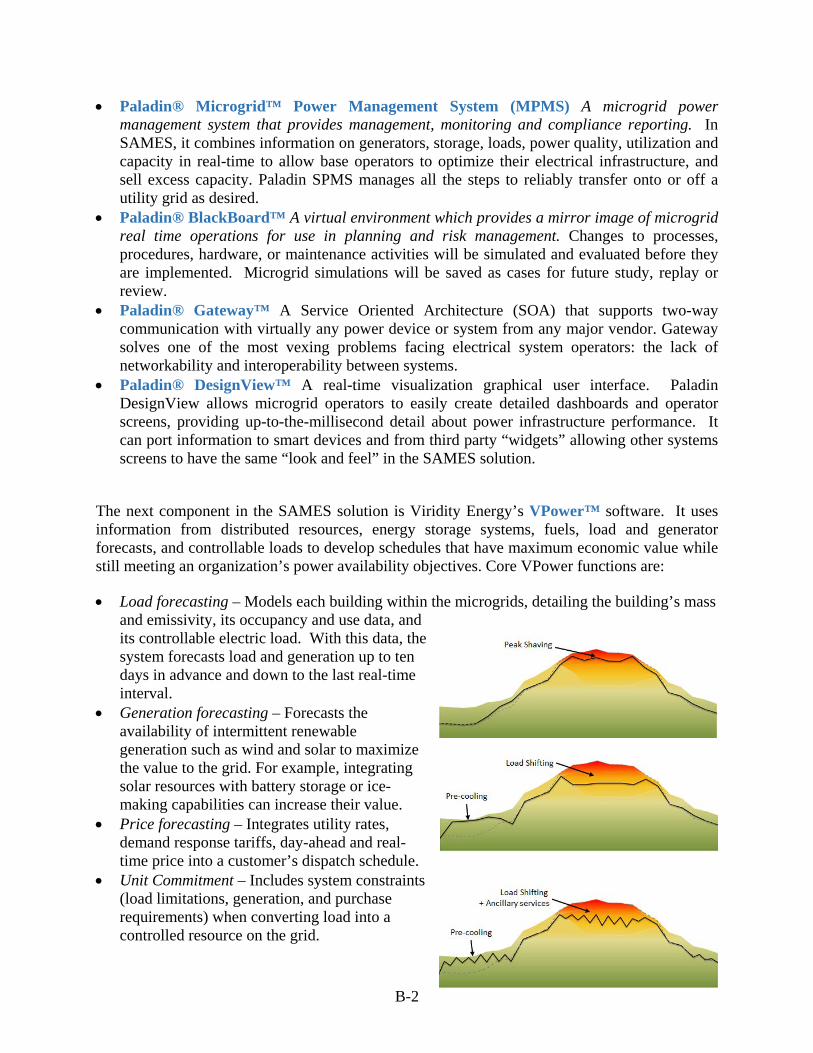
B-2
• Paladin® Microgrid™ Power Management System (MPMS) A microgrid power management system that provides management, monitoring and compliance reporting. In SAMES, it combines information on generators, storage, loads, power quality, utilization and capacity in real-time to allow base operators to optimize their electrical infrastructure, and sell excess capacity. Paladin SPMS manages all the steps to reliably transfer onto or off a utility grid as desired.
• Paladin® BlackBoard™ A virtual environment which provides a mirror image of microgrid real time operations for use in planning and risk management. Changes to processes, procedures, hardware, or maintenance activities will be simulated and evaluated before they are implemented. Microgrid simulations will be saved as cases for future study, replay or review.
• Paladin® Gateway™ A Service Oriented Architecture (SOA) that supports two-way communication with virtually any power device or system from any major vendor. Gateway solves one of the most vexing problems facing electrical system operators: the lack of networkability and interoperability between systems.
• Paladin® DesignView™ A real-time visualization graphical user interface. Paladin DesignView allows microgrid operators to easily create detailed dashboards and operator screens, providing up-to-the-millisecond detail about power infrastructure performance. It can port information to smart devices and from third party “widgets” allowing other systems screens to have the same “look and feel” in the SAMES solution.
The next component in the SAMES solution is Viridity Energy’s VPower™ software. It uses information from distributed resources, energy storage systems, fuels, load and generator forecasts, and controllable loads to develop schedules that have maximum economic value while still meeting an organization’s power availability objectives. Core VPower functions are:
• Load forecasting – Models each building within the microgrids, detailing the building’s mass and emissivity, its occupancy and use data, and its controllable electric load. With this data, the system forecasts load and generation up to ten days in advance and down to the last real-time interval.
• Generation forecasting – Forecasts the availability of intermittent renewable generation such as wind and solar to maximize the value to the grid. For example, integrating solar resources with battery storage or ice-making capabilities can increase their value.
• Price forecasting – Integrates utility rates, demand response tariffs, day-ahead and real-time price into a customer’s dispatch schedule.
• Unit Commitment – Includes system constraints (load limitations, generation, and purchase requirements) when converting load into a controlled resource on the grid.
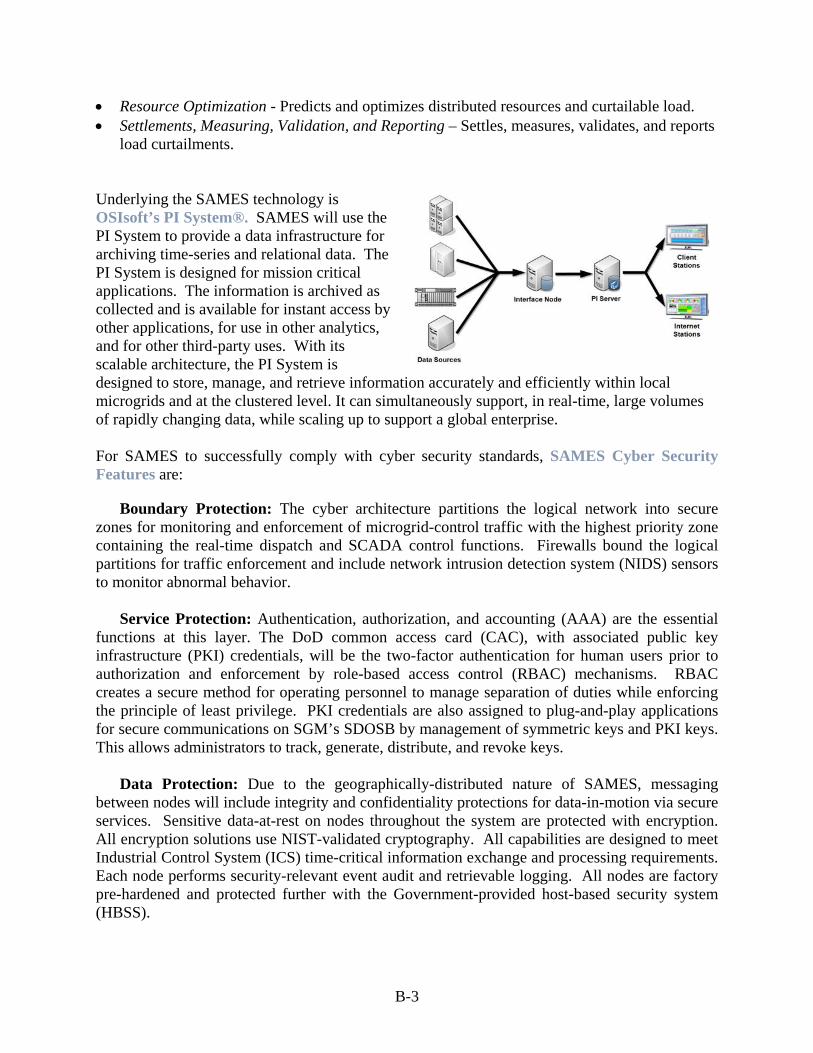
B-3
• Resource Optimization - Predicts and optimizes distributed resources and curtailable load. • Settlements, Measuring, Validation, and Reporting – Settles, measures, validates, and reports
load curtailments. Underlying the SAMES technology is OSIsoft’s PI System®. SAMES will use the PI System to provide a data infrastructure for archiving time-series and relational data. The PI System is designed for mission critical applications. The information is archived as collected and is available for instant access by other applications, for use in other analytics, and for other third-party uses. With its scalable architecture, the PI System is designed to store, manage, and retrieve information accurately and efficiently within local microgrids and at the clustered level. It can simultaneously support, in real-time, large volumes of rapidly changing data, while scaling up to support a global enterprise. For SAMES to successfully comply with cyber security standards, SAMES Cyber Security Features are:
Boundary Protection: The cyber architecture partitions the logical network into secure zones for monitoring and enforcement of microgrid-control traffic with the highest priority zone containing the real-time dispatch and SCADA control functions. Firewalls bound the logical partitions for traffic enforcement and include network intrusion detection system (NIDS) sensors to monitor abnormal behavior.
Service Protection: Authentication, authorization, and accounting (AAA) are the essential functions at this layer. The DoD common access card (CAC), with associated public key infrastructure (PKI) credentials, will be the two-factor authentication for human users prior to authorization and enforcement by role-based access control (RBAC) mechanisms. RBAC creates a secure method for operating personnel to manage separation of duties while enforcing the principle of least privilege. PKI credentials are also assigned to plug-and-play applications for secure communications on SGM’s SDOSB by management of symmetric keys and PKI keys. This allows administrators to track, generate, distribute, and revoke keys.
Data Protection: Due to the geographically-distributed nature of SAMES, messaging
between nodes will include integrity and confidentiality protections for data-in-motion via secure services. Sensitive data-at-rest on nodes throughout the system are protected with encryption. All encryption solutions use NIST-validated cryptography. All capabilities are designed to meet Industrial Control System (ICS) time-critical information exchange and processing requirements. Each node performs security-relevant event audit and retrievable logging. All nodes are factory pre-hardened and protected further with the Government-provided host-based security system (HBSS).

B-4
Correlation and Response: Our cyber solution manages all security event information obtained from capabilities within the cyber security, physical security, and grid-control domains through external and internal security information and event managers (SIEM) for correlation and incident determination.
The SAMES Utility and UEOC solution uses the individual technology capabilities from each team member to create a clustered solution. The regional control center will have access to the data from each of the individual microgrids, market data, and forecast information for each base, and will be able to view all the individual base optimization solutions. With this information, the UEOC can determine if it wants to enhance its commercial and energy security value by applying optimizations across the bases. Examples of cross cutting optimizations are:
1. Buying and selling of power from/to the market for each of the bases to minimize energy cost holistically
2. Optimizing Demand Management across the bases for maximum energy reduction to the utility during emergencies
3. Isolating the bases due to a situation seen on one of the bases before it can affect the others.
C-1
APPENDIX C PATENTS OR SCIENTIFIC/TECHNICAL AWARDS/ HONORS/ PROTOCOLS/ USER-GUIDES
Completed publications, patents, awards, etc. resulting from this work:
• Power Analytics joins the CleanTech San Diego Board of Directors, Jan. 2015;
• Power Analytics received four new patents in 2014, Patent #8688429, #8165723, #8775934 and #8868398;
• Military & Commercial Microgrid, Nov. 19, 2014 “Tackling Microgrid Technical Challenges”, Tisha Trites Co-Presenter;
• Power Analytics 20/20 Vision-Driven Power Conference, Oct. 22, 2014 “Developing and Managing Microgrids and Distributed Energy”, Kevin Meagher Co-Presenter; and,
• “Data Analytics: What Utilities Are Investing in Now”. August 18, 2014. http://www.greentechmedia.com/articles/read/data-analytics-what-utilities-wan

C-2
Page Intentionally Left Blank

D-3
APPENDIX D OVERVIEW OF POWER ANALYTICS CORPORATION
Power Analytics Corporation is a thirty-year old power engineering firm, with deep energy industry roots. Our experience, expertise, and software products have been used within many mission-critical energy facilities. Power Analytics is ISO 9001 and Nuclear Procurement Issues Committee (NUPIC) certified. We are seasoned experts in real-time power system optimization and arc flash protection. In 2016, Power Analytics merged with Power Generation Services a leading operator of a 7/24 balancing authority which is certified by the North American Electric Reliability Corporation (NERC) and currently manages more than 12GW of power generation. Power Analytics has created a powerful, innovative software solution set that will enable the electric energy industry to transition smoothly into a future where distributed energy resources (both generation and load) are carefully managed and become a “used and useful” integral component of overall electric grid.
Since its founding, Power Analytics has been the leading innovator in electrical distribution systems design, analysis and simulation solutions. Today, the company’s products are used by thousands of customers in virtually every industry in which electrical power serves as the “central nervous system” for mission-critical operations. In addition, Power Analytics power system consulting services utilize a broad range of capabilities within our Paladin® software suite including: economic analysis, load flow, short circuit, protective device coordination and programming, AC and DC arc flash, motor starting and transient stability, voltage stability, ground grid, cable ampacity, power system optimization, and over fifty other competencies. We currently maintain Professional Engineering (PE) stamps for MA, NY, DC, CA, WA, NV, and AZ.
Power Analytics is the creator of the Energy Alignment Process™ which combines Power Analytics economic analysis with power analysis to help align the vision of our customers with the capability of technology in power and energy.
Power Analytics products and services are used to ensure the fail-safe operation of data and network operations centers, manufacturing plants, nuclear power facilities, deep sea oil platforms, aircraft carriers, submarines, Federal Aviation Administration networks, and other complex structures with uncompromising electrical power requirements for commercial, federal, state and local governments. The total value of assets protected by Power Analytics technology is more than $100 billion.
Power Analytics software products meet the quality standards from the International Standards Organization (ISO), the American National Standards Institute (ANSI), the Institute of Electrical and Electronics Engineers (IEEE) the Nuclear Regulatory Commission (NRC), the Nuclear Issues Committee (NUPIC), the Department of Defense (DoD), NATO, Det Norske Veritas (DNV GL), the National Fire Protection Association (NFPA), and others.
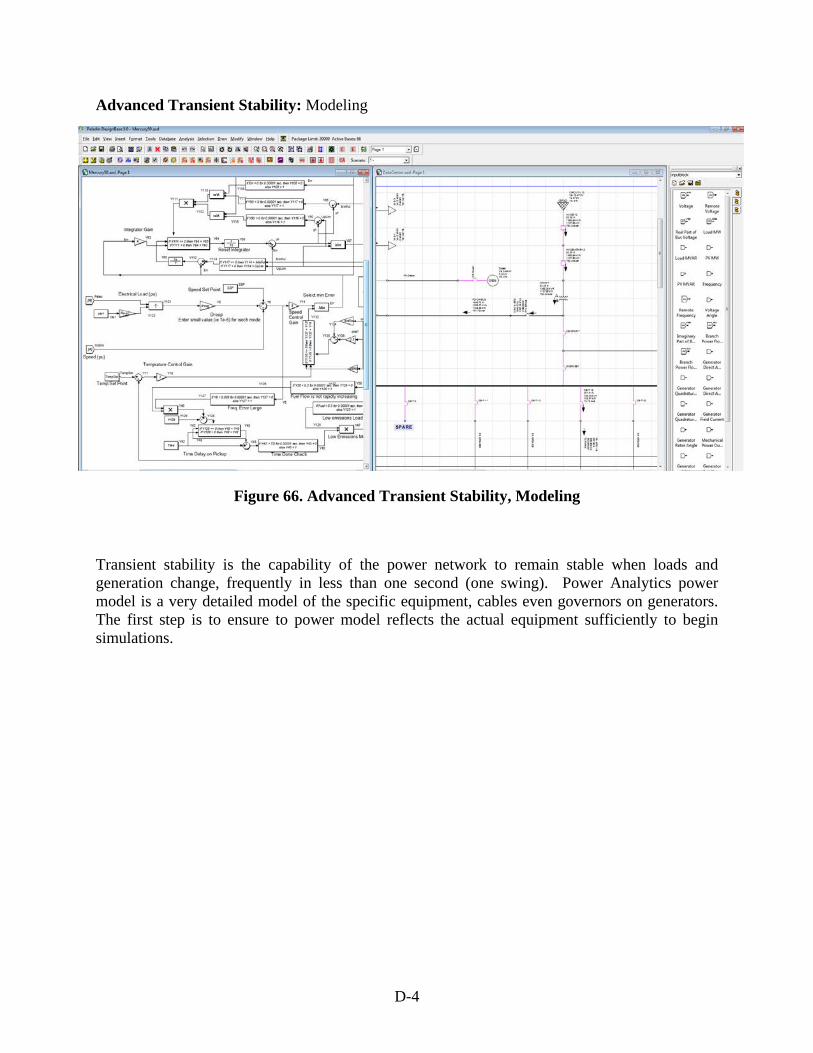
D-4
Advanced Transient Stability: Modeling
Figure 66. Advanced Transient Stability, Modeling
Transient stability is the capability of the power network to remain stable when loads and generation change, frequently in less than one second (one swing). Power Analytics power model is a very detailed model of the specific equipment, cables even governors on generators. The first step is to ensure to power model reflects the actual equipment sufficiently to begin simulations.
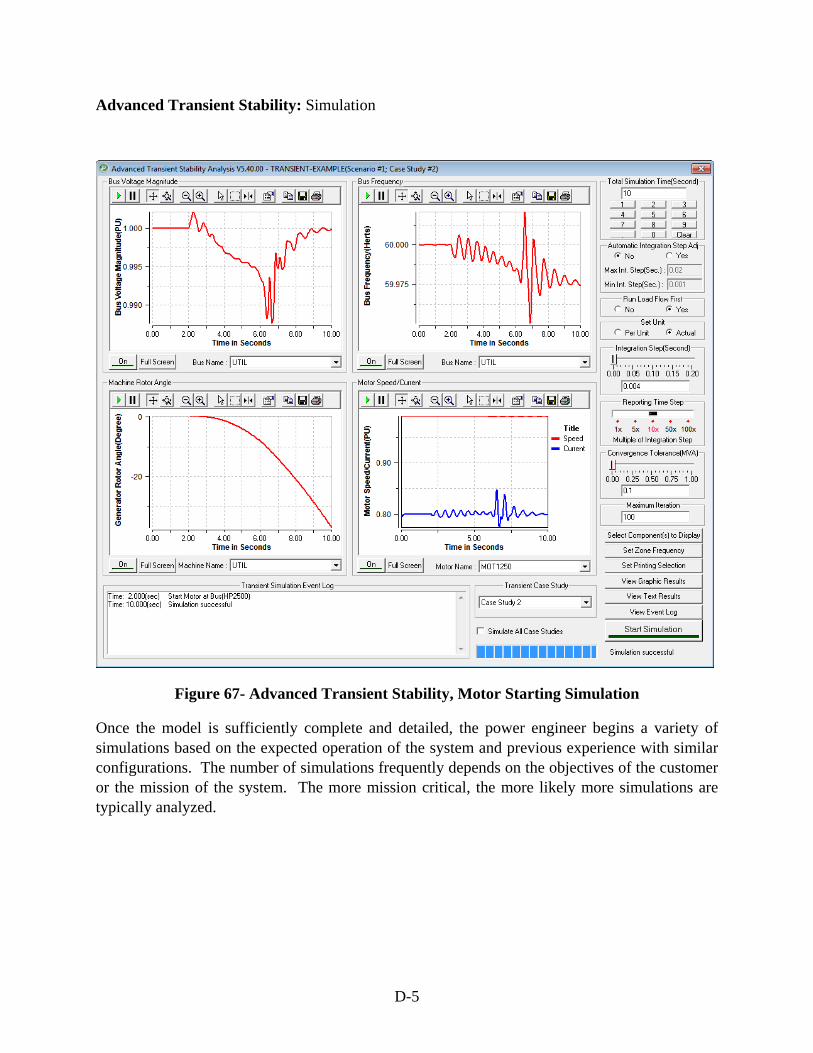
D-5
Advanced Transient Stability: Simulation
Figure 67- Advanced Transient Stability, Motor Starting Simulation
Once the model is sufficiently complete and detailed, the power engineer begins a variety of simulations based on the expected operation of the system and previous experience with similar configurations. The number of simulations frequently depends on the objectives of the customer or the mission of the system. The more mission critical, the more likely more simulations are typically analyzed.
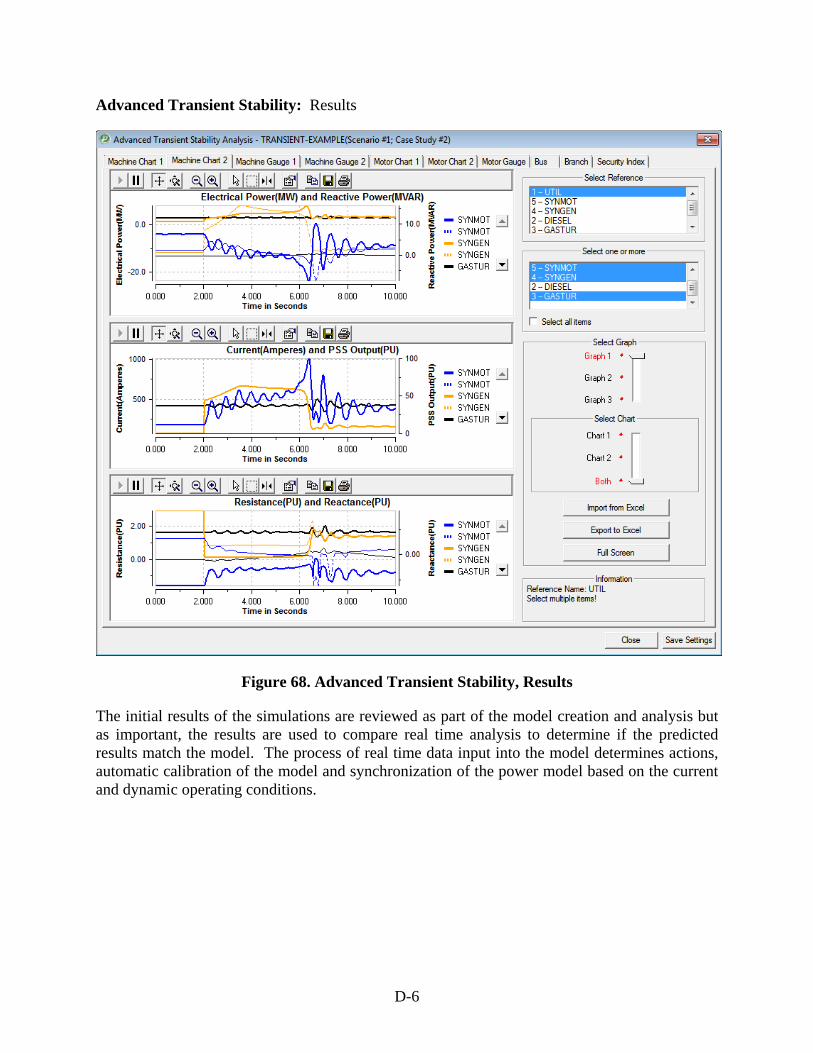
D-6
Advanced Transient Stability: Results
Figure 68. Advanced Transient Stability, Results
The initial results of the simulations are reviewed as part of the model creation and analysis but as important, the results are used to compare real time analysis to determine if the predicted results match the model. The process of real time data input into the model determines actions, automatic calibration of the model and synchronization of the power model based on the current and dynamic operating conditions.
E-1
APPENDIX E INTEGRATION METHODOLOGY
Historically, Department of Defense (DoD) military base installations addressed the need for increased electrical reliability through the use of dedicated diesel generators collocated with critical loads. For large installations, this can result in more than 100 small generators, each servicing a low-voltage feeder to an individual building. The large number of generators can make regular maintenance expensive and lead to uneven maintenance standards. These smaller spot generators typically include 72 hours of on-site fuel storage, potentially leading to issues with resupply logistics during longer-duration outages. The system as a whole is typically not well integrated, either internally with nearby renewable assets or with the larger external grid. As a result, system performance is not optimized for efficient, reactive, and sustainable operations across the installation in the event of a power outage or in response to periods of high stress on the electric grid.
The desire to be able to operate while separated from the utility grid for extended periods along with the push to integrate large-scale solar photovoltaics (PV) across DoD military bases has led to increased interest in integrating very high percentage penetrations of PV into DoD military base microgrids. For example, each of the military services has pledged to install 1 GW of PV on its installations by 2025.
The DoD has mandated a goal of improving energy security while reducing cost. The Department of the Navy (DoN), through its Smart Power Partnership Initiative (SPPI), created a pilot regional smartgrid in San Diego. SPPI goals are to enhance energy security, reduce costs, integrate renewable power, and export the regional smartgrid concept to other regions. As noted by SPPI, military bases, which have a high power demand or a high need for uninterrupted power, are ideal candidates for microgrids. However, because of concerns about operational risks, DoD has not fully realized the potential value of military base electrical infrastructures. Few stand-alone microgrids have been installed, and to date, no microgrid clusters have been deployed. The SAMES project, in part, demonstrated that a clustered microgrid can offer significant benefits in energy cost savings and in power performance improvement.
Objective
The objective of SAMES is the creation and operation of a secure microgrid cluster. The cluster maximizes energy security and efficiency at the lowest possible operating cost. The microgrids are at three geographically separated naval bases in San Diego, with their monitoring and control combined in an enterprise-level system at the Naval Base San Diego Utility and Energy Operations Center.
A nano/micro-grid is either a physical or virtual combination of energy assets (loads and generation) which can be disconnected from the local grid. Single microgrids have proven their value in reducing cost and improving reliability in the commercial sector. However, the aggregation of nanogrids into a microgrid, “cluster”, bringing greater benefits in economies of scale, enhanced reliability and greater value in the marketplace, has not yet been proven. This will be the first instance of the creation of a centrally managed cluster of microgrids in a cyber-secure military environment. It offers great potential to improve energy security, reduce costs, and fully integrate renewable energy sources into a base electrical infrastructure at facilities world-wide.

E-2
Cost-effective microgrid solutions will need to adapt existing installation assets for use within the microgrid. Existing backup diesel generators, building energy management systems, and metering infrastructure can be used to reduce the overall cost of microgrid implementation. The ages, condition, and manufacturers of these systems vary widely across DoD military base installations, however. How best to incorporate legacy hardware and use the existing distribution system is a significant challenge and will be a cost driver for many DoD installation microgrids.
Distributed Energy Resource – Emerging Technologies
A distributed energy resource (DER) is a resource sited close to the end-user that can provide all or some of their immediate electric and power needs and can also be used by the system to either reduce demand (such as energy efficiency) or provide supply to satisfy the energy, capacity, or ancillary service needs of the distribution grid. The resources, if providing electricity or thermal energy, are small in scale, connected to the distribution system, and close to load. Examples of different types of DER include, but are not limited to, solar photovoltaic (PV), energy storage (ES), and combined heat and power (CHP).
Solar PV Systems
The Solar PV systems can be used to meet the energy requirements for DoD military base facilities including, but not limited to, homes, hospitals, storage building; or the energy from the system can be exported to the grid through the distribution system to be used by the local utility. Due to technological advances, falling panel prices, and other policies, including favorable tax treatment, PV systems have become the fastest-growing type of DER.
Energy Storage
Energy storage can be used as a resource to add stability, control, and reliability to the electric grid. Historically, storage technologies have not been widely used because they have not been cost competitive with cheaper sources of power such as fossil fuels. However, given the recent decline in costs and technological improvements in storage, storage has become an option that is able to compete with many other resources. With the growing use of intermittent technologies such as wind and solar energy, energy storage technologies can provide needed power during periods of low generation from intermittent resources that will assist in keeping the electric grid stable and possibly prevent curtailment of resources in spring and fall months when electricity consumption is not affected by summer air-conditioning or winter heating loads. There are a variety of storage types, from large storage resources (e.g. pumped hydro) to thermal storage (e.g., ice energy or electric water heaters) to chemical storage (e.g., flow batteries or solid state) and mechanical devices (e.g., flywheels). These different technologies provide different types of responses and services.
Combined Heat and Power
CHP systems, also referred to as cogeneration, provide both electric power and heat from a single fuel source. While most power plants in the United States create steam as a byproduct that is released as waste heat, a CHP system captures the heat and uses it for many other purposes such as heating, cooling, domestic hot water, and industrial processes. CHP systems can use a diverse set of fuels to operate, including natural gas, biomass, coal, and process wastes.

E-3
CHP can achieve efficiencies of over 80 percent, compared with 50 percent for conventional technologies. Certain types of CHP systems are capable of islanding or offering black start services, where allowed by rules or tariffs.
Key Microgrid Technology Enablers
Generation, energy conversion and storage, plus load control collectively known as DER. Distributed energy storage (DES), which is also an element of DER, allows the management of intermittent and renewable energy generation, as well as serving load during islanded operation.
Microgrid controls and supervisory systems, to implement various modes of operation (namely grid connected and islanding), and to ensure proper transition between these two main operation modes. They also manage real time power balancing and longer term energy requirements among internal DER units and loads. Additionally, they determine power exchange requirements with the rest of the legacy electricity supply chain (macrogrid) during grid-connected operation, based on pre-specified objective functions (e.g. operating cost minimization, or maximum penetration of renewable resources, etc.)
Microgrid protection and automation to ensure safe, sound, and autonomous operation of the microgrid internal assets, as well as fast detection and isolation of faults, either internal or external to microgrid boundaries.
Communications and remote monitoring systems, to enable the collaborative effort of internal and external control, protection, and automation systems for management of day-to-day operation and/or implementation of control and protection schemes.
DOD Military Base Microgrids - Energy Savings, Efficiency, Economic Competitiveness and Grid Support
The Department of Homeland Security (DHS) defines critical infrastructure as “those assets, systems, and networks that, if incapacitated, would have a substantial negative impact on national security, national economic security, or national public health and safety.
Appropriately designed, operated, and sited microgrids can create economic benefits for DoD military base users of the microgrid. Microgrids may incorporate a suite of distributed energy resources (“DER”) including energy efficiency investments, electric generation technologies utilizing combined heat and power (“CHP”), solar photovoltaic (PV), energy storage, optimizations algorithms, and intelligent energy management. This integrated local energy portfolio can directly create benefits by significantly reducing the overall energy costs for the microgrid users compared to purchasing energy from the main grid, deliver power and heat resiliency to the site and indirectly reduce costs for all grid users by lowering peak load on the entire electric system.
The direct economic benefits of microgrids emanate primarily from improving overall energy efficiency—whether by reducing energy consumption or using energy more intelligently. Whole-building energy efficiency measures can reduce overall energy consumption and costs as well as reducing the necessary size of the microgrid’s generation sources. CHP can provide continuous base load power at a lower cost than the main grid by utilizing the waste heat from electricity generation for purposes such as space and water heating and absorption cooling.

E-4
Intelligent energy management software, communication and controls can shape load profiles, optimize onsite energy production and consumption, and shift energy demand in response to price signals.
These technologies can create economic savings as measures within single buildings, but combining them into a larger system with multiple technologies and loads via a microgrid can create synergistic effects that further improve economic, reliability, and grid system benefits. For example, a CHP system that jointly serves multiple users with complementary usage may enable significantly larger energy cost savings than separate systems that serve each building individually. Consider one user with a large and consistent demand for thermal energy, but little demand for electricity, paired with a nearby user with the opposite usage pattern. By combining such complementary loads, a single CHP system will have a marked improvement in efficiency and utilization rate, thereby creating a far more economically viable, and environmentally superior system than operating each individually. While it’s rare to find such perfectly complementary partners, the different load profiles of each can still offer a great deal of load “smoothing” to the overall system.
When sections of the electric grid become congested due to demand growth, utilities need to make significant investments to upgrade the system by replacing old or installing additional infrastructure. Microgrids are able to provide grid support as they decrease the overall load on the main grid by reducing onsite energy consumption and self-generating a large portion of the demand. When microgrids reduce this strain, the utility can defer or avoid these costly investments, as well as avoid additional investment in other generation sources, thus further reducing the entire grid’s energy costs. For distribution only utilities, this results in lower costs for procuring energy and capacity.
Microgrids have proven to be a cost-effective approach to achieving sustainability and environmental goals, by reducing harmful air pollutants such as greenhouse gases. Incorporating energy efficiency and renewable generation sources such as solar PV or wind will provide emission-free energy. Microgrids enable greater economies of scale for renewable energy while allowing multiple users to share the environmental benefits produced by these measures. Intelligent energy management and storage can also be utilized to operate the microgrid in the cleanest way possible—shifting energy demand to when the cleanest sources are available, for example.
Microgrids incorporating CHP systems that run on natural gas can also have significant sustainability benefits. For the same reason that they reduce energy costs, they also reduce air pollution by significantly improving fuel efficiency as compared to the main grid. Because CHP systems are designed and sized to operate continuously as opposed to intermittently, they can produce much greater net emissions reductions than other forms of generation like solar PV and wind.
Operating through extended grid outages is extremely important for critical infrastructure. Natural disasters such as hurricanes, earthquakes, and tornados may render the main grid inoperable by knocking down distribution and transmission lines or disabling other parts of the grid. As the name suggests, it is at precisely these times that critical infrastructure facilities are most needed. Microgrids are self-sufficient systems possessing local power generation sources, with less exposed infrastructure and so are less prone to disruptions and damage during such events. Therefore, critical infrastructure within a microgrid will be much more likely to maintain power and continue operating during emergency events that affect the surrounding macrogrid.
E-5
Conclusion
Looking at the energy security challenges from a DoD perspective provides a unique angle from which to view the challenges and opportunities associated with increasing energy security. The Department of the Navy (DoN), through its Smart Power Partnership Initiative (SPPI), and efforts to operationalize a comprehensive approach provide frameworks within which DoD, in close cooperation with industry, can take additional practical steps to enhance overall energy system resilience through contributing to the development of military facility based microgrids.
Energy security is, like most contemporary complex issues, embedded in a dynamic system of systems involving infrastructure, personnel and emerging issues like cyber security. DoD possesses the organizational infrastructure necessary to bring together broad sets of stakeholders to contribute, along with government standards organizations and other major intergovernmental organizations, to energy security standard creation. Microgrids have two important overlapping capabilities from the military perspective: increased multi-source (natural gas, diesel, oil, wind, solar, methane, etc.) power generation capability for bases (both in home countries and in expeditionary operations in austere environments) and in providing continuity of service separate from the main power grid.
Managing diverse power sources is extremely complicated. For example, integrating a solar array into a base power supply infrastructure requires not only knowledge of the microclimate effecting the array and the projected loads but also requires conventional power generation resources on standby to cover the possible shortfalls from the solar generation. Microgirds can help manage this challenge. The small size and focus on key military base microgrids makes more efficient use of multiple distributed energy resources, like landfill methane, wind, solar and small scale natural gas and co-generation facilities and a variety of storage technologies easier. The microgrid operator can more efficiently manage its loads within the microgrid because the operator can quickly, and without considering possible disruption to other loads, adjust to changes in wind speed or cloud cover by shifting its standby power generation sources or (when available) simply drawing more power from the grid.
Microgrids thus provide two important energy security advantages from a military perspective. First, by providing a flexible set of sockets and the intelligent control of distribution systems into which multiple energy generation sources and storage devices can plug, microgrids simplify the base power management task. Second, the use of multiple power generating technology increases the resilience of a base – when power is unavailable (no wind, the convoy of fuel trucks is late, etc.) another power source can fill the gap and preserve continuity of service. The extra costs associated with creating a microgrid able to utilize multiple power generating and storage systems pales into insignificance when compared to the costs of mission failure. Alternative generating technologies provide faster and more visible savings when the financial evaluation is taking place in a context in which the fully burdened costs of fuel are brought to the forefront of decision making.
Microgrids on military installations constitute a capability that will both enhance DoD’s ability to respond to crises in the security dimension and, through interconnection with local community load capacity, increasing the overall resilience of the nation power grid. This increased resilience is not only useful in itself, but also contributes to DoD’s ability to deter adversaries.

E-6
Extremely resilient power systems, consisting of combinations of large scale power generation, distributed generation and storage, and microgrids mutually supporting one another through a regional power transmission grid will affect the decision making calculus of potential threats in two ways. One, the challenges associated with creating disruption will increase due to the need to not simply degrade the main power grid, but degrade multiple well protected energy network nodes. Two, the negative effects resulting from a successful attack on a single node in the power generation or supply network will decrease. As a result, the costs of developing such system degrading capabilities increase while the negative effects decrease, (the disruption cost curve moves up to the left while the resilience cost curve moves down) making such attacks less worth the investment by threat resources. Military microgrids connected to civil emergency service provider facilities can thus directly help the nation meet its most fundamental obligation – preserving citizen’s security.
Creation of military base microgrids, tied into local emergency management systems, can serve as pilot projects to demonstrate not only the technologies but the return on investment various technological systems make, or fail to make, possible. Deploying microgrids to meet the high demands of military and emergency services customers who can justify the cost in terms of increasing security system resilience provides an opportunity to evaluate the costs and benefits to inform broader public decision making about microgrids as a component of the wider development of smart grid technology by providing insight into the cost effectiveness of microgrids. This will speak not only to the issues of microgrid use, but of the utility of larger investments in the infrastructure necessary to benefit more comprehensively from smart grid technology deployment.
Developing the microgrid capability on military bases does not require a huge expenditure of additional resources. Instead, it only requires an enhancement of existing base energy infrastructure plans and programs so that the system can operate as a microgrid. For example, changes to the base power distribution system to incorporate a renewable production capability (a solar array or combined heat and power system running in conjunction with a computer server farm) could at little additional cost be expanded to create the interfaces necessary to establish a microgrid. These would include the interconnections such that when the local community/city, in the future, renovates its own power grid emergency service connections can easily be made. Linking this sort of planning with initiatives like Secure Automated Microgrid Energy Systems (SAMES) has the potential to expose even more opportunities for mutually beneficial energy related interaction to increase energy security.

F-7
APPENDIX F DESCRIPTION OF DATA
http://www.walkerindustrial.com/Eaton-Cutler-Hammer-400TPCSR631M-786685376011-p/400tpcsr631m.htm?gsn&gclid=CjwKEAjwqJ67BRCzzJ7Hy-LYlFYSJABwp9PG53kP8xmywlFLDHL6IQRH0_7jL8gH1IFSs1xtIQDG8RoCtsXw_wcB
- This link was used for Scenario 4 - KVAR capacitor to change power factor to that of 0.9
http://www.eaton.com/ecm/groups/public/@pub/@electrical/documents/content/sa02607001e.pdf
- This link was used to in Scenario 4 to determine the effect that power factor had on energy consumption.
- Also used for equation to correct power factor and to find what level KVAR capacitor would be needed for said correction.
- Also used to determine what new energy consumption would have been with corrected power factor.
http://regarchive.sdge.com/tm2/pdf/ELEC_ELEC-SCHEDS_A.pdf
- This was used to determine the market rate for energy consumption by SDG&E. - Value of $0.12 per kWh was used.
http://www.cbs8.com/story/26550810/sudden-storm-rips-through-san-diego
- Used in Scenario 6 to determine the effects, if any, that hurricane Odile had on the San Diego area.
http://power.larc.nasa.gov/cgi-bin/timeseries.cgi?&ye=2015&lat=32.7153300&submit=Submit&me=12&[email protected]&step=1&p=swv_dwn&p=T2M&p=WS10M&p=RAIN&de=31&ms=1&ys=2014&plot=swv_dwn&lon=-117.1572600&ds=1
- This was used for the weather data set. - “Near Real-Time” daily values. - Variables were: solar radiation, temperature, rain, wind.
http://myelectrical.com/notes/entryid/225/photovoltaic-pv-electrical-calculations
- Used to determine the daily energy output by a solar panel with respect to the solar radiation variable from the weather data set.
- E = r * P * f r = solar radiation; P = power rating of solar panel; f = efficiency of solar panel


