estcp cost and performance report · estcp cost and performance report ... figure 16. pensacola ssp...
TRANSCRIPT
ESTCPCost and Performance Report
EnvironmEntal SEcuritytEchnology cErtification Program
u.S. Department of Defense
(WP-200528)
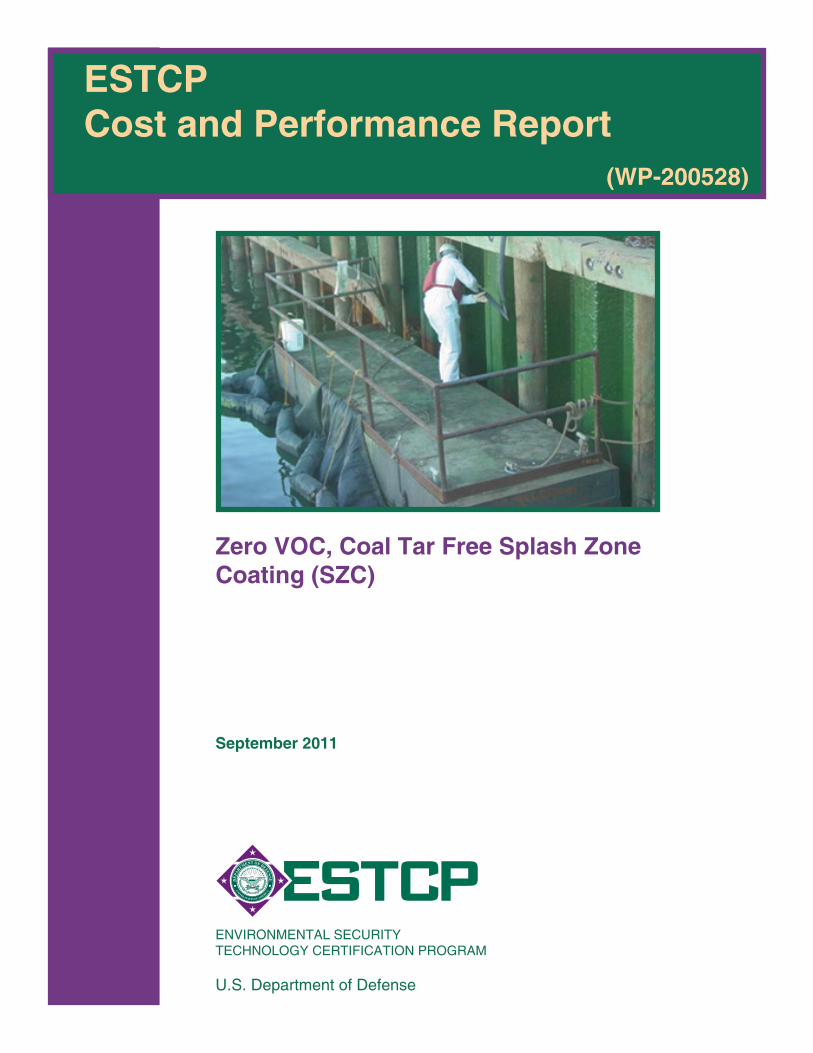
Zero VOC, Coal Tar Free Splash Zone Coating (SZC)
September 2011
i
COST & PERFORMANCE REPORT Project: WP-200528
TABLE OF CONTENTS
Page
1.0 EXECUTIVE SUMMARY ................................................................................................ 1 1.1 OBJECTIVES OF THE DEMONSTRATION ....................................................... 1 1.2 TECHNOLOGY DESCRIPTION .......................................................................... 1 1.3 DEMONSTRATION RESULTS ............................................................................ 2 1.4 IMPLEMENTATION ISSUES .............................................................................. 2
2.0 INTRODUCTION .............................................................................................................. 3 2.1 BACKGROUND .................................................................................................... 3 2.2 OBJECTIVES OF DEMONSTRATION ............................................................... 4 2.3 REGULATORY DRIVERS ................................................................................... 4
3.0 DEMONSTRATION TECHNOLOGY .............................................................................. 7 3.1 TECHNOLOGY DESCRIPTION .......................................................................... 7 3.2 ADVANTAGES AND LIMITATIONS OF THE TECHNOLOGY...................... 9
4.0 PERFORMANCE OBJECTIVES .................................................................................... 11
5.0 SITE/PLATFORM DESCRIPTION ................................................................................. 13 5.1 TEST PLATFORMS/FACILITIES ...................................................................... 13 5.2 PRESENT OPERATIONS ................................................................................... 15 5.3 SITE-RELATED PERMITS AND REGULATIONS .......................................... 15
6.0 TEST DESIGN ................................................................................................................. 17 6.1 LABORATORY TESTING.................................................................................. 17 6.2 FIELD TESTING.................................................................................................. 18
7.0 PERFORMANCE ASSESSMENT .................................................................................. 21 7.1 LABORATORY TESTING.................................................................................. 21 7.2 FIELD TESTING.................................................................................................. 24
8.0 COST ASSESSMENT ...................................................................................................... 27 8.1 COST MODEL ..................................................................................................... 27 8.2 COST ANALYSIS AND COMPARISON ........................................................... 29
9.0 IMPLEMENTATION ISSUES ........................................................................................ 31 9.1 ENVIRONMENTAL CHECKLIST ..................................................................... 31 9.2 OTHER REGULATORAY ISSUES .................................................................... 31 9.3 END-USERS/ORIGINAL EQUIPMENT MANUFACTURERS (OEM)
ISSUES ................................................................................................................. 31
TABLE OF CONTENTS (continued)
Page
ii
10.0 REFERENCES ................................................................................................................. 33 APPENDIX A POINTS OF CONTACT......................................................................... A-1
iii
LIST OF FIGURES
Page Figure 1. Disulfide linkages. .................................................................................................. 7 Figure 2. Co-reaction of polysulfides with epoxy resins........................................................ 8 Figure 3. Demonstration site at NAS Pensacola before coating application........................ 13 Figure 4. Demonstration site at NAVSTA San Diego before coating application............... 13 Figure 5. Pensacola, FL site. ................................................................................................ 14 Figure 6. Bulkhead 303 Pensacola. ...................................................................................... 14 Figure 7. San Diego, CA site. ............................................................................................... 14 Figure 8. Quay wall between Piers 1 and 2, San Diego. ...................................................... 14 Figure 9. Typical corrosion on Pensacola steel sheep pile before surface preparation. ....... 22 Figure 10. Pensacola steel sheet pile surface preparation. ..................................................... 22 Figure 11. Typical corrosion on San Diego steel sheet pile before surface preparation. ....... 22 Figure 12. San Diego steel sheet pile surface preparation. .................................................... 22 Figure 13. Typical test patch – Premier coating system on Pensacola steel sheet pile. ......... 23 Figure 14. Typical test patch – PolySpec coating on San Diego steel sheet pile. .................. 23 Figure 15. Typical appearance of Pensacola SSP just after surface preparation. .................. 23 Figure 16. Pensacola SSP after flash rusting and before coating application. ....................... 23 Figure 17. Typical appearance of San Diego SSP just after surface preparation. .................. 24 Figure 18. San Diego SSP after flash rusting and before coating applications. ..................... 24 Figure 19. Coating application on Pensacola SSP. ................................................................ 24 Figure 20. Coating application on San Diego SSP. ................................................................ 24
iv
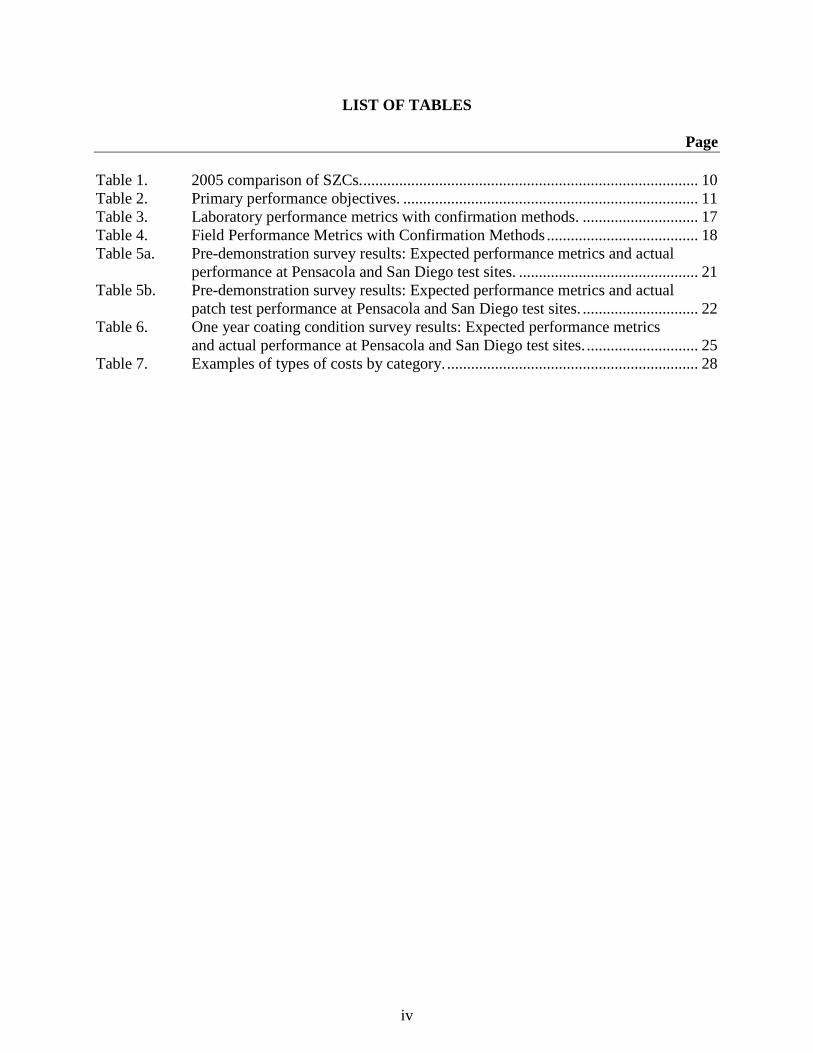
LIST OF TABLES
Page Table 1. 2005 comparison of SZCs. .................................................................................... 10 Table 2. Primary performance objectives. .......................................................................... 11 Table 3. Laboratory performance metrics with confirmation methods. ............................. 17 Table 4. Field Performance Metrics with Confirmation Methods ...................................... 18 Table 5a. Pre-demonstration survey results: Expected performance metrics and actual
performance at Pensacola and San Diego test sites. ............................................. 21 Table 5b. Pre-demonstration survey results: Expected performance metrics and actual
patch test performance at Pensacola and San Diego test sites. ............................. 22 Table 6. One year coating condition survey results: Expected performance metrics
and actual performance at Pensacola and San Diego test sites. ............................ 25 Table 7. Examples of types of costs by category. ............................................................... 28
v
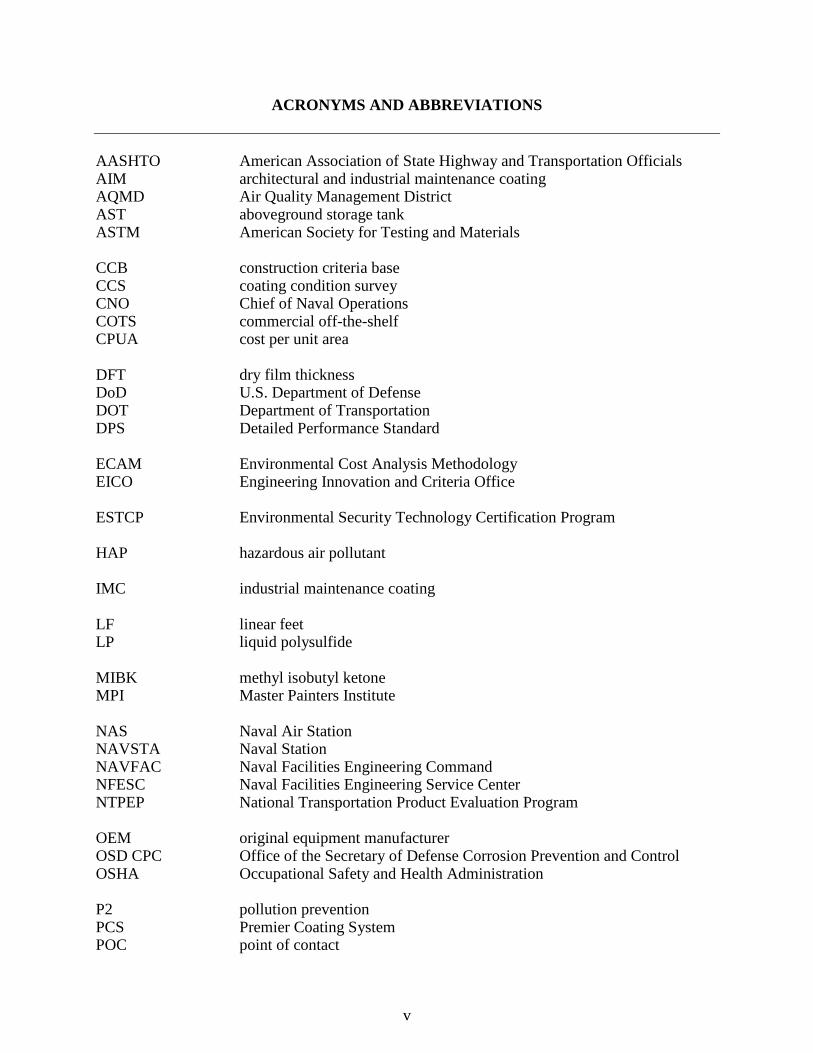
ACRONYMS AND ABBREVIATIONS AASHTO American Association of State Highway and Transportation Officials AIM architectural and industrial maintenance coating AQMD Air Quality Management District AST aboveground storage tank ASTM American Society for Testing and Materials CCB construction criteria base CCS coating condition survey CNO Chief of Naval Operations COTS commercial off-the-shelf CPUA cost per unit area DFT dry film thickness DoD U.S. Department of Defense DOT Department of Transportation DPS Detailed Performance Standard ECAM Environmental Cost Analysis Methodology EICO Engineering Innovation and Criteria Office ESTCP Environmental Security Technology Certification Program HAP hazardous air pollutant IMC industrial maintenance coating LF linear feet LP liquid polysulfide MIBK methyl isobutyl ketone MPI Master Painters Institute NAS Naval Air Station NAVSTA Naval Station NAVFAC Naval Facilities Engineering Command NFESC Naval Facilities Engineering Service Center NTPEP National Transportation Product Evaluation Program OEM original equipment manufacturer OSD CPC Office of the Secretary of Defense Corrosion Prevention and Control OSHA Occupational Safety and Health Administration P2 pollution prevention PCS Premier Coating System POC point of contact
ACRONYMS AND ABBREVIATIONS (continued)
vi
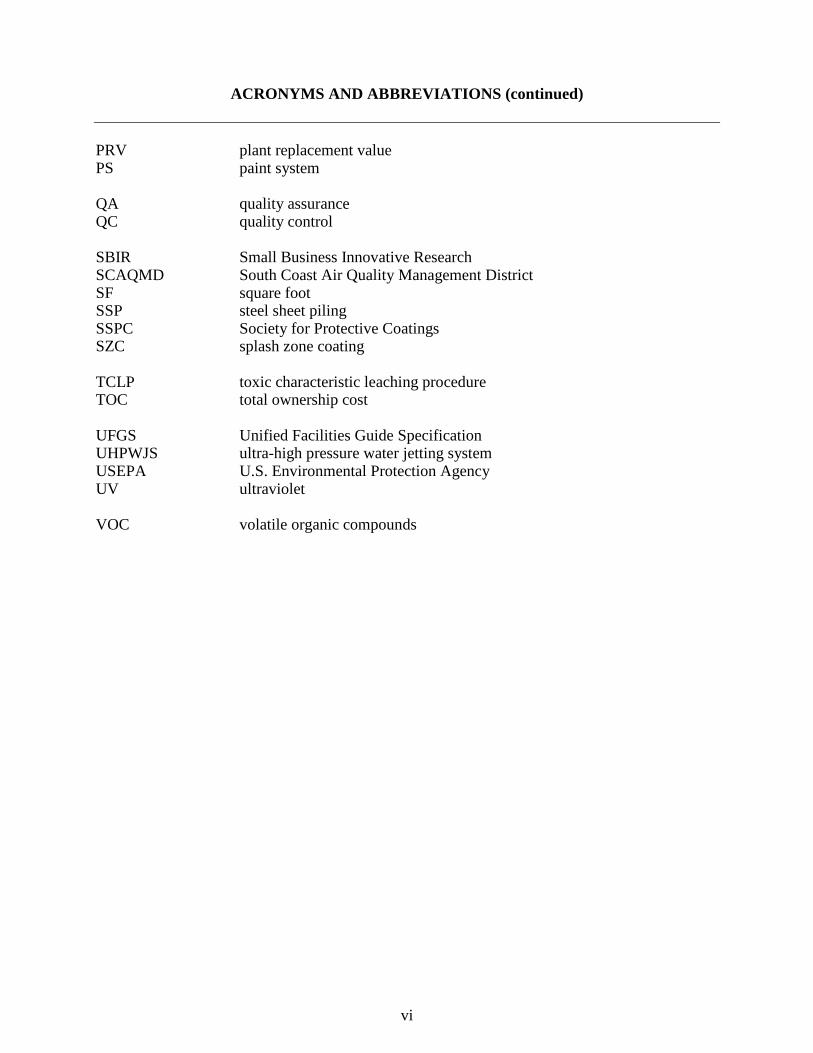
PRV plant replacement value PS paint system QA quality assurance QC quality control SBIR Small Business Innovative Research SCAQMD South Coast Air Quality Management District SF square foot SSP steel sheet piling SSPC Society for Protective Coatings SZC splash zone coating TCLP toxic characteristic leaching procedure TOC total ownership cost UFGS Unified Facilities Guide Specification UHPWJS ultra-high pressure water jetting system USEPA U.S. Environmental Protection Agency UV ultraviolet VOC volatile organic compounds
Technical material contained in this report has been approved for public release. Mention of trade names or commercial products in this report is for informational purposes only;
no endorsement or recommendation is implied.
vii
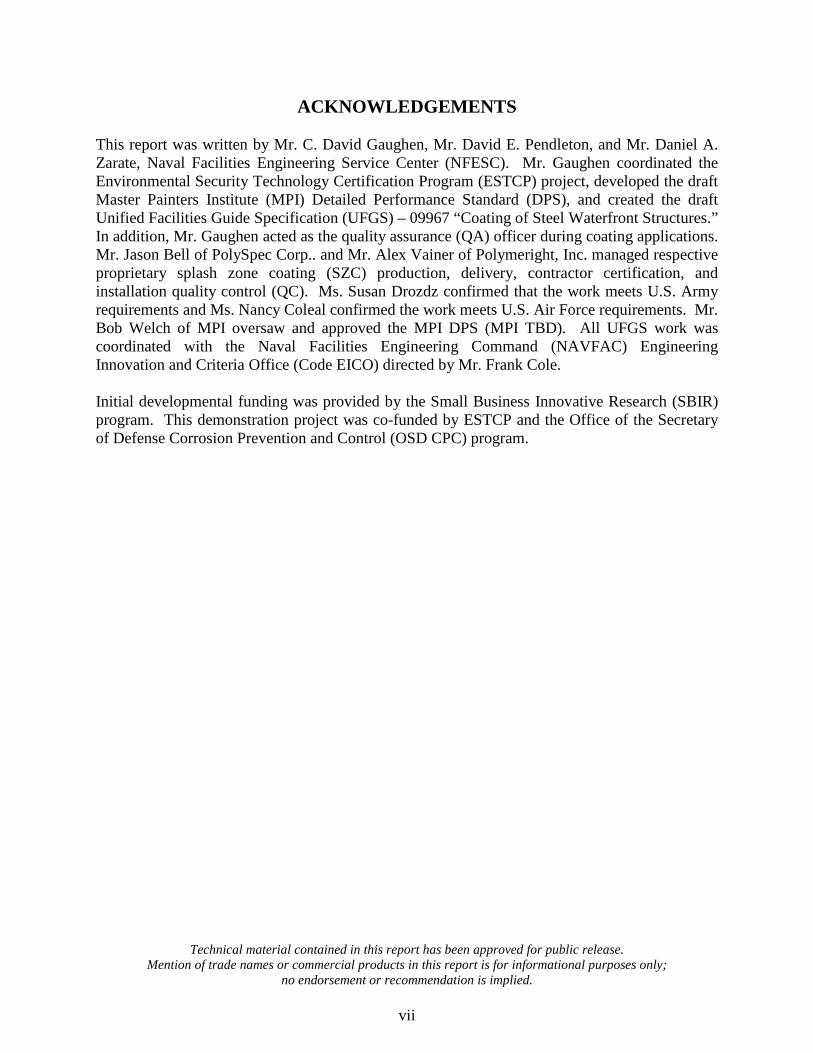
ACKNOWLEDGEMENTS This report was written by Mr. C. David Gaughen, Mr. David E. Pendleton, and Mr. Daniel A. Zarate, Naval Facilities Engineering Service Center (NFESC). Mr. Gaughen coordinated the Environmental Security Technology Certification Program (ESTCP) project, developed the draft Master Painters Institute (MPI) Detailed Performance Standard (DPS), and created the draft Unified Facilities Guide Specification (UFGS) – 09967 “Coating of Steel Waterfront Structures.” In addition, Mr. Gaughen acted as the quality assurance (QA) officer during coating applications. Mr. Jason Bell of PolySpec Corp.. and Mr. Alex Vainer of Polymeright, Inc. managed respective proprietary splash zone coating (SZC) production, delivery, contractor certification, and installation quality control (QC). Ms. Susan Drozdz confirmed that the work meets U.S. Army requirements and Ms. Nancy Coleal confirmed the work meets U.S. Air Force requirements. Mr. Bob Welch of MPI oversaw and approved the MPI DPS (MPI TBD). All UFGS work was coordinated with the Naval Facilities Engineering Command (NAVFAC) Engineering Innovation and Criteria Office (Code EICO) directed by Mr. Frank Cole. Initial developmental funding was provided by the Small Business Innovative Research (SBIR) program. This demonstration project was co-funded by ESTCP and the Office of the Secretary of Defense Corrosion Prevention and Control (OSD CPC) program.

This page left blank intentionally.
1
1.0 EXECUTIVE SUMMARY
1.1 OBJECTIVES OF THE DEMONSTRATION
The “splash zone” is defined as the area between the year’s lowest tidal mark and up to 10 feet above the year’s highest tidal mark. It is extremely difficult to protect steel structures against corrosion in this zone where corrosion rates have been documented to exceed 30 mm per year on unprotected steel. This is more than six times the corrosion rate typically found on steel under constant water immersion. Specific guidance for coating the Navy’s steel sheet piling employs two coating system options for the initial painting of steel placed in seawater immersion/splash zones: 1) three coats of epoxy-polyamide or 2) two coats of coal tar pitch epoxy-polyamide. In theory, the three-coat epoxy system should provide better in-place service than the two-coat coal tar epoxy system. In practice, the coal tar system is used almost exclusively due to the lower material cost. The coal tar system provides approximately five years of splash zone service before maintenance is required which can include complete removal and reapplication. However, maintenance is rarely done due to the high cost and environmental issues that need to be addressed. The environmental issues associated with the two coating system options include high volatile organic compounds (VOC) content, hazardous air pollutants (HAP), and may also include hazardous pigment content. The coal tar epoxy also contains coal tar pitch which is regulated by the Occupational Safety and Health Administration (OSHA) due to known human carcinogen content. The product developed under this effort is 100% solids and therefore has no VOC content, has no coal tar pitch, and exceeds the field performance of the two current coating system options.
1.2 TECHNOLOGY DESCRIPTION
The first liquid polysulfide polymer became commercially available in 1943. Today, there are several liquid polysulfide polymers, each with distinctly different properties but similar in chemical structure. The liquid polysulfides have the advantage of being room-temperature vulcanized, meaning they can be cured at ambient temperatures after the addition of an oxygen-donating curing agent. Epoxy resins date back to about 1949. Their many excellent properties include rapid curing at normal temperatures, good adhesion to most surfaces, toughness, and chemical resistance. Today, versatile epoxy resin compounds and systems are customized to meet the different physical properties required by various markets. None of the commercially tested coatings met the desired Navy performance requirements. The two most significant limitations were the inability of the commercial coatings to adequately bond to clean, semi-damp steel and insufficient curing under immersion. To make a flexible epoxy that could potentially meet the requirements of the splash zone coatings (SZC), a liquid polysulfide polymer was used. The polysulfide addition improves certain physical properties without adversely affecting the existing performance capabilities of the epoxy resin.
2
1.3 DEMONSTRATION RESULTS
Naval Facilities Engineering Command’s (NAVFAC) Small Business Innovative Research (SBIR) program solicited the topic entitled “Polysulfide Modified Epoxy Novolac Cladding for Steel Immersion/Splash Zone Service.” Naval Facilities Engineering Service Center (NFESC) subsequently awarded Phase I and Phase II work to PolySpec Corporation and Polymeright, Incorporated. Phase I results were promising whereas preliminary Phase II results were exceptional. The tests included small-scale application trials under actual field conditions. Early SBIR-funded studies of the SBIR-developed polysulfide modified novolac epoxy formulation (renamed Zero VOC, Coal Tar Free Splash Zone Coating) indicated that the SZC will provide at least twice the performance compared to the currently specified coating systems. This demonstration provides a full-scale validation of the SZC for use as an in-service waterfront maintenance system and enables the transition of this coal tar free coating directly into the hands of Department of Defense (DoD) end-users who require waterfront metal (e.g., sea walls, sheet pile) maintenance painting.
1.4 IMPLEMENTATION ISSUES
This project addresses Air Force, Army, and Navy performance and environmental requirements for sustainability and reduction of VOC and HAP emissions in the use of such SZCs. Federal, state, and local environmental agencies such as the Environmental Protection Agency (EPA) and Air Quality Management Districts (AQMD) across the country classify many VOCs as hazardous and restrict their emissions through regulations such as the Clean Air Act and local EPA and AQMD rules. Chief of Naval Operations (CNO) directives require significant reductions in the amount of hazardous waste generated by the Navy. This technology will satisfy all of these requirements due to the SZC being free of toxic metals, hazardous air pollutants, coal tar pitch, and VOCs.
3
2.0 INTRODUCTION
2.1 BACKGROUND
The “splash zone” is defined as the area between the year’s lowest tidal mark and up to 10 feet above the year’s highest tidal mark. It is extremely difficult to protect steel structures against corrosion in this zone where corrosion rates have been documented to exceed 30 mm per year on unprotected steel. This is more than six times the corrosion rate typically found for steel placed in water below the intertidal zone. The Navy owns about 650,000 linear feet (LF) of waterfront bulkheads, quay walls, and seawalls with a plant replacement value (PRV) of about $1.24 billion. About 30% of these waterfront structures are composed of steel sheet piling (SSP). The annual cost for maintaining these SSP structures is approximately $20 million. Unified Facilities Guide Specification (UFGS) – 09967 “Coating of Steel Waterfront Structures” is used to specify coating of the Navy’s steel sheet piling. It employs two coating system options for use in the initial painting of steel placed in sea water immersion/splash zones:
• Three coats epoxy-polyamide (Society for Protective Coatings [SSPC] Paint System [PS] 13.01), or
• Two coats coal tar pitch epoxy-polyamide (SSPC PS 11.01). In theory, the three-coat epoxy system should provide better in place service than the two-coat coal tar epoxy system. Historically and in practice, the coal tar system is almost exclusively used due to the lower material cost. Nonetheless, the coal tar system provides approximately five years of splash zone service before complete removal and reapplication would be required to prevent the more aggressive corrosion of the exposed substrate. Despite the need for recoating or planned maintenance, it is rarely done due to the high cost and environmental issues that need to be addressed. Each coat of coating system SSPC PS 13.01 contains 300 g/L of VOCs, HAPs of methyl isobutyl ketone (MIBK) and xylene, and the pigment chromium oxide. Each coat of SSPC PS 11.01 contains 30% by weight coal tar pitch (regulated by OSHA: known human carcinogen, National Toxicology Program), 192 g/L of VOCs, and xylene (HAP). In effect since August 2002, California’s South Coast Air Quality Management District (SCAQMD), Rule 1113 “Architectural Coatings,” requires all industrial maintenance coatings (IMC), including SZCs, to contain no more than 100 g/L of VOCs effective August 2006.1,2 The initial shop application of UFGS 09 97 13.26 to a typical 1000 ft long, 20 ft high (20,000 square foot [SF]) sheet pile bulkhead releases 597 lb of VOCs, contains 847 lb of coal tar pitch, and is not suitable for in-service maintenance painting. In 2001, NFESC assessed commercially available coatings for use in splash zone maintenance, including shop application under simulated marine conditions. It was determined that the commercially available coatings did not perform any better than the SZCs being used. As a result, in FY 2002, the NAVFAC SBIR program solicited the topic entitled “Polysulfide Modified Epoxy Novolac Cladding for Steel Immersion/Splash Zone Service.” NFESC
4
subsequently awarded Phase I and Phase II work to PolySpec Corp. and Polymeright, Inc.. Phase I results were promising whereas preliminary Phase II results were exceptional. The tests included small-scale application trials under actual field conditions. These studies indicated that the SBIR-developed formulation, renamed as the Zero VOC, Coal Tar Free Splash Zone Coating, will provide at least twice the performance compared to the currently specified coating systems. The estimated performance is based on comparative laboratory- and small-scale testing.
2.2 OBJECTIVES OF DEMONSTRATION
This demonstration provides a full-scale validation of the SZC for use as an in-service waterfront maintenance system and enables the transition of this coal tar free coating directly into the hands of DoD end-users who require waterfront metal (e.g., sea walls, sheet pile) maintenance painting. Demonstration results are in the process of transitioning into commercial guidance such as a new Master Painters Institute (MPI) Detailed Performance Standard (DPS) for the SZC. Results will be amending the coating systems employed by UFGS-09967 “Coating of Steel Waterfront Structures.” The DPS and the amended UFGS will be web-displayed at http://www.paintinfo.com and http://www.wbdg.org/ccb/browse_org.php?o=70 respectively, for direct use by Tri-service activities with splash zone steel in need of either new or maintenance painting. In addition, results will be posted at the Joint Service Pollution Prevention (P2) Library and presented at the Tri-service Environmental Centers’ Coordinating Committee meeting, if applicable. Intended technology users are the Navy, Army, Air Force, Marines, Bureau of Reclamation, and private industry.
2.3 REGULATORY DRIVERS
The project addresses the following requirements:
• Army Task N.312/N.000-08: Sustainable Painting Operations for the Total Army
• Air Force Need 200-204: Reduce VOC Emissions from Paint Application Systems
• Air Force Need 200-240: Methods to Reduce VOC Emissions/Hazardous Waste from Paint
• Navy 2.1.01.g: Control/Reduce Emissions from Coating, Stripping and Cleaning Operations
• Navy 2.1.01.q: Control of VOC and HAP Emissions
• Navy 3.1.04.a: Shipboard Paint and Coating Systems
• Navy 3.1.04.e: Minimize Paint Application Wastes Federal, state, and local environmental agencies such as the USEPA and California AQMD classify many VOCs as hazardous and restrict their emissions through regulations such as the Clean Air Act and local USEPA and AQMD rules. CNO directives require significant reductions in the amount of hazardous waste generated by the Navy. This technology will satisfy
5
all of these requirements because the SZC is toxic metal free, is hazardous air pollutant free, contains no coal tar pitch, and is formulated without VOC.

This page left blank intentionally.
7
3.0 DEMONSTRATION TECHNOLOGY
3.1 TECHNOLOGY DESCRIPTION
The first liquid polysulfide polymer became commercially available in 1943, 13 years after the Thiokol Corporation developed and marketed a millable gum polysulfide known as the first synthetic rubber commercially made in the United States. Today, there are several liquid polysulfide polymers, each with distinctly different properties, but similar in chemical structure. To a large extent, products made from liquid polysulfide polymers have the same excellent overall solvent resistance properties as the millable gum polysulfides. However, the liquid polysulfides have the advantage of being room-temperature vulcanized, meaning they can be cured at ambient temperatures after the addition of an oxygen-donating curing agent (Figure 1).
Figure 1. Disulfide linkages. (Thiol Terminal Groups: -SH) Liquid polysulfide polymers are classified as high-quality, application-proven products that can be compounded as sealants, adhesives, coatings, potting compounds, and flexible molding compositions. They are also used for impregnating leather and other porous materials. Compounds based on these polymers are used in industrial and building construction, insulation, glass, aerospace, electronics, aviation, marine, and many other industries. The manufacturing process for liquid polysulfide polymers follows the general method of chemical preparation whereby an organic dihalide is reacted with sodium polysulfide at elevated temperatures. A controlled amount of a trifunctional organic halide, which serves to introduce cross-linking sites, is co-reacted in the process. These cross-linking sites permit a range of elongation and modulus properties of the cured polymer. Epoxy resins date back to about 1949. Their many excellent properties include rapid curing at normal temperatures, good adhesion to most surfaces, toughness, and chemical resistance to almost all dilute acids, alkalis, and solvents. Early uses included heavy-duty industrial paints and structural adhesives in the aircraft industry. Today, epoxy resin compounds are widely used in construction, marine, electrical, and industrial markets. However, in order to meet the different physical properties required for these various markets, certain characteristics of the early epoxy systems have been changed. To make an epoxy flexible, the addition of a liquid polysulfide polymer can be used. The polysulfide addition does improve certain physical properties without adversely affecting the existing performance capabilities of the epoxy resin. Versatile systems are possible by co-reacting polysulfides with epoxy resins (Figure 2). Liquid polysulfides (LP) function well as epoxy curatives because of the extreme reactivity of the mercaptide ion created in the presence of an epoxy resin and tertiary amine. The mercaptide ion
HS(C2H4OCH2OC2H4SH)6C2 H4OCH20C2H4SH
8
is formed when the mercaptan donates its hydrogen. The mercaptan ion adds to the epoxide group and displaces the tertiary amine to form a covalent sulfur-carbon bond. The tertiary amine is regenerated and is then available to react with another oxirane group. These systems exhibit the toughness and adhesion of epoxy and show the improved impact and general chemical resistance of polysulfide.
Figure 2. Co-reaction of polysulfides with epoxy resins. Three different epoxy resins can be used with polysulfides: 1) bisphenol A, 2) bisphenol F, and 3) novolac. Each epoxy resin has its own special attributes as follows: Bisphenol A – low cost, low viscosity, high epoxide content liquid resin ideal for coatings, adhesives, casting, potting, encapsulation, and wet lay-up applications. Bisphenol F – more expensive, lower viscosity than A, and improved chemical resistance. It is more resistant to inorganic acids than bisphenol A. Novolac – a high viscosity semisolid to solid resin with multiple functional groups, with increased cross-link density, better physical properties at elevated temperatures, and improved solvent and chemical resistance compared to bisphenol A and F. Polysulfide polymers, with a glass transition temperature of about -65º F, remain flexible even at very low temperatures and when subjected to the stresses caused by thermal shock, including impact, will remain pliant rather than crack or disbond. Through the incorporation of epoxy into the polysulfide backbone, the glass transition temperature does rise but remains flexible even at temperatures below -20º F. Application equipment has advanced significantly in recent years. Polysulfide materials can now be applied without any solvent dilution. Using heated lines, the material is uniformly atomized, giving a smooth coating with good aesthetics. The coating system can now be applied at up to 100 mm in a single pass. Furthermore, the formulated material allows the coating system to be edge retentive, thus overcoming a long-standing challenge for structural steel and other applications.
O O / \ / \
-R-CH-CH2 + HS-R’-SH + H2C-CH-R
OH OH | |
-R-CH-CH2-S-R’-S-CH2-CH-R
9
According to OSHA’s Hazard Communication Standard, LP products are classified as non-hazardous. They are neither eye nor skin irritants, do not cause allergic skin reactions, and are not toxic when administered orally, making LP a safe alternative to amines in curing epoxy systems.
3.2 ADVANTAGES AND LIMITATIONS OF THE TECHNOLOGY
Compared to other commercially available SZCs, the main advantages of the SBIR-developed SZC are:
• Compliant with current/future VOC requirements for USEPA, state, district and regional counties.
• Elimination of environmental fines associated with VOC, HAP, and other regulations.
• Reduced coating removal collection/treatment/disposal costs.
• Reduced facility Total Ownership Cost (TOC).
• Rapid splash zone steel coating maintenance.
• Enhanced waterfront steel corrosion control.
• Flexible, corrosion resistant coating with ability to flex with sea wall movement.
• Maximum adhesion to water blasted steel.
• Impact and abrasion resistant.
• Resistant to cathodic disbondment.
• Ability to cure underwater.
• Edge retentive.
• Free of coal tar pitch. The main limitations of the SBIR-developed SZC are:
• Requires semi-specialized but commercial off-the-shelf (COTS) surface preparation/application equipment.
• Requires semi-specialized contractor skill. Table 1 provides a comparison of the commercially available SZCs previously tested to the SBIR-developed SZCs and to a recently developed commercial product, Premier Coating Systems (PCS) #1200TA, a 100% solids, glass flake filled epoxy.3, 4, 5, 6, 7, 8 This PCS coating, selected as the commercial baseline control coating for this demonstration project, represents a second generation high performance marine coating that contains no HAPs, contains no other hazardous chemicals, develops very good adhesion to marginally prepared surfaces (surface tolerant), and complies with future SCAQMD VOC regulations. This new, glass flake filled
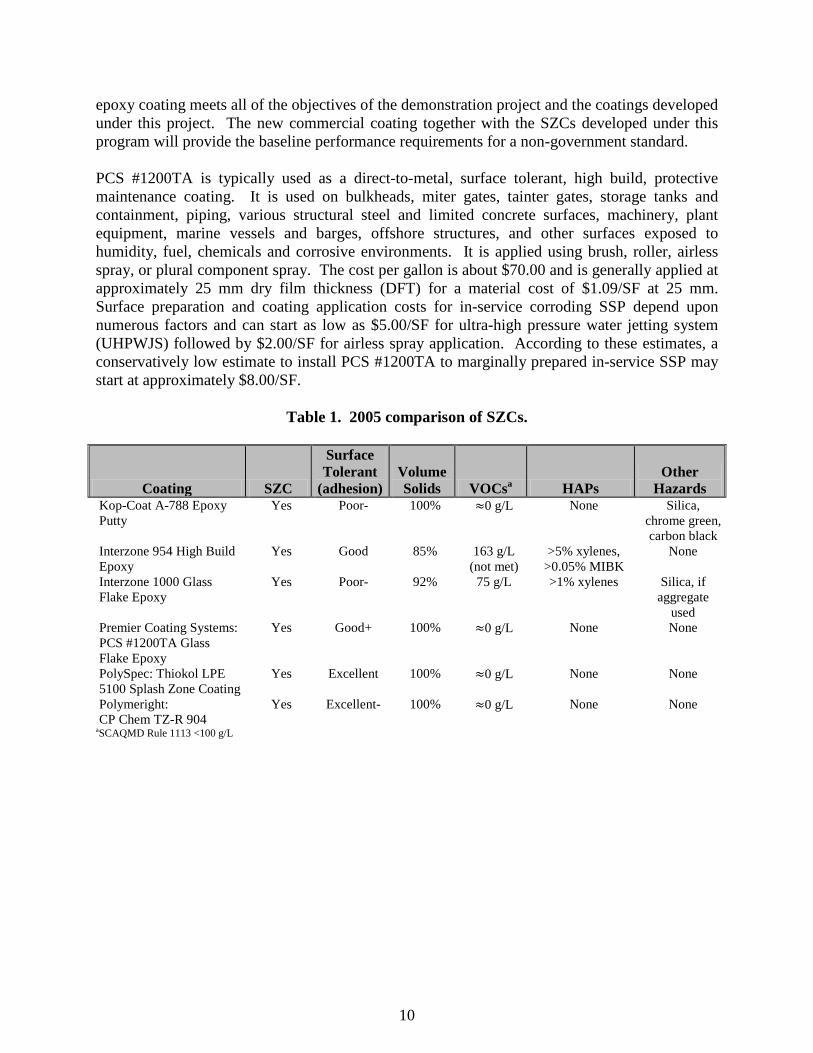
10
epoxy coating meets all of the objectives of the demonstration project and the coatings developed under this project. The new commercial coating together with the SZCs developed under this program will provide the baseline performance requirements for a non-government standard. PCS #1200TA is typically used as a direct-to-metal, surface tolerant, high build, protective maintenance coating. It is used on bulkheads, miter gates, tainter gates, storage tanks and containment, piping, various structural steel and limited concrete surfaces, machinery, plant equipment, marine vessels and barges, offshore structures, and other surfaces exposed to humidity, fuel, chemicals and corrosive environments. It is applied using brush, roller, airless spray, or plural component spray. The cost per gallon is about $70.00 and is generally applied at approximately 25 mm dry film thickness (DFT) for a material cost of $1.09/SF at 25 mm. Surface preparation and coating application costs for in-service corroding SSP depend upon numerous factors and can start as low as $5.00/SF for ultra-high pressure water jetting system (UHPWJS) followed by $2.00/SF for airless spray application. According to these estimates, a conservatively low estimate to install PCS #1200TA to marginally prepared in-service SSP may start at approximately $8.00/SF.
Table 1. 2005 comparison of SZCs.
Coating SZC
Surface Tolerant
(adhesion) Volume Solids VOCsa HAPs
Other Hazards
Kop-Coat A-788 Epoxy Putty
Yes Poor- 100% ≈0 g/L None Silica, chrome green, carbon black
Interzone 954 High Build Epoxy
Yes Good 85% 163 g/L (not met)
>5% xylenes, >0.05% MIBK
None
Interzone 1000 Glass Flake Epoxy
Yes Poor- 92% 75 g/L >1% xylenes Silica, if aggregate
used Premier Coating Systems: PCS #1200TA Glass Flake Epoxy
Yes Good+ 100% ≈0 g/L None None
PolySpec: Thiokol LPE 5100 Splash Zone Coating
Yes Excellent 100% ≈0 g/L None None
Polymeright: CP Chem TZ-R 904
Yes Excellent- 100% ≈0 g/L None None
aSCAQMD Rule 1113 <100 g/L
11
4.0 PERFORMANCE OBJECTIVES
Table 2 summarizes performance objectives for the SZC in terms of primary performance criteria and expected performance metrics. Performance objectives are further defined in section 5, tTable 4 and include performance criteria, expected performance metric, and confirmation methods.
Table 2. Primary performance objectives. Performance
Objective Data Requirements Success Criteria Results Quantitative Pre-demonstration condition survey for
substrate condition and SZC patch employing performance metrics for corrosion, peeling, blistering, tape adhesion, pull-off adhesion, film thickness, and SZC patch test adhesion.
Meet minimum pre-demonstration condition survey performance criteria as defined in table 4.
Met the requirements
Quantitative Enhanced corrosion protection using performance metrics documenting one-year and four years field performance for corrosion, peeling, blistering, tape adhesion, pull-off adhesion, film thickness, cracking/checking, chalking, biological growth, and dirt pick-up.
Anticipated 50% increase in service life based upon meeting individual field performance criteria as defined in table 4.
Preliminary results support minimum 50% increase in service life to more than double

This page left blank intentionally.
13
5.0 SITE/PLATFORM DESCRIPTION
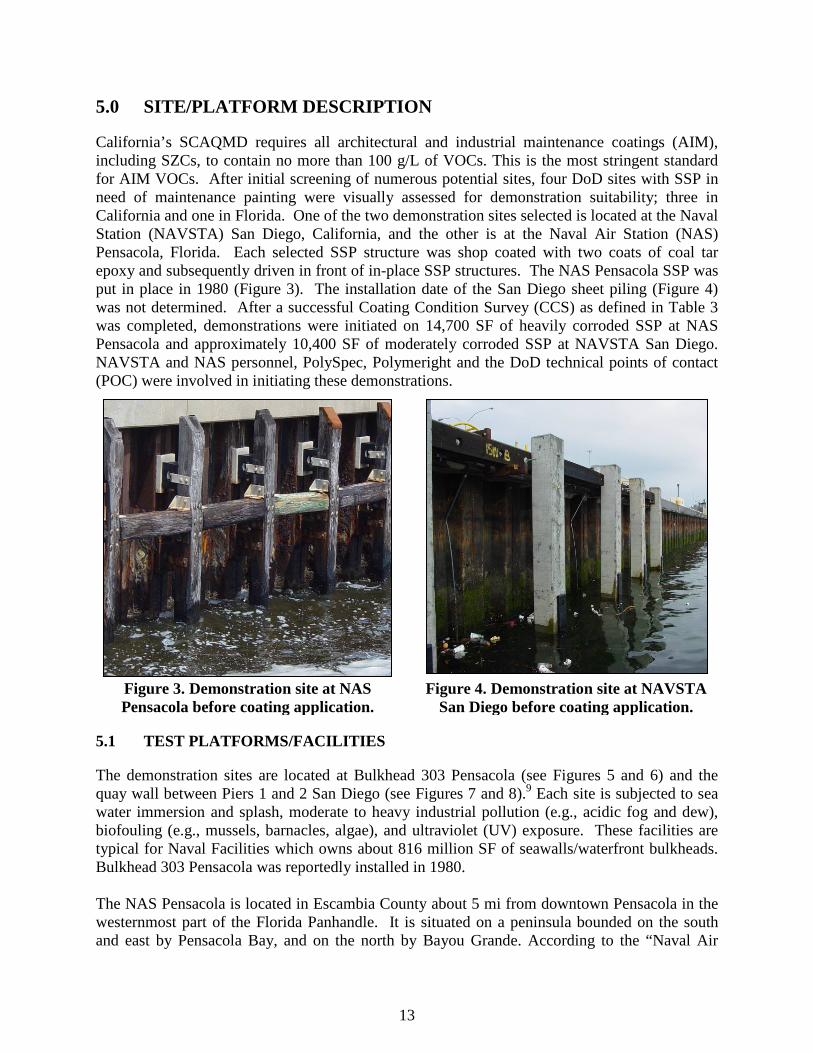
California’s SCAQMD requires all architectural and industrial maintenance coatings (AIM), including SZCs, to contain no more than 100 g/L of VOCs. This is the most stringent standard for AIM VOCs. After initial screening of numerous potential sites, four DoD sites with SSP in need of maintenance painting were visually assessed for demonstration suitability; three in California and one in Florida. One of the two demonstration sites selected is located at the Naval Station (NAVSTA) San Diego, California, and the other is at the Naval Air Station (NAS) Pensacola, Florida. Each selected SSP structure was shop coated with two coats of coal tar epoxy and subsequently driven in front of in-place SSP structures. The NAS Pensacola SSP was put in place in 1980 (Figure 3). The installation date of the San Diego sheet piling (Figure 4) was not determined. After a successful Coating Condition Survey (CCS) as defined in Table 3 was completed, demonstrations were initiated on 14,700 SF of heavily corroded SSP at NAS Pensacola and approximately 10,400 SF of moderately corroded SSP at NAVSTA San Diego. NAVSTA and NAS personnel, PolySpec, Polymeright and the DoD technical points of contact (POC) were involved in initiating these demonstrations.
Figure 3. Demonstration site at NAS Pensacola before coating application.
Figure 4. Demonstration site at NAVSTA San Diego before coating application.
5.1 TEST PLATFORMS/FACILITIES
The demonstration sites are located at Bulkhead 303 Pensacola (see Figures 5 and 6) and the quay wall between Piers 1 and 2 San Diego (see Figures 7 and 8).9 Each site is subjected to sea water immersion and splash, moderate to heavy industrial pollution (e.g., acidic fog and dew), biofouling (e.g., mussels, barnacles, algae), and ultraviolet (UV) exposure. These facilities are typical for Naval Facilities which owns about 816 million SF of seawalls/waterfront bulkheads. Bulkhead 303 Pensacola was reportedly installed in 1980. The NAS Pensacola is located in Escambia County about 5 mi from downtown Pensacola in the westernmost part of the Florida Panhandle. It is situated on a peninsula bounded on the south and east by Pensacola Bay, and on the north by Bayou Grande. According to the “Naval Air
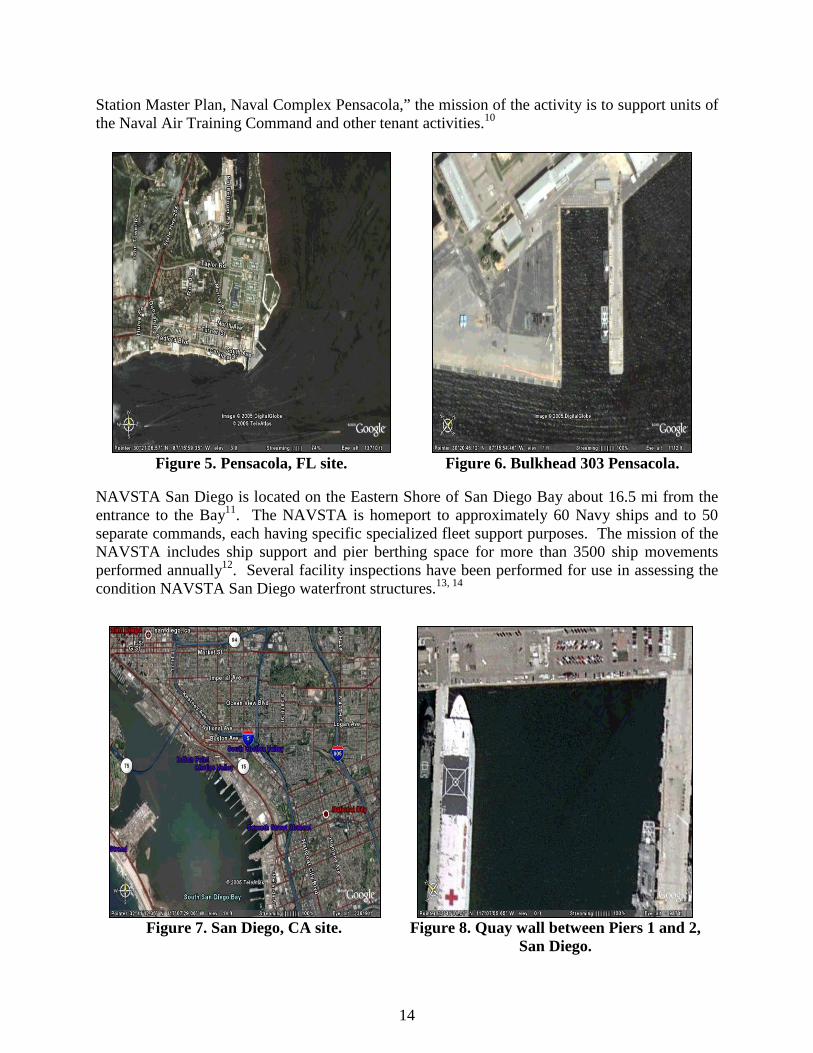
14
Station Master Plan, Naval Complex Pensacola,” the mission of the activity is to support units of the Naval Air Training Command and other tenant activities.10
NAVSTA San Diego is located on the Eastern Shore of San Diego Bay about 16.5 mi from the entrance to the Bay11. The NAVSTA is homeport to approximately 60 Navy ships and to 50 separate commands, each having specific specialized fleet support purposes. The mission of the NAVSTA includes ship support and pier berthing space for more than 3500 ship movements performed annually12. Several facility inspections have been performed for use in assessing the condition NAVSTA San Diego waterfront structures.13, 14
Figure 5. Pensacola, FL site. Figure 6. Bulkhead 303 Pensacola.
Figure 7. San Diego, CA site. Figure 8. Quay wall between Piers 1 and 2,
San Diego.
15
5.2 PRESENT OPERATIONS
SSP, including Bulkhead 303 Pensacola and Quay wall Pier 1/Pier 2 San Diego, initially received one of two coating system options (shop application under controlled conditions) for steel placed in sea water immersion/splash zones as specified in UFGS – 09967 Coating of Steel Waterfront Structures. The coating systems are either three coats epoxy-polyamide or two coats coal tar epoxy-polyamide. Both systems are historically known to provide approximately five years of splash zone service before maintenance is required. Maintenance can be localized surface prep and recoat to complete removal and reapplication. However, historically sheet piles are typically allowed to corrode in place with no coating maintenance employed due to the high cost and environmental concerns that have to be addressed. In addition, neither of these systems is suitable for in-service field maintenance. Therefore, DoD activities typically contact a protective coatings consultant (NAVFAC Paints/Coatings Center of Expertise) for the latest untested state-of-the-art commercial recommendation. It follows that field activities continue to require a coating system capable of in-service field maintenance such as the current SZCs under demonstration.
5.3 SITE-RELATED PERMITS AND REGULATIONS
The industrial painting contractors were required to comply with Federal, state, and local environmental regulations throughout all aspects of the surface preparation and coating application as further defined in the following sections of the installation contract. All surface preparation liquid and paint debris waste was contained, collected, stored and analyzed for hazardous material concentrations prior to appropriate disposal. The following guide specification sections from the demonstration plan installation contract address these issues.
1. Section 01525 “SAFETY AND OCCUPATIONAL HEALTH REQUIREMENTS” and Section 13283N “REMOVAL/CONTROL AND DISPOSAL OF PAINT WITH LEAD” (where applicable) were part of the demonstration contract and forms the demonstration site “Health and Safety Plan.” These Sections are currently titled UFGS 01 35 29 “SAFETY AND OCCUPATIONAL HEALTH REQUIREMENTS” and UFGS 02 82 33.13 20 “REMOVAL / CONTROL AND DISPOSAL OF PAINT WITH LEAD”. To ensure additional “Health and Safety Plan” compliance, the industrial painting contractor was certified by the SSPC to:
• SSPC QP-1 “Standard Procedure for Evaluating the Qualifications of Painting Contractors Performing Industrial Surface Preparation and Coating Application in the Field.”
• SSPC QP-2 “Standard Procedure for Evaluating the Qualifications of Painting Contractors to Remove Hazardous Paint.”
2. Section 01572 “CONSTRUCTION AND DEMOLITION WASTE MANAGEMENT,”
3. Section 01575N “TEMPORARY ENVIRONMENTAL CONTROLS,”
16
4. Section 01770N “CLOSEOUT PROCEDURES,”
5. Section 02120A “TRANSPORTATION AND DISPOSAL OF HAZARDOUS MATERIALS,” and,
6. Section 09967 “COATING OF STEEL WATERFRONT STRUCTURES.” Local and Federal environmental permits associated with construction work were required. These will likely change over time. At the very least a base may require an approved notice of intent (e.g., regional waste water discharge), environmental plan, and a site-specific safety plan.
17
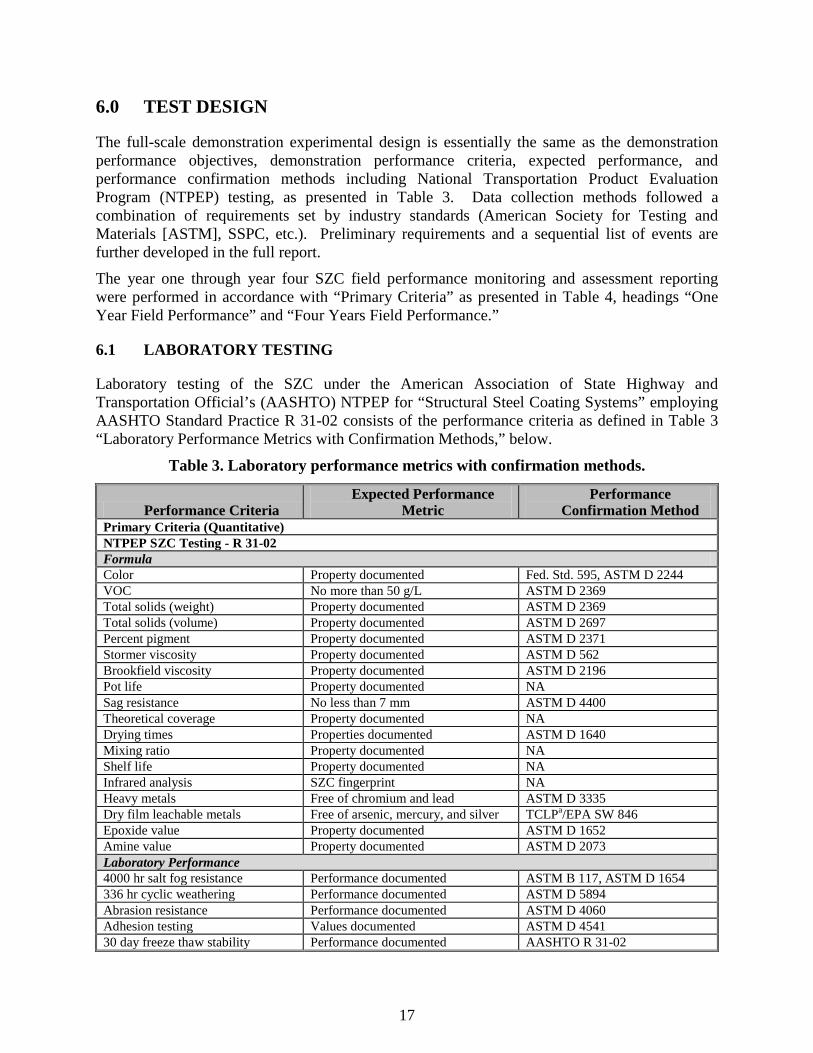
6.0 TEST DESIGN
The full-scale demonstration experimental design is essentially the same as the demonstration performance objectives, demonstration performance criteria, expected performance, and performance confirmation methods including National Transportation Product Evaluation Program (NTPEP) testing, as presented in Table 3. Data collection methods followed a combination of requirements set by industry standards (American Society for Testing and Materials [ASTM], SSPC, etc.). Preliminary requirements and a sequential list of events are further developed in the full report.
The year one through year four SZC field performance monitoring and assessment reporting were performed in accordance with “Primary Criteria” as presented in Table 4, headings “One Year Field Performance” and “Four Years Field Performance.”
6.1 LABORATORY TESTING
Laboratory testing of the SZC under the American Association of State Highway and Transportation Official’s (AASHTO) NTPEP for “Structural Steel Coating Systems” employing AASHTO Standard Practice R 31-02 consists of the performance criteria as defined in Table 3 “Laboratory Performance Metrics with Confirmation Methods,” below.
Table 3. Laboratory performance metrics with confirmation methods.
Performance Criteria Expected Performance
Metric Performance
Confirmation Method Primary Criteria (Quantitative) NTPEP SZC Testing - R 31-02 Formula Color Property documented Fed. Std. 595, ASTM D 2244 VOC No more than 50 g/L ASTM D 2369 Total solids (weight) Property documented ASTM D 2369 Total solids (volume) Property documented ASTM D 2697 Percent pigment Property documented ASTM D 2371 Stormer viscosity Property documented ASTM D 562 Brookfield viscosity Property documented ASTM D 2196 Pot life Property documented NA Sag resistance No less than 7 mm ASTM D 4400 Theoretical coverage Property documented NA Drying times Properties documented ASTM D 1640 Mixing ratio Property documented NA Shelf life Property documented NA Infrared analysis SZC fingerprint NA Heavy metals Free of chromium and lead ASTM D 3335 Dry film leachable metals Free of arsenic, mercury, and silver TCLPa/EPA SW 846 Epoxide value Property documented ASTM D 1652 Amine value Property documented ASTM D 2073 Laboratory Performance 4000 hr salt fog resistance Performance documented ASTM B 117, ASTM D 1654 336 hr cyclic weathering Performance documented ASTM D 5894 Abrasion resistance Performance documented ASTM D 4060 Adhesion testing Values documented ASTM D 4541 30 day freeze thaw stability Performance documented AASHTO R 31-02
18
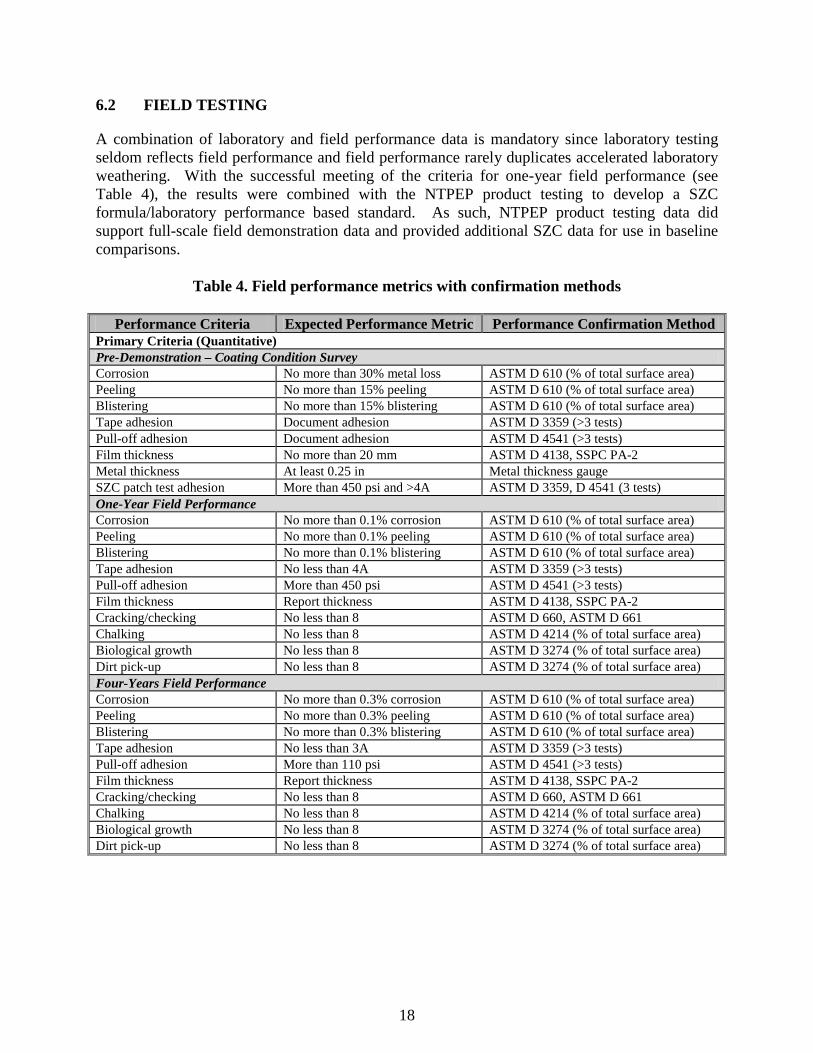
6.2 FIELD TESTING
A combination of laboratory and field performance data is mandatory since laboratory testing seldom reflects field performance and field performance rarely duplicates accelerated laboratory weathering. With the successful meeting of the criteria for one-year field performance (see Table 4), the results were combined with the NTPEP product testing to develop a SZC formula/laboratory performance based standard. As such, NTPEP product testing data did support full-scale field demonstration data and provided additional SZC data for use in baseline comparisons.
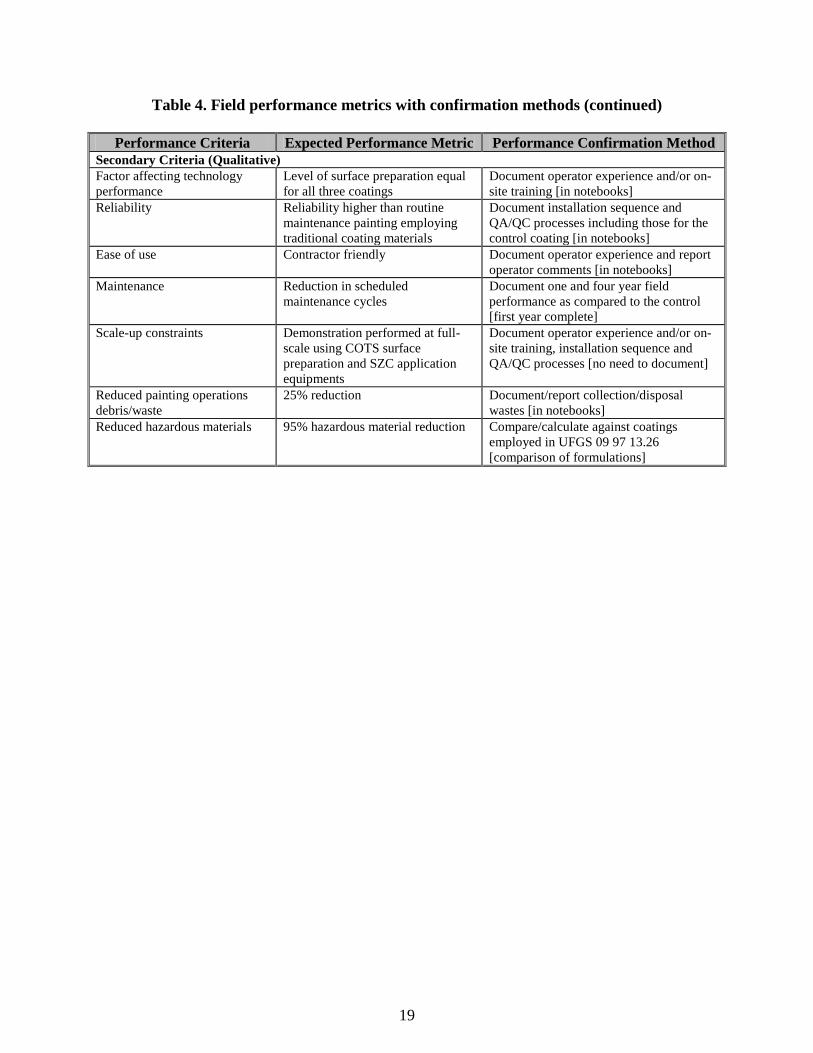
Table 4. Field performance metrics with confirmation methods
Performance Criteria Expected Performance Metric Performance Confirmation Method Primary Criteria (Quantitative) Pre-Demonstration – Coating Condition Survey Corrosion No more than 30% metal loss ASTM D 610 (% of total surface area) Peeling No more than 15% peeling ASTM D 610 (% of total surface area) Blistering No more than 15% blistering ASTM D 610 (% of total surface area) Tape adhesion Document adhesion ASTM D 3359 (>3 tests) Pull-off adhesion Document adhesion ASTM D 4541 (>3 tests) Film thickness No more than 20 mm ASTM D 4138, SSPC PA-2 Metal thickness At least 0.25 in Metal thickness gauge SZC patch test adhesion More than 450 psi and >4A ASTM D 3359, D 4541 (3 tests) One-Year Field Performance Corrosion No more than 0.1% corrosion ASTM D 610 (% of total surface area) Peeling No more than 0.1% peeling ASTM D 610 (% of total surface area) Blistering No more than 0.1% blistering ASTM D 610 (% of total surface area) Tape adhesion No less than 4A ASTM D 3359 (>3 tests) Pull-off adhesion More than 450 psi ASTM D 4541 (>3 tests) Film thickness Report thickness ASTM D 4138, SSPC PA-2 Cracking/checking No less than 8 ASTM D 660, ASTM D 661 Chalking No less than 8 ASTM D 4214 (% of total surface area) Biological growth No less than 8 ASTM D 3274 (% of total surface area) Dirt pick-up No less than 8 ASTM D 3274 (% of total surface area) Four-Years Field Performance Corrosion No more than 0.3% corrosion ASTM D 610 (% of total surface area) Peeling No more than 0.3% peeling ASTM D 610 (% of total surface area) Blistering No more than 0.3% blistering ASTM D 610 (% of total surface area) Tape adhesion No less than 3A ASTM D 3359 (>3 tests) Pull-off adhesion More than 110 psi ASTM D 4541 (>3 tests) Film thickness Report thickness ASTM D 4138, SSPC PA-2 Cracking/checking No less than 8 ASTM D 660, ASTM D 661 Chalking No less than 8 ASTM D 4214 (% of total surface area) Biological growth No less than 8 ASTM D 3274 (% of total surface area) Dirt pick-up No less than 8 ASTM D 3274 (% of total surface area)
19
Table 4. Field performance metrics with confirmation methods (continued)
Performance Criteria Expected Performance Metric Performance Confirmation Method Secondary Criteria (Qualitative) Factor affecting technology performance
Level of surface preparation equal for all three coatings
Document operator experience and/or on-site training [in notebooks]
Reliability Reliability higher than routine maintenance painting employing traditional coating materials
Document installation sequence and QA/QC processes including those for the control coating [in notebooks]
Ease of use Contractor friendly Document operator experience and report operator comments [in notebooks]
Maintenance Reduction in scheduled maintenance cycles
Document one and four year field performance as compared to the control [first year complete]
Scale-up constraints Demonstration performed at full-scale using COTS surface preparation and SZC application equipments
Document operator experience and/or on-site training, installation sequence and QA/QC processes [no need to document]
Reduced painting operations debris/waste
25% reduction Document/report collection/disposal wastes [in notebooks]
Reduced hazardous materials 95% hazardous material reduction Compare/calculate against coatings employed in UFGS 09 97 13.26 [comparison of formulations]

This page left blank intentionally.
21
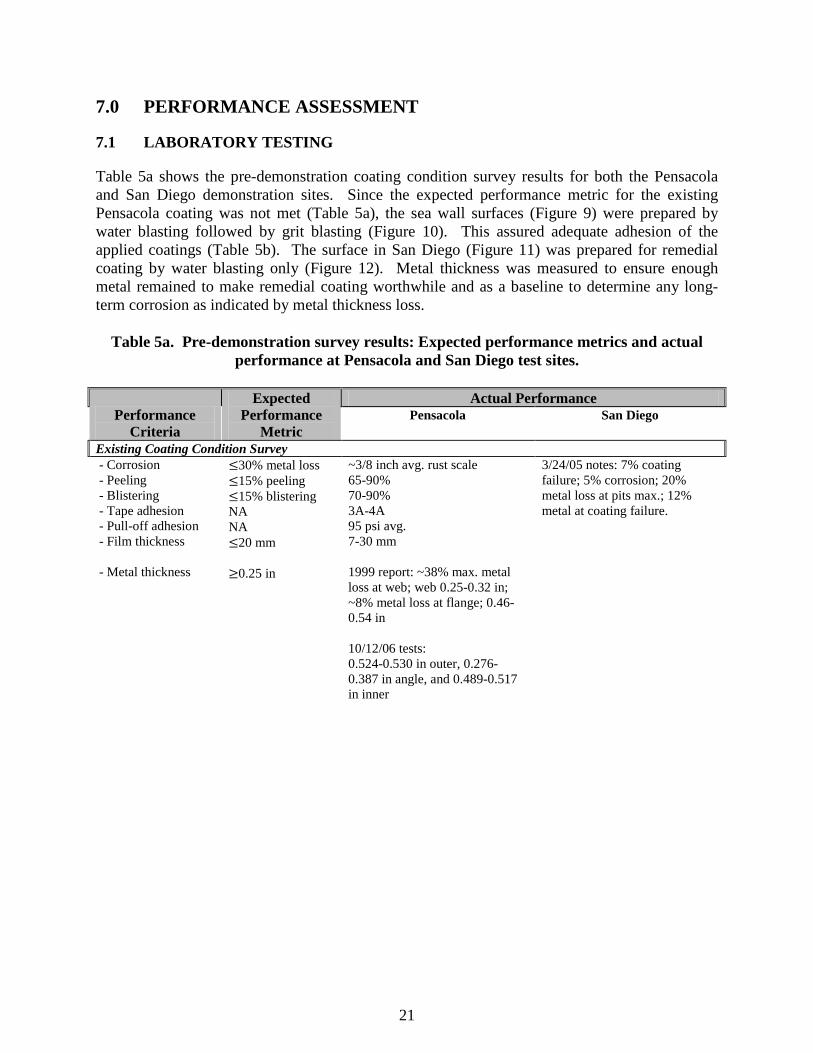
7.0 PERFORMANCE ASSESSMENT
7.1 LABORATORY TESTING
Table 5a shows the pre-demonstration coating condition survey results for both the Pensacola and San Diego demonstration sites. Since the expected performance metric for the existing Pensacola coating was not met (Table 5a), the sea wall surfaces (Figure 9) were prepared by water blasting followed by grit blasting (Figure 10). This assured adequate adhesion of the applied coatings (Table 5b). The surface in San Diego (Figure 11) was prepared for remedial coating by water blasting only (Figure 12). Metal thickness was measured to ensure enough metal remained to make remedial coating worthwhile and as a baseline to determine any long-term corrosion as indicated by metal thickness loss.
Table 5a. Pre-demonstration survey results: Expected performance metrics and actual performance at Pensacola and San Diego test sites.
Performance Criteria
Expected Performance
Metric
Actual Performance Pensacola San Diego
Existing Coating Condition Survey - Corrosion - Peeling - Blistering - Tape adhesion - Pull-off adhesion - Film thickness - Metal thickness
≤30% metal loss ≤15% peeling ≤15% blistering NA NA ≤20 mm ≥0.25 in
~3/8 inch avg. rust scale 65-90% 70-90% 3A-4A 95 psi avg. 7-30 mm 1999 report: ~38% max. metal loss at web; web 0.25-0.32 in; ~8% metal loss at flange; 0.46-0.54 in 10/12/06 tests: 0.524-0.530 in outer, 0.276-0.387 in angle, and 0.489-0.517 in inner
3/24/05 notes: 7% coating failure; 5% corrosion; 20% metal loss at pits max.; 12% metal at coating failure.
22
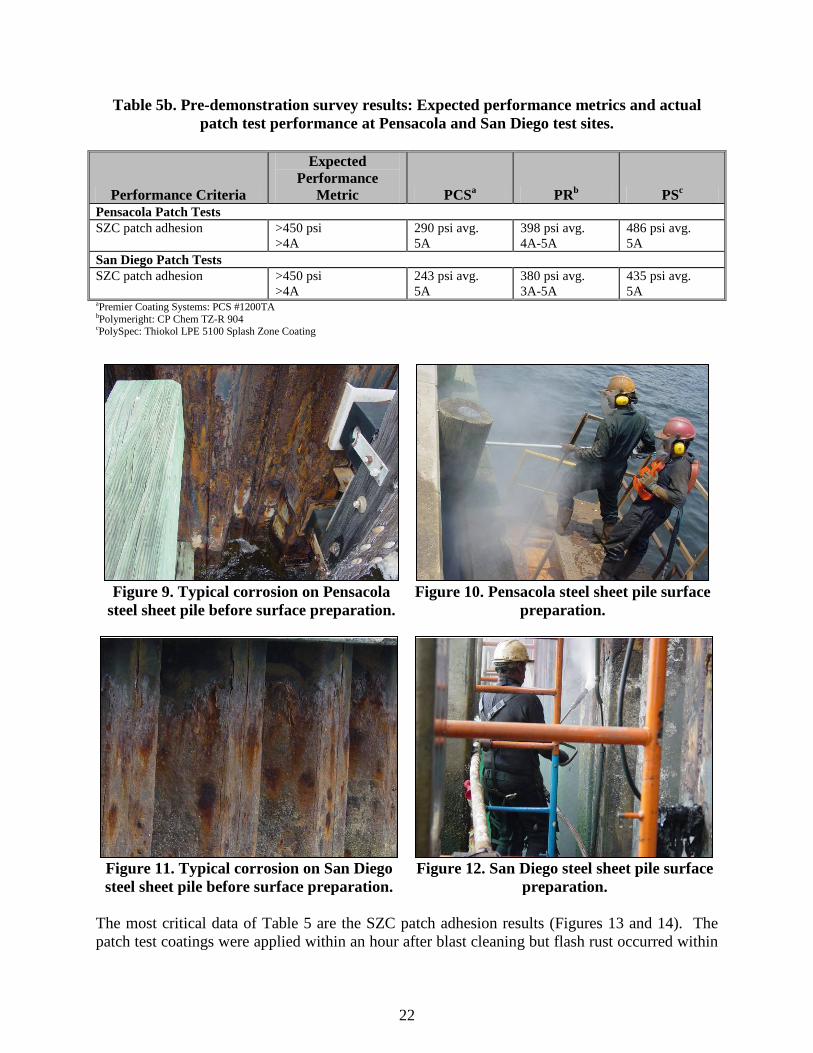
Table 5b. Pre-demonstration survey results: Expected performance metrics and actual patch test performance at Pensacola and San Diego test sites.
Performance Criteria
Expected Performance
Metric PCSa PRb PSc
Pensacola Patch Tests SZC patch adhesion >450 psi
>4A 290 psi avg. 5A
398 psi avg. 4A-5A
486 psi avg. 5A
San Diego Patch Tests
SZC patch adhesion >450 psi >4A
243 psi avg. 5A
380 psi avg. 3A-5A
435 psi avg. 5A
aPremier Coating Systems: PCS #1200TA bPolymeright: CP Chem TZ-R 904 cPolySpec: Thiokol LPE 5100 Splash Zone Coating
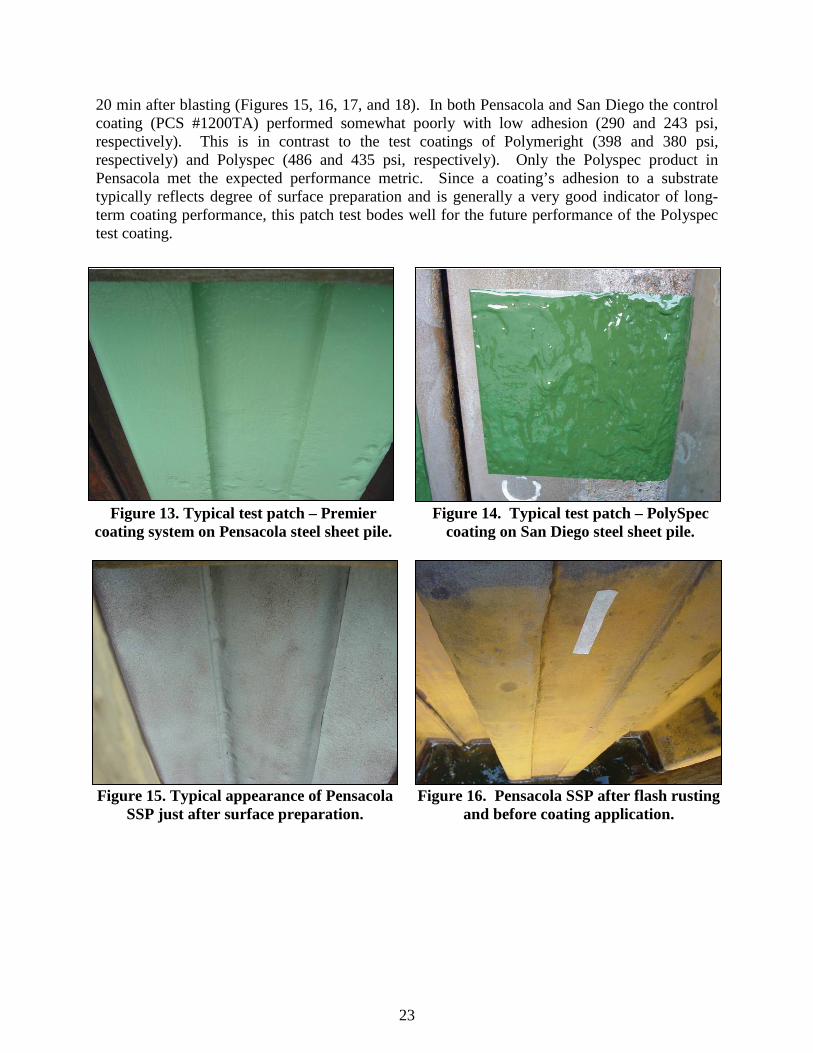
The most critical data of Table 5 are the SZC patch adhesion results (Figures 13 and 14). The patch test coatings were applied within an hour after blast cleaning but flash rust occurred within
Figure 9. Typical corrosion on Pensacola
steel sheet pile before surface preparation. Figure 10. Pensacola steel sheet pile surface
preparation.
Figure 11. Typical corrosion on San Diego steel sheet pile before surface preparation.
Figure 12. San Diego steel sheet pile surface preparation.
23
20 min after blasting (Figures 15, 16, 17, and 18). In both Pensacola and San Diego the control coating (PCS #1200TA) performed somewhat poorly with low adhesion (290 and 243 psi, respectively). This is in contrast to the test coatings of Polymeright (398 and 380 psi, respectively) and Polyspec (486 and 435 psi, respectively). Only the Polyspec product in Pensacola met the expected performance metric. Since a coating’s adhesion to a substrate typically reflects degree of surface preparation and is generally a very good indicator of long-term coating performance, this patch test bodes well for the future performance of the Polyspec test coating.
Figure 15. Typical appearance of Pensacola
SSP just after surface preparation. Figure 16. Pensacola SSP after flash rusting
and before coating application.
Figure 13. Typical test patch – Premier
coating system on Pensacola steel sheet pile. Figure 14. Typical test patch – PolySpec
coating on San Diego steel sheet pile.
24
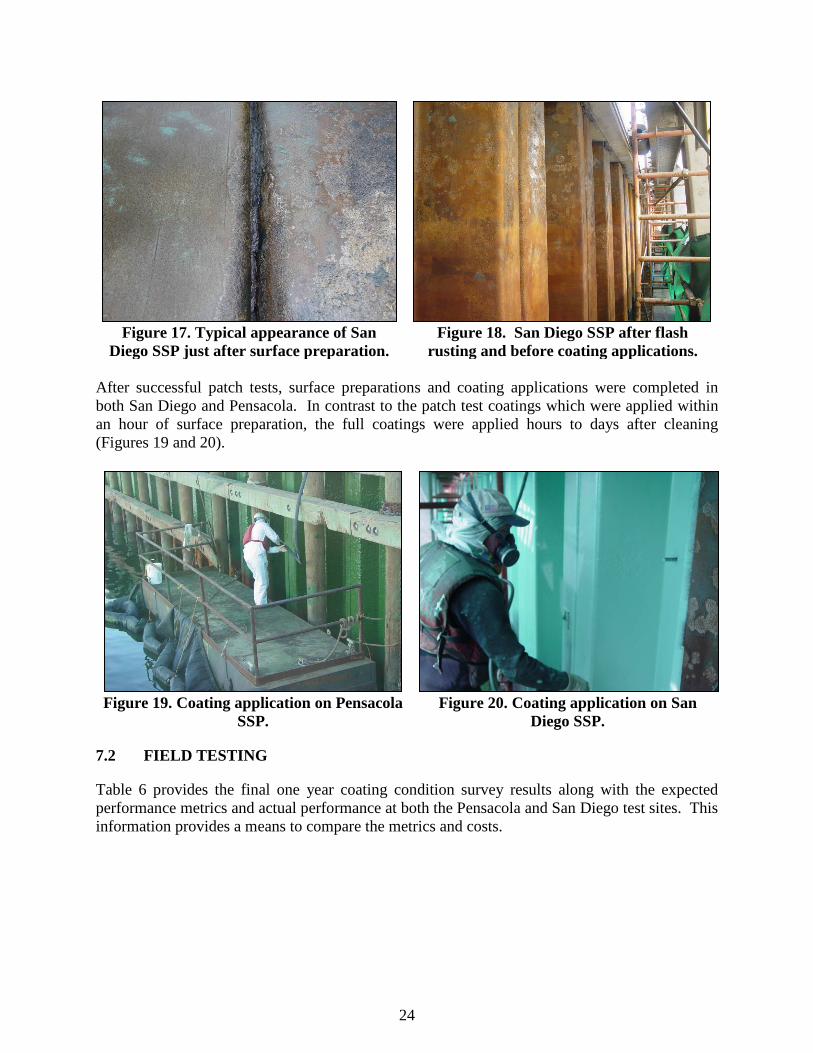
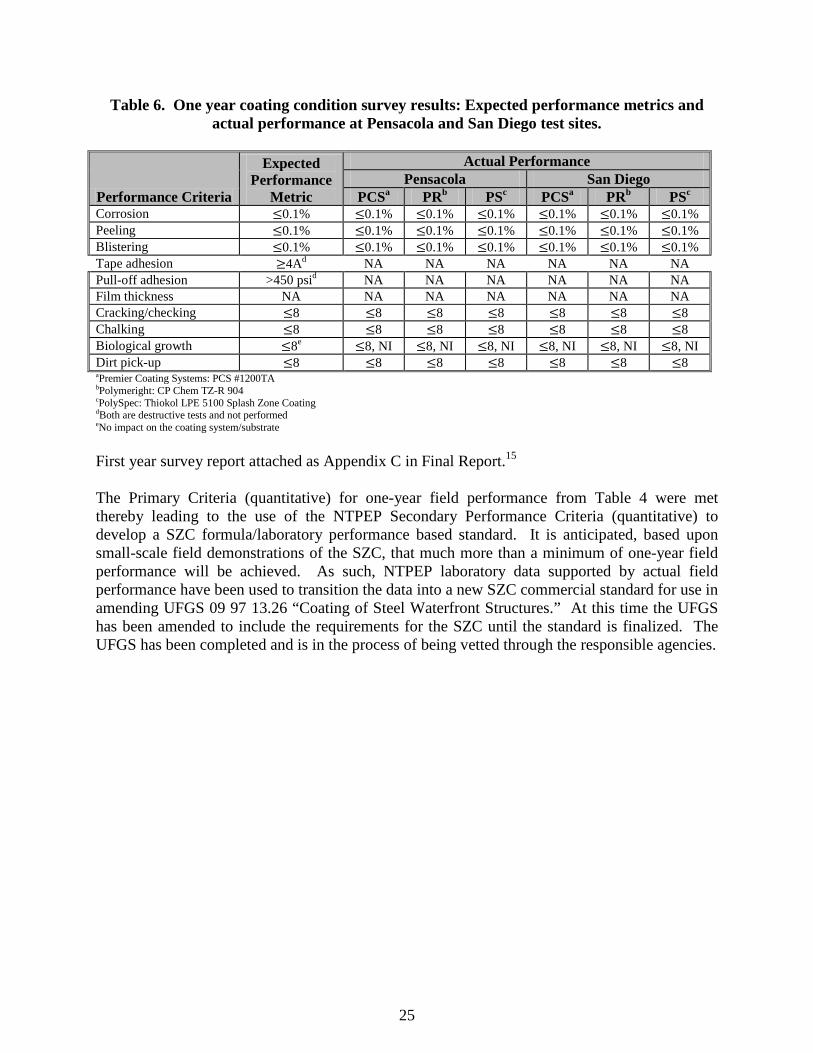
After successful patch tests, surface preparations and coating applications were completed in both San Diego and Pensacola. In contrast to the patch test coatings which were applied within an hour of surface preparation, the full coatings were applied hours to days after cleaning (Figures 19 and 20).
Figure 19. Coating application on Pensacola
SSP. Figure 20. Coating application on San
Diego SSP.
7.2 FIELD TESTING
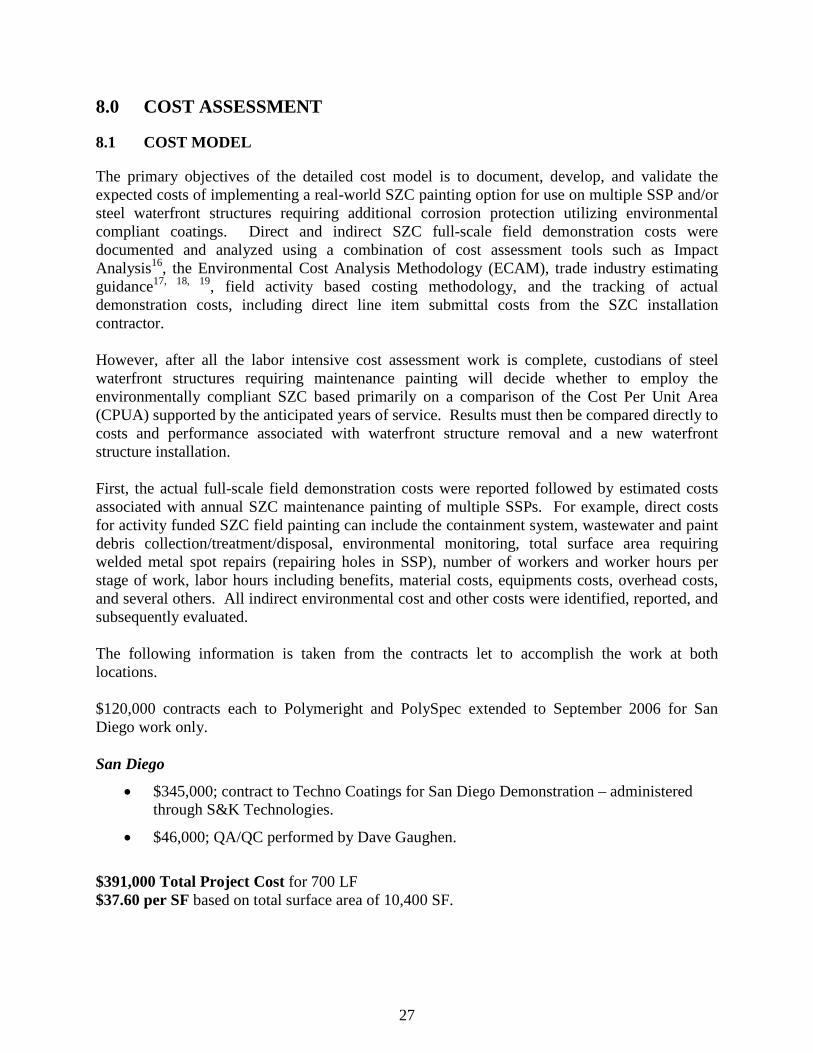
Table 6 provides the final one year coating condition survey results along with the expected performance metrics and actual performance at both the Pensacola and San Diego test sites. This information provides a means to compare the metrics and costs.
Figure 17. Typical appearance of San
Diego SSP just after surface preparation. Figure 18. San Diego SSP after flash
rusting and before coating applications.
25
Table 6. One year coating condition survey results: Expected performance metrics and actual performance at Pensacola and San Diego test sites.
Performance Criteria
Expected Performance
Metric
Actual Performance Pensacola San Diego
PCSa PRb PSc PCSa PRb PSc
Corrosion ≤0.1% ≤0.1% ≤0.1% ≤0.1% ≤0.1% ≤0.1% ≤0.1% Peeling ≤0.1% ≤0.1% ≤0.1% ≤0.1% ≤0.1% ≤0.1% ≤0.1% Blistering ≤0.1% ≤0.1% ≤0.1% ≤0.1% ≤0.1% ≤0.1% ≤0.1% Tape adhesion ≥4Ad NA NA NA NA NA NA Pull-off adhesion >450 psid NA NA NA NA NA NA Film thickness NA NA NA NA NA NA NA Cracking/checking ≤8 ≤8 ≤8 ≤8 ≤8 ≤8 ≤8 Chalking ≤8 ≤8 ≤8 ≤8 ≤8 ≤8 ≤8 Biological growth ≤8e ≤8, NI ≤8, NI ≤8, NI ≤8, NI ≤8, NI ≤8, NI Dirt pick-up ≤8 ≤8 ≤8 ≤8 ≤8 ≤8 ≤8 aPremier Coating Systems: PCS #1200TA bPolymeright: CP Chem TZ-R 904 cPolySpec: Thiokol LPE 5100 Splash Zone Coating dBoth are destructive tests and not performed eNo impact on the coating system/substrate First year survey report attached as Appendix C in Final Report.15 The Primary Criteria (quantitative) for one-year field performance from Table 4 were met thereby leading to the use of the NTPEP Secondary Performance Criteria (quantitative) to develop a SZC formula/laboratory performance based standard. It is anticipated, based upon small-scale field demonstrations of the SZC, that much more than a minimum of one-year field performance will be achieved. As such, NTPEP laboratory data supported by actual field performance have been used to transition the data into a new SZC commercial standard for use in amending UFGS 09 97 13.26 “Coating of Steel Waterfront Structures.” At this time the UFGS has been amended to include the requirements for the SZC until the standard is finalized. The UFGS has been completed and is in the process of being vetted through the responsible agencies.

This page left blank intentionally.
27
8.0 COST ASSESSMENT
8.1 COST MODEL
The primary objectives of the detailed cost model is to document, develop, and validate the expected costs of implementing a real-world SZC painting option for use on multiple SSP and/or steel waterfront structures requiring additional corrosion protection utilizing environmental compliant coatings. Direct and indirect SZC full-scale field demonstration costs were documented and analyzed using a combination of cost assessment tools such as Impact Analysis16, the Environmental Cost Analysis Methodology (ECAM), trade industry estimating guidance17, 18, 19, field activity based costing methodology, and the tracking of actual demonstration costs, including direct line item submittal costs from the SZC installation contractor. However, after all the labor intensive cost assessment work is complete, custodians of steel waterfront structures requiring maintenance painting will decide whether to employ the environmentally compliant SZC based primarily on a comparison of the Cost Per Unit Area (CPUA) supported by the anticipated years of service. Results must then be compared directly to costs and performance associated with waterfront structure removal and a new waterfront structure installation. First, the actual full-scale field demonstration costs were reported followed by estimated costs associated with annual SZC maintenance painting of multiple SSPs. For example, direct costs for activity funded SZC field painting can include the containment system, wastewater and paint debris collection/treatment/disposal, environmental monitoring, total surface area requiring welded metal spot repairs (repairing holes in SSP), number of workers and worker hours per stage of work, labor hours including benefits, material costs, equipments costs, overhead costs, and several others. All indirect environmental cost and other costs were identified, reported, and subsequently evaluated. The following information is taken from the contracts let to accomplish the work at both locations. $120,000 contracts each to Polymeright and PolySpec extended to September 2006 for San Diego work only. San Diego
• $345,000; contract to Techno Coatings for San Diego Demonstration – administered through S&K Technologies.
• $46,000; QA/QC performed by Dave Gaughen. $391,000 Total Project Cost for 700 LF $37.60 per SF based on total surface area of 10,400 SF.
28
Pensacola
• 06/2005 – $236,500; contract to Madcon Corp. subcontract to Ellis Environmental.
• 9/15/06 – $336,000; total revised actual cost, includes modifications due to delays. – $151,000; QA/QC performed by Dave Gaughen. – $166,000; direct support of Madcon expenses by NFESC.
$653,000 Total Project Cost for 700 LF $44.42 per SF based on total surface area of 14,700 SF. Table 7 will be used to report costs for the SZC.
Table 7. Examples of types of costs by category.
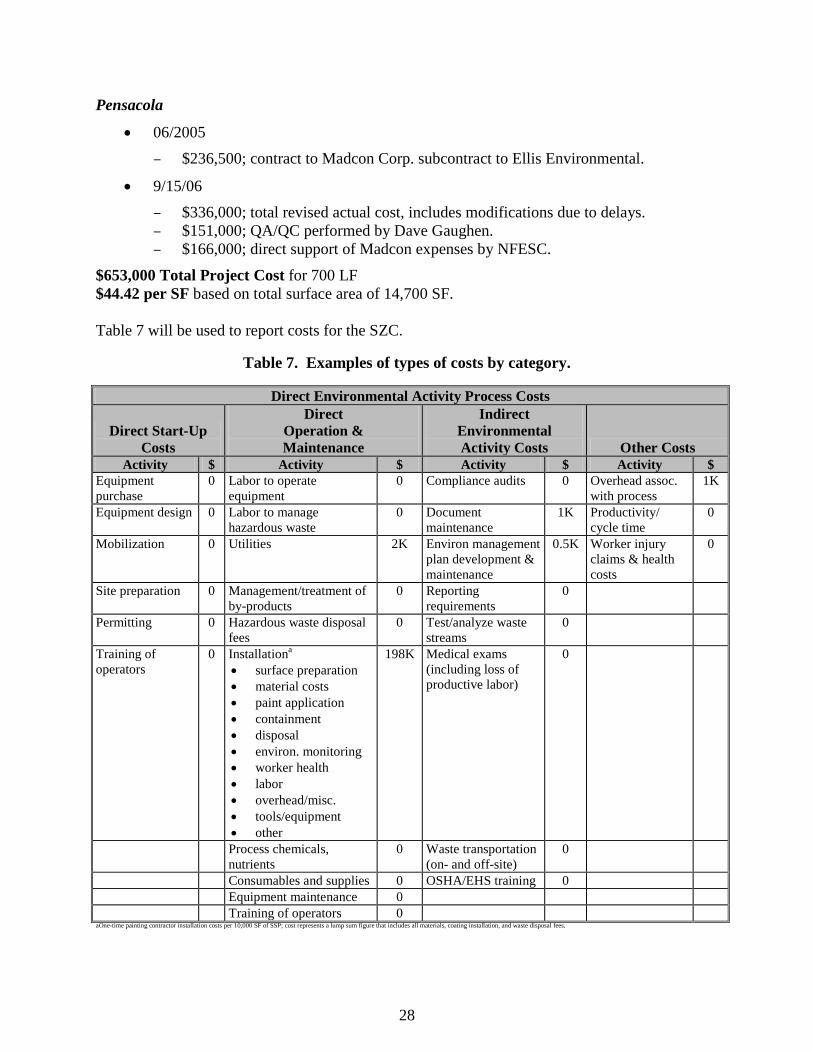
Direct Environmental Activity Process Costs
Direct Start-Up Costs
Direct Operation & Maintenance
Indirect Environmental Activity Costs Other Costs
Activity $ Activity $ Activity $ Activity $ Equipment purchase
0 Labor to operate equipment
0 Compliance audits 0 Overhead assoc. with process
1K
Equipment design 0 Labor to manage hazardous waste
0 Document maintenance
1K Productivity/ cycle time
0
Mobilization 0 Utilities 2K Environ management plan development & maintenance
0.5K Worker injury claims & health costs
0
Site preparation 0 Management/treatment of by-products
0 Reporting requirements
0
Permitting 0 Hazardous waste disposal fees
0 Test/analyze waste streams
0
Training of operators
0 Installationa • surface preparation • material costs • paint application • containment • disposal • environ. monitoring • worker health • labor • overhead/misc. • tools/equipment • other
198K Medical exams (including loss of productive labor)
0
Process chemicals, nutrients
0 Waste transportation (on- and off-site)
0
Consumables and supplies 0 OSHA/EHS training 0 Equipment maintenance 0 Training of operators 0 aOne-time painting contractor installation costs per 10,000 SF of SSP; cost represents a lump sum figure that includes all materials, coating installation, and waste disposal fees.
29
8.2 COST ANALYSIS AND COMPARISON
For cost comparative purposes the following information is provided as to a full-scale repair to a facility. Whereas the costs for the present project ranged from $50 to less than $100 per SF, some of the more extensive projects noted below had costs exceeding $100 per SF to more than $130 per SF assuming an 18 foot tall splash zone. Wake Island Fueling Pier Repair Cost Estimate – September 2005 Steel Sheet Piling Splash Zone Coating = $396,000 for 205 LF bulkhead x 12.7 ft (MLLW to top of sheet piling). Total actual surface area about 4090 SF = $96.82 per SF (about 50% of cost attributed to remote location). Naval Station San Diego – August 21, 2001 Contract award of $8,745,173 firm-fixed-price contract for the temporary shutdown/repair of the Paleta Creek Fendering System and Quay wall at Naval Station San Diego. Work was performed in San Diego, Calif., and was completed by September 2003. LF = ~3,150 Cost for Quay wall Repair only ~$6.5 million = ~$2,063 per LF Naval Station San Diego – September 24, 2003 Contract award of $16,770,000 firm-fixed-price contract for repair of Chollas Creek Fender System and Quay wall at Naval Station San Diego and Fender Piles (Phases I and II) at Naval Amphibious Base Coronado. Sheet Pile Installation in front of existing concrete sheet piles, includes new concrete cap, some repairs to existing concrete. New sheet piling coated with coal tar. LF = ~ 4,720 Cost for Quay wall Repair only ~ $11.5 million = ~$2,436 per LF A cost comparison should be performed to evaluate the environmentally compliant SZC as compared to complete structure removal/new structure installation employing coatings similar to those specified in UFGS 09 97 13.26, and potentially compared to emerging coatings at multiple sites throughout the Navy. This cost comparison was not performed as it was outside the scope of the project. When performed, the comparison should take into consideration the annual economic and environmental considerations of the proposed alternative versus the existing process.

This page left blank intentionally.
31
9.0 IMPLEMENTATION ISSUES
9.1 ENVIRONMENTAL CHECKLIST
The painting contractors are required to comply with Federal, state, and local environmental regulations throughout all aspects of any full-scale demonstration or follow-on work that deals with removal of old splash zone coatings and the application of new coatings. The reader is directed to section 4.3, Site-Related Permits and Regulations, for an outline of relevant items.
9.2 OTHER REGULATORAY ISSUES
A regulatory representative from either the SCAQMD of California at Los Angeles or a southern California district representative of EPA, or both, should be contacted for participation in any project demonstration in San Diego.
9.3 END-USERS/ORIGINAL EQUIPMENT MANUFACTURERS (OEM) ISSUES
Concerns, reservations, and decision-making factors affecting SZC buy-in from DoD end-users have been reviewed by technical POCs from the Navy, Army and Air Force and are providing guidance documents in advance of submission to NAVFAC’s Engineering Innovative Criteria Office (EICO) for guidance inclusion on the Construction Criteria Base’s (CCB) web site at http://www.ccb.org. The full-scale SZC demonstration(s), including the NTPEP testing, will confirm acceptable SZC performance prior to drafting new DoD guidance. PolySpec L.P. has annual sales in excess of $10 million and large volume production, including international sales and distribution to locations outside the continental United States. Polymeright, Incorporated has developed a joint partnership for coating commercialization with Chevron Phillips Chemical Company LP, a multi-billion dollar international corporation. As such, manufacturing including SZC distribution is not a significant concern. Procurement of the SZC will be specified in the amended UFGS using a combination of performance and formulation properties. A new MPI DPS will be developed to replace the SZC specification language. Referencing either the new MPI DPS or presenting formulation and performance testing requirements within the new specification is sufficient to enable other coating manufacturer’s to compete for SZC sales and eliminates the requirement of sole source SZC procurement. As such, SZC procurement will then become a required contractor’s material submittal when preparing a bid for work to perform corrosion control on an SSP requiring maintenance painting. To reiterate, demonstration results are being transitioned into commercial guidance such as a new MPI DPS for the SZC followed by amending UFGS entitled “Coating of Steel Waterfront Structures.” The DPS and the UFGS will be web-displayed at http://www.paintinfo.com, http://www.ccb.org/ufgs/ufgs.htm, respectively, and for direct use by Tri-service activities with aboveground storage tanks (AST) in need of maintenance painting. In addition to the above, PolySpec L.P. and Polymeright, Inc., will continue to produce and market the SZC to the original equipment manufacturer (OEM) community including the Bureau of Reclamation and to state
32
Departments of Transportation (DOT). Other applications of the SZC may include bridges, offshore structures, structural steel, antenna towers, and various concrete structures.
33
10.0 REFERENCES
1. South Coast Air Quality Management District (SCAQMD). Rule 1113 Architectural Coatings. Amended July 09, 2004.
2. SCAQMD– http://www.aqmd.gov/rules/rulesreg.html.
3. Premier Coating Systems, Inc. MSDS & Product Literature for PCS #1200TA. 2004.
4. PolySpec. MSDS & Product Literature for Thiokol LPE 5100 Splash Zone Coating. 2005.
5. Polymeright, Inc. MSDS & Product Literature for CP Chem TZ-R 904. 2005.
6. International Protective Coatings. MSDS & Product Literature for Interzone 954 (High Build Epoxy). 2004.
7. International Protective Coatings. MSDS & Product Literature for Interzone 1000 (Glass Flake Epoxy). 2004.
8. Carboline. MSDS & Product Literature for Kop-Coat A-788 (Epoxy Putty). 2004. 9. NFESC EAST COAST DET Contract Report. 1995. Underwater Inspection of Facilities
at Naval Air Station, Pensacola, FL. NFESC EAST COAST DET. CR-6009-OCN. November 1995.
10. Ibid.
11. NFESC Waterfront Materials Division. 2001. Above Water Control Inspections and Assessments of Piers 1, 3, 5, 7, and 13, Naval Station San Diego and Fuel Pier and Piers 1, 3, 5, 7, 11, 13, 17, and 19, Naval Amphibious Base, Coronado. SSR-2639-SHR. June 2001.
12. U.S. Naval Station San Diego - http://www.navstasd.navy.mil
13. NFESC EAST COAST DET Contract Report. 1995. Underwater Facilities Inspections and Assessments at Naval Station San Diego, California. NFESC EAST COAST DET. Report No. 55-95. June 1995.
14. NFESC EAST COAST DET Contract Report. 2001. Underwater Facilities Inspections and Assessments at Naval Station San Diego, California Volume 2 – Appendices. NFESC EAST COAST DET. CR-6220-OCN. September 2001.
15. Daniel A. Zarate. 2010. Demonstration/ Validation of a Zero-VOC, Coal Tar Free Splash Zone Coating (SZC). ESTCP Final Report. WP-200528. December 2012.
16. Kevin J. Kovaleski. 2003. Demonstration/Validation of a Zero-VOC Waterborne Polyurethane Topcoat. ESTCP Cost and Performance Report. PP-9802. January 2003.
17. The Society for Protective Coatings (SSPC). 2001. Estimating Costs in Protective Coatings Projects. SSPC-TU 9. 2001.
18. Painting and Decorating Contractors of America (PDCA). 1994. Professional Estimating Procedures for Painting Contractors. 1994.
19. Painting and Decorating Contractors of America (PDCA). 2001. Estimating Guide: Volume 2, Rates and Tables. 2001.

This page left blank intentionally.
A-1
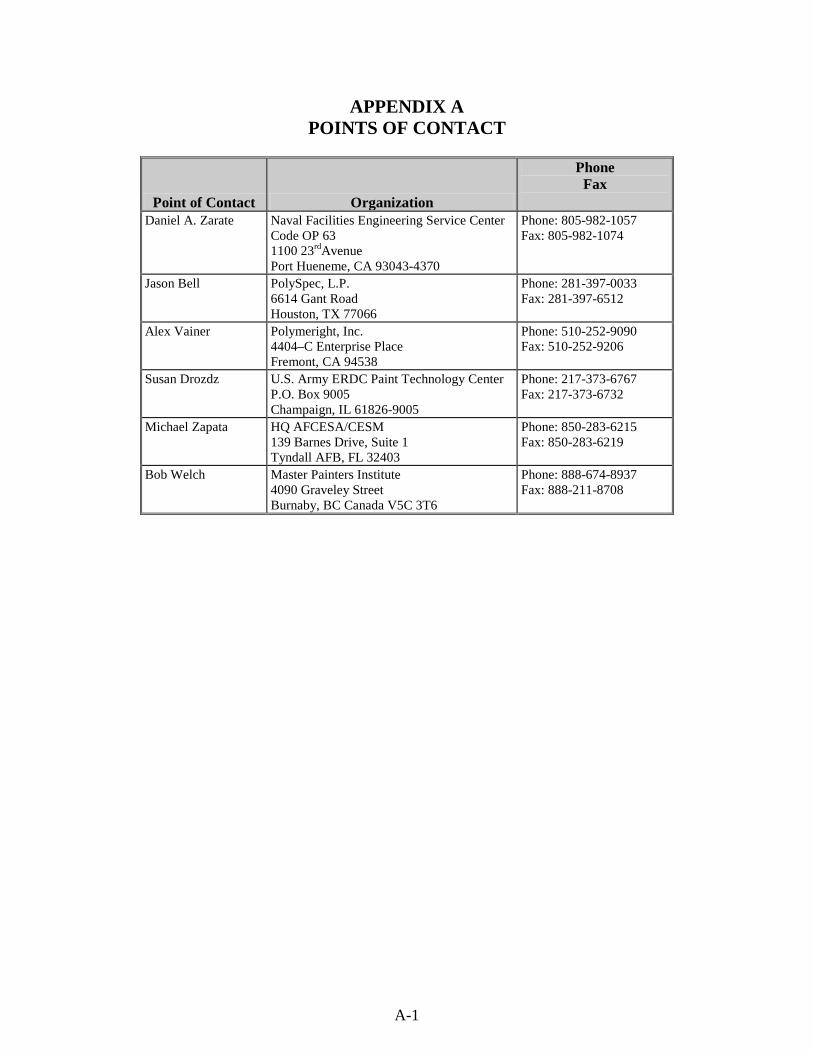
APPENDIX A POINTS OF CONTACT
Point of Contact Organization
Phone Fax
Daniel A. Zarate Naval Facilities Engineering Service Center
Code OP 63 1100 23rdAvenue Port Hueneme, CA 93043-4370
Phone: 805-982-1057 Fax: 805-982-1074
Jason Bell PolySpec, L.P. 6614 Gant Road Houston, TX 77066
Phone: 281-397-0033 Fax: 281-397-6512
Alex Vainer Polymeright, Inc. 4404–C Enterprise Place Fremont, CA 94538
Phone: 510-252-9090 Fax: 510-252-9206
Susan Drozdz U.S. Army ERDC Paint Technology Center P.O. Box 9005 Champaign, IL 61826-9005
Phone: 217-373-6767 Fax: 217-373-6732
Michael Zapata HQ AFCESA/CESM 139 Barnes Drive, Suite 1 Tyndall AFB, FL 32403
Phone: 850-283-6215 Fax: 850-283-6219
Bob Welch Master Painters Institute 4090 Graveley Street Burnaby, BC Canada V5C 3T6
Phone: 888-674-8937 Fax: 888-211-8708
ESTCP Office4800 mark center DriveSuite 17D08alexandria, va 22350-3605
(571) 372-6565 (Phone)
E-mail: [email protected]