
ESTCPCost and Performance Report
EnvironmEntal SEcuritytEchnology cErtification Program
u.S. Department of Defense
(ER-0313)
Demonstration and Validation of a Regenerated Cellulose Dialysis Membrane Diffusion Sampler for Monitoring Ground-Water Quality and Remediation Progress at DoD SitesApril 2010

Report Documentation Page Form ApprovedOMB No. 0704-0188
Public reporting burden for the collection of information is estimated to average 1 hour per response, including the time for reviewing instructions, searching existing data sources, gathering andmaintaining the data needed, and completing and reviewing the collection of information. Send comments regarding this burden estimate or any other aspect of this collection of information,including suggestions for reducing this burden, to Washington Headquarters Services, Directorate for Information Operations and Reports, 1215 Jefferson Davis Highway, Suite 1204, ArlingtonVA 22202-4302. Respondents should be aware that notwithstanding any other provision of law, no person shall be subject to a penalty for failing to comply with a collection of information if itdoes not display a currently valid OMB control number.
1. REPORT DATE APR 2010 2. REPORT TYPE
3. DATES COVERED 00-00-2010 to 00-00-2010
4. TITLE AND SUBTITLE Demonstration and Validation of a Regenerated Cellulose DialysisMembrane Diffusion Sampler for Monitoring Ground-Water Quality andRemediation Progress at DoD Sites
5a. CONTRACT NUMBER
5b. GRANT NUMBER
5c. PROGRAM ELEMENT NUMBER
6. AUTHOR(S) 5d. PROJECT NUMBER
5e. TASK NUMBER
5f. WORK UNIT NUMBER
7. PERFORMING ORGANIZATION NAME(S) AND ADDRESS(ES) Environmental Security Technology Certification Program (ESTCP),901North Stuart Street Suite 303,Arlington,VA,22203
8. PERFORMING ORGANIZATIONREPORT NUMBER
9. SPONSORING/MONITORING AGENCY NAME(S) AND ADDRESS(ES) 10. SPONSOR/MONITOR’S ACRONYM(S)
11. SPONSOR/MONITOR’S REPORT NUMBER(S)
12. DISTRIBUTION/AVAILABILITY STATEMENT Approved for public release; distribution unlimited
13. SUPPLEMENTARY NOTES
14. ABSTRACT
15. SUBJECT TERMS
16. SECURITY CLASSIFICATION OF: 17. LIMITATION OF ABSTRACT Same as
Report (SAR)
18. NUMBEROF PAGES
67
19a. NAME OFRESPONSIBLE PERSON
a. REPORT unclassified
b. ABSTRACT unclassified
c. THIS PAGE unclassified
Standard Form 298 (Rev. 8-98) Prescribed by ANSI Std Z39-18

i
COST & PERFORMANCE REPORT Project: ER-0313
TABLE OF CONTENTS
Page
1.0 EXECUTIVE SUMMARY ........................................................................ 1 1.1 BACKGROUND ............................................................................ 1 1.2 OBJECTIVES OF THE DEMONSTRATION ........................................ 1 1.3 DEMONSTRATION RESULTS ......................................................... 1 1.4 IMPLEMENTATION ISSUES ........................................................... 2
2.0 INTRODUCTION ................................................................................... 5 2.1 BACKGROUND ............................................................................ 5 2.2 OBJECTIVES OF THE DEMONSTRATION ........................................ 6 2.3 REGULATORY DRIVERS .............................................................. 7
3.0 TECHNOLOGY ..................................................................................... 9 3.1 TECHNOLOGY DESCRIPTION ....................................................... 9
3.1.1 Theory and Operation of RCDM Samplers ................................... 9 3.1.2 Construction of RCDM Samplers .............................................. 10 3.1.3 Chronological Development of RCDM Samplers ........................... 10 3.1.4 Summary of Development of RCDM Samplers Conducted under
This ESTCP Project .............................................................. 12 3.1.5 Expected Applications of RCDM Samplers .................................. 12
3.2 ADVANTAGES AND LIMITATIONS OF THE TECHNOLOGY ............. 12
4.0 PERFORMANCE OBJECTIVES ................................................................ 15
5.0 SITE DESCRIPTIONS ............................................................................ 17 5.1 SITE LOCATIONS ....................................................................... 17 5.2 SITE GEOLOGY/HYDROGEOLOGY ............................................... 17 5.3 CONTAMINANT DISTRIBUTION ................................................... 18
6.0 TEST DESIGN ...................................................................................... 19 6.1 CONCEPTUAL EXPERIMENTAL DESIGN ....................................... 19 6.2 BASELINE CHARACTERIZATION ................................................. 19 6.3 TREATABILITY OR LABORATORY STUDY RESULTS ...................... 19 6.4 FIELD TESTING .......................................................................... 21
6.4.1 Field Comparison Testing Periods ............................................. 21 6.4.2 Sampler Construction and Deployment ....................................... 22 6.4.3 Tested Chemical Constituents .................................................. 22
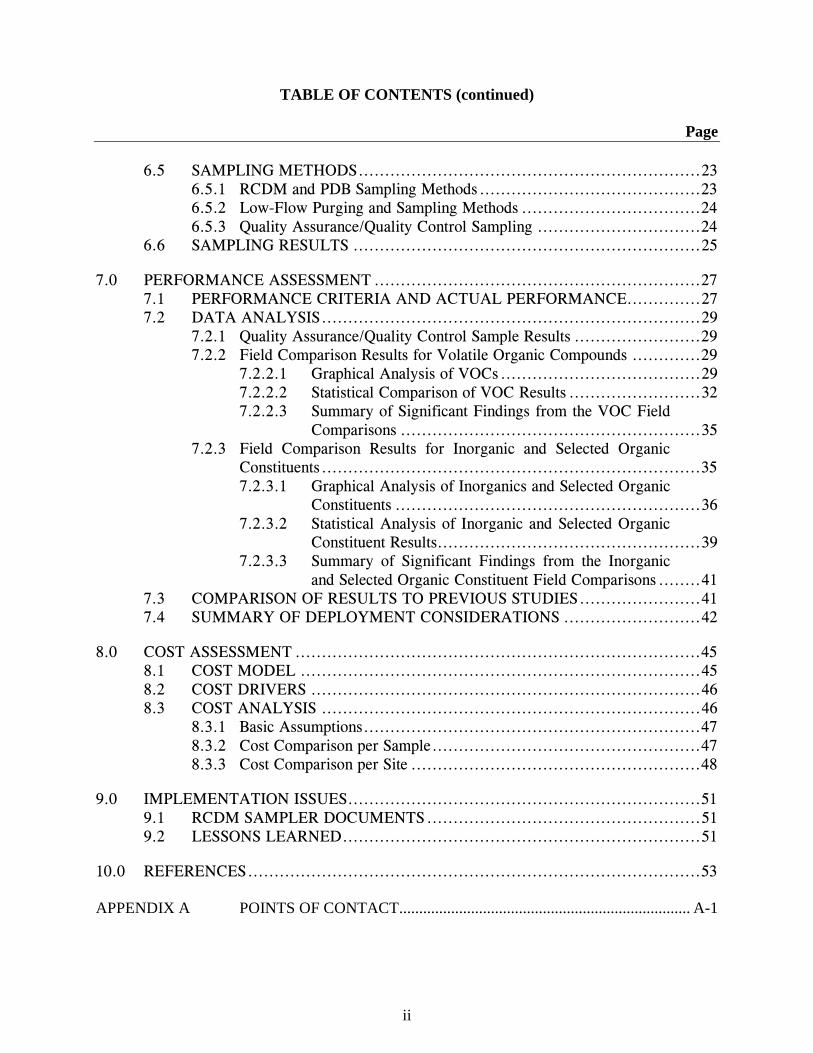
TABLE OF CONTENTS (continued)
Page
ii
6.5 SAMPLING METHODS ................................................................. 23 6.5.1 RCDM and PDB Sampling Methods .......................................... 23 6.5.2 Low-Flow Purging and Sampling Methods .................................. 24 6.5.3 Quality Assurance/Quality Control Sampling ............................... 24
6.6 SAMPLING RESULTS .................................................................. 25
7.0 PERFORMANCE ASSESSMENT .............................................................. 27 7.1 PERFORMANCE CRITERIA AND ACTUAL PERFORMANCE .............. 27 7.2 DATA ANALYSIS ........................................................................ 29
7.2.1 Quality Assurance/Quality Control Sample Results ........................ 29 7.2.2 Field Comparison Results for Volatile Organic Compounds ............. 29
7.2.2.1 Graphical Analysis of VOCs ...................................... 29 7.2.2.2 Statistical Comparison of VOC Results ......................... 32 7.2.2.3 Summary of Significant Findings from the VOC Field
Comparisons ......................................................... 35 7.2.3 Field Comparison Results for Inorganic and Selected Organic
Constituents ........................................................................ 35 7.2.3.1 Graphical Analysis of Inorganics and Selected Organic
Constituents .......................................................... 36 7.2.3.2 Statistical Analysis of Inorganic and Selected Organic
Constituent Results .................................................. 39 7.2.3.3 Summary of Significant Findings from the Inorganic
and Selected Organic Constituent Field Comparisons ........ 41 7.3 COMPARISON OF RESULTS TO PREVIOUS STUDIES ....................... 41 7.4 SUMMARY OF DEPLOYMENT CONSIDERATIONS .......................... 42
8.0 COST ASSESSMENT ............................................................................. 45 8.1 COST MODEL ............................................................................ 45 8.2 COST DRIVERS .......................................................................... 46 8.3 COST ANALYSIS ........................................................................ 46
8.3.1 Basic Assumptions ................................................................ 47 8.3.2 Cost Comparison per Sample ................................................... 47 8.3.3 Cost Comparison per Site ....................................................... 48
9.0 IMPLEMENTATION ISSUES ................................................................... 51 9.1 RCDM SAMPLER DOCUMENTS .................................................... 51 9.2 LESSONS LEARNED .................................................................... 51
10.0 REFERENCES ...................................................................................... 53 APPENDIX A POINTS OF CONTACT......................................................................... A-1

iii
LIST OF FIGURES
Page Figure 1. Diffusion across a membrane (Fick’s Law of Diffusion). ...................................... 9Figure 2. Construction of an RCDM sampler. ..................................................................... 10Figure 3. RCDM and PDB sampling. ................................................................................... 24Figure 4. RCDM sampler versus PDB sampler results for vinyl chloride. .......................... 30Figure 5. RCDM sampler versus LF results for vinyl chloride. ........................................... 31Figure 6. RCDM sampler versus PDB sampler results for ethylbenzene. ........................... 31Figure 7. RCDM sampler versus LF results for ethylbenzene. ............................................ 32Figure 8. RCDM sampler versus PDB sampler results for n-butylbenzene. ........................ 34Figure 9. RCDM sampler versus LF results for n-butylbenzene. ........................................ 35Figure 10. RCDM sampler versus LF results for calcium. .................................................... 36Figure 11. RCDM sampler versus LF results for chloride. .................................................... 37Figure 12. RCDM sampler versus LF results for manganese. ............................................... 37Figure 13. RCDM sampler versus LF results for iron. ........................................................... 38Figure 14. RCDM sampler versus LF results for sulfide. ...................................................... 39

iv
LIST OF TABLES
Page Table 1. Advantages and limitations of the technology. ..................................................... 13Table 2. Performance objectives. ........................................................................................ 15Table 3. List of sampled sites. ............................................................................................. 17Table 4. Summary of all bench-scale testing results: suitability and equilibration
times of all chemicals tested. ................................................................................ 20Table 5. Periods of field comparisons at demonstration sites. ............................................ 21Table 6. Chemical constituents tested for in samples from the field demonstrations. ........ 23Table 7. Expected performance and performance confirmation methods. ......................... 27Table 8. Statistical comparison of VOC concentrations recovered by the RCDM
sampler, PDB sampler, and LF using the Kruskal-Wallis rank sum test. ............. 33Table 9. Statistical comparison of inorganic and selected organic constituent
concentrations recovered by the RCDM sampler and LF using the Wilcoxon signed rank test. .................................................................................................... 40
Table 10. Cost model for RCDM samplers. .......................................................................... 45Table 11. Comparison of material costs, construction labor costs, and field sampling
labor costs for RCDM samplers, PDB samplers, and LF. .................................... 48Table 12. Comparison of sampling costs over a 30-year period for RCDM samplers,
PDB samplers, and LF. ......................................................................................... 48

v
ACRONYMS AND ABBREVIATIONS µS/cm microsiemens per centimeter Å Angstroms AFB Air Force Base ANOVA analysis of variance BTEX benzene, toluene, ethylbenzene, and xylenes DOC dissolved organic carbon DoD Department of Defense ESTCP Environmental Security Technology Certification Program HMX octahydro-1,3,5,7-tetranitro-1,3,5,7-tetrazocine ITRC Interstate Technology & Regulatory Council LDPE low-density polyethylene LF low-flow purging LRL laboratory reporting level MDL minimum detection limit MNA monitored natural attenuation MTBE methyl tert-butyl ether NAES Naval Air Engineering Station NAWC Naval Air Warfare Center NBVC Naval Base Ventura County NAVFAC ESC Naval Facilities Engineering Command/Engineering Service Center NJDEP New Jersey Department of Environmental Protection NTU nephelometric turbidity units PAH polycyclic aromatic hydrocarbons PCB polychlorinated biphenyls PDB polyethylene diffusion bag PVC polyvinyl chloride QA/QC quality assurance/quality control RCDM regenerated cellulose dialysis membrane RDX hexahydro-1,3,5-trinitro-1,3,5-triazine

ACRONYMS AND ABBREVIATIONS (continued)
vi
TDS total dissolved solids TNT 2,4,6-trinitrotoluene SERDP Strategic Environmental Research and Development Program USEPA U.S. Environmental Protection Agency USGS U.S. Geological Survey VOC volatile organic compound

Technical material contained in this report has been approved for public release.
vii
ACKNOWLEDGEMENTS Thomas Imbrigiotta of U.S. Geological Society (USGS) and Joey Trotsky of Naval Facilities Engineering Command/Engineering Service Center (NAVFAC ESC) both contributed to the writing of this report. Matt Place of Battelle and John Dupont of DHL Analytical were responsible for arranging the efficient and consistent analysis of the samples collected in this study. Jeff Dale of the U.S. Navy was instrumental in encouraging and supporting the initial work on dialysis diffusion samplers at the Naval Air Warfare Center (NAWC) West Trenton, NJ site that eventually led to this demonstration. Michael Figura of the U.S. Navy supplied well construction information and water quality data and arranged access to the wells sampled at Naval Air Engineering Station (NAES) Lakehurst, NJ. Ernest Lory, Dale Lorenzana, and Joseph Saenz of the U.S. Navy supplied well construction information and water quality data and arranged access to the wells sampled at Naval Base Ventura County (NBVC) Port Hueneme, CA. Steve Granade of the U.S. Navy supplied well construction information and water quality data and arranged access to wells sampled at NBVC Point Mugu, CA. Eric Best, Rob Rosman, Bonnie Gray, and Christine Wieben of the USGS helped in the collection of samples for this project. Theodore Ehlke of USGS and Ron Hoeppel of NAVFAC ESC were instrumental in conceiving, proposing, and obtaining funding for this project.

This page left blank intentionally.

1
1.0 EXECUTIVE SUMMARY
1.1 BACKGROUND
This Cost and Performance Report documents the demonstration and validation of regenerated cellulose dialysis membrane (RCDM) diffusion samplers for use in collecting groundwater samples for a range of inorganic and organic water quality parameters. This project, ER-0313, was funded by the Environmental Security Technology Certification Program (ESTCP).
1.2 OBJECTIVES OF THE DEMONSTRATION
The primary objectives of the project were (1) to determine the usefulness of RCDM samplers in collecting a range of organic and inorganic water quality constituents from groundwater, (2) to determine the optimum equilibration times for these constituents to diffuse into the RCDM sampler, (3) to compare water quality results and sampling costs from samples collected with RCDM samplers to samples collected with a low-flow purging (LF) technique and polyethylene diffusion bag (PDB) samplers, and (4) to transfer the technology while gaining regulatory acceptance. Equilibration times were determined in bench-scale testing for major cations and anions, a suite of trace elements, volatile organic compounds (VOC), and several natural attenuation parameters. Field comparisons were conducted at three Department of Defense (DoD) sites: (1) Naval Air Engineering Station (NAES) Lakehurst, NJ; (2) Naval Base Ventura County (NBVC), Port Hueneme and Point Mugu, CA; and (3) Naval Air Warfare Center (NAWC) West Trenton, NJ. Samples collected with the three sampling techniques were compared graphically and statistically to determine the significance of any differences found.
1.3 DEMONSTRATION RESULTS
Seven bench-scale equilibration tests were conducted that evaluated 22 cations and trace elements, 59 VOCs, six anions, silica, dissolved organic carbon, methane, and sulfide using groundwater collected from the three field sites. Greater than 95% equilibrium was reached in RCDM samplers within 1 to 3 days for all VOCs, all anions, silica, dissolved organic carbon, methane, and sulfide, and within 3 to 7 days for most cations and trace elements. RCDM samplers equilibrated in a slightly shorter time period when inorganic constituent concentrations were higher. Lower temperatures were found to have a small effect in that they lengthened equilibration times for several inorganic constituents from 3 days to 7 days and several VOCs from 1 day to 3 days. The only parameters that did not equilibrate in 7 days or less in the RCDM samplers were mercury, silver, and tin, which all took greater than 28 days to equilibrate. Because of their longer equilibration times, mercury, silver, and tin were not evaluated in the field comparisons. No trace elements or VOC concentrations were detected in the bench-scale test blanks, indicating that there was no desorption of any of these constituents from the dialysis membrane. Coefficients of variation for triplicate RCDM sampler analyses were generally less than 10% for most inorganics and less than 18% for all VOCs. Based on the results of the bench-scale testing, a 7-day equilibration time was chosen for RCDM samplers in the field demonstration. The experimental design of the field demonstration was to sample groundwater from six to eight wells per site at the three DoD sites with each of three sampling methodsCthe RCDM sampler,

2
the PDB sampler, and LF using a variable-speed submersible pump. Samples were collected at the same depth in each well using all three sampling techniques. In all cases, the RCDM and PDB samplers were suspended in a well at the estimated depth of highest mass flux through the open interval and were allowed to equilibrate for at least one week. After the diffusion samplers were retrieved and sampled, the pump was lowered to the same depth and the well was sampled using a LF procedure that included the monitoring of field parameters to stability prior to sample collection. All samples were analyzed at the same laboratory for the same suite of inorganic and organic water quality constituents. Results of the analyses for VOCs showed excellent agreement between concentrations collected with RCDM samplers and PDB samplers and between concentrations collected with RCDM samplers and LF. For all 24 VOCs detected in the field demonstration, statistical testing showed RCDM samplers recovered median concentrations that were not significantly different from median concentrations recovered by PDB samplers. For 21 of 24 VOCs detected in the field demonstration, identical statistical testing showed RCDM samplers recovered median concentrations that were not significantly different from median concentrations recovered by LF. Results of the analyses for most inorganic constituents also showed excellent agreement between concentrations collected with RCDM samplers and LF. For 28 of 30 inorganic constituents, statistical testing showed RCDM samplers recovered median concentrations of inorganic constituents that were not significantly different from median concentrations recovered by LF. Water samples collected with RCDM samplers were found to cost 73% less than samples collected by LF ($83 versus $311 per sample). The largest portion of these savings was in field sampling time (and hence field labor costs). The field labor costs were reduced by 84% when RCDM samplers were used compared to LF. Besides being able to collect samples more inexpensively for a wide variety of inorganic and organic constituents in ground water, RCDM samplers were found to have the additional advantages that they (1) were easily constructed and deployed, (2) eliminated the production of essentially all purge water when sampling a well, (3) eliminated the need for field filtration of groundwater samples, and (4) eliminated cross-contamination between wells because they were disposable. Limitations of the technology were found to be minimal. Samplers made with RCDM must be kept hydrated between the time they are constructed and deployed. RCDM samplers should be limited to deployments of 4 weeks or less if groundwater temperatures are 15°C or greater due to the possibility of biodegradation of the membrane over this time frame. RCDM samplers lose 3% of their volume per week due to the dialysis process. However, since equilibration times for most parameters are 1-2 weeks, the limitations of biodegradation and water volume loss are minimized. RCDM samplers do not equilibrate effectively with mercury, silver, or tin. RCDM samplers appear to give correct to overestimates of iron and sulfide concentrations in some wells, so values of these parameters measured with these samplers should be considered estimates.
1.4 IMPLEMENTATION ISSUES
Regulatory agency acceptance is currently on a case-by-case basis. The RCDM sampler is not currently manufactured commercially. An ESTCP Final Technical Report (Imbrigiotta et al., 2007) and an ESTCP Protocol Report (Imbrigiotta et al., 2009) on construction and use of RCDM samplers are available on the Strategic Environmental Research and Development

3
Program (SERDP) and ESTCP website for this project (ER-0313) at (www.serdp-estcp.org). Additional information on the application, construction, and use of RCDM samplers is available in Interstate Technology & Regulatory Council (ITRC) Guidance Documents DSP-4 and DSP-5 (ITRC, 2005; ITRC, 2007)

This page left blank intentionally.

5
2.0 INTRODUCTION
2.1 BACKGROUND
Collection of groundwater samples for long-term monitoring or to assess remedial progress at contaminated DoD sites is very costly in terms of manpower, time, and equipment requirements. Currently, the standard technique for groundwater collection is the U.S. Environmental Protection Agency’s (USEPA) LF procedure using a variable-speed submersible pump with disposable discharge tubing (Puls and Barcelona, 1996). The low-flow procedure requires a monitoring well to be pumped at low-flow rates (500-1000 milliliters per minute [mL/min]) while field parameters are monitored to stability. Often this stabilization can take a long period of time (0.75 to 1.5 hours) before samples can be collected. Following sample collection, time and effort must be spent decontaminating the pump and its components before it can be used in another well to prevent cross-contamination. Disposal of both contaminated purge water and wash water is also costly since they must be collected and transported off site to treatment facilities for proper disposal. An additional problem in collecting groundwater samples with portable pumps or bailers is that the installation and removal of these sampling devices frequently results in increased turbidity in the groundwater brought to the surface. LF requires that turbidity be monitored until it is less than 10 nephelometric turbidity units (NTU) or becomes stable prior to sample collection. If turbidity is stable but exceeds 5-10 NTU, serious bias can result for many contaminants that sorb readily onto suspended particulates (Gibs et al., 2000). This introduces uncertainty into the assessment of inorganic and organic contaminant concentrations in groundwater, which can result in incorrect conclusions concerning the water quality or remediation status of a site. Diffusion sampler technology has been evolving over several decades and has shown promise as a way to reduce groundwater sampling field time, equipment decontamination costs, and purge-water treatment costs, as well as a way to avoid the potential problems caused by turbidity in wells. All diffusion membrane samplers developed to date involve suspending a container made of a semi-permeable membrane filled with high-purity water at a given depth in the water column of a well. The system operates on the principle that given the proper amount of time, diffusion of dissolved chemical species across a semi-permeable membrane will occur until concentrations inside the sampler are equivalent to those in the water outside the sampler in a well. The diffusion membrane sampler is then brought to the surface and the enclosed water sample is transferred to sample bottles for analysis. Diffusion membrane samplers have sufficiently small membrane pores so that they do not allow the passage of suspended particulates into the sampler. One design developed for a diffusion membrane sampler consists of a series of short, open-ended rigid polypropylene cylinders with hydrophilic cellulose acetate or polysulfone flat filter membranes covering each end (Ronen et al., 1987; Magaritz et al., 1989). This sampler is restricted in the volume of sample it can collect at a depth because the rigid cylinders must be less than the diameter of the well. Another diffusion membrane sampler design consists of a tubular-shaped bag made of flexible low-density polyethylene (LDPE) (Vroblesky, 2001a, 2001b). The LDPE tube is heat-sealed on one end, filled with high-purity water, heat-sealed at the top, and then suspended in a well to equilibrate for 2 weeks. This type of diffusion membrane sampler, unlike the short cylinder configurations, is inexpensive, can be made to any

6
length to accommodate larger sample volume requirements, and can be constructed from small-diameter LDPE tubing that fits into small-diameter wells. These PDB samplers have been shown to be useful only for collection of VOCs (such as, chlorinated solvents and benzene, toluene, ethylbenzene, and xylenes [BTEX] compounds) because of the hydrophobic nature of the membrane material. The PDB sampler cannot be used for collection of inorganic contaminants (such as trace metals or other dissolved ionic species), inorganic parameters useful for monitored natural attenuation (MNA) (such as nitrate, iron, sulfate, or alkalinity), highly soluble organic compounds (such as methyl tert-butyl ether [MTBE] or acetone), or most semi-volatile organic compounds (such as polychlorinated biphenyls [PCB] and polycyclic aromatic hydrocarbons [PAH]) (ITRC, 2004). Because it is usually necessary to collect samples for both inorganic and organic constituents when monitoring water quality and the progress of remediation at contaminated DoD sites, another diffusion membrane sampler design has recently been developed by the U.S. Geological Survey (USGS) (Imbrigiotta et al., 2002; Ehlke et al., 2004; Vroblesky et al., 2002; Vroblesky and Pravecek, 2002; Vroblesky et al., 2003). This type of diffusion membrane sampler is constructed from commercially available tubular RCDM. The dialysis membrane allows the passage of both dissolved inorganic and organic contaminants from groundwater into the sampler. The RCDM tubing can be purchased in a variety of diameters so the sampler may be configured to fit in both small- and large-diameter wells. The RCDM samplers can be made in various lengths to allow for the collection of a sufficient volume of water necessary for whatever analyses are of interest. The RCDM samplers are relatively low in cost, only slightly more than PDB samplers, and are disposable after one use. RCDM samplers have been used to sample wells for major cations, anions, and chlorinated VOCs. Demonstration of these RCDM diffusion samplers for additional inorganic and organic constituents was performed as part of this project.
2.2 OBJECTIVES OF THE DEMONSTRATION
The primary objectives of this demonstration project were as follows:
(1) To determine if RCDM samplers will collect valid samples for a variety of organic and inorganic chemical constituents relevant to DoD for which there is no current information available
(2) To determine the optimum equilibration period for these contaminants to diffuse into RCDM samplers
(3) To compare the sampling efficiency and cost of RCDM samplers to quantitatively recover these contaminants from wells at field sites with samples collected using a PDB sampler (for VOCs only), and the standard LF technique (for all groundwater constituents)
(4) To transfer the RCDM sampler technology to DoD and private end users and to gain regulatory acceptance.
Objectives (1) and (2) were addressed during the pre-demonstration bench-scale testing at the USGS facility in West Trenton, NJ. Objective (3) was addressed during the field comparison testing conducted at three field sites. Objective (4) was addressed by reporting on the results of

7
the demonstration both in written publications and presentations and in verbal presentations at DoD meetings and technical meetings.
2.3 REGULATORY DRIVERS
This demonstration responds to many DoD requirements, including (1) Navy 1.III.01.k Improved Field Analytical Sensors, Toxicity Assays, Methods, and Protocols to Supplement Traditional Sampling and Laboratory Analysis; (2) Air Force 124 Plume Location and Source Identification; (3) 131 Improved Remediation Monitoring Technologies; (4) 1608 Find and Track Organic Contaminant Plumes; (5) 1703 Technology to Track Transport and Fate of Heavy Metals; and (6) 2705 Methods to Reduce the Cost of Long-Term Monitoring. Other pertinent requirements include 1.III.02.n, 130, 145, 244, 246, 249, 254, 255, and 1701.

This page left blank intentionally.

9
3.0 TECHNOLOGY
3.1 TECHNOLOGY DESCRIPTION
3.1.1 Theory and Operation of RCDM Samplers
Most of the diffusion membrane samplers developed to date involve suspending a container made of a semi-permeable membrane and filled with high-purity water in the water column of a well. These devices operate on the principle that, given the proper amount of time, diffusion of dissolved chemical species across a semi-permeable membrane will occur until concentrations inside the sampler are equivalent to those in the groundwater. The ideal diffusion of chemicals through a membrane is described by Fick’s Law of Diffusion and is dependent primarily on the concentration gradient across the membrane, the thickness of the membrane, and the diffusion coefficient for each chemical (Figure 1). Factors such as molecular size, membrane pore size, the hydrophobic/hydrophilic nature of the membrane, and water temperature can also affect the ability and speed of diffusion of chemicals across a membrane.
Figure 1. Diffusion across a membrane (Fick’s Law of Diffusion).
Once the diffusion sampler has reached equilibrium, it is then brought to the surface and the enclosed water sample is transferred to sample bottles for transport to and analysis at a laboratory. All diffusion samplers have sufficiently small membrane pores so that they do not allow the passage of suspended particulates into the sampler.

10
3.1.2 Construction of RCDM Samplers
The RCDM samplers tested during this demonstration were constructed of regenerated cellulose. The membrane was obtained from Membrane Filtration Products, Inc., Seguin, TX.1
The membrane has a nominal molecular weight cutoff of 8000 Daltons with a pore size of 18 Angstroms (Å). The 100-mm width membrane has a filled diameter of 63.7 mm, a volume of 31.8 milliliters per centimeter (mL/cm), and comes in rolls 5 m in length. The 50-mm width membrane has a filled diameter of 31.8 mm, a volume of 7.94 mL/cm, and comes in rolls 10 m in length. The membrane was pre-cleaned by the manufacturer to remove trace metals and sulfides. The membrane was cut into lengths appropriate for the volume needed for analyses at a particular well and site.
Various components of the RCDM sampler are shown in Figure 2. Figure 2a shows the sampler partially constructed prior to being filled with deionized water, and Figure 2b shows the completed sampler ready for deployment in a well. The polyvinyl chloride (PVC) sections are external to the membrane and are included to remove pressure from the ends of the membrane to prevent leakage. A second version of the RCDM sampler can be constructed with a perforated PVC tube inside the dialysis membrane to keep the membrane from collapsing in waters with high ionic strength. Both versions work on the same diffusion principle and sample the same chemical species.
Figure 2. Construction of an RCDM sampler.
(A) Partially assembled RCDM sampler, showing protective mesh and PVC pipe external to the membrane prior to filling. (B) Fully assembled RCDM sampler
after filling with deionized water.
3.1.3 Chronological Development of RCDM Samplers
In 2000, Ehlke et al. (2004) conducted laboratory studies using RCDM and demonstrated that water inside the membranes could equilibrate with selected inorganics and VOCs in test solutions. Imbrigiotta et al. (2002) used samplers constructed with these RCDMs in actual field sampling at the NAWC West Trenton, NJ, site 2000-2002. During three annual sampling events 1 The use of brand names in this report is for identification purposes only and does not imply endorsement by the USGS, the U.S. Navy, or Battelle.
A
B

11
(nine to 15 wells per event) at the NAWC site, using 1-week equilibration times, these RCDM samplers showed good correlation with LF and modified conventional purging (high-flow purging followed by LF) results for both chlorinated VOCs and selected inorganic constituents. The results of statistical analyses showed no significant difference at the 95% confidence level between sampling techniques for all constituents tested. Laboratory testing of RCDM equilibration times for selected anions and trace elements was also conducted by Vroblesky et al. (2002). They found that within 1-4 days all tested constituents reached equilibrium with the test groundwater in their experiments. Leblanc (2003) tested the dialysis membranes for permeability to explosive compounds and found that 75-80% equilibration of hexahydro-1,3,5-trinitro-1,3,5-triazine (RDX) and octahydro-1,3,5,7-tetranitro-1,3,5,7-tetrazocine (HMX) concentrations were reached within 12 days at 4°C. Harter and Talozi (2004) that found equilibration of specific conductance and nitrate was attained in 1-4 days at 21°C. Also, Parker and Mulherin (2006) conducted laboratory equilibration tests for HMX, 1,3,5-trinitrobenzene, RDX, and 2,4,6-trinitrotoluene (TNT) at room temperature and found these explosive compounds equilibrated in dialysis membrane samplers within 7 to 14 days. RCDM samplers have also been successfully tested in the field on a limited basis at Naval Air Station Fort Worth Joint Reserve Base, TX (Vroblesky et al., 2002); at Hickam Air Force Base (AFB); Hawaii (Vroblesky and Pravecek, 2002); and at Andersen AFB, Guam (Vroblesky et al., 2003). These tests involved comparing RCDM samplers to PDB samplers for fuel-related VOCs and to LF for selected inorganic ions and trace elements. Their results showed good comparability for the RCDM samplers to the other sampling techniques for most compounds tested using a 2-week equilibration period. The authors pointed out that a shorter equilibrium period may have been possible for the RCDM samplers and would be advantageous so as to minimize the potential for membrane biodegradation, iron fouling, and gradual loss of sampler water volume. Studies conducted by various researchers (Ehlke et al., 2004; Ronen et al., 1987; Magaritz et al., 1989; Vroblesky et al., 2002; Harter and Talozi, 2004) indicated that for most organic and inorganic chemical species, the equilibrium period is probably considerably less than 2 weeks. Harter and Talozi (2004) found that nitrate and specific conductance were sampled equally well by RCDM samplers and a conventional purging method. A study comparing a number of different diffusion samplers and purging technologies was conducted in 20 wells at McClellan AFB, Sacramento, CA (Parsons, 2005). RCDM samplers, PDB samplers, rigid porous polyethylene samplers, polysulfone samplers, a downhole thief sampler, a disposable point-source bailer sampler, LF, and conventional purging were compared in samples analyzed for anions; trace metals; hexavalent chromium; 1,4-dioxane; and VOCs. Results of the Parsons (2005) study indicated that RCDM samplers recovered concentrations of VOC; anions; 1,4-dioxane; and hexavalent chromium as well as or better than LF. Parsons (2005) noted that RCDM samplers generally recovered lower concentrations of trace metals than LF in their tests, although results for specific trace metals were not given. Overall, the RCDM sampler was rated equal to LF in Parsons (2005).

12
3.1.4 Summary of Development of RCDM Samplers Conducted under This ESTCP Project
The basic form of the RCDM sampler developed in Ehlke et al. (2004) and Imbrigiotta (2002) was refined for use in this demonstration. Some improvements in the construction technique were made to produce the RCDM sampler shown in Section 3.1.2 that was used in this study. During the pre-demonstration portion of this project, extensive bench-scale testing of the RCDM sampler was conducted to determine if a number of previously untested chemicals would diffuse through the dialysis membrane and how quickly the concentrations of these chemicals would equilibrate inside the sampler. The results of the pre-demonstration laboratory testing are discussed in Section 7.3 of this report.
3.1.5 Expected Applications of RCDM Samplers
The use of RCDM samplers should be advantageous over LF to sample wells in the following situations:
• At sites where large numbers of long-term monitoring wells must be sampled for both inorganics and VOCs
• Where it would be difficult or impossible to bring in a pump and its power source (wells in remote wilderness areas, wells inside buildings)
• Where normal sampling activities would be extremely hazardous or inconvenient (wells in high traffic areas, wells in airport runway areas)
• Where it would be advantageous for sampling personnel to spend as short a period on site as possible (residential areas near military bases)
• Where collection, transport, and treatment of purge water would be costly, difficult, or undesirable due to safety concerns (wells at all hazardous waste sites, wells at remote hazardous waste sites, wells in populated areas near military bases)
• Where wells still have water with high turbidity even after purging due to their construction or the formation they are completed in (incorrect screen size or incorrect particle size of the filter pack for the formation).
3.2 ADVANTAGES AND LIMITATIONS OF THE TECHNOLOGY
The advantages and limitations of the RCDM sampler, the PDB sampler, and LF are shown in Table 1.
13
Table 1. Advantages and limitations of the technology.
RCDM Sampler PDB Sampler LF Advantages
No purge water is produced to drum, transport, or treat.
No purge water is produced to drum, transport, or treat.
Purge water is produced to drum, transport, and treat.
No particulates can pass through the membrane so no sample filtration is necessary.
No particulates can pass through the membrane so no sample filtration is necessary.
Turbidity is minimized but not eliminated so sample filtration is still recommended.
Sampler is disposable so no decontamination is needed between wells.
Sampler is disposable so no decontamination is needed between wells.
Pump must be decontaminated between wells.
Time in field is minimized for field personnel.
Time in field is minimized for field personnel.
Time in field can be 0.75-1.5 hours waiting for field parameters to stabilize.
Dialysis membrane is fairly inexpensive, slightly more than LDPE but still far less than the cost of a pump setup.
LDPE membrane is very inexpensive.
Initial investment in pump setup is expensive (pump, control box, generator, extension cords, and tubing).
It can be used to sample for both inorganic and organic dissolved chemical species.
It can be used to sample for VOCs and methane.
It can be used to sample for both inorganic and organic dissolved chemical species.
Limitations Pre-cleaned dialysis membrane must be kept wet in preservative solution prior to use.
LDPE membrane does not need to be cleaned and can be kept dry or wet prior to use.
Pump must be cleaned prior to use.
RCDM samplers lose water with time due to the nature of the dialysis process.
LDPE samplers do not lose water with time.
Not applicable
Dialysis membranes are subject to attack by bacteria and fungi.
LDPE membranes are not attacked by bacteria and fungi.
Pumps are not affected by bacteria and fungi.
Sample volume is finite. Sample volume is finite. Sample volume is not limited. RCDM samplers do not equilibrate with mercury, tin, or silver; sometimes they give overestimates of iron and sulfide concentrations.
PDB samplers cannot be used to sample for any inorganic species.
No limitations
The limitations of the RCDM sampler indicated in Table 1 with respect to the loss of water volume with time and the potential attack of the membrane by bacteria or fungi are not significant considerations when the equilibration time needed for the sampler is short (<14 days). Results of tests conducted as part of this investigation supporting this statement will be discussed in more detail in sections later in this report.

This page left blank intentionally.

15
4.0 PERFORMANCE OBJECTIVES
The overall performance objective of this demonstration project was to evaluate the performance of RCDM samplers versus LF and PDB samplers and to compare their costs. The performance was evaluated by comparing the water quality results from samples collected at the same depth using the three sampling techniques in a series of wells at three test sites. The primary performance objectives, data requirements, success criteria, and results achieved are tabulated in Table 2.
Table 2. Performance objectives. Performance Objective Data Requirements Success Criteria Results Qualitative Performance Objectives Determine if RCDM samplers recover same chemical parameters as PDB samplers and LF.
Identify chemical parameters recovered by RCDM samplers, PDB samplers, and LF.
Chemical parameters detected in PDB and LF are the same detected by RCDM samplers.
Criteria met
Determine if RCDM membrane integrity is maintained over the course of equilibration.
Observe sampler membranes for perforations.
No perforations noted during the course of the test.
Criteria met
Quantitative Performance Objectives Determine if RCDM samplers recover the same concentrations as LF.
Measure inorganic and organic compound concentrations recovered by RCDM samplers and LF.
NSD at p<0.05 between chemical concentrations recovered by the RCDM samplers and LF.
Criteria met for 96% of all chemicals tested
Determine if RCDM samplers recover the same concentrations as PDB samplers.
Measure VOC concentrations recovered by RCDM samplers and PDB samplers.
NSD at p<0.05 between VOC concentrations recovered by the RCDM sampler and the PDB sampler.
Criteria met for 100% of all chemicals tested
Determine if RCDM samplers can sample low concentrations.
Measure concentrations of chemicals near detection limits.
Concentrations within 2-5 times the detection limit can be detected.
Criteria met
Determine if RCDM samplers take significantly less field time to collect samples than LF.
Measure time needed to collect samples using RCDM samplers and LF.
Comparison of field time required to sample RCDM samplers versus LF should be 5 times shorter.
Criteria met
NSD at p<0.05, No significant difference at the 95% confidence level

This page left blank intentionally.

17
5.0 SITE DESCRIPTIONS
5.1 SITE LOCATIONS
Field comparison demonstrations were done at the same three sites that were sampled for the pre-demonstration portion of this projectCNAES Lakehurst, NJ; NBVC, Port Hueneme and Point Mugu, CA; and NAWC West Trenton, NJ. These sites were chosen for the following reasons:
• The geology and hydrology of the sites were well characterized.
• The construction of wells installed at the sites were well documented and met recommended minimum standards (ITRC, 2004).
• The sites had water-quality analyses for a range of inorganic and organic contaminants of interest to this project.
• The groundwater at the sites had a wide range of concentrations of contaminants. Based on these criteria, the chemical constituents analyzed in samples collected from the three sites and the concentration ranges of the chemical constituents are shown in Table 3.
Table 3. List of sampled sites.
Site Chemical Constituents Concentration Ranges NAES, Lakehurst, NJ Trace metals, BTEX VOCs VOCs <1-700 µg/L
Trace metals <1-40,000 µg/L Methane <1-5600 µg/L Sulfide <10-1300 µg/L TDS <10-280 mg/L
NBVC, Port Hueneme, CA NBVC, Point Mugu, CA
BTEX, MTBE Trace metals
VOCs <1-8000 µg/L Trace metals <1-7000 µg/L Methane <1-3000 µg/L Sulfide <10-7500 µg/L TDS 744 to 2320 mg/L
NAWC, West Trenton, NJ Chlorinated VOCs, trace metals, monitored natural attenuation parameters (sulfide, methane)
VOCs <1-32,000 µg/L Trace metals <1-7700 µg/L Methane <1-50 µg/L Sulfide <10-120 µg/L TDS 58 to 485 mg/L
µg/L = micrograms per liter TDS = total dissolved solids
5.2 SITE GEOLOGY/HYDROGEOLOGY
NAES Lakehurst, NJ is located approximately 15 miles west of the Atlantic coast in south-central New Jersey. The wells that were sampled for the field demonstration are screened in a shallow, unconsolidated sand-and-gravel aquifer in the coastal plain of New Jersey. Groundwater flows generally west to east towards a wetland area on the eastern side of the base.

18
NBVC, Port Hueneme, and Point Mugu are located within 1 mile of the Pacific coast near Oxnard, CA. The wells that were sampled as part of the demonstration are screened in a shallow sand-and-gravel aquifer. Groundwater generally flows from northeast to southwest towards the Pacific Ocean. NAWC is located 5 miles north of Trenton in west-central New Jersey. The wells that were sampled as part of the demonstration are fractured bedrock wells set in the Lockatong formation of the Newark Basin, which is composed primarily of mudstones and siltstones. Groundwater flow is generally northeast to southwest across the site along the strike of the bedrock fractures towards the Delaware River.
5.3 CONTAMINANT DISTRIBUTION
The primary types of contaminants present at the NAES Lakehurst site are aromatic VOCs (BTEX compounds) and trace metals. These contaminants were caused primarily by motor pool activities and leaking underground fuel tanks. The groundwater at this site had fairly low ionic strength with total dissolved solids (TDS) concentrations ranging from <10 to 280 mg/L. The main contaminants at NBVC Port Hueneme are aromatic VOCs (BTEX compounds) and MTBE originating from leaks in the tanks of the base gasoline station. The contaminants of concern at NBVC Point Mugu are trace metals as a result of metal plating activities. The groundwater at the NBVC sites had fairly high ionic strength with TDS concentrations ranging from 744 to 2320 mg/L. The primary chemicals of concern at NAWC are chlorinated VOCs and monitored natural attenuation parameters, such as methane, carbon dioxide, sulfide, sulfate, and dissolved iron. The chlorinated VOC contamination resulted from leakage from an air temperature control system that used trichloroethene as the heat transfer medium. The groundwater at this site had fairly low ionic strength with TDS concentrations ranging from 58 to 485 mg/L.

19
6.0 TEST DESIGN
6.1 CONCEPTUAL EXPERIMENTAL DESIGN
The experimental design of the field demonstration was to sample groundwater from six to eight wells per test site at the three DoD test sites with each of three sampling methods—the RCDM sampler, the PDB sampler, and LF using a variable-speed submersible pump. The plan was to suspend both the RCDM sampler and PDB sampler at the same depth in each well and allow them to equilibrate for the length of time determined in the bench-scale tests. After equilibration, both diffusion samplers were retrieved and sampled. A submersible pump was then to be lowered to the same depth in the same wells and a LF protocol was followed (minimal drawdown, field parameters monitored to stability) before samples were collected. This procedure allowed the collection of samples using all three sampling techniques on the same day from the same depth in the wells. All analyses were completed at one DoD-approved laboratory using identical analytical methods for samples at all three sites. Analytical results were compared by parameter both graphically (using 1:1 correspondence plots) and statistically (using non-parametric tests and analysis of variance [ANOVA] techniques) to determine if there were significant differences between samples collected with each sampling method by chemical constituent. Results for chemical constituents present at more than one site were combined to increase the power of the statistical comparisons to determine if differences existed between sampling methods.
6.2 BASELINE CHARACTERIZATION
Groundwater samples were collected from wells at each of the test sites once before the actual field comparison testing was conducted. The results of these sample analyses gave an idea of the general groundwater chemistry at each site and the current contaminant concentrations present in the groundwater at each site. Concentrations typically ranged from the detection limit up to two to four orders of magnitude higher for most chemical constituents. Groundwater with a range of ionic strengths (TDS from 32 to 2080 mg/L), pH’s (4.8 to 8.9), temperatures (13.1 to 25.4°C), and dissolved oxygen concentrations (<0.1 to 9.3 mg/L) were sampled in the field comparison studies.
6.3 TREATABILITY OR LABORATORY STUDY RESULTS
During the pre-demonstration portion of this project, water samples from the chosen field sites were collected and brought back to the laboratory to conduct bench-scale equilibration tests. Seven bench-scale equilibration tests were conducted that evaluated 22 cations and trace metals, 59 VOCs, six anions, silica, dissolved organic carbon, methane, and sulfide. During the bench-scale testing, RCDM samplers filled with deoxygenated deionized water were placed into containers containing groundwater field samples that had been spiked with known concentrations of the chemicals being tested. Groundwater test solutions were stirred once per day for the duration of the testing to minimize any concentration stratification. After specified times (0, 1, 3, 7, 14, and 28 days of equilibration), an RCDM sampler was removed and sampled. A sample of the groundwater test solution was also collected at each time step. Concentrations of chemicals inside the sampler were compared to concentrations of chemicals outside the sampler at each time step. Time to equilibrium was defined as the time needed for the concentration

20
inside the RCDM sampler to be at least 95% of the concentration in the groundwater test solution outside the sampler. Initially, all tests were run at room temperature (21°C). However, because groundwater temperatures across the continental U.S. are usually lower than this, parts of several tests were conducted at 10°C in an incubator. In addition, the effect of concentration was evaluated by varying the concentrations of the chemical constituents used in portions of selected tests. The equilibration times determined for the chemical constituents in the bench-scale tests were used to guide the time needed for the RCDM samplers to equilibrate in the wells during the field demonstration. The findings of all pre-demonstration plan bench-scale testing are summarized in Table 4. In general, most inorganic and organic parameters tested equilibrated within 1-7 days. For most constituents the effects of concentration and temperature were unimportant. Only a few parameters showed slightly faster equilibration at higher concentrations or higher temperatures.
Table 4. Summary of all bench-scale testing results: suitability and equilibration times of all chemicals tested.
Favorable Bench-Scale Equilibration Testing Results
VOCs (1-3 day equilibration times at 10°C and 21°C) 1,1,1-Trichloroethane cis-1,2-Dichloroethene 1,2-Dibromo-3-chloropropane 1,1,2,2-Tetrachloroethane Dibromomethane 1,3,5-Trimethylbenzene 1,1,2-Trichloroethane Dichlorodifluoromethane 1,3-Dichloropropane 1,1-Dichloroethene Ethylbenzene 2,2-Dichloropropane 1,2,3-Trichloropropane m-Xylene 2-Chlorotoluene 1,2,4-Trimethylbenzene Naphthalene 4-Chlorotoluene 1,2-Dibromoethane o-Xylene Bromobenzene 1,2-Dichlorobenzene p-Xylene Bromochloromethane 1,2-Dichloroethane Tetrachloroethene Bromomethane 1,2-Dichloropropane Toluene Hexachlorobutadiene 1,3-Dichlorobenzene trans-1,2-Dichloroethene Isopropylbenzene 1,4-Dichlorobenzene Trichloroethene Methyl tert-butyl ether Benzene Trichlorofluoromethane Methylene chloride Bromodichloromethane Vinyl chloride n-Butylbenzene Bromoform 1,1,1,2-Tetrachloroethane n-Propylbenzene Carbon tetrachloride 1,1-Dichloroethane p-Isopropyltoluene Chlorobenzene Dibromochloromethane sec-Butylbenzene Chloroethane 1,1-Dichloropropene Styrene Chloroform 1,2,3-Trichlorobenzene tert-Butylbenzene Chloromethane 1,2,4-Trichlorobenzene Cations and Trace Elements (1-7 day equilibration times at 10°C and 21°C ) Calcium Barium Molybdenum Magnesium Cadmium Nickel Potassium Chromium Selenium Sodium Copper Vanadium Aluminum Iron Zinc Arsenic Lead Antimony Manganese

21
Table 4. Summary of all bench-scale testing results: suitability and equilibration times of all chemicals tested (continued).
Favorable Bench-Scale Equilibration Testing Results
Anions (1-3 day equilibration times at 21°C) Bicarbonate/alkalinity Chloride Nitrate Bromide Fluoride Sulfate Other Constituents (1-3 day equilibration times at 10°C and 21°C ) Dissolved organic carbon Silica Methane Sulfide
Unfavorable Bench-Scale Equilibration Testing Results (Greater than 28 day equilibration times at 10°C and 21°C ) Mercury Silver Tin
The only exceptions to these general findings were the inorganic parameters of mercury, tin, and silver, which took more than 28 days to equilibrate. The reasons mercury, silver, and tin did not equilibrate within the same time frame as all the other cations and trace elements tested are uncertain. All three were severely affected by the colder test temperature (10°C). These metals are known to form complexes with humic and fulvic acids present in natural waters. It is possible that these complexes take longer to diffuse through the dialysis membrane. Organic complexes would be expected to move slower than smaller ions at reduced temperatures. It is also possible that these metals became associated with colloidal-sized particles, which were larger than the pore size of the dialysis membrane and therefore were physically prevented from diffusing through the membrane. Because of long equilibration times, mercury, silver, and tin were not evaluated in the field comparisons.
6.4 FIELD TESTING
6.4.1 Field Comparison Testing Periods
Field comparison testing took place at each of the field sites during the time periods given in Table 5. Four field demonstrations were conducted at the three field sites. The RCDM and PDB samplers were deployed in the test wells at least one week prior to the collection of samples. On the sample collection date, the RCDM and PDB samplers were removed from the test wells and sampled prior to the pump installation and collection of samples by LF.
Table 5. Periods of field comparisons at demonstration sites.
Site Diffusion Sampler Deployment Dates Sample Collection Dates
NAES, Lakehurst, NJ December 14, 2004 December 21-22, 2004 NBVC, Port Hueneme, CA NBVC, Point Mugu, CA
February 22-24, 2005 March 2-4, 2005
NAWC, West Trenton, NJ April 19-21, 2005 April 26, 2005 and May 4-5, 2005
NAES, Lakehurst, NJ June 29, 2005 July 6-8, 2005
22
6.4.2 Sampler Construction and Deployment
RCDM samplers and PDB samplers were constructed in the USGS laboratory in West Trenton, NJ, within one week of being deployed in wells at each field site. For the sites in New Jersey, both types of diffusion samplers were stored in PVC tubes filled with nitrogen-sparged deionized water, and transported to the field site in these tubes. For the California site, both types of diffusion samplers were stored in flexible polyethylene tubes filled with nitrogen-spared deionized water, packed in a cooler, and delivered overnight to NAVFAC ESC in Port Hueneme. Diffusion samplers were deployed in wells at the depths of highest mass flux of the primary chemicals of concern at each site. Depths were chosen based on vertical profiling results, knowledge of the well construction, and water-chemistry results from the pre-demonstration plan sampling. Chemical vertical profiling was conducted on wells at each of the sites. Selected wells were hydraulically profiled with a borehole flow meter at the Lakehurst and West Trenton sites. At the Port Hueneme/Point Mugu site, packer test data of the open interval of selected wells was available from previous studies. RCDM and PDB samplers were deployed side by side in wells where the casing diameter allowed (6-inch wells) or as close as possible to one another vertically in wells where the diameter was too narrow (4-inch and 2-inch wells). Duplicate samplers were similarly deployed, side-by-side where possible or as close vertically as possible. For the first two field comparisons, PDB samplers were encased in a separate mesh bag and suspended just above or below the RCDM samplers. In the final two field comparisons, the PDB samplers were included in the top of the same mesh bag that held the RCDM sampler in an attempt to suspend them at more nearly the same depth. The low-flow purge pump was deployed at a depth that corresponded with approximately the center of the primary RCDM sampler in each well to try and sample the same zone in the well.
6.4.3 Tested Chemical Constituents
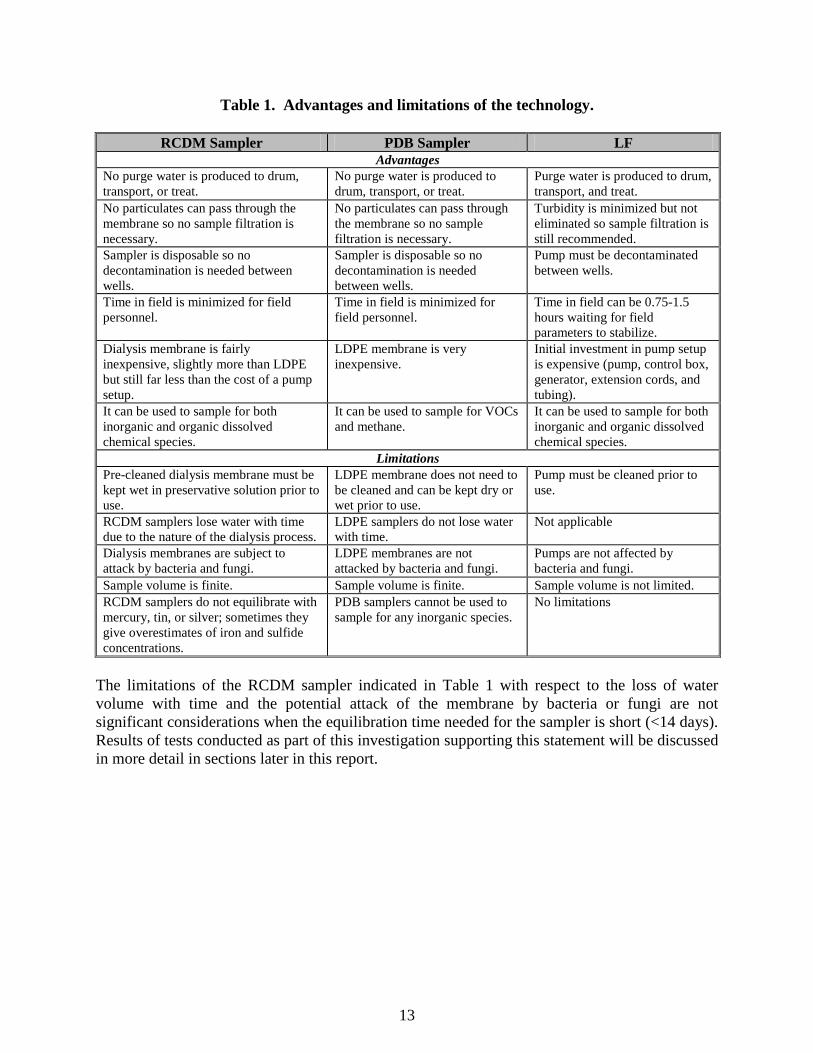
Samples were collected from each well at each site and analyzed for basically the same list of chemical constituents, which included major cations and anions, trace elements, VOCs, dissolved gases, sulfide, silica, total dissolved solids, and dissolved organic carbon. Some samples were not analyzed for all constituents on the list if it was known from past results that the water did not contain those constituents at measurable concentrations. Two chemical constituents, ethene and carbon dioxide, were not tested for equilibration times in the bench-scale tests but were measured in the field samples because they came out on the same dissolved gas analysis as methane. A complete list of sampled chemical constituents and their minimum detection limits (MDL) is given in Table 6.
23
Table 6. Chemical constituents tested for in samples from the field demonstrations. VOCs (MDLs 0.1-5.0 µg/L) 1,1,1-Trichloroethane cis-1,2-Dichloroethene 1,2-Dibromo-3-chloropropane 1,1,2,2-Tetrachloroethane Dibromomethane 1,3,5-Trimethylbenzene 1,1,2-Trichloroethane Dichlorodifluoromethane 1,3-Dichloropropane 1,1-Dichloroethene Ethylbenzene 2,2-Dichloropropane 1,2,3-Trichloropropane m-Xylene 2-Chlorotoluene 1,2,4-Trimethylbenzene Naphthalene 4-Chlorotoluene 1,2-Dibromoethane o-Xylene Bromobenzene 1,2-Dichlorobenzene p-Xylene Bromochloromethane 1,2-Dichloroethane Tetrachloroethene Bromomethane 1,2-Dichloropropane Toluene Hexachlorobutadiene 1,3-Dichlorobenzene trans-1,2-Dichloroethene Isopropylbenzene 1,4-Dichlorobenzene Trichloroethene Methyl tert-butyl ether Benzene Trichlorofluoromethane Methylene chloride Bromodichloromethane Vinyl chloride n-Butylbenzene Bromoform 1,1,1,2-Tetrachloroethane n-Propylbenzene Carbon tetrachloride 1,1-Dichloroethane p-Isopropyltoluene Chlorobenzene Dibromochloromethane sec-Butylbenzene Chloroethane 1,1-Dichloropropene Styrene Chloroform 1,2,3-Trichlorobenzene tert-Butylbenzene Chloromethane 1,2,4-Trichlorobenzene Acetone Cations and Trace Elements (MDLs 0.3-100 µg/L) Calcium (100 µg/L) Barium (3 µg/L) Molybdenum (2 µg/L) Magnesium (100 µg/L) Cadmium (0.3 µg/L) Nickel (3 µg/L) Potassium (100 µg/L) Chromium (2 µg/L) Selenium (2 µg/L) Sodium (100 µg/L) Copper (2 µg/L) Vanadium (3 µg/L) Aluminum (10 µg/L) Iron (50 µg/L) Zinc (2 µg/L) Arsenic (2 µg/L) Lead (0.3 µg/L) Antimony (0.8 µg/L) Manganese (3 µg/L) Anions (MDLs 0.1-10 mg/L) Bicarbonate/alkalinity (10 mg/L) Chloride (0.3 mg/L) Nitrate (0.1 mg/L) Bromide (0.1 mg/L) Fluoride (0.1 mg/L) Sulfate (1 mg/L) Other Constituents (MDLs 0.0001-10 mg/L) Dissolved organic carbon (0.3 mg/L) Silica (1 mg/L) Sulfide (10 µg/L) Methane (1 µg/L) Ethene (0.1 µg/L) Carbon dioxide (1 mg/L) Total dissolved solids (10 mg/L)
MDL = minimum detection limit
6.5 SAMPLING METHODS
6.5.1 RCDM and PDB Sampling Methods
The RCDM and PDB samplers were allowed to equilibrate for at least one week. This was the shortest common period determined during the bench-scale testing necessary for equilibration to take place for all the chemical constituents being sampled. After the equilibration period, the field comparison sampling was conducted at each site. After initial water levels were taken, the RCDM and PDB samplers were retrieved from each well and samples were collected immediately in appropriate containers (Figure 3). All samples were

24
collected and preserved according to standard sampling protocols. All sample bottles were placed in a cooler on ice for transport back to the office.
Figure 3. RCDM and PDB sampling.
Left, removal of a PDB sampler from a well prior to sampling. Right, filling sample bottles from an RCDM sampler.
6.5.2 Low-Flow Purging and Sampling Methods
Then, a variable speed stainless steel low-flow purge pump equipped with Teflon-lined polyethylene discharge tubing was lowered into the well and approximately centered at the depth at which the RCDM sampler was suspended during its equilibration. LF at 500-1000 mL/min was conducted as per the USEPA protocol (Puls and Barcelona, 1996), and field parameters (temperature, pH, specific conductance, dissolved oxygen, and turbidity) were monitored until stability was reached using a multi-parameter instrument (YSI 6920) in a flow-through cell at the surface. Field parameters were considered to be stabilized when three successive readings taken 5 minutes apart were within +/-0.1°C for temperature, +/-0.1 units for pH, +/-5% for conductance in microsiemens per centimeter (µS/cm), <10 NTU or +/-5 NTU if above 10 NTU for turbidity, and +/-0.1 mg/L for dissolved oxygen. After reaching stabilization of field parameters, samples were collected from the discharge line of the low-flow purge pump. All samples were collected in appropriate sample containers and preserved according to standard sampling protocols. Samples were placed in a cooler on ice for transport back to the office. At the end of each day, samples were repacked with fresh ice in coolers, standard chain-of-custody forms were filled out, and the samples were shipped by overnight courier to the laboratory.
6.5.3 Quality Assurance/Quality Control Sampling
Trip blanks, equipment wash blanks, and duplicate analyses were collected during the field demonstrations to meet the data-quality objectives. One duplicate RCDM sample, one duplicate PDB sample, and one duplicate low-flow purge sample were collected during each field demonstration (approximately 10% of samples). One equipment wash blank was collected from the low-flow purge pump each sampling day at each field site. One RCDM sampler and one PDB sampler that were suspended in deionized water for a week were sampled as RCDM and PDB sampler equipment blanks at each field demonstration site. Deionized water trip blanks for

25
VOCs were included in coolers being shipped to the laboratory. The deionized water used to clean the low-flow purge pump and to fill the diffusion samplers was analyzed at two sites. Replicates and blanks were analyzed for the same set of chemical constituents at the laboratory as the other samples in the same set. All analyses for the same chemical constituent were completed by the same laboratory.
6.6 SAMPLING RESULTS
Samples collected in the field demonstrations were analyzed at off-site laboratories. All chemical constituents listed in Table 6 except methane, ethene, carbon dioxide, and sulfide were analyzed at DHL Analytical in Round Rock, TX, using standard USEPA methods (USEPA, 2003; National Environmental Methods Index, 2002). Methane, ethene, carbon dioxide, and sulfide were analyzed at the USGS New Jersey District Laboratory in West Trenton, NJ, using standard and modified USEPA methods. Detection limits for all chemical constituents are given in Table 6. All analytical methods were chosen to have sufficiently low detection levels so that the differences between sample results could be recognized if present. Details of the analytical techniques used in this demonstration are given in Imbrigiotta et al. (2007). Because this demonstration was an evaluation of different sampling methods, the sampling results were the basis of the field comparisons. Therefore, the sampling results are presented and discussed in Section 7.2.

This page left blank intentionally.

27
7.0 PERFORMANCE ASSESSMENT
7.1 PERFORMANCE CRITERIA AND ACTUAL PERFORMANCE
The performance of the tested sampling techniques was evaluated by graphically and statistically comparing the water quality results from groundwater samples collected with each method from the same depth in each well in the field demonstration. RCDM sampler integrity was measured by weighing the samplers before deployment and after recovery from each well. The length of time it took to conduct various phases of a sampling technique was recorded on the field sheets. Table 7 summarizes the expected performance, performance confirmation methods used, and actual performance found during the demonstration project.
Table 7. Expected performance and performance confirmation methods.
Performance Criteria
Expected Performance Metric
(pre-demo)
Performance Confirmation
Method Actual Performance
(post-demo) Primary – Qualitative
Integrity and durability
No membrane perforations during field testing.
Examine samplers at end of field testing.
Yes. No perforations or degradation were noted during the 7-14 day field tests.
Chemical selectivity – lab vs. field
All lab-tested parameters should diffuse into RCDM samplers in field tests.
Compare lists of chemicals sampled in the field vs. lab.
Yes. Parameters that diffused into the RCDM samplers in the lab also diffused into the RCDM samplers in the field if present in the groundwater.
Chemical selectivity – dialysis vs. low-flow
All parameters detected in low-flow are also measured in RCDM samplers.
Compare detected chemicals in low-flow and RCDM samplers.
Yes. All of the organic and inorganic chemical constituents detected with the low-flow purge method were also detected with the RCDM samplers.
Chemical selectivity – RCDM vs. PDB
All parameters measured in PDB samplers are also measured in RCDM samplers.
Compare detected chemicals in PDB and RCDM samplers.
Yes. All of the VOCs detected with the PDB samplers were also detected with the RCDM samplers.
Ease of use RCDM samplers can be constructed, deployed, retrieved, and sampled by field personnel with minimal training.
Experience of field personnel.
Yes. The RCDM samplers were relatively easily constructed and deployed by one person with minimal training. The RCDM samplers were easily recovered and sampled from wells by 2 persons with minimal training.
Primary – Quantitative Integrity and durability
There will be minimal weight loss of RCDM sampler during field test.
Weigh samplers at beginning and end of test.
Yes. A weight loss of <3% per week was measured in the RCDM samplers over the course of the 7-14 day field tests.

28
Table 7. Expected performance and performance confirmation methods (continued).
Performance Criteria
Expected Performance Metric
(pre-demo)
Performance Confirmation
Method Actual Performance
(post-demo) Equal recovery with RCDM vs. low-flow
RCDM sampler concentrations will not be significantly different from LF concentrations.
Make 1:1 plots. Determine if significant differences in recovery were found using Kruskal-Wallis Test, Wilcoxon Test, or multifactor ANOVA on ranks.
Yes. 1:1 plots show good agreement between concentrations recovered with both sampling techniques. No significant difference (at p<0.05) due to sampling technique was found between concentrations recovered with the RCDM sampler and LF for 52 of 54 (96%) of the organic and inorganic constituents compared in the field demonstrations.
Equal recovery with RCDM vs. PDB
RCDM sampler concentrations of VOC chemicals of concern will not be significantly different from PDB sampler concentrations.
Make 1:1 plots. Determine if significant differences in recovery were found using Wilcoxon Signed Rank Test or multifactor ANOVA on ranks.
Yes. 1:1 plots (Appendix A of the Final Report) show good agreement between concentrations recovered with the RCDM sampler and PDB samplers. No significant difference (at p<0.05) due to sampling technique was found between concentrations recovered with the RCDM sampler and the PDB sampler for 24 of 24 (100%) of the volatile organic compounds compared.
Sensitivity RCDM samplers can sample low concentrations.
Concentrations within 2 times to 5 times detection limit are detected.
Yes. The data demonstrate that the RCDM samplers are capable of collecting samples at concentrations twice to five times the detection limit.
Faster field sampling
RCDM samplers take significantly less time in the field than LF.
Compare time to sample w/dialysis to time to sample w/LF in the field.
Yes. Low-flow sampling required an average of 96 minutes to collect a sample whereas RCDM samplers required only 20 minutes to collect a single sample.
Secondary – Qualitative Purge water RCDM sampler will
produce much less purge water than low-flow.
Compare measured purge water production from RCDM samplers and low-flow.
Yes. Less than 0.025 liters of purge water were produced per well with the RCDM sampler, and about 40 liters were produced per well with the low-flow purge technique.
Versatility RCDM samplers work well under a variety of site conditions (hydrologic conditions, chemical conditions)
Compare RCDM samplers to LF at sites with different hydrologic and chemical conditions
Yes. The RCDM samplers worked as well as LF in wells in both unconsolidated deposits and fractured bedrock and in wells with both high and low ionic strengths.
Scale-up constraints
There are no scale-up constraints for full-scale use
Experience of field personnel
Yes. There are no scale-up constraints for full-scale use of RCDM samplers in the field. However, the samplers are not yet available commercially so they must be constructed by project personnel.
Demo = demonstration vs. = versus LF = low-flow purging p<0.05, at 95% confidence level]

29
7.2 DATA ANALYSIS
7.2.1 Quality Assurance/Quality Control Sample Results
The majority of quality assurance/quality control (QA/QC) samples collected in this study showed no contamination with the constituents of interest. Trip blanks contained none of the VOCs found at any of the field sites. Equipment blanks for the RCDM samplers showed no detections of VOCs in two field demonstrations and only trace concentrations of a few compounds in the other two field demonstrations. RCDM sampler equipment blanks analyzed for inorganics showed consistent low levels of zinc. The source of zinc was not the regenerated cellulose membrane (bench-scale blanks were clean) or the deionized water used to fill the dialysis samplers (inorganic trip blanks were clean); therefore, it was probably leaching from the galvanized weights used in the construction of the RCDM samplers. Equipment blanks for the PDB samplers showed no detections of any of the VOCs present at the test sites. Equipment wash blanks for the low-flow pump showed only trace amounts of a few VOCs detected in any of the eight equipment blanks collected. Low-flow pump equipment wash blanks analyzed for inorganics showed detections of a few trace elements in trace concentrations in only a few cases. Dissolved organic carbon (DOC) was detected in six of the nine low-flow equipment wash blanks analyzed for this parameter. It is possible that the compounds used to clean the pump (soap, methanol) were not sufficiently flushed out of the pump by the amount of deionized water used in the field cleaning procedure. The fact that field samples collected after the wash blanks showed no contamination with DOC or the previously mentioned trace elements indicates that the LF process successfully flushed the wash water and any cleaning solutions out the pump over the course of the field parameter stabilization and low-flow sampling. On average, duplicate samples collected by LF agreed within +/-5% for inorganic constituents at all four field demonstrations. Low-flow duplicate samples agreed within +/-15% for VOCs at three of the four field demonstrations. On average, duplicate samples collected with the RCDM sampler agreed within +/-9% for inorganic constituents at all four of the field demonstrations. RCDM sampler duplicate samples agreed within +/-17% for VOCs at two of the four field demonstrations. Duplicate variation was higher at the Lakehurst site where 2-inch diameter wells prevented the RCDM samplers from being installed at the same depth in the fuel-contaminated plume. Apparently, the small differences in depth between RCDM samplers resulted in large differences in VOC concentrations in the duplicate samplers at this site under these conditions. Duplicate samples collected with PDB samplers agreed within +/-21% at three of the field demonstrations, but experienced higher variation at the Lakehurst site also.
7.2.2 Field Comparison Results for Volatile Organic Compounds
7.2.2.1
The results for 24 VOCs found at above-detection-limit concentrations at least four times during the field comparison portion of the study were evaluated graphically using 1:1 correspondence plots. For each VOC compound two 1:1 plots were constructed, one with the concentrations obtained with the RCDM sampler compared to the concentrations obtained with the PDB sampler (plots with blue symbols) and a second with concentrations obtained with the RCDM sampler compared to the concentrations obtained with the LF procedure (plots with red
Graphical Analysis of VOCs

30
symbols). Ideally, if both sampling techniques collected a VOC equally, all points from the field comparison sampling would fall on the 1:1 correspondence line. However, because sampling and analytical variations did occur, the data for most VOCs was scattered around the line. The closer the scatter in the data points was to the 1:1 line, the more comparable was the data produced by the two sampling techniques. All plots in this report are presented as log-log plots because the chemical constituents found in the field comparison samples typically ranged from their detection limit up to 2 to 4 orders of magnitude higher in concentration. Analyses reported at less than the detection limit were assigned a value of one-half the detection limit for the purposes of plotting the data. Each plot was divided into three parts: The white portion of each graph included all data points where both sampling techniques being compared had concentrations above the laboratory reporting level (LRL) for the compound being plotted. The yellow portion of each graph included all points where the concentrations for one or both of the sampling techniques were less than the laboratory reporting level but still above one-half the MDL (1/2 MDL). The rose-colored portion of each graph had no data points plotted because concentrations were all less than one-half the MDL. Selected 1:1 correspondence plots are presented below to illustrate common findings. Vinyl chloride is an example of a chlorinated VOC that was detected in the field comparison samples. Vinyl chloride has a high Henry’s Law constant and a very high vapor pressure. Because of these characteristics, it is often difficult to obtain consistent results for vinyl chloride with pumped samples. The plot of RCDM sampler versus PDB sampler results (Figure 4) showed excellent agreement between concentrations obtained using both sampling techniques starting at the detection limit and going up over 4 orders of magnitude in concentration. The data points were closely grouped on or near the 1:1 correspondence line. These results confirmed that the two diffusion samplers collected nearly identical samples from wells in the field demonstration.
Dialysis vs PDB Vinyl Chloride
0.001
0.01
0.1
1
10
100
1000
10000
0.001 0.01 0.1 1 10 100 1000 10000
Vinyl Chloride (µg/L) recovered by Dialysis Sampler
Viny
l Chl
orid
e ( µ
g/L)
reco
vere
d by
PD
B S
ampl
er
LRL
1/2 MDL
Figure 4. RCDM sampler versus PDB sampler results for vinyl chloride.
The plot of RCDM sampler versus LF results (Figure 5) also showed excellent agreement between concentrations obtained using both sampling techniques, especially in the white portion of the graph. Except for a few data points in the yellow (low concentration) portion of the plot,

31
most data comparison points were tightly grouped on or near the 1:1 line, extending from the detection limit and going up over 4 orders of magnitude in concentration. These results show that the RCDM sampler and LF collected nearly identical samples from wells in the field also.
Dialysis vs Low-Flow Vinyl Chloride
0.001
0.01
0.1
1
10
100
1000
10000
0.001 0.01 0.1 1 10 100 1000 10000
Vinyl Chloride (µg/L) recovered by Dialysis Sampler
Viny
l Chl
orid
e ( µ
g/L)
reco
vere
d by
Low
-Flo
w P
urgi
ng
LRL
1/2 MDL
Figure 5. RCDM sampler versus LF results for vinyl chloride.
These results were typical for most of the other chlorinated VOCs detected in this demonstration. The results for 1,1,1-trichloroethane, 1,1-dichloroethene, trichloroethene, cis-1,2-dichloroethene, trans-1,2-dichloroethene, and dichlorodifluoromethane all showed similar close agreement between sampling techniques. Correspondence plots for all chlorinated VOCs are included in the Appendix A from the Final Technical Report for this study (Imbrigiotta et al, 2007). Ethylbenzene is an example of an aromatic VOC detected in the field demonstration samples. The RCDM sampler versus PDB sampler results (Figure 6) matched very well, indicating that the diffusion samplers were both collecting equivalent concentrations of ethylbenzene from wells in the field. The sampling techniques agree over the range from the detection limit to 3 to 4 orders of magnitude higher.
Dialysis vs PDB Ethylbenzene
0.01
0.1
1
10
100
1000
10000
0.01 0.1 1 10 100 1000 10000
Ethylbenzene (µg/L) recovered by Dialysis Sampler
Ethy
lben
zene
( µg/
L) re
cove
red
by
PDB
Sam
pler
1/2 MDL
LRL
Figure 6. RCDM sampler versus PDB sampler results for ethylbenzene.

32
The RCDM sampler versus the LF results (Figure 7) also showed a close relationship for concentrations above the laboratory reporting level for ethylbenzene. However, at concentrations between the laboratory reporting level and the MDL, several instances were found where ethylbenzene was detected in the low-flow samples but not in the RCDM sampler. Given the fact that the RCDM and PDB samplers agreed well for this compound even at low concentrations, the most likely explanation for this observation was that, even at low purging rates, groundwater containing ethylbenzene was being drawn into these wells that was not present in the screened interval under unstressed conditions. The contaminant may be drawn in vertically from a depth other than the one the RCDM and PDB samplers were suspended at or from an area laterally adjacent to the screen.
Dialysis vs Low-Flow Ethylbenzene
0.01
0.1
1
10
100
1000
10000
0.01 0.1 1 10 100 1000 10000
Ethylbenzene (µg/L) recovered by Dialysis Sampler
Ethy
lben
zene
( µg/
L) re
cove
red
by
Low
-Flo
w P
urgi
ng
LRL
1/2 MDL
Figure 7. RCDM sampler versus LF results for ethylbenzene.
The results for ethylbenzene were similar to the results for other aromatic VOCs in this study. (Imbrigiotta et al, 2007). The distribution of points around the 1:1 correspondence line in a RCDM sampler versus low-flow comparison plot was generally more scattered than the distribution of points around the 1:1 line in an RCDM sampler versus PDB sampler comparison plot. The fact that the comparisons between the RCDM sampler and the PDB sampler usually yielded closer concentrations than between the RCDM sampler and LF was not unexpected. The diffusion samplers take point samples from the depth at which they are suspended in the well. Low-flow purge pumps, even if they are suspended at the same depth as the diffusion samplers, do not sample only from that depth. The process of pumping the well, even at low flow rates, has been found to draw water in over the entire length of the screened or open interval (Gibs et al., 1993; Reilly and Gibs, 1993; Britt, 2005; Varljen et al., 2006).
7.2.2.2
All Pearson’s correlation coefficients calculated (S-PLUS, 2002) between concentrations sampled with the RCDM samplers and concentrations sampled with PDB samplers were strongly positive. For all 24 VOCs, correlation coefficients exceeded 0.57. This result was not unexpected since both were diffusion-type samplers. Most Pearson’s correlation coefficients calculated between concentrations sampled with the RCDM samplers and concentrations
Statistical Comparison of VOC Results

33
sampled with LF were strongly positive also. For 20 of the 24 VOCs included in the field comparisons, correlation coefficients exceeded 0.58. High correlation values indicated that the data collected by different sampling techniques were closely and consistently matched. Correlations for all VOCs are given in Imbrigiotta et al. (2007). Normality testing was conducted on all VOCs included in the field comparison data set (S-PLUS, 2002). The majority (21 of the 24) of VOC data distributions were not normally distributed. Because of this, non-parametric statistical testing of the data was conducted. Non-parametric statistics do not require normal data distributions. VOC concentration data collected with the three different sampling techniques were compared using a non-parametric Kruskal-Wallis rank sum test (S-PLUS, 2002). The results of the testing are given in Table 8. Only VOCs that had four or more field comparison data points with above MDL concentrations were included in this analysis. For 21 of 24 VOCs, no significant difference was found between samples collected with the RCDM sampler, PDB sampler, and LF. These results indicate that for most VOCs, RCDM samplers accurately collected both chlorinated and aromatic VOCs that varied widely in volatility, solubility, and Henry’s Law constant. Table 8. Statistical comparison of VOC concentrations recovered by the RCDM sampler,
PDB sampler, and LF using the Kruskal-Wallis rank sum test.
VOCs where no significant difference was found between samples collected with the RCDM sampler, PDB sampler, and LF (at p<0.05) 1,1,1-Trichloroethane (7)1 Ethylbenzene (17) Benzene (13) 1,1-Dichlorethene (10) Isopropylbenzene (17) Toluene (15) Trichloroethene (12) n-Propylbenzene (14) m,p-Xylene (17) cis-1,2-Dichloroethene (10) tert-Butylbenzene (7) o-Xylene (15) trans-1,2-Dichloroethene (5) Naphthalene (12) Styrene (6) Vinyl chloride (9) 1,2,4-Trimethylbenzene (17) Dichlorodifluoromethane (4) 1,3,5-Trimethylbenzene (13) Chloroform (7) Methyl tert-butyl ether (5) VOCs where a significant difference was found between samples collected with the RCDM sampler, PDB sampler, and LF (at p<0.05)1 sec-Butylbenzene (7) p-Isopropyltoluene (13) n-Butylbenzene (9) [D = PDB < LF] [D = PDB < LF] [D = PDB < LF]
1Number of comparisons for each compound above the MDL. At p<0.05 = the presence or absence of differences is significant at the 95% confidence level for the number of comparisons. D = dialysis sampler LF = low-flow purging The three compounds that showed a significant differenceCsec-butylbenzene, n-butylbenzene, and p-isopropyltolueneCwere all less volatile aromatic VOCs and all were detected only at low concentrations (<10 µg/L) in this study. In addition, the number of field comparison data points where all three sampling techniques had above MDL concentrations was smallC1, 3 and 8 for sec-butylbenzene, n-butylbenzene, and p-isopropyltoluene, respectively. A multifactor ANOVA on ranked data was run (S-PLUS, 2002) for each of these three VOCsC sec-butylbenzene, n-butylbenzene, and p-isopropyltolueneCto determine if other factors such as

34
sampling date or sampling site could have caused the differences observed. The multifactor ANOVA on ranks showed that the differences in the field comparison data for these three VOCs noted by the Kruskal-Wallis test were not due to sampling date or sampling site. All three VOCs were still found to exhibit significant differences between sampling techniques. The multiple comparison test indicated for all three compounds that the RCDM sampler and PDB sampler recovered approximately equal concentrations and that both were significantly less than the concentrations recovered by LF (Table 8). This was statistical confirmation of the phenomena seen in the 1:1 plots for these compounds. For example, the plots for n-butylbenzene showed good agreement between the RCDM and PDB sampler results (Figure 8) with only one point above the laboratory reporting level. However, the plot of RCDM sampler versus LF (Figure 9) showed poor agreement for the majority of comparison points which were all below the laboratory reporting level for n-butylbenzene. All results in the yellow region of the graph indicated that n-butylbenzene is recovered in higher concentrations with the low-flow purge pump than with the RCDM sampler. The reason for this finding was most likely because the pump drew in low concentrations of this VOC during the purging process that were not present in the open interval at the depth the diffusion samplers were suspended prior to purging. This was the case for both s-butylbenzene and p-isopropyltoluene also. Thus, even though the statistical testing indicated significant differences between the sampling techniques, these VOCs may be sampled effectively with RCDM samplers, particularly at concentrations above the laboratory reporting level.
Dialysis vs PDB n-Butylbenzene
0.01
0.1
1
10
100
1000
0.01 0.1 1 10 100 1000
n-Butylbenzene (µg/L) recovered by Dialysis Sampler
n-B
utyl
benz
ene
( µg/
L)
reco
vere
d by
PD
B S
ampl
er
LRL
1/2 MDL
Figure 8. RCDM sampler versus PDB sampler results for n-butylbenzene.

35
Dialysis vs Low-Flow n-Butylbenzene
0.01
0.1
1
10
100
1000
0.01 0.1 1 10 100 1000
n-Butylbenzene (µg/L) recovered by Dialysis Sampler
n-B
utyl
benz
ene
( µg/
L) re
cove
red
by L
ow-F
low
Pur
ging
LRL
1/2 MDL
Figure 9. RCDM sampler versus LF results for n-butylbenzene.
7.2.2.3
• RCDM samplers made of RCDM can be used to collect chlorinated and aromatic VOC constituents from groundwater in wells.
Summary of Significant Findings from the VOC Field Comparisons
• A one- to two-week deployment time was sufficient for equilibration of all VOC constituents monitored in the field comparisons.
• Precleaned RCDM material does not desorb VOCs.
• For most VOCs, the graphs comparing RCDM sampler results to PDB sampler results show a tight grouping of data points around the 1:1 line, indicating extremely good agreement between the sampling techniques. Plots comparing RCDM sampler results to LF results show more scatter in the data points around the 1:1 line, indicating that the agreement, though still good, is not as strong as the agreement between diffusion sampling techniques.
• The correlation coefficients for most VOC concentrations were strongly positive between samples collected with RCDM samplers and PDB samplers and between samples collected with RCDM samplers and LF.
• RCDM samplers recovered concentrations of all VOCs that were not statistically significantly different from concentrations recovered by PDB samplers.
• RCDM samplers recovered concentrations of 21 of 24 VOCs that were not statistically significantly different from concentrations recovered by LF.
7.2.3 Field Comparison Results for Inorganic and Selected Organic Constituents
Thirty different non-VOC water-quality constituents were found above their detection limits in wells in the field comparison studies. This group of constituents included inorganic parameters (all the major cations and anions, many trace elements, silica, and total dissolved solids), and three organic constituents (dissolved organic carbon, methane, and ethene). All these parameters

36
were compared only between RCDM samplers and LF, because PDB samplers could not collect samples for most of these chemical constituents.
7.2.3.1
The results for the 30 inorganic and selected organic constituents found at above-detection-limit concentrations at least four times during the field comparison portion of the study were evaluated graphically using 1:1 correspondence plots. Correspondence plots for all these constituents are given in Appendix A of the Final Report for this study (Imbrigiotta et al., 2007).
Graphical Analysis of Inorganics and Selected Organic Constituents
Calcium and chloride are examples of a major cation and anion that were sampled in this demonstration. The 1:1 plots of these two inorganics are shown in Figures 10 and 11. Both constituents showed excellent agreement between concentrations obtained using both sampling techniques in the 1 to 1000 mg/L range in concentration. The data points were closely grouped on or near the 1:1 correspondence line, indicating that these inorganics were sampled equally by both the RCDM sampler and LF. At concentrations above the laboratory reporting level, similar results were found for magnesium, sodium, potassium, alkalinity, fluoride, nitrate, bromide, silica, and total dissolved solids. Data comparison points for sulfate were also primarily close to the 1:1 line, but had a few more points above the line, indicating that LF recovered slightly higher concentrations than RCDM samplers in some instances.
Dialysis vs Low-FlowCalcium
0.01
0.1
1
10
100
1000
10000
0.01 0.1 1 10 100 1000 10000
Calcium (mg/L) recovered by Dialysis Sampler
Cal
cium
(mg/
L) re
cove
red
by
Low
-Flo
w P
urgi
ng
LRL1/2MDL
Figure 10. RCDM sampler versus LF results for calcium.

37
Dialysis vs Low-Flow Chloride
0.1
1
10
100
1000
0.1 1 10 100 1000
Chloride (mg/L) recovered by Dialysis Sampler
Chl
roid
e (m
g/L)
reco
vere
d b
y Lo
w-F
low
Pur
ging
LRL
1/2MDL
Figure 11. RCDM sampler versus LF results for chloride.
Manganese was an example of a trace elements detected in this demonstration that appeared to be recovered approximately equally by both sampling techniques (Figure 12). Although having fewer data comparison points, plots for arsenic, barium, cadmium, chromium, lead, molybdenum, nickel, selenium, vanadium, and zinc were similarly distributed, particularly at concentrations above the laboratory reporting level for each element (Imbrigiotta et al., 2007).
Dialysis vs Low-Flow Manganese
0.1
1
10
100
1000
10000
0.1 1 10 100 1000 10000
Manganese (µg/L) recovered by Dialysis Sampler
Man
gane
se ( µ
g/L)
reco
vere
d by
Lo
w-F
low
Pur
ging
LRL
1/2MDL
Figure 12. RCDM sampler versus LF results for manganese.
The distribution of comparison points for iron was not as consistent as most other trace elements (Figure 13). Although most points (75%) were near the 1:1 line, a few more were found below the line than above, implying that iron was more often higher in the RCDM samplers than in low-flow purge samples. One possible explanation for this observation is that pumped samples became oxygenated to a degree during pumping, altering the iron redox chemistry of the samples and decreasing their dissolved iron content. Similar results have been observed in pumped wells compared to peeper diffusion samples by Lorah et al. (2004). Another possible explanation may be that iron concentrations were affected by the dissolved oxygen content of the water in the well

38
compared to the water used to fill the RCDM sampler. For example, if a sampler is filled with oxygenated water and then deployed in an anoxic well, dissolved iron may diffuse into the sampler from the well water, react with the oxygen in the sampler, and precipitate out as ferric oxide or ferric hydroxide. Once precipitated out, these iron precipitates may take a longer period of time to re-dissolve and re-equilibrate once the water in the sampler goes anoxic. If the deployment period is short, iron precipitates inside the diffusion sampler may be present when sampling takes place, resulting in higher iron concentrations inside the sampler than in the subsequent low-flow purge samples. However, no precipitation of ferric oxide or ferric hydroxide was observed in any of the RCDM samplers used in any of the field comparisons in this study. This phenomenon has only been observed in nylon-screen diffusion samplers by Vroblesky and Pravecek (2002). Precautions were taken in this study to fill the samplers with anoxic water and to try to keep them anoxic up until the time they were deployed in any anoxic wells. However, it was difficult to maintain deoxygenated conditions during transport to the field, so some re-oxygenation may have taken place to cause the few higher iron concentrations seen in the RCDM sampler. Another possible explanation for finding higher iron concentrations in RCDM samplers was the observation that RCDM samplers suspended in wells with high iron concentrations were noted to become slightly discolored. This may indicate that high concentrations of iron are adsorbing to the regenerated cellulose membrane rather than simply diffusing through it. If high concentrations of iron are adsorbed to the membrane, they may cause higher iron concentrations to equilibrate inside the sampler than outside the sampler.
Dialysis vs Low-FlowIron
1
10
100
1000
10000
100000
1 10 100 1000 10000 100000
Iron (µg/L) recovered by Dialysis Sampler
Iron
( µg/
L) re
cove
red
by
Low
-Flo
w P
urgi
ng
LRL
1/2MDL
Figure 13. RCDM sampler versus LF results for iron.
Carbon dioxide, methane, and ethene were dissolved gases detected in wells in this study that appeared to be recovered equally by both sampling techniques. Dissolved organic carbon was recovered equally to slightly better by the RCDM sampler than LF. Sulfide comparison points fell mostly below the 1:1 correspondence line (Figure 14) indicating sulfide was usually recovered in higher concentrations by the RCDM samplers than by LF. This phenomenon needs further study. An adsorption mechanism similar to that described for iron may also be taking place for sulfide on the regenerated cellulose membrane, causing higher sulfide concentrations to equilibrate within the sampler.

39
Dialysis vs Low-Flow Sulfide
0.1
1
10
100
1000
10000
100000
0.1 1 10 100 1000 10000 100000
Sulfide (µg/L) recovered by Dialysis Sampler
Sulfi
de ( µ
g/L)
reco
vere
d
by L
ow-F
low
Pur
ging
LRL1/2MDL
Figure 14. RCDM sampler versus LF results for sulfide.
7.2.3.2
Pearson’s correlation coefficients (S-PLUS, 2002) were calculated for all field comparison results between the RCDM sampler and LF for all inorganic and selected organic constituents. All correlations between concentrations sampled with the RCDM samplers and concentrations sampled with LF were strongly positive. For 29 of the 30 constituents, correlation coefficients exceeded 0.50. Only lead (0.49) had a correlation coefficient slightly below 0.50. All correlation results are given in Imbrigiotta et al. (2007).
Statistical Analysis of Inorganic and Selected Organic Constituent Results
Normality testing was conducted on all 30 inorganic and selected organic parameters detected in wells from the field comparison study. The majority (26 of the 30) of these data distributions were not normally distributed. Because of this, similar to the VOC results, non-parametric statistical testing of the data was conducted. Inorganic and selected organic constituent concentration data collected with RCDM samplers and LF were compared using a non-parametric Wilcoxon signed rank test (S-PLUS, 2002). The results of the testing are given in Table 9. For 24 of 30 constituents, no significant difference was found between samples collected with the RCDM sampler and LF. Thus, although some constituents seemed to be recovered better with one sampling technique or the other on the 1:1 correspondence plots, these differences mostly turned out not to be significant statistically. These results indicated that in most cases, RCDM samplers were able to collect inorganic and organic constituents as accurately as LF over a range of concentrations. The six constituents that showed a significant difference in this test, dissolved organic carbon, total dissolved solids, potassium, nitrate, nickel, and sulfide, varied widely in their chemical characteristics and concentrations. A multifactor ANOVA on ranked data was run for each of these six constituents to determine if other factors such as sampling date or sampling site could have caused the differences observed. The multifactor ANOVA on ranks showed that the differences in the field comparison data for all six constituents were not due to sampling date.

40
Table 9. Statistical comparison of inorganic and selected organic constituent concentrations recovered by the RCDM sampler and
LF using the Wilcoxon signed rank test.
Constituents where no significant difference was found between samples collected with the RCDM sampler and LF (at p<0.05) Aluminum (22)1 Chloride (28) Selenium (8) Arsenic (18) Chromium (5) Silica (28) Barium (25) Fluoride (16) Sodium (28) Bicarbonate/Alkalinity (27) Iron (23) Sulfate (25) Bromide (8) Lead (14) Vanadium (7) Cadmium (5) Magnesium (28) Zinc (18) Calcium (28) Manganese (27) Methane (21) Carbon dioxide (28) Molybdenum (11) Ethene (9) Constituents where a significant difference was found between demonstration sites but no significant difference was found between samples collected with the RCDM sampler and LF (at p<0.05) Dissolved organic carbon (27) Nitrate (11) Potassium (28) Total dissolved solids (27) Constituents where a significant difference was found between samples collected with the RCDM sampler and LF (at p<0.05) Nickel (11) [LF > RCDM] Sulfide (16) [RCDM >F]
1Number of comparisons for each constituent above the MDL. At p<0.05 = the presence or absence of differences is significant at the 95% confidence level for the number of comparisons. LF = low-flow purging Four constituentsCdissolved organic carbon, total dissolved solids, potassium, and sulfideCwere found to be significantly different due to differences in concentrations present at the three sites. In all cases, the Port Hueneme/Point Mugu site had significantly higher concentrations of these four constituents than the Lakehurst site, which in turn had significantly higher concentrations than the West Trenton site. The ANOVA on ranks also showed that DOC, TDS, and potassium were not significantly different due to the sampling techniques used to collect the samples. The ANOVA on ranks failed to find any significant difference due to sampling site or confirm any significant differences due to sampling technique for nitrate. The significant differences between sampling techniques noted by the Wilcoxon test were confirmed by the multifactor ANOVA on ranks for nickel and sulfide. Nickel was recovered in higher concentrations by low-flow purging than by the RCDM sampler. However, for 10 of the 11 comparisons for nickel, the field data occurred at concentrations below the laboratory reporting level. The one field comparison where nickel was at the laboratory reporting level for both sampling methods, the results agreed very closely. Additional comparison testing should be done in waters with higher concentrations before final conclusions are drawn about nickel. Sulfide was recovered in higher concentrations by the RCDM sampler than by LF. These findings also confirmed statistically the phenomena observed on the 1:1 plots for this constituent. Results of sulfide analysis of RCDM sampler field equipment blanks were all below minimum detection levels (<10 µg/L), indicating that sulfide was not leaching from the membrane. The recovery of higher dissolved sulfide concentrations by the RCDM samplers than by LF may be due to losses of this volatile redox-active constituent under the purging process. Active pumping conditions present in a well during the purging process may induce volatilization of hydrogen

41
sulfide gas or may produce more oxygenated conditions, which can result in conversion of sulfide to sulfate in low-flow purge samples. Another possible explanation for higher sulfide concentrations in samples from the RCDM sampler than in samples from LF is that sulfate-reducing bacteria may attach to the regenerated cellulose membrane during the period of equilibration in a well. If conditions are right, when the sulfate-reducing bacteria produce sulfide in the immediate vicinity of the RCDM membrane, the sulfide concentration that equilibrates inside the sampler may be artificially high when compared to a subsequent purged sample. If this is happening, lower sulfate concentrations should be found in RCDM samplers in wells where this occurred. However, lower sulfate concentrations were not found in RCDM samples where higher sulfide concentrations were measured. Microbial analysis or scanning electron microscope photos of the RCDM samplers after removal from a well may be needed to shed light on this possible explanation. Another possible explanation for this observation may be that a direct adsorption mechanism may be taking the place of sulfide on the regenerated cellulose membrane, causing higher sulfide concentrations to equilibrate within the membrane. This phenomenon needs further study.
7.2.3.3
• RCDM samplers made of RCDM can be used to collect both inorganic and organic constituents from groundwater in wells.
Summary of Significant Findings from the Inorganic and Selected Organic Constituent Field Comparisons
• A one- to two-week deployment time was sufficient for equilibration of all inorganics and selected organic constituents monitored in the field comparisons.
• Pre-cleaned RCDM material does not desorb trace metals, sulfides, cations, or anions.
• For most inorganic and selected organic constituents, the graphs comparing RCDM sampler results to LF results show a tight grouping of data points around the 1:1 line, indicating extremely good agreement between the sampling techniques, particularly at concentrations above the laboratory reporting level.
• The correlation coefficients for most inorganic and selected organic constituents were strongly positive between concentrations recovered by RCDM samplers and LF.
• RCDM samplers recovered concentrations of 28 of 30 inorganic, and selected organic constituents that were not statistically significantly different due to sampling technique from concentrations recovered by LF.
• RCDM samplers may be used to collect samples for sulfide and iron with the qualification that the concentrations measured may be correct to overestimates for these parameters.
7.3 COMPARISON OF RESULTS TO PREVIOUS STUDIES
Most previous studies involving RCDM samplers have had similar results to those in this demonstration, but usually with far fewer sample comparisons. The results of this study showing that RCDM samplers were able to sample for a wide variety of VOCs and inorganics agreed well

42
with the results of Imbrigiotta et al. (2002) (nine wells at the NAWC site in West Trenton, NJ, sampled for several chlorinated VOCs and inorganic ions); Vroblesky et al. (2002) (three wells at the Naval Air Station Fort Worth Reserve Base sampled for a number of inorganic trace elements); Vroblesky and Pravecek (2002) (13 wells at Hickam AFB in Hawaii sampled for several aromatic VOCs and inorganic ions); Harter and Talozi (2004) (43 wells in Oregon sampled for nitrate and specific conductance); and Parsons (2005) (20 wells at McClellan AFB, Sacramento, CA, sampled for VOCs and anions). The results of this demonstration did not agree with some findings from a few previous studies. RCDM samplers were found to have difficulty sampling for chlorinated VOCs by Vroblesky et al. (2003) (5 wells at Andersen AFB in Guam) and trace metals by Parsons (2005) (20 wells at McClellan AFB). Possible explanations as to why the results of these latter two studies differed from the results of the current demonstration are given in the discussion section of the Final Technical Report for this study (Imbrigiotta et al., 2007).
7.4 SUMMARY OF DEPLOYMENT CONSIDERATIONS
During the field comparison demonstrations, several general findings regarding the proper use of RCDM samplers emerged. Each of these findings is discussed in more detail in the Final Technical Report for this demonstration (Imbrigiotta et al., 2007).
• RCDM samplers made with RCDM must be kept hydrated between the time they are constructed and deployed.
• De-oxygenated deionized water should be used to fill and store RCDM samplers that will be deployed in anoxic wells to avoid altering the concentrations of redox active chemicals, such as iron and sulfide.
• RCDM samplers can easily be deployed by one person and sampled by two persons. The basic considerations in deploying diffusion samplers include that they must be submerged below the air/water interface in a well and they must remain submerged and be allowed to equilibrate for an appropriate period of time for the chemicals of concern at a site,
• An RCDM sampler should be placed at a depth where the highest mass flux passes through the open interval of each well. This means the variation in groundwater flow and any stratification of concentrations of contaminants should be determined over the length of the open interval prior to deployment of an RCDM sampler. Vertical profiling by preferably both hydraulic and chemical methods should be conducted to obtain this information prior to the first deployment of an RCDM sampler in a well. If the screened or open interval of a well is 5 ft or less, no profiling is required (ITRC, 2004).
• The size of an RCDM sampler must be carefully determined before sampler construction begins to be sure it will contain the necessary minimum sample volume for all analyses that will be run on a sample. The size of an RCDM sampler should not be longer than (a) 5 ft (ITRC, 2004), (b) the length of the open interval of the well, or (c) the length of the zone of highest mass influx of the chemical of concern to the well.

43
• RCDM samplers lose less than 3% of their volume per week in wells with TDS up to 2300 mg/L because of the dialysis process. If sampler deployment times in the well are short (1-2 weeks), this loss can be taken into account when constructing the sampler and should not impact the use of these samplers.
• RCDM samplers may biodegrade within 4 to 6 weeks in a well at 15°C. If equilibration times for the chemicals of concern are short (1-2 weeks) this should not restrict the use of these samplers in a well. If the equilibration times for the chemicals of concern are longer than 4 weeks, RCDM membranes should not be used in a well unless prior testing shows that they will survive the length of time without biodegrading. Warmer groundwater temperatures and high microbial populations may accelerate biodegradation while colder temperatures (4°C) have been shown to stop biodegradation for up to 6 months (Iwakun et al., 2008).
• In the vast majority of wells tested, chemical concentrations in samples collected with RCDM samplers agreed very well with chemical concentrations in samples collected by LF. On the rare occasion when concentrations differed significantly between samples collected with RCDM samplers and LF, it does not mean one sampler is necessarily right and the other is wrong (ITRC, 2004). Differences in concentrations may be due to the fact that the sampling techniques use different mechanisms to collect samples. RCDM samplers can only equilibrate with chemical concentrations that are present at the depth at which they are suspended in an open interval under non-pumping conditions. LF can collect samples that are drawn from different depths over the entire open interval or from areas of the aquifer adjacent to the open interval (Varlgen et al., 2006).

This page left blank intentionally.

45
8.0 COST ASSESSMENT
8.1 COST MODEL
One of the objectives of this demonstration was to evaluate the cost savings produced by using diffusion samplers instead of traditional LF techniques. The costs for collecting samples with the RCDM sampler and LF have been estimated based on the costs experienced in both the laboratory and field portions of this project. Costs for collecting samples (VOCs only) with PDB samplers have also been estimated and compared. Table 10 delineates the cost elements, data that must be tracked, and the estimated costs for each element that was considered in this cost model.
Table 10. Cost model for RCDM samplers.
Cost Element Data Tracked During the Demonstration Estimated Costs Site characterization Personnel time to obtain information on well
construction, recent water chemistry, recent contaminant concentrations
Project person, 80 hr $8000
Vertical profilingC chemical
Personnel time to construct, deploy, and retrieve diffusion samplers; analytical costs Must be done once prior to diffusion sampling or LF (assume 5 diffusion samplers per 20 ft open interval/well in 10 wells)
1 lab person to construct 50 samplers, 8 hr
$400
1 field person to deploy 50 samplers, 2 hr
$100
1 field person to retrieve and collect 50 samples, 5 hr
$250
Analytical costs $5000 Vertical profilingC hydraulic/geophysical
Personnel time to test open interval with a borehole flow meter, rental of equipment Must be done once prior to diffusion sampling or LF (assume logging 10 wells)
Borehole flow meter rental, 40 hr
$1000
Geophysics person to log 10 wells, 24 hr
$2400
Geophysics person to analyze collected data, 16 hr
$1600
Material costsC RCDM samplers
Costs of membrane, mesh, rope, stopcock, clamps, weights, regenerated cellulose lay-flat tubing (assume 2-ft long by 2.5-inch diameter sampler in 10 wells)
Material costs (10 samplers)
$205
Construction costsC RCDM samplers
Personnel time to assemble sampler (assume 0.75 hr/sampler for 10 samplers)
1 lab person, 7.5 hr $375
Operating costsC RCDM sampler
Field personnel time to deploy, retrieve, and collect sample; purge water disposal
1 field person to deploy 10 samplers, 2 hr
$100
2 field persons to retrieve and collect 10 samplers, 3.5 hr
$170
Purge water disposal $0 Material costsC PDB samplers
Costs of membrane, mesh, rope, stopcock, clamps, weights (assume 2-ft long by 1.25-inch diameter sampler in 10 wells)
Material costs $90
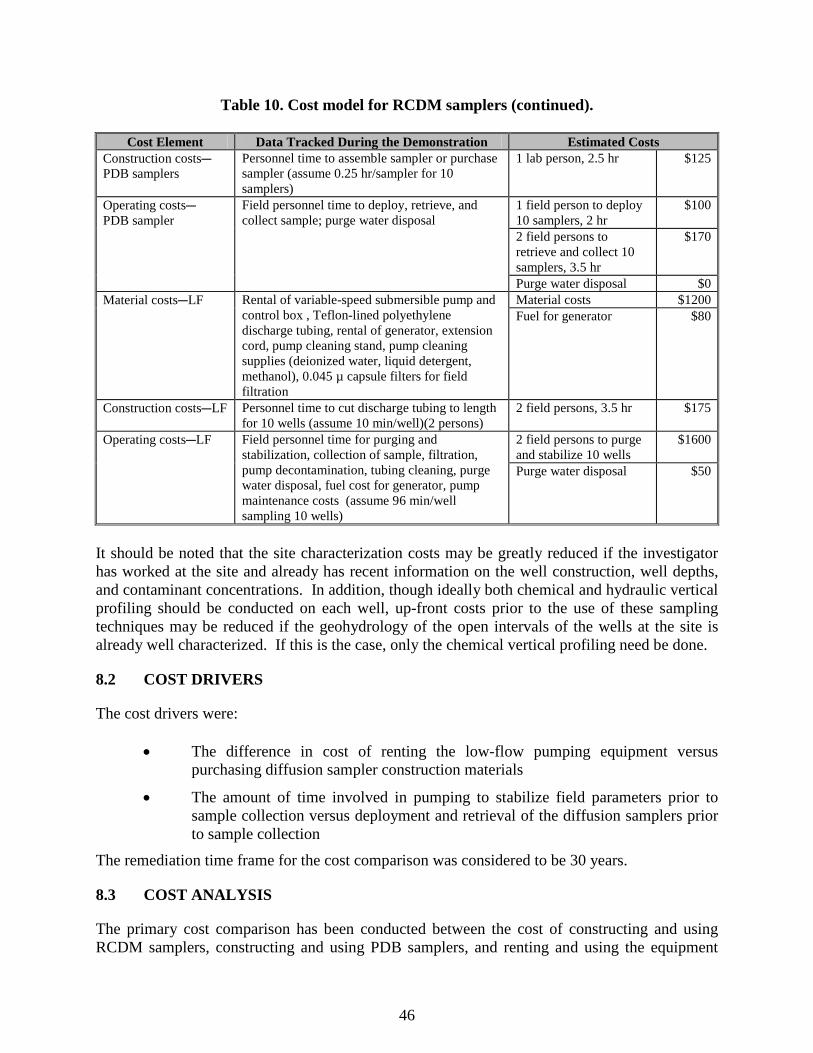
46
Table 10. Cost model for RCDM samplers (continued).
Cost Element Data Tracked During the Demonstration Estimated Costs Construction costsC PDB samplers
Personnel time to assemble sampler or purchase sampler (assume 0.25 hr/sampler for 10 samplers)
1 lab person, 2.5 hr $125
Operating costsC PDB sampler
Field personnel time to deploy, retrieve, and collect sample; purge water disposal
1 field person to deploy 10 samplers, 2 hr
$100
2 field persons to retrieve and collect 10 samplers, 3.5 hr
$170
Purge water disposal $0 Material costsCLF Rental of variable-speed submersible pump and
control box , Teflon-lined polyethylene discharge tubing, rental of generator, extension cord, pump cleaning stand, pump cleaning supplies (deionized water, liquid detergent, methanol), 0.045 µ capsule filters for field filtration
Material costs $1200 Fuel for generator $80
Construction costsCLF Personnel time to cut discharge tubing to length for 10 wells (assume 10 min/well)(2 persons)
2 field persons, 3.5 hr $175
Operating costsCLF Field personnel time for purging and stabilization, collection of sample, filtration, pump decontamination, tubing cleaning, purge water disposal, fuel cost for generator, pump maintenance costs (assume 96 min/well sampling 10 wells)
2 field persons to purge and stabilize 10 wells
$1600
Purge water disposal $50
It should be noted that the site characterization costs may be greatly reduced if the investigator has worked at the site and already has recent information on the well construction, well depths, and contaminant concentrations. In addition, though ideally both chemical and hydraulic vertical profiling should be conducted on each well, up-front costs prior to the use of these sampling techniques may be reduced if the geohydrology of the open intervals of the wells at the site is already well characterized. If this is the case, only the chemical vertical profiling need be done.
8.2 COST DRIVERS
The cost drivers were:
• The difference in cost of renting the low-flow pumping equipment versus purchasing diffusion sampler construction materials
• The amount of time involved in pumping to stabilize field parameters prior to sample collection versus deployment and retrieval of the diffusion samplers prior to sample collection
The remediation time frame for the cost comparison was considered to be 30 years.
8.3 COST ANALYSIS
The primary cost comparison has been conducted between the cost of constructing and using RCDM samplers, constructing and using PDB samplers, and renting and using the equipment

47
needed to conduct LF to sample a well. Cost comparisons were made on both a per sample basis and a per site basis. The costs for site characterization, chemical vertical profiling, and hydraulic vertical profiling were assumed to be one-time only costs that were needed for all three sampling techniquesCRCDM samplers, PDB samplers, and LFCin order to determine the proper sampling depth in a well. Because these costs were needed for all three sampling methods, they were not included in the cost comparisons below.
8.3.1 Basic Assumptions
For the cost comparison made on a per sample basis, the following assumptions were used:
• The average well sampled was a 4-inch diameter well, having a depth to water of approximately 10 ft below land surface, a total well depth of 35 ft below land surface, and an average sampling depth of 30 ft below land surface.
• The minimum required volume of groundwater for a typical suite of VOC and inorganic analyses was assumed to be 1.7 L, the volume contained in one RCDM sampler 2.5 inches in diameter by 2 ft in length.
• The minimum required volume of groundwater for a typical VOC analysis was assumed to be 150 mL, the volume contained in one PDB sampler 1.25 inches in diameter by 1 ft in length.
• Both the RCDM samplers and the PDB samplers were constructed by laboratory personnel, not purchased commercially.
• During sampling, essentially no purge water was produced using either type diffusion sampler, while approximately 40 L (10 gal) of purge water was produced during each low-flow purge sampling.
• The LF sample will require field filtration whereas the diffusion samplers will not.
• The laboratory and field personnel earn $50/hour. For the cost comparison made on a per site basis, the following assumptions were used:
• The sampling costs per well were applied to a typical site with 50 monitoring wells.
• The wells were sampled semi-annually for a period of 30 years.
8.3.2 Cost Comparison per Sample
The costs of constructing, deploying, and sampling 10 wells using the three sampling technologies evaluated in this project are estimated in Table 10. A more detailed breakdown of the material costs, labor costs, and operating costs is presented in the cost assessment section of the Final Report (Imbrigiotta et al., 2007). Table 11 summarizes the cost comparison of materials, construction labor, and field labor costs per sample of each of the sampling technologies evaluated in this project.

48
Table 11. Comparison of material costs, construction labor costs, and field sampling labor costs for RCDM samplers, PDB samplers, and LF.
Costs RCDM Sampler
PDB Sampler LF
Materials costs/sample $20 $9 $128 Labor costs/sample -construction $38 $25 $18 Labor costs/sample - field sampling $25 $25 $160 Purge water disposal $0 $0 $5 Total Costs/Sample $83 $59 $311
All cost comparisons have assumed that the RCDM samplers were produced by project personnel. These costs would be expected to drop significantly if the RCDM sampler is produced commercially. It is significant to note that the field sampling labor costs per sample using RCDM samplers are decreased 84% (six times less) from these same costs when using a LF procedure. Therefore, there is a tremendous savings in personnel time in the field when using RCDM samplers versus LF. In addition, the overall sampling costs per sample using RCDM samplers are decreased 73% (three to four times less) from the same costs when using a LF procedure. Though RCDM samplers cost slightly more than PDB samplers to construct, overall they save costs when collection of both inorganic constituents and VOCs are required in a sample.
8.3.3 Cost Comparison per Site
Table 12 summarizes the life-cycle costs of the three sampling technologies evaluated in this project when used to monitor a typical site over the period of 30 years. All the basic assumptions for these calculations are given in Section 8.3.1 and Table 11.
Table 12. Comparison of sampling costs over a 30-year period for RCDM samplers, PDB samplers, and LF.
Costs RCDM Sampler
PDB Sampler* LF
Sampling cost/sample (from Table 11) $83 $59 $311 Samples (wells)/site 50 50 50 Sampling costs per site per sampling event $4150 $2950 $15,550 Sampling events per 30-year period 60 60 60 Total sampling costs per site per 30-year period $249,000 $177,000 $933,000 Total sampling cost savings per site per 30-year period over LF $684,000 $756,000 --
*PDB sampler collects VOC samples only. The use of RCDM samplers instead of LF in long-term monitoring plans can result in a 73% sampling cost savings over the length of the plan. The use of PDB samplers instead of LF in long-term monitoring plans can result in an 81% sampling cost savings over the length of the plan. Therefore, at sites where only sampling for VOCs is required, PDB samplers will be the more economical choice over either LF and RCDM samplers. However, at sites where sampling

49
for both VOCs and inorganics is required, the RCDM samplers will be the more economical choice over LF and PDB samplers (which cannot collect inorganic samples).

This page left blank intentionally.

51
9.0 IMPLEMENTATION ISSUES
9.1 RCDM SAMPLER DOCUMENTS
The Final Report for this demonstration (Imbrigiotta et al., 2007) is available on the SERDP/ESTCP web site (www.serdp-estcp.org). This report details the results that showed that for the large majority of chemical parameters tested in this demonstration, RCDM samplers were found to collect samples with comparable concentrations to samples collected with LF. A Protocol Report (Imbrigiotta et al., 2009) is also available on the ESTCP website for this project which details the proper construction procedures and conditions of use that must be followed and met when making and deploying RCDM samplers. Three of the investigators on the Points of Contact list (Appendix A) for this demonstration, including the principal investigator and the co-principal investigator, were long time members of the ITRC Diffusion/Passive Samplers Team. Members of the team included regulators from many state environmental agencies and USEPA, environmental professionals from the Navy, Air Force, Army, USGS, and private industry, and vendors of diffusion/passive sampling devices. The goal of this team was to evaluate the research on diffusion/passive samplers and to transfer worthwhile knowledge of this technology to those who could make use of it in the field. This group wrote several guidance documents on diffusion/passive samplers that are available on the ITRC web site (www.itrcweb.org). The two most recent guidance documents on diffusion/passive samplers (ITRC, 2005 (DSP-4); ITRC, 2007 (DSP-5) include chapters on RCDM samplers that were contributed by the principal and co-principal investigators of this demonstration.
9.2 LESSONS LEARNED
Limitations of the technology were found to be minimal. Samplers made with RCDM must be kept hydrated between the time they are constructed and deployed. Purported limitations of dialysis samplers due to water volume loss with time in high ionic strength waters and due to biodegradation were not significant when equilibration times in wells were one to two weeks. RCDM samplers do not sample effectively for mercury, silver, or tin. RCDM samplers may give correct to overestimates of iron and sulfide concentrations in some wells, so values of these parameters measured with RCDM samplers should be considered estimates. Many states currently have regulations or guidance documents that specific various purging or grab sampling methods are needed to collect groundwater samples to meet regulatory requirements. Regulatory acceptance of diffusion/passive samplers is currently being done on a state by state basis. Most state regulators will want to see a side-by-side comparison of RCDM samplers and whatever sampling technique is currently being employed at a site. This requires the collection and analysis of at least one to two sets of extra samples to accomplish the comparison, which can be costly to the site responsible party. If the comparison results agree, RCDM samplers are usually allowed to replace the previous sample collection technique. If the comparison results do not agree, the state regulators will be reluctant to allow replacement of the current sampling technique with RCDM samplers. A large part of gaining acceptance of RCDM samplers at a site is in educating the state regulators on how the samplers work and why the

52
RCDM samplers may give valid results that do not agree exactly with the current sampling technique being used at the site. As an example, New Jersey Department of Environmental Protection (NJDEP) site managers at the NAWC West Trenton, New Jersey site have approved the use of RCDM samplers as the sole means of sampling 39 wells at the site for long-term monitoring of inorganics and VOCs. NJDEP approval came about only because the U.S. Navy and the USGS conducted comparison sampling of RCDM samplers and LF at the site and found the comparison was favorable in these 39 wells. The driving force behind the U.S. Navy’s support for the implementation of RCDM samplers at this site is the large cost savings to the annual long-term monitoring plan sampling. Because there are currently no commercially available RCDM samplers of the type being tested in this demonstration, the samplers must be custom built by the user. This is a stumbling block to having these samplers tested at more sites. The authors of this report contacted one manufacturer about commercializing the RCDM sampler, and the response was initially enthusiastic. However, since they were also developing another passive sampler, they have not moved forward as quickly on the RCDM sampler. The lesson from this is that researchers should contact several potential manufacturers during ESTCP testing to spur on the process of commercialization more quickly. This project’s ESTCP Protocol on the proper use and construction of RCDM diffusion samplers should be instrumental in encouraging the commercialization of this technology.

53
10.0 REFERENCES
Britt, S.L. 2005. Testing the in-well horizontal laminar flow assumption with a sand-tank well model. Ground Water Monitoring and Remediation. 25 (3): 73-81.
Ehlke, T.A., T.E. Imbrigiotta, and J.M. Dale. 2004. Laboratory comparison of polyethylene and
dialysis membrane diffusion samplers. Ground Water Monitoring and Remediation. 24 (1): 53-59.
Gibs, J, G.A. Brown, K.S. Turner, C.L. MacLeod, J.C. Jelinski, and S.A. Koehnlein. 1993.
Effects of small-scale vertical variations in well-screen inflow rates and concentrations of organic compounds on the collection of representative ground-water quality samples. Ground Water. 35 (2): 201-208.
Gibs, J., Z. Szabo, T. Ivahnenko, and F.N. Wilde. 2000. Change in field turbidity and trace
element concentrations during well purging. Ground Water. 38 (4): 577-588. Harter, T., and S. Talozi. 2004. A simple, inexpensive dialysis sampler for small diameter
monitoring wells. Ground Water Monitoring and Remediation. 24 (4):97-105. Imbrigiotta, T.E., J.S. Trotsky, and M.C. Place. 2007. Demonstration and validation of a
regenerated cellulose dialysis membrane diffusion sampler for monitoring ground-water quality and remediation progress at DoD sites (ER-0313). ESTCP Final Report for Project ER-0313. www.serdp-estcp.org/Program-Areas/Environmental-Restoration/ Contaminated-Groundwater/Monitoring/ER-200313/ER-200313
Imbrigiotta, T.E., J.S. Trotsky, and M.C. Place. 2009. Protocol for use of regenerated cellulose
dialysis membrane diffusion samplers (ER-0313). ESTCP Protocol Report for Project ER-0313. www.serdp-estcp.org/Program-Areas/Environmental-Restoration/ Contaminated-Groundwater/Monitoring/ER-200313/ER-200313
Imbrigiotta, T.E., T.A. Ehlke, P.J. Lacombe, and J.M. Dale. 2002. Comparison of dialysis
membrane diffusion samplers and two purging methods in bedrock wells. In A.R. Gavaskar and A.S.C. Chen (Eds.), Remediation of Chlorinated and Recalcitrant Compounds. Proceedings of the Third International Conference on Remediation of Chlorinated and Recalcitrant Compounds, Monterey, California. May 2002.
Interstate Technology and Regulatory Council (ITRC). 2004. Technical and regulatory guidance
for using polyethylene diffusion bag samplers to monitor volatile organic compounds in ground water. ITRC Technical/Regulatory Guidelines Report. February 2004. 78 p.
Interstate Technology and Regulatory Council (ITRC). 2005. Technology Overview of Passive
Sampler Technologies. DSP-4. Washington, D.C.: Interstate Technology & Regulatory Council, Authoring Team. March 2006. 115 p.

54
Interstate Technology and Regulatory Council (ITRC). 2007. Protocol for Use of Five Passive
Samplers to Sample for a Variety of Contaminants in Groundwater. DSP-5. Washington, D.C.: Interstate Technology & Regulatory Council, Diffusion/Passive Sampler Team. http://www.itrcweb.org/Documents/DSP-5.pdf, February 2007, 121 p.
Iwakun, K., J. Biggar, J. Armstrong, R. Donahue, and D. Sego. 2008. Evaluation of a Dialysis
Sampler’s Integrity in a Cold Climate. Ground Water Monitoring and Remediation, 28 (1): 50-56.
LeBlanc, D.R. 2003. Diffusion and drive-point sampling to detect ordnance-related compounds
in shallow ground water beneath Snake Pond, Cape Cod, Massachusetts, 2001-2002. U.S. Geological Survey Water-Resources Investigations Report 03-4133. 20 p.
Lorah, M.M., D.R. Burris, and L.J. Dyer. 2004. Natural attenuation of chlorinated solvent
ground-water plumes discharging to wetlands. U.S. Geological Survey Scientific Investigations Report 2004-5220. 33 p.
Magaritz, M., M. Wells, A.J. Amiel, and D. Ronen. 1989. Application of a multi-layer sampler
based on the dialysis cell technique for the study of trace metals in ground water. Applied Geochemistry. 4: 617-624.
National Environmental Methods Index. 2002. Environmental methods comparison. http://www.nemi.gov. Parker, L.V., and N.D. Mulherin. 2006. Preliminary studies of alternative passive diffusion
devices for sampling explosives. In Proceedings for the 2006 North American Environmental Field Conference and Exposition, Tampa, Florida, January 10-12, 2006. 11 p.
Parsons. 2005. Results report for the demonstration of no-purge groundwater sampling devices
at former McClellan Air force Base, California. Contract No. F44650-99-D-0005. October 2005. 400 p.
Puls, R.W., and M.J. Barcelona. 1996. Ground water issue: Low-flow (minimal draw-down)
ground-water sampling procedures. U.S. Environmental Protection Agency Report EPA/540/S-95/504, R.S. Kerr Environmental Research Center, Ada, Oklahoma.
Reilly, T.E., and J. Gibs. 1993. Effects of physical and chemical heterogeneity on water-quality
samples obtained from wells. Ground Water. 31 (5): 805-813. Ronen, D., M. Magaritz, and I. Levy. 1987. An in situ multilevel sampler for preventive
monitoring and study of hydrochemical profiles in aquifers. Ground Water Monitoring Review. 7(4): 69-74.

55
S-PLUS. 2002. S-PLUS 6.1 for Windows, Professional Edition, Release 1. Insightful Corporation, Seattle, Washington. Revison Date May 23, 2002.
U.S. Environmental Protection Agency, (USEPA). 2003. SW-846 Online, Test Methods for
Evaluating Solid Waste, Physical/Chemical Methods. http://www.epa.gov/epaoswer/hazwaste/test/main.htm. Varljen, M.D., M.J. Barcelona, J. Obereiner, and D. Kaminski. 2006. Numerical simulations to
assess the monitoring zone achieved during low-flow purging and sampling. Ground Water Monitoring and Remediation. 26 (1): 44-52.
Vroblesky, D.A. 2001a. Users guide for polyethylene-based passive diffusion bag samplers to
obtain volatile organic compound concentrations in wells, Part 1: Deployment, recovery, data interpretation, and quality control and assurance. U.S. Geological Survey Water-Resources Investigations Report 01-4060. 18 p.
Vroblesky, D.A. 2001b. User’s guide for polyethylene-based passive diffusion bag samplers to
obtain volatile organic compound concentrations in wells. Part 2: Field Tests. U.S. Geological Survey Water-Resources Investigations Report 01-4061. 120 p.
Vroblesky, D.A., J. Manish, J. Morrell, and J.E. Peterson. 2003. Evaluation of passive diffusion
bag samplers, dialysis samplers, and nylon-screen samplers in selected wells at Andersen Air Force Base, Guam, March-April 2002. U.S. Geological Survey Water-Resources Investigations Report 03-4157. 29 p.
Vroblesky, D.A., M.D. Petkewich, and T.R. Campbell. 2002. Field tests of diffusion samplers for
inorganic constituents in wells and at a ground-water-discharge zone. U.S. Geological Survey Water-Resources Investigations Report 02-4031. 24 p.
Vroblesky, D.A., and Pravecek, T. 2002. Evaluation of passive diffusion bag and dialysis
samplers in selected wells at Hickam Air Force Base, Hawaii, July 2001. U.S. Geological Survey Water-Resources Investigations Report 02-4159. 28 p.

This page left blank intentionally.

A-1
APPENDIX A
POINTS OF CONTACT
Point of Contact Organization
Phone Fax
E-Mail Role Joseph Trotsky NAVFAC ESC
1100 23rd Avenue Port Hueneme, CA 93043-4370
(805) 982-1258 (805) 982-4304 (fax) [email protected]
Principal Investigator
Thomas Imbrigiotta USGS 810 Bear Tavern Road Suite 206 West Trenton, NJ 08628
(609) 771-3914 (609) 771-3915 (fax) [email protected]
Co-Principal Investigator and Field QA Officer
Matthew Place Battelle 505 King Avenue Columbus, OH 43201
(614) 424-4531 (614) 424-3667 (fax) [email protected]
Lab QA Officer and Project Staff
George Nicholas NJDEP PO Box 413 401 East State Street 4th Floor West Trenton, NJ 08625
(609) 984-6565 (609) 292-0848 (fax) [email protected]
Tech Transfer
Jeff Dale U.S. Navy Naval Facilities Engineering Command, Mid-Atlantic 4911 South Broad Street Bldg. 679m PNBC Philadelphia, PA 19112
(215) 897-4914 (215) 897-4902 (fax)
Site Support
[email protected] and Tech Transfer
Andrea Leeson ESTCP Office 901 N. Stuart Street Suite 303 Arlington, VA 22203
(703) 696-2118 (703) 696-2114 (fax) [email protected]
Environmental Restoration Program Manager

EStcP Program office901 north Stuart StreetSuite 303arlington, virginia 22203
(703) 696-2117 (Phone)(703) 696-2114 (fax)
E-mail: [email protected]


