
925 West Georgia Street, Suite 1805, Vancouver, B.C. Canada V6C 3L2 Phone: 604.688.3033 | Fax: 604.639.8873 | Toll Free: 1.866.529.2807 | Email: [email protected]
www.firstmajestic.com
CONDENSED CONSOLIDATED INTERIM FINANCIAL STATEMENTS
FOR THE QUARTER ENDED
MARCH 31, 2012
(UNAUDITED)

MANAGEMENT’S RESPONSIBILITY FOR FINANCIAL REPORTING The condensed consolidated interim financial statements of First Majestic Silver Corp. (the “Company”) are the responsibility of the Company’s management. The condensed consolidated financial statements are prepared in accordance with International Financial Reporting Standards as issued by the International Accounting Standards Board and reflect management’s best estimates and judgment based on information currently available. Management has developed and maintains a system of internal controls to ensure that the Company’s assets are safeguarded, transactions are authorized and properly recorded, and financial information is reliable. The Board of Directors is responsible for ensuring management fulfills its responsibilities. The Audit Committee reviews the results of the condensed consolidated interim financial statements prior to their submission to the Board of Directors for approval. The condensed consolidated interim financial statements have not been audited. “Keith Neumeyer” “Raymond Polman” Keith Neumeyer Raymond Polman, CA President & CEO Chief Financial Officer May 9, 2012 May 9, 2012
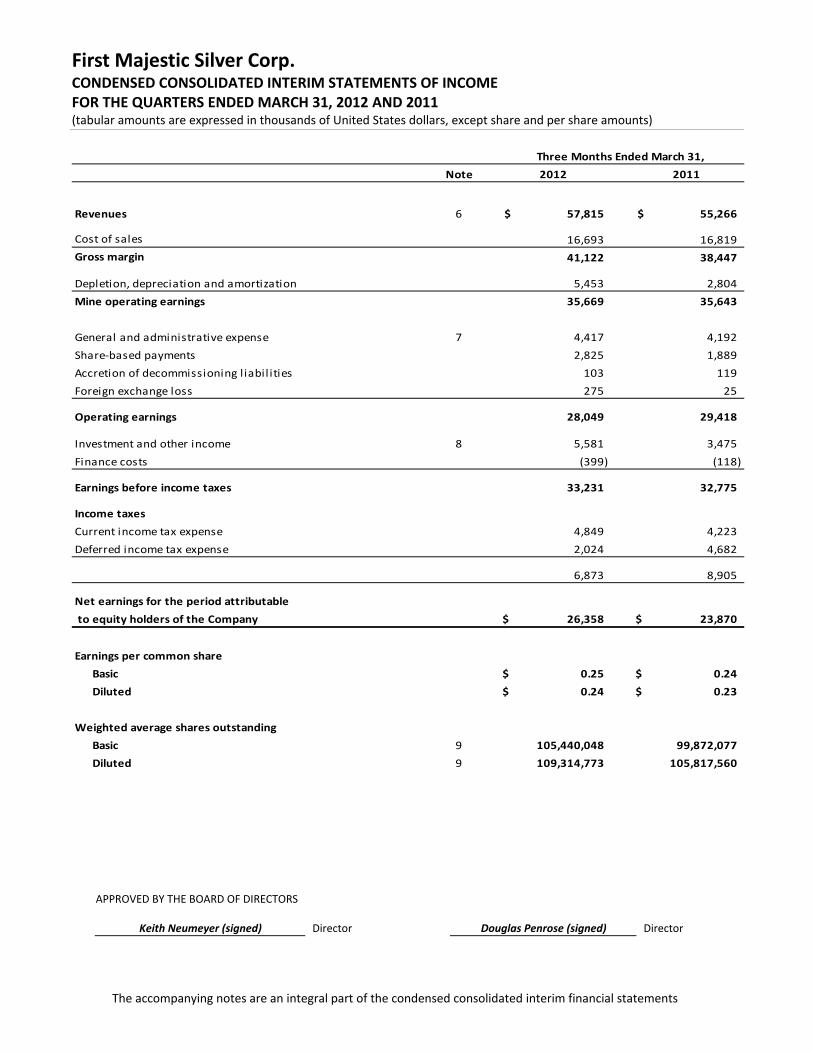
First Majestic Silver Corp. CONDENSED CONSOLIDATED INTERIM STATEMENTS OF INCOME FOR THE QUARTERS ENDED MARCH 31, 2012 AND 2011 (tabular amounts are expressed in thousands of United States dollars, except share and per share amounts)
The accompanying notes are an integral part of the condensed consolidated interim financial statements
Note 2012 2011
Revenues 6 57,815$ 55,266$
Cost of sales 16,693 16,819
Gross margin 41,122 38,447
Depletion, depreciation and amortization 5,453 2,804
Mine operating earnings 35,669 35,643
General and administrative expense 7 4,417 4,192
Share‐based payments 2,825 1,889
Accretion of decommissioning l iabil ities 103 119
Foreign exchange loss 275 25
Operating earnings 28,049 29,418
Investment and other income 8 5,581 3,475
Finance costs (399) (118)
Earnings before income taxes 33,231 32,775
Income taxes
Current income tax expense 4,849 4,223
Deferred income tax expense 2,024 4,682
6,873 8,905
Net earnings for the period attributable
to equity holders of the Company 26,358$ 23,870$
Earnings per common share
Basic 0.25$ 0.24$
Diluted 0.24$ 0.23$
Weighted average shares outstanding
Basic 9 105,440,048 99,872,077
Diluted 9 109,314,773 105,817,560
Three Months Ended March 31,
APPROVED BY THE BOARD OF DIRECTORS
Keith Neumeyer (signed) Director Douglas Penrose (signed) Director

First Majestic Silver Corp. CONDENSED CONSOLIDATED INTERIM STATEMENTS OF COMPREHENSIVE INCOME FOR THE QUARTERS ENDED MARCH 31, 2012 AND 2011 (tabular amounts are expressed in thousands of United States dollars)
The accompanying notes are an integral part of the condensed consolidated interim financial statements
2012 2011
Net earnings for the period attributable
to equity holders of the Company 26,358$ 23,870$
Other comprehensive income
Available for sale investments:
Unrealized loss on fair value of investments (2,737) (87)
Currency translation gain 386 493
Other comprehensive income (loss) (2,351) 406
Comprehensive income for the period attributable
to equity holders of the Company 24,007$ 24,276$
Three Months Ended March 31,

First Majestic Silver Corp. CONDENSED CONSOLIDATED INTERIM STATEMENTS OF CASH FLOW FOR THE QUARTERS ENDED MARCH 31, 2012 AND 2011 (tabular amounts are expressed in thousands of United States dollars)
The accompanying notes are an integral part of the condensed consolidated interim financial statements
Note 2012 2011
OPERATING ACTIVITIES
Net earnings for the period 26,358$ 23,870$
Adjustments for:
Share‐based payments 2,825 1,889
Depletion, depreciation and amortization 5,453 2,804
Accretion of decommissioning l iabil ities 103 119
Investment income from derivative financial instruments (5,475) (3,225)
Current income taxes 4,849 4,223
Deferred income taxes 2,024 4,682
Finance costs 399 118
Unrealized foreign exchange loss and other 583 516
Operating cash flows before movements in working capital and
income taxes 37,119 34,996
Net change in non‐cash working capital items 24 8,550 (229)
Income taxes paid (7,143) (344)
Cash generated by operating activities 38,526 34,423
INVESTING ACTIVITIES
Expenditures on mineral property interests (22,208) (5,227)
Acquisition of property, plant and equipment (10,880) (4,455)
Increase in deposits on long‐term assets (5,896) (3,761)
Proceeds from realized gain on disposal of derivative financial instruments 1,563 3,225
Proceeds from disposal of marketable securities 2,488 ‐
Investment in marketable securities (9,999) ‐
Cash used in investing activities (44,932) (10,218)
FINANCING ACTIVITIES
Proceeds from exercise of stock options and share warrants 2,524 17,937
Payment of lease obligations (1,309) (326)
Finance costs paid (399) (118)
Repayment of debt facilities (648) ‐
Proceeds from lease financing ‐ 2,474
Payment of other long‐term l iabil ities ‐ (37)
Cash generated by financing activities 168 19,930
(Decrease) increase in cash and cash equivalents (6,238) 44,135
Effect of exchange rate on cash held in foreign currencies 387 326
Cash and cash equivalents, beginning of period 91,184 41,163
Cash and cash equivalents, end of period 85,333$ 85,624$
Supplemental cash flow information 24
Three Months Ended March 31,

First Majestic Silver Corp. CONDENSED CONSOLIDATED INTERIM STATEMENTS OF FINANCIAL POSITION AS AT MARCH 31, 2012 AND DECEMBER 31, 2011 (tabular amounts are expressed in thousands of United States dollars)
The accompanying notes are an integral part of the condensed consolidated interim financial statements
Note March 31, 2012 December 31, 2011
Assets
Current assets
Cash and cash equivalents 85,333$ 91,184$
Trade and other receivables 10 14,431 15,593
Income taxes receivable 26 11,270 9,734
Inventories 11 18,313 14,661
Other financial assets 12 10,259 4,865
Prepaid expenses and other 13 2,369 1,535
Total current assets 141,975 137,572
Non‐current assets
Mining interests 14 176,755 157,865
Property, plant and equipment 15 140,975 129,040
Deferred tax assets 7,208 8,331
Deposits on long‐term assets 16 13,970 10,504
Total assets 480,883$ 443,312$
Liabilities and Equity
Current liabilities
Trade and other payables 17 27,499$ 22,433$
Other financial l iabil ities 18 790 383
Debt facil ities 19 137 784
Current portion of lease obligations 20 5,231 4,269
Total current liabilities 33,657 27,869
Non‐current liabilities
Lease obligations 20 10,647 9,825
Decommissioning l iabilities 6,778 6,123
Deferred tax l iabil ities 50,361 48,897
Total liabilities 101,443 92,714
Equity
Shareholders' equity
Share capital 21 276,799 273,304
Equity reserves 22 26,833 27,844
Retained earnings 75,808 49,450
Total equity 379,440 350,598
Total liabilities and equity 480,883$ 443,312$
Contingent l iabil ities (Note 25)
Subsequent events (Note 26)

First Majestic Silver Corp. CONDENSED CONSOLIDATED INTERIM STATEMENTS OF CHANGES IN EQUITY FOR THE QUARTERS ENDED MARCH 31, 2012 AND 2011 (tabular amounts are expressed in thousands of United States dollars, except share amounts)
The accompanying notes are an integral part of the condensed consolidated interim financial statements
Shares Amount To be issued Total
Share‐based
payment
Available for
sale
revaluation
Foreign
currency
translation
Total equity
reserves
Retained
earnings
(Accumulated
deficit) Total equity
Balance at December 31, 2010 97,560,417 239,525$ 245$ 239,770$ 25,170$ 18$ 621$ 25,809$ (54,124)$ 211,455$
Net earnings ‐ ‐ ‐ ‐ ‐ ‐ ‐ ‐ 23,870 23,870
Share‐based payment ‐ ‐ ‐ ‐ 1,889 ‐ ‐ 1,889 ‐ 1,889
Other comprehens ive income (loss) ‐ ‐ ‐ ‐ ‐ (87) 493 406 ‐ 406
Shares i s sued for:
Exercise of options 391,200 1,303 ‐ 1,303 ‐ ‐ ‐ ‐ ‐ 1,303
Exercise of warrants 4,731,593 16,637 ‐ 16,637 ‐ ‐ ‐ ‐ ‐ 16,637
Transfer of equity reserve upon exercise of
options and warrants ‐ 1,527 ‐ 1,527 (1,527) ‐ ‐ (1,527) ‐ ‐
Balance at March 31, 2011 102,683,210 258,992$ 245$ 259,237$ 25,532$ (69)$ 1,114$ 26,577$ (30,254)$ 255,560$
Balance at December 31, 2011 105,135,372 273,094$ 210$ 273,304$ 27,394$ 1,127$ (677)$ 27,844$ 49,450$ 350,598$
Net earnings ‐ ‐ ‐ ‐ ‐ ‐ ‐ ‐ 26,358 26,358
Share‐based payment, net of related tax benefi ts ‐ ‐ ‐ ‐ 2,302 ‐ ‐ 2,302 ‐ 2,302
Other comprehens ive income (loss) ‐ ‐ ‐ ‐ ‐ (2,737) 386 (2,351) ‐ (2,351)
Shares i s sued for:
Exercise of options 431,650 2,533 ‐ 2,533 ‐ ‐ ‐ ‐ ‐ 2,533
Convers ion of shares to be i s sued (Note 21(c)) 250 1 (1) ‐ ‐ ‐ ‐ ‐ ‐ ‐
Transfer of equity reserve upon exercise of
options and warrants ‐ 962 ‐ 962 (962) ‐ ‐ (962) ‐ ‐
Balance at March 31, 2012 105,567,272 276,590$ 209$ 276,799$ 28,734$ (1,610)$ (291)$ 26,833$ 75,808$ 379,440$
Equity ReservesShare Capital
Total comprehensive income for the three months ended March 31, 2012 was $24,007,000 (2011 ‐ $24,276,000).
First Majestic Silver Corp. NOTES TO CONDENSED CONSOLIDATED INTERIM FINANCIAL STATEMENTS (tabular amounts are expressed in thousands of United States dollars)
Notes Page 1
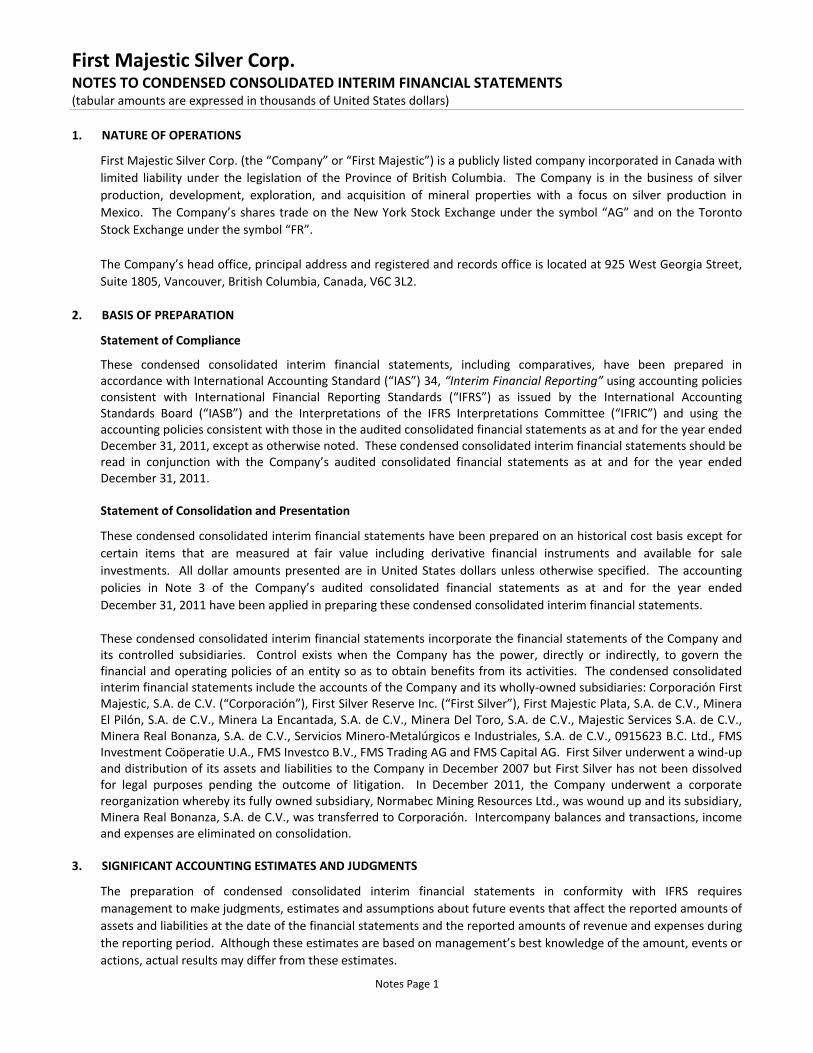
1. NATURE OF OPERATIONS
First Majestic Silver Corp. (the “Company” or “First Majestic”) is a publicly listed company incorporated in Canada with
limited liability under the legislation of the Province of British Columbia. The Company is in the business of silver
production, development, exploration, and acquisition of mineral properties with a focus on silver production in
Mexico. The Company’s shares trade on the New York Stock Exchange under the symbol “AG” and on the Toronto
Stock Exchange under the symbol “FR”.
The Company’s head office, principal address and registered and records office is located at 925 West Georgia Street,
Suite 1805, Vancouver, British Columbia, Canada, V6C 3L2.
2. BASIS OF PREPARATION
Statement of Compliance
These condensed consolidated interim financial statements, including comparatives, have been prepared in accordance with International Accounting Standard (“IAS”) 34, “Interim Financial Reporting” using accounting policies consistent with International Financial Reporting Standards (“IFRS”) as issued by the International Accounting Standards Board (“IASB”) and the Interpretations of the IFRS Interpretations Committee (“IFRIC”) and using the accounting policies consistent with those in the audited consolidated financial statements as at and for the year ended December 31, 2011, except as otherwise noted. These condensed consolidated interim financial statements should be read in conjunction with the Company’s audited consolidated financial statements as at and for the year ended December 31, 2011. Statement of Consolidation and Presentation
These condensed consolidated interim financial statements have been prepared on an historical cost basis except for
certain items that are measured at fair value including derivative financial instruments and available for sale
investments. All dollar amounts presented are in United States dollars unless otherwise specified. The accounting
policies in Note 3 of the Company’s audited consolidated financial statements as at and for the year ended
December 31, 2011 have been applied in preparing these condensed consolidated interim financial statements.
These condensed consolidated interim financial statements incorporate the financial statements of the Company and its controlled subsidiaries. Control exists when the Company has the power, directly or indirectly, to govern the financial and operating policies of an entity so as to obtain benefits from its activities. The condensed consolidated interim financial statements include the accounts of the Company and its wholly‐owned subsidiaries: Corporación First Majestic, S.A. de C.V. (“Corporación”), First Silver Reserve Inc. (“First Silver”), First Majestic Plata, S.A. de C.V., Minera El Pilón, S.A. de C.V., Minera La Encantada, S.A. de C.V., Minera Del Toro, S.A. de C.V., Majestic Services S.A. de C.V., Minera Real Bonanza, S.A. de C.V., Servicios Minero‐Metalúrgicos e Industriales, S.A. de C.V., 0915623 B.C. Ltd., FMS Investment Coöperatie U.A., FMS Investco B.V., FMS Trading AG and FMS Capital AG. First Silver underwent a wind‐up and distribution of its assets and liabilities to the Company in December 2007 but First Silver has not been dissolved for legal purposes pending the outcome of litigation. In December 2011, the Company underwent a corporate reorganization whereby its fully owned subsidiary, Normabec Mining Resources Ltd., was wound up and its subsidiary, Minera Real Bonanza, S.A. de C.V., was transferred to Corporación. Intercompany balances and transactions, income and expenses are eliminated on consolidation.
3. SIGNIFICANT ACCOUNTING ESTIMATES AND JUDGMENTS
The preparation of condensed consolidated interim financial statements in conformity with IFRS requires
management to make judgments, estimates and assumptions about future events that affect the reported amounts of
assets and liabilities at the date of the financial statements and the reported amounts of revenue and expenses during
the reporting period. Although these estimates are based on management’s best knowledge of the amount, events or
actions, actual results may differ from these estimates.

First Majestic Silver Corp. NOTES TO CONDENSED CONSOLIDATED INTERIM FINANCIAL STATEMENTS (tabular amounts are expressed in thousands of United States dollars)
Notes Page 2
3. SIGNIFICANT ACCOUNTING ESTIMATES AND JUDGMENTS (continued)
Critical judgments exercised in applying accounting policies that have the most significant effect on the amounts recognized in the condensed consolidated interim financial statements include: economic recoverability and probability of future economic benefits of exploration; evaluation and development costs; and commencement of commercial production and production levels intended by management.
Information about assumptions and estimation uncertainties that have a significant risk of resulting in material
adjustments include: impairment of property, plant and equipment and mining interests; depreciation and
amortization rates for property, plant and equipment and depletion rates for mining interests; estimated reclamation
and closure costs; mineral reserve estimates; inventory valuation; valuation of share‐based payments; and income
taxes.
4. RECENT ACCOUNTING PRONOUNCEMENTS
Financial instruments
The IASB intends to replace IAS 39 – Financial Instruments: Recognition and Measurement (“IAS 39”) in its entirety with IFRS 9 – Financial Instruments (“IFRS 9”) in three main phases. IFRS 9 will be the new standard for the financial reporting of financial instruments that is principles‐based and less complex than IAS 39, and is effective for annual periods beginning on or after January 1, 2013, with earlier adoption permitted. The Company will evaluate the impact the final standard will have on its consolidated financial statements when issued. Consolidated Financial Statements
In May 2011, the IASB issued IFRS 10 ‐ Consolidated Financial Statements (“IFRS 10”) and IFRS 12 ‐ Disclosure of Interests in Other Entities (“IFRS 12”). IFRS 10 establishes principles for the presentation and preparation of consolidated financial statements when an entity controls one or more other entities. IFRS 12 outlines the disclosure requirements for interests in subsidiaries and other entities to enable users to evaluate the risks associated with interests in other entities and the effects of those interests on an entity’s financial position, financial performance and cash flows. IFRS 10 and IFRS 12 are effective for annual periods beginning on or after January 1, 2013, with earlier application permitted if adopted along with IFRS 11, IFRS 12, IAS 27 (revised) and IAS 28 (revised). The Company is evaluating the impact of these new standards on its consolidated financial statements.
Joint Arrangements
In May 2011, the IASB issued IFRS 11 ‐ Joint Arrangements (“IFRS 11”), which provides guidance on accounting for joint arrangements. IFRS 11 classifies joint arrangements as either joint operations or joint ventures, depending on the rights and obligations of the parties involved. An entity accounts for a joint operation by recognizing its portion of the assets, liabilities, revenues and expenses. A joint venture is accounted for using the equity method and proportionate consolidation is no longer permitted. This standard is effective for annual periods beginning on or after January 1, 2013, with early adoption permitted. The Company does not anticipate these new standards to have a significant impact on its consolidated financial statements.
Fair Value Measurement
In May 2011, the IASB issued IFRS 13 ‐ Fair Value Measurement (“IFRS 13”). This standard defines fair value as the price that would be received to sell an asset or paid to transfer a liability in an orderly transaction between market participants at the measurement date. IFRS 13 sets out a single IFRS framework for measuring fair value and outlines disclosure requirements about fair value measurements. IFRS 13 is effective for annual periods on or after January 1, 2013, with earlier application permitted. This IFRS is to be applied prospectively as of the beginning of the annual period in which it is initially applied and the disclosure requirements do not need to be applied in comparative periods before initial application. The Company is currently assessing the impact of this standard on its financial statements.

First Majestic Silver Corp. NOTES TO CONDENSED CONSOLIDATED INTERIM FINANCIAL STATEMENTS (tabular amounts are expressed in thousands of United States dollars)
Notes Page 3
4. RECENT ACCOUNTING PRONOUNCEMENTS (continued)
Items of Other Comprehensive Income
In June 2011, the IASB issued an amendment to IAS 1 – Presentation of Items of Other Comprehensive Income (“amendments to IAS1”). The amendments to IAS1 require items of OCI, along with their tax effects, to be grouped into those that will and will not subsequently be reclassified to profit or loss. The measurement and recognition of items of profit or loss and OCI are not affected by the amendments. This amendment is effective for annual periods beginning on or after July 1, 2012 with earlier application permitted. The Company does not anticipate this amendment to have a material impact on its consolidated financial statements.
5. SEGMENTED INFORMATION
The Company has three operating segments located in Mexico, two development projects in Mexico, one retail market segment in Canada and one silver trading segment in Europe. All of the Company’s operations are within the mining industry and its major products are silver doré and lead‐silver concentrate. Transfer prices between business segments are set on an arm’s‐length basis in a manner similar to transactions with third parties.
An operating segment is defined as a component of the Company that:
engages in business activities from which it may earn revenues and incur expenses;
whose operating results are reviewed regularly by the entity’s chief operating decision maker; and for which discrete financial information is available.
Significant information relating to the Company’s reporting operating segments is summarized in the table below:
Revenue Cost of sales
Depletion,
depreciation
and
amortization
Mine operating
earnings (loss)
Capital
expenditures
Mexico
San Martin 6,064$ 2,820$ 960$ 2,284$ 3,850$
La Parri l la 20,714 6,318 2,336 12,060 14,729
La Encantada 18,853 7,454 2,157 9,242 7,729
Del Toro ‐ ‐ ‐ ‐ 8,982
La Luz ‐ ‐ ‐ ‐ 1,557
Canada
Coin Sales 1,190 1,330 ‐ (140) ‐
Europe
Doré Sales 40,140 28,001 ‐ 12,139 ‐
Corporate and Eliminations (29,146) (29,230) ‐ 84 674
Consolidated 57,815$ 16,693$ 5,453$ 35,669$ 37,521$
Three Months Ended March 31, 2012
Revenue Cost of sales
Depletion,
depreciation
and
amortization
Mine operating
earnings (loss)
Capital
expenditures
Mexico
San Martin 9,536$ 3,309$ 346$ 5,881$ 1,803$
La Parril la 10,047 3,317 853 5,877 4,020
La Encantada 34,090 10,035 1,384 22,671 3,878
Del Toro ‐ ‐ ‐ ‐ 1,386
La Luz ‐ ‐ ‐ ‐ 298
Canada
Coin and Doré Sales 9,348 8,212 ‐ 1,136 ‐
Corporate and Eliminations (7,755) (8,054) 221 78 49
Consolidated 55,266$ 16,819$ 2,804$ 35,643$ 11,434$
Three Months Ended March 31, 2011

First Majestic Silver Corp. NOTES TO CONDENSED CONSOLIDATED INTERIM FINANCIAL STATEMENTS (tabular amounts are expressed in thousands of United States dollars)
Notes Page 4
5. SEGMENTED INFORMATION (continued)
Total assets Total liabilities Total assets Total liabilities
Mexico
San Martin 71,739$ 15,508$ 69,288$ 19,734$
La Parril la 176,555 39,962 148,446 15,043
La Encantada 136,611 30,301 127,491 21,929
Canada
Coin and Doré Sales 644 38 728 139
Europe
Doré Sales 38,260 5,509 30,483 4,484
Corporate and Eliminations 57,074 10,125 66,876 31,385
Consolidated 480,883$ 101,443$ 443,312$ 92,714$
At March 31, 2012 At December 31, 2011
6. REVENUES
Three Months Ended Three Months Ended
March 31, 2012 March 31, 2011
Gross revenue from payable ounces of s i lver equiva lents 61,687$ 56,927$
Less : refining & smelting, net of intercompany el iminations (3,872) (1,661)
Revenues 57,815$ 55,266$
7. GENERAL AND ADMINISTRATIVE EXPENSES
The general and administrative expenses for the Company are comprised of the following:
Three Months Ended Three Months Ended
March 31, 2012 March 31, 2011
Corporate adminis tration 1,123$ 1,195$
Salaries and benefi ts 2,070 1,930
Audit, lega l and profess ional fees 762 630
Fi l ing and l i s ting fees 197 298
Directors fees and expenses 167 77
Depreciation 98 62
4,417$ 4,192$
8. INVESTMENT AND OTHER INCOME
The Company’s investment and other income (loss) is comprised of the following:
Three Months Ended Three Months Ended
March 31, 2012 March 31, 2011
Gain from investment in derivative investments 5,475$ 3,225$
Interest income and other 106 250
5,581$ 3,475$

First Majestic Silver Corp. NOTES TO CONDENSED CONSOLIDATED INTERIM FINANCIAL STATEMENTS (tabular amounts are expressed in thousands of United States dollars)
Notes Page 5
9. EARNINGS PER SHARE
The calculations of basic and diluted earnings per share for the three months ended March 31, 2012 and 2011 are
based on the following:
Three Months Ended Three Months Ended
March 31, 2012 March 31, 2011
Net income for the period attributable to equity
holders of the Company 26,358$ 23,870$
Weighted average number of shares on i ssue ‐ bas ic 105,440,048 99,872,077
Adjustments for:
Share options 3,874,725 3,907,879
Warrants ‐ 2,037,604
Weighted average number of shares on i ssue ‐ di luted 109,314,773 105,817,560
Earnings per share ‐ bas ic 0.25$ 0.24$
Earnings per share ‐ di luted 0.24$ 0.23$
10. TRADE AND OTHER RECEIVABLES
Trade and other receivables of the Company are comprised of:
March 31, 2012 December 31, 2011
Trade receivables 7,094$ 6,269$
Value added taxes and other taxes recoverable 6,595 8,872
Loan receivable from suppl ier and other 742 452
14,431$ 15,593$
The Company does not hold any collateral for any receivable amounts outstanding at March 31, 2012 and December 31, 2011. Trade and other receivables include $608,000 (December 31, 2011 ‐ $557,000) in value added taxes recoverable that have been outstanding for more than one year. The Company expects full recovery of the amounts outstanding and therefore no impairment has been recorded against these receivables.
11. INVENTORIES
March 31, 2012 December 31, 2011
Finished product ‐ doré and concentrates 583$ 799$
Work in process 5,138 4,027
Stockpi le 792 409
Materia ls and suppl ies 11,498 8,934
Si lver coins and bul l ion including in‐process shipments 302 492
18,313$ 14,661$
The amount of inventories recognized as an expense during the period is equivalent to cost of sales for the period and no inventory write‐downs were recorded or reversed during the periods presented.

First Majestic Silver Corp. NOTES TO CONDENSED CONSOLIDATED INTERIM FINANCIAL STATEMENTS (tabular amounts are expressed in thousands of United States dollars)
Notes Page 6
12. OTHER FINANCIAL ASSETS
March 31, 2012 December 31, 2011
Marketable securi ties ‐ avai lable‐for‐sa le 2,128$ 4,865$
Marketable securi ties ‐ fa i r va lue through profi t and loss 8,131 ‐
10,259$ 4,865$
In January 2012, the Company purchased 757,500 trust units of Sprott Physical Silver Trust (PSLV) at $13.20 per unit for a total cost of $9,999,000. These trust units are classified as fair value through profit and loss (“FVTPL”) marketable securities, with changes in fair value recorded through profit and loss. During the three months ended March 31, 2012, 160,980 trust units were sold for a realized gain of $363,000 and an unrealized gain of $256,000 was recorded on the remaining 596,520 trust units, which has a cost of $7,875,000 (December 31, 2011 ‐ $nil). As at March 31, 2012, the Company also holds various investments designated as available‐for‐sale (“AFS”) marketable securities, with cost of $3,667,000 (December 31, 2011 ‐ $3,713,000). Changes in fair value on AFS marketable securities are recognized in other comprehensive income or loss, unless there is objective evidence of impairment.
13. PREPAIDS EXPENSES AND OTHER
The Company's prepaid expenses and other are comprised of:
March 31, 2012 December 31, 2011
Prepayments to suppl iers and contractors 1,955$ 1,138$
Depos i ts 414 397
2,369$ 1,535$
14. MINING INTERESTS
The Company’s mining interest is composed of the following:
March 31, 2012 December 31, 2011
Producing properties 101,437$ 91,116$
Exploration properties (non‐depletable) 75,318 66,749
176,755$ 157,865$

First Majestic Silver Corp. NOTES TO CONDENSED CONSOLIDATED INTERIM FINANCIAL STATEMENTS (tabular amounts are expressed in thousands of United States dollars)
Notes Page 7
14. MINING INTERESTS (continued)
Producing properties are allocated as follows:
La Encantada La Parrilla San Martin
Producing properties Silver Mine Silver Mine Silver Mine Total
Cost
At December 31, 2010 17,512$ 27,452$ 38,337$ 83,301$
Additions 8,305 15,869 3,571 27,745
Change in decommiss ioning l iabi l i ties (25) (525) 164 (386)
Transfer from exploration properties 1,472 4,394 5 5,871
At December 31, 2011 27,264$ 47,190$ 42,077$ 116,531$
Additions 3,312 6,943 1,334 11,589
At March 31, 2012 30,576$ 54,133$ 43,411$ 128,120$
Accumulated depletion and amortization
At December 31, 2010 (4,200)$ (3,829)$ (12,531)$ (20,560)$
Depletion and amortization (1,840) (1,573) (1,442) (4,855)
At December 31, 2011 (6,040)$ (5,402)$ (13,973)$ (25,415)$
Depletion and amortization (238) (473) (557) (1,268)
At March 31, 2012 (6,278)$ (5,875)$ (14,530)$ (26,683)$
Carrying value
At December 31, 2011 21,224$ 41,788$ 28,104$ 91,116$
At March 31, 2012 24,298$ 48,258$ 28,881$ 101,437$
Exploration properties are allocated as follows:
La Encantada La Parrilla San Martin Del Toro La Luz
Exploration properties Silver Mine Silver Mine Silver Mine Silver Mine Silver Project Total
Cost
At December 31, 2010 2,935$ 7,790$ 15,432$ 11,640$ 19,122$ 56,919$
Exploration and eva luation expenditures 2,057 2,274 3,008 10,472 1,242 19,053
Proceeds from option payment (f) ‐ ‐ (3,400) ‐ ‐ (3,400)
Change in decommiss ioning l iabi l i ties ‐ ‐ ‐ ‐ 48 48
Transfer to producing properties (1,472) (4,394) (5) ‐ ‐ (5,871)
At December 31, 2011 3,520$ 5,670$ 15,035$ 22,112$ 20,412$ 66,749$
Exploration and eva luation expenditures 1,371 475 1,728 4,754 241 8,569
At March 31, 2012 4,891$ 6,145$ 16,763$ 26,866$ 20,653$ 75,318$
(a) La Encantada Silver Mine, Coahuila State
The La Encantada Silver Mine is a producing underground mine located in northern Mexico 708 kilometres north east of Torreon, Coahuila and is accessible via a 1.5 hour flight from Torreon, Coahuila. The La Encantada Silver Mine consists of a 4,000 tpd cyanidation plant which achieved commercial production on April 1, 2010, a 1,000 tpd flotation plant (currently in care‐and‐maintenance), a village with 180 houses as well as administrative offices, laboratory, general store, hospital, schools, church, airstrip and all the infrastructure required for such an operation. The mine is comprised of 4,076 hectares of mining rights and surface land ownership of 1,343 hectares. The closest town, Muzquiz, is 225 km away via mostly paved road. The Company owns 100% of the La Encantada Silver Mine.

First Majestic Silver Corp. NOTES TO CONDENSED CONSOLIDATED INTERIM FINANCIAL STATEMENTS (tabular amounts are expressed in thousands of United States dollars)
Notes Page 8
14. MINING INTERESTS (continued)
(b) La Parrilla Silver Mine, Durango State
The La Parrilla Silver Mine, located approximately 65 kilometres southeast of the city of Durango, Mexico, is a group of producing underground operations consisting of the Rosarios / La Rosa and La Blanca mines which are inter‐connected through underground workings, and the San Marcos and the Quebradillas mines which are connected via gravel road ways. La Parrilla includes a 2,000 tpd processing plant consisting of the new 1,000 tpd cyanidation and 1,000 tpd flotation circuits, buildings, offices and associated infrastructure. The Company owns 100% of the La Parrilla Silver Mine. There is a net smelter royalty (“NSR”) agreement of 1.5% of sales revenue associated with the Quebradillas Mine, with a maximum payable of $2.5 million. The Company has an option to purchase the NSR at any time for an amount of $2.0 million. For the three months ended March 31, 2012, the Company paid royalties of $181,000 (2011 ‐ $27,000). As at March 31, 2012, the sum of total royalties paid to date for the Quebradillas NSR is $871,000.
(c) San Martin Silver Mine, Jalisco State
The San Martin Silver Mine is a producing underground mine located adjacent to the town of San Martin de Bolaños, in northern Jalisco State, Mexico, 290 km north east of Guadalajara, Mexico, and is owned 100% by the Company. The mine comprises approximately 7,841 hectares of mineral rights, 1,300 hectares of surface rights surrounding the mine, and another 104 hectares of surface rights where the 950 tpd cyanidation plant and 500 tpd flotation plant (currently in care and maintenance), mine buildings, offices and related infrastructure. During 2011, several improvements were made including the installation of a new ball mill, replacing an older and smaller mill, the replacement of the filter presses in the Merrill‐Crowe circuit, and the addition of two new induction furnaces.
(d) Del Toro Silver Mine, Zacatecas State
The Del Toro Silver Mine is located 60 km to the southeast of the Company’s La Parrilla Silver Mine and consists of 405 contiguous hectares of mining claims, including the Dolores area, plus an additional 129 hectares of surface rights covering the area surrounding the San Juan mine. The Del Toro operation represents the consolidation of two old silver mines, the Perseverancia and San Juan mines, which are approximately one kilometre apart. Del Toro is presently an operating division of the Company’s First Majestic Plata, S.A. de C.V. subsidiary, although plans are underway to transfer its assets into a newly formed subsidiary of the Company to better isolate its operating results from the La Parrilla Mine as the plant begins production in late 2012. First Majestic owns 100% of the Del Toro Silver Mine. In the third quarter of 2011, the Company acquired a neighbouring property called Dolores for $1.5 million. The property includes 12 hectares of land and a small producing mine where a small amount of high grade ore was shipped to La Parrilla by the previous owner.
(e) La Luz Silver Project, San Luis Potosi State
The La Luz Silver Project, is located 25 km west of the town of Matehuala in San Luis Potosi State, Mexico, near the village of Real de Catorce and was acquired in November 2009, through the acquisition of Normabec Mining Resources Ltd. ("Normabec"). The Company owns 100% of the La Luz Silver Project and all of the associated mining claims of what was historically known as the Santa Ana mine and consists of 35 mining concessions covering 5,738 hectares, with estimated historical production of 230 million ounces between 1773 and 1990.

First Majestic Silver Corp. NOTES TO CONDENSED CONSOLIDATED INTERIM FINANCIAL STATEMENTS (tabular amounts are expressed in thousands of United States dollars)
Notes Page 9
14. MINING INTERESTS (continued)
(f) Jalisco Group of Properties, Jalisco State
The Company also owns the Jalisco Group of Properties which consist of 5,240 hectares of mining claims in Jalisco State, Mexico. On April 15, 2011, a definitive agreement was entered into with Sonora Resources Corp. (the “Optionee”) whereby the Optionee has an option to acquire up to 90% in the Jalisco Group of Properties (the “Properties”) located in Jalisco State, Mexico. The Optionee issued 10 million shares of common stock with a fair value of $3.4 million to the Company and is committed to spend $3 million over the first three years to earn a 50% interest and $5 million over five years to earn a 70% interest. In order to obtain a 90% interest, the Optionee is required to complete a bankable feasibility study within seven years. First Majestic will retain a 10% free carried interest and a 2.375% NSR. The fair value of common shares received from the Optionee was recorded in other financial assets with a corresponding reduction in the carrying value of the San Martin mining interests during the period.
15. PROPERTY, PLANT AND EQUIPMENT
Property, plant and equipment are composed of the following:
Land and
Buildings
Machinery and
equipment
Assets under
construction Other Total
Cost
At December 31, 2010 $ 14,953 $ 67,032 $ 2,731 $ 2,078 86,794$
Additions 5,722 25,066 34,671 1,675 67,134
At December 31, 2011 20,675$ 92,098$ 37,402$ 3,753$ 153,928$
Additions 1,362 7,032 7,138 671 16,203
Transfers 14,092 13,998 (28,090) ‐ ‐
At March 31, 2012 36,129$ 113,128$ 16,450$ 4,424$ 170,131$
Accumulated depreciation and amortization
At December 31, 2010 (3,485)$ (9,801)$ ‐$ (1,125)$ (14,411)$
Depreciation and amortization (1,846) (7,501) ‐ (1,130) (10,477)
At December 31, 2011 (5,331)$ (17,302)$ ‐$ (2,255)$ (24,888)$
Depreciation and amortization (897) (3,075) ‐ (296) (4,268)
At March 31, 2012 (6,228)$ (20,377)$ ‐$ (2,551)$ (29,156)$
Carrying value
At December 31, 2011 15,344$ 74,796$ 37,402$ 1,498$ 129,040$
At March 31, 2012 29,901$ 92,751$ 16,450$ 1,873$ 140,975$ (1) Included in land and buildings is $4,181,000 (December 31, 2011 ‐ $4,181,000) of land properties which are not subject to
depreciation.
(2) Included in property, plant and equipment is $18,824,000 (December 31, 2011 ‐ $14,789,000) of equipment under finance lease.

First Majestic Silver Corp. NOTES TO CONDENSED CONSOLIDATED INTERIM FINANCIAL STATEMENTS (tabular amounts are expressed in thousands of United States dollars)
Notes Page 10
15. PROPERTY, PLANT AND EQUIPMENT (continued)
Mining assets, including land and buildings, machinery and equipment, assets under construction and other assets
above are allocated as follow:
La Encantada
Silver Mine
La Parrilla
Silver Mine
San Martin
Silver Mine
Del Toro
Silver Mine
La Luz
Silver ProjectCorporate Total
Cost
At December 31, 2010 $ 51,788 $ 19,546 $ 11,068 $ 1,944 $ 1,357 $ 1,091 86,794$
Additions 13,949 37,808 8,215 5,061 1,316 785 67,134
At December 31, 2011 65,737$ 57,354$ 19,283$ 7,005$ 2,673$ 1,876$ 153,928$
Additions 3,046 7,311 788 4,228 156 674 16,203
At March 31, 2012 68,783$ 64,665$ 20,071$ 11,233$ 2,829$ 2,550$ 170,131$
Accumulated depreciation and amortization
At December 31, 2010 $ (4,224) $ (5,539) $ (4,006) ‐$ $ (37) $ (605) (14,411)$
Depreciation and amortization (6,385) (2,846) (917) ‐ (36) (293) (10,477)
At December 31, 2011 (10,609)$ (8,385)$ (4,923)$ ‐$ (73)$ (898)$ (24,888)$
Depreciation and amortization (1,911) (1,846) (390) ‐ (8) (113) (4,268)
At March 31, 2012 (12,520)$ (10,231)$ (5,313)$ ‐$ (81)$ (1,011)$ (29,156)$
Carrying value
At December 31, 2011 $ 55,128 $ 48,969 $ 14,360 $ 7,005 $ 2,600 $ 978 129,040$
At March 31, 2012 $ 56,263 $ 54,434 $ 14,758 $ 11,233 $ 2,748 $ 1,539 140,975$
16. DEPOSITS ON LONG‐TERM ASSETS
The Company’s deposits on long‐term assets are comprised of the following:
March 31, 2012 December 31, 2011
Depos its on equipment 10,140$ 6,006$
Depos its on equipment under finance leases 2,042 2,812
Depos its on services 1,788 1,686
13,970$ 10,504$
17. TRADE AND OTHER PAYABLES
The Company’s trade and other payables are primarily comprised of amounts outstanding for purchases relating to
mining operations, exploration and evaluation activities and corporate office expenses. The normal credit period for
these purchases is between 30 to 90 days.
Trade payables and accrued liabilities are comprised of the following items:
March 31, 2012 December 31, 2011
Trade payables 9,785$ 6,512$
Accrued l iabi l i ties 17,703 15,903
Unearned revenue 11 18
27,499$ 22,433$

First Majestic Silver Corp. NOTES TO CONDENSED CONSOLIDATED INTERIM FINANCIAL STATEMENTS (tabular amounts are expressed in thousands of United States dollars)
Notes Page 11
18. OTHER FINANCIAL LIABILITIES
At March 31, 2012, the Company carried a long position on silver futures equivalent to 500,000 ounces (December 31, 2011 ‐ 1.0 million ounces) of silver at an average price of $34.06. Other financial liabilities of $790,000 (December 31, 2011 ‐ $383,000) reflects an unrealized loss in silver futures. For the three months ended March 31, 2012, the Company has a realized gain on silver futures of $5,646,000 (March 31, 2011 ‐ $3,225,000), resulting in a net gain of $4,856,000 (March 31, 2011 – net gain of $3,225,000).
19. DEBT FACILITIES
In March 2011, the Company entered into an agreement for a pre‐payment facility for advances on the sale of lead in its concentrate production. Under the terms of the agreement, $3.0 million was advanced against the Company’s lead concentrate production from the La Parrilla Silver Mine for a period of 12 months. Interest accrues at an annualized floating rate of one‐month LIBOR plus 5%. Interest is payable monthly and the principal amount is repayable based on the volume of lead concentrate shipped with minimum monthly quotas valued at $250,000. At March 31, 2012, after delivering monthly quotas of lead concentrates and payments of interest charges, the Company had a remaining balance payable on the pre‐payment facility of $137,000 (December 31, 2011 ‐ $784,000).
20. LEASE OBLIGATIONS
The Company has entered into leases for various mining and plant equipment. These leases have terms of 36 to 48 months with interest rates ranging from 7.9% to 9.1%. Assets under finance leases are pledged as security against the lease obligation.
The following is a schedule of future minimum lease payments under the finance leases:
March 31, 2012 December 31, 2011
Less than one year 6,320$ 5,238$
More than one year but not more than five years 11,554 10,795
17,874 16,033
Less : future finance charges (1,996) (1,939)
Present value of minimum lease payments 15,878$ 14,094$
Included in the financia l s tatements as:
Current portion of lease obl igations 5,231 4,269
Lease obl igations 10,647 9,825
Present value of minimum lease payments 15,878$ 14,094$

First Majestic Silver Corp. NOTES TO CONDENSED CONSOLIDATED INTERIM FINANCIAL STATEMENTS (tabular amounts are expressed in thousands of United States dollars)
Notes Page 12
21. SHARE CAPITAL
(a) Authorized and issued capital
The Company has unlimited authorized common shares with no par value. The movement in the Company’s issued and outstanding capital during the period is as follows:
Shares Amount
Shares
to be issued Total
Balance at December 31, 2010 97,560,417 239,525$ 245$ 239,770$
Shares i s sued for:
Exerci se of options 391,200 1,303 ‐ 1,303
Exerci se of warrants 4,731,593 16,637 ‐ 16,637
Transfer of equi ty reserve upon exerci se of options and warrants ‐ 1,527 ‐ 1,527
Balance at March 31, 2011 102,683,210 258,992$ 245$ 259,237$
Balance at December 31, 2011 105,135,372 273,094$ 210$ 273,304$
Shares i s sued for:
Exerci se of options 431,650 2,533 ‐ 2,533
Convers ion of shares to be i s sued (Note 21(c)) 250 1 (1) ‐
Transfer of equi ty reserve upon exerci se of options ‐ 962 ‐ 962
Balance at March 31, 2012 105,567,272 276,590$ 209$ 276,799$
(b) Stock options
Under the terms of the Company’s Stock Option Plan, the maximum number of shares reserved for issuance under the Plan is 10% of the issued shares on a rolling basis. Options may be exercisable over periods of up to five years as determined by the Board of Directors of the Company and the exercise price shall not be less than the closing price of the shares on the day preceding the award date, subject to regulatory approval. All stock options granted prior to May 19, 2011 are subject to vesting with 25% vesting upon issuance and 25% vesting each six months thereafter. All stock options granted thereafter are subject to vesting with 25% vesting on first anniversary from the date of grant, and 25% vesting each six months thereafter.
The following table summarizes the information about stock options outstanding and exercisable at
March 31, 2012:
Exercise prices (CAD$)
Number of
Options
Weighted
Average
Exercise Price
(CAD$/Share)
Weighted
Average
Remaining Life
(Years)
Number of
Options
Weighted
Average
Exercise Price
(CAD$/Share)
Weighted
Average
Remaining Life
(Years)
2.01 ‐ 3.00 435,150 2.04 0.93 435,150 2.04 0.93
3.01 ‐ 4.00 1,149,375 3.64 1.09 1,149,375 3.64 1.09
4.01 ‐ 5.00 781,600 4.30 0.77 781,600 4.30 0.77
10.01 ‐ 20.03 3,147,225 15.33 3.84 858,975 12.56 2.49
5,513,350 10.28 2.60 3,225,100 5.96 1.37
Options Outstanding Options Exercisable

First Majestic Silver Corp. NOTES TO CONDENSED CONSOLIDATED INTERIM FINANCIAL STATEMENTS (tabular amounts are expressed in thousands of United States dollars)
Notes Page 13
21. SHARE CAPITAL (continued)
(b) Stock options (continued)
As of March 31, 2012, incentive stock options represent 5% (December 31, 2011 ‐ 5%) of issued and outstanding common capital. The aggregate intrinsic values of vested share options (the market value less the exercise value) at March 31, 2012 and December 31, 2011 were $34.4 million (CAD$34.4 million) and $40.1 million (CAD$40.8 million), respectively.
The changes in stock options issued during the three months ended March 31, 2012 and the year ended
December 31, 2011 are as follows:
Number of Options
Weighted Average
Exercise Price
(CAD$/Share) Number of Options
Weighted Average
Exercise Price
(CAD$/Share)
Balance, beginning of the period 4,934,375 8.31 6,464,875 5.61
Granted 1,045,000 17.96 939,500 16.13
Exercised (431,650) 5.88 (2,449,750) 4.15
Expired (34,375) 16.40 (20,250) 12.44
Balance, end of the period 5,513,350 10.28 4,934,375 8.31
Three Months Ended
March 31, 2012
Year Ended
December 31, 2011
During the three months ended March 31, 2012, 431,650 (2011 – 391,000) stock options were exercised. The weighted average closing share price at date of exercise for the three months ended March 31, 2012 was CAD$19.70 (2011 ‐ CAD$12.84).
During the three months ended March 31, 2012, 1,045,000 stock options were granted for an aggregate fair value of CAD$8,218,000. No options were granted during the three months ended March 31, 2011.
The fair value of employee stock options granted is estimated using the Black‐Scholes Option Pricing Model with the following assumptions:
Three Months Ended March 31,
2012
Weighted average fair value at grant date ($) 8.82 n/a
Expected dividend yield (%) ‐ n/a
Average risk‐free interest rate (%) 1.22 n/a
Expected life (years) 3.38 n/a
Expected volatility (%) 65.16 n/a
Forfeiture rate (%) 5.00 n/a
2011
The expected volatility assumption is based on the historical and implied volatility of the Company’s Canadian dollar common share price on the Toronto Stock Exchange. The risk‐free interest rate assumption is based on yield curves on Canadian government zero‐coupon bonds with a remaining term equal to the stock options’ expected life.

First Majestic Silver Corp. NOTES TO CONDENSED CONSOLIDATED INTERIM FINANCIAL STATEMENTS (tabular amounts are expressed in thousands of United States dollars)
Notes Page 14
21. SHARE CAPITAL (continued)
(c) Share capital to be issued
On June 5, 2006, pursuant to the acquisition of First Silver Reserve Inc. and the San Martin mine, First Majestic and First Silver entered into a business combination agreement whereby First Majestic acquired the 36.25% remaining minority interest in securities of First Silver resulting in First Silver becoming a wholly owned subsidiary of First Majestic. At March 31, 2012, the prior shareholders of First Silver had yet to exchange 98,530 shares (December 31, 2011 – 99,030 shares) of First Silver, exchangeable for 49,265 shares (December 31, 2011 – 49,515 shares) of First Majestic resulting in a remaining value of shares to be issued of $209,000 (December 31, 2011 ‐ $210,000). During the three months ended March 31, 2012, a total of 250 shares were redeemed by prior shareholders of First Silver. No shares were redeemed during the three months ended March 31, 2011. Any certificate formerly representing First Silver shares not duly surrendered on or prior to September 14, 2012 shall cease to represent a claim or interest of any kind or nature, including a claim for dividends or other distributions against First Majestic or First Silver by any former First Silver shareholder. After such date, all First Majestic shares to which the former First Silver shareholder was entitled shall be deemed to have been cancelled.
22. EQUITY RESERVES
Three Months Ended
March 31, 2012
Three Months Ended
March 31, 2011
Available for sale revaluation reserve (a)
Balance at beginning of period 1,127$ 18$
Gain on avai lable for sa le securi ties (2,737) (87)
Balance at end of period (1,610) (69)
Share‐based payments reserve (b)
Balance at beginning of period 27,394 25,170
Share‐based payments recognized in profi t and loss , and related tax benefi t 2,302 1,889
Reclassed to share capita l for exercise of stock
options and warrants (962) (1,527)
Balance at end of period 28,734 25,532
Foreign currency translation reserve (c)
Balance at beginning of period (677) 621
Currency trans lation ga in 386 493
Balance at end of period (291) 1,114
Total equity reserves per statement of financial position 26,833$ 26,577$ (a) The available for sale reserve principally records the fair value gains or losses related to available‐for‐sale financial instruments.
(b) The share‐based payments reserve records the cumulative amount recognized under IFRS 2 in respect of options granted but not exercised to
acquire shares of the Company and related tax benefits.
(c) The foreign currency translation reserve represents exchange differences arising on the translation of non‐US dollar functional currency
operations within the Company into the US dollar presentation currency.

First Majestic Silver Corp. NOTES TO CONDENSED CONSOLIDATED INTERIM FINANCIAL STATEMENTS (tabular amounts are expressed in thousands of United States dollars)
Notes Page 15
23. FINANCIAL INSTRUMENTS
(a) Capital risk management
The Company’s objective when managing capital is to maintain its ability to continue as a going concern while at
the same time maximizing growth of its business and providing returns to its shareholders’ investments. The
Company’s overall strategy with respect to capital risk management remains unchanged from the prior year
ended December 31, 2011.
The capital of the Company consists of equity, comprising issued capital, share capital to be issued, equity reserves and retained earnings, debt facilities, net of cash and cash equivalents as follows:
March 31, 2012 December 31, 2011
Equity 379,440$ 350,598$
Debt faci l i ties 137 784
Less : cash and cash equiva lents (85,333) (91,184)
294,244$ 260,198$ In order to facilitate the management of its capital requirements, the Company prepares annual expenditure budgets that are updated as necessary depending on various factors, including successful capital deployment and general industry conditions. The annual and updated budgets are approved by the Company’s Board of Directors.
(b) Financial risk management
There are no significant changes in financial risk management compared to the Company’s consolidated financial statements for the year ended December 31, 2011, except for the following:
i) Liquidity Risk
Liquidity risk is the risk that the Company will not be able to meet its financial obligations as they arise. The Company has in place a planning and budgeting process to help determine the funds required to support the Company’s normal operating requirements on an ongoing basis and to support its expansion plans. As at March 31, 2012, the Company has outstanding trade payables of $9.8 million (December 31, 2011 ‐ $6.5 million) which are generally payable in 90 days or less and accrued liabilities of $17.7 million (December 31, 2011 ‐ $15.9 million) which are generally payable within 12 months. The Company believes it has sufficient cash on hand to meet operating requirements as they arise for at least the next 12 months. The Company’s liabilities and commitments have maturities which are summarized below:
Tota l Less than 1 to 3 4 to 5 After 5
1 year years years years
Trade and other payables 27,499$ 27,499$ ‐$ ‐$ ‐$
Other financia l l iabi l i ties 790 790 ‐ ‐ ‐
Debt faci l i ties 137 137 ‐ ‐ ‐
Finance lease obl igations 17,874 6,321 10,959 594 ‐
Decommiss ioning l iabi l i ties 7,725 ‐ ‐ ‐ 7,725
Purchase obl igations 27,229 27,229 ‐ ‐ ‐
Total Obligations 81,254$ 61,976$ 10,959$ 594$ 7,725$
Payments Due By Period

First Majestic Silver Corp. NOTES TO CONDENSED CONSOLIDATED INTERIM FINANCIAL STATEMENTS (tabular amounts are expressed in thousands of United States dollars)
Notes Page 16
23. FINANCIAL INSTRUMENTS (continued)
(b) Financial risk management (continued)
ii) Currency Risk
Financial instruments that impact the Company’s net earnings or other comprehensive income due to currency
fluctuations include Canadian dollar and Mexican peso denominated assets and liabilities. The sensitivity of the
Company’s net earnings and other comprehensive income due to changes in the exchange rate between the
Canadian dollar and the Mexican peso against the U.S. dollar is included in the table below:
December 31, 2011
Cash and cash
equivalents
Trade and other
receivables
Trade and other
payables
Net assets
(liabilities)
exposure
Effect of +/‐ 10%
change in
currency
Net assets
(liabilities)
exposure
Effect of +/‐ 10%
change in
currency
Canadian dol lar 30,121$ 151$ (2,090)$ 28,182$ 2,818$ 40,786$ 4,079$
Mexican peso 413 5,485 (19,095) (13,197) (1,320) (5,495) (549)
30,534$ 5,636$ (21,185)$ 14,985$ 1,498$ 35,291$ 3,530$
March 31, 2012
24. SUPPLEMENTAL CASH FLOW INFORMATION
Three Months Ended Three Months Ended
March 31, 2012 March 31, 2011
Net change in non‐cash working capital items:
Decrease (increase) in trade and other receivables 1,162$ (1,883)$
Increase in inventories (3,652) (344)
Decrease (increase) in prepaid expenses and other 2,866 (692)
Increase in trade and other payables 7,417 1,867
Increase in taxes payable 757 823
8,550$ (229)$
Non‐cash investing and financing activities:
Trans fer of share‐based payments reserve upon exercise
of options and warrants 962$ 1,527$
Assets acquired by capi ta l lease (3,092) (2,474)
25. VENDOR LIABILITY AND INTEREST
In May 2006, First Majestic acquired a controlling interest in First Silver Reserve Inc. (“First Silver”) for $50,776,000. The purchase price was payable to the seller (the “Seller”) in three instalments (“the Agreement”). The first instalment of $25,388,000, for 50% of the purchase price, was paid upon closing on May 30, 2006. An additional 25% instalment of $12,694,000 was paid on May 30, 2007. The final 25% instalment of $12,694,000, together with accrued interest of $872,000 was due on May 30, 2008, was paid into a trust account of the Company and First Silver, and a Letter of Credit deposited in court, pending the outcome of the claims. In November 2007, an action was commenced by the Company and First Silver against the Seller who was previously a director, President & Chief Executive Officer of First Silver. The Company and First Silver alleged that, while holding the positions of director, President and Chief Executive Officer, the Seller engaged in a course of deceitful and dishonest conduct in breach of his fiduciary and statutory duties owed to First Silver, which resulted in the Seller acquiring a mine which was First Silver’s right to acquire. These allegations are denied by the Seller but management believes that there are substantial grounds to this claim.

First Majestic Silver Corp. NOTES TO CONDENSED CONSOLIDATED INTERIM FINANCIAL STATEMENTS (tabular amounts are expressed in thousands of United States dollars)
Notes Page 17
25. VENDOR LIABILITY AND INTEREST (continued)
On March 14, 2008, the Seller filed a Counterclaim in the Action against the Company in which he claimed for unpaid
amounts and interest arising out of the Agreement. As of July 16, 2009, the claimed unpaid amount, together with
interest calculated at the contractual interest rate of 6% amounted to $14,160,000.
On July 16, 2009, an Order was granted by the Court, with the consent of all parties, under which the Seller obtained a judgment in the amount of $14,160,000. The Company agreed that $13,566,000 under the Letter of Credit would be paid into the Seller’s lawyer’s trust account (the “Trust Funds”) in partial satisfaction of the Judgment. The Consent Order requires that the Trust Funds be held pending the outcome of the Action. In his counterclaim, the Seller is also seeking, among other things, interest at 6% compounded annually and calculated daily on the Trust Funds and reimbursements of all costs and expenses, including his legal fees, incurred by the Seller in pursuing his claims against the Company. The trial commenced in the Supreme Court of British Columbia, Vancouver, British Columbia on April 17, 2012 and is expected to end in June 2012. The Consent Order does not affect the standing of the Company’s claims for relief against the Seller in the Action. The Trust Funds could potentially become accessible to the Company in the event of a favourable outcome to the litigation. However, the outcome of this litigation is not presently determinable.
26. SUBSEQUENT EVENTS
Subsequent to March 31, 2012:
a) The Company received its Mexican income tax refund of $11.2 million as filed for the 2011 fiscal year. The
amount is included in income taxes receivable at March 31, 2012;
b) On April 2, 2012, the Company entered into a definitive agreement to acquire all of the issued and outstanding common shares of Silvermex Resources Inc. (“Silvermex”) for a consideration of 0.0355 common shares of First Majestic and CAD$0.0001 in cash per common share of Silvermex. Based on First Majestic’s share price of CAD$16.92 on April 2, 2012, total consideration for the acquisition is estimated at CAD$162.4 million. Total transaction costs for the acquisition, upon closing, are estimated to be CAD$1.7 million. The transaction will require the approval of at least 662/3% of the votes cast by the shareholders, warrant holders and option holders of Silvermex at a special meeting expected to take place in June 2012. The transaction is also subject to regulatory approvals and the satisfaction of certain other closing conditions customary in transactions of this nature. The final closing of the acquisition is expected to be in July 2012;
c) 315,000 options were exercised for gross proceeds of CAD$1,098,000; and
d) 62,500 options were forfeited.
27. APPROVAL OF FINANCIAL STATEMENTS
The condensed consolidated interim financial statements of First Majestic Silver Corp. for the three months ended
March 31, 2012 were approved and authorized for issue by the Board of Directors on May 9, 2012.

925 West Georgia Street, Suite 1805, Vancouver, B.C., Canada V6C 3L2 Phone: 604.688.3033 | Fax: 604.639.8873| Toll Free: 1.866.529.2807 | Email: [email protected]
www.firstmajestic.com
*****
MANAGEMENT’S DISCUSSION AND ANALYSIS FOR THE FIRST QUARTER ENDED MARCH 31, 2012
This Management’s Discussion and Analysis (“MD&A”) should be read in conjunction with the unaudited condensed consolidated interim financial statements of First Majestic Silver Corp. (“First Majestic” or “the Company”) for the three months ended March 31, 2012 and audited consolidated financial statements for the year ended December 31, 2011, which are prepared in accordance with International Financial Reporting Standards (“IFRS”) as issued by the International Accounting Standards Board (“IASB”). This MD&A contains “forward‐looking statements” that are subject to risk factors set out in a cautionary note contained herein. All dollar amounts are expressed in United States (“US”) dollars and tabular amounts are expressed in thousands of dollars unless otherwise indicated. All information contained in this MD&A is current as of May 9, 2012 unless otherwise stated.
Forward‐Looking Statements
Certain information contained herein constitutes forward‐looking statements. Forward‐looking statements are frequently characterized by words such as “plan”, “expect”, “forecast”, “project”, ”intend”, ”believe”, ”anticipate”, “outlook” and other similar words, or statements that certain events or conditions “may” or “will” occur. Forward‐looking statements are based on the opinions and estimates of management at the dates the statements are made, and are subject to a variety of risks and uncertainties and other factors that could cause actual events or results to differ materially from those projected in the forward‐looking statements. These factors include the inherent risks involved in the mining, exploration and development of mineral properties, the uncertainties involved in interpreting drilling results and other geological data, fluctuating metal prices, the possibility of project cost overruns or unanticipated operating costs and expenses, uncertainties related to the necessity of financing, the availability of and costs of financing needed in the future, and other factors described in the Company’s Annual Information Form under the heading “Risk Factors”. The Company undertakes no obligation to update forward‐looking statements if circumstances or management’s estimates or opinions should change other than as required by securities laws. The reader is cautioned not to place undue reliance on forward‐looking statements.
Qualified Persons
Leonel Lopez, C.P.G., P.G. of Pincock Allen & Holt is the independent Qualified Person for the Company. Ramon Davila, Ing., the Company’s Chief Operating Officer and Florentino Muñoz, Ing., the Company’s Chief Geologist, are also certified Qualified Persons. Leonel Lopez has reviewed the technical information reported in the National Instrument 43‐101 technical reports regarding the La Parrilla Silver Mine, the La Encantada Silver Mine, the San Martin Silver Mine and the Del Toro Silver Mine. Ramon Davila has reviewed this MD&A for QP technical disclosures. All National Instrument 43‐101 technical reports can be found on the Company’s website at www.firstmajestic.com or on SEDAR at www.sedar.com. Additional information on the Company, including the Company’s Annual Information Form, is also available on SEDAR at www.sedar.com and on the Company’s website at www.firstmajestic.com.

Page 2
2012 FIRST QUARTER HIGHLIGHTS
FIRST QUARTER2012
FIRST QUARTER2011 Change
Operating Silver Equivalent Ounces Produced 2,007,219 1,825,366 10%
Silver Ounces Produced (excluding equivalent ounces from by-products) 1,826,803 1,769,208 3%
Payable Silver Ounces Produced(1) 1,766,160 1,751,312 1%
Total Cash Costs per Ounce(2) $8.96 $8.26 8%
Total Production Cost per Tonne(2) $29.24 $30.04 -3%
Average Revenue per Payable Equivalent Ounces Sold ($/eq. oz.)(2)$32.79 $32.60 1%
Financial Revenues ($ millions) $57.8 $55.3 5%
Mine Operating Earnings ($ millions) $35.7 $35.6 0%
Net Earnings After Taxes ($ millions) $26.4 $23.9 10%
Operating Cash Flows Generated Before Movements in Working Capital ($ millions) $37.1 $35.0 6%
Cash and Cash Equivalents at March 31 ($ millions) $85.3 $85.6 0%
Working Capital at March 31 ($ millions) $108.3 $84.9 28%
ShareholdersEarnings Per Share - Basic $0.25 $0.24 5%
Cash Flow Per Share(1) $0.35 $0.35 0%
Weighted Average Shares Outstanding for the Periods Ended March 31 105,440,048 99,872,077 6%
(1) Payable Silver Ounces Produced is equivalent to Silver Ounces Produced less metal deductions from smelters and refineries. (2) The Company reports non‐GAAP measures which include Total Cash Costs per Ounce, Total Production Cost per Tonne, Average Revenue per Payable
Equivalent Ounces Sold and Cash Flow Per Share Before Movements in Working Capital. These measures are widely used in the mining industry as a benchmark for performance, but do not have a standardized meaning and may differ from methods used by other companies with similar descriptions. See Reconciliation to IFRS on pages 13 and 14.
Produced 2,007,219 of silver equivalent ounces, an increase of 10% compared to 1,825,366 silver equivalent ounces produced in the first quarter of 2011.
Produced 1,826,803 ounces of silver, an increase of 3% compared to 1,769,208 ounces of silver produced in the first quarter of 2011.
Generated revenues of $57.8 million for the quarter ended March 31, 2012, an increase of $2.5 million or 5% compared to $55.3 million in the first quarter of 2011.
Recognized mine operating earnings of $35.7 million, which was consistent with $35.6 million in the first quarter of 2011.
Net earnings after taxes for the three months ended March 31, 2012 were $26.4 million compared to $23.9 million in the first quarter of 2011, an increase of 10%.
Earnings per share (“EPS”) for the three months ended March 31, 2012 was $0.25, an increase of 5% compared to $0.24 for the three months ended March 31, 2011.
Net earnings for the quarter ended March 31, 2012 reflects an unrealized loss on silver futures of $0.8 million. Adjusted EPS (a non‐GAAP measure) after removing the unrealized loss on silver futures was $0.26.
In January 2012, the Company purchased 757,500 trust units of Sprott Physical Silver Trust at $13.20 per unit for a total cost of $9,999,000. During the quarter, 160,980 trust units were sold for a realized gain of $363,000 and an unrealized gain of $256,000 was recorded on the remaining 596,520 trust units.
Cash flows from operations before movements in non‐cash working capital and income taxes in the first quarter of 2012 increased by 6% to $37.1 million ($0.35 per share) compared to $35.0 million ($0.35 per share) in first quarter of 2011.
Cash cost per ounce (a non‐GAAP measure) for the first quarter of 2012 was $8.96, an increase of 8% compared to $8.26 in the first quarter of 2011. Cash cost was higher primarily due to low grades and recoveries at the La Encantada Mine. Since installing a new ball mill in mid‐April, recoveries have been improving due to a higher proportion of fresh ore being processed.
Production costs per tonne decreased 3% to $29.24 per tonne compared to $30.04 per tonne in the first quarter of 2011, reflecting cost decreases at La Parrilla associated with its increased scale of production.
The new 1,000 tpd cyanidation circuit at the La Parrilla Silver Mine was commissioned effective March 1, 2012. The new parallel 1,000 tpd flotation and 1,000 tpd cyanidation circuits (2,000 tpd combined), which replaced the old 850 tpd mill, are now fully operational and were operating at an average of 1,850 tpd in the month of March 2012.

Page 3
REVIEW OF OPERATING RESULTS
Selected Production Results on a Mine‐by‐Mine Basis for the Past Eight Quarters
Production Highlights Q1
T
o Q4 Q3 Q2 Q1
T
o Q4 Q3 Q2Ore processed/tonnes milled
La Encantada 337,940 369,310 366,308 333,710 314,712 319,908 295,328 264,552
La Parrilla 147,938 121,109 89,972 77,363 74,503 78,537 76,618 75,271
San Martin 72,305 74,584 73,879 71,004 67,291 68,730 62,275 64,527
Consolidated 558,183 565,003 530,159 482,077 456,506 467,175 434,221 404,350
Silver ounces produced
La Encantada 846,391 1,076,096 1,020,467 1,133,654 1,136,419 1,049,811 1,160,468 921,078
La Parrilla 719,143 628,836 449,771 395,716 319,405 395,161 402,760 375,465
San Martin 261,269 252,725 238,627 251,009 313,384 312,360 260,142 242,255
Consolidated 1,826,803 1,957,657 1,708,865 1,780,379 1,769,208 1,757,332 1,823,370 1,538,798
Silver equivalent ounces produced
La Encantada 861,506 1,092,189 1,029,336 1,139,336 1,138,624 1,050,911 1,163,887 950,223
La Parrilla 860,739 738,919 511,301 443,304 363,648 448,592 483,608 435,985
San Martin 284,974 270,420 251,133 261,190 323,094 328,484 273,003 269,959
Consolidated 2,007,219 2,101,528 1,791,770 1,843,830 1,825,366 1,827,987 1,920,498 1,656,167
Cash cost per ounce
La Encantada 9.69$ 7.49$ 8.04$ 7.61$ 7.17$ 7.71$ 6.23$ 7.20$
La Parrilla 8.14$ 8.22$ 7.90$ 8.84$ 10.66$ 7.06$ 7.09$ 7.57$
San Martin 8.67$ 9.70$ 10.74$ 10.72$ 9.85$ 8.87$ 10.52$ 10.13$
Consolidated 8.96$ 8.01$ 8.39$ 8.32$ 8.26$ 7.78$ 7.03$ 7.75$
Production cost per tonne
La Encantada 23.27$ 20.78$ 21.46$ 24.09$ 23.80$ 23.30$ 22.62$ 26.36$
La Parrilla 38.87$ 42.46$ 41.32$ 45.88$ 42.60$ 38.07$ 38.74$ 41.78$
San Martin 38.64$ 38.64$ 37.20$ 40.67$ 45.34$ 43.05$ 45.10$ 38.69$
Consolidated 29.24$ 27.47$ 26.86$ 30.03$ 30.04$ 28.70$ 28.68$ 29.11$
2011 20102012
Consolidated Production Results for the Quarter Ended March 31, 2012 and 2011
CONSOLIDATED FIRST MAJESTIC
RESULTS 2012 2011
Ore processed/tonnes milled (3)
558,183 456,506
Average silver grade (g/t) 177 211
Recovery (%) 57% 57%
Total silver ounces produced 1,826,803 1,769,208
Pre‐commercial silver ounces produced (3)
28,639 ‐
Commercial silver ounces produced 1,798,164 1,769,208
Payable silver ounces produced (1)
1,766,160 1,751,312
Gold ounces produced 611 351
Pounds of lead produced 3,176,662 1,187,912
Pounds of zinc produced 1,320,726 ‐
Tonnes of iron ore produced 4,596 382
Total production ‐ ounces silver equivalent 2,007,219 1,825,366
Total cash cost per ounce (1)(3)
$8.96 $8.26
Total production cost per ounce (1)(2)(3)
$9.09 $7.82
Total production cost per tonne (1)(2)(3)
$29.24 $30.04
Underground development (m) 14,243 6,749
Diamond dril l ing (m) 29,194 5,793
Quarter Ended
(1) The Company reports non‐GAAP measures which include production costs per tonne, production costs per ounce and cash cost (including smelting and refining charges) per ounce of payable silver, in order to manage and evaluate operating performance at each of the Company’s mines. These measures, established by the Silver Institute (Production Cost Standards, June 2011), are widely used in the silver mining industry as a benchmark for performance, but do not have a standardized meaning. See Reconciliation to IFRS on page 13.
(2) Total production cost per ounce and total production cost per tonne includes mining, processing and direct overhead at the mill site and does not include smelting and refining, transportation and other selling costs.
(3) The cyanidation circuit for the La Parrilla mill expansion project achieved a commercial stage of production effective March 1, 2012. During the quarter ended March 31, 2012, the net margin of $0.6 million (Net Revenue of $1.0 million less Costs of Sales of $0.4 million) in connection with the sale of 30,456 ounces of silver equivalent during the pre‐operating period was recorded as a reduction of construction in progress. The tables above include the production from the cyanidation circuit expansion, however, average silver grade, recovery, total cash costs per ounce, production cost per ounce and total production cost per tonne are based on production excluding pre‐commercial stage production of 9,118 tonnes of ore processed and 30,456 ounces of silver equivalent during the quarter ended March 31, 2012.
Page 4
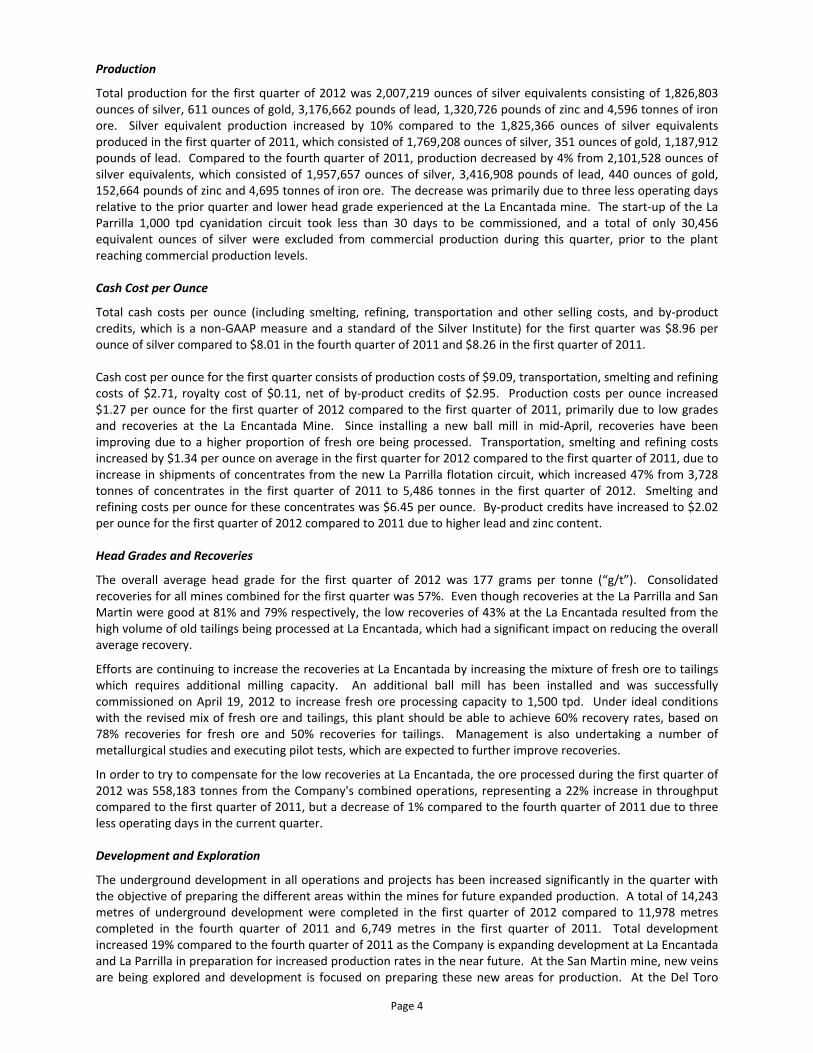
Production
Total production for the first quarter of 2012 was 2,007,219 ounces of silver equivalents consisting of 1,826,803 ounces of silver, 611 ounces of gold, 3,176,662 pounds of lead, 1,320,726 pounds of zinc and 4,596 tonnes of iron ore. Silver equivalent production increased by 10% compared to the 1,825,366 ounces of silver equivalents produced in the first quarter of 2011, which consisted of 1,769,208 ounces of silver, 351 ounces of gold, 1,187,912 pounds of lead. Compared to the fourth quarter of 2011, production decreased by 4% from 2,101,528 ounces of silver equivalents, which consisted of 1,957,657 ounces of silver, 3,416,908 pounds of lead, 440 ounces of gold, 152,664 pounds of zinc and 4,695 tonnes of iron ore. The decrease was primarily due to three less operating days relative to the prior quarter and lower head grade experienced at the La Encantada mine. The start‐up of the La Parrilla 1,000 tpd cyanidation circuit took less than 30 days to be commissioned, and a total of only 30,456 equivalent ounces of silver were excluded from commercial production during this quarter, prior to the plant reaching commercial production levels. Cash Cost per Ounce
Total cash costs per ounce (including smelting, refining, transportation and other selling costs, and by‐product credits, which is a non‐GAAP measure and a standard of the Silver Institute) for the first quarter was $8.96 per ounce of silver compared to $8.01 in the fourth quarter of 2011 and $8.26 in the first quarter of 2011. Cash cost per ounce for the first quarter consists of production costs of $9.09, transportation, smelting and refining costs of $2.71, royalty cost of $0.11, net of by‐product credits of $2.95. Production costs per ounce increased $1.27 per ounce for the first quarter of 2012 compared to the first quarter of 2011, primarily due to low grades and recoveries at the La Encantada Mine. Since installing a new ball mill in mid‐April, recoveries have been improving due to a higher proportion of fresh ore being processed. Transportation, smelting and refining costs increased by $1.34 per ounce on average in the first quarter for 2012 compared to the first quarter of 2011, due to increase in shipments of concentrates from the new La Parrilla flotation circuit, which increased 47% from 3,728 tonnes of concentrates in the first quarter of 2011 to 5,486 tonnes in the first quarter of 2012. Smelting and refining costs per ounce for these concentrates was $6.45 per ounce. By‐product credits have increased to $2.02 per ounce for the first quarter of 2012 compared to 2011 due to higher lead and zinc content. Head Grades and Recoveries
The overall average head grade for the first quarter of 2012 was 177 grams per tonne (“g/t”). Consolidated recoveries for all mines combined for the first quarter was 57%. Even though recoveries at the La Parrilla and San Martin were good at 81% and 79% respectively, the low recoveries of 43% at the La Encantada resulted from the high volume of old tailings being processed at La Encantada, which had a significant impact on reducing the overall average recovery.
Efforts are continuing to increase the recoveries at La Encantada by increasing the mixture of fresh ore to tailings which requires additional milling capacity. An additional ball mill has been installed and was successfully commissioned on April 19, 2012 to increase fresh ore processing capacity to 1,500 tpd. Under ideal conditions with the revised mix of fresh ore and tailings, this plant should be able to achieve 60% recovery rates, based on 78% recoveries for fresh ore and 50% recoveries for tailings. Management is also undertaking a number of metallurgical studies and executing pilot tests, which are expected to further improve recoveries.
In order to try to compensate for the low recoveries at La Encantada, the ore processed during the first quarter of 2012 was 558,183 tonnes from the Company's combined operations, representing a 22% increase in throughput compared to the first quarter of 2011, but a decrease of 1% compared to the fourth quarter of 2011 due to three less operating days in the current quarter. Development and Exploration
The underground development in all operations and projects has been increased significantly in the quarter with the objective of preparing the different areas within the mines for future expanded production. A total of 14,243 metres of underground development were completed in the first quarter of 2012 compared to 11,978 metres completed in the fourth quarter of 2011 and 6,749 metres in the first quarter of 2011. Total development increased 19% compared to the fourth quarter of 2011 as the Company is expanding development at La Encantada and La Parrilla in preparation for increased production rates in the near future. At the San Martin mine, new veins are being explored and development is focused on preparing these new areas for production. At the Del Toro

Page 5
mine, the different ore bodies are being prepared for production which is expected to commence in the fourth quarter of 2012.
Diamond drilling programs on a companywide basis during the first quarter of 2012 amounted to 29,194 metres from 129 holes consisting primarily of definition drilling and surface exploration drilling, representing a 47% increase from the 19,916 metres drilled in the fourth quarter of 2011. A significant project is underway at Del Toro to define the ore bodies at the San Juan and Perseverancia mines to support production planning and to continue to extend the life of the Del Toro mine. At the end of the first quarter of 2012, the Company had a total of 19 diamond drill rigs operating throughout its projects.
During the quarter ended March 31, 2012, the Company expended $22.2 million on its mineral properties and a further $10.9 million on plant and equipment on a cash basis. This compares to $5.2 million invested in mineral properties and $4.5 million in plant and equipment in the first quarter of 2011. The increase in capital expenditures was primarily related to the mill expansion at the La Parrilla Silver Mine, underground development at Del Toro, and the land clearing and equipment purchased for the new Del Toro processing plant. The Company is also aggressively increasing its exploration and development programs to support additional mill expansions and to drive further resource upgrades.

Page 6
La Encantada Silver Mine, Coahuila, Mexico Production Results for the Quarter Ended March 31, 2012 and 2011
LA ENCANTADA
RESULTS 2012 2011
Ore processed/tonnes milled 337,940 314,712
Average silver grade (g/t) 181 225
Recovery (%) 43% 50%
Total silver ounces produced 846,391 1,136,419
Payable silver ounces produced (1)
842,026 1,130,737
Gold ounces produced 19 26
Tonnes of iron ore produced 4,596 382
Total production ‐ ounces silver equivalent 861,506 1,138,624
Total cash cost per ounce (1)
$9.69 $7.17
Total production cost per ounce (1)(2)
$9.34 $6.62
Total production cost per tonne (1)(2)
$23.27 $23.80
Underground development (m) 3,921 2,837
Diamond dril l ing (m) 6,038 1,041
Quarter Ended
(1) The Company reports non‐GAAP measures which include production costs per tonne, production costs per ounce and total cash cost (including smelting and refining charges) per ounce of payable silver, in order to manage and evaluate operating performance at each of the Company’s mines. These measures, established by the Silver Institute (Production Cost Standards, June 2011), are widely used in the silver mining industry as a benchmark for performance, but do not have a standardized meaning. See Reconciliation to IFRS on page 13.
(2) Total production cost per ounce and total production cost per tonne includes mining, processing and direct overhead at the mill site and does not include smelting and refining, transportation and other selling costs.
The La Encantada Silver Mine is a producing underground mine located in northern Mexico 708 kilometres north east of Torreon, Coahuila and is accessible via a 1.5 hour flight from Torreon, Coahuila. The La Encantada Silver Mine consists of a 4,000 tpd cyanidation plant, a 1,000 tpd flotation plant (currently in care‐and‐maintenance), a village with 180 houses as well as administrative offices, laboratory, general store, hospital, schools, church, airstrip and all the infrastructure required for such an operation. The mine is comprised of 4,076 hectares of mining rights and surface land ownership of 1,343 hectares. The closest town, Muzquiz, is 225 km away via mostly paved road. The Company owns 100% of the La Encantada Silver Mine. With adjustments made to the tailings screening intake systems, and to the tailings filter presses, the plant, initially inaugurated with a capacity of 3,500 tpd, has been able to consistently achieve over 4,000 tpd on average of processing throughput and was re‐rated to 4,000 tpd. Average throughput for the first quarter of 2012 was 3,976 tpd. Recoveries at the La Encantada operation remained a challenge in the first quarter of 2012. In order to increase the blend of fresh ore versus old tailings being processed, a third ball mill was installed in the fourth quarter of 2011. Additional parts were required in order to have this new ball mill operational which all arrived in the first quarter of 2012. This new ball mill will give the operation increased crushing capacity. Immediate plans are to ramp up fresh ore production from the mine to 1,500 tpd from the current average of 973 tpd and to include an additional 300 tpd of screened material from the dumps. This new ball mill became fully operational on April 19, 2012. In anticipation of this new fresh ore capacity, the Company has stockpiled approximately 23,070 tonnes of mine ore on surface ready for production. Under ideal conditions, with the revised mix of fresh ore and tailings, this plant should be able to achieve 60% recovery rates, based on 78% recoveries for fresh ore and 50% recoveries for tailings. A total of 861,506 equivalent ounces of silver were produced by the La Encantada plant during the first quarter of 2012, which was a decrease of 21% compared with the 1,092,189 equivalent ounces of silver produced in the fourth quarter of 2011, and a decrease of 24% compared to the 1,138,624 equivalent ounces of silver produced in

Page 7
the first quarter of 2011. The mill feed from the tailings changed in the quarter which negatively impacted recoveries of silver. This feed was higher in humidity and contained reagents which interfered with the cyanidation process. Changes have been made to the feed process which is expected to result in improved recoveries in the second quarter of 2012. Throughput of ore in the first quarter decreased 8% to 337,940 tonnes processed compared to 369,310 tonnes processed in the fourth quarter of 2011, however, this was an increase of 7% compared to the 314,712 tonnes processed in the first quarter of 2011. The average head grade decreased 15% to 181 g/t compared to 214 g/t in the fourth quarter of 2011 and decreased 19% compared to 225 g/t in the first quarter of 2011, summarized as follows:
Q1 2012 Q4 2011 Change Q1 2011 Change
Tonnes Milled
Fresh ore 78,817 86,782 -9% 77,864 1%
Tailings 259,123 282,528 -8% 236,848 9%
Total 337,940 369,310 -8% 314,712 7%
% Tonnes Milled
Fresh ore 23% 23% -1% 25% -6%
Tailings 77% 77% 0% 75% 2%
Grades
Fresh ore 293 259 13% 290 1%
Tailings 147 199 -26% 204 -28%
Average 181 214 -15% 225 -19%
Silver recovery in the first quarter of 2012 was 43%, a slight increase from the 42% in the fourth quarter of 2011, but a decrease from the 50% in the first quarter of 2011. Management is also undergoing a number of metallurgical studies and executing pilot tests, which are anticipated to further improve recoveries. In addition, current mine development is focused on areas with lower manganese levels in order to achieve better blending. Continuing with the underground mine development program from 2011 to improve blending in the future, a total of 3,921 metres were completed in the first quarter of 2012 compared to 3,760 metres of development completed in the fourth quarter of 2011, representing an increase of 4%. In addition, 802 metres of Robbins raises were developed which will aid with ventilation and optimization of the operations at the mine. Three diamond drill rigs are active at La Encantada, two on surface and one underground, with the objective of defining additional Reserves and Resources. A new NI 43‐101 Technical Report will be released prior to 2012 year end. A total of 6,038 metres of diamond drilling were completed in the first quarter of 2012 compared to 2,922 metres in the fourth quarter of 2011.

Page 8
La Parrilla Silver Mine, Durango, Mexico
Production Results for the Quarter Ended March 31, 2012 and 2011
LA PARRILLA
RESULTS 2012 2011
Ore processed/tonnes milled (3)
147,938 74,503
Average silver grade (g/t) 187 184
Recovery (%) 81% 73%
Total silver ounces produced 719,143 319,405
Pre‐commercial silver ounces produced (3)
28,639 ‐
Commercial silver ounces produced 690,504 319,405
Payable silver ounces produced (1)
663,312 308,757
Gold ounces produced 134 100
Pounds of lead produced 3,176,662 1,187,912
Pounds of zinc produced 1,320,726 ‐
Total production ‐ ounces silver equivalent 860,739 363,648
Total cash cost per ounce (1)(3)
$8.14 $10.66
Total production cost per ounce (1)(2)
$8.13 $10.28
Total production cost per tonne (1)(2)
$38.87 $42.60
Underground development (m) 5,039 2,044
Diamond dril l ing (m) 5,569 2,393
Quarter Ended
(1) The Company reports non‐GAAP measures which include production costs per tonne, production costs per ounce and total cash cost (including smelting and refining charges) per ounce of payable silver, in order to manage and evaluate operating performance at each of the Company’s mines. These measures, established by the Silver Institute (Production Cost Standards, June 2011), are widely used in the silver mining industry as a benchmark for performance, but do not have a standardized meaning. See Reconciliation to IFRS on page 13.
(2) Total production cost per ounce and total production cost per tonne includes mining, processing and direct overhead at the mill site and does not include smelting and refining, transportation and other selling costs.
(3) The cyanidation circuit for the La Parrilla mill expansion project achieved a commercial stage of production effective March 1, 2012. During the quarter ended March 31, 2012, the net margin of $0.6 million (Net Revenue of $1.0 million less Costs of Sales of $0.4 million) in connection with the sale of 30,456 ounces of silver equivalent during the pre‐operating period was recorded as a reduction of construction in progress. The tables above include the production from the cyanidation circuit expansion, however, average silver grade, recovery, total cash costs per ounce, production cost per ounce and total production cost per tonne are based on production excluding pre‐commercial stage production of 9,118 tonnes of ore processed and 30,456 ounces of silver equivalent during the quarter ended March 31, 2012.
The La Parrilla Silver Mine, located approximately 65 kilometres southeast of the city of Durango, Mexico, is a complex of producing underground operations consisting of the Rosarios / La Rosa and La Blanca mines which are inter‐connected through underground workings, and the San Marcos, Vacas and Quebradillas mines which are connected via above‐ground gravel road ways. La Parrilla includes a 2,000 tpd processing plant consisting of new 1,000 tpd cyanidation and 1,000 tpd flotation circuits, buildings, offices and associated infrastructure. The cyanidation circuit has been producing commercially since March 1, 2012, and the plant, including flotation and cyanidation circuits, is currently operating at a combined capacity of 1,850 tpd. The total mining concessions consist of 69,460 hectares and the Company owns 45 hectares and leases an additional 69 hectares of surface rights, for a total of 114 hectares of surface rights. The Company owns 100% of the La Parrilla Silver Mine. Total production at the La Parrilla Silver Mine was 860,739 equivalent ounces of silver in the first quarter of 2012, which was an increase of 16% compared to the fourth quarter of 2011, and an increase of 137% compared to the first quarter of 2011. The composition of the silver equivalent production in the first quarter of 2012 consisted of 719,143 ounces of silver, 134 ounces of gold, 3,176,662 pounds of lead and 1,320,726 pounds of zinc. This compares with a composition of 628,836 ounces of silver, 79 ounces of gold, 3,416,908 pounds of lead and 152,664 pounds of zinc produced in the fourth quarter of 2011, and 319,405 ounces of silver, 100 ounces of gold, 1,187,912 pounds of lead, and no zinc in the first quarter of 2011.

Page 9
In the first quarter of 2012, a total of 147,938 tonnes of ore were processed at La Parrilla, representing an increase of 22% when compared with the 121,109 tonnes processed in the fourth quarter of 2011, and an increase of 99% when compared with the 74,503 tonnes processed in the first quarter of 2011. During the quarter, 59,103 tonnes of oxide ore with an average grade of 151 g/t were extracted from the open pit area at the Quebradillas mine compared to 33,668 tonnes of oxide ore in the fourth quarter of 2011. Recovery levels of silver in the fourth quarter were 81% compared to 80% in the fourth quarter of 2011 and 73% in the first quarter of 2011. Lead and zinc concentrates are now grading at approximately 1.9% for lead and 1.7% for zinc. Silver recoveries for flotation were 89% compared to 85% in the fourth quarter. Silver recoveries for cyanidation were 65% compared to 66% in the fourth quarter. A total of 5,039 metres of underground development were completed in the first quarter of 2012, compared to 3,793 metres in the fourth quarter of 2011. As part of the mine’s expansion program, an extensive underground development program and a new ramp system is under construction including a new production shaft. Once completed, an underground rail system connecting the different operations to the shaft will be constructed. This investment will improve logistics, transportation of ore and is expected to ultimately reduce cash costs. A total of 5,569 metres of diamond drilling were completed in the first quarter of 2012 compared to 4,648 metres of diamond drilling in the fourth quarter of 2011 and 2,393 metres in the first quarter of 2011. Currently, there are four diamond drill rigs operating at La Parrilla, three are on surface and one is underground. More than 25,000 metres of drilling are planned for 2012 representing the continuation of an aggressive investment in exploration at La Parrilla, both at the La Parrilla mines complex and in the La Parrilla regional area. The focus during this expanded exploration program will be the Rosarios, Quebradillas, Vacas, San Marcos, and La Blanca mines and the Cerro Santiago, Viboras, San Nicolas, Sacramento areas plus the first ever regional exploration program undertaken on this very large 69,460 hectare property. The aggressive regional mapping program started in 2011 was concluded in late March and defined a broad regional exploration program covering the entire property with favourable results on anomalies. The 2012 exploration program will consist of a regional geophysical program to define drill targets followed by a focused drill program later in the year. This program will mark the first time that this region is drilled. Results from this exploration program are expected to be released late in 2012 in an updated NI 43‐101 Technical Report. The 2,000 tpd dual processing plant is now fully producing commercially. Incremental production, revenues and operating costs associated with the new cyanidation circuit prior to March 1, 2012 were capitalized. Effective March 1, 2012, the commissioning of the cyanidation circuit was completed and all revenues and costs are now recorded in operations rather than being capitalized as pre‐production. A total of 30,456 silver equivalent ounces from the cyanidation circuit were considered pre‐commercial and will be capitalized in the quarter ended March 31, 2012. The final additional improvement will be the operation of the new tailings filters which will re‐circulate over 80% of the water through the milling process. The tailings filters are in the final stage of installation, and are expected to be operational in the second quarter of 2012. The new 115,000 Kw power transmission line was completed and connected in January; this transmission line will provide the mine with a more dependable and continuous power source at a lower cost per kilowatt. At the newly designed run rate of 2,000 tpd, it is anticipated that the La Parrilla operation will produce in the range of 3.0 to 3.2 million ounces of silver equivalent annually. In September 2011, the Company issued a new NI 43‐101 Technical Report which indicated that the Company’s exploration and development efforts have resulted in upgrading a significant portion of the Measured and Indicated Resources to Proven and Probable Reserves, resulting in the life of mine (“LOM”) being extended. Exploration has continued since that time which is expected to result in an additional NI 43‐101 Report to be released prior to the end of 2012.

Page 10
San Martin Silver Mine, Jalisco, Mexico
Production Results for the Quarter Ended March 31, 2012 and 2011
SAN MARTIN
RESULTS 2012 2011
Ore processed/tonnes milled 72,305 67,291
Average silver grade (g/t) 142 179
Recovery (%) 79% 81%
Total silver ounces produced 261,269 313,384
Payable silver ounces produced (1)
260,822 311,817
Gold ounces produced 458 225
Total production ‐ ounces silver equivalent 284,974 323,094
Total cash cost per ounce (1)
$8.67 $9.85
Total production cost per ounce (1)(2)
$10.72 $9.78
Total production cost per tonne (1)(2)
$38.64 $45.34
Underground development (m) 2,526 1,497
Diamond dril l ing (m) 9,205 1,654
Quarter Ended
(1) The Company reports non‐GAAP measures which include production costs per tonne, production cost per ounce and total cash cost (including smelting and refining charges) per ounce of payable silver, in order to manage and evaluate operating performance at each of the Company’s mines. These measures, established by the Silver Institute (Production Cost Standards, June 2011), are widely used in the silver mining industry as a benchmark for performance, but do not have a standardized meaning. See Reconciliation to IFRS on page 13.
(2) Total production cost per tonne includes mining, processing and direct overhead at the mill site and does not include smelting and refining, transportation and other selling costs.
The San Martin Silver Mine is a producing underground mine located adjacent to the town of San Martin de Bolaños, in northern Jalisco State, Mexico, 290 km north east of Guadalajara, Mexico, and is owned 100% by the Company. The mine comprises approximately 7,841 hectares of mineral rights, 1,300 hectares of surface rights surrounding the mine, and another 104 hectares of surface rights where the 950 tpd cyanidation plant and 500 tpd flotation plant (currently in care and maintenance), mine buildings, offices and related infrastructure. Total production of 284,974 ounces of silver equivalent in the first quarter of 2012 was 5% higher than the 270,420 ounces of silver equivalent produced in the fourth quarter of 2011 and 12% lower than the 323,094 equivalent ounces of silver produced in the first quarter of 2011. The ounces of silver equivalent in the first quarter of 2012 consisted of 261,269 ounces of silver and 458 ounces of gold. This compares with 252,725 ounces of silver and 336 ounces of gold produced in the fourth quarter of 2011 and 313,384 ounces of silver and 225 ounces of gold in the first quarter of 2011. Silver recovery levels in the first quarter of 2012 increased to 79%, compared to 78% in the fourth quarter of 2011, but decreased from 81% in the first quarter of 2011. In the first quarter of 2012, a total of 72,305 tonnes were processed at the San Martin Silver Mine, representing a decrease of 3% when compared to the 74,584 tonnes milled in the fourth quarter of 2011 and an increase of 7% compared to the 67,291 tonnes milled in the first quarter of 2011. The average head grade was 142 g/t in the first quarter of 2012, compared to the 135 g/t in the fourth quarter of 2011 and 179 g/t in the first quarter of 2011. During the quarter, a total of 9,205 metres of diamond drilling were completed compared with 6,885 metres of drilling in the fourth quarter of 2011. Five drill rigs are currently active within the San Martin property focusing on the La Esperanza, Los Blancos, Pinalillo, La Huichola, Rosarios and Condesa veins which are returning positive results. In addition, a new North/South system of veins has been discovered and is in the process of being defined. For 2012, the focus will be to develop additional ounces within the Zuloaga, La Esperanza and Huichola/Rosarios vein systems in preparation of the release of a new NI 43‐101 Technical Report expected to be released prior to the 2012 year end.

Page 11
DEVELOPMENT AND EXPLORATION PROJECTS Del Toro Silver Mine, Zacatecas, Mexico
The Del Toro Silver Mine is located 60 km to the southeast of the Company’s La Parrilla Silver Mine and consists of 405 contiguous hectares of mining claims plus an additional 129 hectares of surface rights covering the area surrounding the San Juan mine where construction of a 4,000 tpd flotation / cyanidation plant is currently underway. The Del Toro operation represents the consolidation of three historical silver mines, the Perseverancia, San Juan and Dolores mines, which are approximately one and three kilometres apart, respectively. Dolores was acquired in the third quarter of 2011 for $1.5 million. The previous owner of this high grade producing mine was shipping a small amount of ore to First Majestic’s La Parrilla mill for the past two years. Del Toro is presently an operating division of the Company’s First Majestic Plata, S.A. de C.V. subsidiary, although plans are underway to transfer Del Toro into a newly formed subsidiary of the Company to better isolate its operating results from the La Parrilla mine as the plant begins production in late 2012. First Majestic owns 100% of the Del Toro Silver Mine. All necessary permits for the construction of a 1,000 tpd flotation mill were granted by the Mexican authorities in the fourth quarter of 2009 and the first quarter of 2010. Land clearing began in April 2011 and foundation construction for this new processing facility began in December 2011. Re‐permitting for a 4,000 tpd dual processing operation is currently underway in conjunction with a Preliminary Economic Assessment which is expected to be released during the second quarter of 2012. The current plans involve scaling up the plant capacity over a three year period commencing at 1,000 tpd in the fourth quarter of 2012, expanding to 2,000 tpd by the fourth quarter of 2013 and finally reaching 4,000 tpd by the middle of 2014. At a ceremony celebrated in December 2011, the first stone of the new plant was placed by the Governor of Zacatecas and the first stage of the construction of the new processing plant was officially launched. Construction of the new milling facility is well underway and currently on schedule. After the completion of the platform construction at the mill site, foundations were poured at the crushing, flotation and thickener areas during the quarter, and mechanical installation also began in the crushing area. The residual water treatment plant for the town of Chalchihuites was completed during the quarter and is in the process of being tested. This facility is expected to be completed by mid‐2012 and will supply water to the mill while cleaning up the environment in the region. Also, 95% of the required equipment for the flotation circuit and 60% of the equipment for the cyanidation circuit has been ordered and is in the process of being delivered. The new 115,000 KW power line from the town of Vicente Guerrero and Chalchihuites is in the permitting process. In order to prepare Del Toro for production, an extensive development program was launched in late 2010 consisting of constructing three access ramps into ore bodies 1, 2 and 3 at San Juan, an access ramp into the Perseverancia chimney and an access ramp in Dolores. These access ramps have also allowed for the construction of crosscuts for drilling to further define additional Reserves and Resources. To date, the main ramp into the San Juan mine is now at level 10, which will be the first production level of this mine. This ramp is now 2,060 metres in length and close to 250 metres in vertical distance from surface. This main ramp will be used for ore haulage during the first production stage, prior to the shaft being completed in 2013, and will act as an access to the three main ore bodies which will be developed during 2012. To date, access has been completed to ore body 1 and ore body 2 at San Juan and access to ore body 3 is still in development with 186 metres developed during the first quarter. At the Perseverancia mine, development of the access ramp was re‐initiated in 2011 and to date has reached 244 metres in length, to gain access to the chimneys. While developing this ramp, a new vein was discovered which was named the “San Nicolas vein”. This vein has been correlated to old mine workings 1,000 metres to the north‐east from the Perseverancia mine. The discovery of the San Nicolas vein has opened a new development area and to date 1,251 metres of development has been completed in an access ramp on two different levels, 50 metres apart. Two drill rigs were assigned to this area and are currently drilling with the intent of defining the possible connection of the San Juan and Perseverancia ore bodies. Three holes have been completed and the results appear very favourable, pending results from the final assays.

Page 12
At the Dolores mine, over 1,342 metres have been developed to date in different workings including a ramp that is providing access to the main Dolores and Chalchihuites veins on two levels. Total underground development at Del Toro in the quarter amounted to 2,757 metres. This development program will continue over the next twelve months to support planned production levels while construction of the new processing plant is underway. During the quarter, 36 holes were completed for a total of 8,382 metres consisting of 20 holes drilled underground for a total of 4,088 metres, and 16 holes were drilled on surface for a total of 4,294 metres. The Company has plans to invest $58.5 million in construction, equipment and underground development of which $10.7 million has been spent during the first quarter of 2012.
La Luz Silver Project, San Luis Potosi, Mexico
The La Luz Silver Project, is located 25 km west of the town of Matehuala in San Luis Potosi State, Mexico, near the village of Real de Catorce and was acquired in November 2009, through the acquisition of Normabec Mining
Resources Ltd. ("Normabec"). As a result of the acquisition of Normabec, and its wholly owned subsidiary Minera Real Bonanza, S.A. de C.V., the Company owns 100% of the La Luz Silver Project and all of the associated mining claims of what was historically known as the Santa Ana mine and consists of 35 mining concessions covering 5,738 hectares, with estimated historical production of 230 million ounces between 1773 and 1990. After the acquisition of Normabec, the Company transferred Mineral Real Bonanza into the consolidated group in Mexico under the Company’s wholly owned subsidiary, Corporación First Majestic, SA de CV, and proceeded to wind up Normabec in December 2011. In November 2010, the Company agreed to acquire the 3% net smelter royalty (“NSR”), the surface rights of the property, the buildings located thereon covering the location of the previous mining operations, and all technical and geological information collected pertaining to the area, for consideration of $3.0 million. Consideration for the purchase consisted of a cash payment of $1.1 million and $1.5 million in shares of the Company (152,798 shares) in November 2010, and $0.4 million which was paid in January 2011. All payments in cash and shares have been completed fulfilling the Company’s objectives in acquiring all the necessary land and buildings for the La Luz Silver Project. The Company continued with the process of obtaining final approval for the purchase of 100 hectares of surface rights which were purchased during the fourth quarter of 2011 in order to secure an area where the plant and mine access are planned to be located. To date, the Baseline Study and the Geo‐hydrologic Study have been completed. The Environmental Impact Statement, the Risk Study and the Change of Use of Land Studies are expected to be presented to government authorities in the second half of 2012. A metallurgical test is underway to define the final flow sheet diagram for a flotation plant which is required for final permitting. There has been opposition from indigenous people and non‐government organizations (“NGOs”), which are being addressed by the Company. Contrary to independent reports regarding the La Luz project, the Company has no plans to do any mining above ground, no plans for open pit mining, and has no plans for the use of cyanide in any of its processing activities on or around the La Luz project.
The permit for the restoration of the old historic buildings at the Santa Ana Hacienda has been received and the construction of the previously announced Thematic and Cultural Park which will include a mining museum has begun. In addition, cleaning of the impressive underground workings is underway to rehabilitate this historic mine for public access. This new cultural facility and mining museum will form a “Sustainable Development Project” which will provide permanent long term jobs to the local communities.
Jalisco Group of Properties, Jalisco, Mexico
The Company acquired a group of mining claims totalling 5,240 hectares located in various mining districts located in Jalisco State, Mexico. During 2008, surface geology and mapping began with the purpose of defining future drill targets; however, exploration has since been discontinued as the Company focuses its capital investment on other higher priority projects, including the Del Toro Silver Mine and La Luz Silver Project.

Page 13
In January 2011, the Company granted an option to acquire up to 90% in the Jalisco Group of Properties (the “Properties”) to Sonora Resources Corp. (the “Optionee”) whereby the Optionee issued 10 million shares of common stock with a fair value of $3.4 million. The Optionee has committed to spend $3 million over the first three years to earn a 50% interest and $5 million over five years to earn a 70% interest. In order to obtain a 90% interest, the Optionee is required to complete a bankable feasibility study within seven years. First Majestic will retain a 10% free carried interest and a 2.375% NSR. The fair value of common shares received from the Optionee was recorded in other financial assets with a corresponding reduction in the carrying value of the San Martin mining interests in the second quarter of 2011.
NON‐GAAP MEASURES
TOTAL CASH COST PER OUNCE FOR THE QUARTER ENDED MARCH 31, 2012 AND 2011
“Total cash cost per ounce” is a measure developed by precious metals companies in an effort to provide a comparable standard; however, there can be no assurance that our reporting of this non‐GAAP measure is similar to that reported by other mining companies. Total cash costs per ounce is a measure used by the Company to manage and evaluate operating performance at each of the Company’s operating mining units, and is widely reported in the silver mining industry as a benchmark for performance, but does not have a standardized meaning and is disclosed in addition to IFRS measures. The following tables provide a detailed reconciliation of these measures to our cost of sales, as reported in our condensed consolidated interim financial statements.
(expressed in thousands of U.S. dollars,
except ounce and per ounce amounts) San Martin La Parrilla La Encantada Total San Martin La Parrilla La Encantada Total
Cost of sales (as reported) 16,693$ 16,819$
Add (Deduct): Cost of sales for Vancouver,
Europe and intercompany elimination (101) (158)
Cost of sales (mine) 2,820$ 6,318$ 7,454$ 16,592$ 3,309$ 3,317$ 10,035$ 16,661$
Add: Third party smelting and refining 54 3,465 353 3,872 80 1,332 459 1,871
Deduct: By‐product credits (713) (4,084) (414) (5,211) (204) (1,359) (75) (1,638)
Deduct: Employee benefits ‐ ‐ (225) (225) (250) (2) (2,038) (2,290)
Inventory changes 110 (242) 1,031 899 148 43 (273) (82)
Other non‐cash costs (11) (54) (43) (108) (13) (41) (3) (57)
Total cash cost (A) 2,260$ 5,403$ 8,156$ 15,819$ 3,070$ 3,290$ 8,105$ 14,465$
Tonnes processed 72,305 138,820 337,940 549,065 67,291 74,503 314,712 456,506
Total ounces of silver produced 261,269 690,504 846,391 1,798,164 313,384 319,405 1,136,419 1,769,208
Deduct: Metal deduction ounces 447 27,192 4,365 32,004 1,567 10,648 5,682 17,896
Payable ounces of silver produced (B) 260,822 663,312 842,026 1,766,160 311,817 308,757 1,130,737 1,751,312
Mining cost per ounce 3.44$ 2.70$ 1.73$ 2.35$ 3.89$ 3.48$ 1.10$ 2.01$
Milling cost per ounce 5.49 4.24 6.70 5.60 3.90 4.79 4.71 4.58
Indirect cost per ounce 1.79 1.19 0.91 1.14 1.99 2.01 0.81 1.23
Total production cost per ounce 10.72$ 8.13$ 9.34$ 9.09$ 9.78$ 10.28$ 6.62$ 7.82$
Transport and other selling costs cost per ounce 0.48 0.65 0.42 0.52 0.46 0.47 0.21 0.30
Smelting and refining costs cost per ounce 0.21 5.22 0.42 2.19 0.26 4.31 0.41 1.07
Royalties per ounce 0.00 0.29 0.00 0.11 ‐ ‐ ‐ ‐
By‐product credits cost per ounce (2.74) (6.15) (0.49) (2.95) (0.65) (4.40) (0.07) (0.93)
Total cash cost per ounce (A/B) 8.67$ 8.14$ 9.69$ 8.96$ 9.85$ 10.66$ 7.17$ 8.26$
Mining cost per tonne 12.40$ 12.92$ 4.30$ 7.55$ 18.05$ 14.41$ 3.94$ 7.73$
Milling cost per tonne 19.79 20.28 16.70 18.01 18.09 19.85 16.94 17.58
Indirect cost per tonne 6.45 5.67 2.26 3.68 9.20 8.34 2.92 4.73
Total production cost per tonne 38.64$ 38.87$ 23.27$ 29.24$ 45.34$ 42.60$ 23.80$ 30.04$
Three Months Ended March 31, 2012 Three Months Ended March 31, 2011
Note ‐ The table above does not include 28,639 silver ounces of pre‐commercial production from the La Parrilla cyanidation circuit expansion project during the quarter ended March 31, 2012, which were produced at a cost of $442,000.
AVERAGE REALIZED PRICE PER OUNCE OF SILVER SOLD FOR THE QUARTER ENDED MARCH 31, 2012 AND 2011
Revenues are presented as the net sum of invoiced revenues related to delivered shipments of silver doré bars, and concentrates, including associated metal by‐products of gold, lead, zinc and iron ore after having deducted refining and smelting charges, and after elimination of intercompany shipments of silver, silver being minted into coins, ingots and bullion products. The following is an analysis of the gross revenues prior to refining and smelting charges, and shows deducted smelting and refining charges to arrive at the net reportable revenue for the period per IFRS. Gross revenues are divided into shipped payable ounces of silver to calculate the average realized price per ounce of silver sold.

Page 14
Revenue Analysis
(expressed in thousands of dollars, except ounce and per ounce amounts) 2012 2011
Net Revenues as reported 57,815$ 55,266$
Add back: Smelting and Refining Charges 3,872 1,661
Gross Revenues 61,687 56,927
Payable equivalent silver ounces sold 1,881,499 1,746,126
Average consolidated gross revenue per payable equivalent silver ounces sold 32.79$ 32.60$
Average market price per ounce of silver per COMEX 32.69$ 31.74$
Quarter Ended
March 31,
(1) During the quarter ended March 31, 2012, the La Parrilla cyanidation mill expansion project was inaugurated and achieved commercial stage of production on March 1, 2012. Therefore, sales receipts of $1.0 million in the quarter in connection with the sale of 30,456 silver equivalent ounces of concentrates during the pre‐operating period were recorded as a reduction of capital in the construction in progress account and were excluded from the above revenue analysis.
CASH FLOW PER SHARE FOR THE QUARTER ENDED MARCH 31, 2012 AND 2011
Cash Flow per Share is determined based on operating cash flows before movements in working capital and income taxes, as illustrated in the Condensed Consolidated Interim Statements of Cash Flow, divided by the weighted average shares outstanding during the period.
ADDITIONAL GAAP MEASURES
The Company uses additional GAAP measures which should be evaluated in conjunction with IFRS measures. It is intended to provide additional information and should not be considered in isolation or as a substitute for measures prepared in accordance with IFRS. The following additional GAAP measures are used:
Gross margin represents the difference between revenues and cost of sales, excluding depletion, depreciation and amortization. Management believes that this presentation provides useful information to investors to evaluate the Company’s operating performance on a cash basis in order to assess the Company’s ability to generate operating cash flow.
Mine operating earnings represents the difference between gross margin and depletion, depreciation and amortization. Management believes that mine operating earnings provides useful information to investors because mine operating earnings excludes expenses not directly associated with commercial production.
Operating cash flows before movements in working capital and income taxes represents cash flows generated from operations before changes in non‐cash working capital and income taxes paid. Management believes that this measure allows investors to evaluate the Company’s pre‐tax cash flows generated from operations adjusted for fluctuations in non‐cash working capital items due to timing issues and the Company’s ability to service its debt, if any.
The terms described above do not have a standardized meaning prescribed by IFRS, and therefore the Company’s definitions are unlikely to be comparable to similar measures presented by other companies.

Page 15
REVIEW OF FINANCIAL RESULTS For the quarter ended March 31, 2012 compared to the quarter ended March 31, 2011 (in $000’s, except for share amounts):
For Quarter Ended For Quarter Ended
March 31, 2012 March 31, 2011
Revenues 57,815$ 55,266$ (1)
Cost of sales 16,693 16,819 (2)
Gross margin 41,122 38,447
Depletion, depreciation and amortization 5,453 2,804 (3)
Mine operating earnings 35,669 35,643 (4)
General and administrative 4,417 4,192 (5)
Share‐based payments 2,825 1,889 (6)
Accretion of decommissioning liabilities 103 119
Foreign exchange loss 275 25 (7)
Operating earnings 28,049 29,418 (8)
Investment and other income 5,581 3,475 (9)
Finance costs (399) (118)
Earnings before income taxes 33,231 32,775
Current income tax expense 4,849 4,223
Deferred income tax expense 2,024 4,682
Income tax expense 6,873 8,905 (10)
Net earnings for the period attributable to equity holders of
the Company 26,358$ 23,870$ (11)
Earnings per share (basic) 0.25$ 0.24$ (11)
Earnings per share (diluted) 0.24$ 0.23$ 1. Revenues for the quarter ended March 31, 2012 increased by $2,549,000 or 5% to $57,815,000 from
$55,266,000 in the first quarter of 2011. The increase was attributed to a 13% increase in silver equivalent ounces sold compared to the same quarter of the prior year, net of higher smelting and refining costs related to increased concentrate output from the expanded La Parrilla flotation circuit. Revenues for the quarter ended March 31, 2012 includes 64,266 silver equivalent ounces of lead concentrates, or $1.4 million of revenues, at La Parrilla that were delayed for shipment at year end due to year end logistical challenges with our purchaser of the concentrates.
2. Cost of sales in the first quarter of 2012 was $16,693,000, comparable to $16,819,000 in the first quarter of 2011. The additional cost of sales related to a 10% increase in production was primarily offset by an 8% appreciation of the average exchange rate for the U.S. dollar against the Mexican peso when compared to the same quarter of the prior year.
3. Depletion, depreciation and amortization increased from $2,804,000 in the first quarter of 2011 to $5,453,000 in the first quarter of 2012, an increase of $2,649,000 or 94%. The increase was due to incremental depreciation from the new La Parrilla cyanidation and flotation circuits, as well as higher depletion from a 22% increase in tonnage of ore milled.
4. Mine operating earnings in the first quarter of 2012 was $35,669,000, comparable to $35,643,000 for the same quarter in the prior year, as higher revenue was offset by an increase in depletion, depreciation and amortization expenses compared to the first quarter of 2011.
5. General and administrative expenses for the first quarter of 2012 increased by $225,000 or 5% compared to the same quarter in the prior year due to higher legal litigation and professional fees, additional administrative expenses for new European subsidiaries and increase in salaries and employee benefits.
6. Share‐based payments for the first quarter of 2012 increased by $936,000 or 50% compared to the same quarter in the prior year. The increase was primarily due to more stock options granted in the first quarter of 2012 compared to the first quarter of 2011. The Company’s higher share price compared to the prior year also contributed to the increase in the Company’s share‐based payments expense.

Page 16
7. Foreign exchange loss for the quarter was $275,000 compared to $25,000 in the first quarter of 2011. The foreign exchange loss for the quarter primarily reflects the effect of the weakening of the US dollar during the three months ended March 31, 2012 on the Company’s monetary liabilities that are not denominated in US dollars.
8. Operating earnings decreased by $1,369,000 or 5% to $28,049,000 for the quarter ended March 31, 2012, compared to operating earnings of $29,418,000 for the quarter ended March 31, 2011, due to the decrease in mine operating earnings and higher share‐based payments and general and administrative expenses.
9. During the quarter ended March 31, 2012, the Company recognized an investment income of $5,581,000 compared to $3,475,000 in the same quarter in the prior year. The investment income is primarily attributed to net gain of $4,856,000 on the Company’s investment in silver futures and gain of $619,000 on investment in marketable securities.
10. During the quarter ended March 31, 2012, the Company recorded an income tax expense of $6,873,000 compared to an income tax expense of $8,905,000 in the quarter ended March 31, 2011. The decrease is reflective of the new global tax structure that the Company established in late 2011 to take advantage of favourable tax rates in various jurisdictions, as well as effects of favourable foreign exchange rate during the period.
11. As a result of the foregoing, net earnings for the period attributable to equity holders of the Company for the quarter ended March 31, 2012 increased to $26,358,000 or basic earnings per share of $0.25 compared to net earnings of $23,870,000 or $0.24 per common share in the quarter ended March 31, 2011, for an increase of $2,488,000 or 10% compared to the same period in the prior year.
SUMMARY OF QUARTERLY RESULTS
The following table presents selected financial information for each of the most recent eight quarters:
Financial Highlights Q1(1) Q4(2) Q3(3) Q2(4) Q1(5) Q4(6) Q3(7) Q2(8)
Revenue 57,815$ 60,801$ 61,407$ 68,040$ 55,266$ 40,092$ 32,614$ 27,456$
Cost of sales 16,693$ 16,383$ 15,473$ 18,112$ 16,819$ 12,977$ 14,195$ 12,324$
Depletion, depreciation and amortization 5,453$ 6,035$ 3,467$ 3,134$ 2,804$ 3,131$ 2,545$ 2,483$
Mine operating earnings 35,669$ 38,383$ 42,467$ 46,794$ 35,643$ 23,984$ 15,874$ 12,649$
Net earnings after tax 26,358$ 21,339$ 27,772$ 30,593$ 23,870$ 13,654$ 10,059$ 10,976$
Basic earnings per share 0.25$ 0.20$ 0.27$ 0.30$ 0.24$ 0.14$ 0.11$ 0.12$
Diluted earnings per share 0.24$ 0.20$ 0.26$ 0.29$ 0.23$ 0.13$ 0.10$ 0.12$
20112012 2010
Notes:
1. In the quarter ended March 31, 2012, mine operating earnings decreased $2,714,000 or 7% compared to the quarter ended December 31, 2011. The decrease was primarily attributed to $2,986,000 or 5% decrease in revenue due to 2% less ounces of silver equivalents sold. Net earnings after tax increased $5,019,000 compared to the prior quarter, primarily due to an investment income of $5,581,000 from a gain on silver futures and marketable securities during the current quarter and a lower effective tax rate due to the new global tax structure that the Company established in late 2011.
2. In the quarter ended December 31, 2011, mine operating earnings decreased by $4,084,000 or 10% compared
to the quarter ended September 30, 2011. The decrease was primarily attributed to 18% decrease in average realized silver price and increase in depletion, depreciation and amortization expense related to higher mill throughput and commencement of depreciation for La Parrilla’s flotation circuit after it was successfully commissioned on October 1, 2011. Net earnings after tax decreased from the prior quarter by $6,433,000 or 23% compared to the prior quarter, primarily due to an unrealized loss of $4,083,000 on silver futures.
3. In the quarter ended September 30, 2011, sales revenues decreased by $6,633,000 compared to the quarter
ended June 30, 2011. The decrease was primarily attributed to 1% decrease in average realized silver price and 9% decrease in ounces of silver equivalents sold. Net earnings after taxes decreased by $2,821,000 or 9% in the quarter ended September 30, 2011 compared to the quarter ended June 30, 2011, primarily due to a loss of $1.5 million on derivative instrument and a one‐time cost of $0.7 million related to restructuring of the union labour agreement at the San Martin Silver Mine.

Page 17
4. In the quarter ended June 30, 2011, sales revenues increased by $12,774,000 compared to the quarter ended March 31, 2011. The increase was primarily attributed to a 20% increase in average realized silver price. Net earnings after taxes increased by $6,723,000 or 28% in the quarter ended June 30, 2011 compared to the quarter ended March 31, 2011, primarily due to $11,151,000 increase in mine operating earnings, offset by a $1,775,000 increase in income taxes and lower investment income.
5. In the quarter ended March 31, 2011, sales revenues increased by $15,174,000 compared to the quarter
ended December 31, 2010. The increase was primarily due to the 30% increase in silver price. Net earnings after taxes increased 10,216,000 or 75% in the quarter ended March 31, 2011, compared to the quarter ended December 31, 2010, primarily due to $11,659,000 increase in mine operating earnings.
6. In the quarter ended December 31, 2010, sales revenues increased by $7,478,000 compared to the quarter ended September 30, 2010. The increase was primarily due to the increase in silver price, partially offset by a 9.6% decrease in silver equivalent ounces sold related to a slowdown in the holiday season. Net earnings after taxes increased $3,599,000 or 36% in the quarter ended December 31, 2010, compared to the quarter ended September 30, 2010, due to $8,110,000 increase in mine operating earnings, which was partially offset by increases in non‐cash share‐based payments and deferred income tax expenses.
7. In the quarter ended September 30, 2010, sales revenues increased by $5,158,000 compared to the quarter ended June 30, 2010. The increase was primarily due to a 15% increase, or 245,549 equivalent ounces of silver sold after intercompany eliminations, in the third quarter of 2010 as compared to the second quarter of 2010, and an increase in silver price during the quarter. Net earnings after taxes decreased $919,000 or 8% in the quarter ended September 30, 2010, compared to the quarter ended June 30, 2010, mainly due to $2,890,000 increase in deferred income tax expense due to utilization of certain loss carryforwards during the period.
8. In the quarter ended June 30, 2010, sales revenues increased by $9,710,000 compared to the quarter ended
March 31, 2010 and was primarily due to an increase of 325,185 equivalent ounces of silver sold (after intercompany eliminations) in the second quarter of 2010 compared to the first quarter of 2010. In the first quarter of 2010, pre‐commercial sales were not included as equivalent ounces sold but instead were credited to the capitalization of the La Encantada mill expansion project. Revenues and net earnings was positively affected by an increase of the average gross revenue per ounce realized of $18.68 in the quarter ended June 30, 2010 compared to $16.23 in the quarter ended March 31, 2010.
LIQUIDITY At March 31, 2012, the Company had cash and cash equivalents of $85.3 million and working capital of $108.3 million, compared to cash and cash equivalents of $91.2 million and working capital $109.7 million at December 31, 2011. Cash and cash equivalents decreased by $5.9 million during the quarter as a result $33.1 million invested in property, plant and equipment, and mineral property interests, $7.5 million net investment in marketable securities, $5.9 million increase in deposits on long‐term assets, offset by $38.4 million generated from operating activities and $2.5 million proceeds from exercise of stock options. Cash flows from operations were strong at $38.5 million during the quarter, and with current silver prices and expanding operations, the operational cash flows are expected to remain robust for the remainder of 2012. During the quarter, the Company expended $22.2 million on mineral properties and $10.9 million on property, plant and equipment on a cash basis compared to $5.2 million expended on mineral properties and $4.4 million expended on property, plant and equipment in the first quarter of 2011. The significant increase in capital expenditures is primarily related to the additional investments in the mill expansion at La Parrilla and the development of Del Toro, all afforded by additional operational cash flows. Funds surplus to the Company’s short‐term operating needs are invested in highly liquid short‐term investments with maturities of three months or less. The funds are not exposed to liquidity risk and there are no restrictions on the ability of the Company to use these funds to meet its obligations.

Page 18
With approximately $84.1 million in cash and short‐term investments as at the date of this MD&A, the Company believes it has sufficient funds to meet current operating and capital requirements. Capital requirements for the remaining three quarters of 2012 include $47.8 million earmarked for the Del Toro capital project, inclusive of exploration and development costs. Should the Company adopt additional expansion plans, the Company would need to consider the funds required relative to the funds available in treasury at such time, including expected cash flows from operations, to determine whether additional sources would be required for those pending additional expansion plans.
MANAGEMENT OF RISKS AND UNCERTAINTIES The Company thoroughly examines the various financial instruments and risks to which it is exposed and assesses the impact and likelihood of those risks. These risks may include credit risk, liquidity risk, currency risk, commodity price risk, and interest rate risk. Where material, these risks are reviewed and monitored by the Board of Directors. Liquidity Risk
Liquidity risk is the risk that the Company will not be able to meet its financial obligations as they arise. The Company has in place a planning and budgeting process to help determine the funds required to support the Company’s normal operating requirements on an ongoing basis and to support its expansion plans. As at March 31, 2012, the Company has outstanding trade payables of $9.8 million (December 31, 2011 ‐ $6.5 million) which are generally payable in 90 days or less and accrued liabilities of $17.7 million (December 31, 2011 ‐ $15.9 million) which are generally payable within 12 months. The Company believes it has sufficient cash on hand to meet operating requirements as they arise for at least the next 12 months. The Company’s liabilities and commitments have maturities which are summarized below:
Tota l Less than 1 to 3 4 to 5 After 5
1 year years years years
Trade and other payables 27,499$ 27,499$ ‐$ ‐$ ‐$
Other financia l l iabi l i ties 790 790 ‐ ‐ ‐
Debt faci l i ties 137 137 ‐ ‐ ‐
Finance lease obl igations 17,874 6,321 10,959 594 ‐
Decommiss ioning l iabi l i ties 7,725 ‐ ‐ ‐ 7,725
Purchase obl igations 27,229 27,229 ‐ ‐ ‐
Total Obligations 81,254$ 61,976$ 10,959$ 594$ 7,725$
Payments Due By Period
Currency Risk
Financial instruments that impact the Company’s net earnings or other comprehensive income due to currency
fluctuations include Canadian dollar and Mexican peso denominated assets and liabilities. The sensitivity of the
Company’s net earnings and other comprehensive income due to changes in the exchange rate between the
Canadian dollar and the Mexican peso against the U.S. dollar is included in the table below:
December 31, 2011
Cash and cash
equivalents
Trade and other
receivables
Trade and other
payables
Net assets
(liabilities)
exposure
Effect of +/‐ 10%
change in
currency
Net assets
(liabilities)
exposure
Effect of +/‐ 10%
change in
currency
Canadian dol lar 30,121$ 151$ (2,090)$ 28,182$ 2,818$ 40,786$ 4,079$
Mexican peso 413 5,485 (19,095) (13,197) (1,320) (5,495) (549)
30,534$ 5,636$ (21,185)$ 14,985$ 1,498$ 35,291$ 3,530$
March 31, 2012

Page 19
OFF‐BALANCE SHEET ARRANGEMENTS At March 31, 2012, the Company had no material off‐balance sheet arrangements such as contingent interest in assets transferred to an entity, derivative instruments obligations or any obligations that generate financing, liquidity, market or credit risk to the Company, other than those disclosed in this MD&A and the condensed consolidated interim financial statements and the related notes. At quarter end, the Company was carrying a long position on silver futures equivalent to 0.5 million ounces of silver at an average price of $34.06, representing an unrealized investment loss of $0.8 million. Management is bullish on silver prices and believed the price of silver would recover sufficiently to erase the unrealized loss. During 2011, the Company pledged certain properties of the San Martin Silver Mine as guarantees as part of the requirement for its tax appeal process with the Mexican tax authority (see note 32 of consolidated financial statements for the year ended December 31, 2011).
RELATED PARTY TRANSACTIONS
Amounts paid to related parties were incurred in the normal course of business and measured at the exchange amount, which is the amount agreed upon by the transacting parties and on terms and conditions similar to non‐related parties. During the quarter ended March 31, 2012, there were no significant transactions with related parties outside of the ordinary course of business.
PROPOSED TRANSACTIONS
On April 2, 2012, the Company entered into a definitive agreement to acquire all of the issued and outstanding common shares of Silvermex Resources Inc. (“Silvermex”) for estimated considerations in common shares of First Majestic and cash of approximately CAD$162.4 million. See “subsequent events” section below for details. Other than as disclosed herein, the Board of Directors of the Company is not aware of any proposed transactions involving any proposed business acquisitions or dispositions which may have an effect on the financial condition, results of operations and cash flows.
SUBSEQUENT EVENTS
Subsequent to March 31, 2012:
a) The Company received its Mexican income tax refund of $11.2 million as filed for the 2011 fiscal year.
The amount is included in income taxes receivable at March 31, 2012;
b) On April 2, 2012, the Company entered into a definitive agreement to acquire all of the issued and
outstanding common shares of Silvermex for a consideration of 0.0355 common shares of First Majestic
and CAD$0.0001 in cash per common share of Silvermex. Based on First Majestic’s share price of
CAD$16.92 on April 2, 2012, total consideration for the acquisition is estimated at CAD$162.4 million.
Total transaction costs for the acquisition, upon closing, are estimated to be CAD$1.7 million. The
transaction will require the approval of at least 662/3% of the votes cast by the shareholders, warrant
holders and option holders of Silvermex at a special meeting expected to take place in June 2012. The
transaction is also subject to regulatory approvals and the satisfaction of certain other closing conditions
customary in transactions of this nature. The final closing of the acquisition is expected to be in July
2012;
c) 315,000 options were exercised for gross proceeds of CAD$1,098,000; and
d) 62,500 options were forfeited.
CRITICAL JUDGEMENTS AND ESTIMATES
The preparation of condensed consolidated interim financial statements in conformity with IFRS requires
management to make judgments, estimates and assumptions about future events that affect the reported

Page 20
amounts of assets and liabilities at the date of the financial statements and the reported amounts of revenue and
expenses during the reporting period. Although these estimates are based on management’s best knowledge of
the amount, events or actions, actual results may differ from these estimates.
Critical judgments exercised in applying accounting policies and assumptions and estimation uncertainties that
have the most significant effect on the amounts recognized in the condensed consolidated interim financial
statements are outlined as follows. Detail explanation of these critical judgments and estimates were included in
note 3 of the Company’s audited consolidated financial statements as at December 31, 2011.
Economic recoverability and probability of future economic benefits of exploration, evaluation and
development costs
Commencement of commercial production and production levels intended by management
Functional currency
Impairment of property, plant and equipment assets and mining interests
Depreciation and amortization rate for property, plant and equipment and depletion rate for mineral
interests
Estimated reclamation and closure costs
Mineral reserve estimates
Inventory valuation
Valuation of share‐based payments
Income taxes
MANAGEMENT’S REPORT ON INTERNAL CONTROL OVER FINANCIAL REPORTING
Disclosure Controls and Procedures
The Company’s management, with the participation of its President and Chief Executive Officer and Chief Financial Officer, has evaluated the effectiveness of the Company’s disclosure controls and procedures. Based upon the results of that evaluation, the Company’s President and Chief Executive Officer and Chief Financial Officer have concluded that, as of the end of the period covered by this report, the Company’s disclosure controls and procedures were effective to provide reasonable assurance that the information required to be disclosed by the Company in reports it files is recorded, processed, summarized and reported, within the appropriate time periods and is accumulated and communicated to management, including the President and Chief Executive Officer and Chief Financial Officer, as appropriate to allow timely decisions regarding required disclosure. Internal Control Over Financial Reporting
The Company’s management, with the participation of its President and Chief Executive Officer and Chief Financial Officer, is responsible for establishing and maintaining adequate internal control over financial reporting as such term is defined in the rules of the United States Securities and Exchange Commission and the Canadian Securities Administrators. The Company’s internal control over financial reporting is a process designed to provide reasonable assurance regarding the reliability of financial reporting and the preparation of financial statements for external purposes in accordance with IFRS as issued by the IASB. The Company’s internal control over financial reporting includes policies and procedures that:
• maintaining records that accurately and fairly reflect, in reasonable detail, the transactions and dispositions of assets of the Company;
• provide reasonable assurance that transactions are recorded as necessary for preparation of financial statements in accordance with IFRS;
• provide reasonable assurance that the Company’s receipts and expenditures are made only in accordance with authorizations of management and the Company’s Directors; and

Page 21
• provide reasonable assurance regarding prevention or timely detection of unauthorized acquisition, use, or disposition of the Company’s assets that could have a material effect on the Company’s consolidated financial statements.
The Company’s internal control over financial reporting may not prevent or detect all misstatements because of inherent limitations. Additionally, projections of any evaluation of effectiveness for future periods are subject to the risk that controls may become inadequate because of changes in conditions or deterioration in the degree of compliance with the Company’s policies and procedures. There has been no change in the Company’s internal control over financial reporting during the three months ended March 31, 2012 that has materially affected, or is reasonably likely to materially affect, the Company’s internal control over financial reporting. Limitations of Controls and Procedures
The Company’s management, including the President and Chief Executive Officer and Chief Financial Officer, believes that any disclosure controls and procedures or internal control over financial reporting, no matter how well conceived and operated, may not prevent or detect all misstatements because of inherent limitations. Further, the design of a control system must reflect the fact that there are resource constraints, and the benefits of controls must be considered relative to their costs. Because of the inherent limitations in all control systems, they cannot provide absolute assurance that all control issues and instances of fraud, if any, within the Company have been prevented or detected. These inherent limitations include the realities that judgments in decision‐making can be faulty, and that breakdowns can occur because of simple error or mistake. Additionally, controls can be circumvented by the individual acts of some persons, by collusion of two or more people, or by unauthorized override of the control. The design of any control system also is based in part upon certain assumptions about the likelihood of future events, and there can be no assurance that any design will succeed in achieving its stated goals under all potential future conditions. Accordingly, because of the inherent limitations in a cost effective control system, misstatements due to error or fraud may occur and not be detected.
OTHER MD&A REQUIREMENTS
Additional information relating to the Company may be found on or in:
SEDAR at www.sedar.com,
the Company’s Annual Information Form,
the Company’s audited consolidated financial statements for the year ended December 31, 2011 and the unaudited condensed consolidated interim financial statements for the quarter ended March 31, 2012.


