
„Comparison of Fuel-Cell-Vehicles with Other Alternative Systems
Dr. Johannes Töpler, Deutscher Wasserstoff- und Brennstoffzellenverband (DWV)

0
5000
10000
15000
20000
25000
1920 1960 2000 2040 2080
Coal
Nat.Gas
Oil
Nuclear Energy
Wind
PV
SOT
Biomass
Mtoe [Millions of Tons of Oil Equivalent]
Quelle: LBST Alternative World Energy Outlook 2005
Jahr
A possible Scenario of World Energy
Solarthermal Electricity
Geothermal Heat
Geothermal Electricity
PV Electricity
Water Power
Wind Power
Solarthermal Heat

Future primary energy supply
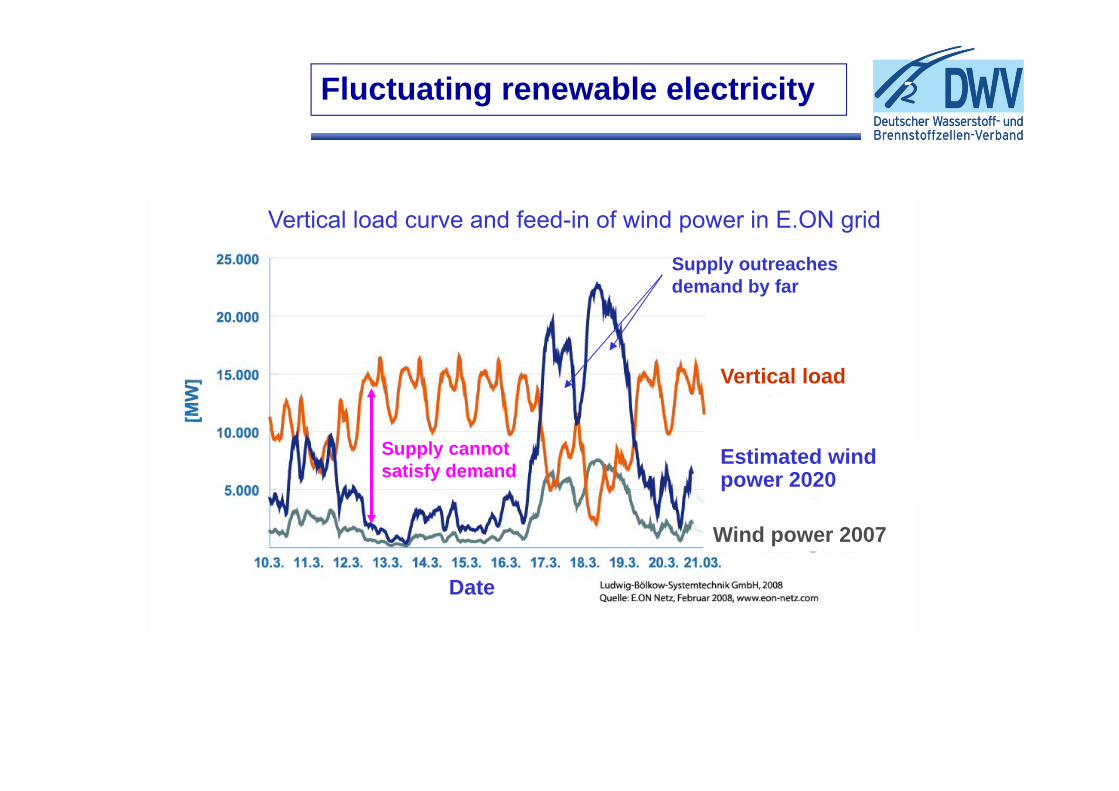
Supply cannot satisfy demand
Supply outreaches demand by far
Vertical load curve and feed-in of wind power in E.ON grid
Vertical load
Wind power 2007
Estimated wind power 2020
Date
Fluctuating renewable electricity

HydrogenElectricity
or:
Hydrogen as secondary energy carrier

Comparison of netto-storage capacities
0
2000
4000
6000
8000
0 2 4 6 8 10 12 14 16 18 20Zeit in d
Win
d Le
istu
ng in
MW
AA CAES
Pumpspeicher
H2 (GuD)
Bei einem Speichervolumen von V = 8 Mio. m³
8 Mio. m3 correspond to the biggest German natural gas caverne fieldFor comparison: Pump storage Goldisthal has a Volume of 12 Mio. m3
Pump storage5 GWh
AA CAES23 GWh
H2 – Gas /vapor turbineca. 1.300 GWh (1.3 TWh)
Time (days)
Win
d Po
wer
in M
W
Storage volume of V = 8 Mio. m3
Source: KBB UT


Electric Drive
System Module
Fuel Cell Stack
Power Distribution Unit (PDU)
Hydrogen Storage
Cooling System
Daimler, FCell Packaging
Battery

Fuel Cell vehicleMercedes-Benz B-Class
Lithium-Ionbattery
Electric motor
Air module
Hydrogen tank
Hydrogen module
Fuel Cell
Hydrogen module
Essential Facts
1) Vehicle is constructed,fabricated and approvedunder serial condititions.
2) It was tested by a turn of 125 days around the world with 30.000km
3) Start of serial productionin 2017
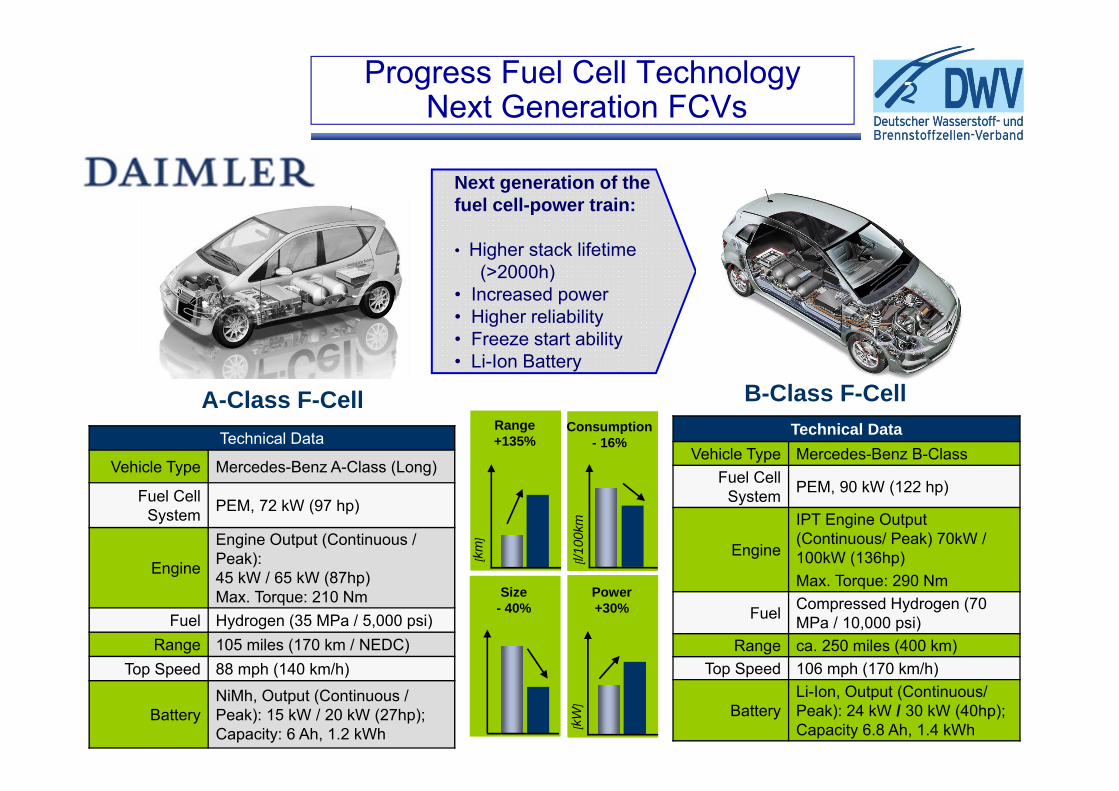
B-Class F-Cell
Next generation of the fuel cell-power train:
• Higher stack lifetime (>2000h)
• Increased power• Higher reliability• Freeze start ability• Li-Ion Battery
Size- 40%
[l/10
0km
Consumption- 16%
[kW
]Power+30%
[km
]
Range+135%Technical Data
Vehicle Type Mercedes-Benz A-Class (Long)
Fuel Cell System PEM, 72 kW (97 hp)
Engine
Engine Output (Continuous / Peak):45 kW / 65 kW (87hp)Max. Torque: 210 Nm
Fuel Hydrogen (35 MPa / 5,000 psi)Range 105 miles (170 km / NEDC)
Top Speed 88 mph (140 km/h)
BatteryNiMh, Output (Continuous / Peak): 15 kW / 20 kW (27hp); Capacity: 6 Ah, 1.2 kWh
Technical DataVehicle Type Mercedes-Benz B-Class
Fuel Cell System PEM, 90 kW (122 hp)
Engine
IPT Engine Output (Continuous/ Peak) 70kW / 100kW (136hp)Max. Torque: 290 Nm
Fuel Compressed Hydrogen (70 MPa / 10,000 psi)
Range ca. 250 miles (400 km)Top Speed 106 mph (170 km/h)
BatteryLi-Ion, Output (Continuous/ Peak): 24 kW / 30 kW (40hp); Capacity 6.8 Ah, 1.4 kWh
A-Class F-Cell
Progress Fuel Cell TechnologyNext Generation FCVs

Concept of Honda

After 2015, with lowered vehicle production costs and further developed hydrogen infrastructure, Hyundai will begin manufacturing hydrogen fuel cell vehicles for
consumer retail sales.
The ix35 Fuel Cell Specifications
The Hyundai Strategy, published on Feb. 27th 2013
Hyundai plans to build 1,000 ix35 Fuel Cell vehicles by 2015 for lease to public and private fleets, primarily in Europe, where the European Union has established a
hydrogen road map and initiated construction of hydrogen fueling stations.
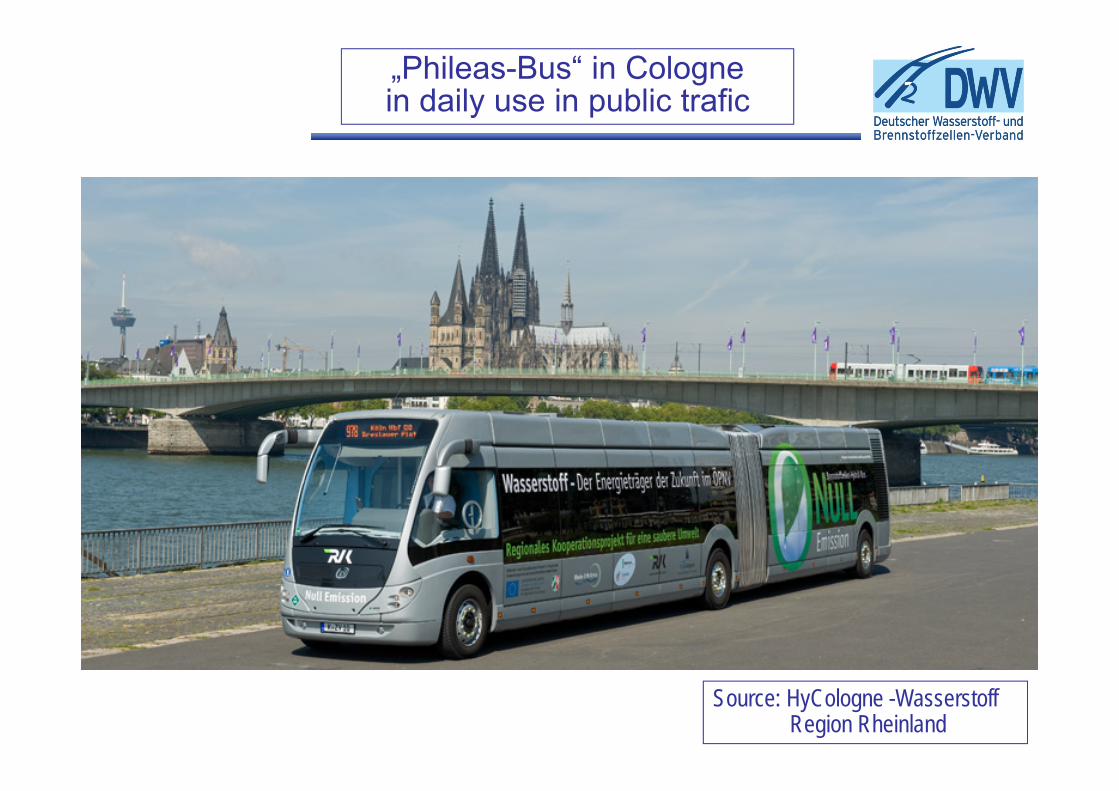
„Phileas-Bus“ in Colognein daily use in public trafic
Source: HyCologne -Wasserstoff Region Rheinland

Source: Vossloh


Anode: H2 2 H+ + 2 e-
Cathode: 2 H+ + ½O2 + 2 e- H2O---------------------------------------------------------------------------------------------------
Sum: H2 + ½O2 H2O
CnH2(n+1) + (3n+1)/2 O2 nCO2 + (n+1)/2 H2O
Comparison of Power-Trains I
Gasoline/ Diesel- Vehicles
H2/FC- vehicles
Battery-Vehicles
(double range)I
Cathode: LixCn nC + x Li+ + x e-
Anode: Li1-xMn2O4+ xLi +xe- LiMn2O4------------------------------------------------------------------------------------------------------------------------------------------------------
---------
Batt.: Li1-xMn2O4+ LixCn LiMn2O4 + nC
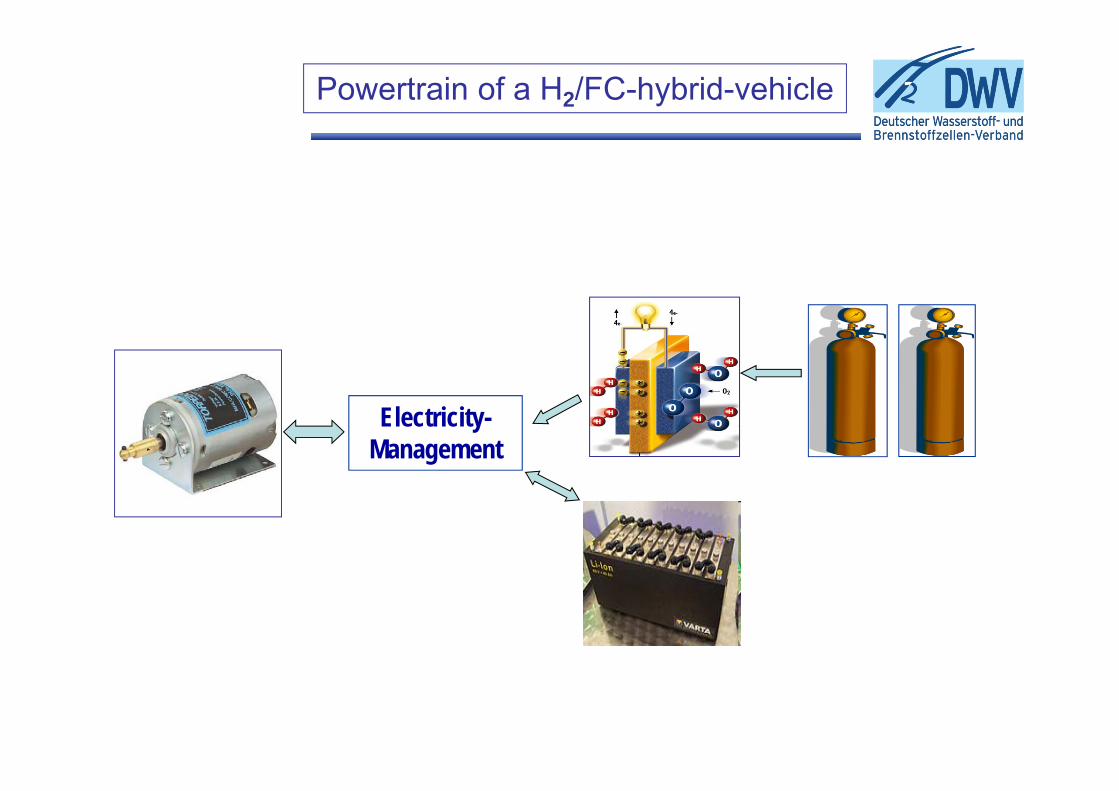
Electricity-Management
Powertrain of a H2/FC-hybrid-vehicle
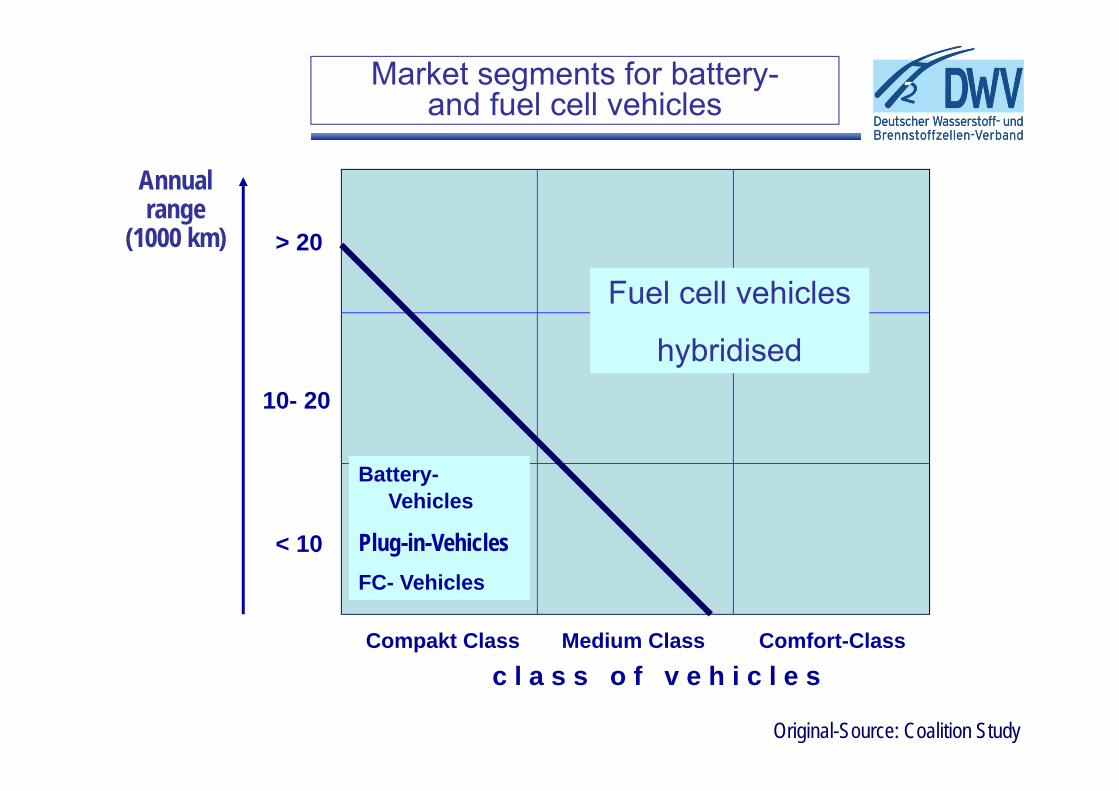
Market segments for battery-and fuel cell vehicles
Original-Source: Coalition Study
Annual range
(1000 km)
< 10
> 20
10- 20
Compakt Class Medium Class Comfort-Classc l a s s o f v e h i c l e s
Fuel cell vehicles
hybridised
Battery-Vehicles
Plug-in-VehiclesFC- Vehicles

As personal mobility, EV is viable for inner-city travel, and FCHV for inter-city travel.
Cover Area of FCHV and EV EV: inner-city
FCHV: inter-city travelSmall
Middle
Large
Short-range Middle-range Long-range
CommuterTown use
Long-distance trucksExpressway buses
Middle & large passenger cars
City busCourier vehicles
EV
FCHV
PHV(Biofuel)
Concept of TOYOTA
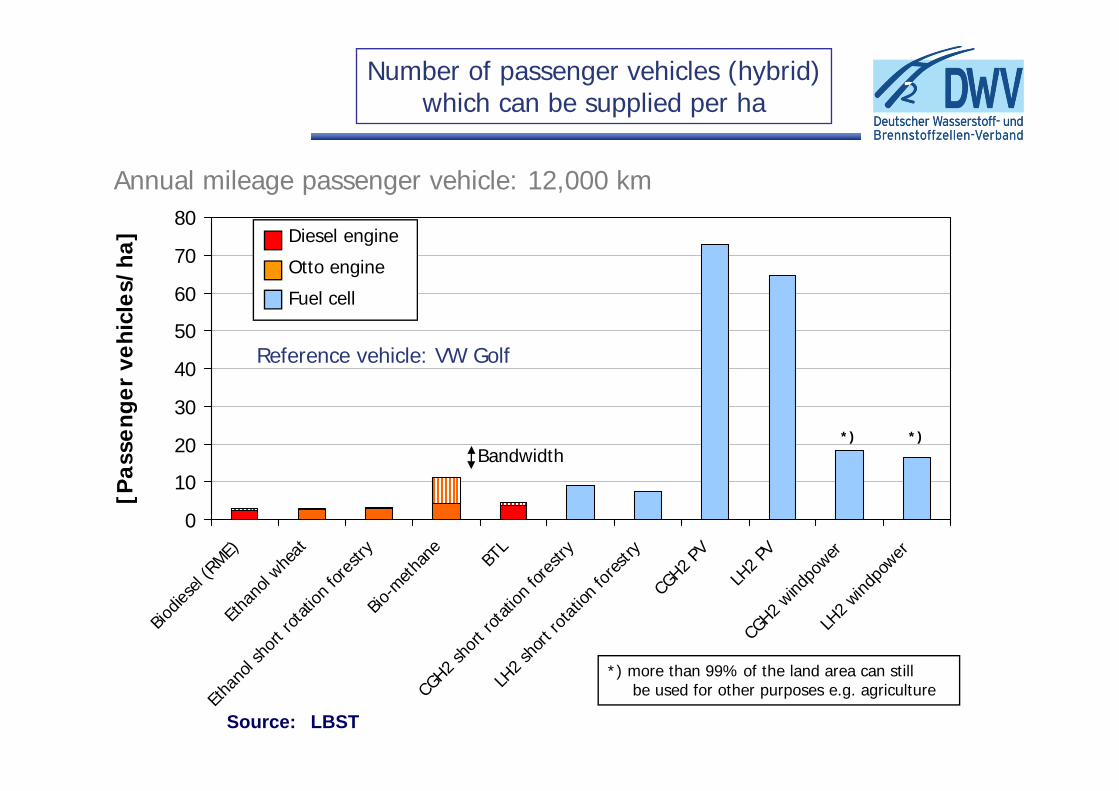
Number of passenger vehicles (hybrid) which can be supplied per ha
0
10
20
30
40
50
60
70
80
Biodie
sel (R
ME)Eth
anol
wheat
Ethan
ol sho
rt rota
tion f
orestr
yBio
-meth
ane
BTL
CGH2 s
hort r
otatio
n fore
stry
LH2 s
hort r
otatio
n fore
stry
CGH2 P
V
LH2 P
VCG
H2 wind
power
LH2 w
indpo
wer
[Pas
seng
er v
ehic
les/
ha] Diesel engine
Otto engineFuel cell
Bandwidth
Annual mileage passenger vehicle: 12,000 km
Reference vehicle: VW Golf
*) *)
*) more than 99% of the land area can still be used for other purposes e.g. agriculture
Source: LBST

Comparison of Fuel Cell System and Internal Combustion Engine
Power in %
Effic
ienc
y in
%Medium Power
Passenger Car Bus /Truck
with HydrogenFuel Cell Systems
Source: IBZ

50 ltr. E 105 ltr. Ethanol=̂
12,5 kg Wheat106 MJ (29,4 kWh)
80 MJ (22,2 kWh)
9,5 kg Wheat
22 kg WheatNecessary area of farmland: 39 m2
Consumption: 6l/100 km 2,5 kg Bread /100 km
E10-Balance
External EnergyNot CO2-free !
Alternative
Annual range :15 000km 375 kg Bread = 585 m2 Farmland^

J.Töpler
η(%)
100
70
54
30
12
Comparison hydrogen „ Wind-Gas“ for mobile application
Efficiencies:η (elektrolysis) = 70%
η (Sabatier) = 78%
η (NEDC, ICE) = 22%
η (NEDC, FC) = 42%
Electricity from
Wind&PVElektrolysis Methani-
sation(Sabatier)
Transport
Distribution
Fuel Cell
Combustion

J.Töpler
Eprim
8,3
4,5
2,4
1
Electricity from
Wind&PV
Elektrolysis Methani-sation
(Sabatier)
Transport
Distribution
Fuel Cell
Combustion
3,4
5,8
Efficiencies:η (elektrolysis) = 70%
η (Sabatier) = 78%
η (NEDC, ICE) = 22%
η (NEDC, FC) = 42%
Comparison hydrogen „ Wind-Gas“ for mobile application

“Optiresource” (Daimler AG)
See:
http://www2.daimler.com/sustainability/optiresource/index.html

Thank you very much for your attention!
And see us occasionally at
www.dwv-info.de!
Which are the questions I can answer at first?


