
Ambient Groundwater Qualityof the
Avra Valley Sub-Basinof the
Tucson Active Management Area
A 1998-2001 Baseline StudyBy Douglas Towne
Arizona Dept. of Environmental Quality Water Quality Division Surface Water Section, Monitoring Unit1110 West Washington StreetPhoenix, AZ 85007-2935Publication Number: OFR-14-06

Ambient Groundwater Quality of the Avra Valley Sub-Basin of the Tucson Active Management Area: A 1998-2001 Baseline Study By Douglas C. Towne Arizona Department of Environmental Quality Open File Report 14-06 ADEQ Water Quality Division Surface Water Section Monitoring Unit 1110 West Washington St. Phoenix, Arizona 85007-2935 Thanks: Field Assistance: Elizabeth Boettcher, Royce Flora, Maureen Freark, Joe Harmon, Angela Lucci,
and Wang Yu. Special recognition is extended to the many well owners who were kind enough to give permission to collect groundwater data on their property.
Report Cover: An irrigated field of corn is almost ready for harvest in the late spring near the
Town of Marana. Most irrigated agriculture in the Avra Valley sub-basin is located in this area, which is becoming a bedroom community of Tucson. Saguaro National Monument West and the Tucson Mountains are in the distance.
iii

ADEQ Ambient Groundwater Quality Open-File Reports (OFR) and Factsheets (FS): Harquahala Basin OFR 14-04, 62 p. FS 14-09, 5 p. Tonto Creek Basin OFR 13-04, 50 p. FS 13-04, 4 p. Upper Hassayampa Basin OFR 13-03, 52 p. FS 13-11, 3 p. Aravaipa Canyon Basin OFR 13-01, 46 p. FS 13-04, 4 p. Butler Valley Basin OFR 12-06, 44 p. FS 12-10, 5.p. Cienega Creek Basin OFR 12-02, 46 p. FS 12-05, 4.p. Ranegras Plain Basin OFR 11-07, 63 p. FS 12-01, 4.p. Bill Williams Basin OFR 11-06, 77 p. FS 12-01, 4.p. Groundwater Quality in Arizona OFR 11-04, 26 p. - McMullen Valley Basin OFR 11-02, 94 p. FS 11-03, 6 p. San Bernardino Valley Basin OFR 10-03, 43 p. FS 10-31, 4 p. Dripping Springs Wash Basin OFR 10-02, 33 p. FS 11-02, 4 p. Gila Valley Sub-basin OFR 09-12, 99 p. FS 09-28, 8 p. Agua Fria Basin OFR 08-02, 60 p. FS 08-15, 4 p. Pinal Active Management Area OFR 08-01, 97 p. FS 07-27, 7 p. Hualapai Valley Basin OFR 07-05, 53 p. FS 07-10, 4 p. Big Sandy Basin OFR 06-09, 66 p. FS 06-24, 4 p. Lake Mohave Basin OFR 05-08, 66 p. FS 05-21, 4 p. Meadview Basin OFR 05-01, 29 p. FS 05-01, 4 p. San Simon Sub-Basin OFR 04-02, 78 p. FS 04-06, 4 p. Detrital Valley Basin OFR 03-03, 65 p. FS 03-07, 4 p. San Rafael Basin OFR 03-01, 42 p. FS 03-03, 4 p. Lower San Pedro Basin OFR 02-01, 74 p. FS 02-09, 4 p. Willcox Basin OFR 01-09, 55 p. FS 01-13, 4 p. Sacramento Valley Basin OFR 01-04, 77 p. FS 01-10, 4 p Upper Santa Cruz Basin (w/ USGS) OFR 00-06, 55 p. - Prescott Active Management Area OFR 00-01, 77 p. FS 00-13, 4 p. Upper San Pedro Basin (w/ USGS) OFR 99-12, 50 p. FS 97-08, 2 p. Douglas Basin OFR 99-11, 155 p. FS 00-08, 4 p. Virgin River Basin OFR 99-04, 98 p. FS 01-02, 4 p. Yuma Basin OFR 98-07, 121 p. FS 01-03, 4 p.
These publications are available at: www.azdeq.gov/environ/water/assessment/ambient.html
iv

v

Table of Contents
Abstract .................................................................................................................................................................... 1
Introduction ............................................................................................................................................................. 2
Purpose and Scope ...................................................................................................................................... 2
Physical and Cultural Characteristics .......................................................................................................... 2
Groundwater Characteristics ....................................................................................................................... 5
Investigation Methods ............................................................................................................................................. 6
Sample Collection ..................................................................................................................................... 12
Laboratory Methods .................................................................................................................................. 12
Data Evaluation ..................................................................................................................................................... 12
Quality Assurance ..................................................................................................................................... 12
Data Validation ......................................................................................................................................... 16
Statistical Considerations .......................................................................................................................... 16
Groundwater Sampling Results ........................................................................................................................... 20
Water Quality Standards / Guidelines ....................................................................................................... 20
Analytical Results .................................................................................................................................... 20
Groundwater Composition ................................................................................................................................... 27
General Summary .................................................................................................................................... .27
Constituent Co-Variation .......................................................................................................................... 33
Groundwater Quality Variation ................................................................................................................ 35
Discussion ............................................................................................................................................................... 46
References .............................................................................................................................................................. 49
Appendices
Appendix A – Data for Sample Sites, Avra Valley Sub-Basin, 1998-2001 .............................................. 51
Appendix B – Groundwater Quality Data, Avra Valley Sub-Basin, 1998-2001 ....................................... 54
vi

Maps
ADEQ Ambient Monitoring Reports ........................................................................................................................ V
Map 1. Avra Valley Sub-Basin ............................................................................................................................... 3
Map 2. Land Ownership.......................................................................................................................................... 4
Map 3. Sample Sites ............................................................................................................................................... 7
Map 4. Water Quality Standards ........................................................................................................................... 21
Map 5. Radon ........................................................................................................................................................ 24
Map 6. Water Chemistry ....................................................................................................................................... 28
Map 7. Total Dissolved Solids .............................................................................................................................. 30
Map 8. Hardness ................................................................................................................................................... 31
Map 9. Nitrate ....................................................................................................................................................... 32
Map 10. Fluoride ..................................................................................................................................................... 37
Map 11.Gross Alpha ............................................................................................................................................... 47
Tables
Table 1. Laboratory water methods and minimum reporting levels used in the study .......................................... 13
Table 2. Volatile Organic Compounds (VOCs) analyte list .................................................................................. 15
Table 3. Summary results of duplicate samples from the ADHS laboratory ....................................................... 17
Table 4. Summary results of split samples between the ADHS/Test America labs .............................................. 18
Table 5. Sampled sites exceeding health-based water quality guidelines or Primary MCLs ................................ 22
Table 6. Sampled sites exceeding aesthetics-based water quality guidelines or Secondary MCLs ...................... 23
Table 7. Summary statistics for groundwater quality data .................................................................................... 25
Table 8. Sodium and salinity hazards for sampled sites ........................................................................................ 29
Table 9. Correlation among groundwater quality constituent concentrations ....................................................... 34
Table 10. Variation in groundwater quality constituent concentrations between two valley groups .................... 38
Table 11. Summary statistics for two valley groups with significant constituent differences .............................. 39
Table 12. Variation in groundwater quality constituent concentrations between two geologic groups ................ 41
Table 13. Summary statistics for two geologic groups with significant constituent differences .......................... 42
Table 14. Variation in groundwater quality constituent concentrations among four valley/geologic groups ....... 44
Table 15. Summary statistics for two four valley/geologic with significant constituent differences .................... 45
vii

Diagrams
Diagram 1. Hardness – hardness-calculated relationship .................................................................................... 19
Diagram 2. Water chemistry piper plot ................................................................................................................ 27
Diagram 3. TDS - bicarbonate relationship ......................................................................................................... 33
Diagram 4. Temperature box plot using two valley groups .................................................................................. 35
Diagram 5. TDS box plot using two valley groups .............................................................................................. 35
Diagram 6. Sodium box plot using two valley groups .......................................................................................... 36
Diagram 7. Nitrate box plot using two valley groups ........................................................................................... 36
Diagram 8. Hardness box plot using two geologic groups ................................................................................... 40
Diagram 9. Bicarbonate box plot using two geologic groups ............................................................................... 40
Diagram 10. Turbidity box plot using four valley/geologic groups ....................................................................... 43
Diagram 11. Nitrate box plot using four valley/geologic groups ........................................................................... 43
Figures
Figure 1. Sasabe, Arizona ..................................................................................................................................... 8
Figure 2. Buenos Aires Wildlife Refuge ................................................................................................................ 8
Figure 3. State Trust land ....................................................................................................................................... 9
Figure 4. Santa Margarita Ranch gateway ............................................................................................................. 9
Figure 5. Arizona Water Company well ................................................................................................................ 9
Figure 6. Lane windmill......................................................................................................................................... 9
Figure 7. Cinco de Mayo well ............................................................................................................................... 9
Figure 8. State Trust windmill ............................................................................................................................. 10
Figure 9. Kai Farm Well #1 ................................................................................................................................. 10
Figure 10. Heatley well .......................................................................................................................................... 10
Figure 11. Altar Valley domestic well .................................................................................................................. 10
Figure 12. Agua del Oro well ............................................................................................................................... 10
Figure 13. Avra Valley Air Park well ................................................................................................................... 11
Figure 14. Avra Valley domestic well .................................................................................................................. 11
Figure 15. Bringhurst well ..................................................................................................................................... 11
Figure 16. Kai Farm Well #2 ................................................................................................................................. 11
viii

Abbreviations amsl above mean sea level ac-ft acre-feet af/yr acre-feet per year ADEQ Arizona Department of Environmental Quality ADHS Arizona Department of Health Services ADWR Arizona Department of Water Resources ARRA Arizona Radiation Regulatory Agency AVB Avra Valley Sub-basin AZGS Arizona Geological Survey As arsenic bls below land surface BLM U.S. Department of the Interior Bureau of Land Management CAP Central Arizona Project oC degrees Celsius CI0.95 95 percent Confidence Interval Cl chloride EPA U.S. Environmental Protection Agency F fluoride Fe iron gpm gallons per minute GWPL Groundwater Protection List active ingredient HCl hydrochloric acid LLD Lower Limit of Detection Mn manganese MCL Maximum Contaminant Level ml milliliter msl mean sea level ug/L micrograms per liter um micron uS/cm microsiemens per centimeter at 25° Celsius mg/L milligrams per liter MRL Minimum Reporting Level ns not significant ntu nephelometric turbidity unit pCi/L picocuries per liter QA Quality Assurance QAPP Quality Assurance Project Plan QC Quality Control SAR Sodium Adsorption Ratio SDW Safe Drinking Water SC Specific Conductivity su standard pH units SO4 sulfate TDS Total Dissolved Solids TKN Total Kjeldahl Nitrogen USFS U.S. Forest Service USGS U.S. Geological Survey VOC Volatile Organic Compound WQARF Water Quality Assurance Revolving Fund * significant at p ≤ 0.05 or 95% confidence level ** significant at p ≤ 0.01 or 99% confidence level *** for information only, statistical test for this constituent invalid because detections fewer than 50
percent
ix

x

Ambient Groundwater Quality of the Avra Valley Sub-basin of the Tucson Active Management Area: A 1998-2001 Baseline Study
Abstract - The Tucson Active Management Area (AMA) consists of two parallel sub-basins: the Upper Santa Cruz Valley sub-basin in the east and the Avra Valley sub-basin in the west. The Upper Santa Cruz Valley sub-basin and the adjacent Santa Cruz AMA were the subject of a joint Arizona Department of Environmental Quality (ADEQ)-U.S. Geological Survey ambient groundwater quality study in 1998.13 ADEQ subsequently conducted a study of the Avra Valley sub-basin from 1998-2001 to complete the groundwater quality characterization of the Tucson AMA. The Avra Valley sub-basin comprises 2,167 square miles within Pima, Pinal, and Santa Cruz counties. The long, thin basin is located west of Tucson and includes Altar and Avra valleys, which are divided by State Route 86. Population centers include exurban areas of Tucson, most of Town of Marana, and unincorporated communities including Arivaca, Three Points, Red Rock, and Sasabe. Most (87 percent) of the sub-basin is rangeland.36 The sub-basin is drained by Altar Wash, which name changes to Brawley Wash north of State Route 86. Downgradient, the wash eventually empties into the Santa Cruz River, which has nine miles of perennial flow as the result of effluent discharge from wastewater treatment plants.5 All other washes in the sub-basin are ephemeral.22 Groundwater was formerly the source of all irrigation, public, domestic, industrial, and stock uses. Colorado River water, conveyed through the Central Arizona Project canal, has supplemented the water supply of the Tucson AMA since 1992. 9 Sediments in the Avra Valley sub-basin have been divided into upper and lower alluvial units, which form the regional aquifer. The upper unit is the primary water producer and is composed of streambed deposits of silt, sand, and gravel which range in thickness from approximately 100 to 1,000 feet. The lower alluvial unit is thousands of feet thick and consists of gravel and conglomerates located near the edges of the sub-basin. These deposits transition into clayey silts and mudstones along the sub-basin’s central axis.5 Limited amounts of groundwater are also found in the surrounding mountains in thin alluvial deposits and in fractured or faulted bedrock. 22 ADEQ collected samples from 42 wells used for domestic, stock, irrigation, and public water supply purposes. Sampled wells generally did not have driller’s logs, but most were thought to tap the upper alluvial unit.7 Inorganic samples were collected at each site while radionuclide (24), volatile organic compounds or VOCs (22), and radon (19) samples were collected at selected sites. Based on these water quality results, groundwater in the sub-basin is generally suitable for drinking water uses. Of the 42 sites sampled, 36 sites met all health-based and aesthetics-based water quality standards, excluding the proposed radon standard. Health-based, Primary Maximum Contaminant Levels (MCLs) were exceeded at six of 42 sites (14 percent). These enforceable standards define the maximum constituent concentrations allowed in water supplied for drinking water purposes by a public water system. 29 Constituents exceeding Primary MCLs include arsenic (two sites), gross alpha (five sites), uranium (two sites), and one site each for nitrate and radium-226+228. Aesthetics-based, Secondary MCLs were exceeded at 11 of 42 sites (26 percent). These are unenforceable guidelines that define the maximum constituent concentration that can be present in drinking water without an unpleasant taste, color, or odor but is not considered a health concern.29 Constituents above Secondary MCLs include total dissolved solids or TDS (seven sites), fluoride (five sites), manganese (two sites), iron and sulfate (one site apiece). Of the 19 sites sampled for radon, one exceeded the proposed 4,000 picocuries per liter (pCi/L) standard while 16 sites (84 percent) exceeded the proposed 300 pCi/L standard. 30 Of the 32 compounds sampled for, there were no VOC detections. Groundwater in the basin typically has calcium or mixed-bicarbonate chemistry and is slightly alkaline, fresh, and moderately hard to hard, based on pH levels along with TDS and hardness concentrations.15, 17Groundwater constituent concentrations significantly differed between valleys and geology.4,32 Constituents such as temperature, specific conductivity (SC), TDS, sodium, potassium, chloride, sulfate, nitrate, and fluoride had significantly higher constituent concentrations at sites in Avra Valley than at sites in Altar Valley (Kruskal-Wallis test, p ≤ 0.05). Constituents such as hardness, turbidity, magnesium, bicarbonate, and radon had significantly greater concentrations in sites located in consolidated rock than in unconsolidated sediment; temperature and nitrate exhibited the opposite pattern (Kruskal-Wallis test, p ≤ 0.05). Groundwater quality does not appear to be impacted by anthropomorphic sources, especially in Altar Valley. Concentrations of many constituents naturally increase downgradient in Avra Valley. Near Marana, however, irrigation recharge appears to have increased nitrate and TDS concentrations in groundwater.14
1

INTRODUCTION Purpose and Scope The Tucson Active Management Area (AMA) comprises two parallel sub-basins: the Upper Santa Cruz Valley sub-basin in the east and the Avra Valley sub-basin in the west. The groundwater quality of the Upper Santa Cruz sub-basin was characterized in 1998 in a joint Arizona Department of Environmental Quality (ADEQ) – U.S. Geological Survey water investigations report that also included the Santa Cruz AMA.13 The ADEQ ambient monitoring program subsequently sampled the Avra Valley sub-basin to complete the groundwater quality characterization of the Tucson AMA. The Avra Valley sub-basin consists of approximately 2,167 square miles in the south-central portion of the state (Map 1).4 The basin is located west of Tucson within Pima, Pinal, and Santa Cruz counties, and includes the Altar and Avra valleys. Population centers include exurban areas of the Tucson metropolitan area, most of the Town of Marana, and the unincorporated communities of Arivaca, Three Points, Red Rock, Sasabe, and Silver Bell. Most of the sub-basin (87 percent) consists of rangeland. 36 Groundwater was formerly used for all irrigation, public, domestic, industrial, and stock uses. Since 1992, Colorado River water conveyed through the Central Arizona Project (CAP) has also been used in the Tucson AMA. 9 The land in the sub-basin is primarily used for livestock grazing, recreation, wildlife, and residential use along with some irrigated agriculture near Marana. Sampling by the ADEQ Ambient Groundwater Monitoring program is authorized by legislative mandate in the Arizona Revised Statutes §49-225, specifically: “...ongoing monitoring of waters of the state, including...aquifers to detect the presence of new and existing pollutants, determine compliance with applicable water quality standards, determine the effectiveness of best management practices, evaluate the effects of pollutants on public health or the environment, and determine water quality trends.” 3 Benefits of ADEQ Study – This study, which utilizes scientific sampling techniques and quantitative analyses, is designed to provide the following benefits:
• A characterization of regional groundwater quality conditions in the Avra Valley sub- basin identifying water quality variations between groundwater originating from different valleys and geology.
• A process for evaluating potential groundwater quality impacts arising from mineralization, mining, livestock, septic tanks, and poor well construction.
• A guide for determining areas where further
groundwater quality research is needed. Physical and Cultural Characteristics Geography – The Avra Valley sub-basin has a maximum width of about 25 miles east to west, and a maximum length of about 65 miles north to south. The sub-basin is located within the Basin and Range physiographic province of central Arizona.5 The basin consists of relatively deep alluvial basins filled with sediments within the Altar and Avra Valleys that are bordered by mountains. Vegetation classification is composed of four types ranging with elevation from Middle Sonoran desert (1,200 – 2000 feet), Upper Sonoran desert (2,000 – 3,200 feet) Chihuahuan-Sonoran semi-desert grasslands (3,200-5,000 feet), and Mexican oak-pine woodland (5,000 – 7,000 feet).6 The basin, which extends southward into Mexico, for the purposes of this report is bounded on the south by the International Border, on the west by the Pozo Verde, Baboquivari, Quinlan, Coyote, Roskruge, Silver Bell, Waterman, and Picacho Mountains, on the east by the San Luis, Cerro Colorado, Sierrita, Black, Tucson, Tortolita Mountains and on the north by Black Mountain. Elevations in the basin range from a high of approximately 7,257 feet above mean sea level (amsl) atop Baboquivari Peak to a low of 1,847 feet amsl where the Santa Cruz River exits the sub-basin. Land Ownership - The Avra Valley sub-basin consists of State Trust (45 percent) and federal lands (26 percent managed by the Bureau of Land Management (11 percent), the U.S. Fish and Wildlife Service (eight percent), the U.S. Forest Service (six percent), the National Park Service (one percent), and the Bureau of Reclamation (one percent). The remainder is private land (22 percent), Tohono O’odham Nation (six percent), and Tucson Mountain Park, the Pascua Yaqui Tribe, and Arizona Fish and Game holdings (Map 2). 4 Climate – The Avra Valley sub-basin has a semiarid climate characterized by hot, dry summers and mild winters. There is wide variation in precipitation amounts which range annually from 30 inches atop Baboquivari Peak to 10 inches near Marana.6
Precipitation occurs predominantly as rain in either late summer, localized thunderstorms or, less often, as widespread, low intensity winter rain that occasionally includes snow at higher elevations. 22
2

3

4

Surface Water – The sub-basin is drained by a watercourse that is named Altar Wash within Altar Valley and called Brawley Wash downgradient in Avra Valley. Arivaca Creek is the largest tributary to Altar Wash. Mountain runoff usually recharges along the pediments or evaporates before reaching the main drainages. As a result, the numerous stream channels which originate in the mountains surrounding Avra Valley become less distinct and may disappear altogether as the channels approach the valley floor.14 Brawley Wash drains north eventually discharging into Los Robles Wash, a short distance before its confluence with the Santa Cruz River.5 The latter has a nine-mile effluent dependent perennial reach due to discharges from Tucson wastewater treatment plants, which have occurred since 1969.14 The Santa Cruz River flows northwesterly across the northern reaches of Avra Valley and exits the sub-basin into the Pinal AMA. Agriculture – Historically, agriculture has been the largest user of groundwater in the Avra Valley sub-basin. The first irrigation wells were drilled in 1937 near Marana and, by 1954, more than 100 wells produced 90,000 acre-feet (af) of water to irrigate 30,000 acres of farmland. Declining groundwater levels led to the state declaring most of Avra Valley a critical groundwater area in 1954. This designation banned the drilling of new irrigation wells but failed to restrict how much water existing wells could pump. By the early 1960's, annual pumping had increased to 150,000 af with water level declines in some wells of up to 140 feet by 1979.14 To stabilize groundwater levels and obtain the associated water rights, the City of Tucson has purchased and retired more than 14,000 acres of farmland since the early 1970s.14 About 10,000 acres of irrigated crops, mostly alfalfa and cotton, continue to be farmed. Much of this acreage will likely be converted to urban use in the future. Central Arizona Project - The Central Arizona Project (CAP) canal enters the Avra Valley sub-basin from the north near the Picacho Mountains, continues south, and exits the sub-basin to the east, south of State Route 86. The CAP canal eventually terminates at Pima Mine Road just south of the San Xavier District of the Tohono O’odham Nation in the Upper Santa Cruz Valley sub-basin of the Tucson AMA. 9 Colorado River water has been conveyed through the CAP to the Tucson AMA since 1992. Tucson’s Water Department, which previously supplied only groundwater to its customers, provided CAP water directly to its customers for two years. The different
chemistry resulted in discolored water, broken water lines, and damaged water heaters and evaporative coolers. The Tucson City Council ordered the city to cease directly using CAP water in 1994. The direct delivery of CAP water unless its quality was equal to that of groundwater was prohibited by Proposition 200 in 1995. 9 CAP water is currently recharged in five facilities in the Tucson AMA, four of which are located in the Avra Valley sub-basin. Two recharge facilities are located near the Santa Cruz River northwest of Marana: the Avra Valley facility operated by Metro Water, and the Lower Santa Cruz facility operated by the Central Arizona Water Conservation District.11 Two facilities are located south of Marana in Avra Valley: the Central Avra Valley Storage and Recovery Project (CAVSARP) and the Southern Avra Valley Storage and Recovery Project (SAVSARP) operated by the Tucson Water Department. The CAVSARP and SAVSARP are part of the city’s Clearwater Renewable Resource Facility and are capable of recharging up to 140,000 af of Colorado River water, nearly all of Tucson Water's current annual allocation.12 The CAP water is recharged, blended with groundwater in the aquifer, and pumped out for public water use. The supplied water originally consisted of 95 percent groundwater and will transition into equal parts groundwater and CAP water.12 CAP water is also used directly for irrigation in the Avra Valley sub-basin. Tucson Water partners with farms within the Tucson AMA which irrigate their crops with CAP water rather than groundwater. The farmers purchase a portion of the City of Tucson's CAP allotment at a cost that is competitive with their cost for pumping groundwater. In exchange, Tucson Water receives the right to the groundwater that would otherwise have been used for irrigation. 12
This ADEQ study was conducted before there were considered to be any potential impacts from CAP recharge in the groundwater quality of the Avra Valley sub-basin. Groundwater Characteristics Aquifers – Sediments in the Avra Valley sub-basin have been divided into upper and lower alluvial units. The units are hydrologically connected and form the regional aquifer. 5 The upper unit is the primary water producer. The unit is composed of streambed deposits of silt, sand, and
5

gravel along Altar and Brawley washes and their major tributaries. The upper alluvial unit ranges in thickness from less than 100 feet to more than 1,000 feet. 22 The lower alluvial unit is thousands of feet thick and consists of gravel and conglomerates located near the edges of the sub-basin. These deposits transition into clayey silts and mudstones along the sub-basin’s central axis. These deposits are thickest in the northern part of the sub-basin, reaching an estimated depth of 9,600 feet in Avra Valley. The lower alluvial unit thins to the south, with sediments in the Altar Valley ranging from 4,800 feet thick in the northern part to 400 feet thick near the border with Mexico. 5 Limited amounts of groundwater are also found in the surrounding mountains in thin alluvial deposits and in fractured or faulted bedrock. Groundwater Conditions – Groundwater flow follows surface-water drainage, moving north and northwest from the border with Mexico. Groundwater is found in unconfined conditions though wells deeper than 1,000 feet below land surface (bls) may encounter confining conditions caused by less permeable clay layers. Perched groundwater exists in northeast Avra Valley, created by fine-grained beds impeding recharging irrigation water.5 Precipitation is the main source of natural recharge in the Avra Valley sub-basin. Most storm runoff recharge occurs along the contact zone between the mountains and valley sediments.14 Minor amounts of recharge also occur during flow events along Altar and Brawley washes and their major tributaries.32 Natural recharge in the Avra Valley sub-basin constitutes only about 16 percent of the Tucson AMA’s total.6
A small amount of groundwater underflow also recharges the basin from gaps in the mountains that separate it from the Upper Santa Cruz Valley sub-basin. An estimated 29,000 af per year of groundwater exits the Avra Valley sub-basin to the northwest into the Pinal AMA near the Picacho Mountains.5 Minimal groundwater development has occurred in the Altar Valley, where depth-to-water ranges from 14 to 720 feet bls.5 The shallowest water levels are along the Altar and Brawley washes while the deepest water levels are found on alluvial fans along the mountain fronts.5 There has been no significant change in groundwater levels as most wells are shallow, low-yielding, and used for stock watering. Numerous domestic wells do exist, however, near the community of Arivaca.6
Most groundwater development in the sub-basin has occurred within Avra Valley, where water levels range from 140 to 600 feet bls.5 Irrigation wells located near the center of Avra Valley are very productive, capable of more than 3,000 gallons per minute (gpm). Well yields decline towards the basin’s margins as the basin-fill sediments decrease in thickness.5 Irrigation pumping in Avra Valley had caused water level declines of more than 200 feet near the community of Red Rock by 1985. These declining groundwater levels have resulted in aquifer compaction and land subsidence of up to 1.1 feet in this area. Groundwater pumping was significantly reduced in Avra Valley between 1975 and 1984 as the result of the City of Tucson purchasing and retiring agricultural lands.36 After 1985, groundwater levels have increased near Marana as the result of the retirement of agricultural lands, the use of CAP water instead of groundwater, and groundwater recharge projects. 6 INVESTIGATION METHODS ADEQ collected samples from 42 sites to characterize regional groundwater quality in the Avra Valley sub-basin (Map 3). Specifically, the following types of samples were collected:
• inorganic suites at 42 sites • radionuclides at 24 sites • volatile organic compounds (VOCs) at 22 sites • radon at 19 sites
No bacteria sampling was conducted because microbiological contamination problems in groundwater are often transient and subject to a variety of changing environmental conditions including soil moisture content and temperature. 16 Wells pumping groundwater for domestic, stock, irrigation, and public water supply purposes were sampled for the study, provided each well met ADEQ requirements. A well was considered suitable for sampling when the following conditions were met: the owner has given permission to sample, a sampling point existed near the wellhead, and the well casing and surface seal appeared to be intact and undamaged.2, 8 For this study, ADEQ personnel sampled 42 wells served by 30 submersible pumps, 10 windmills, and two turbine pumps. Additional information on groundwater sample sites is compiled from the Arizona Department of Water Resources (ADWR) well registry in Appendix A. 7
6

7

Figure 1 – The Avra Valley sub-basin extends for a short distance past the Sasabe Customs Inspection Station shown above, south into Mexico. Sasabe is a small, unincorporated community that has one of the least-used crossings along the international border.
Figure 2 – The Buenos Aires National Wildlife Refuge is located in southern Altar Valley, just north of the Mexican border. The wildlife refuge provides 117,107 acres of grassland habitat for threatened and endangered species, most notably for the reintroduction of masked bobwhite quail and pronghorn. 4
8

Figure 3 – In the Altar Valley, the majority of lands are State Trust lands leased for grazing. Baboquivari Mountain is in the distance to the west. 4
Figure 4 – Most groundwater development in Altar Valley is for livestock use such as at the Santa Margarita Ranch, owned for many years by the famed Ronstadt family. Baboquivari Mountain is framed by the gateway entrance to the ranch.
Figure 5 – An Arizona Water Company well used for public water supply is located south of the community of Three Points (also known as Robles Junction), at the intersection of State Routes 86 and 286.
Figure 6 – Water from Lane Windmill pours into a storage tank for use by livestock and wildlife. A duplicate sample (AVB-26/27) was collected at the site.
Figure 7 – Former ADEQ employee Joe Harmon collects a sample (AVB-50) from the Cinco de Mayo stock well located near the Sierrita Mountains in Altar Valley.
9

Figure 8 – A sample (AVB-4) was collected from this windmill on State Trust land located north of Interstate 10 near the Tortilita Mountains.
Figure 9 – Former ADEQ employee Wang Yu poses by Kai Farm Well #1, a 650-foot-deep irrigation well in Marana. The sample (AVB-8) collected from the well met both health and aesthetics water quality standards.
Figure 10 – Duplicate samples (AVB-9/9D) were collected from Heatley Well, used for irrigation in Marana. The duplicate samples exceeded water quality standards for both nitrate and TDS.
Figure 11 – This well used for domestic purposes is located in granitic geology near the Sierrita Mountains in Altar Valley. The sample (AVB-15) exceeded water quality standards for radionuclides and had the highest radon concentration (83,620 piC/L) ever collected by the ADEQ ambient groundwater monitoring program. .
Figure 12 – A sample (AVB-36) was collected from Agua del Oro Well that is located in the remote southern part of the Baboquivari Mountains. No water quality standards were exceeded at this stock well, which is powered by a pump jack.
10

Figure 13 – The sample (AVB-51/51D) obtained at the Avra Valley Air Park well was collected before any treatment by the water system. The well, one of the few in the study that had a driller’s log, tapped the upper alluvial unit of the regional aquifer. 7
Figure 14 – A duplicate sample (AVB-42/43) was collected from this domestic well located in Avra Valley just west of the Tucson Mountains. The samples met all water quality standards.
Figure 15 – The 740-foot-deep Bringhurst Well, located north of Interstate 10 is used for domestic and stock purposes. The sample (AVB-6) collected from the well had the highest field pH value of the study (8.19 su) and exceeded standards for arsenic, fluoride, and gross alpha.
Figure 16 – The sample (AVB-52) collected from Kai Farm Well #2 met all water quality standards except for the aesthetic standard for TDS. Water produced by the well is used for irrigation in Marana.
11

Sample Collection The sample collection methods for this study conformed to the Quality Assurance Project Plan (QAPP) 2 and the Field Manual for Water Quality Sampling.8 While these sources should be consulted as references to specific sampling questions, a brief synopsis of the procedures involved in collecting a groundwater sample is provided. After obtaining permission from the well owner, the volume of water needed to purge the well three bore-hole volumes was calculated from well log and on-site information. Physical parameters—temperature, pH, and specific conductivity—were monitored every five minutes using a YSI multi-parameter instrument. To assure obtaining fresh water from the aquifer, after three bore volumes had been pumped and physical parameter measurements had stabilized within 10 percent, a sample representative of the aquifer was collected from a point as close to the wellhead as possible. In certain instances, it was not possible to purge three bore volumes. In these cases, at least one bore volume was evacuated and the physical parameters had stabilized within 10 percent. Sample bottles were filled in the following order: 1. Radon 2. VOCs 3. Inorganics 4. Radionuclide Radon, a naturally occurring, intermediate breakdown from the radioactive decay of uranium-238 to lead-206, was collected in two unpreserved, 40 milliliter (ml) clear glass vials. Radon samples were filled to minimize volatilization and sealed so that no headspace remained.8, 26
VOC samples were collected in two, 40-ml amber glass vials which contained 10 drops of 1:1 hydrochloric (HCl) acid preservative prepared by the laboratory. Before sealing the vials with Teflon caps, pH test strips were used to confirm the pH of the sample was below 2 standard units (su); additional HCl acid was added if necessary. VOC samples were subsequently checked to make sure there were no air bubbles in the vials. 24 The inorganic constituents were collected in three, one-liter polyethylene bottles: samples to be analyzed for dissolved metals were filtered into bottles using a positive pressure filtering apparatus with a 0.45 micron (µm) pore size groundwater capsule filter and
preserved with 5 ml nitric acid (70 percent). Samples AVB-4 through AVB-16 were delivered unpreserved and not acidified to the laboratory and analyzed for total recoverable metals instead of dissolved metals. Samples to be analyzed for nutrients were preserved with 2 ml sulfuric acid (95.5 percent). Samples to be analyzed for other parameters were unpreserved.24, 26
Radiochemistry samples were collected in two collapsible four-liter plastic containers and preserved with 5 ml nitric acid to reduce the pH below 2.5 su. 8 All samples were kept at 4oC with ice in an insulated cooler. 24 Chain of custody procedures were followed in sample handling. Samples for this study were collected during 12 field trips conducted between 1998 and 2002. Laboratory Methods VOC samples and the inorganic analyses were conducted by the Arizona Department of Health Services (ADHS) Laboratory in Phoenix, Arizona. The inorganic analyses for the four split samples (AVB-19, AVB-26, AVB-33, and AVB-41) were conducted by Test America Laboratory in Phoenix, Arizona. A complete listing of inorganic parameters, including laboratory method and Minimum Reporting Level (MRL) for each laboratory is provided in Table 1. The VOCs analyte list is provided in Table 2. Radionuclide analyses were conducted by the Arizona Radiation Agency Laboratory in Phoenix. The following EPA Safe Drinking Water Act (SDWA) protocols were used: Gross alpha was analyzed, and if levels exceeded 5 picocuries per liter (pCi/L), then radium-226 was measured. If radium-226 exceeded 3 pCi/L, radium-228 was measured. If gross alpha levels exceeded 15 pCi/L initially, then radium-226/228 and total uranium were measured. Radon samples were submitted to Test America Laboratory and analyzed by Radiation Safety Engineering, Inc. Laboratory in Chandler, Arizona. DATA EVALUATION Quality Assurance Quality-assurance (QA) procedures were followed and quality-control (QC) samples were collected to quantify data bias and variability for the Avra Valley basin study. The design of the QA/QC plan was based on recommendations included in the Quality Assurance Project Plan (QAPP) and the Field Manual for Water Quality Sampling. 2, 8
12
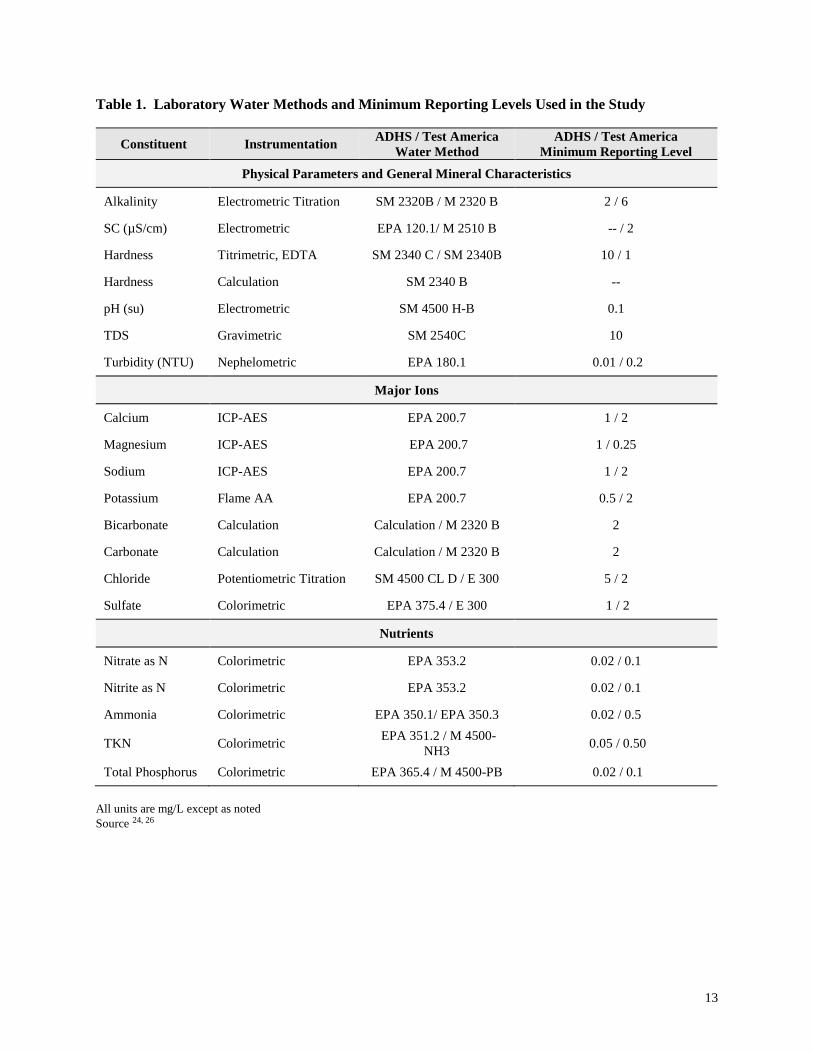
Table 1. Laboratory Water Methods and Minimum Reporting Levels Used in the Study
Constituent Instrumentation ADHS / Test America Water Method
ADHS / Test America Minimum Reporting Level
Physical Parameters and General Mineral Characteristics
Alkalinity Electrometric Titration SM 2320B / M 2320 B 2 / 6
SC (µS/cm) Electrometric EPA 120.1/ M 2510 B -- / 2
Hardness Titrimetric, EDTA SM 2340 C / SM 2340B 10 / 1
Hardness Calculation SM 2340 B --
pH (su) Electrometric SM 4500 H-B 0.1
TDS Gravimetric SM 2540C 10
Turbidity (NTU) Nephelometric EPA 180.1 0.01 / 0.2
Major Ions
Calcium ICP-AES EPA 200.7 1 / 2
Magnesium ICP-AES EPA 200.7 1 / 0.25
Sodium ICP-AES EPA 200.7 1 / 2
Potassium Flame AA EPA 200.7 0.5 / 2
Bicarbonate Calculation Calculation / M 2320 B 2
Carbonate Calculation Calculation / M 2320 B 2
Chloride Potentiometric Titration SM 4500 CL D / E 300 5 / 2
Sulfate Colorimetric EPA 375.4 / E 300 1 / 2
Nutrients
Nitrate as N Colorimetric EPA 353.2 0.02 / 0.1
Nitrite as N Colorimetric EPA 353.2 0.02 / 0.1
Ammonia Colorimetric EPA 350.1/ EPA 350.3 0.02 / 0.5
TKN Colorimetric EPA 351.2 / M 4500-NH3 0.05 / 0.50
Total Phosphorus Colorimetric EPA 365.4 / M 4500-PB 0.02 / 0.1 All units are mg/L except as noted Source 24, 26
13

Table 1. Laboratory Water Methods and Minimum Reporting Levels Used in the Study-Continued
Constituent Instrumentation ADHS / Test America Water Method
ADHS / Test America Minimum Reporting Level
Trace Elements
Aluminum ICP-AES EPA 200.7 0.5 / 0.2
Antimony Graphite Furnace AA EPA 200.8 0.005 / 0.003
Arsenic Graphite Furnace AA EPA 200.9 / EPA 200.8 0.005 / 0.001
Barium ICP-AES EPA 200.8 / EPA 200.7 0.005 to 0.1 / 0.01
Beryllium Graphite Furnace AA EPA 200.9 / EPA 200.8 0.0005 / 0.001
Boron ICP-AES EPA 200.7 0.1 / 0.2
Cadmium Graphite Furnace AA EPA 200.8 0.0005 / 0.001
Chromium Graphite Furnace AA EPA 200.8 / EPA 200.7 0.01 / 0.01
Copper Graphite Furnace AA EPA 200.8 / EPA 200.7 0.01 / 0.01
Fluoride Ion Selective Electrode SM 4500 F-C 0.1 / 0.4
Iron ICP-AES EPA 200.7 0.1 / 0.05
Lead Graphite Furnace AA EPA 200.8 0.005 / 0.001
Manganese ICP-AES EPA 200.7 0.05 / 0.01
Mercury Cold Vapor AA SM 3112 B / EPA 245.1 0.0002
Nickel ICP-AES EPA 200.7 0.1 / 0.01
Selenium Graphite Furnace AA EPA 200.9 / EPA 200.8 0.005 / 0.002
Silver Graphite Furnace AA EPA 200.9 / EPA 200.7 0.001 / 0.01
Thallium Graphite Furnace AA EPA 200.9 / EPA 200.8 0.002 / 0.001
Zinc ICP-AES EPA 200.7 0.05
Radionuclides
Radon Liquid scintillation counter EPA 913.1 varies
Gross alpha beta Gas flow proportional counter EPA 900.0 varies
Co-Precipitation Gas flow proportional counter EPA 00.02 varies
Radium 226 Gas flow proportional counter EPA 903.0 varies
Radium 228 Gas flow proportional counter EPA 904.0 varies
Uranium Kinetic phosphorimeter EPA Laser Phosphorimetry varies
All units are mg/L Source 24, 26
14

Table 2. Volatile Organic Compounds (VOCs) Analyte List
Benzene 1,4-Dichlorobenzene Methyl-T-butyl ether
Bromodichloromethane Dichlorodifluoromethane 1,1,1,2-Tetrachloroethane
Bromoform 1,1-Dichloroethane Tetrachloroethylene
Bromomethane 1,2-Dichloroethane Toluene
Carbon Tetrachloride 1,1-Dichloroethene 1,1,1-Trichlorobenzene
Chlorobenzene cis-1,2-Dichloroethene 1,1,2-Trichloroethane
Chloroethane trans-1,2-Dichloroethene Trichloroethylene
Chloroform 1,2-Dichloropropane Trichlorofluoromethane
Chloromethane cis-1,3-Dichloropropene Vinyl chloride
Dibromomethane trans-1,3-Dichloropropene Total xylenes
1,2-Dichlorobenzene Ethylbenzene
1,3-Dichlorobenzene Methylene chloride
Types and numbers of QC inorganic samples collected for this study include four blanks, seven duplicates, four partial duplicates, and three splits. Blanks – Four equipment blanks for inorganic analyses was collected and delivered to the ADHS laboratory to ensure adequate decontamination of sampling equipment, and that the filter apparatus and/or de-ionized water were not impacting the groundwater quality sampling.8 The equipment blank sample for major ion and nutrient analyses were collected by filling unpreserved and sulfuric acid preserved bottles with de-ionized water. The equipment blank sample for trace element analysis was collected with de-ionized water that had been filtered into nitric acid preserved bottles. Systematic contamination was judged to occur if 50 percent or more of the equipment blank samples contained measurable quantities of a particular groundwater quality constituent. The equipment blanks contained boron, turbidity and specific conductivity (SC-lab) at levels that could be explained by impurities in the source water used for the samples. Three of four equipment blanks tested had detections of SC with a mean value of 2.9 micro-Siemens per cm (uS/cm) which was less than one percent of the SC mean concentration for the study and was not considered to be significantly affecting the sample
results. The SC detections may have occurred when water passing through a de-ionizing exchange unit, which normally has an SC value of at least 1 uS/cm. Carbon dioxide from the air can also dissolve in de-ionized water with the resulting bicarbonate and hydrogen ions imparting the observed conductivity.24 Three of four equipment blanks tested had detections of turbidity with a mean level of 0.04 nephelometric turbidity units (ntu), less than one percent of the turbidity mean level for the study. This was not considered to significantly affect the sample results. Testing indicates turbidity is present at 0.01 ntu in the de-ionized water supplied by the ADHS laboratory, and levels increase with time due to storage in ADEQ carboys.24 Two of four equipment blanks tested had detections of boron with a mean value of 0.115 mg/L. These levels were not considered to significantly affect the sample results. The boron detections may have occurred with detergent residue left when the de-ionized water bottles were cleaned.24 Boron detections in equipment blanks have been found in previous ADEQ ambient groundwater studies.27 Zinc was also detected at a concentration of 0.17 mg/L in one equipment blank. The cause of this detection was unknown. The eight VOC travel blanks revealed no contamination issues with any of the 34 compounds.
15

Duplicate Samples – Duplicate samples are identical sets of samples collected from the same source at the same time and submitted to the same laboratory. Data from duplicate samples provide a measure of variability from the combined effects of field and laboratory procedures.8 Duplicate samples were collected from sampling sites that were believed to have elevated or unique constituent concentrations as judged by SC-field and pH-field values. Seven complete duplicate samples and four partial duplicate samples were collected and submitted to the ADHS laboratory for this study. Analytical results indicate that of the 40 constituents examined, 24 had concentrations above the MRL. The duplicate samples had an excellent correlation as the maximum variation between constituents was less than 10 percent except for nitrate (14 percent), sulfate (15 percent), turbidity (41 percent), and TKN (63 percent) (Table 3). Split Samples – Split samples are identical sets of samples collected from the same source at the same time that are submitted to two different laboratories to check for laboratory differences.8 Four inorganic split samples were collected and distributed between the ADHS and Test America labs. The analytical results were evaluated by examining the variability in constituent concentrations in terms of absolute levels and as the percent difference. Analytical results indicate that of the 36 constituents examined, 16 had concentrations above MRLs for both ADHS and Test America laboratories. The maximum variation between constituent values was 10 percent or below except for TDS (11 percent), zinc (12 percent), fluoride (14 percent), sulfate and nitrate (18 percent), and turbidity (61 percent) (Table 4). Split samples were also evaluated using the non-parametric Sign test to determine if there were any significant differences between ADHS laboratory and Test America laboratory analytical results.33 There were no significant differences in constituent concentrations between the labs (Sign test, p ≤ 0.05). Based on the results of blank, duplicate, and split samples collected for this study, no significant QA/QC problems were apparent with the study. Data Validation The analytical work for this study was subjected to four QA/QC correlations and considered valid based on the following results. 19
Cation/Anion Balances – In theory, water samples exhibit electrical neutrality. Therefore, the sum of milliequivalents per liter (meq/L) of cations should equal the sum of meq/L of anions. However, this neutrality rarely occurs due to unavoidable variation inherent in all water quality analyses. Still, if the cation/anion balance is found to be within acceptable limits, it can be assumed there are no gross errors in concentrations reported for major ions.19 Overall, cation/anion meq/L balances of Avra Valley samples were significantly correlated (regression analysis, p ≤ 0.01). Of the 42 samples, all were within +/-5 percent and 29 samples were within +/- 2 percent. Twenty-seven samples had low cation/high anion sums and 15 samples had high cation/low anion sums. SC/TDS – The SC and TDS concentrations measured by contract laboratories were significantly correlated as were SC-field and TDS concentrations (regression analysis, r = 0.98, p ≤ 0.01). The TDS concentration in mg/L should be from 0.55 to 0.75 times greater than the SC in µS/cm for groundwater up to several thousand TDS mg/L.19 Groundwater high in bicarbonate and chloride will have a multiplication factor near the lower end of this range; groundwater high in sulfate may reach or even exceed the higher factor. The relationship of TDS to SC becomes undefined with very high or low concentrations of dissolved solids.19
SC – The SC measured in the field at the time of sampling was significantly correlated with the SC measured by contract laboratories (regression analysis, r = 0.99, p ≤ 0.01). Hardness – Concentrations of laboratory-measured and calculated values of hardness were significantly correlated (regression analysis, r = 0.99, p ≤ 0.01) (Diagram 1). Hardness concentrations were calculated using the following formula: [(calcium x 2.497) + (magnesium x 4.118)]. 17 pH – The pH value is related to the environment of the water and is likely to be altered by sampling and storage.20 Still, the pH values measured in the field using a YSI meter at the time of sampling were not significantly correlated with laboratory pH values (regression analysis, r = 0.37, p ≤ 0.05). Statistical Considerations Various statistical analyses were used to examine the groundwater quality data of the study. All statistical tests were conducted using SYSTAT software.33
16
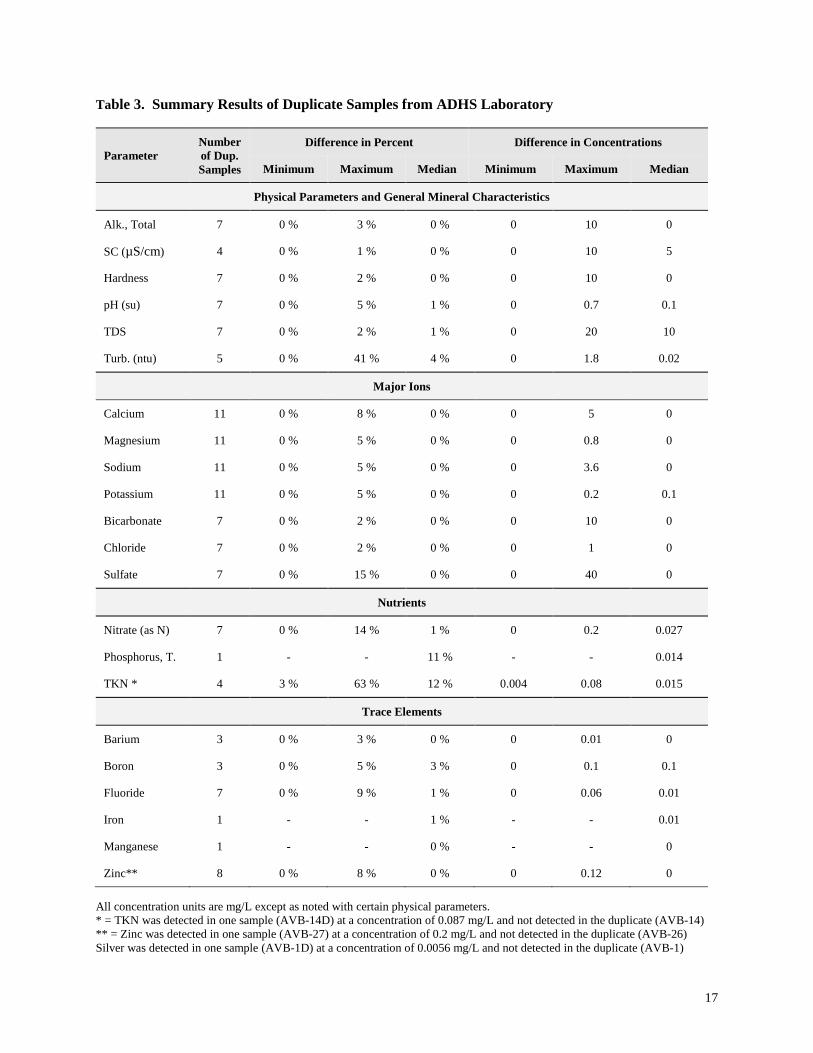
Table 3. Summary Results of Duplicate Samples from ADHS Laboratory
Parameter Number of Dup. Samples
Difference in Percent Difference in Concentrations
Minimum Maximum Median Minimum Maximum Median
Physical Parameters and General Mineral Characteristics
Alk., Total 7 0 % 3 % 0 % 0 10 0
SC (µS/cm) 4 0 % 1 % 0 % 0 10 5
Hardness 7 0 % 2 % 0 % 0 10 0
pH (su) 7 0 % 5 % 1 % 0 0.7 0.1
TDS 7 0 % 2 % 1 % 0 20 10
Turb. (ntu) 5 0 % 41 % 4 % 0 1.8 0.02
Major Ions
Calcium 11 0 % 8 % 0 % 0 5 0
Magnesium 11 0 % 5 % 0 % 0 0.8 0
Sodium 11 0 % 5 % 0 % 0 3.6 0
Potassium 11 0 % 5 % 0 % 0 0.2 0.1
Bicarbonate 7 0 % 2 % 0 % 0 10 0
Chloride 7 0 % 2 % 0 % 0 1 0
Sulfate 7 0 % 15 % 0 % 0 40 0
Nutrients
Nitrate (as N) 7 0 % 14 % 1 % 0 0.2 0.027
Phosphorus, T. 1 - - 11 % - - 0.014
TKN * 4 3 % 63 % 12 % 0.004 0.08 0.015
Trace Elements
Barium 3 0 % 3 % 0 % 0 0.01 0
Boron 3 0 % 5 % 3 % 0 0.1 0.1
Fluoride 7 0 % 9 % 1 % 0 0.06 0.01
Iron 1 - - 1 % - - 0.01
Manganese 1 - - 0 % - - 0
Zinc** 8 0 % 8 % 0 % 0 0.12 0 All concentration units are mg/L except as noted with certain physical parameters. * = TKN was detected in one sample (AVB-14D) at a concentration of 0.087 mg/L and not detected in the duplicate (AVB-14) ** = Zinc was detected in one sample (AVB-27) at a concentration of 0.2 mg/L and not detected in the duplicate (AVB-26) Silver was detected in one sample (AVB-1D) at a concentration of 0.0056 mg/L and not detected in the duplicate (AVB-1)
17

Table 4. Summary Results of Split Samples between ADHS / Test America Labs
Constituents Number of Split Sites
Difference in Percent Difference in Levels Significance
Minimum Maximum Minimum Maximum
Physical Parameters and General Mineral Characteristics
Alkalinity, total 4 0 % 8 % 0 20 ns
SC (µS/cm) 4 0 % 8 % 0 70 ns
Hardness 4 0 % 0 % 0 0 ns
pH (su) 4 1 % 3 % 0.11 0.47 ns
TDS 4 2 % 11 % 20 40 ns
Turbidity (ntu) 2 22 % 61 % 3.1 21.9 ns
Major Ions
Calcium 4 0 % 3 % 0 2 ns
Magnesium 4 0 % 3 % 0 0.4 ns
Sodium 4 3 % 7 % 1 7 ns
Potassium 4 2 % 10 % 0.1 0.5 ns
Chloride 4 5 % 8 % 1 5 ns
Sulfate 4 0 % 18 % 0 15 ns
Nutrients
Nitrate as N 3 1 % 18 % 0.3 1.5 ns
Trace Elements
Barium 1 0 % 0 % 0 0 ns
Fluoride 4 2 % 14 % 0.12 0.63 ns
Zinc 3 4 % 12 % 0.008 0.4 ns
ns = No significant (p ≤ 0.05) difference All units are mg/L except as noted TKN was detected by Test America in (AVB-29) at 0.56 mg/L and not detected in the ADHS split sample (AVB-25) TKN was detected by Test America in (AVB-41) at 1.7 mg/L and not detected in the ADHS split sample (AVB-40) Turbidity was detected by Test America in (AVB-41) at 0.011 mg/L and not detected in the ADHS split sample (AVB-40)
18

Data Normality: Data associated with 24 constituents were tested for non-transformed normality using the Kolmogorov-Smirnov one-sample test with the Lilliefors option.10 Results of this test revealed that two of the 24 constituents examined were normally distributed including temperature and pH-field. Spatial Relationships: The non-parametric Kruskal-Wallis test using untransformed data was applied to investigate the hypothesis that constituent concentrations from groundwater sites having different valleys and geology were the same. With the four-way valley/geology demarcation, the Tukey test was also used to examine for significant differences between groups. 18 The Kruskal-Wallis test uses the differences, but also incorporates information about the magnitude of each difference.33 The null hypothesis of identical mean values for all data sets within each test was rejected if the probability of obtaining identical means by
chance was less than or equal to 0.05. The Kruskal-Wallis test is not valid for data sets with greater than 50 percent of the constituent concentrations below the MRL.18 Correlation between Constituents: In order to assess the strength of association between constituents, their concentrations were compared to each other using the non-parametric Kendall’s tau-b test. Kendall’s correlation coefficient varies between -1 and +1; with a value of +1 indicating that a variable can be predicted perfectly by a positive linear function of the other, and vice versa. A value of -1 indicates a perfect inverse or negative relationship. The results of the Kendall’s tau-b test were then subjected to a probability test to determine which of the individual pair wise correlations were significant.33 The Kendall’s tau-b test is not valid for data sets with greater than 50 percent of the constituent concentrations below the MRL.18
0 100 200 300 400 500Hardness (mg/L)
0
100
200
300
400
500
Hard
ness
- Ca
lcula
ted
(mg/
L)
Diagram 1 – The graph illustrates a positive correlation between two constituents; as hardness concentrations increase, calculated hardness concentrations also increase. This strong relationship is described by the regression equation: y = 1.02x + 0.5 (r = 0.40). This relationship is one of the QA/QC correlations conducted to validate the laboratory results. 19 Hardness concentrations were calculated using the following formula: [(calcium x 2.497) + (magnesium x 4.118)].
19

GROUNDWATER SAMPLING RESULTS Water Quality Standards/Guidelines The ADEQ ambient groundwater program characterizes regional groundwater quality. An important determination ADEQ makes concerning the collected samples is how the analytical results compare to various drinking water quality standards. ADEQ used three sets of drinking water standards that reflect the best current scientific and technical judgment available to evaluate the suitability of groundwater in the basin for drinking water use:
• Federal Safe Drinking Water (SDW) Primary Maximum Contaminant Levels (MCLs). These enforceable health-based standards establish the maximum concentration of a constituent allowed in water supplied by public systems.29
• State of Arizona Aquifer Water Quality
Standards. These apply to aquifers that are classified for drinking water protected use. All aquifers within Arizona are currently classified and protected for drinking water use. These enforceable State standards are identical to the federal Primary MCLs except for arsenic which is at 0.05 mg/L compared with the federal Primary MCL of 0.01 mg/L and uranium with a federal Primary MCL of 30 ug/L. 3
• Federal SDW Secondary MCLs. These non-
enforceable aesthetics-based guidelines define the maximum concentration of a constituent that can be present without imparting unpleasant taste, color, odor, or other aesthetic effects on the water.29
Health-based drinking water quality standards (such as Primary MCLs) are based on the lifetime consumption (70 years) of two liters of water per day and, as such, are chronic not acute standards.29
Exceedances of specific constituents for each groundwater site is found in Appendix B. Overall Results – Of the 42 sites sampled in the Avra Valley study, 36 sites met all health-based and aesthetics-based, water quality standards (excluding the proposed radon standard discussed below). Of the 42 sites sampled in the Avra Valley study, health-based water quality standards were exceeded at six sites (14 percent). Constituents above Primary
MCLs include arsenic (two sites), gross alpha (five sites), uranium (two sites), and one site each for nitrate and radium-226+228. Inorganic Constituent Results - Of the 42 sites sampled for the full suite of inorganic constituents (excluding radionuclide sample results) in the Avra Valley study, 29 sites (69 percent) met all health-based and aesthetics-based, water quality standards. Health-based Primary MCL water quality standards and State aquifer water quality standards were exceeded at three of the 42 sites (seven percent) (Map 4). Constituents above Primary MCLs include arsenic (two sites) and nitrate (one site). Potential impacts of these Primary MCL exceedances are given in Table 5. Aesthetics-based Secondary MCL water quality guidelines were exceeded at 11 of 42 sites (26 percent) (Map 4). Constituents above Secondary MCLs include TDS (seven sites), fluoride (five sites), manganese (two sites), iron and sulfate (one site apiece). Potential impacts of these Secondary MCL exceedances are given in Table 6. Radionuclide Results - Of the 24 sites sampled for radionuclides, health-based water quality standards were exceeded at five sites (21 percent). Constituents above Primary MCLs include gross alpha (five sites), uranium (two sites), and radium-226+228 (one site). VOC Results - Of the 22 sites sampled for VOCs, there were no detections of any of the 32 compounds. Radon Results - Of the 19 sites sampled for radon, one exceeded the proposed 4,000 picocuries per liter (pCi/L) standard that would apply if Arizona establishes an enhanced multimedia program to address the health risks from radon in indoor air. Sixteen sites exceeded the proposed 300 pCi/L standard (Table 5; Map 5) that would apply if Arizona doesn’t develop a multimedia program. 30
Analytical Results Analytical inorganic and radiochemistry results of the Avra Valley sub-basin sample sites are summarized (Table 7) using the following indices: MRLs, number of sample sites over the MRL, upper and lower 95 percent confidence intervals (CI95%), median, and mean. Confidence intervals are a statistical tool which indicates that 95 percent of a constituent’s population lies within the stated confidence interval.33 Specific constituent information for each sampled groundwater site is in Appendix B.
20

21

Table 5. Sampled Sites Exceeding Health-based Water Quality Standards or Primary MCLs
Constituent Primary MCL
Number of Sites Exceeding
Primary MCL
Highest Concentration
Potential Health Effects of MCL Exceedances *
Nutrients
Nitrite (NO2-N) 1.0 0 - -
Nitrate (NO3-N) 10.0 1 12.5 methemoglobinemia
Trace Elements
Antimony (Sb) 0.006 0 - -
Arsenic (As) 0.01 2 0.038 dermal and nervous system toxicity
Arsenic (As) 0.05 0 - -
Barium (Ba) 2.0 0 - -
Beryllium (Be) 0.004 0 - -
Cadmium (Cd) 0.005 0 - -
Chromium (Cr) 0.1 0 - -
Copper (Cu) 1.3 0 - -
Fluoride (F) 4.0 0 - -
Lead (Pb) 0.015 0 - -
Mercury (Hg) 0.002 0 - -
Nickel (Ni) 0.1 0 - -
Selenium (Se) 0.05 0 - -
Thallium (Tl)** 0.002 0 - -
Radiochemistry Constituents
Gross Alpha 15 5 170 cancer
Ra-226+Ra-228 5 1 30.8 bone cancer
Radon ** 300 16 906 cancer
Radon ** 4,000 1 83,620 cancer
Uranium 30 2 140 cancer and kidney toxicity
All units are mg/L except gross alpha, radium-226+228 and radon (pCi/L), and uranium (ug/L). * Health-based drinking water quality standards are based on a lifetime consumption of two liters of water per day over a 70-year life span.29
** Proposed EPA Safe Drinking Water Act standards for radon in drinking water. 30
22

Table 6. Sampled Sites Exceeding Aesthetics-Based (Secondary MCL) Water Quality Standards
Constituents Secondary MCL
Number of Sites Exceeding
Secondary MCLs
Concentration Range
of Exceedances
Aesthetic Effects of MCL Exceedances
Physical Parameters
pH - field < 6.5 0 - -
pH - field > 8.5 0 - -
General Mineral Characteristics
TDS 500 7 720 hardness; deposits;
colored water; staining; salty taste
Major Ions
Chloride (Cl) 250 0 - -
Sulfate (SO4) 250 1 290 salty taste
Trace Elements
Fluoride (F) 2.0 5 2.8 tooth discoloration
Iron (Fe) 0.3 1 0.475 rusty color, reddish stains, and metallic tastes
Manganese (Mn) 0.05 2 0.052 black staining; bitter metallic taste
Silver (Ag) 0.1 0 - -
Zinc (Zn) 5.0 0 - - All units mg/L except pH is in standard units (su). Source: 29
23

24

Table 7. Summary Statistics for Groundwater Quality Data
Constituent Minimum Reporting
Limit (MRL)*
# of Samples / Samples
Over MRL Median
Lower 95% Confidence
Interval Mean
Upper 95% Confidence
Interval
Physical Parameters
Temperature (oC) 0.1 42 / 42 26.6 25.0 26.3 27.6
pH-field (su) 0.01 42 / 42 7.57 7.46 7.56 7.66
pH-lab (su) 0.01 42 / 42 7.82 7.67 7.79 7.91
Turbidity (ntu) 0.01 / 1.0 42 / 39 0.4 -0.2 4.3 8.8
General Mineral Characteristics
T. Alkalinity 2.0 / 5.0 42 / 42 163 169 189 209
Phenol. Alk. 2.0 / 5.0 42 / 0 > 50% of data below MRL
SC-field (µS/cm) N/A 42 / 42 477 480 551 623
SC-lab (µS/cm) N/A / 2.0 42 / 42 468 485 559 633
Hardness-lab 10 / 1 42 / 42 130 144 173 202
TDS 10 / 20 42 / 42 280 303 349 394
Major Ions
Calcium 5 / 2 42 / 42 39 43 51 59
Magnesium 1.0 / 0.5 42 / 42 10 10 13 15
Sodium 5 42 / 42 42 43 52 60
Potassium 0.5 / 1.0 42 / 42 2.4 2.1 2.5 2.9
Bicarbonate 2.0 / 5.0 42 / 42 203 206 231 255
Carbonate 2.0 / 5.0 42 / 0 > 50% of data below MRL
Chloride 1 / 5 42 / 42 24 26 37 48
Sulfate 10 42 / 41 17 23 41 59
Nutrients
Nitrate (as N) 0.05 42 / 41 1.7 2.0 2.9 3.7
Nitrite (as N) 0.02 / 0.20 29 / 0 > 50% of data below MRL
TKN 0.05 / 0.5 34 / 18 > 50% of data below MRL
Ammonia 0.02 / 0.5 31 / 1 > 50% of data below MRL
T. Phosphorus 0.02 / 0.05 31 / 7 > 50% of data below MRL
25

Table 7. Summary Statistics for Groundwater Quality Data—Continued
Constituent Minimum Reporting
Limit (MRL)*
# of Samples / Samples
Over MRL Median
Lower 95% Confidence
Interval Mean
Upper 95% Confidence
Interval
Trace Elements
Aluminum 0.5 29 / 0 > 50% of data below MRL
Antimony 0.005 / 0.004 42 / 0 > 50% of data below MRL
Arsenic 0.01 / 0.003 42 / 40 > 50% of data below MRL
Barium 0.1 / 0.01 42 / 14 > 50% of data below MRL
Beryllium 0.0005 42 / 0 > 50% of data below MRL
Boron 0.1 / 0.5 42 / 18 > 50% of data below MRL
Cadmium 0.001 / 0.005 42 / 0 > 50% of data below MRL
Chromium 0.01 / 0.004 42 / 1 > 50% of data below MRL
Copper 0.01 / 0.004 42 / 1 > 50% of data below MRL
Fluoride 0.05 / 0.1 42 / 42 0.5 0.5 0.8 1.0
Iron 0.1 / 0.2 42 / 3 > 50% of data below MRL
Lead 0.005 / 0.002 42 / 0 > 50% of data below MRL
Manganese 0.05 / 0.02 42 / 2 > 50% of data below MRL
Mercury 0.0005 / 0.0002 42 / 0 > 50% of data below MRL
Nickel 0.1 / 0.05 42 / 0 > 50% of data below MRL
Selenium 0.005 / 0.004 42 / 0 >50% of data below MRL
Silver 0.001 / 0.005 42 / 0 > 50% of data below MRL
Thallium 0.002 42 / 0 > 50% of data below MRL
Zinc 0.05 42 / 29 0.07 0.06 0.25 0.45
Radiochemical
Gross Alpha** Varies 24 / 22 7 2 16 31
Gross Beta** Varies 24 / 24 4 0 7 16
Radon ** Varies 19 / 19 587 -3883 5276 14436
* = ADHS MRL / Test America MRL All units mg/L except where noted or ** = (pCi/L)
26

GROUNDWATER COMPOSITION General Summary The water chemistry at the 42 sample sites in the Avra Valley include mixed-bicarbonate (21 sites), calcium-bicarbonate (11 sites), sodium-bicarbonate (three sites), calcium-mixed and mixed-mixed (two sites apiece), and sodium mixed and mixed-sulfate (one site apiece) (Diagram 2 – middle figure) (Map 6).
The dominant cation was calcium at 13 sites and sodium at five sites. At 24 sites the composition was mixed as there was no dominant cation (Diagram 2 – left figure). The dominant anion was bicarbonate at 35 sites. Chloride and sulfate were the dominant anion at one site apiece. The composition was mixed at five sites as there was no dominant anion (Diagram 2 – right figure).
Diagram 2 – Samples collected in the Avra Valley sub-basin predominantly have a calcium-bicarbonate or mixed-bicarbonate chemistry which is reflective of younger groundwater that has been recently recharged.25
Each sample was classified by valley location (Avra vs Altar), designated by triangles and geologic substrate (consolidated rock vs unconsolidated sediments), designated by “x’s”. Samples collected from wells producing water from unconsolidated sediments in Avra Valley had the most variable chemistry, probably as a result of having the most development, particularly irrigation, in that portion of the sub-basin.
27

28

At 42 sites, levels of pH-field were slightly alkaline (above 7 su) and three sites were above 8 su. No sites had pH-field levels that were slightly acidic (below 7 su).17 TDS concentrations were considered fresh (below 999 mg/L) at 42 sites (Map 7).17 Hardness concentrations were soft (below 75 mg/L) at two sites, moderately hard (75 – 150 mg/L) at 21 sites, hard (150 – 300 mg/L) at 13 sites, very hard (301 - 600 mg/L) at five sites, and extremely hard at one site (Map 8).15 Nitrate (as nitrogen) concentrations at most sites may have been influenced by human activities (Map 9). Nitrate concentrations were divided into natural background (four sites at < 0.2 mg/L), may or may not indicate human influence (23 sites at 0.2 – 3.0 mg/L), may result from human activities (14 sites at
3.0 – 10 mg/L), and probably result from human activities (one site > 10 mg/L).21
Most trace elements such as aluminum, antimony, arsenic, beryllium, cadmium, chromium, copper, iron, lead, manganese, mercury, nickel, selenium, silver, and thallium were rarely – if ever - detected. Only barium, boron, fluoride, and zinc were detected at more than 25 percent of the sites. The groundwater at each sample site was assessed as to its suitability for irrigation use based on salinity and sodium hazards. Excessive levels of sodium are known to cause physical deterioration of the soil and vegetation. Irrigation water may be classified using SC and the Sodium Adsorption Ratio (SAR) in conjunction with one another.31 Groundwater sites in the Avra Valley display a narrow range of irrigation water classifications. Samples predominantly had a “low” sodium hazard and a “medium-to-high” salinity hazard (Table 8).
Table 8. Sodium and Salinity Hazards for Sampled Sites
Hazard Total Sites Low Medium High Very High
Sodium Hazard Sodium Adsorption
Ratio (SAR) 0 - 10 10- 18 18 - 26 > 26
Sample Sites 42 42 0 0 0
Salinity Hazard Specific
Conductivity (µS/cm)
100–250 250 – 750 750-2250 >2250
Sample Sites 42 0 33 9 0
29

30

31

32

Constituent Co-Variation The correlations between different chemical parameters were analyzed to determine the relationship between the constituents that were sampled. The strength of association between the chemical constituents allows for the identification of broad water quality patterns within a basin. The results of each combination of constituents were examined for statistically-significant positive or negative correlations. A positive correlation occurs when, as the level of a constituent increases or decreases, the concentration of another constituent also correspondingly increases or decreases. A negative correlation occurs when, as the concentration of a constituent increases, the concentration of another constituent decreases, and vice-versa. A positive correlation indicates a direct relationship between constituent concentrations; a negative correlation indicates an inverse relationship.33 Several significant correlations occurred among the 42 sample sites (Table 9, Kendall’s tau-b test, p ≤ 0.05). Three groups of correlations were identified:
• There were positive correlations with TDS
and SC, hardness, calcium, magnesium, sodium, potassium, bicarbonate (Diagram 3), chloride, and sulfate.
• Fluoride had a strong positive correlation
with pH-field, sodium, potassium, chloride, and sulfate though these relationships were influenced by an outlier.
• Nitrate was negatively correlated with pH-
field, SC, TDS, hardness, calcium, magnesium, sodium, bicarbonate, chloride, sulfate, fluoride, and gross alpha though these relationships were influenced by an outlier.
TDS concentrations are best predicted among major ions by calcium concentrations (standard coefficient = 0.51), among cations by calcium concentrations (standard coefficient = 0.58) and among anions, by sulfate concentrations (standard coefficient = 0.60) (multiple regression analysis, p ≤ 0.01).
0 100 200 300 400 500 600 700 800 900TDS (mg/L)
0
100
200
300
400
500
600
700
Bica
rbon
ate
(mg/
L)
Diagram 3 – The graph illustrates a positive correlation between two constituents; as TDS concentrations increase, bicarbonate concentrations also increase. This relationship is described by the regression equation: y = 0.26x + 141 (r = 0.42). Elevated bicarbonate in groundwater is often associated with recently recharged water. Water infiltrating the sub-surface readily dissolves carbon dioxide gas (CO2) in soil zones, where the partial pressure of CO2 is much greater than that in the atmosphere. The CO2 combines with water to form carbonic acid. The resultant higher acidity of recharging water increases dissolution and weathering of minerals in the sub-surface, resulting in higher TDS concentrations. 14
33
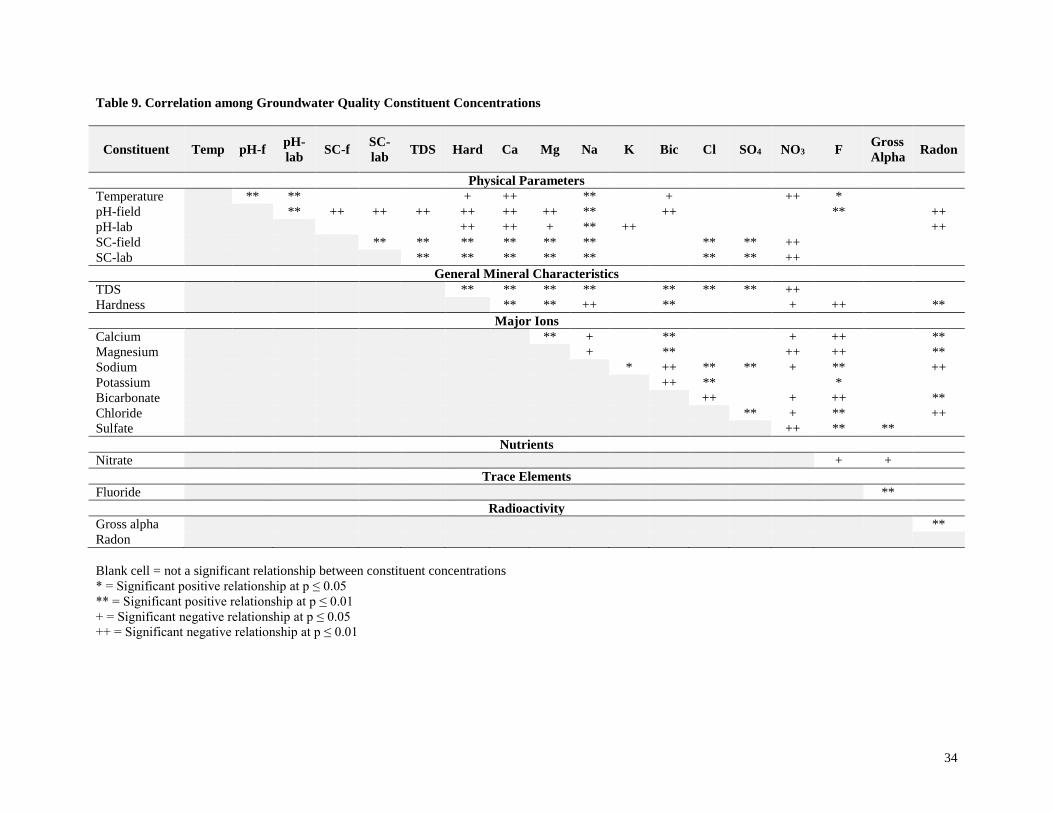
Table 9. Correlation among Groundwater Quality Constituent Concentrations
Constituent
Temp
pH-f pH-
lab SC-f SC-lab
TDS
Hard
Ca
Mg
Na
K
Bic
Cl
SO4
NO3 F Gross
Alpha Radon
Physical Parameters Temperature ** ** + ++ ** + ++ * pH-field ** ++ ++ ++ ++ ++ ++ ** ++ ** ++ pH-lab ++ ++ + ** ++ ++ SC-field ** ** ** ** ** ** ** ** ++ SC-lab ** ** ** ** ** ** ** ++
General Mineral Characteristics TDS ** ** ** ** ** ** ** ++ Hardness ** ** ++ ** + ++ **
Major Ions Calcium ** + ** + ++ ** Magnesium + ** ++ ++ ** Sodium * ++ ** ** + ** ++ Potassium ++ ** * Bicarbonate ++ + ++ ** Chloride ** + ** ++ Sulfate ++ ** **
Nutrients Nitrate + +
Trace Elements Fluoride **
Radioactivity Gross alpha ** Radon Blank cell = not a significant relationship between constituent concentrations * = Significant positive relationship at p ≤ 0.05 ** = Significant positive relationship at p ≤ 0.01 + = Significant negative relationship at p ≤ 0.05 ++ = Significant negative relationship at p ≤ 0.01
34

Groundwater Quality Variation Between Two Valley Groups – Twenty-one groundwater quality constituents were compared between two groups: samples collected from sites in Altar Valley (20 sites) and Avra Valley (22 sites). Significant concentration differences were found with 10 constituents: temperature (Diagram 4), SC-field, SC-lab, TDS (Diagram 5), sodium (Diagram 6),
potassium, chloride, sulfate, nitrate (Diagram 7), and fluoride (Map 10) (Kruskal-Wallis test, p ≤ 0.05). In all these instances, sites located in Avra Valley had significantly higher constituent concentrations than sites located in Altar Valley. Complete statistical results are contained in Table 10. For valley groups with significantly different concentrations, 95 percent confidence intervals are contained in Table 11.
Altar Avra
Valley10
20
30
40
Tem
pera
ture
(Cel
sius)
Altar AvraValley
100
200
300
400
500
600
700
800
TDS
(mg/
L)
Diagram 4 – Samples collected from sites in Avra Valley have significantly higher temperatures values than samples collected from sites in Altar Valley (Kruskal-Wallis, p ≤ 0.01). This phenomenon might be explained by the generally deeper groundwater levels in Avra Valley wells. Groundwater temperatures increase with depth, approximately 3 degrees Celsius with every 100 meters or 328 feet in depth. 34
Diagram 5 – Samples collected from sites in Avra Valley have significantly higher TDS concentrations than samples collected from sites in Altar Valley (Kruskal-Wallis, p ≤ 0.01). Possible explanations for this TDS difference include low rock solubility, a poor supply of carbon dioxide which increases acidity to aid in the weathering of sub-surface minerals, influence of CAP recharge, and the few significant impacts from human activities in the Altar Valley.25
35

Altar AvraValley
0
50
100
150So
dium
(mg/
L)
Altar AvraValley
0
5
10
15
Nitra
te a
s N
(mg/
L)
Diagram 6 – Samples collected from sites in Avra Valley have significantly higher sodium concentrations than samples collected from sites in Altar Valley (Kruskal-Wallis, p ≤ 0.01). Low concentrations of sodium typically occur in recharge areas and increase downgradient as the result of silicate weathering and halite dissolution along with ion exchange.25 Sodium concentrations in the Avra Valley could also be elevated by CAP recharge.
Diagram 7 – Samples collected from sites in Avra Valley have significantly higher nitrate concentrations than samples collected from sites in Altar Valley (Kruskal-Wallis, p ≤ 0.01). Development in Altar Valley is limited to isolated ranches and some residential use in its northern reaches. Avra Valley, in contrast, has much more urban development along with expanses of irrigated cropland near Marana. Nitrate loading to the groundwater from irrigation recharge and septic tank leaching probably accounts for the difference in nitrate concentrations between the two valleys.
36

37

Table 10. Variation in Groundwater Quality Constituent Concentrations between Two Valley Groups
Constituent Sites Sampled Significance Significant Differences Between Two Valley Groups
Temperature - field 42 ** Avra Valley > Altar Valley
pH – field 42 ns -
pH – lab 42 ns -
SC - field 42 ** Avra Valley > Altar Valley
SC - lab 42 ** Avra Valley > Altar Valley
TDS 42 ** Avra Valley > Altar Valley
Turbidity 42 ns -
Hardness 42 ns -
Calcium 42 ns -
Magnesium 42 ns -
Sodium 42 ** Avra Valley > Altar Valley
Potassium 42 * Avra Valley > Altar Valley
Bicarbonate 42 ns -
Chloride 42 ** Avra Valley > Altar Valley
Sulfate 42 ** Avra Valley > Altar Valley
Nitrate (as N) 42 ** Avra Valley > Altar Valley
Fluoride 42 * Avra Valley > Altar Valley
Zinc 42 ns -
Gross alpha 24 ns -
Gross beta 24 ns -
Radon 19 ns -
ns = not significant * = significant at p ≤ 0.05 or 95% confidence level ** = significant at p ≤ 0.01 or 99% confidence level
38
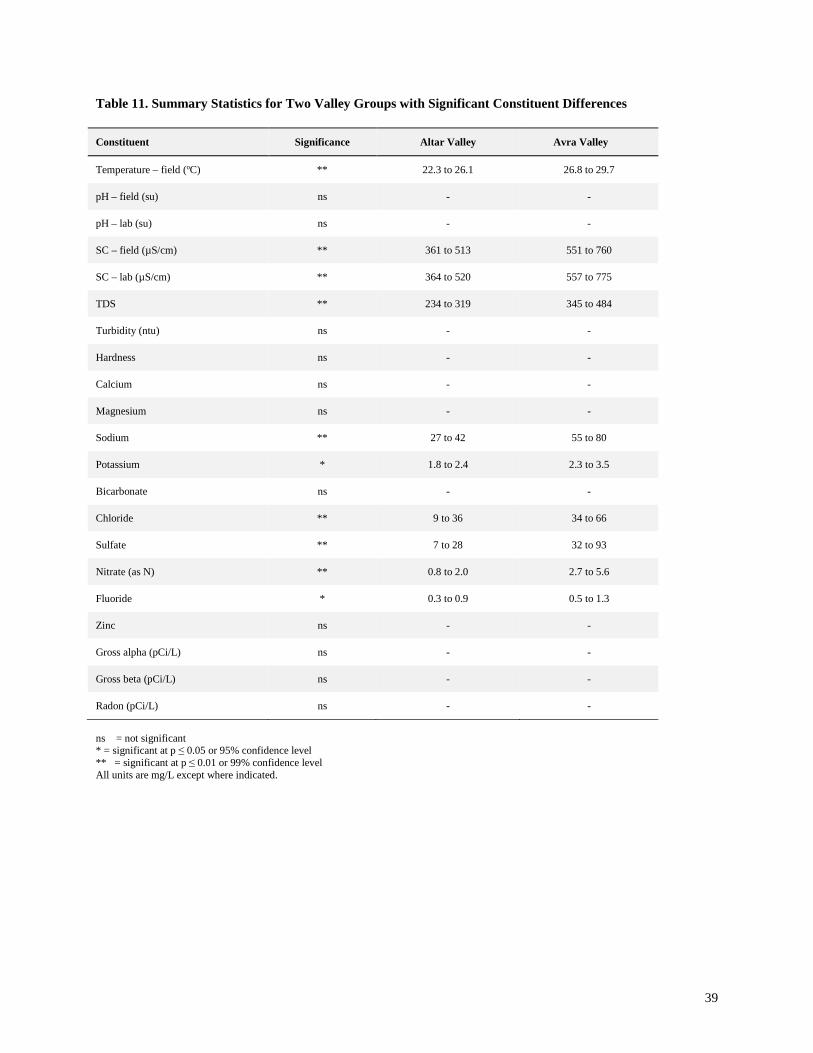
Table 11. Summary Statistics for Two Valley Groups with Significant Constituent Differences Constituent Significance Altar Valley Avra Valley
Temperature – field (oC) ** 22.3 to 26.1 26.8 to 29.7
pH – field (su) ns - -
pH – lab (su) ns - -
SC – field (µS/cm) ** 361 to 513 551 to 760
SC – lab (µS/cm) ** 364 to 520 557 to 775
TDS ** 234 to 319 345 to 484
Turbidity (ntu) ns - -
Hardness ns - -
Calcium ns - -
Magnesium ns - -
Sodium ** 27 to 42 55 to 80
Potassium * 1.8 to 2.4 2.3 to 3.5
Bicarbonate ns - -
Chloride ** 9 to 36 34 to 66
Sulfate ** 7 to 28 32 to 93
Nitrate (as N) ** 0.8 to 2.0 2.7 to 5.6
Fluoride * 0.3 to 0.9 0.5 to 1.3
Zinc ns - -
Gross alpha (pCi/L) ns - -
Gross beta (pCi/L) ns - -
Radon (pCi/L) ns - -
ns = not significant * = significant at p ≤ 0.05 or 95% confidence level ** = significant at p ≤ 0.01 or 99% confidence level All units are mg/L except where indicated.
39

Between Two Geologic Groups – Twenty-one (21) groundwater quality constituents were compared between two general geologic types: unconsolidated sediment (29 sites) and consolidated rock (13 sites.).22 Significant concentration differences were found with seven constituents: temperature, hardness (Diagram
8), turbidity, magnesium, bicarbonate (Diagram 9), nitrate, and radon (Kruskal-Wallis test, p ≤ 0.05). Complete statistical results are in Table 12 and 95 percent confidence intervals for significantly different groups based on recharge groups are in Table 13.
Consolidated UnconsolidatedGeology
0
100
200
300
400
500
Hard
ness
(mg/
L)
Consolidated UnconsolidatedGeology
100
200
300
400
Bica
rbon
ate
(mg/
L)
Diagram 8 – Samples collected from sites in consolidated rock have significantly higher hardness concentrations than sample sites collected from unconsolidated sediments (Kruskal-Wallis, p ≤ 0.05). Samples collected in consolidated rock were generally “hard” while those in unconsolidated sediments were generally “moderately hard.” This difference is likely due to calcium-dominated recharge occurring near mountains along with the natural softening that occurs along a groundwater flow path in downgradient areas. 25
Diagram 9 – Samples collected from sites in consolidated rock have significantly higher bicarbonate concentrations than sample sites collected from unconsolidated sediments (Kruskal-Wallis, p ≤ 0.01). Elevated bicarbonate in ground water is often associated with recently recharged water. Water infiltrating the sub-surface dissolves carbon dioxide gas (CO2) in soil, where the partial pressure of CO2 is much greater than that in the atmosphere. The CO2 combines with water to form carbonic acid. The acid then dissociates to hydrogen and bicarbonate ions. 14
40

Table 12. Variation in Groundwater Quality Constituent Concentrations between Two Geologic Groups
Constituent Sites Sampled Significance Significant Differences between Two Geologic Groups
Temperature - field 42 * Unconsolidated Sediment > Consolidated Rock
pH – field 42 ns -
pH – lab 42 ns -
SC - field 42 ns -
SC - lab 42 ns -
TDS 42 ns -
Turbidity 42 * Consolidated Rock > Unconsolidated Sediment
Hardness 42 * Consolidated Rock > Unconsolidated Sediment
Calcium 42 ns -
Magnesium 42 ** Consolidated Rock > Unconsolidated Sediment
Sodium 42 ns -
Potassium 42 ns -
Bicarbonate 42 * Consolidated Rock > Unconsolidated Sediment
Chloride 42 ns -
Sulfate 42 ns -
Nitrate (as N) 42 ** Unconsolidated Sediment > Consolidated Rock
Fluoride 42 ns -
Zinc 42 ns -
Gross alpha 24 ns -
Gross beta 24 ns -
Radon 19 * Consolidated Rock > Unconsolidated Sediment
ns = not significant * = significant at p ≤ 0.05 or 95% confidence level ** = significant at p ≤ 0.01 or 99% confidence level
41

Table 13. Summary Statistics for Two Geologic Groups with Significant Constituent Differences Constituent Significance Consolidated Rock Unconsolidated Sediment
Temperature – field (oC) * 21.5 to 26.9 25.9 to 28.7
pH – field (su) ns - -
pH – lab (su) ns - -
SC – field (µS/cm) ns - -
SC – lab (µS/cm) ns - -
TDS ns - -
Turbidity (ntu) * -3.9 to 26.1 0 to 2.6
Hardness * 166 to 263 129 to 202
Calcium ns - -
Magnesium ** 12 to 21 8 to 14
Sodium ns - -
Potassium ns - -
Bicarbonate * 225 to 325 185 to 237
Chloride ns - -
Sulfate ns - -
Nitrate (as N) ** 0.3 to 2.7 2.3 to 4.6
Fluoride ns - -
Zinc ns - -
Gross alpha (pCi/L) ns - -
Gross beta (pCi/L) ns - -
Radon (pCi/L) * - -
ns = not significant * = significant at p ≤ 0.05 or 95% confidence level ** = significant at p ≤ 0.01 or 99% confidence level All units are mg/L except where indicated.
42

Among Four Valley/Geologic Groups – Twenty-one groundwater quality constituents were compared between four valley-geologic groups: Altar Valley unconsolidated sediment (eight sites), Altar Valley consolidated rock (nine sites), Avra Valley unconsolidated sediment (21 sites), and Avra Valley consolidated rock (four sites).22 Significant concentration differences were found with 10 constituents: temperature, SC-field, SC-lab, TDS, turbidity (Diagram 10), sodium, chloride, sulfate, nitrate (Diagram 11), and radon (Kruskal-Wallis with Tukey test, p ≤ 0.05). Complete statistical results are in Table 14 and 95 percent confidence intervals for significantly different groups based on valley/geology groups are in Table 15.
Between Geologic Fault Groups – Twenty-one groundwater quality constituents were compared between wells located less than 2 kilometers from major fault lines (13 sites) and other wells (26 sites).22 A U.S. Geologic Survey report had found significantly higher concentrations on some constituents in close proximity to faults.13 No significant concentration differences were found among the 21 constituents except for radon which had significantly higher concentrations at the four sites located near major fault lines compared with the other 15 sites (Kruskal-Wallis test, p ≤ 0.05).
Altar-C
on
Altar-U
N
Avra - C
on
Avra-U
N
Valley / Geology
0
10
20
30
40
50
60
70
80
90
100
Turb
idity
(ntu
)
Altar-C
on
Altar-U
N
Avra - C
on
Avra-U
N
Valley / Geology
0
5
10
15
Nitra
te a
s N
(mg/
L)
Diagram 10 – Samples collected from sites in consolidated rock in Altar Valley have significantly higher turbidity values than sample sites collected from unconsolidated sediments in Avra Valley (Kruskal-Wallis, p ≤ 0.05). Turbidity in ground water generally is less than 5 ntu and is more reflective of well production. Although turbidity is not a direct indicator of health risk, it is aesthetically unappealing, and can provide food and shelter for pathogens. 29
Diagram 11 – Samples collected from sites in unconsolidated sediment in Avra Valley have significantly higher nitrate concentrations than samples collected from sites in consolidated rock in Altar Valley (Kruskal-Wallis, p ≤ 0.05). There are no significant differences with nitrate concentrations in consolidated rock in Avra Valley or unconsolidated sediments in Altar Valley. The elevated nitrate concentrations in the Avra Valley basin fill are likely linked to irrigation recharge, treated sewage effluent released into the Santa Cruz River, and improperly operating and/or high densities of septic systems. 14
43

Table 14. Variation in Groundwater Quality Constituent Concentrations among Four Valley/Geologic Groups
Constituent Sites Sampled Significance Significant Differences between Four Valley/Geologic Groups
Temperature - field 42 * Avra Valley Unconsolidated > Altar Valley Consolidated Rock *
pH – field 42 ns -
pH – lab 42 ns -
SC - field 42 * Avra Valley Unconsolidated > Altar Valley Consolidated Rock ** Avra Valley Unconsolidated > Altar Valley Unconsolidated Rock *
SC - lab 42 * Avra Valley Unconsolidated > Altar Valley Consolidated Rock * Avra Valley Unconsolidated > Altar Valley Unconsolidated Rock *
TDS 42 * Avra Valley Unconsolidated > Altar Valley Consolidated Rock * Avra Valley Unconsolidated > Altar Valley Unconsolidated Rock *
Turbidity 42 ** Altar Valley Consolidated Rock > Avra Valley Unconsolidated Sediment *
Hardness 42 ns -
Calcium 42 ns -
Magnesium 42 ns -
Sodium 42 ** Avra Valley Unconsolidated > Altar Valley Unconsolidated Rock *
Potassium 42 ns -
Bicarbonate 42 ns -
Chloride 42 * -
Sulfate 42 ** -
Nitrate (as N) 42 ** Avra Valley Unconsolidated > Altar Valley Consolidated Rock *
Fluoride 42 ns -
Zinc 42 ns -
Gross alpha 24 ns -
Gross beta 24 ns -
Radon 19 * Altar Valley Consolidated Rock > Avra Valley Unconsolidated Sediment ** Altar Valley Consolidated Rock > Altar Valley Unconsolidated Sediment **
ns = not significant * = significant at p ≤ 0.05 or 95% confidence level ** = significant at p ≤ 0.01 or 99% confidence level
44

Table 15. Summary Statistics for Four Valley/Geologic Groups with Significant Constituent Differences
Constituent Significance Altar Valley Consolidated
Rock
Altar Valley Unconsolidated
Sediment
Avra Valley Consolidated
Rock
Avra Valley Unconsolidated
Sediment
Temperature – field (oC) * 19.4 to 26.8 - - 26.6 to 29.6
pH – field (su) ns - - - -
pH – lab (su) ns - - - -
SC – field (µS/cm) * 341 to 667 335 to 392 - 489 to 713
SC – lab (µS/cm) * 345 to 683 349 to 393 - 493 to 732
TDS * 218 to 397 214 to 264 - 310 to 462
Turbidity (ntu) ** -6.4 to 38.1 - - 0 to 1.3
Hardness ns - - - -
Calcium ns - - - -
Magnesium ns - - - -
Sodium ** - 25 to 41 - 50 to 75
Potassium ns - - - -
Bicarbonate ns - - - -
Chloride * - - - -
Sulfate ** - - - -
Nitrate (as N) ** 0.3 to 1.3 - - 2.6 to 5.5
Fluoride ns - - - -
Zinc ns - - - -
Gross alpha (pCi/L) ns - - - -
Gross beta (pCi/L) ns - - - -
Radon (pCi/L) * -462,586 to 550124 - - 177 to 1287
ns = not significant * = significant at p ≤ 0.05 or 95% confidence level ** = significant at p ≤ 0.01 or 99% confidence level All units are mg/L except where indicated.
45

DISCUSSION
ADEQ sampled 42 wells to characterize water quality in the Avra Valley sub-basin of the Tucson AMA. Constituents above health-based, water quality standards in the ADEQ study include arsenic (two sites), gross alpha (five sites), uranium (two sites), and one site each for nitrate and radium-226+228. Arsenic, gross alpha, and nitrate are three of the four constituents that most commonly exceed health-based water quality standards in Arizona. 28 Based on results from the ADEQ study, groundwater in the Avra Valley sub-basin is generally suitable for drinking water uses. This is a conclusion also reached by previous groundwater quality studies.22 The ADEQ study, however, sampled for constituents that had not previously been collected during baseline studies, allowing for the identification of new water quality issues in the sub-basin. Particularly noteworthy is that the most common health-based exceedance was for radionuclides, despite these samples being collected at only 24 of 42 sample sites. Besides Primary MCL exceedances for gross alpha, uranium, and radium-226+228, the ADEQ study also collected the highest radon concentration, 83,620 pCi/L ever recorded by the agency’s ambient groundwater monitoring program. Radionuclides - The wells which had radionuclide concentrations exceeding water quality standards were located in both Avra and Altar valleys. Two of the exceedances were located in granitic geology, which is often associated with elevated radionuclide concentrations in groundwater.20 The other wells having radionuclide exceedances were located in a variety of geologic substrates. The only commonality is that all the wells were located on the east side of their respective valleys (Map 11). In other ambient groundwater studies in Arizona, wells with radionuclide exceedances were sometimes located in proximity to active or inactive mines. Mines are often correlated with elevated radionuclide concentrations because of increased rock surface exposure. 20 None of the five wells in the Avra Valley sub-basin were located near mines. Future groundwater quality studies in the sub-basin should better characterize gross alpha concentrations by collecting additional radionuclide samples since this was the most common Primary MCL exceedance. Arsenic - Arsenic was exceeded in two wells, one located by Marana (AVB-6) and the other in the Sierrita Mountains in Altar Valley (AVB-39). Both
wells also exceeded standards for gross alpha. The AVB-6 sample was collected from a 265-feet-deep windmill that also exceeded aesthetics-based standards for fluoride. These two constituents are frequently significantly correlated in other Arizona groundwater basins.28 The AVB-6 sample also had the highest pH-field value of 8.19 su, and the softest water (40 mg/L) recorded in the study. High arsenic and fluoride concentrations are often significantly correlated to high pH values and low hardness concentrations. 27 Arsenic concentrations are effected by reactions with hydroxyl ions. Elevated arsenic concentrations are also influenced by factors such as aquifer residence time, an oxidizing environment, and lithology. 25 Fluoride - The Avra Valley sub-basin is unusual in that unlike other groundwater basins in southeast Arizona, fluoride concentrations are generally low. Although five wells exceeded aesthetics-based standards, the highest concentration was only 2.8 mg/L, well below the 4.0 mg/L health-based standard. The highest fluoride concentrations in the ADEQ study were found northeast of Interstate 10. This area, as well as northwest of Three Points, was previously noted as having the sub-basin’s highest fluoride concentrations.14 Elevated fluoride concentrations appear to be rare in the sub-basin. In a previous study of 120 wells, fluoride concentrations ranged from 0.2 to 8.7 mg/L, with only five samples exceeding 1.6 mg/L. 22 Fluoride concentrations in groundwater are often controlled by calcium through precipitation or dissolution of the mineral, fluorite.25The five sites with elevated fluoride concentrations in the ADEQ study however, are not depleted in calcium and appear to be controlled by hydroxyl ion exchange or sorption-desorption reactions. These often provide controls on lower (< 5 mg/L) levels of fluoride. As pH values increase downgradient, greater levels of hydroxyl ions may affect an exchange of hydroxyl for fluoride ions thereby increasing fluoride in solution. 25 Nitrate - Nitrate exceeded health-based, water quality standards in just one sample and only 17 percent of wells exceeded 5 mg/L or one-half the 10 mg/L health-based, water quality standard. Despite the generally low nitrate concentrations, there are two areas of concern with the sub-basin. The five wells sampled in the Marana area all had elevated concentrations of nitrate, including sample
46

47

AVB-9 at 12.5 mg/L. The recharge of salt and nitrate-laden irrigation water through the unsaturated vadose zone likely contributes to groundwater nitrate concentrations. Irrigation water that directly recharges groundwater through vertical leakage along well casings is also a potential pathway for nitrate contamination.14 Treated sewage effluent released into the Santa Cruz River by wastewater treatment plants since 1969 may also contribute to elevated concentrations of nitrate in ground water near Marana. 14 Prior to this, sewage effluent was used near Marana for irrigation. 36 Since irrigated agriculture in the Avra Valley sub-basin is largely confined to the Marana area, other wells sampled as part of the ADEQ study with slightly elevated nitrate concentrations likely have different sources. Nitrate can impact groundwater from leaking residential septic systems, especially where there is a high density of houses. 14 This source might explain the slightly elevated nitrate concentration (6.6 mg/L) in the sample collected from a well located in the community of Three Points. More research, however, is needed to better
understand the relative contributions of nitrate from both anthropomorphic and natural sources. 21, 35 TDS – TDS concentrations in the sub-basin were also generally low with only 17 percent of wells exceeding the Secondary MCL of 500 mg/L. The highest concentrations were two wells at 720 mg/L. In a previous study consisting of 120 well samples, only 21 exceeded 500 mg/L., with 1,200 mg/L the highest concentration. 22 Many of the Secondary MCL exceedances occurred near Marana and are likely the result of salt-laden irrigation recharge. Evaporate deposits in this area may also impact TDS concentrations.36 TDS also generally increases from south to north in the sub-basin, corresponding to the direction of groundwater flow. Increases in TDS along flow paths are often observed in ground water. 25
48

REFERENCES
1 Andrews, D.A., Ground water in Avra-Altar Valley, Arizona, 1937: U.S. Geological Supply Paper 796-E, 18 p.
2 Arizona Department of Environmental Quality, 1991,
Quality Assurance Project Plan: Arizona Department of Environmental Quality Standards Unit, 209 p.
3 Arizona Department of Environmental Quality, 2011-
2012, Arizona Laws Relating to Environmental Quality: St. Paul, Minnesota, West Group Publishing, §49-221-224, p 134-137.
4 Arizona State Land Department, 1997, “Land Ownership
- Arizona” GIS coverage: Arizona Land Resource Information Systems, downloaded, 4/7/07.
5 Arizona Department of Water Resources, 1994, Arizona Water Resources Assessment – Volume II, Hydrologic Summary, Hydrology Division, pp. 174-187.
6 Arizona Department of Water Resources Water Atlas
website, 2014, http://www.azwater.gov/azdwr/StatewidePlanning/WaterAtlas/ActiveManagementAreas/PlanningAreaOverview/Groundwater-TucsonAMA.htm, accessed 6/26/14.
7 Arizona Department of Water Resources Water
Atlas website, 2014, http://www.azwater.gov/AzDWR/GeneralServices/Imaging/ accessed 6/26/14.
8 Arizona Water Resources Research Center, 1995, Field
Manual for Water-Quality Sampling: Tucson, University of Arizona College of Agriculture, 51 p.
9 Bloomquest, William, Schlager, Edella, and Heikkila,
Tanya, 2004, Common Waters, Diverging Streams: Linking Institutions and Water Management in Arizona, California, and Colorado: Washington D.C, Resources for the Future, 210 p.
10 Brown, S.L., Yu, W.K., and Munson, B.E., 1996, The
impact of agricultural runoff on the pesticide contamination of a river system - A case study on the middle Gila River: Arizona Department of Environmental Quality Open File Report 96-1: Phoenix, Arizona, 50 p.
11 Central Arizona Project website, http://www.cap-
az.com/index.php/departments/recharge-program, accessed 7/3/14.
12 City of Tucson website, http://www.tucsonaz.gov/water/recharged_water, accessed 7/3/14.
13 Coes, A.L., Gellenbeck, D.J., Towne, D.C., and Freark, M.C., 1998, Ground-Water quality in the Upper Santa Cruz basin, Arizona, 1998: U.S. Geological Survey Water Resources Investigations Report 00-4117, 55 p.
14 Conner, L.L., 1986, Geochemistry of ground water in
Avra Valley, Pima County, Arizona: Master’s thesis, University of Arizona, 81 p.
15 Crockett, J.K., 1995. Idaho statewide groundwater
quality monitoring program–Summary of results, 1991 through 1993: Idaho Department of Water Resources, Water Information Bulletin No. 50, Part 2, p. 60.
16 Graf, Charles, 1990, An overview of groundwater
contamination in Arizona: Problems and principals: Arizona Department of Environmental Quality seminar, 21 p.
17 Heath, R.C., 1989, Basic ground-water hydrology: U.S.
Geological Survey Water-Supply Paper 2220, 84 p. 18 Helsel, D.R. and Hirsch, R.M., 1992, Statistical methods
in water resources: New York, Elsevier, 529 p. 19 Hem, J.D., 1985, Study and interpretation of the
chemical characteristics of natural water [Third edition]: U.S. Geological Survey Water-Supply Paper 2254, 264 p.
20 Lowry, J.D. and Lowry, S.B., 1988, “Radionuclides in
Drinking Waters,” in American Water Works Association Journal, 80 (July), pp. 50-64.
21 Madison, R.J., and Brunett, J.O., 1984, Overview of the
occurrence of nitrate in ground water of the United States, in National Water Summary 1984-Water Quality Issues: U.S. Geological Survey Water Supply Paper 2275, pp. 93-105.
22 Reeter, R.W. and Cady, C.V., 1982, Maps showing
ground-water conditions in the Avra/Altar Valley area, Pima and Santa Cruz counties, Arizona—1981; Arizona Department of Water Resources Hydrologic Map Series Report Number 7, 2 sheets, scale, 1:250,000.
23 Richard, S.M., Reynolds, S.J., Spencer, J.E. and Pearthree, Pa, P.A., 2000, Geologic map of Arizona:
Arizona Geological Survey Map 35, scale 1:1,000,000.
24 Roberts, Isaac, 2008, Personal communication from
ADHS staff.
25 Robertson, F.N., 1991, Geochemistry of ground water in alluvial basins of Arizona and adjacent parts of Nevada, New Mexico, and California: U.S. Geological Survey Professional Paper 1406-C, 90 p.
26 Test America, 2013, Personal communication from Test
America staff.
49

27 Towne, Douglas and Freark, Maureen, 2000, Ambient groundwater quality of the Prescott Active Management Area: A 1997-1998 baseline study: Arizona Department of Environmental Quality Open File Report 00-01, 77 p.
28 Towne, Douglas and Jones, Jason, 2011, Groundwater
quality in Arizona: a 15 year overview of the ADEQ ambient groundwater monitoring program (1995-2009): Arizona Department of Environmental Quality Open File Report 11-04, 44 p.
29 U.S. Environmental Protection Agency website, www.epa.gov/waterscience/criteria/humanhealth/,
accessed 3/05/10. 30 U.S. Environmental Protection Agency website,
http://water.epa.gov/lawsregs/rulesregs/sdwa/radon/regulations.cfm, accessed 6/18/14.
31 U.S. Salinity Laboratory, 1954, Diagnosis and improvement of saline and alkali soils: U.S. Department of Agriculture, Agricultural Research Service, Agriculture Handbook No. 60, 160 p.
32 White, N.D., Matlock, W.G., and Schwalen, H.C., An
appraisal of the ground-water resources of Avra and Altar valleys, 1966: Arizona State Land Department Water Resources Report #25, 64 p.
33 Wilkinson, L., and Hill, M.A., 1996. Using Systat 6.0 for Windows, Systat: Evanston, Illinois, p. 71-275. 34 Bitton, G. and Gerba, C.P., 1994, Groundwater
Pollution Microbiology: Malabar, FL: Krieger Publishing Company, 377 p.
35 Thiros, S.A., Bexfield, L.M., Anning, D.W., and
Huntington, J.M., eds., 2010, Conceptual understanding and groundwater quality of selected basin-fill aquifers in the Southwestern United States: U.S. Geological Professional Paper 1781, 288 p.
36 Gellenbeck, D.J. and Coes, Alissa L., 1999, Ground-
Water quality in alluvial basins that have minimal urban development, South-Central Arizona: U.S. Geological Survey Water Resources Investigations Report 99-4005, 27 p.
50

Appendix A. Data for Sample Sites, Avra Valley Sub-Basin, 1998-2001
Site # Cadastral / Pump Type
Latitude - Longitude ADWR # ADEQ # Site
Name Samples Collected
Well Depth
Water Depth
Valley / Geology
1st Field Trip, May 10-11, 2000 – Flora &Yu (VOC Travel Blank)
AVB-1/1D duplicate
D(7-10)33cc submersible
32°45’52.407” 111°19’32.751”
636121
58799
Walker North Well
Inorganic, VOC, Radon, Radionuclide
120’
70’
Avra
Unconsolidated
AVB-2
D(9-10)16dbb submersible
32°38’19”
111°19’08.6”
615625
33855
Walker South Well
Inorganic, Radon Radionuclide
303’
238’
Avra Unconsolidated
AVB-3
D(8-12)20cca submersible
33°43’01.890” 111°07’57.938”
804176
58798
Goff Well Inorganic
500’
228’
Avra
Consolidated
2nd Field Trip, May 25, 2000 – Flora & Yu
AVB-4
D(09-12)20acb
windmill
32°38’15.564” 111°07’36.430”
615644
33894
ASLD Windmill
Inorganic, VOC Radionuclide
265’
180’
Avra
Consolidated
AVB-5
D(8-11)09aaa submersible
32°45’15.769” 111°13’01.933”
623946
58761
Martin Well
Inorganic, VOC Radionuclide
1800’
427’
Avra
Unconsolidated
3rd Field Trip, June 20-21, 2000 – Flora & Yu (VOC Travel Blank)
AVB-6
D(10-11)15cbc
submersible
32°26’48.916” 111°15’13.694”
634826
58821
Bringhurst Well
Inorganic, VOC, Radon, Radionuclide
740’
580’
Avra Unconsolidated
AVB-7/54
D(11-09)27bda
submersible
32°26’48.473” 111°24’57.877”
634241
34495
Lucer Well
Inorganic, VOC Radon Radionuclide
150’
39’
Avra Unconsolidated
AVB-8
D(12-10)01dcc
turbine
32°20’06.715” 110°20’18.409”
618390
35039
Kai Farm Well #1 Inorganic, Radon
650’
290’
Avra Unconsolidated
AVB-9/9D duplicate
D(11-11)30 submersible
32°33’45.174” 111°12’29.497”
800462
58825
Heatley Well
Inorganic, Radon Radionuclide, VOCs
400’
230’
Avra Unconsolidated
4th Field Trip, July 18, 2000 – Flora & Yu
AVB-10
D(13-10)21aad
windmill
32°17’23.749” 111°19’15.624”
629192
58800
Earley Well Inorganic
700’
292’
Avra
Unconsolidated
5th Field Trip, August 9-10, 2000 – Flora & Yu (VOC Travel Blank)
AVB-11
D(14-11)26ddd
submersible
32°10’36.38”
111°11’12.417”
634956
37358
Robillard Well
Inorganic, VOCs Radionuclide
480’
356’
Avra Unconsolidated
AVB-12
D(15-10)33dbc
turbine
32°04’32.468” 111°19’37.947”
603527
38415
Buckelew FarmWell Inorganic, VOCs
617’
170’
Avra Unconsolidated
AVB-13
D(18-9)27bda submersible
31°50’09.202” 111°24’44.834”
616202
40887
ASLD Well Inorganic
-
287’
Altar Unconsolidated
AVB-14/14D
duplicate
D(16-9)28b submersible
32°00’28.402” 111°26’05.781”
633673
58823
Schach Well
Inorganic, Radon Radionuclide
400’
295’
Altar Unconsolidated
AVB-15
Radon dup
D(17-10)13bdd
submersible
31°57’09.205” 111°16’27.786”
-
58824
Greene Well
Inorganic, Radon, Radionuclide
300’
30’
Altar Consolidated
6th Field Trip, September 7, 2000 – Flora & Yu
AVB-16
D(15-12)21b submersible
32°06’58.905” 111°07’30.464”
-
58871
Camacho Well Inorganic
-
-
Avra
Unconsolidated
51

Appendix A. Data for Sample Sites, Avra Valley Sub-Basin, 1998-2001--Continued
Site # Cadastral / Pump Type
Latitude - Longitude ADWR # ADEQ # Site
Name Samples Collected
Well Depth
Water Depth
Sub-basin / Aquifer
7th Field Trip, February 26-28, 2001 – Boettcher & Lucci (Equipment Blank AVB-23 & VOC Travel Blank)
AVB-17
D(21-10)21aab
submersible
31°35’35.578” 111°19’12.256”
529932
59092
Reichelt Well
Inorganic, Radionuclide, VOCs
335’
171’
Altar
Consolidated
AVB-18/19 split
D(22-11)03bdb
windmill
31°32’42.400” 111°12’28.312”
517078
59093
Apache Windmill
Inorganic, Radionuclide, VOCs
150’
40’
Altar
Unconsolidated
AVB-20/21 duplicate
D(22-10)10ba
windmill 31°31’09.859” 111°18’20.970”
642691
59094 Yellow
Jacket Inorganic,
Radionuclide
120’
20’
Altar
Consolidated
AVB-22
D(22-9)11dda windmill
31°31’23.725” 111°22’54.976”
641652
59095 Up Mill
Well Inorganic,
Radionuclide, VOCs
50’
30’
Altar
Consolidated
8th Field Trip, April18-19, 2001 – Boettcher & Lucci (Equipment Blank AVB-25& VOC Travel Blank)
AVB-24
D(20-10)25da
windmill
31°39’27.501” 111°16’01.186”
804186
59196
Mailbox Well
Inorganic Radionuclide,
150’
10’
Altar
Consolidated
AVB-26/27 duplicate
D(19-8)22cdb
windmill
31°45’19.474” 111°31’01.573”
616240
59197
Lane Well
Inorganic, VOCs Radionuclide
-
16’
Altar Consolidated
AVB-28/29 split
D(14-10)12ba submersible
32°13’58” 111°16’53”
632949
59198
Bobwhite Well Inorganic, Radon
-
-
Avra Unconsolidated
9th Field Trip, June 9-10, 2001 – Harmon & Lucci (Equipment Blank AVB-35& VOC Travel Blank ) AVB-30/30a/31
duplicate partial duplicates
D(16-10)28bbc
submersible
32°00’50.464” 111°19’58.398”
616059
59232
Santa TeresaWell Inorganic, Radon
500’
-
Altar Unconsolidated
AVB-32/33 split
D(17-09)23aac
submersible
31°56’18.606” 111°23’14.808”
616135
59233
Williams Well Inorganic, Radon
500’
238’
Altar Unconsolidated
AVB-34
D(17-08)23dcb
submersible
31°55’31.974” 111°30’13.254”
616129
59234
Milagro Well
Inorganic, VOCs Radionuclide
776’
710’
Altar Unconsolidated
AVB-36
D(21-07)16add
submersible
31°36’05.412” 111°37’27.206”
616351
59235
Agua del OroWell
Inorganic Radionuclide
305’
133’
Altar Consolidated
AVB-37
D(20-08)07cbc
windmill
31°42’00.041” 111°34’20.286”
616288
59236
Upper Mormon
Inorganic, VOCs Radionuclide
301’
45’
Altar Consolidated
AVB-38
D(18-11)33ada
windmill
31°49’18.852” 111°13’00.526”
804631
59237
Champ-urradoWell
Inorganic, VOCs Radionuclide
-
-
Altar Unconsolidated
AVB-39
D(19-11)8 windmill
31°45’45.734” 111°16’48.708”
616244
59323
Ridge Well
Inorganic, VOCs Radionuclide
-
-
Altar Unconsolidated
10th Field Trip, May 22-23, 2001 - Harmon & Lucci (Equipment Blank AVB-45& VOC Travel Blank )
AVB-40/40a/41 partial duplicate
split
D(10-10)34caa
submersible
32°30’28.799” 111°18’25.588”
533158
56296
Evergreen Air Well
Inorganic, VOCs, Radon
-
-
Avra Unconsolidated
AVB-42/43
duplicate
D(13-11)18acc
submersible
32°17’59.715” 111°15’35.108”
532647
59242
Mattison Well Inorganic, Radon
505’
365’
Avra Unconsolidated
AVB-46
D(18-8)33acc submersible
31°49’15.777” 111°31’51.823”
639713
59245
Elkhorn Well
Inorganic, Radionuclide
200’
95’
Altar Consolidated
AVB-47
D(21-08)27 submersible
31°34’24.425” 111°30’18.917”
604205
59246
BA Well #8
Inorganic, VOCs, Radon
400’
316’
Altar Unconsolidated
AVB-48
D(19-9)15ada submersible
31°46’41.451” 111°24’14.278”
607355
41587
BA Well #2 Inorganic, Radon
570’
326’
Altar Unconsolidated
AVB-49
D(11-12)26bdc
submersible
32°26’47.328” 111°05’26.189”
526187
59247
Moseman Well
Inorganic, Radon Radionuclide
641’
350’
Avra Unconsolidated
52

Appendix A. Data for Sample Sites, Avra Valley Sub-Basin, 1998-2001--Continued
Site # Cadastral / Pump Type
Latitude - Longitude ADWR # ADEQ # Site
Name Samples Collected
Well Depth
Water Depth
Sub-basin / Aquifer
AVB-50
D(18-10)28ada
submersible
31°50’15.433” 111°19’02.364”
804711
59265
Cinco de Mayo Well
Inorganic, Radon Radionuclide
-
-
Altar /
Consolidated
11th Field Trip, May 30, 2001 - Harmon & Lucci (Equipment Blank AVB-45& VOC Travel Blank)
AVB-51/51a
partial duplicate
D(12-11)9bba submersible
32°24’09.971” 111°13’01.241”
531335
59243
Avra Vly Airpark Wl
Inorganic, Radon VOCs
450’
325’
Avra / Unconsolidated
AVB-52
D(11-10)25dda
submersible
32°26’18.556” 111°16’11.500”
615764
34543
Kai Farm Well #2 Inorganic, Radon
-
-
Avra / Unconsolidated
AVB-53
D(10-12)20cbc
submersible
32°32’42.524” 111°07’58.743”
515847
59244
Charnis Well
Inorganic, Radionuclides, VOCs
315’
35’
Avra / Consolidated
12th Field Trip, December 12, 1998 - Towne & Freark
AVB-55
D(11-9)27bbc submersible
32°26’55.292” 111°25’22.160”
636944
34494
Reeves Well Inorganic, VOCs
325’
40’
Avra /
Unconsolidated
AVB-56
D(11-9)27bbb submersible
32°26’56.565” 111°25’24.967”
636945
57594
Davis #3 Well Inorganic, VOCs
88’
80’
Avra /
Unconsolidated
53

Appendix B. Groundwater Quality Data, Avra Valley Sub-Basin, 1998-2001
Site # MCL Exceedances
Temp (oC)
pH-field (su)
pH-lab (su)
SC-field (µS/cm)
SC-lab (µS/cm)
TDS (mg/L)
Hard (mg/L)
Hard - cal (mg/L)
Turb (ntu)
AVB-1/1D -
30.1
7.88 7.65 856
810
445
100 98
0.72
AVB-2 F
28.0
8.00 7.3 485
440
270
73 71
0.35
AVB-3 TDS
28.9
7.35 7.3 890
800
510
340 320
1.1
AVB-4 TDS, F,
Gross α
29.3
7.93 8.2 836
870
500
180 170
0.50
AVB-5 -
31.1
7.73 7.8 468
480
270
150 130
0.53
AVB-6 F, As, Gross α
33.4
8.19 8.4 417
430
280
40 42
0.26
AVB-7/54 -
23.6
7.125 7.25 589
620
380
315 310 0.045
AVB-8 -
29.7
7.62 7.5 405
430
280
130 130
0.01
AVB-9 TDS, NO3
23.5
7.09 7.3 1024
1100
720
420 410
0.17
AVB-10 -
30.6
7.73 8.2 338
340
230
97 95
0.05
AVB-11 -
31.3
7.86 7.6 321
330
220
90 88
0.80
AVB-12 -
27.7
7.78 7.4 531
560
360
120 120
0.81
AVB-13 -
26.0
7.71 7.6 347
370
240
110 110
0.58
AVB-14/14D -
28.9
7.75 7.55 360
380
240
110 110
0.29
AVB-15 TDS, F, Mn,
Gross α, Ra,U
29.0
7.30 7.3 961
1000
560
350 330
0.76
AVB-16 TDS, SO4
32.7
7.52 7.7 1001
1100
720
300 290
0.35
AVB-17 -
22.6
7.85 7.8 382
400
250
160 160
ND
AVB-18/19 Gross α, U
16.6
7.95 7.75 307
330
180
150 140
18
AVB-20/21 Fe, Mn
17.7
7.16 7.0 529
560
335
245 230
91.5
AVB-22 -
17.9
7.09 7.0 256
270
180
91 89
8.4
AVB-24 -
20.3
7.92 8.2 580
580
340
200 190
7.8
AVB-26/27 -
20.3
7.12 7.7 302
305
190
120 120
3.1
AVB-28/29 -
30.6
7.69 7.84 435
455
260
110 110
7.05
AVB-30/30a/31 -
25.8
7.57 8.1 357
360
235
130 130
0.02
AVB-32/33 -
26.1
7.54 8.05 385
385
235
120 120
0.03
AVB-34 -
27.2
7.23 8.2 345
340
230
92 92
3.0
AVB-36 -
21.5
7.56 7.9 381
380
230
130 130
2.7
AVB-37 -
28.0
8.0 7.84 614
610
360
230 220
20
italics = constituent exceeded holding time bold = constituent concentration exceeded Primary or Secondary Maximum Contaminant Level
54

Appendix B. Groundwater Quality Data, Avra Valley Sub-Basin, 1998-2001--continued
Site # MCL Exceedances
Temp (oC)
pH-field (su)
pH-lab (su)
SC-field (µS/cm)
SC-lab (µS/cm)
TDS (mg/L)
Hard (mg/L)
Hard - cal (mg/L)
Turb (ntu)
AVB-38 - 23.6 7.13 8.2 409 410 270 140 140 0.98
AVB-39 As, Gross α 27.5 7.48 8.1 403 390 280 130 130 0.15
AVB-40/41 - 32.0 7.57 7.89 644 660 410 210 210 0.17
AVB-42/43 - 29.3 7.84 8.1 330 320 215 86.5 88 ND
AVB-46 - 24.3 7.10 8.1 621 600 410 260 260 0.03
AVB-47 - 25.7 7.96 8.3 338 330 220 82 84 ND
AVB-48 - 25.2 7.88 8.2 334 320 220 120 120 0.28
AVB-49 - 28.6 7.65 8.2 727 700 440 200 200 0.79
AVB-50 - 30.4 7.32 7.8 532 520 320 210 200 8.6
AVB-51 TDS 24.0 7.43 8.2 1010 1000 660 320 320 0.12
AVB-52 TDS 22.8 7.19 8.1 914 960 590 300 320 0.04
AVB-53 F 24.3 7.33 8.2 743 760 440 270 280 0.03
AVB-55 - 25.6 7.26 7.2 717 760 480 280 - 0.05
AVB-56 - 24.4 7.10 7.2 716 720 440 280 - 0.01
italics = constituent exceeded holding time bold = constituent concentration exceeded Primary or Secondary Maximum Contaminant Level
55

Appendix B. Groundwater Quality Data, Avra Valley Sub-Basin, 1998-2001--continued
Site # Calcium (mg/L)
Magnesium (mg/L)
Sodium (mg/L)
Potassium (mg/L)
T. Alk (mg/L)
Bicarbonate (mg/L)
Carbonate (mg/L)
Chloride (mg/L)
Sulfate (mg/L)
AVB-1/1D
29
6.2
120
4.2
110
130 ND
160
23
AVB-2
22
3.9
69
4.1
140
170 ND
31
29
AVB-3
92
21
49
5.9
300
370 ND
38
49
AVB-4
45
14
130
1.9
210
260 ND
93
100
AVB-5
39
8.6
48
2.9
140
170 ND
43
36
AVB-6
12
2.8
84
1.9
160
195 ND
21
25
AVB-7/54
83
25
17
2.1
285
345 ND
15
10.5
AVB-8
41
6.4
41
2.7
140
170 ND
25
16
AVB-9
130
21
82.5
3.6
282.5
345 ND
74
130
AVB-10
31
5.3
41
1.9
150
180 ND
13
18
AVB-11
29
4.0
41
3.1
150
180 ND
9.0
12
AVB-12
39
5.6
72
2.4
120
150 ND
53
52
AVB-13
35
6.1
39
2.6
160
200 ND
12
14
AVB-14/14D
33
6.5
37.5
2.5
130
160 ND
29.5
ND
AVB-15
83
31
79
3.2
230
280 ND
140
88
AVB-16
82
20
110
7.2
120
150 ND
95
290
AVB-17
44
13
20
2.2
180
220 ND
13
5.4
AVB-18/19
39
11
11.5
2.35
143
178 ND
8.8
14
AVB-20/21
84
9.8
24.5
1.3
250
300 ND
25
14
AVB-22
28
4.5
20
1.9
110
130 ND
11
7.9
AVB-24
40
21
57
0.64
310
380 ND
11
5.2
AVB-26/27
33.5
8.4
15.5
1.05
110
130 ND
5.45
35.5
AVB-28/29
33
5.95
49.5
2.3
110
130 ND
29.5
41.5
AVB-30/30a/31
35
11
25
2.45
165
205 ND
13
11
AVB-32/33
37.5
6.0
36
2.45
150
180 ND
13
15.5
AVB-34
25
7.2
38
1.8
140
170 ND
22
8.4
AVB-36
37
9.9
31
2.0
170
210 ND
21
3.9
AVB-37
57
20
47
2.6
290
350 ND
40
4.0
bold = constituent concentration exceeded Primary or Secondary Maximum Contaminant Level
56
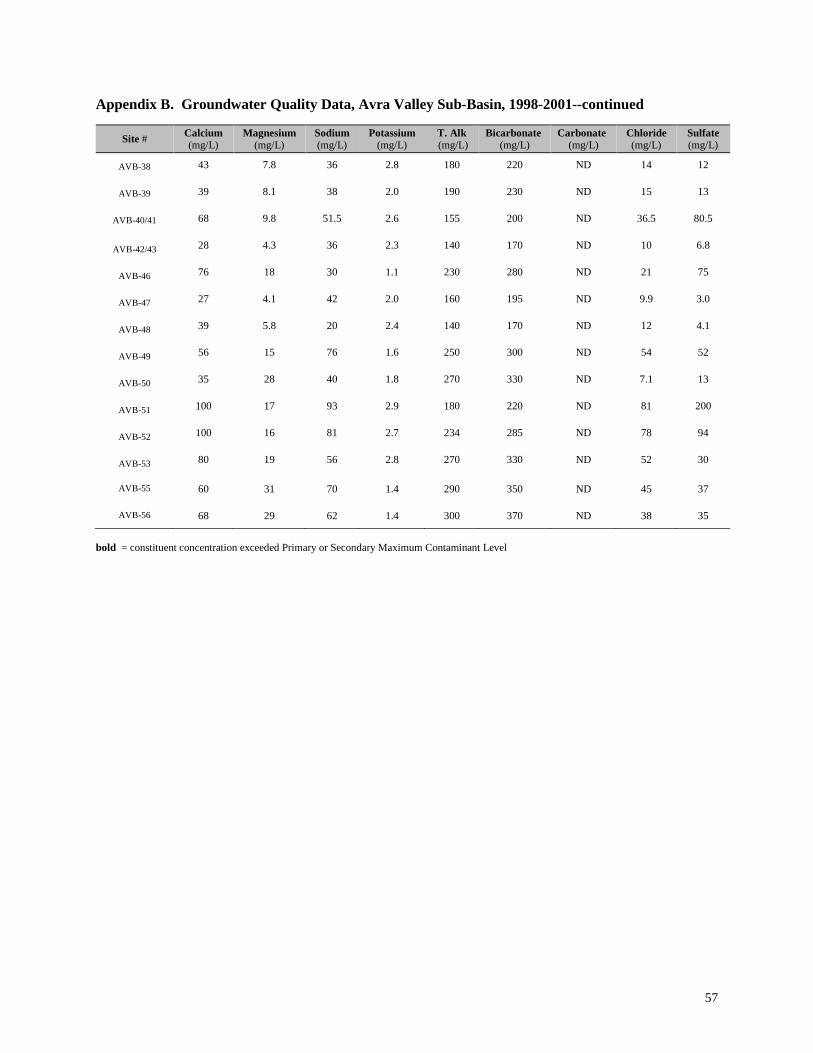
Appendix B. Groundwater Quality Data, Avra Valley Sub-Basin, 1998-2001--continued
Site # Calcium (mg/L)
Magnesium (mg/L)
Sodium (mg/L)
Potassium (mg/L)
T. Alk (mg/L)
Bicarbonate (mg/L)
Carbonate (mg/L)
Chloride (mg/L)
Sulfate (mg/L)
AVB-38 43 7.8 36 2.8 180 220 ND 14 12
AVB-39 39 8.1 38 2.0 190 230 ND 15 13
AVB-40/41 68 9.8 51.5 2.6 155 200 ND 36.5 80.5
AVB-42/43 28 4.3 36 2.3 140 170 ND 10 6.8
AVB-46 76 18 30 1.1 230 280 ND 21 75
AVB-47 27 4.1 42 2.0 160 195 ND 9.9 3.0
AVB-48 39 5.8 20 2.4 140 170 ND 12 4.1
AVB-49 56 15 76 1.6 250 300 ND 54 52
AVB-50 35 28 40 1.8 270 330 ND 7.1 13
AVB-51 100 17 93 2.9 180 220 ND 81 200
AVB-52 100 16 81 2.7 234 285 ND 78 94
AVB-53 80 19 56 2.8 270 330 ND 52 30
AVB-55
60
31
70
1.4
290
350
ND
45
37
AVB-56
68
29
62
1.4
300
370
ND
38
35
bold = constituent concentration exceeded Primary or Secondary Maximum Contaminant Level
57

Appendix B. Groundwater Quality Data, Avra Valley Sub-Basin, 1998-2001--continued
Site # T. Nitrate-N
(mg/L) Nitrite-N
(mg/L) TKN
(mg/L) Ammonia
(mg/L) T. Phosphorus
(mg/L) SAR
(value) Irrigation Quality
Aluminum (mg/L)
AVB-1/1D
2.7
ND
0.0625
ND
0.028/nd 5.3 C3-S1
ND
AVB-2
1.4
ND
ND
ND
ND 3.6 C2-S1
ND
AVB-3
7.1
ND
0.11
ND
0.043 1.2 C3-S1
ND
AVB-4
0.81
-
-
-
- 4.3 C3-S1
-
AVB-5
3.8
-
-
-
- 1.8 C2-S1
-
AVB-6
1.8
-
-
-
- 5.7 C2-S1
-
AVB-7/54
7.05
-
-
-
- 0.4 C2-S1
-
AVB-8
6.8
-
-
-
- 1.6 C2-S1
-
AVB-9
12.5
-
-
-
- 1.8 C3-S1
-
AVB-10
1.1
-
-
-
- 1.8 C2-S1
-
AVB-11
1.6
-
0.072
ND
ND 1.9 C2-S1
-
AVB-12
6.6
-
0.22
ND
ND 2.9 C2-S1
-
AVB-13
1.3
-
0.096
ND
ND 1.6 C2-S1
-
AVB-14/14D
4.25
-
.087
ND
ND 1.5 C2-S1
-
AVB-15
ND
-
0.20
0.031
ND 1.9 C2-S1
-
AVB-16
0.67
-
-
-
- 2.8 C3-S1
-
AVB-17
1.5
ND
ND
ND
0.37 0.7 C2-S1
ND
AVB-18/19
0.082
ND
ND
ND
ND 0.4 C2-S1
ND
AVB-20/21
1.7
ND
0.070
ND
0.065 0.7 C2-S1
ND
AVB-22
0.90
ND
0.29
ND
0.034 0.9 C2-S1
ND
AVB-24
0.11
ND
ND
ND
ND 1.8 C2-S1
ND
AVB-26/27
0.10
ND
0.16
ND
ND 0.6 C2-S1
ND
AVB-28/29
1.25
ND
ND
ND
ND 1.9 C2-S1
ND
AVB-30/30a/31
1.7
ND
ND
ND
ND 0.9 C2-S1
ND
AVB-32/33
4.05
ND
ND
ND
ND 1.4 C2-S1
ND
AVB-34
2.1
ND
0.57
ND
ND 1.7 C2-S1
ND
AVB-36
0.49
ND
ND
ND
ND 1.2 C2-S1
ND
AVB-37
1.3
ND
0.073
ND
ND 1.4 C2-S1
ND
bold = constituent concentration exceeded Primary or Secondary Maximum Contaminant Level
58

Appendix B. Groundwater Quality Data, Avra Valley Sub-Basin, 1998-2001--continued
Site # T. Nitrate-N
(mg/L) Nitrite-N
(mg/L) TKN
(mg/L) Ammonia
(mg/L) T. Phosphorus
(mg/L) SAR
(value) Irrigation Quality
Aluminum (mg/L)
AVB-38
2.2
ND
ND
ND
0.041 1.3 C2-S1
ND
AVB-39
0.24
ND
0.098
ND
0.025 1.4 C2-S1
ND
AVB-40/41
7.4
ND
ND
ND
ND 1.4 C2-S1
ND
AVB-42/43 1.8
ND
0.056
ND
ND 1.7 C2-S1 ND
AVB-46 0.63
ND
ND
ND
0.028 0.8 C2-S1 ND
AVB-47 1.4
ND
ND
ND
ND 2.0 C2-S1
ND
AVB-48 3.1
ND
ND
ND
ND 0.8 C2-S1
ND
AVB-49 1.1
ND
ND
ND
ND 2.3 C2-S1
ND
AVB-50 1.0
ND
ND
ND
ND 1.2 C2-S1
ND
AVB-51 4.8
ND
ND
-
- 2.3 C3-S1
ND
AVB-52 9.8
ND
ND
-
- 2.0 C3-S1
ND
AVB-53 4.2
ND
ND
-
- 1.5 C2-S1
ND
AVB-55
4.2
ND
0.14
ND
ND 1.8 C3-S1
ND
AVB-56
3.5
ND
0.072
ND
ND 1.6 C2-S1
ND
bold = constituent concentration exceeded Primary or Secondary Maximum Contaminant Level
59

Appendix B. Groundwater Quality Data, Avra Valley Sub-Basin, 1998-2001--continued
Site # Antimony
(mg/L) Arsenic (mg/L)
Barium (mg/L)
Beryllium (mg/L)
Boron (mg/L)
Cadmium (mg/L)
Chromium (mg/L)
Copper (mg/L)
Fluoride (mg/L)
AVB -1/1D
ND
ND
0.185
ND
0.19
ND
ND
ND
0.51
AVB-2
ND
ND
0.12
ND
0.17
ND
ND
ND
2.1
AVB-3
ND
ND
ND
ND
ND
ND
ND
ND
0.45
AVB-4*
ND
ND
ND
ND
0.34
ND
ND
ND
2.77
AVB-5*
ND
ND
0.2
ND
0.14
ND
ND
ND
0.54
AVB-6*
ND
0.016
ND
ND
0.15
ND
0.014
ND
2.2
AVB-7*/54
ND
ND
0.19
ND
0.11.5
ND
ND
ND
0.24
AVB-8*
ND
ND
ND
ND
ND
ND
ND
ND
0.46
AVB-9*
ND
ND
0.10
ND
0.165
ND
ND
ND
0.335
AVB-10*
ND
ND
ND
ND
ND
ND
ND
ND
0.56
AVB-11*
ND
ND
0.14
ND
ND
ND
ND
ND
0.35
AVB-12*
ND
ND
ND
ND
0.12
ND
ND
ND
1.3
AVB-13*
ND
ND
ND
ND
ND
ND
ND
ND
1.1
AVB-14/14D*
ND
ND
ND
ND
ND
ND
ND
ND
0.55
AVB-15*
ND
ND
ND
ND
0.16
ND
ND
ND
2.8
AVB-16*
ND
ND
ND
ND
0.21
ND
ND
ND
0.64
AVB-17
ND
ND
0.42
ND
ND
ND
ND
ND
0.26
AVB-18/19
ND
ND
0.16
ND
ND
ND
ND
ND
0.16
AVB-20/21
ND
ND
0.10
ND
ND
ND
ND
ND
0.125
AVB-22
ND
ND
0.20
ND
ND
ND
ND
ND
0.22
AVB-24
ND
ND
0.35
ND
0.18
ND
ND
ND
0.37
AVB-26/27
ND
ND
ND
ND
ND
ND
ND
ND
0.505
AVB-28/29
ND
ND
ND
ND
ND
ND
ND
ND
0.62
AVB-30/30a/31
ND
ND
ND
ND
ND
ND
ND
ND
0.395
AVB-32/33
ND
ND
ND
ND
ND
ND
ND
ND
0.43
AVB-34
ND
ND
ND
ND
ND
ND
ND
ND
1.0
AVB-36
ND
ND
ND
ND
ND
ND
ND
ND
1.1
AVB-37
ND
ND
ND
ND
0.11
ND
ND
0.073
0.53
* = result for Total Recoverable Metals rather than Dissolved Metals bold = constituent concentration exceeded Primary or Secondary Maximum Contaminant Level
60

Appendix B. Groundwater Quality Data, Avra Valley Sub-Basin, 1998-2001--continued
Site # Antimony
(mg/L) Arsenic (mg/L)
Barium (mg/L)
Beryllium (mg/L)
Boron (mg/L)
Cadmium (mg/L)
Chromium (mg/L)
Copper (mg/L)
Fluoride (mg/L)
AVB-38
ND
ND
0.13
ND
ND
ND
ND
ND
0.31
AVB-39
ND
0.038
ND
ND
ND
ND
ND
ND
0.30
AVB-40/41
ND
ND
ND
ND
ND
ND
ND
ND/.011
0.365
AVB-42/43
ND
ND
ND
ND
ND
ND
ND
ND
0.38
AVB-46
ND
ND
ND
ND
ND
ND
ND
ND
0.39
AVB-47
ND
ND
ND
ND
ND
ND
ND
ND
0.50
AVB-48
ND
ND
0.11
ND
ND
ND
ND
ND
0.23
AVB-49
ND
ND
ND
ND
ND
ND
ND
ND
0.42
AVB-50
ND
ND
0.25
ND
0.16
ND
ND
ND
0.31
AVB-51
ND
ND
ND
ND
0.105
ND
ND
ND
0.49
AVB-52
ND
ND
ND
ND
0.13
ND
ND
ND
0.34
AVB-53
ND
ND
ND
ND
0.11
ND
ND
ND
2.8
AVB-55
ND
ND
ND
ND
0.20
ND
ND
ND
1.0
AVB-56
ND
ND
ND
ND
0.16
ND
ND
ND
0.87
bold = constituent concentration exceeded Primary or Secondary Maximum Contaminant Level
61

Appendix B. Groundwater Quality Data, Avra Valley Sub-Basin, 1998-2001--continued
Site # Iron
(mg/L) Lead
(mg/L) Manganese
(mg/L) Mercury (mg/L)
Nickel (mg/L)
Selenium (mg/L)
Silver (mg/L)
Thallium (mg/L)
Zinc (mg/L)
AVB-1/1D
ND
ND
ND
ND ND
ND
ND/.0056
ND
0.18
AVB-2
ND
ND
ND
ND ND
ND
ND
ND
0.22
AVB-3
ND
ND
ND
ND ND
ND
ND
ND
0.098
AVB-4*
ND
ND
ND
ND ND
ND
ND
ND
0.12
AVB-5*
ND
ND
ND
ND ND
ND
ND
ND
0.18
AVB-6*
ND
ND
ND
ND ND
ND
ND
ND
0.052
AVB-7*/54
ND
ND
ND
ND ND
ND
ND
ND
0.0665
AVB-8*
ND
ND
ND
ND ND
ND
ND
ND
ND
AVB-9*
ND
ND
ND
ND ND
ND
ND
ND
0.074
AVB-10*
ND
ND
ND
ND ND
ND
ND
ND
ND
AVB-11*
ND
ND
ND
ND ND
ND
ND
ND
0.19
AVB-12*
ND
ND
ND
ND ND
ND
ND
ND
ND
AVB-13*
ND
ND
ND
ND ND
ND
ND
ND
0.074
AVB-14/14D*
ND
ND
ND
ND ND
ND
ND
ND
0.083
AVB-15*
ND
ND
0.052
ND ND
ND
ND
ND
ND
AVB-16*
ND
ND
ND
ND ND
ND
ND
ND
0.24
AVB-17
ND
ND
ND
ND ND
ND
ND
ND
ND
AVB-18/19
ND
ND
ND
ND ND
ND
ND
ND
1.7
AVB-20/21
0.475
ND
0.051
ND ND
ND
ND
ND
3.8
AVB-22
0.26
ND
ND
ND ND
ND
ND
ND
0.068
AVB-24
ND
ND
ND
ND ND
ND
ND
ND
0.058
AVB-26/27
ND
ND
ND
ND ND
ND
ND
ND
0.20/ND
AVB-28/29
ND
ND
ND
ND ND
ND
ND
ND
0.24
AVB-30/30a/31
ND
ND
ND
ND ND
ND
ND
ND
0.12/ND
AVB-32/33
ND
ND
ND
ND ND
ND
ND
ND
0.084
AVB-34
ND
ND
ND
ND ND
ND
ND
ND
0.36
AVB-36
ND
ND
ND
ND ND
ND
ND
ND
ND
AVB-37
0.22
ND
ND
ND ND
ND
ND
ND
ND
* = result for Total Recoverable Metals rather than Dissolved Metals bold = constituent concentration exceeded Primary or Secondary Maximum Contaminant Level
62

Appendix B. Groundwater Quality Data, Avra Valley Sub-Basin, 1998-2001--continued
Site # Iron
(mg/L) Lead
(mg/L) Manganese
(mg/L) Mercury (mg/L)
Nickel (mg/L)
Selenium (mg/L)
Silver (mg/L)
Thallium (mg/L)
Zinc (mg/L)
AVB-38
ND
ND
ND
ND ND
ND
ND
ND
0.066
AVB-39
ND
ND
ND
ND ND
ND
ND
ND
ND
AVB-40/41
ND
ND
ND
ND ND
ND
ND
ND
ND
AVB-42/43
ND
ND
ND
ND ND
ND
ND
ND
0.061
AVB-46
ND
ND
ND
ND ND
ND
ND
ND
ND
AVB-47
ND
ND
ND
ND ND
ND
ND
ND
ND
AVB-48
ND
ND
ND
ND ND
ND
ND
ND
0.27
AVB-49
ND
ND
ND
ND ND
ND
ND
ND
0.13
AVB-50
ND
ND
ND
ND ND
ND
ND
ND
0.79
AVB-51
ND
ND
ND
ND ND
ND
ND
ND
0.0575
AVB-52
ND
ND
ND
ND ND
ND
ND
ND
ND
AVB-53
ND
ND
ND
ND ND
ND
ND
ND
0.46
AVB-55
ND
ND
ND
ND ND
ND
ND
ND
0.16
AVB-56
ND
ND
ND
ND ND
ND
ND
ND
ND
bold = constituent concentration exceeded Primary or Secondary Maximum Contaminant Level
63

Appendix B. Groundwater Quality Data, Avra Valley Sub-Basin, 1998-2001--continued
Site # Radon-222 (pCi/L)
Alpha (pCi/L)
Beta (pCi/L)
Ra-226 + Ra-228 (pCi/L)
Uranium (µg/L) Chemistry VOCs
AVB-1/1D
315
3.0
3.9
-
- sodium-chloride ND
AVB-2
427
6.2
5.2
ND
-- sodium-bicarbonate -
AVB-3
--
--
--
--
-- calcium-bicarbonate -
AVB-4
--
26.1
6.7
< LLD
20 sodium-mixed ND
AVB-5
--
<LLD
2.1
--
-- mixed-bicarbonate ND
AVB-6
587
15
4.2
< LLD
16 sodium-bicarbonate ND
AVB-7/54
1,203
6.5
5.3
< LLD
-- calcium-bicarbonate ND
AVB-8
209
--
--
--
-- mixed-bicarbonate -
AVB-9
3918
--
--
--
-- calcium-mixed ND
AVB-10
--
--
--
--
-- mixed-bicarbonate ND
AVB-11
--
13
7.6
< LLD
-- mixed-bicarbonate ND
AVB-12
--
--
--
--
-- sodium-bicarbonate ND
AVB-13
--
--
--
--
-- mixed-bicarbonate -
AVB-14/14D
1,019
7.9
4.7
--
-- mixed-bicarbonate -
AVB-15
83,620
170
110
30.8
140 mixed-mixed -
AVB-16
--
--
--
--
-- mixed-sulfate -
AVB-17
--
1.6
2.9
--
-- calcium-bicarbonate ND
AVB-18/19
--
49
24
< LLD
67 calcium-bicarbonate ND
AVB-20/21
--
2.2
2.4
--
-- calcium-bicarbonate -
AVB-22
--
3.0
4.5
--
-- calcium-bicarbonate ND
AVB-24
--
< LLD
1.1
--
-- mixed-bicarbonate -
AVB-26/27
--
1.9
2.2
--
-- calcium-bicarbonate ND
AVB-28/29
862
--
--
--
-- mixed-bicarbonate -
AVB-30/30a/31
615
--
--
--
-- mixed-bicarbonate -
AVB-32/33
827
--
--
--
-- mixed-bicarbonate -
AVB-34
--
2.5
1.7
--
-- mixed-bicarbonate ND
AVB-36
--
14
4.3
< LLD
-- mixed-bicarbonate -
AVB-37
--
11
3.3
< LLD
-- mixed-bicarbonate ND
LLD = Lower Limit of Detection bold = constituent concentration exceeded Primary or Secondary Maximum Contaminant Level
64

Appendix B. Groundwater Quality Data, Avra Valley Sub-Basin, 1998-2001--continued
Site # Radon-222 (pCi/L)
Alpha (pCi/L)
Beta (pCi/L)
Ra-226 + Ra-228 (pCi/L)
Uranium (µg/L) Chemistry
Ion Balance % Difference
Pass / Fail
AVB -38
--
6.5
2.9
< LLD
-- mixed-bicarbonate ND
AVB -39
--
15
2.2
< LLD
3.6 mixed-bicarbonate ND
AVB -40/41
321
--
--
--
-- calcium-bicarbonate ND
AVB -42/43
750
--
--
--
-- calcium-bicarbonate -
AVB -46
--
9.5
4.1
< LLD
-- calcium-bicarbonate -
AVB -47
212
--
--
--
-- mixed-bicarbonate ND
AVB -48
558
--
--
--
-- calcium-bicarbonate -
AVB -49
170
13
7.5
< LLD
-- mixed-bicarbonate -
AVB -50
3918
5.6
2.7
< LLD
-- mixed-bicarbonate -
AVB -51
340
--
--
--
-- mixed-mixed ND
AVB -52
380
--
--
--
-- calcium-mixed -
AVB -53
--
9.2
6.2
< LLD
-- mixed-bicarbonate ND
AVB -55
--
--
--
--
-- mixed-bicarbonate ND
AVB -56
--
--
--
--
-- mixed-bicarbonate ND
LLD = Lower Limit of Detection bold = constituent concentration exceeded Primary or Secondary Maximum Contaminant Level
65


