ambient groundwater quality of the tiger wash basin · ii ambient groundwater quality of the tiger...
TRANSCRIPT


ii
Ambient Groundwater Quality of the
Tiger Wash Basin: A 2014 Baseline Study
By Douglas C. Towne
Arizona Department of Environmental Quality
Open File Report 14-07
ADEQ Water Quality Division
Surface Water Section
Monitoring Unit
1110 West Washington St.
Phoenix, Arizona 85007-2935
Thanks:
Field Assistance: Elizabeth Boettcher and Jade Dickens. Special recognition is extended to Clayton
Overson for assisting with groundwater data collection on his ranch.
Photo Credits: Douglas Towne
Report Cover: Little Horn windmill, named after a nearby rock outcrop, was one of five wells
sampled for the Tiger Wash basin study. The small, remote basin located west of
Phoenix in the Lower Sonoran desert is used almost exclusively for livestock
grazing and recreation.

iii
ADEQ Ambient Groundwater Quality Open-File Reports (OFR) and Factsheets (FS):
Avra Valley Sub-basin OFR 14-06, 66 p. FS 14-11, 5 p.
Harquahala Basin OFR 14-04, 62 p. FS 14-09, 5 p.
Tonto Creek Basin OFR 13-04, 50 p. FS 13-18, 4 p.
Upper Hassayampa Basin OFR 13-03, 52 p. FS 13-11, 3 p.
Aravaipa Canyon Basin OFR 13-01, 46 p. FS 13-04, 4 p.
Butler Valley Basin OFR 12-06, 44 p. FS 12-10, 5.p.
Cienega Creek Basin OFR 12-02, 46 p. FS 12-05, 4.p.
Ranegras Plain Basin OFR 11-07, 63 p. FS 12-01, 4.p.
Groundwater Quality in Arizona OFR 11-04, 26 p. -
Bill Williams Basin OFR 11-06, 77 p. FS 12-01, 4.p.
San Bernardino Valley Basin OFR 10-03, 43 p. FS 10-31, 4 p.
Dripping Springs Wash Basin OFR 10-02, 33 p. FS 11-02, 4 p.
McMullen Valley Basin OFR 11-02, 94 p. FS 11-03, 6 p.
Gila Valley Sub-basin OFR 09-12, 99 p. FS 09-28, 8 p.
Agua Fria Basin OFR 08-02, 60 p. FS 08-15, 4 p.
Pinal Active Management Area OFR 08-01, 97 p. FS 07-27, 7 p.
Hualapai Valley Basin OFR 07-05, 53 p. FS 07-10, 4 p.
Big Sandy Basin OFR 06-09, 66 p. FS 06-24, 4 p.
Lake Mohave Basin OFR 05-08, 66 p. FS 05-21, 4 p.
Meadview Basin OFR 05-01, 29 p. FS 05-01, 4 p.
San Simon Sub-Basin OFR 04-02, 78 p. FS 04-06, 4 p.
Detrital Valley Basin OFR 03-03, 65 p. FS 03-07, 4 p.
San Rafael Basin OFR 03-01, 42 p. FS 03-03, 4 p.
Lower San Pedro Basin OFR 02-01, 74 p. FS 02-09, 4 p.
Willcox Basin OFR 01-09, 55 p. FS 01-13, 4 p.
Sacramento Valley Basin OFR 01-04, 77 p. FS 01-10, 4 p
Upper Santa Cruz Basin (w/ USGS) OFR 00-06, 55 p. -
Prescott Active Management Area OFR 00-01, 77 p. FS 00-13, 4 p.
Upper San Pedro Basin (w/ USGS) OFR 99-12, 50 p. FS 97-08, 2 p.
Douglas Basin OFR 99-11, 155 p. FS 00-08, 4 p.
Virgin River Basin OFR 99-04, 98 p. FS 01-02, 4 p.
Yuma Basin OFR 98-07, 121 p. FS 01-03, 4 p.
These publications are available at: www.azdeq.gov/environ/water/assessment/ambient.html

iv
Map 1. ADEQ Ambient Groundwater Monitoring Program Studies
v
Table of Contents
Abstract .................................................................................................................................................................... 1
Introduction ............................................................................................................................................................. 2
Investigation Methods ............................................................................................................................................. 2
Sample Collection ....................................................................................................................................... 5
Laboratory Methods .................................................................................................................................... 5
Data Evaluation ..................................................................................................................................................... 11
Quality Assurance ..................................................................................................................................... 11
Data Validation ......................................................................................................................................... 11
Groundwater Sampling Results ........................................................................................................................... 13
Water Quality Standards / Guidelines ....................................................................................................... 13
Analytical Results .................................................................................................................................... 13
Groundwater Composition ................................................................................................................................... 18
General Summary .................................................................................................................................... .18
Isotopes ..................................................................................................................................................... 25
Discussion ............................................................................................................................................................... 30
References .............................................................................................................................................................. 30
Appendices
Appendix A – Data for Sample Sites, Tiger Wash basin, 2014 ................................................................. 32
Appendix B – Groundwater Quality Data, Tiger Wash basin, 2014 ......................................................... 32

vi
Maps
ADEQ Ambient Monitoring Program Studies .......................................................................................................... V
Map 1. Tiger Wash Basin ...................................................................................................................................... 3
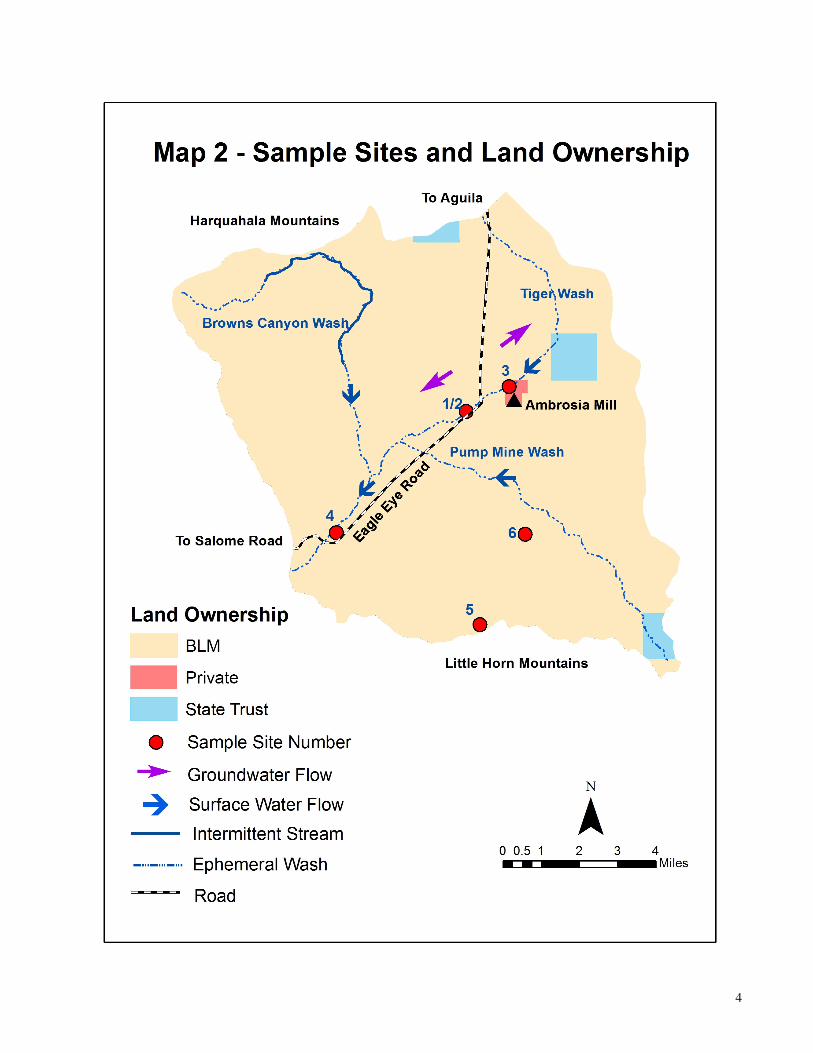
Map 2. Sample Sites and Land Ownership ............................................................................................................. 4
Map 3. Water Quality Standards ........................................................................................................................... 14
Map 4. Water Chemistry ....................................................................................................................................... 19
Map 5. Total Dissolved Solids .............................................................................................................................. 21
Map 6. Nitrate ....................................................................................................................................................... 22
Map 7. Arsenic ...................................................................................................................................................... 23
Map 8. Radon and Geology .................................................................................................................................. 24
Tables
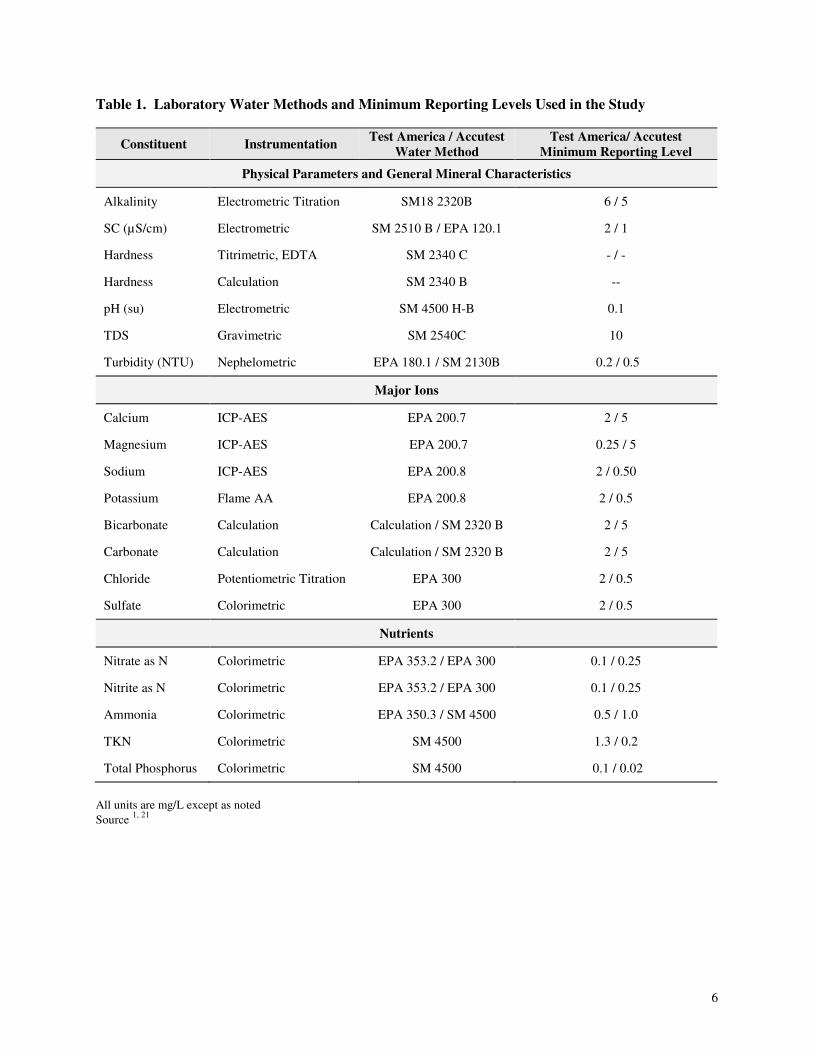
Table 1. Laboratory water methods and minimum reporting levels used in the study ............................................ 5
Table 2. Summary results of split samples from the Accutest/Test America laboratories ................................... 12
Table 3. Sampled sites exceeding health-based water quality guidelines or Primary MCLs ................................ 15
Table 4. Summary statistics for groundwater quality data .................................................................................... 16
Table 5. Summary of 18-Year Time Trend Sample Results at Headquarters Well (TIG-3) ................................. 27
Table 6. Summary of 24-Year Time Trend Sample Results at Tiger Well (TIG-4) ............................................. 29
Table 7. Summary of 20-Year Time Trend Sample Results at Tiger Well (TIG-4) ............................................. 29
Diagrams
Diagram 1. Water chemistry piper plot ................................................................................................................ 18
Diagram 2. Sodium-sulfate relationship .............................................................................................................. 20
Diagram 3. Oxygen-18 – deuterium relationship ................................................................................................ 26
Diagram 4. Nitrogen-15 – nitrate relationship ..................................................................................................... 26
Diagram 5. Nitrate concentrations over time in Old Headquarters well ............................................................... 27
Diagram 6. Chloride concentrations over time in Old Headquarters well ............................................................ 27
Figures
Figure 1. Tiger Wash ............................................................................................................................................ 8
Figure 2. Eagle Eye Road ...................................................................................................................................... 8
Figure 3. Mine Pump Well .................................................................................................................................... 9
Figure 4. Tiger Well .............................................................................................................................................. 9
Figure 5. Headquarters Well ................................................................................................................................ 10
Figure 6. Pegrin Well ........................................................................................................................................... 10
Figure 7. Pegrin Well notes ................................................................................................................................. 10
Figure 8. Little Horn Well ................................................................................................................................... 10

vii
Abbreviations
amsl above mean sea level
ac-ft acre-feet
af/yr acre-feet per year
ADEQ Arizona Department of Environmental Quality
ADHS Arizona Department of Health Services
ADWR Arizona Department of Water Resources
ARRA Arizona Radiation Regulatory Agency
AZGS Arizona Geological Survey
As arsenic
bls below land surface
BLM U.S. Department of the Interior Bureau of Land Management oC degrees Celsius
CI0.95 95 percent Confidence Interval
Cl chloride
EPA U.S. Environmental Protection Agency
F fluoride
Fe iron
gpm gallons per minute
GWPL Groundwater Protection List active ingredient
HCl hydrochloric acid
LLD Lower Limit of Detection
Mn manganese
MCL Maximum Contaminant Level
ml milliliter
msl mean sea level
ug/L micrograms per liter
um micron
µS/cm microsiemens per centimeter at 25° Celsius
mg/L milligrams per liter
MRL Minimum Reporting Level
ns not significant
ntu nephelometric turbidity unit
pCi/L picocuries per liter
QA Quality Assurance
QAPP Quality Assurance Project Plan
QC Quality Control
SAR Sodium Adsorption Ratio
SDW Safe Drinking Water
SC Specific Conductivity
su standard pH units
SO4 sulfate
TDS Total Dissolved Solids
TKN Total Kjeldahl Nitrogen
TIG Tiger Wash groundwater basin
USGS U.S. Geological Survey

viii

1
Ambient Groundwater Quality of the Tiger Wash Basin:
A 2014 Baseline Study
Abstract – In 2014, the Arizona Department of Environmental Quality (ADEQ) conducted a baseline groundwater
quality study of the Tiger Wash basin in west-central Arizona. The small, remote basin comprises 74 square miles
within Maricopa County and consists of a narrow valley bordered by rugged mountain ranges.5 Low-intensity
livestock grazing and recreation are the predominant land uses. Within the basin, there are also small inactive mines
and the Ambrosia Mill, which briefly processed manganese ore in the early 1960s.8 Land ownership consists of
federal lands (97.4 percent) managed by the Bureau of Land Management (BLM), State Trust lands (2.3 percent)
and private land (0.3 percent).4, 5
There are no incorporated communities within the basin, which had a population of
less than 10 people in 2000.5
The basin is bounded on the north by the Harquahala Mountains and the Little Horn Mountains on the south. The
small, shallow, alluvium-filled basin is drained by Tiger Wash which is a tributary of Centennial Wash. Tiger Wash
heads in the northwest portion of the basin and flows south and west until exiting into the Harquahala basin shortly
after crossing Eagle Eye Road.14
All washes in the basin are ephemeral and flow only after heavy precipitation
except for an intermittent portion of Browns Canyon Wash within the Harquahala Mountains.14
Groundwater is used
for stock and domestic purposes.
The main aquifer in the Tiger Wash basin is basin-fill alluvium that is composed of heterogeneous deposits of clay,
silt, sand, and gravel that are less than 1,000 feet thick.14
Groundwater flow is to the northeast and southwest away
from the center of the basin. 14
The basin contains an estimated 700,000 to 2 million acre-feet of water to a depth of
1,200 feet below land surface. Natural recharge is estimated to be less than 1,000 acre-feet per year.
5 Only a few
low-yield wells used for stock purposes exist in the basin. Based on field reconnaissance, all known wells in the
basin were sampled for the study.
Five wells were sampled; four were powered by windmills and one by a portable generator. Inorganic constituents
and isotopes (oxygen, deuterium, and nitrogen) samples were collected at all five wells while radon (three samples)
and radionuclides (two samples) were collected at selected sites.
Health-based, Primary Maximum Contaminant Levels (MCLs) are enforceable standards that define the maximum
concentrations of constituents allowed in water supplied for drinking water purposes by a public water system and
are based on a lifetime daily consumption of two liters.29
Of the five sites sampled, three sites (60 percent) exceeded
the federal arsenic Primary MCL of 0.01 milligram per Liter (mg/L) and one site exceeded the state arsenic standard
of 0.05 mg/L. Only arsenic exceeded standards and appears to be naturally occurring caused by local lithology.
Aesthetics-based, Secondary MCLs are unenforceable guidelines that define the maximum constituent concentration
that can be present in drinking water without an unpleasant taste, color, or odor.29
Secondary MCLs were not
exceeded at any of the five sites. Of the three sites sampled for radon, two sites (66 percent) exceeded the proposed
300 picocuries per liter standard but none exceeded the proposed 4,000 picocuries per liter standard. 30
The two sites
at which radionuclide samples were collected did not have elevated concentrations of either gross alpha or uranium.
Groundwater is of calcium-bicarbonate chemistry and, based on pH, total dissolved solids, and hardness
concentrations, is categorized as slightly-alkaline, fresh, and hard.10, 13
Most trace elements such as aluminum,
antimony, beryllium, boron, cadmium, chromium, iron, lead, manganese, mercury, nickel, selenium, silver, and
thallium were rarely – if ever - detected. Only arsenic, barium, copper, fluoride, strontium, and zinc were detected
at more than 40 percent of the sites.
Oxygen and deuterium isotope values of the samples have been subject to evaporation and can be characterized as
younger, enriched water. The enriched samples are similar to those collected from a small subset of wells, often
located near bedrock areas, in other nearby western Arizona basins.23
In contrast, most isotope samples in this region
have depleted values that suggest that the majority of groundwater was recharged long ago (8,000 to 12,000 years)
during cooler climatic conditions.11, 23, 24, 25, 26
Wells with enriched samples in other basins rarely exceeded water
quality standards for arsenic but this commonly occurs in the Tiger Wash basin. Nitrogen isotope values suggest the
source of nitrate is from natural soil organic matter in three samples and from animal waste in two samples. 20, 22

2
INTRODUCTION
Purpose and Scope
The Tiger Wash groundwater basin comprises
approximately 74 square miles within Maricopa County
in the west central portion of Arizona (Map 1).5
The
Tiger Wash basin, which is the smallest officially
designated groundwater basin in the state, is located
about 75 miles northwest of Phoenix. There are no
incorporated towns in the rural basin, which had an
estimated population of less than 10 people in 2000.5
The basin is a small, shallow alluvium-filled valley
bordered by mountain ranges. Groundwater is used for
stock and domestic uses.
Sampling by the Arizona Department of Environmental
Quality (ADEQ) Ambient Groundwater Monitoring
program is authorized by legislative mandate in the
Arizona Revised Statutes §49-225, specifically:
“...ongoing monitoring of waters of the state,
including...aquifers to detect the presence of new and
existing pollutants, determine compliance with
applicable water quality standards, determine the
effectiveness of best management practices, evaluate
the effects of pollutants on public health or the
environment, and determine water quality trends.” 3
Benefits of ADEQ Study – This study, which utilizes
scientific sampling techniques and quantitative
analyses, is designed to characterize regional
groundwater quality conditions in the Tiger Wash
basin.
Physical and Cultural Characteristics
Geography – The Tiger Wash basin is located within
the Basin and Range physiographic province of central
Arizona. The basin is drained by Tiger Wash and
bordered by rugged mountains. Vegetation is composed
of Lower Colorado River Valley and Arizona uplands
Sonoran desert scrub with some Southwestern interior
chaparral in the northwest of the basin. 5
The basin is bounded on the north by the Harquahala
Mountains and the Little Horn Mountains on the south.
Elevations range from a maximum of approximately
2,724 feet above mean sea level (amsl) at Little Horn
Mountain to a low of approximately 1,950 feet amsl
where Tiger Wash exits into the Harquahala basin.
Land use in the basin is predominantly livestock
grazing and recreational activities such as hiking,
though there are several small, inactive mines and the
former Ambrosia Mill. The latter property, located on
private land, briefly processed manganese ore in 1960-
61 for the U.S. Department of Defense. The mill and
equipment were later dismantled and sold. There
remains, however, 150,000 tons of mill tailings having
manganese and arsenic levels that are significantly
above the Arizona non-residential soil remediation
levels.8
All streams in the basin are ephemeral except for an
intermittent stretch of Browns Canyon Wash, which is
located in the Harquahala Mountains. 5
Land Ownership - The Tiger Wash basin consists of
federal land (97.4 percent) managed by the U.S. Bureau
of Land Management (BLM), including a portion of the
Harquahala Mountains Wilderness.7
The remainder of
the basin is composed of State Trust lands (2.3 percent),
and private lands (0.3 percent). 4, 5
Climate – The Tiger Wash basin is in a semiarid
climate characterized by hot, dry summers and mild
winters. Precipitation amounts vary by elevation and
range annually from 10 to 16 inches. Precipitation
occurs predominantly as rain in either late summer,
localized thunderstorms or, less often, as widespread,
low intensity winter rain that rarely includes snow at
higher elevations.5
Groundwater - The main aquifer in the Tiger Wash
basin is the basin-fill alluvium that is composed of
heterogeneous deposits of clay, silt, sand, and gravel
that are less than 1,000 feet thick.14
Groundwater flow
is surmised to be to the northeast and southwest away
from the center of the basin based on a very limited
amount of data, raising the question of why this basin
was originally delinated.14
The few wells in the basin
are low yielding and are used for stock and domestic
purposes.14
Natural recharge is less than 1,000 acre-feet
(af) per year. There is an estimated 700,000 to 2 million
af of water in storage to a depth of 1,200 below land
surface (bls). 5
INVESTIGATION METHODS
ADEQ collected samples from five wells to
characterize regional groundwater quality in the Tiger
Wash basin (Map 2). This is thought to be all of the
active wells in the basin based on field reconnaissance.
The following types of samples were collected:
• inorganic suites at five sites
• oxygen and deuterium isotopes at five sites
• nitrogen isotopes at five sites
• radon at three sites
• radionuclides at two sites

3
4

5
No bacteria sampling was conducted because
microbiological contamination problems in
groundwater are often transient and subject to a
variety of changing environmental conditions
including soil moisture content and temperature. 12
Five wells used for stock watering were sampled for
the study. A well was considered suitable for
sampling when the following conditions were met:
the owner had given permission, a sampling point
existed near the wellhead, and the well casing and
surface seal appeared to be intact and undamaged.2, 6
Additional information on groundwater sample sites
was compiled from the Arizona Department of Water
Resources (ADWR) well registry and is available in
Appendix A. 5
Sample Collection
The sample collection methods for this study
conformed to the Quality Assurance Project Plan
(QAPP) 2 and the Field Manual for Water Quality
Sampling.6 While these sources should be consulted
as references to specific sampling questions, a brief
synopsis of the procedures involved in collecting a
groundwater sample is provided.
After obtaining permission from the well owner, the
volume of water needed to purge the well three bore-
hole volumes was calculated from well log and on-
site information. Physical parameters—temperature,
pH, and Specific Conductivity (SC)—were
monitored every five minutes using a YSI multi-
parameter instrument.
To assure obtaining fresh water from the aquifer,
after three bore volumes had been pumped and
physical parameter measurements had stabilized
within 10 percent, a sample representative of the
aquifer was collected from a point as close to the
wellhead as possible.
In certain instances, it was not possible to purge three
bore volumes. In these cases, at least one bore
volume was evacuated and the physical parameters
had stabilized within 10 percent. Sample bottles were
labeled with a Tiger Wash identifier (TIG) and filled
in the following order:
1. Radon
2. Inorganics
3. Radionuclide
4. Isotopes
Radon, a naturally occurring, intermediate
breakdown from the radioactive decay of uranium-
238 to lead-206, was collected in two unpreserved,
40 milliliter (ml) clear glass vials. Radon samples
were filled to minimize volatilization and sealed so
that no headspace remained.1, 21
The inorganic constituents were collected in three,
one-liter polyethylene bottles. Samples to be
analyzed for dissolved metals were filtered into
bottles using a positive pressure filtering apparatus
with a 0.45 micron (µm) pore size groundwater
capsule filter and preserved with 5 ml nitric acid (70
percent). Samples to be analyzed for nutrients were
preserved with 2 ml sulfuric acid (95.5 percent).
Samples to be analyzed for other inorganic
parameters were unpreserved.1, 21
Radiochemistry samples were collected in two
collapsible 4-liter plastic containers and preserved
with 5 ml nitric acid to reduce the pH below 2.5 su. 1
Oxygen and hydrogen isotope samples were collected
in a 250 ml polyethylene bottle with no
preservative.26
Nitrogen isotope samples were
collected in a 500 ml polyethylene bottle and filled ¾
full to allow room for expansion when frozen. 28
All samples were kept at 4° Celsius with ice in an
insulated cooler, with the exception of the oxygen
and hydrogen isotope samples. 28
Nitrogen samples
were frozen upon returning from the field and
shipped in dry ice to the laboratory.28
Chain of
custody procedures were followed in sample
handling. Samples for this study were collected
during two field trips conducted in early 2014.
Laboratory Methods
Inorganic analyses for the study were analyzed by
Accutest Northern California Laboratory in San Jose,
California. A complete listing of inorganic
parameters, including laboratory method and
Minimum Reporting Level (MRL) for each
laboratory is provided in Table 1.
Radionuclide and radon analyses were conducted by
Radiation Safety Engineering, Inc. Laboratory in
Chandler, Arizona.
Isotope samples were analyzed by the Laboratory of
Isotope Geochemistry at the University of Arizona in
Tucson, Arizona.
6
Table 1. Laboratory Water Methods and Minimum Reporting Levels Used in the Study
Constituent Instrumentation Test America / Accutest
Water Method Test America/ Accutest
Minimum Reporting Level
Physical Parameters and General Mineral Characteristics
Alkalinity Electrometric Titration SM18 2320B 6 / 5
SC (µS/cm) Electrometric SM 2510 B / EPA 120.1 2 / 1
Hardness Titrimetric, EDTA SM 2340 C - / -
Hardness Calculation SM 2340 B --
pH (su) Electrometric SM 4500 H-B 0.1
TDS Gravimetric SM 2540C 10
Turbidity (NTU) Nephelometric EPA 180.1 / SM 2130B 0.2 / 0.5
Major Ions
Calcium ICP-AES EPA 200.7 2 / 5
Magnesium ICP-AES EPA 200.7 0.25 / 5
Sodium ICP-AES EPA 200.8 2 / 0.50
Potassium Flame AA EPA 200.8 2 / 0.5
Bicarbonate Calculation Calculation / SM 2320 B 2 / 5
Carbonate Calculation Calculation / SM 2320 B 2 / 5
Chloride Potentiometric Titration EPA 300 2 / 0.5
Sulfate Colorimetric EPA 300 2 / 0.5
Nutrients
Nitrate as N Colorimetric EPA 353.2 / EPA 300 0.1 / 0.25
Nitrite as N Colorimetric EPA 353.2 / EPA 300 0.1 / 0.25
Ammonia Colorimetric EPA 350.3 / SM 4500 0.5 / 1.0
TKN Colorimetric SM 4500 1.3 / 0.2
Total Phosphorus Colorimetric SM 4500 0.1 / 0.02
All units are mg/L except as noted
Source 1, 21

7
Table 1. Laboratory Water Methods and Minimum Reporting Levels Used in the Study-Continued
Constituent Instrumentation Test America / Accutest
Water Method Test America/ Accutest
Minimum Reporting Level
Trace Elements
Aluminum ICP-AES EPA 200.7 0.2 / 0.2
Antimony Graphite Furnace AA EPA 200.8 0.003 / 0.004
Arsenic Graphite Furnace AA EPA 200.8 0.001 / 0.004
Barium ICP-AES EPA 200.7 / EPA 200.8 0.01 / 0.002
Beryllium Graphite Furnace AA EPA 200.8 / EPA 200.7 0.001 / 0.005
Boron ICP-AES EPA 200.7 0.2 / 0.10
Cadmium Graphite Furnace AA EPA 200.8 0.001 / 0.002
Chromium Graphite Furnace AA EPA 200.7 / EPA 200.8 0.01 / 0.002
Copper Graphite Furnace AA EPA 200.7 / EPA 200.8 0.01 / 0.004
Fluoride Ion Selective Electrode SM 4500 F-C / EPA 300 0.4 / 0.10
Iron ICP-AES EPA 200.7 0.05 / 0.20
Lead Graphite Furnace AA EPA 200.8 0.001 / 0.002
Manganese ICP-AES EPA 200.7 0.01 / 0.15
Mercury Cold Vapor AA EPA 245.1 0.0002
Nickel ICP-AES EPA 200.7 0.01 / 0.005
Selenium Graphite Furnace AA EPA 200.8 0.002 / 0.004
Silver Graphite Furnace AA EPA 200.7 / EPA 200.8 0.01 / 0.002
Strontium ICP-AES EPA 200.7 0.1 / 0.01
Thallium Graphite Furnace AA EPA 200.8 0.001 / 0.002
Zinc ICP-AES EPA 200.7 0.05 / 0.02
Radionuclides
Gross alpha Gas flow counter EPA 900.0 varies
Radium 226 Gas flow counter EPA 903.0 varies
Radium 228 Gas flow counter EPA 904.0 varies
Radon Liquid scantill. counter EPA 913.1 varies
Uranium Kinetic phosphorimeter EPA Laser
Phosphorimetry varies
All units are mg/L Source 1, 21

8
Figure 1 –The basin is drained by Tiger Wash, an ephemeral waterway that flows only in response to major
precipitation events. The wash is shown here crossing Eagle Eye Road.
Figure 2 – Looking north along Eagle Eye Road from a former loading site for ore from the nearby Black
Nugget and Black Queen mines. More than 97 percent of the basin consists of federally owned land managed
by the Bureau of Land Management that is used for low intensity livestock grazing and recreation. 5
9
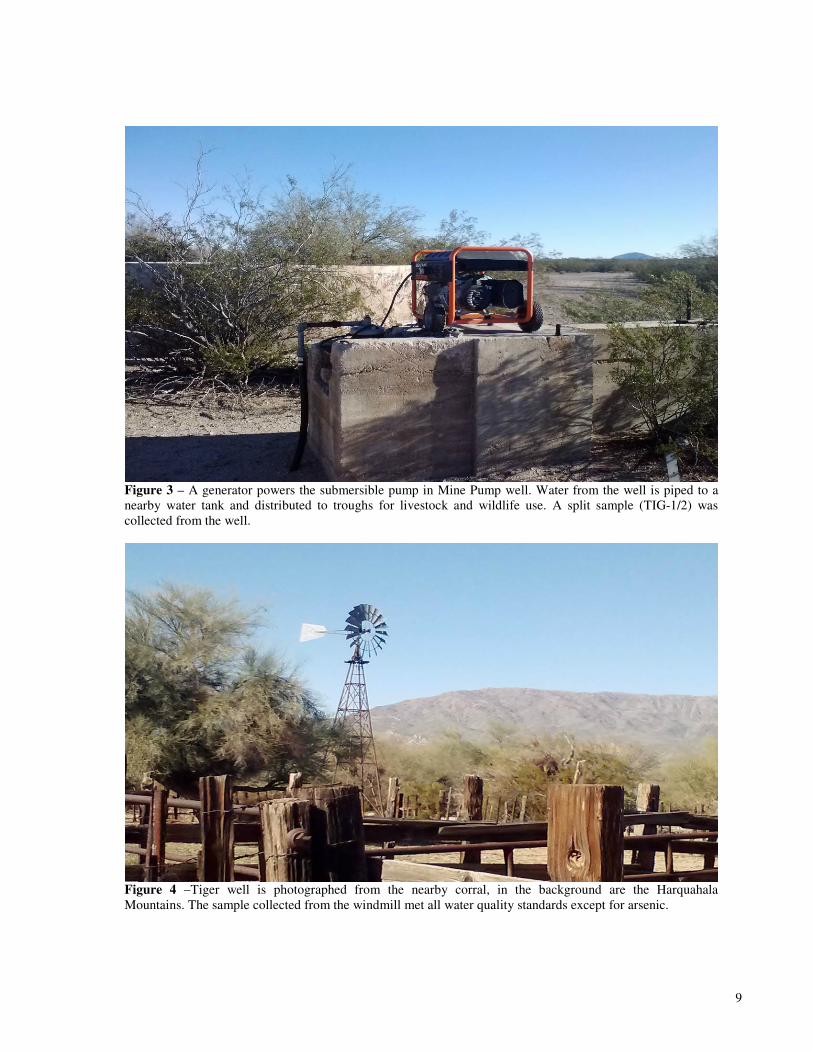
Figure 3 – A generator powers the submersible pump in Mine Pump well. Water from the well is piped to a
nearby water tank and distributed to troughs for livestock and wildlife use. A split sample (TIG-1/2) was
collected from the well.
Figure 4 –Tiger well is photographed from the nearby corral, in the background are the Harquahala
Mountains. The sample collected from the windmill met all water quality standards except for arsenic.

10
Figure 5 – Headquarters well is located on a small enclave of private land in the basin. Formerly powered by a pump jack, the sample (TIG-3) collected from the windmill met all water quality standards.
Figure 6 – ADEQ’s Elizabeth Boettcher collects a sample (TIG-6) from Pegrin well. The well was temporarily powered by a pump jack to keep up with livestock water demands because of calm winter winds.
Figure 7 – The “graffiti” on Pegrin well’s adjacent water tank is actually valuable hydrologic notes left by Balow’s Pump when the company serviced the well.
Figure 8 – The water tank supplied by Little Horn well
was full when a sample (TIG-5) was collected in
February 2014. Overflow from the windmill supports a
small riparian area adjacent to the tank.

11
DATA EVALUATION
Quality Assurance
Quality-assurance (QA) procedures were followed
and quality-control (QC) samples were collected to
quantify data bias and variability for the Tiger Wash
basin study. The design of the QA/QC plan was
based on recommendations included in the Quality
Assurance Project Plan (QAPP) and the Field
Manual for Water Quality Sampling. 2, 6
The QC
inorganic samples collected for this study include one
split.
Split Samples – Split samples are identical sets of
samples collected from the same source at the same
time that are submitted to two different laboratories
to check for laboratory differences.6 One inorganic
split sample was collected and distributed between
the Accutest and Test America labs. The analytical
results were evaluated by examining the variability in
constituent concentrations in terms of absolute levels
and as the percent difference.
Analytical results indicate that of the 41 constituents
examined, 18 had concentrations above MRLs for
both the Accutest and Test America laboratories.
The maximum variation between constituents was
below seven percent except for turbidity (Table 2).
Based on the results of blank, duplicate, split, time-
trend samples collected for this study, no significant
QA/QC problems were apparent with the study.
Data Validation
The analytical work for this study was subjected to
four QA/QC correlations and considered valid based
on the following results.15
Cation/Anion Balances – In theory, water samples
exhibit electrical neutrality. Therefore, the sum of
milliequivalents per liter (meq/L) of cations should
equal the sum of meq/L of anions. However, this
neutrality rarely occurs due to unavoidable variation
inherent in all water quality analyses. Still, if the
cation/anion balance is found to be within acceptable
limits, it can be assumed there are no gross errors in
concentrations reported for major ions.15
Overall, cation/anion meq/L balances of Tiger Wash
basin samples were significantly correlated
(regression analysis, p ≤ 0.01). Of the five samples,
all were within +/-11 percent and four samples were
within +/- 5 percent. Three samples had low
cation/high anion sums; two samples had high
cation/low anion sums.
SC/TDS – The SC-lab and Total Dissolved Solids
(TDS) concentrations measured by contract
laboratories were significantly correlated as were SC-
field and TDS concentrations (regression analysis, r =
0.97, p ≤ 0.01). The TDS concentration in mg/L
should be from 0.55 to 0.75 times the SC in µS/cm
for groundwater up to several thousand TDS mg/L.15
Groundwater high in bicarbonate and chloride will
have a multiplication factor near the lower end of this
range; groundwater high in sulfate may reach or even
exceed the higher factor. The relationship of TDS to
SC becomes undefined with very high or low
concentrations of dissolved solids.15
SC – The SC measured in the field at the time of
sampling was significantly correlated with the SC
measured by contract laboratories (regression
analysis, r = 0.99, p ≤ 0.01).
pH – The pH values measured in the field using a
YSI meter at the time of sampling were significantly
correlated with laboratory pH values (regression
analysis, r = 0.87, p ≥ 0.01).
Based on the results of blank, duplicate, and split
samples collected for this study, no significant
QA/QC problems were apparent with the study.

12
Table 2. Summary Results of Split Sample between Accutest / Test America Laboratories
Constituents Number of
Split Sites Difference in Percent Difference in Concentration
Physical Parameters and General Mineral Characteristics
Alkalinity, total 1 4 % 18
SC (µS/cm) 1 0 % 2
Hardness 1 3 % 12
pH (su) 1 1 % 0.2
TDS 1 7 % 41
Turbidity 1 13 % 0.7
Major Ions
Calcium 1 1 % 1
Magnesium 1 3 % 1.2
Sodium 1 4 % 1.5
Potassium 1 4 % 0.16
Chloride 1 3 % 0.3
Sulfate 1 3 % 0.4
Nutrients
Nitrate as N 1 3 % 0.2
Trace Elements
Arsenic 1 1 % 0.0001
Barium 1 1 % 0.0008
Fluoride 1 3 % 0.006
Strontium 1 3 % 0.045
Zinc 1 7 % 0.21
All units are mg/L except as noted.

13
GROUNDWATER SAMPLING RESULTS
Water Quality Standards/Guidelines
The ADEQ ambient groundwater program
characterizes regional groundwater quality. An
important determination ADEQ makes concerning
the collected samples is how the analytical results
compare to various drinking water quality standards.
ADEQ used three sets of drinking water standards
that reflect the best current scientific and technical
judgment available to evaluate the suitability of
groundwater in the basin for drinking water use:
• Federal Safe Drinking Water Act (SDWA)
Primary Maximum Contaminant Levels
(MCLs). These enforceable health-based
standards establish the maximum
concentration of a constituent allowed in
water supplied by public systems.29
• State of Arizona Aquifer Water Quality
Standards. These apply to aquifers that are
classified for drinking water protected use.
All aquifers within Arizona are currently
classified and protected for drinking water
use. These enforceable state standards are
identical to the federal Primary MCLs
except for arsenic which is at 0.05 mg/L
compared with the federal Primary MCL of
0.01 mg/L and uranium with a federal
Primary MCL of 30 ug/L.3
• Federal SDW Secondary MCLs. These non-
enforceable aesthetics-based guidelines
define the maximum concentration of a
constituent that can be present without
imparting unpleasant taste, color, odor, or
other aesthetic effects on the water.29
Health-based drinking water quality standards (such
as Primary MCLs) are based on the lifetime
consumption (70 years) of two liters of water per day
and, as such, are chronic rather than acute
standards.29
Exceedances of specific constituents for
each groundwater site is found in Appendix B.
Overall Results – Of the five sites sampled in the
Tiger Wash study, two sites (40 percent) met all
health-based and aesthetics-based, water quality
standards (excluding the proposed radon standard
discussed below).
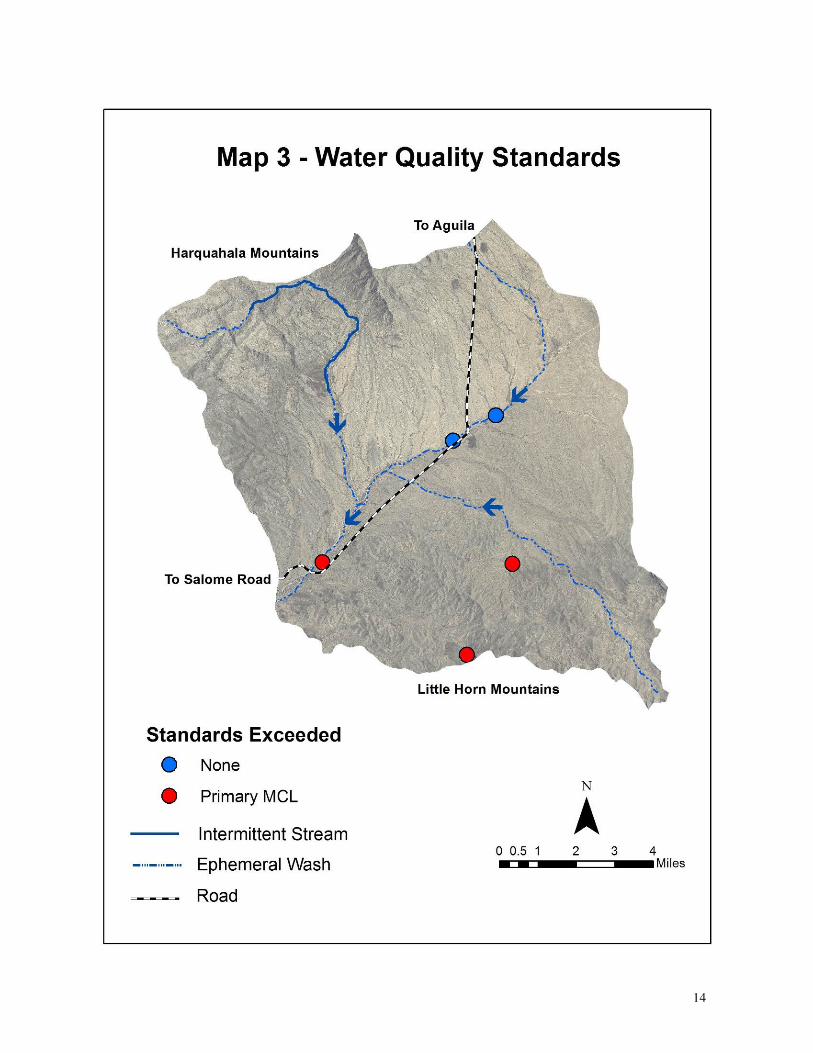
Of the five sites sampled in the Tiger Wash study,
health-based water quality standards were exceeded
at three sites (60 percent). Constituents above
Primary MCLs are arsenic at all three sites.
Inorganic Constituent Results - Of the five sites
sampled for the full suite of inorganic constituents
(excluding radionuclide sample results) in the Tiger
Wash study, two sites (40 percent) met all health-
based and aesthetics-based, water quality standards.
Health-based Primary MCL water quality standards
were exceeded at three of the five sites (Map 3; Table
3). Arsenic was the only inorganic constituent that
exceeded a Primary MCL and was exceeded at the
federal standard at three of the five sites and the state
standard at one site. Potential impacts of these
Primary MCL exceedances are given in Table 3.
Aesthetics-based Secondary MCL water quality
guidelines were not exceeded at any of the five sites.
Radionuclide Results - Of the two sites sampled for
gross alpha and uranium, neither one exceeded the
respective health-based Primary MCL water quality
standards
Radon Results - Of the three sites sampled for
radon, none exceeded the proposed 4,000 picocuries
per liter (pCi/L) standard that would apply if Arizona
establishes an enhanced multimedia program to
address the health risks from radon in indoor air. Two
sites exceeded the proposed 300 pCi/L standard
(Table 3) that would apply if Arizona doesn’t
develop a multimedia program. 30
Analytical Results
Analytical inorganic and radiochemistry results of the
Tiger Wash sample sites are summarized (Table 4)
using the following indices: MRLs, number of
sample sites over the MRL, upper and lower 95
percent confidence intervals (CI95%), median, and
mean. Confidence intervals are a statistical tool
which indicates that 95 percent of a constituent’s
population lies within the stated confidence
interval.32
Specific constituent information for each
sampled groundwater site is in Appendix B.
14

15
Table 3. Sampled Sites Exceeding Health-based Water Quality Standards or Primary MCLs
Constituent Primary
MCL
Number of Sites
Exceeding
Primary MCL
Highest
Concentration
Potential Health Effects of
MCL Exceedances *
Nutrients
Nitrite (NO2-N) 1.0 0 - -
Nitrate (NO3-N) 10.0 0 - -
Trace Elements
Antimony (Sb) 0.006 0 - -
Arsenic (As) 0.01 3 0.0602 dermal and nervous system
toxicity
Arsenic (As) 0.05 1 0.0602 dermal and nervous system
toxicity
Barium (Ba) 2.0 0 - -
Beryllium (Be) 0.004 0 - -
Cadmium (Cd) 0.005 0 - -
Chromium (Cr) 0.1 0 - -
Copper (Cu) 1.3 0 - -
Fluoride (F) 4.0 0 - -
Lead (Pb) 0.015 0 - -
Mercury (Hg) 0.002 0 - -
Nickel (Ni) 0.1 0 - -
Selenium (Se) 0.05 0 - -
Thallium (Tl)** 0.002 0 - -
Radionuclide Constituents
Gross Alpha 15 0 - -
Radon ** 300 2 524 cancer
Radon ** 4,000 0 - -
Uranium 30 0 - -
All units are mg/L except gross alpha, radium-226+228 and radon (pCi/L), and uranium (ug/L).
* Health-based drinking water quality standards are based on a lifetime consumption of two liters of water
per day over a 70-year life span.29
** Proposed EPA Safe Drinking Water Act standards for radon in drinking water. 30

16
Table 4. Summary Statistics for Groundwater Quality Data
Constituent
Minimum
Reporting Limit (MRL)*
# of Samples /
Samples
Over MRL
Median
Lower 95%
Confidence
Interval
Mean
Upper 95%
Confidence
Interval
Physical Parameters
Temperature (oC) 0.1 5 / 5 22.3 19.5 22.4 25.3
pH-field (su) 0.01 5 / 5 7.64 7.37 7.64 7.91
pH-lab (su) 0.01 5 / 5 7.70 7.22 7.70 8.18
Turbidity (ntu) 0.20 / 0.50 5 / 2 > 50 percent of data below MRL
General Mineral Characteristics
T. Alkalinity 6.0 / 5.0 5 / 5 228 176 215 253
SC-field (µS/cm) N/A 5 / 5 472 362 458 554
SC-lab (µS/cm) 2.0 / 1.0 5 / 5 495 328 460 591
Hardness-lab - 5 / 5 286 229 284 338
TDS-field - 5 / 5 307 236 293 349
TDS-lab 20 / 10 5 / 5 286 229 284 338
Major Ions
Calcium 2 / 5 5 / 5 44 23 42 62
Magnesium 0.25 / 5.0 5 / 5 19 14 21 29
Sodium 2 / 0.5 5 / 5 23 10 30 50
Potassium 2.0 / 0.5 5 / 5 2.1 1.2 2.0 2.8
Bicarbonate 6.0 / 5.0 5 / 5 278 215 262 308
Carbonate 6.0 / 5.0 5 / 0 > 50 percent of data below MRL
Chloride 20 / 0.5 5 / 5 9 0 15 32
Sulfate 20 / 0.5 5 / 5 8 - 2 13 28
Nutrients
Nitrate (as N) 0.1 / 0.25 5 / 5 3.4 1.7 3.9 6.1
Nitrite (as N) 0.1 / 0.25 5 / 0 > 50% of data below MRL
TKN 1.3 / 0.2 5 / 2 > 50% of data below MRL
Ammonia 0.5 / 1.0 5 / 0 > 50% of data below MRL
T. Phosphorus 0.1 / .02 5 / 3 0.22 0.07 0.22 0.37

17
Table 4. Summary Statistics for Groundwater Quality Data—Continued
Constituent
Minimum
Reporting
Limit (MRL)*
# of Samples /
Samples
Over MRL
Median
Lower 95%
Confidence
Interval
Mean
Upper 95%
Confidence
Interval
Trace Elements
Aluminum 0.2 5 / 0 > 50% of data below MRL
Antimony 0.003 / 0.004 5 / 0 > 50% of data below MRL
Arsenic 0.001 / 0.004 5 / 4 0.012 - 0.009 0.021 0.051
Barium 0.01 / 0.002 5 / 4 0.034 - 0.007 0.33 0.074
Beryllium 0.001 / 0.005 5 / 0 > 50% of data below MRL
Boron 0.2 / 0.1 5 / 2 > 50% of data below MRL
Cadmium 0.001 / 0.002 5 / 0 > 50% of data below MRL
Chromium 0.01 / 0.002 5 / 2 > 50% of data below MRL
Copper 0.01 / 0.004 5 / 3 0.004 - 0.001 0.006 0.013
Fluoride 0.4 / 0.1 5 / 5 0.3 0.0 0.4 0.8
Iron 0.05 / 0.2 5 / 0 > 50% of data below MRL
Lead 0.001 0.002 5 / 0 > 50% of data below MRL
Manganese 0.01 / 0.15 5 / 1 > 50% of data below MRL
Mercury 0.0002 5 / 0 > 50% of data below MRL
Nickel 0.01 / 0.005 5 / 0 > 50% of data below MRL
Selenium 0.002 / 0.004 5 / 0 > 50% of data below MRL
Silver 0.01 / 0.002 5 / 0 > 50% of data below MRL
Strontium 0.1 / 0.01 5 / 5 0.7 0.4 0.8 1.2
Thallium 0.001 / 0.002 5 / 0 > 50% of data below MRL
Zinc 0.005 / 0.02 5 / 5 0.3 0.1 0.4 0.8
Radionuclide
Gross Alpha** Varies 2 / 2 4 - 22 4 30
Uranium** Varies 2 / 2 3 - 13 3 19
Radon ** Varies 3 / 3 319 - 131 332 795
Isotopes
Oxygen-18 *** Varies 5 / 5 -8.1 -8.7 -7.9 -7.1
Deuterium *** Varies 5 / 5 -56.0 -59.4 -55.8 -52.2
Nitrogen *** Varies 5 / 5 4.5 0.6 8.3 16.0
* = Test America / Accutest MRL All units mg/L except where noted: ** - (pCi/L) or *** - 0/00

18
GROUNDWATER COMPOSITION
General Summary
The water chemistry at the five sample sites in the
Tiger Wash basin are all calcium-bicarbonate
(Diagram 1 – middle figure) (Map 4). The dominant
cation was calcium at two sites, magnesium at two
sites, and one site was mixed (Diagram 1 – left
figure). The dominant anion was bicarbonate at five
sites (Diagram 1 – right figure).
Diagram 1 – Samples collected in the Tiger Wash basin are predominantly of calcium/magnesium-
bicarbonate chemistry which is reflective of recently recharged groundwater.19

19
20
At all five sites, levels of pH-field were slightly
alkaline (above 7 su). 13
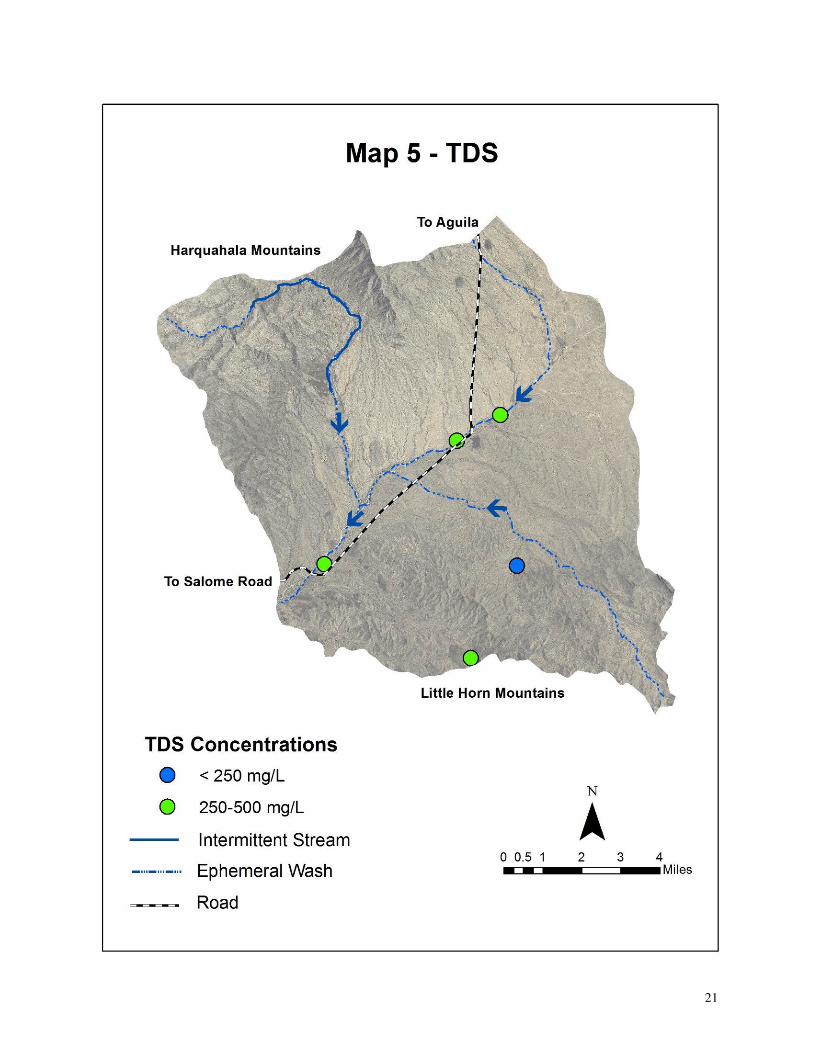
TDS concentrations were considered fresh (below
999 mg/L) at five sites (Map 5).13
Hardness concentrations were moderately hard (75 –
150 mg/L) at one site and hard (150 – 300 mg/L) at
four sites. 10
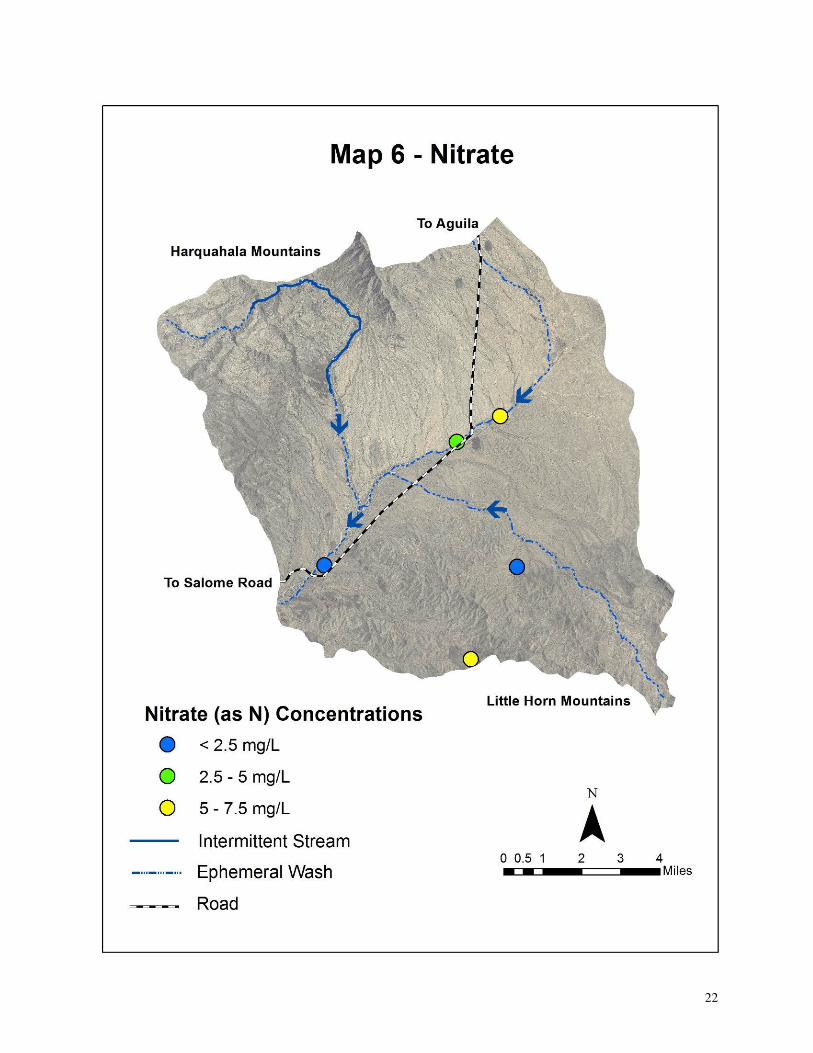
Nitrate (as nitrogen) concentrations at most sites may
have been influenced by human activities according
to a prominent nationwide USGS study.22
Nitrate
concentrations were divided into natural background
(no sites at < 0.2 mg/L), may or may not indicate
human influence (two sites at 0.2 – 3.0 mg/L), may
result from human activities (three sites at 3.0 – 10
mg/L (Map 6).17
This general classification system,
however, may not appear to apply to Sonoran desert
areas. Further analysis of nitrate concentrations is
provided in the nitrogen isotope analysis section.
Most trace elements such as aluminum, antimony,
beryllium, boron, cadmium, chromium, iron, lead,
manganese, mercury, nickel, selenium, silver, and
thallium were rarely – if ever - detected. Only
arsenic (Map 7), barium, copper, fluoride, strontium,
and zinc were detected at more than 40 percent of the
sites.
The groundwater at each sample site was assessed as
to its suitability for irrigation use based on salinity
and sodium hazards. Excessive levels of sodium are
known to cause physical deterioration of the soil and
vegetation. Irrigation water may be classified using
SC and the Sodium Adsorption Ratio (SAR) in
conjunction with one another.31
Groundwater sites in
the Tiger Wash basin all have a “C2-S1” irrigation
classification that indicates samples have a “low”
sodium hazard and a “medium” salinity hazard.
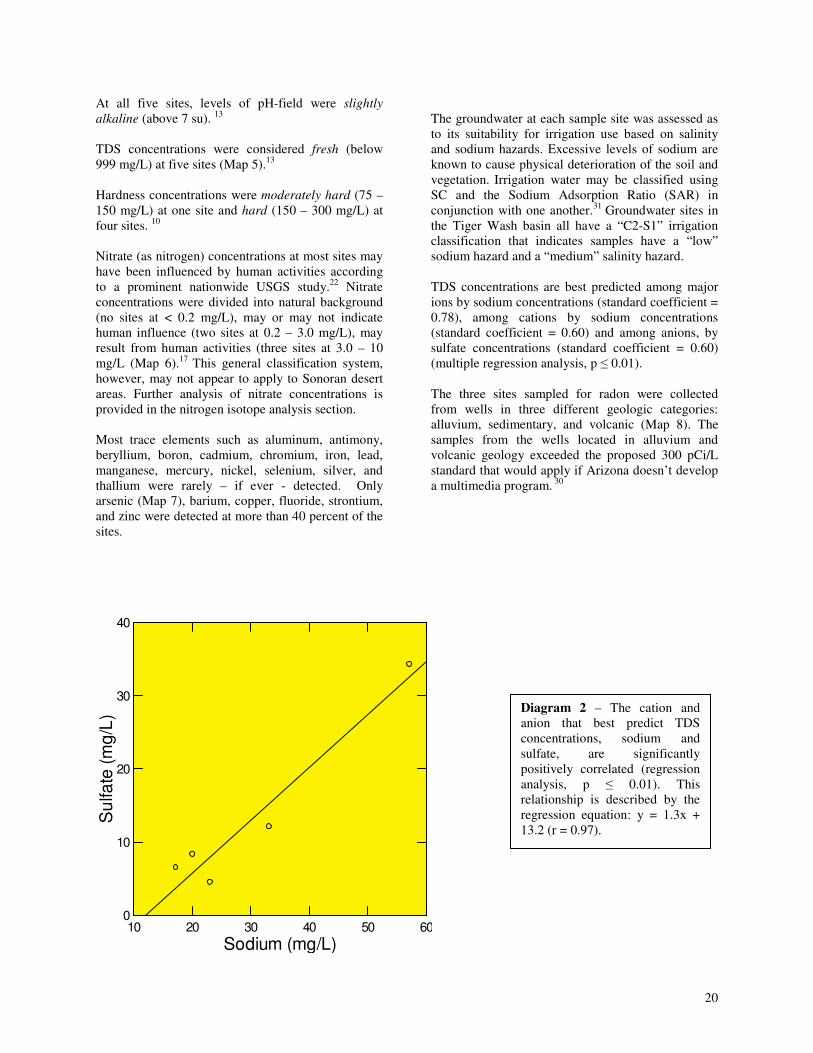
TDS concentrations are best predicted among major
ions by sodium concentrations (standard coefficient =
0.78), among cations by sodium concentrations
(standard coefficient = 0.60) and among anions, by
sulfate concentrations (standard coefficient = 0.60)
(multiple regression analysis, p ≤ 0.01).
The three sites sampled for radon were collected
from wells in three different geologic categories:
alluvium, sedimentary, and volcanic (Map 8). The
samples from the wells located in alluvium and
volcanic geology exceeded the proposed 300 pCi/L
standard that would apply if Arizona doesn’t develop
a multimedia program. 30
10 20 30 40 50 60
Sodium (mg/L)
0
10
20
30
40
Su
lfate
(m
g/L
)
Diagram 2 – The cation and
anion that best predict TDS
concentrations, sodium and
sulfate, are significantly
positively correlated (regression
analysis, p ≤ 0.01). This
relationship is described by the
regression equation: y = 1.3x +
13.2 (r = 0.97).
21
22

23

24

25
Isotopes
Oxygen and Hydrogen Isotopes - These samples
were collected from five sites in the Tiger Wash
basin and roughly conform to what would be
expected in an arid environment, having a slope of
7.1, with the Local Meteoric Water Line (LMWL)
described by the linear equation:
δ D = 4.3 18
O – 22.2
The LMWL for the Tiger Wash basin (Diagram 3) is
similar to other basins in Arizona such as Aravaipa
Canyon (4.1), Dripping Springs Wash (4.4), Upper
Hassayampa and Harquahala (5.0), Detrital Valley
(5.2), Agua Fria (5.3), Bill Williams (5.3),
Sacramento Valley and Tonto Basin (5.5), Big Sandy
(6.1), Butler Valley (6.4), Pinal Active Management
Area (6.4), Gila Valley (6.4), San Simon (6.5), San
Bernardino Valley (6.8), McMullen Valley (7.4),
Lake Mohave (7.8), and Ranegras Plain (8.3). 23
Oxygen and deuterium isotopes values were
characteristic of younger, enriched water that had
experienced considerable evaporation. This
conclusion is supported by their calcium-bicarbonate
chemistry which is characteristic of recently
recharged groundwater.19
Although younger,
enriched isotope samples have been collected in
limited areas in the Bill Williams, Butler Valley,
McMullen Valley, and Ranegras Plain basins, most
isotope samples collected in the western Arizona
basins were lighter and more depleted than would be
expected from recharge occurring at elevations in this
region. This suggests that much of the groundwater
was recharged long ago (8,000 to 12,000 years)
during cooler climatic conditions.11
Nitrogen Isotopes - Sources of nitrate in
groundwater may be distinguished by measuring two
stable isotopes of nitrogen, nitrogen-14 and nitrogen-
15, often represented as δ15
N. Although the
percentage of the two isotopes is nearly constant in
the atmosphere, certain chemical and physical
processes preferentially utilize one isotope, causing a
relative enrichment of the other isotope in the
remaining reactants. Because of these isotopic
fractionation processes, nitrate from various nitrogen
sources has been shown to have different nitrogen
isotope ratios. The δ15
N values have been cited as
ranging from +2 to +9 per mil (0/00) for natural soil
organic matter, -3 to +3 for inorganic fertilizer, and
+10 to +20 per mil for animal waste. 20, 22
Oxygen and Hydrogen Isotopes
Groundwater characterizations using oxygen and
hydrogen isotope data may be made with respect to
the climate and/or elevation where the water
originated, residence within the aquifer, and whether
or not the water was exposed to extensive
evaporation prior to collection.9
This is accomplished
by comparing oxygen-18 isotopes (δ 18
O) and
deuterium (δ D), an isotope of hydrogen, data to the
Global Meteoric Water Line (GMWL). The GMWL
is described by the linear equation:
δ D = 8 δ 18
O + 10
where δ D is deuterium in parts per thousand (per
mil, 0/00), 8 is the slope of the line, δ
18O is oxygen-18
0/00, and 10 is the y-intercept.
9 The GMWL is the
standard by which water samples are compared and is
a universal reference standard based on worldwide
precipitation without the effects of evaporation.
Isotopic data from a region may be plotted to create a
Local Meteoric Water Line (LMWL) which is
affected by varying climatic and geographic factors.
When the LMWL is compared to the GMWL,
inferences may be made about the origin or history of
the local water.9 The LMWL created by δ
18O and δ D
values for samples collected at sites in the Tiger
Wash basin plot mostly to the right of the GMWL.
Meteoric waters exposed to evaporation are enriched
and characteristically plot increasingly below and to
the right of the GMWL. Evaporation tends to
preferentially contain a higher percentage of lighter
isotopes in the vapor phase and causes the water that
remains behind to be isotopically heavier. In contrast,
meteoric waters that experience little evaporation are
depleted and tend to plot increasing to the left of the
GMWL and are isotopically lighter. 9
Groundwater from arid environments is typically
subject to evaporation, which enriches δ D and δ 18
O,
resulting in a lower slope value (usually between 3
and 6) as compared to the slope of 8 associated with
the GMWL.9
Groundwater samples for δ
15N analysis were
collected at five wells in the basin. The δ15
N values

26
ranged from +3.6 to +17.5 0/00 while nitrate values
ranged at these sites ranged from 2.2 to 5.9 mg/L
(Diagram 4).
Based on these isotope results, it appears that the
nitrogen source is natural soil organic matter for three
samples in which δ15
N values ranged from +3.6 to
+3.9 0/00. 20, 22 In two samples with δ15
N values of
11.9 and 17.5 0/00, it appears that animal waste is the
predominant contributor of nitrogen. The samples
were collected respectively from Pump Mine Well
and Tiger Well, both of which are frequently used by
livestock for watering purposes.
0 5 10 15 20
Delta Nitrogen-15 (0/00)
2
3
4
5
6
Nitr
ate
as N
itro
ge
n (
mg
/L)
1/2
3
4
5
6
Diagram 3 – The five isotope samples are
plotted according to their oxygen-18 and
deuterium values and form the Local
Meteoric Water Line. The samples all consist
of enriched samples that contain younger
water recharged from lower-elevation
precipitation that has undergone the most
evaporation prior to sampling.
This is in
contrast to most of the isotope samples
collected in nearby western Arizona
groundwater basins such as Butler Valley,
Harquahala, and Ranegras Plain. Samples
from these basins were mostly depleted and
consisted of older recharge that had
undergone less evaporation prior to sampling
and appeared to reflect groundwater
recharged during cooler climatic conditions.
11, 23, 24, 25
Diagram 4 – The five nitrogen isotope
samples are plotted along with their
corresponding nitrate (as N) concentrations.
Samples from three sites (TIG-4, TIG-5, and
TIG-6) appear to stem from natural soil
organic matter while nitrogen from animal
waste may impact the remaining two sites
(TIG-1/2 and TIG-3). 20, 22
However, these
categories didn’t appear to be accurate in the
adjacent Harquahala basin where most δ15
N
values corresponded with naturally
occurring soil organic matter yet there was a
strong statistical correlation between nitrate
concentrations and areas of irrigated
agriculture. 23
27
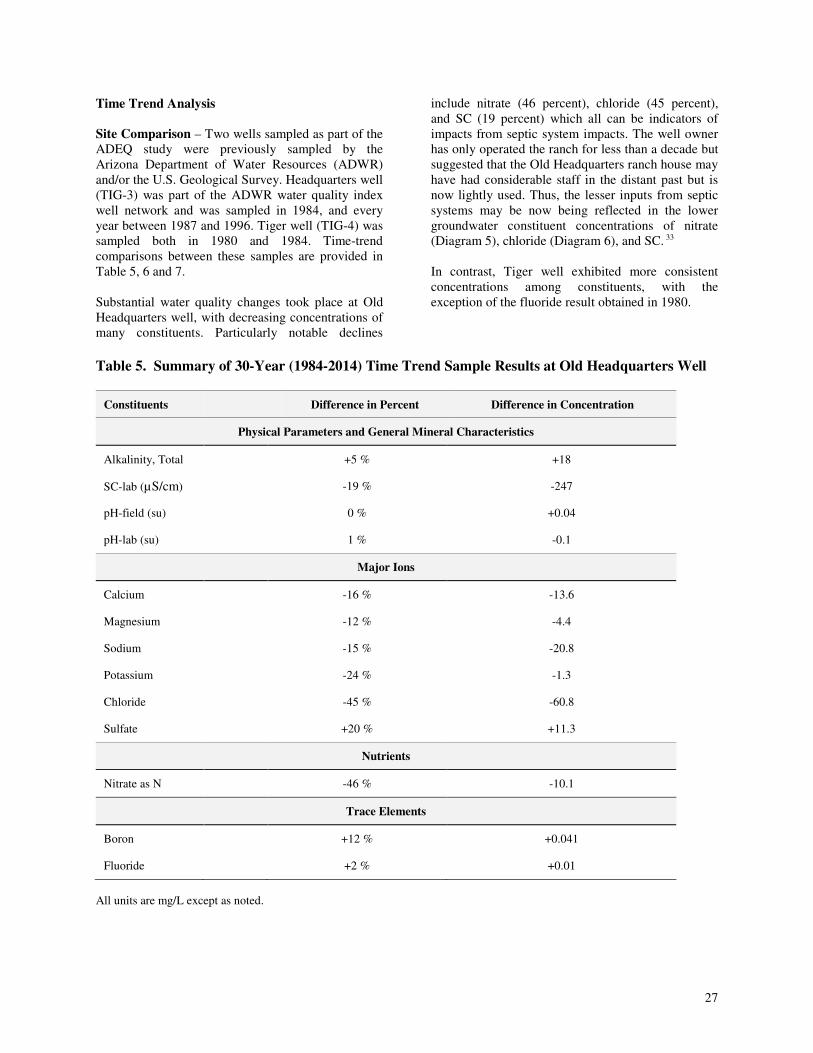
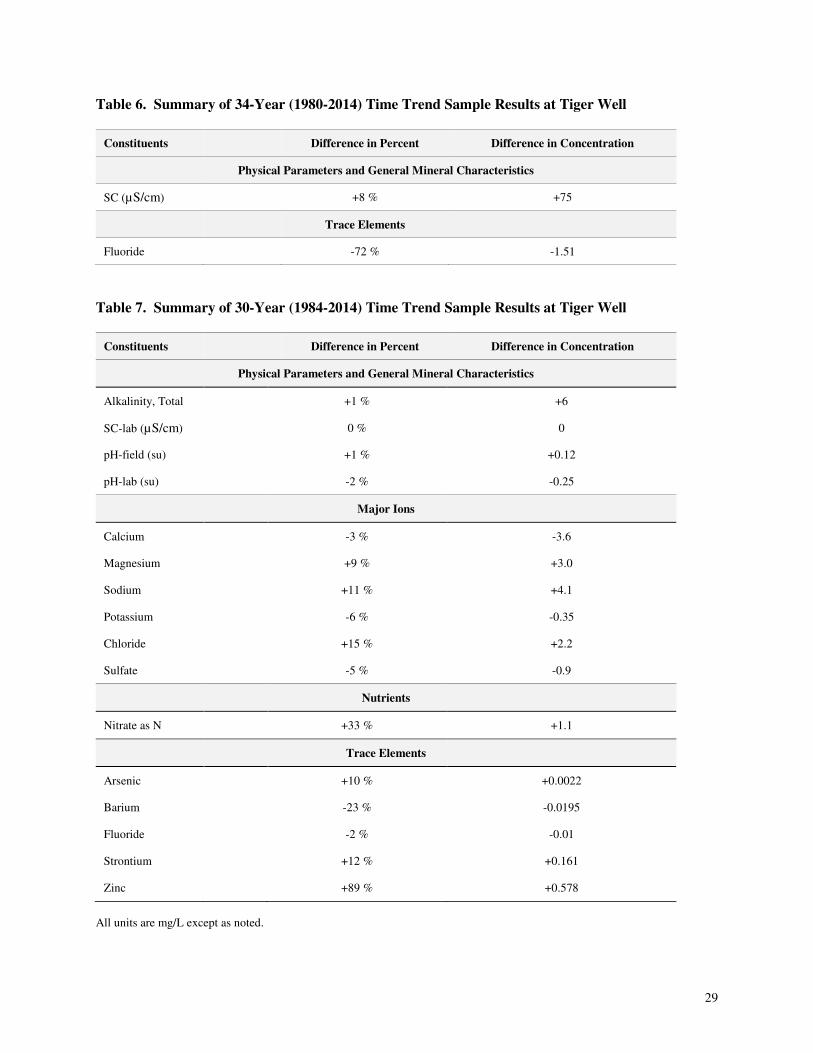
Time Trend Analysis
Site Comparison – Two wells sampled as part of the
ADEQ study were previously sampled by the
Arizona Department of Water Resources (ADWR)
and/or the U.S. Geological Survey. Headquarters well
(TIG-3) was part of the ADWR water quality index
well network and was sampled in 1984, and every
year between 1987 and 1996. Tiger well (TIG-4) was
sampled both in 1980 and 1984. Time-trend
comparisons between these samples are provided in
Table 5, 6 and 7.
Substantial water quality changes took place at Old
Headquarters well, with decreasing concentrations of
many constituents. Particularly notable declines
include nitrate (46 percent), chloride (45 percent),
and SC (19 percent) which all can be indicators of
impacts from septic system impacts. The well owner
has only operated the ranch for less than a decade but
suggested that the Old Headquarters ranch house may
have had considerable staff in the distant past but is
now lightly used. Thus, the lesser inputs from septic
systems may be now being reflected in the lower
groundwater constituent concentrations of nitrate
(Diagram 5), chloride (Diagram 6), and SC. 33
In contrast, Tiger well exhibited more consistent
concentrations among constituents, with the
exception of the fluoride result obtained in 1980.
Table 5. Summary of 30-Year (1984-2014) Time Trend Sample Results at Old Headquarters Well
Constituents Difference in Percent Difference in Concentration
Physical Parameters and General Mineral Characteristics
Alkalinity, Total +5 % +18
SC-lab (µS/cm) -19 % -247
pH-field (su) 0 % +0.04
pH-lab (su) 1 % -0.1
Major Ions
Calcium -16 % -13.6
Magnesium -12 % -4.4
Sodium -15 % -20.8
Potassium -24 % -1.3
Chloride -45 % -60.8
Sulfate +20 % +11.3
Nutrients
Nitrate as N -46 % -10.1
Trace Elements
Boron +12 % +0.041
Fluoride +2 % +0.01
All units are mg/L except as noted.

28
1984
1985
1986
1987
1988
1989
1990
1991
1992
1993
1994
1995
1996
1997
1998
1999
2000
2001
2002
2003
2004
2005
2006
2007
2008
2009
2010
2011
2012
2013
2014
Year Sampled
5
10
15
20N
itra
te a
s N
(m
g/L
)
1984
1985
1986
1987
1988
1989
1990
1991
1992
1993
1994
1995
1996
1997
1998
1999
2000
2001
2002
2003
2004
2005
2006
2007
2008
2009
2010
2011
2012
2013
2014
Year Sampled
30
40
50
60
70
80
90
100
Ch
lorid
e (
mg
/L)
Diagram 5 – Old Headquarters
well (TIG-3) was sampled 12
times over a 30-year period
from 1984 to 2014. The nitrate
(as N) concentrations have
declined 46 percent during this
time period, with the majority
of the decrease occurring 18-
year time period between 1996
and 2014.
Diagram 6 – Old Headquarters
well (TIG-3) was sampled 12
times over a 30-year period
from 1984 to 2014. The
chloride concentrations have
declined 45 percent during this
time period, with much of the
decrease occurring after 1993.
29
Table 6. Summary of 34-Year (1980-2014) Time Trend Sample Results at Tiger Well
Constituents Difference in Percent Difference in Concentration
Physical Parameters and General Mineral Characteristics
SC (µS/cm) +8 % +75
Trace Elements
Fluoride -72 % -1.51
Table 7. Summary of 30-Year (1984-2014) Time Trend Sample Results at Tiger Well
Constituents Difference in Percent Difference in Concentration
Physical Parameters and General Mineral Characteristics
Alkalinity, Total +1 % +6
SC-lab (µS/cm) 0 % 0
pH-field (su) +1 % +0.12
pH-lab (su) -2 % -0.25
Major Ions
Calcium -3 % -3.6
Magnesium +9 % +3.0
Sodium +11 % +4.1
Potassium -6 % -0.35
Chloride +15 % +2.2
Sulfate -5 % -0.9
Nutrients
Nitrate as N +33 % +1.1
Trace Elements
Arsenic +10 % +0.0022
Barium -23 % -0.0195
Fluoride -2 % -0.01
Strontium +12 % +0.161
Zinc +89 % +0.578
All units are mg/L except as noted.
30
DISCUSSION
Groundwater in the Tiger Wash basin is generally of
good quality with the exception of arsenic
concentrations. Of the five sites sampled, three had
arsenic concentrations that exceeded federal health-
based, Primary MCLs and one site exceeded the state
arsenic standard. Otherwise, all health and aesthetic
drinking water quality standards were met at all five
sites. Arsenic is the constituent that most commonly
exceeds health-based water quality standards in
Arizona.27
This trace element is likely naturally
occurring in the basin.
Arsenic concentrations are affected by reactions with
hydroxyl ions and are influenced by factors such as
an oxidizing environment, lithology, and aquifer
residence time.19
Oxygen and hydrogen isotope
values suggest that groundwater in the basin is
younger, enriched water that has experienced
considerable evaporation, so aquifer residence time
does not appear to be a major factor.11
Nearby basins Bill Williams, Butler Valley,
Harquahala, and Ranegras Plain have limited
groundwater sites that consist of younger, enriched
water. For the most part, enriched samples from these
sites do not have elevated concentrations of arsenic.
23, 24, 25, 26 This suggests that local lithology at the
three Tiger Wash sites which include granitic,
volcanic, and alluvial geology are a major factor in
creating elevated arsenic concentrations.
Limited time trend analysis involving two wells had
inconclusive results. Historic sampling results from
Tiger well (TIG-4) suggested generally steady
constituent concentrations including arsenic levels
which exceed the Primary MCL. Previous sample
results from Headquarters well (TIG-3), however,
indicated that concentrations of many constituents
decreased, some dramatically. Emblematic are nitrate
concentrations which were measured at 13 mg/L in
1996 and declined below the Primary MCL to 5.9
mg/L by 2014. Possible explanations for decreasing
constituent concentrations at Headquarters well
include less input from the onsite septic system. 33
REFERENCES
1 Accutest, 2014. Personal communication from Test
America staff.
2 Arizona Department of Environmental Quality, 1991.
Quality Assurance Project Plan: Arizona Department
of Environmental Quality Standards Unit, 209 p.
3 Arizona Department of Environmental Quality, 2013-
2014. Arizona Laws Relating to Environmental
Quality: St. Paul, Minnesota, West Group Publishing,
§49-221-224, p 134-137.
4 Arizona State Land Department, 1997. “Land Ownership
- Arizona” GIS coverage: Arizona Land Resource
Information Systems, downloaded, 9/10/14.
5 Arizona Department of Water Resources website, 2014.
www.azwater.gov/azdwr/default.aspx, accessed 08/12/14.
6 Arizona Water Resources Research Center, 1995. Field
Manual for Water-Quality Sampling: Tucson,
University of Arizona College of Agriculture, 51 p.
7 Bitton, G. and Gerba, C.P., 1994. Groundwater Pollution
Microbiology: Malabar, FL: Krieger Publishing
Company, 377 p.
8 Cook, D., 2009. “Toxic mine tailings no longer headed
for Iron King Mine,” Prescott Daily Courier: Prescott,
AZ, August 25,
www.dcourier.com/main.asp?SectionID=1&subsectio
nID=1&articleID=71736
9 Craig, H., 1961. Isotopic variations in meteoric waters.
Science, 133, pp. 1702-1703.
10 Crockett, J.K., 1995. Idaho statewide groundwater
quality monitoring program–Summary of results, 1991
through 1993: Idaho Department of Water Resources,
Water Information Bulletin No. 50, Part 2, p. 60.
11 Earman, Sam, et al, 2003. An investigation of the
properties of the San Bernardino groundwater basin,
Arizona and Sonora, Mexico: Hydrology program,
New Mexico Institute of Mining and Technology, 283
p.
5 12 Graf, Charles, 1990. An overview of groundwater
contamination in Arizona: Problems and principals:
Arizona Department of Environmental Quality
seminar, 21 p.
13 Heath, R.C., 1989. Basic ground-water hydrology: U.S.
Geological Survey Water-Supply Paper 2220, 84 p.

31
14 Hedley, J.D., 1990. Maps showing ground-water
conditions in the Harquahala Irrigation Non-
Expansion area and Tiger Wash basin, Maricopa and
La Paz Counties, Arizona—1989; Arizona Department
of Water Resources Hydrologic Map Series Report
Number 17, 3 sheets, scale, 1:250,000.
15 Hem, J.D., 1985. Study and interpretation of the
chemical characteristics of natural water [Third
edition]: U.S. Geological Survey Water-Supply Paper
2254, 264 p.
16 Lowry, J.D. and Lowry, S.B., 1988. “Radionuclides in
Drinking Waters,” in American Water Works
Association Journal, 80 (July), pp. 50-64.
17 Madison, R.J., and Brunett, J.O., 1984. Overview of the
occurrence of nitrate in ground water of the United
States, in National Water Summary 1984-Water
Quality Issues: U.S. Geological Survey Water Supply
Paper 2275, pp. 93-105.
18 Richard, S.M., Reynolds, S.J., Spencer, J.E. and
Pearthree, P.A., 2000. Geologic map of Arizona:
Arizona Geological Survey Map 35, scale
1:1,000,000.
19 Robertson, F.N., 1991. Geochemistry of ground water in
alluvial basins of Arizona and adjacent parts of
Nevada, New Mexico, and California: U.S. Geological
Survey Professional Paper 1406-C, 90 p.
20 Sustainability of Semi-Arid Hydrology and Riparian
Areas website,
http://web.sahra.arizona.edu/programs/isotopes/nitrog
en.html#2, accessed 9/10/14.
21 Test America, 2014. Personal communication from Test
America staff.
22 Thiros, S.A., Bexfield, L.M., Anning, D.W., and
Huntington, J.M., eds., 2010. Conceptual
understanding and groundwater quality of selected
basin-fill aquifers in the Southwestern United States:
U.S. Geological Professional Paper 1781, 288 p.
23 Towne, D.C., 2014. Ambient groundwater quality of the
Harquahala basin: a 2009-2014 baseline study:
Arizona Department of Environmental Quality Open
File Report 14-04, 62 p.
24 Towne, D.C., 2012. Ambient groundwater quality of the
Butler Valley basin: a 2008-2012 baseline study:
Arizona Department of Environmental Quality Open
File Report 12-06, 44 p.
25 Towne, D.C., 2011. Ambient groundwater quality of the
Ranegras Plain basin: a 2008-2011 baseline study:
Arizona Department of Environmental Quality Open
File Report 11-07, 63 p.
26 Towne, D.C., 2011. Ambient groundwater quality of the
Ranegras Plain basin: a 2008-2011 baseline study:
Arizona Department of Environmental Quality Open
File Report 11-07, 63 p.
27 Towne, Douglas and Jones, Jason, 2011. Groundwater
quality in Arizona: a 15 year overview of the ADEQ
ambient groundwater monitoring program (1995-
2009): Arizona Department of Environmental Quality
Open File Report 11-04, 22 p.
28 University of Arizona Environmental Isotope
Laboratory, 2014. Personal communication from
Christopher Eastoe.
29 U.S. Environmental Protection Agency website,
www.epa.gov/waterscience/criteria/humanhealth/,
accessed 9/10/14.
30 U.S. Environmental Protection Agency website,
http://water.epa.gov/lawsregs/rulesregs/sdwa/radon/re
gulations.cfm, accessed 9/10/14.
31 U.S. Salinity Laboratory, 1954. Diagnosis and
improvement of saline and alkali soils: U.S.
Department of Agriculture, Agricultural Research
Service, Agriculture Handbook No. 60, 160 p.
32 Wilkinson, L., and Hill, M.A., 1996. Using Systat 6.0
for Windows, Systat: Evanston, Illinois, p. 71-275.
33 Overson, Clayton, 2014. Personal communication from
ranch owner, 10/8/14.

32
Appendix A. Data for Sample Sites, Tiger Wash Basin, 2014
Site # Cadastral /
Pump Type Latitude -
Longitude ADWR # ADEQ # Site
Name Samples
Collected Well
Depth Water
Depth Year Drilled
1st Field Trip, January 17, 2014 – Towne
TIG-1/2
split B(5-9)03cca
submersible 33°48'02.034"
113°11'25.783" 612680 18403 Pump Mine
Well
Inorganic, Radiochem
Radon, O,H, N isotope - -
TIG-3 B(5-9)02bbd
windmill 33°48'30.197"
113°10'27.792" 612682 18402 HQ
Windmill Inorganic, Radon
O,H & N Isotopes 400’ 200’
TIG-4 B(5-9)19bdd
windmill 33°45'44.927"
113°14'22.620" 612691 18398 Tiger
Windmill Inorganic
O,H & N Isotopes 235’ 90’
2nd Field Trip, February 10 & 11, 2014 – Towne & Boettcher & Dickens
TIG-5 B(5-9)34acb
windmill 33°44'00.870"
113°11'07.114" 612689 18401 Little Horn
Windmill
Inorganic, Radiochem
Radon, O,H, N isotope 360’ 250’
TIG-6 B(5-9)23bdd
windmill 33°45'43.224"
113°10'05.423" 612690 18399 Pegrin
Windmill Inorganic
O,H & N Isotopes 520’ 180’
Appendix B. Groundwater Quality Data, Tiger Wash Basin, 2014
Site # MCL
Exceedances
Temp
(oC)
pH-field
(su)
pH-lab
(su)
SC-field
(µS/cm)
SC-lab
(µS/cm)
TDS-field
(mg/L)
TDS-lab
(mg/L)
Hard
(mg/L)
Turb
(ntu)
TIG-1/2 22.3 7.58 7.58 420 441 273 279.5 222 2.75
TIG-3 20.9 7.74 7.70 528 538 341 304 153 8.9
TIG-4 As 19.3 7.32 7.15 472 495 307 286 224 ND
TIG-5 As 24.8 7.64 7.88 526 540 318 333 240 ND
TIG-6 As 24.5 7.92 8.19 345 284 224 215 126 ND
italics = constituent exceeded holding time
bold = constituent concentration exceeded Primary or Secondary Maximum Contaminant Level
Appendix B. Groundwater Quality Data, Tiger Wash Basin, 2014--Continued
Site # Calcium (mg/L)
Magnesium (mg/L)
Sodium (mg/L)
Potassium (mg/L)
T. Alk (mg/L)
Bicarbonate (mg/L)
Carbonate Alk (mg/L)
Hydroxide
Alk (mg/L) Chloride (mg/L)
Sulfate (mg/L)
TIG-1/2 53.5 20.6 17.25 2.12 229 279 ND ND 5.45 6.5
TIG-3 35.4 15.6 57.2 2.17 174 212 ND ND 37.2 34.3
TIG-4 58.4 19.0 20.1 2.75 250 305 ND ND 8.7 8.3
TIG-5 43.8 31.7 33.2 1.88 228 278 ND ND 20 12.1
TIG-6 18.9 19.1 23.1 1.01 192 234 ND ND 7.8 4.5
bold = constituent concentration exceeded Primary or Secondary Maximum Contaminant Level
33
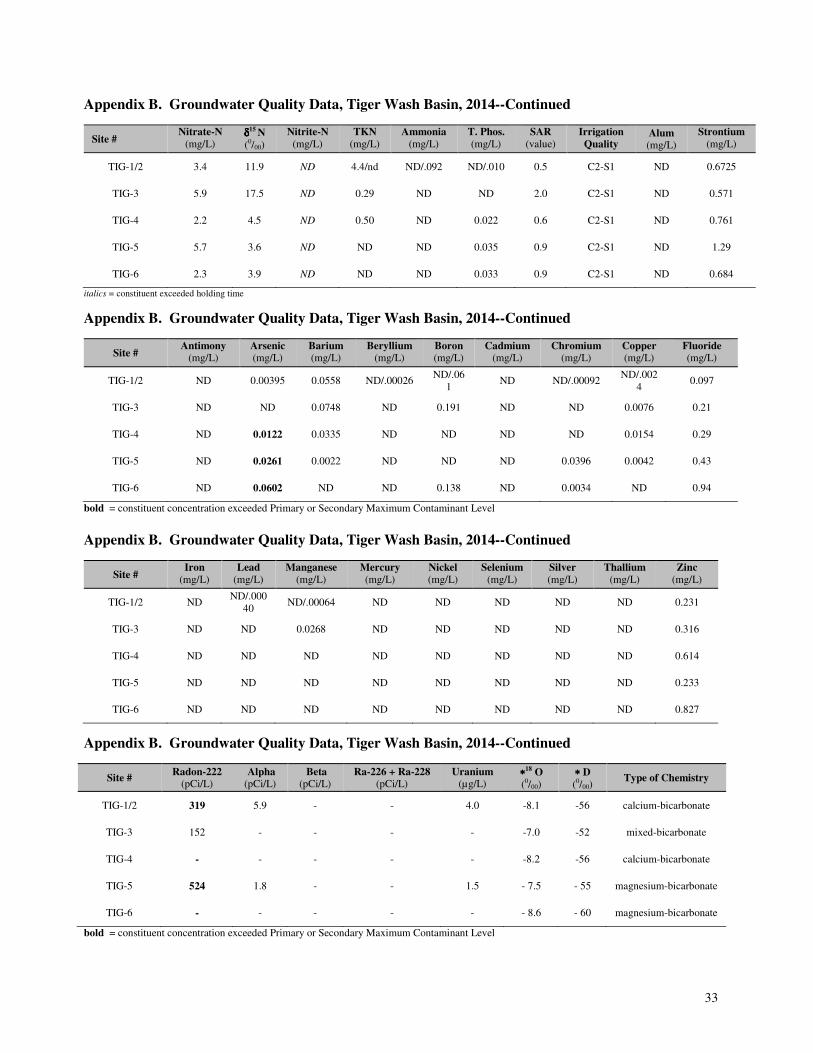
Appendix B. Groundwater Quality Data, Tiger Wash Basin, 2014--Continued
Site # Nitrate-N
(mg/L) δδδδ
15 N
(0/00)
Nitrite-N
(mg/L)
TKN
(mg/L)
Ammonia
(mg/L)
T. Phos.
(mg/L)
SAR
(value)
Irrigation
Quality Alum (mg/L)
Strontium
(mg/L)
TIG-1/2 3.4 11.9 ND 4.4/nd ND/.092 ND/.010 0.5 C2-S1 ND 0.6725
TIG-3 5.9 17.5 ND 0.29 ND ND 2.0 C2-S1 ND 0.571
TIG-4 2.2 4.5 ND 0.50 ND 0.022 0.6 C2-S1 ND 0.761
TIG-5 5.7 3.6 ND ND ND 0.035 0.9 C2-S1 ND 1.29
TIG-6 2.3 3.9 ND ND ND 0.033 0.9 C2-S1 ND 0.684
italics = constituent exceeded holding time
Appendix B. Groundwater Quality Data, Tiger Wash Basin, 2014--Continued
Site # Antimony
(mg/L) Arsenic (mg/L)
Barium (mg/L)
Beryllium (mg/L)
Boron (mg/L)
Cadmium (mg/L)
Chromium (mg/L)
Copper (mg/L)
Fluoride (mg/L)
TIG-1/2 ND 0.00395 0.0558 ND/.00026 ND/.06
1 ND ND/.00092
ND/.002
4 0.097
TIG-3 ND ND 0.0748 ND 0.191 ND ND 0.0076 0.21
TIG-4 ND 0.0122 0.0335 ND ND ND ND 0.0154 0.29
TIG-5 ND 0.0261 0.0022 ND ND ND 0.0396 0.0042 0.43
TIG-6 ND 0.0602 ND ND 0.138 ND 0.0034 ND 0.94
bold = constituent concentration exceeded Primary or Secondary Maximum Contaminant Level
Appendix B. Groundwater Quality Data, Tiger Wash Basin, 2014--Continued
Site # Iron
(mg/L)
Lead
(mg/L)
Manganese
(mg/L)
Mercury
(mg/L)
Nickel
(mg/L)
Selenium
(mg/L)
Silver
(mg/L)
Thallium
(mg/L)
Zinc
(mg/L)
TIG-1/2 ND ND/.000
40 ND/.00064 ND ND ND ND ND 0.231
TIG-3 ND ND 0.0268 ND ND ND ND ND 0.316
TIG-4 ND ND ND ND ND ND ND ND 0.614
TIG-5 ND ND ND ND ND ND ND ND 0.233
TIG-6 ND ND ND ND ND ND ND ND 0.827
Appendix B. Groundwater Quality Data, Tiger Wash Basin, 2014--Continued
Site # Radon-222 (pCi/L)
Alpha (pCi/L)
Beta (pCi/L)
Ra-226 + Ra-228 (pCi/L)
Uranium (µg/L)
∗∗∗∗18 O
(0/00) ∗∗∗∗ D
(0/00) Type of Chemistry
TIG-1/2 319 5.9 - - 4.0 -8.1 -56 calcium-bicarbonate
TIG-3 152 - - - - -7.0 -52 mixed-bicarbonate
TIG-4 - - - - - -8.2 -56 calcium-bicarbonate
TIG-5 524 1.8 - - 1.5 - 7.5 - 55 magnesium-bicarbonate
TIG-6 - - - - - - 8.6 - 60 magnesium-bicarbonate
bold = constituent concentration exceeded Primary or Secondary Maximum Contaminant Level