
1
Agent Network Accelerator Survey: Tanzania Country Report 2013
April, 2014
Contributing Authors: Mike McCaffrey, Leena Anthony, Annabel Lee, Kimathi Githachuri, Graham A. N. Wright

2
Through the financial support of the Bill & Melinda Gates Foundation, MicroSave is conducting a four-year research project in the following eight focus countries as
part of the Agent Network Accelerator (ANA) Project:
Research findings are disseminated through The Helix Institute of Digital Finance. Helix is a world-class institution providing operational training for
digital finance practitioners.
Bangladesh India Indonesia Pakistan
Kenya Nigeria Tanzania Uganda
Africa Asia
Project Description

3
The research focuses on operational determinants of success in agent network management, specifically:
Focus of Research
Quality of Provider Support
Agent & Agency
Demographics
Core Agency Operations
Liquidity Management
Business Model Viability

4
Key Providers**
Location Exclusivity
A B C
572 197 297
444 180 426
Non-Dar es Salaam
Urban
Dar es Salaam
Non-Dedicated
Rural Non-
Exclusive Exclusive Dedicated
934 256 358
Dedication
572 144 182
895 25 66
1055 555 900
1378 383 669
Sample Profile*
The Research Is Based On 2,052 Nationally Representative Agent Interviews
484, 24%
974, 47%
594, 29%
Achieved Sample
Dar es Salaam Non-Dar es Salaam Urban Rural
Red points represent agents Brand Fusion found in 2012 when it collected geo-spatial coordinates of mobile money agents. Blue ones are the ones interviewed for this research.
*Note this table shows results only for the top three providers. Numbers in this table sum to 3,496 as they represent all providers served by agents. i.e. if an interview was done with an agent serving three providers, it is counted three times in this table. ** Provider names have been anonymized to maintain confidentiality.
Data collection occurred in July/August 2013, using a random route methodology based on the displayed agent census.

5
Different players in the ecosystem are offering novel solutions
for liquidity management, and providers need to assess what is working best and scale it up.
Agent support indicators are higher than in Uganda. Providers are
increasingly looking towards financial products and merchant payments to differentiate their offering.
Agents are overwhelmingly profitable, with healthy transaction rates. The three aggressively expanding providers, and the non-exclusivity of agents is putting pressure on liquidity. It is also driving low operational
costs and a focus on agent support (relative to Uganda).
Tanzania Overview
6
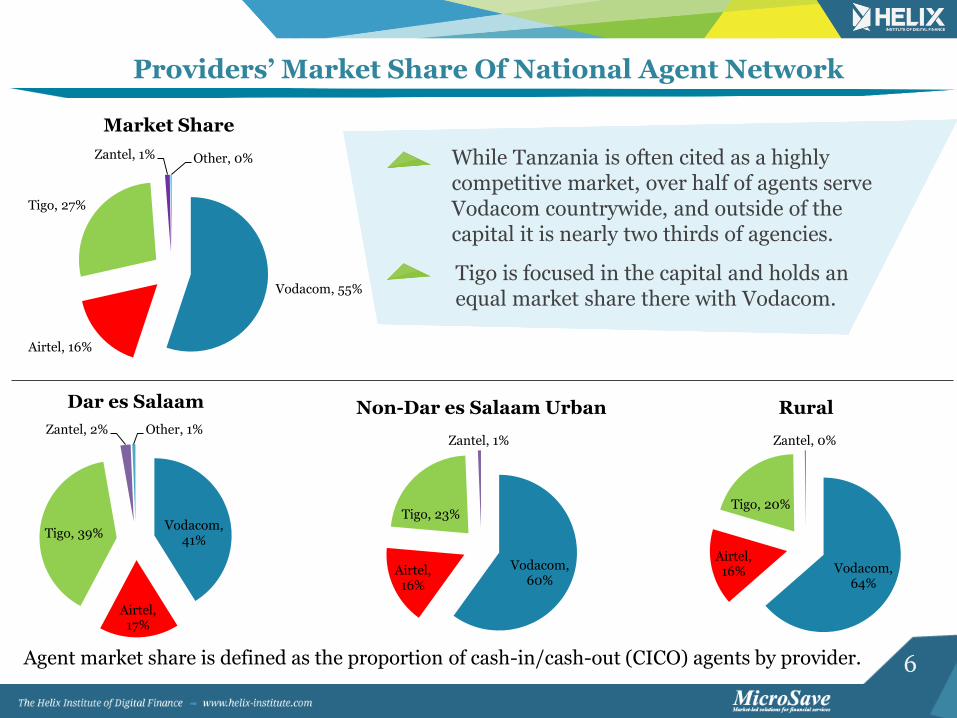
Vodacom, 55%
Airtel, 16%
Tigo, 27%
Zantel, 1% Other, 0%
Market Share
Vodacom, 41%
Airtel, 17%
Tigo, 39%
Zantel, 2% Other, 1%
Dar es Salaam
Agent market share is defined as the proportion of cash-in/cash-out (CICO) agents by provider.
Providers’ Market Share Of National Agent Network
Vodacom, 60%
Airtel, 16%
Tigo, 23%
Zantel, 1%
Non-Dar es Salaam Urban
Vodacom, 64%
Airtel, 16%
Tigo, 20%
Zantel, 0%
Rural
While Tanzania is often cited as a highly competitive market, over half of agents serve Vodacom countrywide, and outside of the capital it is nearly two thirds of agencies.
Tigo is focused in the capital and holds an equal market share there with Vodacom.

7
0%
5%
10%
15%
20%
25%
30%
1-10
11-20
21-3
0
31-4
0
41-5
0
51-6
0
61-7
0
71-8
0
81-9
0
91-10
0
101-110
111-120
121-13
0
130
+
Pe
rc
en
t o
f R
es
po
nd
en
ts
Number of Transactions
Transactions Per Day
Dar es Salaam Non-Dar es Salaam Urban Rural Total
The most common band is 21-30 transactions per day.
This is slightly higher than the frequency in Uganda (30), yet lower than that
of Kenya (46).
It is intriguing that outside the capital, urban and rural areas are reporting similar
transaction volumes, whereas one would expect
the lower population density in rural areas would result
in lower volumes.
Daily Transaction Levels* Show A Healthy Business For Agents
Median Transactions Per Day
Dar es Salaam 35
Non-Dar es Salaam Urban
30
Rural 32
Total 31
* Numbers represent transactions per day by selected provider, not overall volumes for the agency.

8
Largest Stated Barriers To Daily Transactions*
0
1
2
3
4
5
6
Too many otheragents competing
for business
Too often haveonly either cash or
e-float when theclient is asking for
other
Lack of resourcesto buy enough
float
Doing morebusiness meanstoo much morerisk of fraud or
robbery
Lack of awarenessof service among
potentialcustomers in the
area
Individual clientsdemand for
service is not veryregular
Too busy to doanymore business(already have lines
of clients)
Ra
nk
s
Some agents seem like they were poorly
selected, and will not survive, while others
with potential might put to use targeted support.
Liquidity issues are being driven by non-exclusivity of agents (forcing
agents to manage multiple liquidity pools) and agents’ apathetic
approach to float management.
Rapid expansion of networks is reportedly decreasing
activity per agent.
* These scores are weighed averages of rankings, so that higher scores represent dimensions receiving a higher ranking.

9
36%
100% 97%
23%
5% % % % 1% 1%
0%
20%
40%
60%
80%
100%
120%
Acco
un
t op
enin
g
Ca
sh-in
(dep
osit)
Ca
sh-o
ut (w
ithd
raw
als)
Mo
ney
tran
sfer
Bill p
ay
men
ts
Airtim
e to
p-u
p
Cred
it
Insu
ran
ce
Sa
vin
gs d
ep
osits to
ab
an
k
Welfa
re/S
ocia
lp
ay
men
ts
Pe
rc
en
t o
f R
es
po
nd
en
ts
Products and Services
Products And Services Offered In The Country
Sophisticated financial services have yet to be offered in Tanzania on any meaningful scale from the
agents or through handsets.
Only about a third of agents are contributing
to client growth. This indicates a
high level of agent-assisted
Over the Counter Transactions
(Direct Deposits).
The Lack Of Offerings Means Potential For Product Innovation

10
%
5%
10%
15%
20%
25%
30%
35%
40%
Real time(0-15 mins)
Less than anhour
One to threehours
Four to sixhours
Seven hoursto one day
One to twodays
More than2 days butless than a
week
One week Don’t know/ Can’t
say
Pe
rc
en
t o
f R
es
po
nd
en
ts
Customer Account Activation Time
Only a third of agents report clients can register
and use the service immediately. This was an
issue for all providers.
In general, agents report this process takes too long, and they are
unclear on the commission they gain from it.
By this time the customer is much more likely to never become
active.
Customer Activation Time A Serious Issue

11
0%
5%
10%
15%
20%
25%
30%
Ma
kin
g lo
sses
Bre
ak
ing
even
1-50
51-10
0
101-15
0
151-2
00
20
1-25
0
25
1-30
0
30
1-35
0
35
1-40
0
40
1-45
0
45
1-50
0
50
1-55
0
55
1-60
0
60
1-65
0
65
1-70
0
70
1-75
0
75
1-80
0
85
1-90
0
90
1-95
0
>9
50
Pe
rc
en
t o
f R
es
po
nd
en
ts
Profit (In US$)
Profit Per Month
Dar es Salaam Non-Dar es Salaam Urban Rural Total
Agents Are Overwhelmingly Profitable*
* Is calculated by subtracting expenses from total earnings from all the providers served.
49% of agents are earning at least $US 100 per month in
profits, compared to only 40% in Uganda.
Tanzania actually has a lower median revenue than Uganda, but higher overall profitability
due to low operational expenses (OpEx).
Median Monthly Profit (US$)
Dar es Salaam 115
Non-Dar es Salaam Urban 95
Rural 95
Tanzania Median 95
Only 4 % agents are making a loss as compared to 11% in Uganda

12
Risk Of Fraud Most Burdensome To Agents’ Business*
0
1
2
3
4
5
6
7
Risk of fraud Dealing withcustomer servicewhen something
goes wrong
Time spentteaching
customers aboutthe product
Threat of Armedrobbery
Not makingenough moneyto cover costs
Time spent onfloat
management
Time spent intraining from
service provider
Ra
nk
Biggest Operational Issues
Tanzanians have a high amount of awareness about digital finance, but still need
support understanding it.
Support is still not adequate when there are
issues like reversals.
This is the number one burden across East Africa.
* These scores are weighed averages of rankings, so that higher scores represent dimensions receiving a higher ranking.

13
95 96
106
79
63
134
0
20
40
60
80
100
120
140
160
Male Female Dedicated Non-Dedicated Exclusive Non-Exclusive
Me
dia
n P
ro
fit
US
$
2% 113%
34%
Comparison of Median Profits* By Existing Dimensions
Dedicated agents only perform CICO services and sometimes also sell
airtime. They are significantly more
profitable than agents who also run other
businesses.
Non-exclusive agents serve multiple providers, so it is
expected that this value should be higher, but the
large magnitude of the difference was unexpected.
Female profits are only 2% greater than male’s,
indicating a more equitable market as
compared to Uganda where males earn 53%
more than females.
* Is calculated by subtracting expenses from total earnings from all the providers served.

14
Profitability Across Tanzania
Profitability is lowest in the sparsely populated center of the country, however, in Tanzania this reportedly fluctuates with the harvest season. It is still unclear if the centre of the country does not have a viable business model, or if providers just have not figured it out yet.
Profit Levels in US$ Dar es Salaam

15
112
95 95
114
0
20
40
60
80
100
120
0 1 2 3
Me
dia
n P
ro
fit
(US
$)
Agency Years of Operation
Impact Of Age Of Agency On Profitability
Median Profits* Drop After The First Year Of Operation
+
In Uganda profits were greater for agents that had been in the business longer, but in Tanzania the youngest and oldest agencies seem to be most
profitable.
* Is calculated by subtracting expenses from total earnings from all the providers served.

16
79% Of Agencies Have Been Operating For One Year Or Less
Less Than One Year, 49%
One Year, 30%
Two Years, 14%
Three Years, 7%
Age* Distribution Of Agencies Major providers all report aggressively growing their agent networks, and therefore there are many new agents in the market.
However 70% of agents interviewed reported they thought they would continue with the business next year, so the small percentage of agencies over two years old probably represents a high-level of agency turnover as well.
* Age here is defined as when the agency was opened irrespective of the providers served. Also note that 9% of respondents have been excluded from the analysis as they did not accurately remember age.

17
133
124 126 126
0
20
40
60
80
100
120
140
Dar es Salaam Non-Dar es Salaam Urban Rural Total
Me
dia
n R
ev
en
ue
(U
S$
)
Median Revenue In US$
Total monthly revenue from all providers is highest in Dar es Salaam and equal to the GNI per capita. This is primarily because of the dominance of
non-exclusive agents.
Outside of Dar, Agents Are Earning* Marginally Less Than The Average GNI Per Capita
Monthly GNI per capita = US$133
* Total monthly revenue reported here pertain to all providers being served. Therefore for non-exclusive agencies, their revenue is reported here with regards to all the providers they serve.

18
0%
10%
20%
30%
40%
50%
60%
0-19 20 - 39 40 - 59 60 - 79 80 - 99 100 - 119 120 - 139 140 - 159 160 - 179 180 - 199 200+
Pe
rc
en
t o
f R
es
po
nd
en
ts
Operational Expenses (in US$)
Dar es Salaam Non-Dar es Salaam Urban Rural Total
Almost half of agencies report operational expenses under
$US20 per month.
OpEx in Dar es Salaam is 28% higher than in rural
areas.
Agents Report Low Operational Expenses Across The Country
Median:
Dar es Salaam: 32 US$ Non-Dar es Salaam Urban: 19 US$ Rural: 25 US$ Total: 25 US$
Operational Expenses Per Month
* The OpEx reported is for the entire agency and not for a particular provider.

19
84%
45%
38%
52%
0%
10%
20%
30%
40%
50%
60%
70%
80%
90%
Dar es Salaam Non-Dar es Salaam Urban Rural Total
Pe
rc
en
t o
f R
es
po
nd
en
ts
Exclusive Non-Exclusive
84% of agencies in Dar are serving more than one provider.
We expect non-exclusivity to increase significantly, as subsequent providers
expand across the country.
Vodacom still has the most dispersed network, making exclusivity more
prominent for now.
Overall Agents Are Non-Exclusive, But It Varies By Area
Exclusivity Of Agents By Location

20
Cash, 15%
E-float, 20% About the same, 66%
Non-Dar es Salaam Urban
Agents Predominantly Report A Balanced Need For E-Float & Cash
Cash, 15%
E-float, 25%
About the same, 60%
Dar es Salaam
Cash, 20%
E-float, 23% About the same, 57%
Rural
Cash, 16%
E-float, 22% About the same, 62%
Total
Qualitative research shows agents take an apathetic approach to float management, preferring to wait in the shop until a customer makes a transaction which gives them the needed liquidity. It is surprising that there is not a higher demand for cash in rural areas, as it is expected that e-float is generally sent from urban to rural areas, and then withdrawn as cash. This needs further exploration.

21
%
5%
10%
15%
20%
25%
30%
35%
40%
45%
1-5
6-10
11-15
16-2
0
21-2
5
26
-30
31-3
5
36
-40
41-4
5
46
-50
56
-60
71-7
5
76
-80
86
-90
96
-100
121-12
5
146
-150
Pe
rc
en
t o
f R
es
po
nd
en
ts
Time in Minutes
Time Taken To Nearest Rebalance Point
Dar es Salaam Non-Dar es Salaam Urban Rural Total
It is notable that travel time in Dar is equivalent to that in rural areas, likely
attributable to traffic in the capital, and selective agent placement near rebalance points in rural areas.
6% of agents responses were not included here as they reported
they did not travel to rebalance.
Rebalancing Is Easy For Agents In Terms Of Time And Money
Agents tend to pay little or nothing to rebalance: 81% have costs of less than US$1
Median Time Taken To Reach Rebalance Point (In
Minutes)
Dar es Salaam 15
Non-Dar es Salaam Urban
10
Rural 15
Tanzania 10
69% of agents take 15 minutes or less to reach their rebalance point.

22
Agents Make Cash Withdrawals Three Times A Month
15%
16% 16%
12%
7% 7%
3%
2%
3%
1%
5%
0%
2%
0% 0%
3%
0% 1% 0%
2%
0% 0% 0% 0% 0%
2% 2%
0%
2%
4%
6%
8%
10%
12%
14%
16%
18%
20%
0 1 2 3 4 5 6 7 8 9 10 11 12 13 14 15 16 18 19 20
22
23
24
25
26
30
Mo
re tha
n 3
0
Pe
rc
en
t o
f R
es
po
nd
en
ts
Number of Withdrawals
Monthly Cash Withdrawals For Rebalancing
Dar es salaam Non-Dar es salaam Urban Rural Total
Two thirds of agents withdraw cash only once
a week or less.
Under five percent of agents are withdrawing at least once a day.
Median Monthly Cash Withdrawals For
Rebalancing
Dar es Salaam 3
Non-Dar es Salaam Urban
3
Rural 3
Tanzania 3

23
Five Transactions Are Denied Each Day Due To Lack Of Float
Median: Dar es Salaam: 4.5 Non-Dar es Salaam Urban: 4 Rural: 5
National: 5
20%
2%
9%
12%
6%
20%
6%
3%
5%
1%
9%
7%
0%
5%
10%
15%
20%
25%
0 1 2 3 4 5 6 7 8 9 10 Morethan 10
Pe
rc
en
t o
f R
es
po
nd
en
ts
Number of Transactions per Day
Transactions Denied Due To Unavailability Of Float
Five transactions a day represents 14% of average volumes potentially lost
every day.
In Uganda three transactions a day (median) are reported lost due to lack
of float.
In Tanzania, silo-ed e-float at non-
exclusive agents really puts pressure on e-float liquidity.

24
Greater Provider Support Can Address Highly Ranked Issues*
0.00
0.50
1.00
1.50
2.00
2.50
3.00
3.50
4.00
4.50
5.00
Have to shutstore to go get
more float
Unpredictablefluctuations inclient demand
Time taken atrebalance point
is too long
Travel time torebalance point
is too long
Lack resources ingeneral to buy a
sufficientamount that will
last
Rebalance pointsoften do not have
cash/float
The costincurred is toomuch to do it
frequently
Some master agents are now doing float delivery.
Rebalance points are close, but usually involve waiting in line in a
crowded bank.
A greater array of products offerings could help smooth these fluctuations, and hopefully
with providers implementing platform upgrades, this will soon become a reality.
Ra
nk
* These scores are weighed averages of rankings, so that higher scores represent dimensions receiving a higher ranking.
Greatest Impediments To Float Management Reported By Agents

25 Source: Qualitative discussions in Tanzania
The prevalence of non-exclusivity puts pressure on float management as almost all agents hold e-float for multiple providers and these e-
float balances are still difficult to exchange across providers.
Informal Innovation In Float Management
• Deliver float to agents on demand for a fee
• Will hold multiple e-currencies & offer exchange for a fee
• Will send cash to an ATM nearby the agent
• Make informal deals with surrounding retailors
• Make informal deals with surrounding agents (49% of agents reported doing this)
• Call trusted agents to see who has float, have the customer enter the other agent’s till number, and then agents settle the loan later
Solutions are Self-Manifesting
Master Agent Level
Agent Level

26
Training 79% report receiving training 61% from a provider 41% from master agent 7% from an employer 55% of agents have never undergone refresher training
Operational Support: 76% of agents report being visited. Of those visited about three quarters were visited directly by the provider with a frequency of at least once a month.
The Quality Of Agent Support Is High, But There Are Targeted Areas For Improvement
Call Centre: 91% of agents were aware of a call centre and rated it a 5 out of 7 in terms of its ability to resolve their issues.

27 Source: Qualitative discussions around Tanzania
Sales teams visit agents to provide monitoring and support. They are either directly employed or contracted by the provider.
Comments On The Quality Of Agent Support
Flagship stores only operate 9am-5pm, so they are never open
during the weekends and evenings when
you need them most.
We need a dedicated agent helpline,
separate from the customer line.
Geographies are too broad for sales teams to supervise my float
balances.
Master agents don’t support, they take our commissions.
Fraud is common, but if we just knew
how to be more cautious, we could
overcome it.
Sales teams don’t have the tools to help
with issues like reversals, so I have to
call customer care, but can’t always get
through.

28
Recurrent Service Downtime Is Affecting Transaction Levels
Unreliable service is a challenge for most agents:
82% of agents report having experienced downtime in
the past.
Only 13% of agents report receiving prior warning
about downtime, however two thirds report that
information given is inaccurate.
There is a great reported variation per provider on
amount of transactions lost per occurrence of server
downtime with the median reported to be 10
transactions.

29
Transaction levels are high, and operational costs are low, meaning on average almost all agents are profitable.
This profit, and the exuberance of providers,
is spurring innovation and pushing the networks forward.
There are a couple of areas for improvement, but on average the quality of agent support seems high.
Outstanding Attributes Of Agent Network Management
Tanzania is pioneering a model in East Africa, where providers share agents. It is moving ahead profitably, and showing that this distinctive model can work, which is important as it will probably be the norm elsewhere in the near future.

30
Opportunities For Improvement
Competition at the agent level does seem to be resulting in better support than in countries like Uganda. However, the vast
geography and low population density makes operationalising it a difficult proposition:
Agents handling multiple providers have to hold many different e-
currencies which are not easily exchangeable, limiting liquidity.
Lack of product diversity – airtime and bill pay are done on the handset. Sophisticated financial services are still not offered.
Large challenges on fraud at the agent level.
Centralized customer service support does not always arrive in time when working across broad geographies.
Most Tanzanians still do not have IDs, making registrations at the agent level much harder, direct deposits inevitable, and KYC
compliance difficult at best.
High incidents of new agencies that will need support, and a low incidence of old agencies suggesting a very short agent life-cycle.
Most agents are close to rebalancing points indicating a limited geographical expansion beyond bank branches.

31
Thank You
www.helix-institute.com
Helix Institute
Helix Institute of Digital Finance


