download - crawford school of public policy - australian national
TRANSCRIPT

Kazuki Onji
ASIA PAcIfIc EcOnOmIc PAPErS No. 382, 2009
A TALE OF PORK PRICES: EVASION AND ATTENUATION OF A JAPANESE TARIFF
AuStrAlIA–JAPAn rESEArch cEntrE
Anu cOllEgE Of ASIA & thE PAcIfIc
crAwfOrd SchOOl Of EcOnOmIcS And gOvErnmEnt


A tale of pork prices: evasion and attenuation of a Japanese tariff
Kazuki Onji*
ASIA PAcIfIc EcOnOmIc PAPEr nO. 382
2009
AuStrAlIA–JAPAn rESEArch cEntrEcrAwfOrd SchOOl Of EcOnOmIcS & gOvErnmEnt
Anu cOllEgE Of ASIA And thE PAcIfIc

II
© KazuKi Onji, 2009.
This work is copyright. Apart from those uses which may be permitted under the Copy-right Act 1968 as amended, no part may be reproduced by any process without written permission.
Asia Pacific Economic Papers are published under the direction of the Editorial Com-mittee of the Australia–Japan Research Centre (AJRC). Members of the Editorial Com-mittee are:
Professor Jenny Corbett Executive Director Australia–Japan Research Centre The Australian National University, Canberra Professor Emeritus Peter Drysdale Crawford School of Economics and Government The Australian National University, Canberra Professor Christopher Findlay Professor of Economics University of Adelaide Adelaide, South Australia Professor Stuart Harris Department of International Relations The Australian National University, Canberra Dr Kazuki Onji Crawford School of Economics and Government The Australian National University, Canberra Papers submitted for publication in this series are subject to double-blind external review by two referees.The views expressed in APEPs are those of the individual authors and do not represent the views of the Australia–Japan Research Centre, the Crawford School, or the institutions to which authors are attached.
The Australia–Japan Research Centre is part of the Crawford School of Economics and Government, The Australian National University, Canberra. iSSn 0 728 8409 iSBn 978-0-86413-336-6 auStralia–japan reSearch centre crawfOrd SchOOl Of ecOnOmicS and GOvernment the auStralian natiOnal univerSity canBerra act 0200 telephOne: (61 2) 6125 3780 facSimile: (61 2) 6125 0767 e-mail: [email protected] url: http://www.crawfOrd.anu.edu.au

a tale Of pOrK priceS: evaSiOn and attenuatiOn Of a japaneSe tariff
This paper empirically examines the effectiveness of a safeguard tariff in the Japanese market for imported pork parts. The goals are, first, to consider a refinement to the traditional market-based method for evasion detection, and, second, to apply the method in a setting where evasion is suspected to be widespread. Utilising a within-pig variation in tariff burdens and the timing of safeguard invocations, I examine a panel of monthly wholesale prices on narrowly-defined pork products from 2001 through 2008. The results are consistent with a hypothesis that a widespread evasion nullified the safeguard tariff on pork, and are robust to a range of alternative explanations including the adjustment of profit margins by traders. Safeguard tariffs appear to be a simple mechanism, but behavioural responses can undo the policy intent.Keywords: safeguard tariff, price disparity, tax incidenceJEL Classification: H26, H22, F13, L11, Q17* This research developed through conversations with visitors to the Australia-Japan Research Centre in ANU while I was a postdoctoral fellow at the Centre. Special thanks are due to Yoshihisa Godo, who introduced me to people at a NPO organised by pork traders. I wish to thank for comments and suggestions Bolong Cao, Jenny Corbett, Roger Gordon, David Vera, and seminar participants at Australian National University, Kent State University, Ohio University, and JSAA 2009. Hiroshi Kobayashi and the student members at the Japan Meat Trade Center helped me collect data from their archive. A financial support from the Japanese Economy Research Foundation is grate-fully acknowledged.+ Crawford School of Economics and Government, Australian National University, Building 13, ACT0200, Australia; Tel.:+61-2-6125-0134; Fax: +61-2-6125-0767; email: [email protected]
Introduction
Tariffs are important sources of government revenue for countries with insufficient infra-
structures for collecting taxes. Baunsgaard and Keen (2005) note that sub-Saharan countries
in Africa collect, on average, a quarter of government revenue from levies on international
trade, and find that low-income countries have on average recovered only 30 per cent
of revenue lost from trade liberalisation. Consequently, the evasion of custom duties had
received considerable research attention (for example Bhagwati, 1974). Contemporary

2
Asia Pacific Economic Papers
empirical research on tariff evasion builds on the previous literature but is distinct in the
extensiveness of data analysed, in the application of recently developed statistical techniques,
and in the careful choice of research settings.1 Particularly, studies that identify evasion
through gaps in matched-partner trade statistics have flourished (Fisman and Wei 2005;
Mishra, Subramanian, and Topalova, 2008; Javorcik and Narciso, 2008) in the backdrop
of the international harmonisation of the product code in the trade statistics and the avail-
ability of trade flow statistics through the United Nations’ COMTRADE database. Those
studies have provided insights into the relationship between the evasion of tariff with the
tax rate, degree of law enforcement, and product differentiation.
As powerful as it may be, the price gap analysis has its limitations. First, as noted
repeatedly, the cross-country discrepancies between trade statistics are caused by freight,
services charges, timing of trade, product classification, among others factors. Bhagwati
(1964) emphasises in his seminal paper that the 'price gap provides, not a conclusive proof,
but only a strong indication of the presence of under-invoicing of imports'. The study by
Fisman and Wei (2005) reduces this concern by focusing on the border trade between
Hong Kong and China. Second, if goods were imported through smugglers operating
stealthily in the night, rather than under-invoiced at official ports of entry, an approach
based on an official statistics fails to capture the behaviour (Cooper, 1974). Last, but not
least important, price gaps provide no information about the effects of evasion on traded
prices — the key in understanding the welfare consequence of smuggling, according to
theoretical studies (Bhagwati and Hansen, 1973; Pitt, 1981;Thursby, Mutti, and Thursby,
1991; Lovely, 1994). Essentially, welfare improves if the reduction in the distortionary
impacts of tariffs is larger than the resource wasted in conducting smuggling. Analyses of
trade statistics are silent on the market consequence of tariff evasion.
Cooper (1974) and Pitt (1981a,b) have suggested a market-based method for eva-
sion detection referred to as a price disparity analysis; this paper aims to refine this com-
plementary method. The price disparity analysis infers the presence of tariff evasion from
the difference between the prevailing market price of a commodity and the counterfactual
price that would have prevailed had there been no tariff evasion. In an early application
in Indonesia, Cooper (1974) finds price disparities in a number of narrowly defined com-
modities during the 1950s and 1960s — a time period in which smuggling is thought to be
pervasive — confirming the informativeness of the analysis. Cooper (1974) approximates
the counterfactual price in a crude manner, arbitrarily assuming a uniform mark-up of 25
per cent across a range of products. Furthermore, consider a setting where exporters have
market power. By presuming that the price respond one-for-one to changes in tariff, as is
often assumed to be the case, the approach erroneously attributes price disparities as due
to the evasion of custom duties when in fact the pricing behaviour of exporters is the real

3
No. 382, 2009
cause.2 To my knowledge, the price disparity analysis has not received a contemporary
make-over as in the price gap analysis.
To address these concerns, this paper proposes a new approximation of the counter-
factual price, drawing from the literature, which was not well developed at the time of the
earlier price disparity studies, on the exchange-rate pass-through (ERPT). Feenstra (1989)
shows that the changes in tariffs and exchange rates have the same impact in an oligopoly
market. While this result is derived under a set of assumptions, empirical studies suggest
that an ERPT coefficient provides a first approximation of a tariff-rate pass-through (TRPT)
coefficient (Feenstra, 1989; Winkleman and Winkleman 1998). This paper considers an
identification strategy whereby the evasion is attributed to the difference between observed
price levels and a theoretical benchmark based on ERPT. In the empirical public finance
literature, behavioural responses, including commodity tax evasion, are identified through
the deviation of the observed impacts of taxes from theoretical benchmarks (Marion and
Muehlegger, 2008; Chetty, Looney, and Kroft, 2007).3 The contribution of this paper is
to suggest a benchmark.
The setting to apply this refined price disparity analysis is the Japanese market for
imported pork parts. An advantage in focusing on the Japanese tariff on pork parts is that,
due to the complexity in the tariff design, the tariff system generates 'within-pig variation'
in tax rates. Under a variable tariff levy adopted in the market for imported pork, low-
value pork parts are taxed more heavily than high-value pork parts, creating incentives for
smuggling low-value pork parts. Furthermore, Japan had negotiated a special agreement
on safeguard clause in the WTO, allowing Japan to temporarily raise tariffs when import
volume surges. The WTO records 89 cases of safeguard measures invoked over 1995
through 2008 around the world.4 In the current setting, the invocation of the safeguards
in the period 2001–2004 led to a 24.6 per cent increase in average import value at ports
of entry. Thus, the institutional setting creates cross-section as well as time variations in
tariff, providing an interesting setting to examine the performance of the price disparity
analysis. Additionally, a focus on a specific type of commodities allows for a straightforward
verification of the price disparity analysis with the price gap analysis.
The topic for this paper has relevance to a policy debate in Japan. In the backdrop
of rising pork imports, the pork tariff has generated controversy.5 While economists and
the press generally consider the Japanese pork tariff needs to be reformed,6 the producer
groups have managed to maintain the status quo. In May 2007, a report submitted by the
Council on Economic and Fiscal Policy, a Japanese equivalent of the Economic Council of
the President in the United States, argued that the complexity with tariff systems causes
evasion, and recommended repealing the variable levy. The producer group responded
strongly to this report.7 In the reform agenda adopted by the Japanese Cabinet in June

4
Asia Pacific Economic Papers
2007, the phrase was toned down, stating that the variable levy is to be reviewed (Cabi-
net Office 2007:16). Despite this policy interest, the impacts of the variable levy on firm
behaviour are not formally documented in academic studies.8 During a Diet Meeting
in 2005, a politician demanded to know the effect of evasion on the price levels, and a
representative from the Ministry of Agriculture, Forestry and Fisheries answered that it is
undeniable that there are some effects (of tariff evasion) on the pork prices in the domestic
markets but it is difficult to quantitatively assess the impacts.9 This paper aims to offer such
an assessment.
In summary, this paper examines an unbalanced panel of monthly prices of finely
disaggregated commodities from three source countries traded at wholesale markets
around Japan from 2001 through 2008. Under the full compliance to the law, the tax
hike would have led to around 12.3 to 17.2 per cent increase in traded price for a sensible
range of TRPT parameters. In an analysis that allows for unobserved country-year specific
cost shocks, the disparity between the observed prices and predicted prices is found to
be statistically significant for a sample of low-value pork, suggesting a pervasive evasion.
Alternative explanations are unlikely to account for the disparity. The results also indicate
that the strengthening of enforcement has had a statistically significant impact on the prices
of frozen pork. Thus, this study finds that the evasion of the variable levy have attenuated
the impact of safeguard tariffs in the Japanese imported pork market in the early 2000s.
This result is corroborated by the price gap analysis, which finds an evasion epidemic of
1999–2005: An estimated the total amount of tariff evaded on Denmark frozen pork is
293 billion yen over 1998–2007. This amount is 6 times as much as the revenue collected
from those commodities in the period. Consequently, the result suggests that, as a result
of the evasion, the safeguard did not result in inefficiency through interfering in the price
mechanism, or through affecting other margins of adjustments, to the extent that would
have arose under the full compliance.
This paper adds to recent empirical studies on tax evasion, particularly those that
examine the effects of enforcement on firm behaviour (Yang, 2008; Marion and Muehleg-
ger, 2008; Mishra, Subramanian, and Topalova, 2008).10 The current study corroborates
the previous findings that enforcement affects firms’ decisions to engage in tax evasion.
One distinctive feature with this paper is in documenting a case where, due to pervasive
evasion, prices do not respond one-for-one to changes in tariff. A number of studies point
out that the tax incidence, while theoretically well understood, is not well documented
empirically (Besley and Rosen, 1999; Alm, Sennoga, and Skidmore, 2009). In understand-
ing tax incidence, the economic reasoning point us to the demand elasticity and the market
power of suppliers, but the results in this paper remind us that behavioural responses that
operates outside the conventional price mechanism can induce first-order effects on the

No. 382, 2009
5
formation of market prices.11
The rest of the paper is organised as follows. Section 2 discusses the pork market
and policies in Japan. Section 3 describes the data. Section 4 examines the responses of
wholesale prices to the invocation of safeguards, considers non-evasion based explanation
for an observed lack of price response, and presents a price gap analysis. Section 6 con-
cludes.
Background on the Japanese market for imported pork
Industry characteristics
Japan in 2008 imports about a half of domestic pork consumption from abroad, a substantial
increase from 1990 when the import share was about a quarter.12 The major source coun-
tries are the Denmark, United States, and Canada, which have the import share in 2000
of 32.6, 29.0, and 17 per cent respectively. Imports from neighbouring countries such as
Taiwan and Korea are limited due to the outbreak of foot and mouse disease outbreaks
in these countries. About 70 per cent of pork imports are frozen meat, which are inputs
for manufacturing processed meats, such as ham and sausages. The downstream market is
dominated by large meat processing companies: the five-firm concentration ratio in 1999
was 56.7 per cent. The meats are imported by trading intermediaries, which are relatively
small — there were about 60 companies importing pork in 2000. Some of the trading
intermediaries are subsidiaries of the downstream manufacturers.
The variable levy on imported pork
The European Union used to adopt a variable import levy on some of its agricultural
commodities (Harris, Swinbank, and Wilkinson, 1983). The Japanese tariff on pork is a
version of the variable import levy (Obara, Dyck, and Stout, 2003). Figure 1 illustrates
the relationship between the imported price (CIF) and after-tax price. The unit is in per
kilo of pork parts. There are three segments: If the average price per kilo is beyond the
gate price of 524 yen, there is an ad valorem tax of 4.3 per cent per kilo; between 524 and
65 yen, the levy is the difference between 546.5 and CIF; below 65 yen, there is unit tax
of 482 yen per kilo. Except for dressed carcasses for which the gate price of 393 per kilo
applies, any pork parts are taxed under this scheme. In short, the system sets a price floor
— officially called a standard import price — on pork parts imports.
There are concerns about several types of behavioural responses. First, since low-
value pork parts are taxed heavily under the variable levy, there are incentives to smuggle
low-value parts disguised as high-value parts. Given that much of the import demand is

6
Asia Pacific Economic Papers
for low-value frozen pork parts for processing into ham and sausages, the incentives for
smuggling are relevant. In light of the finding by Fisman and Wei (2005) that suggests
higher tariff rates induce more traders to evade tariffs, it is plausible to expect that traders
attempt to evade duties. Second, there is de facto permission for mixing different parts
shipped from a same origin country by the same storage method. This means that traders
can combine frozen tenderloin and belly from Denmark to increase the weighted average
price per invoice. This mixing strategy is thought to be a common practice.13 Tanaka and
Mori (2001) show that high-value meats from the United States are traded at discount on
the data from 1998 through 2000, and interpret the result as suggesting that the traders
import high-value parts for tax purposes despite smaller domestic demand for high-value
imported pork parts. Third, according to a trader whom I interviewed, the system discour-
ages traders from claiming refund for the damaged commodities on arrival, since claiming
damage reduces the value to be declared to the Japanese custom and thereby increases the
amount of tax liability. Thus, this variable levy creates a variety of incentives that are not
captured in the price mechanism.
Figure 1: Variable import levy on pork
Source: Author’s Caculations

7
No. 382, 2009
The safeguard of a domestic swinery
Several changes to the price floor provide a useful setting to implement a study on price
disparities. The WTO agreement permits Japan to invoke two types of safeguard tariffs on
pork: gate-price safeguard (SG) and special safeguard (SSG).14 SG raises the price floor
to 681 yen from 546.53 yen and is invoked if import surges beyond a trigger level — the
import volume above 119 per cent of the average volume for the past three years. The
quantity test is based on the cumulative volume since the beginning of the Japanese Fiscal
Year (JFY), which is from April to March. Once invoked, SG lasts till the end of JFY and
is removed from the beginning of the following JFY. The focus of this study is the SG
invoked in 2001–2004 based on the availability of commodity price data. SSG increases
the tariff rate to 6.5 per cent and was invoked in January–March 1997.
Figure 2 shows the impact of the changes in gate price on the reported import per-
kilo price (CIF) from 1988 to 2008. Unlike usual time series data on prices, the pattern
is quite unusual in tracing the gate price very closely. The solid and dotted line shows,
respectively, the average price for invoices declared above and below the gate price. The
proximity of two lines indicates the distribution of declared price that is dense around
the gate price. Two lines trace the reduction in the gate price until 2000 under the WTO
agreement, as well as the invocation of SG in JFY 1995, 1996, 1997 and 2000-2004.
Figure 2: Average declared price of frozen pork imports
Source: Author’s Caculations

8
Asia Pacific Economic Papers
As the timing of the safeguard removal is known, traders are expected to adjust
the timing of trade to take advantage of a lower tariff after safeguard removal at the end
of March. Safeguards were invoked in 2001 after there was a surge in imports that was
intended to beat the import restrictions from Europe due to the outbreak of the foot and
mouth disease. Thus, hoarding behaviour is a relevant consideration in the analysis of the
price disparity.
Law enforcement
The evasion of pork tariffs is an chronic issue since the introduction of the variable levy
in 1974. In a recent criminal case, a meat wholesaler was accused in 2007 of evading 5.9
billion yen over 23 month (April 2003-February 2005). Relative to 16.1 billion yen col-
lected from tariff revenue on pork in 2005, the amount from a single case was already
substantial. A casual examination of court cases suggests that the enforcement strengthened
during 2005.15 The total amount of tax evaded in the five large cases of criminal indict-
ments from 1999 through 2004 was 740 million yen whereas the total amount was 24.5
billion yen for five cases from May 2005 through February 2007; for the first time since
the enactment of the custom law, a warehouse company caught with a tariff evasion had
its permission to conduct custom clearance services revoked in December 2006. Corre-
spondingly, a heavier penalty on tariff evasion was enacted in March 2005 and was enforced
from October 2005. Previously, the penalty was at a maximum 5 years of imprisonment
and/or a maximum fine of 5 million yen, in addition to a penalty from 10 per cent of the
correct tax liability. The penalty tax was increased to 35 per cent in the reform of 2005.
In addition, the Ministry of Agriculture, Forestry and Fisheries nudged traders for better
compliance through distributing a leaflet in April-May 2005. The leaflet contains texts that
call for a better compliance and inform traders about the legislative change on penalties.
Thus, the policy environment changed in the mid-2000s.
Data
The data source is the monthly product-level price data on pork parts published by the
Japan Meat Trade Centre (JMTC), which organises wholesale markets for domestic as well
as imported meats in several locations around Japan. The main advantage of the JMTC data
over other information source on pork price is the level of disaggregation; some wholesale
markets publicise the prices of domestic dressed carcasses and sometimes prices of meat
parts, but the JMTC is, to my knowledge, the only data that allows us to make a distinction
between, for example, the prices of chilled tenderloin from the United States and frozen
belly from Denmark.16 The main trading results at JMTC are published daily in the press,

9
No. 382, 2009
including the Nihon Keizai Shimbun, the Japanese-equivalent of the Wall Street Journal.
Transactions of imported pork are, however, typically over-the-counter trades, meaning
downstream meat processors deal directly with trading intermediaries rather than making
purchases at wholesale markets (Kaku and Fukase 2002). In 2005, the total volume of
imported pork traded at the JMTC was 8.2 thousand tons, which is just 0.94 per cent
of the total imported volume of frozen and chilled pork parts declared at the custom in
the year. An ideal data is the trade information of private parties, but the arbitrage would
prevent a divergence of JMTC prices from trades conducted elsewhere.17 Furthermore,
the JMTC publication is used as reference prices by transacting parties.
I use the monthly weighted-average prices from three markets at varying time lengths:
Kawasaki, located near Tokyo, (2001:2-2008:7), Osaka (2003:3-2008:7) and Nagoya
(2005:3-2008:7). JMTC has provided the data in electric format from 2005 onwards,
and I obtained photocopies of the trade archives at their business office in Kawasaki for
the earlier data. Data contains six pork parts (back ribs, belly, butt, collar, loin, and tender
loin), two storage methods (frozen and chilled), and three countries of origin (Canada,
Denmark, and United States). Other sources of data used in this study are in the data ap-
pendix. Table 1 shows the summary statistics.
Table 1: Summary statistics
Mean S.D. N
Frozen
Backribs 580.6 37.7 196 Belly 589.8 39.9 544 Butt 577.8 43.5 90 Collar 548.0 82.5 196 Tender Loin 811.5 54.3 344 Chilled
Backribs 721.6 40.2 196 Belly 749.8 27.3 252 Butt 704.9 33.3 155 Loin 698.4 39.0 196 Tender Loin 936.1 73.6 351 Exchange rates
JPY/CAD 91.3 12.4 90 JPY/DKK 18.4 2.4 90 JPY/USD 115.6 7.3 90
Source: Author’s Caculations

10
Asia Pacific Economic Papers
Analyses
Visual inspection and a preliminary test
Figure 3 plots the weighted average prices of frozen pork belly, along with those of frozen
tenderloin, imported from Denmark and traded at the Kawasaki market from 2001:2
through 2008:7. I focus on these products in a preliminary analysis since about 70 per
cent of pork imports in 2000 are frozen, and 46 per cent of them originate in Denmark.
The dotted lines show the levels of price floors and the timing of SG invocations over
August-March in 2001, 2002, 2003, and 2004. Note that the price of belly is well below
the price floor during the safeguard, but tenderloin is traded above the price floor. Thus,
under full compliance, we would expect the belly price to be affected by SG but not the
tenderloin price. Recall that the declared prices on frozen pork parts changed sharply dur-
ing SG. Here, SG appears to have no effects on the market price of belly.
To formalise this observation, I consider modeling the belly-tenderloin relationship
in a cointegration regression.18 Since those belly and tenderloin are produced in Denmark
and might originate from identical animals, those commodities are, in theory, subject to
similar shocks (for example fluctuations in feed prices). Indeed, a sharp rise in 2001 for
both commodities is caused by a contraction in supply due to the food and mouth disease
Figure 3: Frozen pork from Denmark: Tokyo market
Source: Author’s Caculations

11
No. 382, 2009
outbreak in Europe that led to a temporary suspension of Denmark import. The ban was
lifted in one month. The pattern suggests a long-term relationship between the prices of
these closely-related commodities. It is thus sensible to expect these prices to be co-inte-
grated. Under a full compliance to the tariff change, then, we would expect the relative
prices of those commodities to be affected due to the differential in tax treatments of those
goods.
The framework for the analysis is the cointegration regression with a known structural
break. If SG had its intended effects — to penalise cheap imports — we would expect a
break in the cointegrating relationship between belly and tenderloin. I fit a dynamic OLS
with a structural break following the application in Hayashi (2000). Standard tests showed
that two series are nonstationary and are cointegrated.19
2 1 0 1 1
,0 1 , 1 1 1 , 2 1 2 ,1 1 1 ,2 1 2
t t t t t
p t p t p t p t p t t
p p D p D
p p p p p
µ γ δ δ
β β β β β υ− + − + − −
= + + + +
∆ + ∆ + ∆ + ∆ + ∆ + (1)
Dt takes the value of 1 while SG is invoked (that is August to March, every JFY from
2001 through 2004). For modeling convenience, this formulation treats all periods of
SG as a single regime. p1t and p2t are, respectively, the price of belly and tenderloin in log.
0δ and 1
δ are the parameter of interest since they capture changes in the cointegrating
relationship. t
υ is a white noise. The lag and lead terms in a dynamic OLS regression are
included to deal the serial correlation issue. Appropriate standard errors are calculated
following Hayashi (2000).
A structural change is tested with the Chow test. The null hypothesis is the safeguard
having no effects on the cointegrating relationship ( 0 1
0δ δ= = ). A non rejection of the
null will be interpreted as a pattern consistent with the attenuation of safeguard due to a
host of reasons that I am not distinguishing at this stage. Below, I attempt to distinguish
alternative explanations, including the tariff evasion, adjustment of profit margins, hoarding,
and mixing strategy. Notice that this approach presumes guilty by taking pervasive evasion
as a maintained hypothesis. A preferred approach, to be explored below, would be to take
no evasion as a null (Marion and Muehlegger, 2008). Table 2 presents the results.
12
Asia Pacific Economic Papers
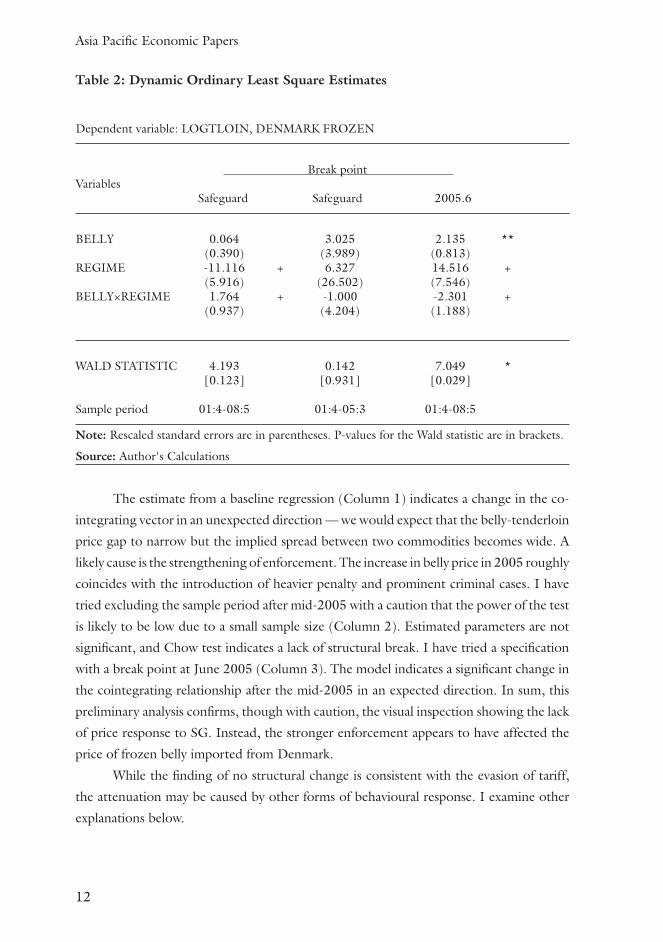
Table 2: Dynamic Ordinary Least Square Estimates
Dependent variable: LOGTLOIN, DENMARK FROZEN
Break point Variables Safeguard Safeguard 2005.6
BELLY 0.064 3.025 2.135 ** (0.390) (3.989) (0.813) REGIME -11.116 + 6.327 14.516 + (5.916) (26.502) (7.546) BELLY×REGIME 1.764 + -1.000 -2.301 + (0.937) (4.204) (1.188)
WALD STATISTIC 4.193 0.142 7.049 * [0.123] [0.931] [0.029] Sample period 01:4-08:5 01:4-05:3 01:4-08:5
Note: Rescaled standard errors are in parentheses. P-values for the Wald statistic are in brackets.
Source: Author's Calculations
The estimate from a baseline regression (Column 1) indicates a change in the co-
integrating vector in an unexpected direction — we would expect that the belly-tenderloin
price gap to narrow but the implied spread between two commodities becomes wide. A
likely cause is the strengthening of enforcement. The increase in belly price in 2005 roughly
coincides with the introduction of heavier penalty and prominent criminal cases. I have
tried excluding the sample period after mid-2005 with a caution that the power of the test
is likely to be low due to a small sample size (Column 2). Estimated parameters are not
significant, and Chow test indicates a lack of structural break. I have tried a specification
with a break point at June 2005 (Column 3). The model indicates a significant change in
the cointegrating relationship after the mid-2005 in an expected direction. In sum, this
preliminary analysis confirms, though with caution, the visual inspection showing the lack
of price response to SG. Instead, the stronger enforcement appears to have affected the
price of frozen belly imported from Denmark.
While the finding of no structural change is consistent with the evasion of tariff,
the attenuation may be caused by other forms of behavioural response. I examine other
explanations below.
13
No. 382, 2009
Is the lack of response due to the adjustment of the profit margin?
Exchange-rate pass-through coefficient as an approximation
The lack of price response may be due to traders bearing the tax incidence by adjusting
profit margins in response to SG. This section considers the role of pricing behaviour
in attenuating SG tariffs. The proposed empirical approach is in line with Marion and
Muehlegger (2008) and Chatty, Looney, and Kroft (2007). As discussed already, in these
studies, different types of behavioural responses are expected to weaken the response of
some variables to taxes. To identify the behavioural response, the estimates of the tax effects
are compared with a benchmark for which the magnitudes are theoretically equivalent in
the absence of the particular behavioural response.20
A benchmark considered in this paper is the degree of exchange rate pass-through
(ERPT). Theoretical and empirical bases render ERPT coefficients a reasonable approxima-
tion for tariff rate pass-through (TRPT) coefficients. Feenstra (1989) proposes the sym-
metry of ERPT and TRPT in the following model of an exporting firm whose objective
is to maximize an expected profit in the unit of foreign currency.
++ (2)[ ] [ ]{ }/ (1 ) ( , , ) ( , ) (1 ) /p
Max e px p q I c x w et t− − −
e denotes an expected exchange rate in the unit of foreign currency per unit of home currency.
The objective of the firm is to maximise an expected profit, but since the only stochastic
variable in the model is the exchange rate, the model is written without the expectation
operator. x(.) is an import demand, which is a function of the price of imported product
(p), the price of a competing variety (q), and income level (I), all of which is denoted in
the unit of domestic currency. c(.) is the cost function, which depends on the foreign factor
price and quantity demanded, and is denoted in the unit of foreign currency.
The formulation shows that the change in expected exchange rate or tariff rate can
be represented as a cost shifter. To the extent that the changes in tariff and exchange rate
affect the term (1+t)/e equivalently, the pricing decision does not depend on the source
of cost shocks. Thus, the model predicts a symmetry of ERPT and TRPT.
The symmetry hypothesis, however, requires assumptions that may not be tenable
in various practical settings. If production costs co-vary with exchange rate (Goldberg and
Hellerstein, 2008), which can happen when inputs include imported materials, the symme-
try prediction does not hold. Similar to the concern discussed by Marion and Muehlegger
(2008) in the context of local diesel markets, the transition effects of tariffs and exchange
rates are unlikely to be the identical since tariff change may be fully expected while the

14
Asia Pacific Economic Papers
exchange rate movements are much uncertain. If the fluctuation of exchange rate is small
and the producers do not make any adjustment to small changes in exchange rate due to
menu costs, the degree of ERPT may underestimate the degree to which the producer
respond to a large change in tariff. Despite these theoretical concerns, previous empirical
studies find that the degree of ERPT and TRPT are not different statistically (Feenstra,
1989; Winkleman and Winkleman 1998).21 Thus, ERPT provides a first approximation
of the expected response of prices in absence of tariff evasion.
What is a sensible range for a TRPT coefficient?
Table 3 provides a summary of previous ERPT studies on various food categories in
Japan.
Table 3: ERPT estimates from closely related commodities
Study Category Estimation ERPT Import Period share (year)
[1] Kimura et al. (1997) Livestock 1985-1994 0.707 0.20 (1990) products [2] Campa & Goldberg (2005) Food 1975-2003 0.269 - [3] Ohtani et al. (2003) Food 1991.1-2002.10 0.59 - [4] Miljkovic & Zhuang (2007) Beef 1996.11-2006.1 0.504 0.58 (2005) Pork 1996.11-2006.1 0.129 0.53 (2005) Poultry 1996.11-2006.1 0.943 0.40 (2005) [5] Ono (2007) Frozen minced 2001.1-2007.6 0.657 0.64 (2002) Alaskan Pollack imported from US
Notes: The frequency for the data is monthly except [1] (two periods) and [2] (quarterly). Data is import price indices, at varying level of disaggregation, published by the Bank of Japan except [1] (input-output table) and [4] (trade statistics).
Source: Author's Calculations
Overall, the ERPT estimates range from 0.129 to 0.94. Campa and Goldberg
(2005) provide a low estimate (0.269) based on quarterly data on the Japanese food price
index on import. Ohtani et al. (2003) replicate the Campa-Goldberg study with monthly
data and find a larger coefficient (0.59). In an early study, Kimura et al. (1997) use the
import price deflator for livestock products — more relevant food category — and report
the estimate of 0.71. Miljkovic and Zhuang (2007) focus on even narrower categories:
beef, pork, and poultry. The data source, however, is the Japanese trade statistics, where
declared values for pork are highly susceptible to misreporting. Possibly reflecting the
misreporting concern, the estimated ERPT coefficient for pork is the lowest among all
estimates (0.129) and is not significantly different from zero. The estimate for beef and

15
No. 382, 2009
poultry is 0.50 and 0.94 respectively. Ohno (2007) focuses on the price of minced frozen
Alaska Pollack, and finds an ERPT estimate of 0.66. Like frozen pork, this frozen fish
product is mainly processed to produce traditional fish cakes. From the comparability of
the data frequency and product category, I take a range of 0.5-0.7 as a benchmark for a
TRPT into the pork price.
Panel data analysis
To address the issue with power, I utilise the panel data on pork-parts price series. I have
considered the validity of a group of high-value parts as a control sample. I define low-
value parts to include all frozen parts except tenderloin (that is backribs, belly, butt, collar)
and high-value parts to include all the chilled meats (backribs, belly, butt, loin, tenderloin)
and frozen tenderloin. The mean price for the former and latter group is 579 and 793
yen/kilo respectively. Given that the average price of the former is well below the price
floor under SG, the direct impacts of SG are expected to fall on low-value meats. Initial
examination revealed that a group of chilled products would not serve as an appropriate
control products for a group of frozen products since the price of chilled parts appear to
be influenced more by the outbreaks of livestock diseases, such as the bird flu outbreaks
in 2001-2002, and the BSE concerns for domestic as well as US beef.22 These factors
might have increased the price volatility since chilled meats are consumed directly. The
possible change in the seasonal pattern for high-value meat raises a question about the
appropriateness of using the group as a control in implementing a difference-in-difference
analysis. Thus, I consider a difference estimator in this paper.
The data is the unbalanced panel of JMTC pork price series for a category of low-
value parts described above. Exchange rates variables, in addition to the price series, are
found to contain unit roots. Given the concern about the panel spurious regression when
the cross-section dimension is small, I estimate the model in first difference. The following
is a difference model estimated in the sample of low-value parts.
(3)
3 12
0 ,1 1
ln lnit km k t m j jt it it
m jp e sg X ua a l θ′
−= =
∆ = + ∆ + + +∑ ∑ pit is the price of ith commodity in log. There are 15 series, containing 3 origin
countries, 2 storage types, 5 parts, and 3 locations at the destination country. ek,t-m is the
mth lag of the exchange rate between yen and the origin country currency in log. I follow
the ERPT literature and use the spot market data. ak,t-m is a currency-specific ERPT coef-
ficient, assumed to be constant across commodities from a same origin country(k). The
specification includes three lags.
To flexibly model the impacts of SG invocations and removals, a preferred specifica-

16
Asia Pacific Economic Papers
tion includes dummy variables (sgjt) indicating jth month in a fiscal year since the invocation
of each SG in JFY 2001, 02, 03 and 04. for example sg1,t and sg12,t is, respectively, a dummy
variable for August 2001-04 and July 2002-05. lj is the main coefficient of interest, and is
designed to capture the difference in price changes across months with and without SG.
We would expect that a cumulative value of l to be positive when SG has had its intended
effects of increasing the price of imported pork. Under the assumption that the seasonal
trend remains the same on average, the coefficient is interpreted as the impact of the SG.
The models are estimated with OLS with standard error clustered by each series.
Xit is a vector of control variables: seasonality controls that allow for heterogene-
ous trend for 6 parts stored in different methods; year-country specific production cost
control; dummies for April 2005, the month just after the enactment of the strengthened
penalty, and two lags.
Results
Table 4 presents the analysis, progressively adding control variables. For the sample of
low-value commodities, the coefficients on the SG dummies are generally not significantly
different from zero, and are sensitive to the addition of controls for those that have signifi-
cant coefficients in the baseline specification, which only control for parts-storage specific
seasonality (Column 1). A test on joint significance, to be discussed below, confirms the
lack of explanatory power of the SG on price. The exchange rates appear to have a weak
explanatory power in the sample of frozen commodities. In the full specification (Col-
umn4), the individual coefficients are not significant, except for the first lag of Canadian
dollar (CAD). The sum of the coefficients are 0.125, 0.076, and 0.097 for CAD, Den-
mark Kroner (DKK), and US dollar (USD), respectively. Jointly, USD is significant but
not CAD and DKK. The timing of the enactment of the tougher penalty law is strongly
correlated with the price increase. The first and second lags are significant at the 5 and 1
per cent level respectively. The three penalty law variables are jointly significant at the 1
per cent level.

17
No. 382, 2009
Table 4: The estimate of a difference model using low-value pork parts sample
[1] [2] [3] [4]
sg_aug -0.0088 -0.0084 0.0028 -0.0113 (0.0110) (0.0109) (0.0159) (0.0174) sg_sep -0.0037 -0.0039 0.0075 -0.0043 (0.0066) (0.0075) (0.0081) (0.0088) sg_oct 0.0006 0.0010 0.0126 0.0014 (0.0072) (0.0081) (0.0147) (0.0167) sg_nov 0.0078 0.0078 0.0197* 0.0076 (0.0052) (0.0053) (0.0074) (0.0084) sg_dec -0.0112* -0.0115* -0.0002 -0.0128 (0.0041) (0.0046) (0.0085) (0.0114) sg_jan 0.0020 0.0025 0.0131 0.0083 (0.0081) (0.0083) (0.0098) (0.0094) sg_feb -0.0338** -0.0212* -0.0101 -0.0166 (0.0074) (0.0076) (0.0133) (0.0142) sg_mar -0.0179** -0.0106* -0.0002 -0.0134 (0.0054) (0.0042) (0.0094) (0.0142) sg_apr 0.0073 -0.0013 0.0097 -0.0061 (0.0056) (0.0047) (0.0088) (0.0126) sg_may 0.0219** 0.0238* 0.0331* 0.0036 (0.0072) (0.0086) (0.0134) (0.0136) sg_jun 0.0071 0.0059 0.0154 0.0115 (0.0056) (0.0058) (0.0108) (0.0115) sg_jul 0.0062 0.0059 0.0070 0.0100 (0.0084) (0.0083) (0.0081) (0.0082) L1(CAD) 0.0186 0.0353+ 0.0639* (0.0154) (0.0200) (0.0237) L2(CAD) 0.0304 0.0611 0.0915 (0.0593) (0.0703) (0.0717) L3(CAD) -0.0288 -0.0045 -0.0301 (0.0306) (0.0369) (0.0351) L1(DKK) -0.0532 -0.0384 0.0390 (0.0678) (0.0758) (0.0901) L2(DKK) -0.0044 0.0078 0.0379 (0.0702) (0.0781) (0.0940) L3(DKK) 0.0274 0.0238 -0.0005 (0.0511) (0.0535) (0.0595) L1(USD) -0.0414 -0.0518 -0.0411 (0.0873) (0.1120) (0.0990) L2(USD) -0.0122 0.0129 0.0443 (0.1338) (0.1275) (0.1396) L3(USD) 0.1215* 0.1547* 0.0941 (0.0513) (0.0593) (0.0666) Penalty Law 0.0224 (0.0192) L1(Penalty Law) 0.0365* (0.0147) L2(Penalty Law) 0.0802** (0.0199) SEASONALITY YES YES YES YES ORIGIN SPECIFIC COSTS NO NO YES YES Constant 0.0114** -0.0031 -0.0015 0.0032 (0.0000) (0.0101) (0.0079) (0.0081) Observations 1008 963 963 963 Adjusted R-squared 0.03 0.02 0.04 0.08
Notes: Robust standard errors, clustered by each series, are in parentheses. + significant at 10%; * significant at 5%; ** significant at 1%. Variables except dummies are differenced. Source: Author's Calculations

18
Asia Pacific Economic Papers
To interpret these estimates, the SG did not resulted in an average increase of prices
of low-value commodities relative to the same set of commodities in the period when
SG was not in place. The difference estimate allows for unobserved country-specific cost
shocks. The exchange rates in general appear to have a weak explanatory power for pork
products in this sample. In a descriptive industry study, Kaku and Fukase (2002) argue that
the fluctuation of exchange rates are fully borne by sellers since the convention in the pork
export to Japan, which adopts the variable levy, is to invoice in yen. While a strong propo-
sition that is supported by the estimates only partially, it is possible that ERPT coefficient
estimated here might underestimate the degree of TRPT for this reason. Additionally, to
the extent that the traders adjust abnormal profit earned from evasion, ERPT would be
attenuated. To be sure, under the assumption of zero TRPT coefficients, the hypothesis
of tariff evasion is not distinguishable from the alternative hypothesis of a full incomplete
pass-through of tariff in an empirical strategy solely based on variations in market prices to
identify evasion. I thus proceed by using the range of previous ERPT estimates discussed
above. Finally, the strengthening of enforcement seems to have had an impact. The en-
forcement includes prosecutions of larger criminal cases, increased penalty, and nudging
firms not to evade, and the effects of these different policy tools are combined in the es-
timate. The effects of the nudging may seem controversial given that there seem to be no
real incentives to act, and indeed, one politician raised concern about its effectiveness.23
However, warning taxpayers have been shown to affect behaviour in randomised studies
(Slemrod, Blumenthalb and Christianc, 2001). One may be concerned that the fuel and
other production costs increased during the mid-2000s might have confounded the influ-
ence of the penalty variables, but the year-country specific dummies should capture those
confounding effects.
Table 5 shows the Wald tests that compare the sum of safeguard coefficients to the
product of the presumed pass-through coefficient and the change in the average declared
price in log [0.22=ln(681.08-546.53)]. The coefficients used in the tests are based on
the difference estimate from the full specification (Column 4). In one extreme, under the
assumption that the full burden of tariff increase is passed onto buyers, we should observe
a change of 0.22 in log price level. The test rejects the null of no evasion under the full
pass-through assumption at the 1 per cent level. In the other extreme, if we assume instead
that a TRPT coefficient to be low, say 12.9 per cent, the lowest estimates of ERPT from the
studies reviewed above, the sum of the estimates are not distinguishable from an increase
of 0.066 in log price level, leading us to accept the maintained hypothesis that there was
no evasion. For a realistic range of TRPT (50-70 per cent), the tests reject the null at the
5 or 10 levels. The result of the test naturally depends on the presumed parameter value.
However, for a sensible parameter range, the test rejects the hypothesis that the lack of

19
No. 382, 2009
price response was due to the pricing behaviour of traders.24
Table 5:The test for the null of no evasion
Tariff-rate pass-through coefficients (%) Wald statistic
100 9.46 ** 80 6.54 * 70 5.28 * 60 4.30 + 50 3.17 + 40 2.31 0 0.23 Notes: The results from the Wald tests. + significant at 10%; * significant at 5%; ** significant at 1%. Source: Author's Calculations
To check the finding, Figure 4 presents the prices of low-value pork
parts before and after March 2005, when the last safeguard was removed. The figures
plot the percentage deviation of average monthly price from the respective group
average. The series on the pattern after March 2005 (dotted lines) should capture
seasonal trend. If SG has had any effects we would expect to see a deviation from the
seasonality in the normal years, especially over August-March. Two lines are nearly
identical, except for the deviation in January-February and June-July.
Figure 4: Percentage of deviation of monthly prices
Source: Author’s Caculations

20
Asia Pacific Economic Papers
Other explanations
Was the attenuation due to hoarding?
The price would not have respond as much if traders were able to stockpile when the tariff
was low and to sell them off when the tariff was high. While traders incur storage costs
and forgo interest earnings, frozen pork is physically storable. Figure 5 plots the fraction
of frozen pork imported to Japan over August-March from JFY1988 through 2007 using
the Japanese trade statistics. The hoarding behaviour would imply increases in the share of
imports in April-July so that we would expect to observe reductions in the August-March
import share over JFY2001–2004. The most salient pattern in the figure is the reduction
of the share in JFY1996, which is attributable to the invocation of a SSG that increased the
tariff rate on top of the increased price floor over January through March 1997. The pattern
suggests that importers adjusted the real timing of import in JFY1996. Over JFY2001-
2004, in contrast, substantial fractions of pork clear custom when tariff is high, indicating
that SG did not cause shift in timing as much as in JFY1996. Thus, hoarding would not
have had a first-order effect on the price level of frozen pork during SG in the 2000s.
Figure 5: The share of imports over August-March
Source: Author’s Caculations

21
No. 382, 2009
Was the attenuation due to tax avoidance?
Another alternative explanation for the lack of price response to safeguards is the tax avoidance
through the mixing of parts. By increasing the average price on invoice through increasing
the share of high-value meats, importers can avoid paying penalising tariff applicable to
pork imported at prices below the gate price. While this strategy increases costs to traders
due to the purchase of high-value parts that would not have been imported otherwise, the
full burden of the safeguard would not be borne by market participants.
Figure 6 plots the value of frozen pork per kilo exported to Japan declared at the
Denmark custom (solid line). If there was a change in the composition of pork parts ex-
ported from Denmark, the average value should increase, perhaps with a lead. The data is
based on frozen pork category that corresponds to the Japanese custom data. The dotted
line shows the frozen pork parts imported from Denmark reported to the Japanese custom.
Put differently, the figure presents a time series examination of the price gap in the context
of frozen port import into Japan to be discussed below.
For 2001-2004, the volatility of the value declared at Denmark appears to increase,
perhaps reflecting some adjustments in the timing of trade. However, there seems no
significant indication that the mixing strategy was in wide use. Tanaka and Mori (2001)
find the mixing strategy to be significant but their study is based on chilled US products in
1998–2000. It is thus unlikely that the mixing strategy explain the lack of price response
in the 2000s for the Denmark frozen pork.
Figure 6: The price gap analysis
Source: Author’s Caculations

22
Asia Pacific Economic Papers
Alternative approach: Price-gap estimate of evaded duties
The most salient feature of Figure 6 is the gap between prices over 1999–2005. Two lines
are reasonably close in other periods; the 1996 safeguard is associated with a sharp tem-
porary rise in the average value declared at Denmark, indicating that much of the imports
for the period employed the tax avoidance strategy — a pattern that is in line with the
sharp reduction in the imported volume during SG and SSG noted above. In contrast,
from the late 1990s to the mid-2000s, the declared values at Denmark are visibly below
those declared at Japan. The behaviour of price gaps is thus consistent with the lack of
price response to SG documented above.
The broad pattern is in line with the market development. As the share of import
in the domestic pork consumption increased during the 1990s, the detection probability
would have fallen, all else equal. A larger market size would be conducive to evasion since
the evasion production function is likely to exhibit economies of scale; court cases have
documented elaborate evasion schemes that involve establishments of shell companies,
indicating that firms need to invest in learning evasion strategy.25 The closing of the price
gap starting in 2005 can be explained by the strengthening of law enforcement. Recall
from the above analysis that the price of low-value parts increased at the time that the
enforcement was strengthened. Compliance to the tariff regime would have resulted in
traders resorting to the mixing strategy, which increases costs of imports.
Table 6 shows the price-gap estimate of evaded custom duties on the Japanese
import of Denmark frozen pork parts. The price gap is defined as the difference between
the CIF (per kilo) declared at the Japanese custom and the one-month lag of FOB (per
kilo) declared at the Denmark custom. The lag of one month is chosen because shipping
from Copenhagen to Yokohama takes 36 days.26 The Danish Krone in the Denmark data
is converted to Yen using spot exchange rates. The evasion estimate is the product of the
price gap and corresponding volume declared at the Japanese custom. The estimate is
intended to provide an upper bound estimate only: once again, the sources of discrepancy
include the costs of transportation (fright, insurance, other expenses), the difference in the
timing of import and export, actual exchange rate used by trading parties, and commodi-
ties damaged during transport. However, since those sources of disparities are unlikely to
change abruptly, the price gap estimates would provide a reasonable comparison across
time.

23
No. 382, 2009
Table 6: Revenue and Evasion: Denmark Frozen Pork
Evasion Estimate Revenue Evasion-Revenue Ratio JFY All year Safeguard All year Safeguard All year Safeguard Apr.-Mar. Aug.-Mar. Apr.-Mar. Aug.-Mar. Apr.-Mar. Aug.-Mar.
1998 9,006.0 - 3,598.4 - 2.50 - 1999 34,134.5 - 4,946.0 - 6.90 - 2000 29,849.1 - 4,417.1 - 6.76 - 2001 40,668.1 31,357.3 5,677.1 3,727.2 7.16 8.41 2002 46,078.6 34,496.8 5,674.9 3,463.0 8.12 9.96 2003 47,623.3 35,752.5 5,945.6 3,520.2 8.01 10.16 2004 53,161.3 32,700.8 6,647.7 3,424.8 8.00 9.55 2005 24,837.4 - 5,297.9 - 4.69 - 2006 6,853.7 - 3,898.7 - 1.76 - 2007 834.3 - 2,709.8 - 0.31 - Total 293,046.3 134,307.4 48,812.9 14,135.2 6.00 9.50
Notes: The unit is in million yen.
Source: Author's Calculations
Over the decade spanning JFY1998–2007, the upper-bound estimate of total eva-
sion on Denmark frozen pork is 293 billion yen. The amount is 6 times as large as the
total tariff revenue on the commodity from Denmark. The evasion-revenue ratio shows
a substantial time variation, peaking at 8.12 in 2002, and falling to 0.31 in 2007. This
pattern suggests an evasion epidemic over 1999–2005, followed by a period of better
compliance. The ratio during the safeguard in JFY2001–04 is higher because of the larger
amount of tariff evaded per kilo due to the higher price floor. A higher evasion-revenue
ratio during the safeguard period indicates that the tariff revenue from Denmark pork did
not respond as much to the increase in tariff due to evasion. In sum, this auxiliary evidence
supports the interpretation that the price disparity as due to tariff evasion rather than the
adjustment of profit margins. Further, evidence supports the interpretation that the break
in cointegrating relationship between Denmark frozen belly and tenderloin as due to the
better compliance to the variable tariff levy.
Concluding remarks
This paper examined the disparities between the observed prices of low-value imported
pork parts and the predicted prices that would have prevailed under the full compliance
to the increases in a price floor under the Japanese variable levy on pork. Statistically
significant disparities between prices were found during the safeguard tariff of JFY2001-
2004, and were best explained by tariff evasion. A complementary examination based on
a comparison of trade statistics from Japan and Denmark — the leading exporter of frozen

24
Asia Pacific Economic Papers
pork to Japan — revealed visible gaps over JFY1999–2005, indicating an epidemic of un-
der-invoicing to reduce tax liability. Alternative explanations for the lack of price response
were considered but were unlikely to account for the divergence of market prices from the
theoretical benchmark. The results indicated that the strengthening of enforcement have
had a statistically significant impact on price. I estimated the total amount of tariff evaded
on Denmark frozen pork to be 293 billion yen over 1998-2007. This amount was 6 times
as much as the revenue collected from those commodities in the period.
The analysis has implications beyond the current context. First, in line with Cooper
(1974) and Pitt (1981a,b), this study shows that price disparities give indications about the
presence of pervasive tax evasion. Particularly, a comparison of two similar commodities
that are reasonably thought of as differentially affected by non-compliance would provide
a quick visual check. Second, the results raise questions about the effectiveness of safe-
guard tariffs as a public policy tool. Safeguard tariffs affect the margins of incentives that
are neglected in the partial equilibrium analysis of a commodity tax. A tax hike increases
the incentives for misreporting (Fisman and Wei, 2005), and I find a near complete at-
tenuation of safeguard tariff in the current setting. Thus, to achieve its protectionist goal,
safeguard tariffs should be accompanied by a closer monitoring by Customs. However,
policy makers should be aware that such efforts draw resource away from the monitoring
of other imported commodities or even border protection when the custom resource is
fixed.
Several extensions to this paper are possible. First, it would be of interest to examine
price disparities in countries that rely more heavily on tariff as a revenue source. Particu-
larly, it seem a useful exercise to see whether price disparities exist for commodities that
are found to have price gaps in China, India and Eastern Europe (Fisman and Wei 2005;
Mishra, Subramanian, and Topalova, 2008; Javorcik and Narciso, 2008). Conversely,
studies have suggested the lack of price response to the US steel safeguard of 2002 (Lieb-
man, 2006). The pattern might have been caused by exemptions granted to a number of
source countries, but since the press reports widespread smuggling in US steel imports,27
an interesting question would be: Are there price gaps for the steel imports into the United
States? Last, given the goal of protecting Japanese pork producers, a further study might
ask to what extent the Japanese pork safeguard was successful in maintaining the prices of
domestic pork.

25
No. 382, 2009
References
Alm, J., Sennoga, E., and Skidmore, M., 2009. ‘Perfect Competition, Urbanization, and Tax Incidence in the Retail Gasoline Market’, Economic Inquiry 47:118-34.
Andreoni, J., Erard, B., and Feinstein, J., 1998. ‘Tax Compliance’, Journal of Economic Literature 36:818-60.
Besley, T.J., and Rosen, H.S., 1999. ‘Sales Taxes and Prices: An Empirical Analysis’, National Tax Journal 52:157-176.
Bhagwati, J., 1964. ‘On the Under-invoicing of Imports’, Bulletin of the Oxford University Institute of Statistics 26:389-97.
Bhagwati, J., 1974. Illegal Transactions in International Trade: Theory and Measurement, North-Holland Publishing Company, Amsterdam.
Bhagwati, J., and Hansen, B., 1973. ‘A Theoretical Analysis of Smuggling’, Quarterly Journal of Economics 87:172-187.
Baunsgaard, T., and Keen, M., 2005. ‘Tax Revenue and (or?) Trade Liberalization’, International Monetary Fund Working Paper 05/112.
Campa, J.M., and Goldberg, L.S., 2005. ‘Exchange rate pass-through into import prices’, Review of Economics and Statistics 87:679-690.
Cabinet Office, Japan. 2007. Economic and Fiscal Reform 2007. Cabinet Office, Tokyo. (available from http://www.keizai-shimon.go.jp/explain/2007link/basic_policies2007.pdf, downloaded March 31, 2008.)
Chetty, R., Looney, A., and Kroft, K., 2007. ‘Salience and taxation: Theory and evidence’, NBER Working Paper Series No. 13330.
Cooper, R.N., 1974. ‘Tariffs and smuggling in Indonesia’, in Bhagwati, J. (ed) Illegal Transactions in International Trade: Theory and Measurement, North-Holland Publishing Company, Amsterdam, 183-192.
von Cramon-Taubadel, S., 1997. ‘Estimating asymmetric price transmission with the error cor-rection representation: An application to the German pork market’, European Review of Agricultural Economics 25:1-18.
Feenstra, R.C., 1989. ‘Symmetric pass-through of tariffs and exchange rates under imperfect com-petition: An empirical test’, Journal of International Economics 27:25-45.
——, 1995. ‘Estimating the effects of trade policy’, in Grossman G.M. and Rogoff K. (eds.) Hand-book of International Economics, Elsevier, Amsterdam, 1553-1595.
Fisman, R., and Wei, S.J., 2004. ‘Tax Rates and Tax Evasion: Evidence from Missing Imports in China’, Journal of Political Economy 112:471-496.
Goldberg, P.K., and Hellerstein, R., 2008. ‘A structural approach to explaining incomplete ex-change-rate pass-through and pricing-to-market’, American Economic Review: Papers and Proceedings 98:423-429.
Gordon, R.H., and Hines, J.R. Jr., 2002. ‘International Taxation’, in: Auerbach AJ & Feldstein M (eds.) Handbook of Public Economics, Elsevier, Amsterdam, 1935-1995.
Gordon, R.H., and Slemrod, J., 2000. ‘Are real responses to taxes simply income shifting between corporate and personal tax base?’. in Slemrod J. (ed.) Does Atlas Shrug? The Economic Con-sequences of Taxing the Rich. Harvard University Press, MA, 240-328.
Harris, S., Swinbank, A., and Wilkinson, G., 1983. The Food and Farm Policies of the European Community. John Wiley & Sons, New York.
Hayashi, F., 2000. Econometrics. Princeton University Press, Princeton.Hummels, D.L., and Lugovskyy, V., 2006. ‘Are Matched Partner Trade Statistics a Usable Measure
of Transportation Costs?’. Review of International Economics 14:69-86.

26
Asia Pacific Economic Papers
Javorcik, B.S., and Narciso, G., 2008. ‘Differentiated products and evasion of import tariffs’, Journal of International Economics 76:208-222.
Kaku, K., and Fukase, M., 2002. 'Production, Distribution, Consumption and Price Formation of Pork in Japan: Basic Research for the Pork Futures Market'. Futures Market Research 1:1-62 (in Japanese).
Kimura, H., Suzuki, H., Saito, T., Suzuki, T., Shimada, H., and Murota, H., 1997. ‘Economic Effects of Yen Appreciation: A Sectoral Approach’, Keizai Bunseki (Economic Analysis) 148:1-53 (in Japanese).
Liebman, B.H., 2006. ‘Safeguards, China, and the Price of Steel’, Review of World Economies 142:354-373.
Lovely, M.E., 1994. ‘Crossing the Border: Does Commodity Tax Evasion Reduce Welfare and Can Enforcement Improve It?’ Canadian Journal of Economics 27:157-174.
Marion, J., and Muehlegger, E., 2008. ‘Measuring Illegal Activity and the Effects of Regulatory Innovation: Tax Evasion and the Dyeing of Untaxed Diesel’. Journal of Political Economy 116:633-666.
Miljkovic, D., and Zhuang, R., 2007. ‘The exchange rate pass-through into import prices: The case of Japanese meat imports’. A paper presented at the American Agricultural Economics Association Annual Meeting, Portland, Oregon.
Mishraa, P., Subramanianb, A., and Topalovac, P., 2008. ‘Tariffs, enforcement, and customs eva-sion: Evidence from India’. Journal of Public Economics 92:1907-1925
Obara, K., Dyck, J., and Stout, J., 2003. ‘Pork Policies in Japan’, in: Electronic Outlook Report from the Economic Research Service, No. LDPM105-01. United States Department of Agriculture.
Ohtani, A., Shiratsuka, S., and Shirota, T., 2003. ‘Kaw ’ (The decline of exchange-rate pass-through: Examination of wholesale price level in Japan’. Kinyu Kenkyu (Finance Research) 22:59-90 (in Japanese).
Ono, M., 2007. ‘Exchange rate pass-through into import prices of materials for processed marine products: A time-series analysis of the bank of Japan’s import price index’. Annual Research Report of Fukushima University 3:11-15.
Pitt, M.M., 1981a. ‘Smuggling and price disparity’. Journal of International Economics 11, 447-458.
——, 1981b. ‘Alternative Trade Strategies and Employment in Indonesia’ in: Krueger A.O., Lary H.B., Monson T. and Akrasanel N. (eds.) Trade and Employment in Developing Countries. University of Chicago Press, Chicago, 181-237.
Rezitis, A.N., and Brown, A.B., 1999. Pass-Through of Exchange Rates and Tariffs in Greek-US Tobacco Trade. Agricultural Economics 21:269-277.
The Forum for Considering Import & Distribution System of Meat, 2007. ‘Butaniku ga Kieru: Sagakukanzei ga Nihon no Shokutaku o Hakai Suru’ (Disappearance of Pork Meat: the Vari-able Tariff Levy will Destroy the Dinner Tables in Japan). Bijinesu Sha, Tokyo.
Slemrod, J., Blumenthalb, M., and Christianc, C., 2001. 'Taxpayer response to an increased prob-ability of audit: evidence from a controlled experiment' in Minnesota Journal of Public Economics 79:455-483.
Tanaka, M., and Mori, H., 2001. ‘Economic Analysis of Japanese Pork Import Regulations’. Pro-ceedings of annual conference of the Agricultural Economics Society of Japan, 175-177.
Thursby, M., Jensen, R., and Thursby, J., 1991. ‘Smuggling, Camouflaging, and Market Structure’. Quarterly Journal of Economics 106:789-814.
Yang, D., 2008. ‘Can enforcement backfire? Crime displacement in the context of customs reform in the Philippines’. Review of Economics and Statistics 90:1-14.

27
No. 382, 2009
Winkelmann, L., and Winkelmann, R., 1998. 'Tariffs, quotas and terms-of-trade: The case of New
Zealand.' Journal of International Economics 46:313-332.
Data Appendix
Trade Statistics of JapanThe monthly information for the declared pork parts imports are obtained from the Trade Statistics of Japan published by the Ministry of Finance (http://www.customs.go.jp/toukei/info/index.htm). The Harmonised System codes for the frozen meat of pork are 020329021 and 020329022 and correspond to other pork meats, which exclude dressed carcasses and hams, shoulders and cuts thereof, with bone in.
Denmark customs dataThe monthly Denmark custom data is obtained from the StatBank of the Statistics Denmark.(http://www.statbank.dk/statbank5a/default.asp?w=1024).I combined 11 categories of pork meats that begin with Frozen. In practice, nearly all of frozen meat is reported under the category Frozen boneless meat of domestic pork (excluding bellies streaky and cuts thereof).
Exchange ratesMonthly exchange rates are obtained from International Financial Statistics published by the International Monetary Fund.
Notes
1 For a collection of precursors of the contemporary research on tariff evasion, see Bhagwati (1974).
2 The extensive literature on the exchange rate pass-through indicates that there are substantial departures from the perfect competition in some of the international markets and that the degree to which the change in exchange rate is passed through to the price in the destination market is affected by the pricing power of the exporter (Feenstra, 1995). The approach would be sensible when the market is approximated by a long-run equilibrium with a constant marginal cost and free entry. See also the discussion by Besley and Rosen (1999).
3 In these studies, different types of behavioural responses are expected to weaken the response of some variables to taxes. To identify the behavioural response, the estimate of the tax effects are compared with a benchmark for which the magnitudes are theoretically equivalent in the absence of the particular behavioural response. To identify the impact of tax salience, Chetty, Looney, and Kroft (2007) compare the responses of beer demand to exercise tax (salient tax) and sales tax (less salient). To identify the effects of tax evasion, Marion and Muehlegger (2008) compare tax and (wholesale) price elasticity of diesel fuel retail demand.
4 The figure includes measures in form of tariffs or quantitative restrictions, and is based on notification by WTO members to the WTO - (http://www.wto.org/english/tratop_E/safeg_e/safeg_e.htm#statistics, accessed September 2, 2009). The Japanese safeguard has some distinct features since it is permitted under a separate agreement (see Obara, Dyck and Stout, 2003).
5 In 1990, the import and domestic production of pork was 342 thousand tons and 1,088 thousand tons respectively. In 2007, the import and domestic production of pork was 879 thousand tons and 869 thousand tons respectively.

28
Asia Pacific Economic Papers
6 See, for example, the Editorial in the International Herald Tribune, November 17, 2006.
7 The Japanese pork industry was politically active in the mid-2000s. The domestic swinery formed the Japan Pork Producers’ Association in 2006. The pork importers formed in 2006 a NPO that lobby for a pork tariff reform.
8 To my knowledge, Tanaka and Mori (2001) is the only empirical study on the variable levy, focusing on the tax avoidance through mixing strategy to be discussed below. In a book published by an interest group that calls for a pork tariff reform, a simple price disparity analysis has been considered (The Forum for Considering Import & Distribution System of Meat, 2007).
9 A response by the head of the Agricultural Production Bureau in the Ministry of Agriculture, Forestry and Fishery at the Diet Committee Meeting on Agriculture, Forestry and Fishery, August 4, 2005. Translation by this author.
10 A large number of previous studies examine tax avoidance by multinational corporations (for example Gordon and Hines, 2002) and evasion by individuals (for example Andreoni, Erard, and Feinstein, 1998), but a relatively smaller number of studies concern outright evasion by firms.
11 For a nice discussion on the importance of behavioural response in the context of elasticity of income to taxes, see Gordon and Slemrod (2000).
12 Kaku and Fukase (2002) provide a descriptive study on the swine markets in Japan. Obara, Dyck, and Stout (2003) describe the Japanese government policies on swine.
13 The strategy is permitted according to a Japanese tax official contacted by this author.
14 From January 1995 to November 2008, 89 safeguards were imposed around the world (http://www.wto.org/english/tratop_e/safeg_e/safeg_e.htm#top, accessed May 11, 2009).
15 Based on a headline search of financial press (Nihon Keizai Shimbun, Nikkei Sangyo Shimbun). The largest evasion is 10.48 billion yen in the late 2006.
16 For a centralised data source, see Agriculture & Livestock Industries Corporation (http://lin.lin.go.jp/alic/statis/dome/data2/e_nstatis.htm, Accessed May 12, 2009).
17 Meat processing companies are likely to have a stronger bargaining power over trading intermediaries owning to the concentration in the downstream industry. Thus, contract prices in the over-the-counter trade are likely to reveal the effects of evasion since the benefits of tax saving through evasion would be passed onto buyers.
18 von Cramon-Taubadel (1997) examines wholesale and retail prices of pork in Germany using a co-integration regression.
19 Dicky-Fuller unit root tests on the logarithmic of average price in a specification with time trends reject the unit root hypothesis at the 5 per cent level in only 1 out of 37 instances. I therefore accept the null hypothesis of the log price being nonstationary, but, as in Campa and Goldberg (2005), with caution about the power of the test. The Engle-Granger test rejected the null of no cointegration of the prices of belly and tenderloin, so I take the two series to be co-integrated, once again with caution.
20 If profit earned by trading intermediaries are affected by SG, their stock prices should be influenced by a surprise invocation of SG. A direct approach to check whether the importers adjust margin would be to examine the response of stock prices, but to my knowledge, no specialized trader of pork is publicly listed in the Japanese stock market.
21 In addition, Rezitis and Brown (1999) examine Greek tobacco export to the United States, and their estimates imply symmetry.
22 Another explanation is the inflow of high-value meat through the mixing strategy. While the explanation is consistent with the depressed price in the intermission of SG, it would not account for the rise in January-March. As discussed below, the mixing strategy would not have been prevalent in the sample period.
23 A statement by Chizuko Takahashi (Japanese Communist Party) at the Diet Committee Meeting on Agriculture, Forestry and Fishery, May 17, 2005.
24 I have tried nesting the null of no evasion into the cointegration analysis with a structural break. The test is based on a comparison of the implied change in the tenderloin price implied by the estimate

29
No. 382, 2009
of cointegrating vector with the expected price change based on a range of TRPT coefficients. The implied change is evaluated at the mean of belly price. The results are hard to interpret since the power of the test is likely to be low due to the imprecise estimates arising from a shorter time series (2001:2-2005:3).
25 A ruling on an evasion case at the Tokyo District Court made in December 22, 2005 found that the case involved ordering forged invoice from a company in Taiwan, clearing customs under the name of a shell company, and changing ownership through a number of shell companies.
26 Based on the shipping schedule posted on the Nippon Yusen Kaisha’s website (accessed Dec. 1, 2008).
27 The Wall Street Journal (Eastern Edition), Nov. 1, 2001.

30
Asia Pacific Economic Papers
Previous Asia Pacific Economic Papers
381 Are the East Asian Currencies Still Misaligned? An Analysis Based on Absolute ppp-Income Relationship using Panel Data Taizo Motonishi, 2009
380 Is Foreign Aid a Vanguard of Foreign Direct Investment? A Gravity-Equation Approach Hidemi Kimura and Yasuyuki Todo, 2009
379 Rain, Elections and Money: The Impact of Voter Turnout on Distributive Policy Outcomes in Japan Yusaku Horiuchi and Jun Saito, 2009
378 Japanese FDI in China: determinants and performance Shiro Armstrong, 2009
377 Expansion Abroad and Jobs at Home: Evidence from Japanese Multinational Enterprises Nobuaki Yamashita and Kyoji Fukao, 2009
376 Should Australia Encourage Developing Countries to Adopt Competition Laws? Henry Ergas, 2008
375 Will New Trends in Foreign Direct Investment Change the Structure of Intra-industry Trade between China and Japan? Tao Tao, 2008
374 Competition Policy in ASEAN: Case studies Johannah Branson, 2008
373 Can the New Antimonopoly Act Change the Japanese Business Community? The 2005 Amendment to Antimonopoly Act and Corporate Compliance. Kazukiyo Onishi, 2008
372 Immunising future trade against protectionists: preventing the emergence of more sensitive sectors Andrew Elek, 2008
371 Tax law asymmetries and income shifting: evidence from Japanese Capital KEIRETSU Kazuki Onji and David Vera, 2008
370 The response of firms to eligibility thresholds: evidence from the Japanese value-added tax Kazuki Onji, 2008
369 China and East Asian Energy: Prospects and Issues Vol. 1 & 11 Peter Drysdale, Kejun Jiang and Dominic Meagher, 2008
368 Measuring trade and trade potential Shiro Armstrong, 2007
367 APEC and infectious disease: meeting the challenge Joel Gilbourd, 2007
366 The flow of funds through a government – A case study on Japan Jun Ikeda, 2007
365 The puzzle of small farming in Japan Yoshihisa Godo, 2007
364 How should one evaluate fiscal conditions? A study based on the comparison between Japan and Australia Jun Ikeda, 2007
363 Political institutions and distributive politics in Japan: getting along with the opposition Yusaku Horiuchi, 2007
362 Negotiating the Australia–Japan basic treaty of friendship and cooperation: reflections and afterthoughts Garry Woodard, Moreen Dee and Max Suich, 2007
361 China and East Asian energy: prospects and issues Vol. 1 Peter Drysdale, Kejun Jiang and Dominic Meagher, 2007

31
No. 382, 2009
Annual subscription rate for up to eight issues:
Individuals A$65.00 (includes GST) A$60 (overseas)Institutions A$110.00 (includes GST) A$100 (overseas)
Cost for single issues:
A$16.50 (includes GST) A$15.00 (overseas)A$10.00 (Students)No postage required within Australia
Available from:
Centre AdministratorAustralia–Japan Research CentreCrawford School of Economics and ManagementANU College of Asia and the PacificThe Australian National UniversityCanberra ACT 0200, AustraliaFacsimile: (61 2) 6125 0767Telephone: (61 2) 6125 3780Email: [email protected] URL: http:/www.crawford.anu.edu.au