tom kompas crawford school of economics and government … · tom kompas . crawford school of...
TRANSCRIPT

Tom Kompas Crawford School of Economics and Government
Australian National University
Nhu Che*Australian Bureau of Agricultural and Resource Economics
.
*The views presented are those of the authors and do not represent the official view of ABARE.
The ProblemClose proximity between countries and international trade and tourism increases the probability of an incursion and the spread of exotic diseases and pests; ones that can do great harm, and in some cases be potentially devastating to local industry, animal and human health, and the environment.

Traditional Measures• Pre-border measures and border quarantine (i.e.,
preventing a potential incursion at the border). • Limits on imports• Airport inspections, and inspections of shipping
containers and contents • Local surveillance programs (preventing spread in
the local environment). • Surveillance traps• Blood screening and visual inspection
• Containment and eradication programs.

The PuzzleHow much should be spent, or what costs should be incurred, for pre-border measures and border quarantine, surveillance and eradication activities to protect plant and animal health and the environment? How to allocate resources across various threats?
• Ban imports and close airports?• Spend $0 on quarantine and surveillance?• Spend all of GDP on quarantine and surveillance?• Eradicate? Contain? Neither?• How to allocate resources across various threats?


Border Quarantine Measures
Infected Animals/Area
(N)
Time
Quarantine Expenditures E(N)
Zero entryZero entry
Zero entryZero entry
E(N)
E(N) N

Optimal Border QuarantineBenefit: Less initial entry gives smaller damages (or more benefits) over time, prior to full saturation. Trade-off: The smaller is initial entry the more expensive is the border quarantine programObjective: Minimize all expenditures: damages (e.g., losses in plant and animal health, damage to the environment, trade restrictions, containment and eradication costs) plus the cost of the quarantine program itself. (Equivalent to equating the marginal benefits of having less damages to the marginal costs of quarantine expenditures.)
Conditional on:Probability of entry Spatial and density spread, and E(N) functionPrices and costs that may vary over time, discount rate

Case study: Risk of OJD in WA
Quarantine measure against OJD in imported sheep in WA: blood tests, screening, and general surveillance
Papers:◦
Tom Kompas and Nhu Che, A Practical Optimal Quarantine Measure, ANU, 2003◦
Tom Kompas, Nhu Che and Pham Van Ha, “An Optimal Quarantine Measure”, ANU, 2009.
Method: Stochastic Bioeconomic Model with a Jump-Diffusion Process.
Possible quarantine measures Risk of infected rams entering (no/month)
• Free entry or no quarantine activity 18.5 • Australian Sheep Johne’s Disease 0.5 Market Assurance Program • Movement Restrictions Program Less than 0.5 (depends on level of restriction) • National OJD Management Program Close to 0 • Source: Agriculture Protection Program (APP) 2000b.

Mean value and standard error 1. Total production loss • Number of sheep in the state N(26 000 000,
(number) 500 000) • Maximum infection level N(26, 5)
(% of total sheep) • Growth rate of OJD N(1.4, 0.5)
transmission (%/month) • Maximum average costs of OJD N(14, 1.4)
($/head) • Discount rate (%/year) 5 2. Quarantine expenditures • Max quarantine expenditures $300 000 ($/month) • Risk of infected rams entering N(18.5, 1.85) under ‘Free Entry’ (no/month) • Current quarantine expenditures $40 000
($/month) • Current risk of infected rams N(1.84, 0.18) entering (no/month) 3. Welfare losses from trade restrictions • Volume of rams imported 550
(no/month) • Difference of domestic price $1 000 and imported price ($/ram) • Conformance cost for ram $75/ram exported ($/ram)
OJD in WA: Key Parameters

Results: The optimal quarantine measure gives a potential entry of 0.116 infected sheep per year, or one potentially infected sheep every nine years. At this potential entry the value of time horizon T, or the time when the present value of the cost of the disease becomes zero, is 130 years . The minimum total cost of 67 million over 130 years roughly decomposes into 33.8 million in quarantine costs, 16 million in trade losses and 17.2 million in direct losses.
OJD in WA


Infected Animals/Area
(N)
Time
Surveillance Expenditures S(N)
Earliest Detection Earliest Detection
Earliest DetectionEarliest Detection
S(N)
E(N)Optimal Early Detection
Natural DetectionNatural Detection
Natural DetectionNatural Detection
S(N)
Local Surveillance Measures
N

Optimal Surveillance Expenditures • Optimal Surveillance
• Benefit: Earlier detection and consequent action gives smaller damages over time (or more benefits)
• Trade-off: The earlier is detection the more expensive is the local surveillance program
• Objective: Given a border quarantine measure, minimize all expenditures: damages (e.g., losses in plant and animal health, damage to the environment, trade restrictions, containment and eradication costs) plus the cost of the surveillance program itself. (Equivalent to equating the marginal benefits of having less damages to the marginal costs of surveillance expenditures.)
• Conditional on: • Natural detection point (can be altered)• Spatial and density spread, and S(N) function• Prices and costs that may vary over time, discount rate

PPF attacks fruit and habitat, and in early stages is difficult to detect by inspection (boarder quarantine is limited and ineffective).
Largest risk of entry: via the Torres Strait Islands and at ports of entry.
Current surveillance grid: 1 trap for every 6,200 km2, 1,878 traps in total, Current Expenditures = $1,380,000 (including the program’s fixed costs).
1995 outbreak in QLD: $43m in eradication and management costs over a 13 month period. Papers:◦
Tom Kompas, Nhu Che, L. Cao and Nico Klijn, A Practical Optimal Surveillance Measure: Papaya Fruit Fly in Australia, ABARE Report to DAFF, Chief Plant Protection Officer, 2003
◦
Tom Kompas, Nhu Che and Pham Van Ha, “An Optimal Surveillance Measure Against Papaya Fruit Fly in Australia”, ANU, 2009.
Method: Stochastic Bioeconomic Model with a Jump-Diffusion Process.
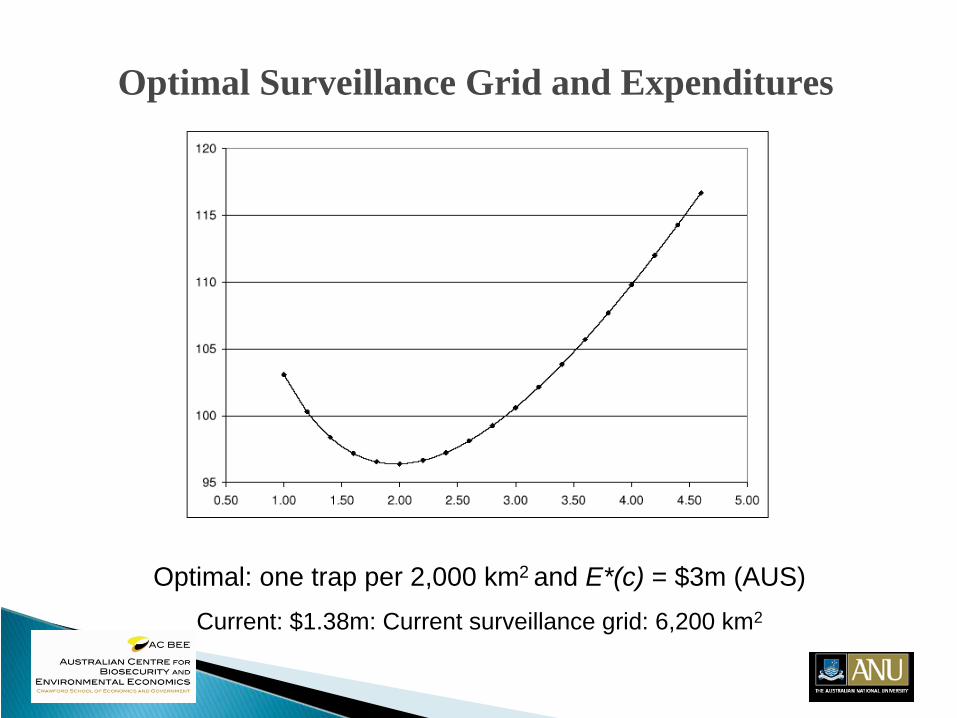
Optimal Surveillance Grid and Expenditures
Optimal: one trap per 2,000 km2 and E*(c) = $3m (AUS)Current: $1.38m: Current surveillance grid: 6,200 km2

Time
Infected Animals/Area
(N)
Containment and Eradication(The role of cost-benefit analysis (CBA) after an incursion,
or for a potential incursion.)
Note: The potential size of benefits depend on size of initial entry and the choice of early detection, for given eradication/containment exercise.
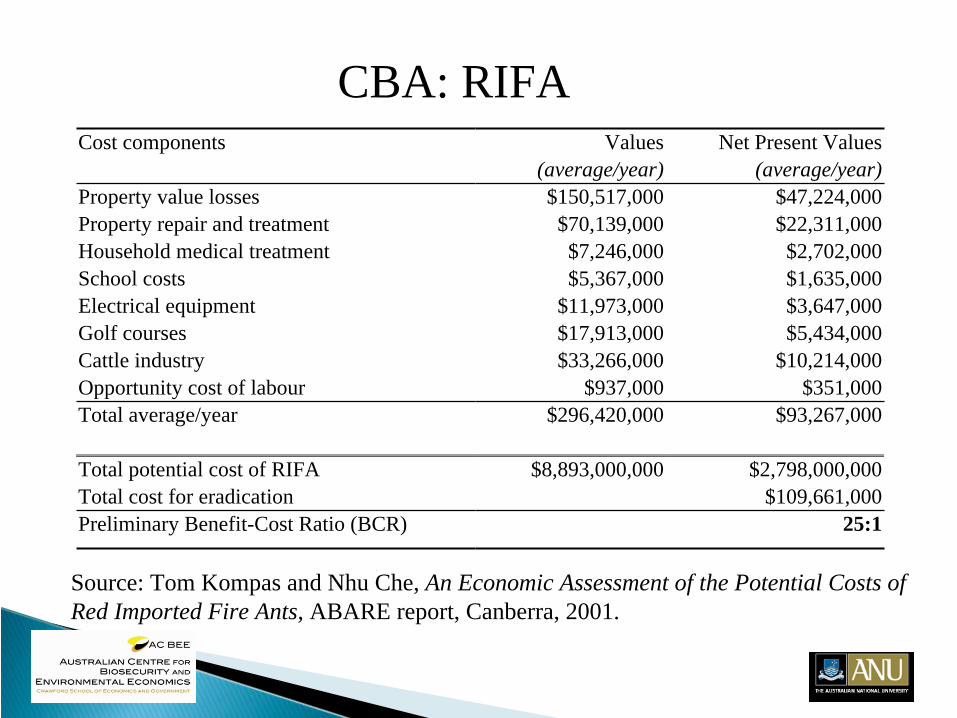
Cost components Values Net Present Values (average/year) (average/year)
Property value losses $150,517,000 $47,224,000Property repair and treatment $70,139,000 $22,311,000Household medical treatment $7,246,000 $2,702,000School costs $5,367,000 $1,635,000Electrical equipment $11,973,000 $3,647,000Golf courses $17,913,000 $5,434,000Cattle industry $33,266,000 $10,214,000Opportunity cost of labour $937,000 $351,000Total average/year $296,420,000 $93,267,000
Total potential cost of RIFA $8,893,000,000 $2,798,000,000Total cost for eradication $109,661,000Preliminary Benefit-Cost Ratio (BCR) 25:1
CBA: RIFA
Source: Tom Kompas and Nhu Che, An Economic Assessment of the Potential Costs of Red Imported Fire Ants, ABARE report, Canberra, 2001.

0.00
0.05
0.10
0.15
0.20
0.25
-
1,25
0 2,
500
3,75
0 4,
999
6,24
9 7,
499
8,74
9 9,
999
11,24
9
Values in Millions
PRO
BA
BIL
ITY
Probability Frequency on NPV of the costs of RIFA:

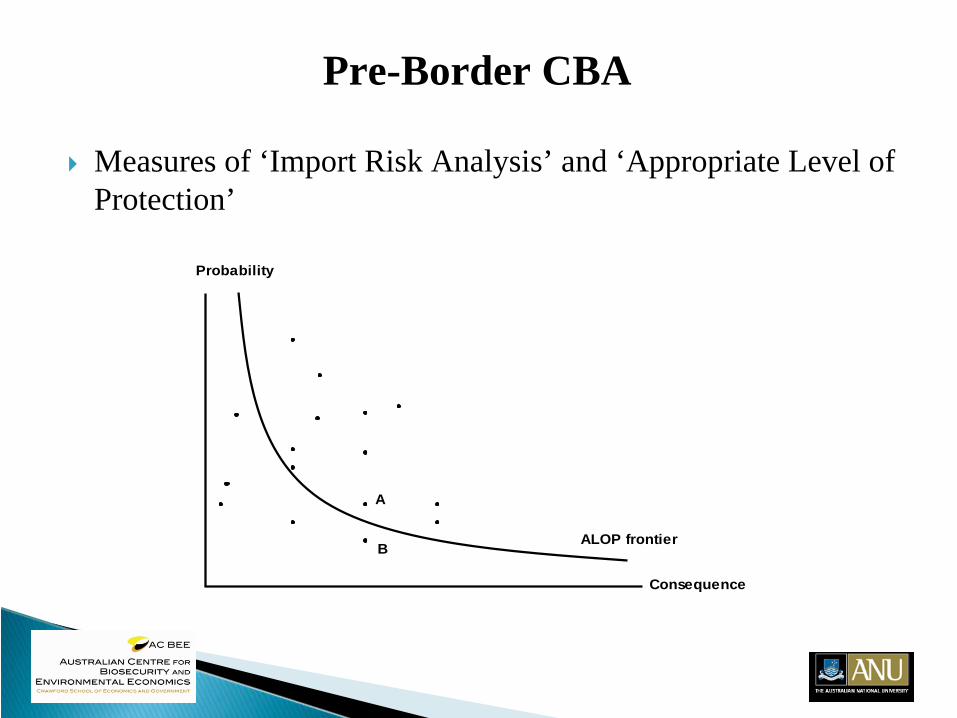
Pre-Border CBA
Measures of ‘Import Risk Analysis’ and ‘Appropriate Level of Protection’
ALOP frontier
Probability
Consequence
A
B

http://www.crawford.anu.edu.au/staff/tkompas.php