kompas tb png - development policy centre · kompas tb png.pptx author: tom kompas created date:...
TRANSCRIPT

The Economics of Tuberculosis Control in PNG and the Torres Strait
Hoa Nguyen, Roslyn Hickson, Tom Kompas, Geoff Mercer and Kamalini Lounge
Presenter: Tom Kompas
Crawford School of Public Policy Australian NaGonal University
www.acbee.anu.edu.au
.


PNG Health and Tuberculosis (TB) Facts High Prevalence of TB:
Ø 430 per 100,000 pop in PNG Ø 197 per 100,000 pop in Western Pacific Region
Ø 6 per 100,000 pop in Australia High prevalence of mul6drug resistant TB in PNG
Ø 25% of Australian MDR-‐TB cases from the TS islands
Low level of expenditure on health
Ø Total expenditure on health per capita: § 71 (Int’l $, 2009) in PNG
§ 3,382 (Int’l $, 2009) in Australia
Ø Total expenditure on health as % of GDP (2009): § 3.1% in PNG; 8.5% in Australia

Current TB Control Strategy in PNG Directly Observed Treatment Short Course (DOTS) Program
Ø Treatment lasts about 6 months
Ø Risk of drug resistance in TB strain if inconsistent or parGal treatment
Ø Current DOTS coverage is about 14% in PNG
What is the cost and benefit of expanding DOTS?
We focus only on South Fly District
Ø Pop size: about 50,000 people (about 7 mill people in PNG)
Ø <5km to TS islands
Ø Free movement allowed for “tradiGonal acGviGes”
Ø There were 59,003 movements in 2008-‐09 (about 162/day)
§ 98% of movements are by PNG ciGzens, possibly due to the “health gradient”

The Papua New Guinea (PNG) and Torres Strait (TS) Region
South Fly, Western District
South Fly, Western District
Less than 100 cases per 100,000 per year
100-199 cases per 100,000 per year
200-299 cases per 100,000 per year
More than 300 cases per 100,000 per year

The Epidemiological and Economic Models
.

Epidemiological Model: Not taking into account HIV co-‐infecGon and MDR.
S: SuscepGble
L: Latent InfecGous
N: Non-‐infecGous
I: infecGous
D: Detected
T: Treatment applied

Benefit in Quality-‐Adjusted Life Year (QALY) gained
Ø QALYs in one year = 1* Q
where Q = 1 if full health; Q = 0.71 – 0.74 with acGve TB
Ø Quality-‐Adjusted Life Expectancy at age a is defined:
where L is the residual life expectancy of the individual at age a
Ø Discounted QALE:
where r is the discount rate
Ø Quality-‐Adjusted Life Year (QALY) gained due to intervenGons
where and are vectors of health-‐related quality of life weights generated by the
epidemiological model with and without intervenGons
QALE = Qtt=a
a+L
∑
DQALE = Qt
(1+ r)t−at=a
a+L
∑
QALYgained = Qit
(1+ r)t−at=a
a+Li
∑ −Qt
(1+ r)t−at=a
a+L
∑
Qti Qt
Economic Model (1): IntervenGons: Expanding minimum DOTS from 2012
to 2050: Baseline: 0% coverage of DOTS

Economic Model (2): Conversion:
Ø Convert QALY into dollars: § PPP Converted GDP Per Capita in PNG: $Int’l 2,826.08
§ Note: Australian Willingness to pay per QALY is $Int’l 43,456.06
Cost :
Ø DiagnosGcs, treatment of infecGous TB and the TB program (regional proxies but no
hospitalizaGon cost)
Ø Total cost per paGent varies across the level of coverage (regional proxies and WHO
data):
Ø 463 -‐ 1,100 $Int’l for the first treatment
Ø 562 -‐ 1,200 $Int’l for follow-‐up treatment (if needed)
Discount rate: 3% per annum; all valued in $Int’l 2005 price

Cost versus Gain of expanding DOTS: 2012-‐50 ($Int’l 2005 price)
-‐
1
2
3
4
5
6
7
8
9
-‐
50
100
150
200
250
300
350
15% 30% 50% 80% 95%
Gain
Millions
Cost
Thou
sand
s
Cost versus Gain ($)
Cost (Int'l Dollar 2005) QALY gain (Int'l Dollar 2005)
-‐
500
1,000
1,500
2,000
2,500
3,000
3,500
-‐
50
100
150
200
250
300
350
15% 30% 50% 80% 95%
Gain Cost
Thou
sand
s
Cost versus Gain (QALY)
Cost (Int'l Dollar 2005) Gain (QALY-‐year)
Average cost per QALY is about $Int 6
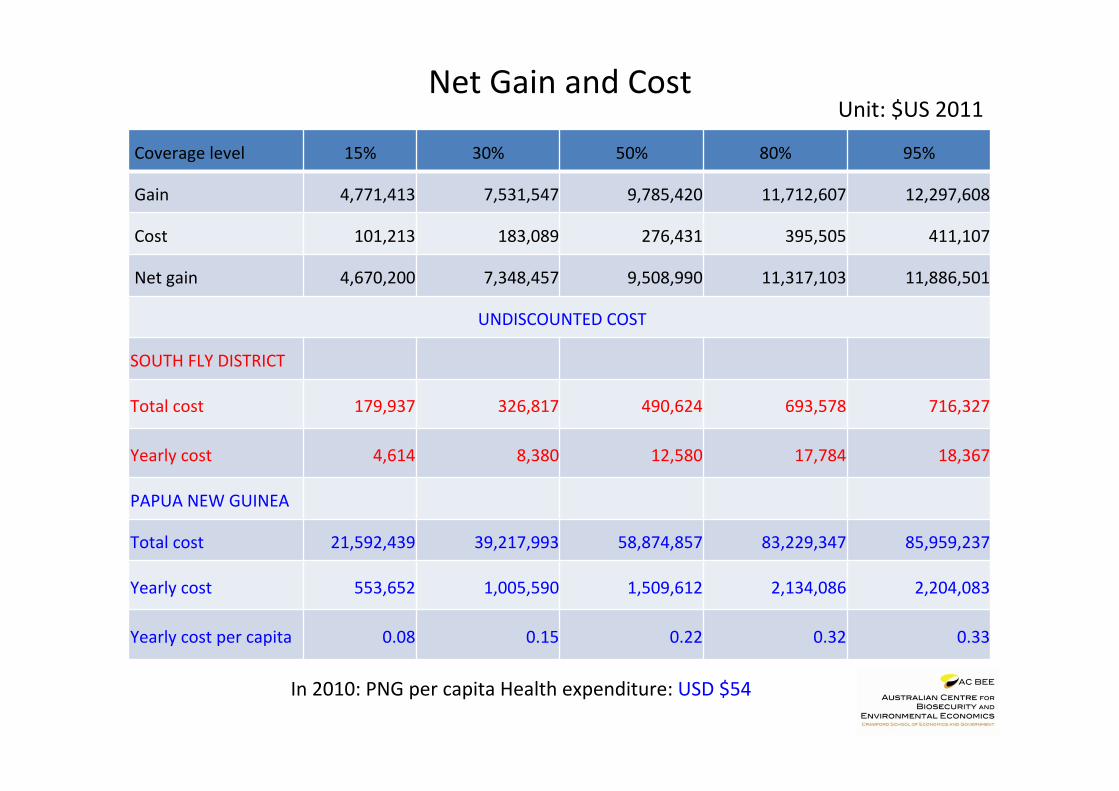
Net Gain and Cost
Coverage level 15% 30% 50% 80% 95%
Gain 4,771,413 7,531,547 9,785,420 11,712,607 12,297,608
Cost 101,213 183,089 276,431 395,505 411,107
Net gain 4,670,200 7,348,457 9,508,990 11,317,103 11,886,501
UNDISCOUNTED COST
SOUTH FLY DISTRICT
Total cost 179,937 326,817 490,624 693,578 716,327
Yearly cost 4,614 8,380 12,580 17,784 18,367
PAPUA NEW GUINEA
Total cost 21,592,439 39,217,993 58,874,857 83,229,347 85,959,237
Yearly cost 553,652 1,005,590 1,509,612 2,134,086 2,204,083
Yearly cost per capita 0.08 0.15 0.22 0.32 0.33
Unit: $US 2011
In 2010: PNG per capita Health expenditure: USD $54

What’s missing? • Costs and gains of non-‐infecGous acGve TB paGents are not
counted. • Modeling and costs and gains of MDR and HIV/TB co-‐infecGon
(and cross-‐border effects) need to be added. • More accurate measures of the cost of the TB program per
unit in PNG (both inside and outside of the South Fly region). • Parameters/calibraGon of cross-‐border movements needs to
be verified. • Clear life-‐expectancy tables in PNG. • Parameter values and age-‐structure (current and changing
over Gme) in the epidemiological and economic models. • DALY and producGvity comparaGve measures are needed.

Thanks for listening!
Tom Kompas [email protected]
hsp://www.crawford.anu.edu.au/staff/tkompas.php
www.acbee.anu.edu.au