zem 2 all project presentation on ieee its 2015 congress
TRANSCRIPT


Summary
• Main Features.
• Why ZEM 2 ALL was necessary
• Consortium Members.
• Requirements.
• Verification Packages.
• Services.
• Hardware and software.
• Participants and trips.
• Key Findings.
• Traffic Data Management.
• EV usage.
• Demand Monitoring, Prediction and Demand Response
• Driving Analysis
• Participants’ Satisfaction.
2
Sum
mar
y

Summary
• Main Features.
• Why ZEM 2 ALL was necessary
• Consortium Members.
• Requirements.
• Verification Packages.
• Services.
• Hardware and software.
• Participants and trips.
• Key Findings.
• Traffic Data Management.
• EV usage.
• Demand Monitoring, Prediction and Demand Response
• Driving Analysis
• Participants’ Satisfaction.
3
Sum
mar
y

Main Features
• Why ZEM 2 ALL was necessary
• Nobody can doubt nowadays that electrification of transport will play a principal role in future urban and suburban mobility.
• Unless adequately tested, they cannot be prevented all the consequences, needs and opportunities of real Electric Mobility.
• EV related projects tend to test some type of uses, some type of customers, some type of infrastructures, some platforms, but not all of them sharing the same scenario.
• ZEM 2 ALL is a comprehensive demonstration and research project:
4
Mai
n F
eat
ure
s
• Including most representative elements of
electric mobility.
• Acting all together.
• In a real world.

Summary
• Main Features.
• Why ZEM 2 ALL was necessary
• Consortium Members.
• Requirements.
• Verification Packages.
• Services.
• Hardware and software.
• Participants and trips.
• Key Findings.
• Traffic Data Management.
• EV usage.
• Demand Monitoring, Prediction and Demand Response
• Driving Analysis
• Participants’ Satisfaction.
5
Sum
mar
y

Main Features
• Consortium Members
6
Mai
n F
eat
ure
s

Summary
• Main Features.
• Why ZEM 2 ALL was necessary
• Consortium Members.
• Requirements.
• Verification Packages.
• Services.
• Hardware and software.
• Participants and trips.
• Key Findings.
• Traffic Data Management.
• EV usage.
• Demand Monitoring, Prediction and Demand Response
• Driving Analysis
• Participants’ Satisfaction.
7
Sum
mar
y

Main Features
• Requirements
8
Mai
n F
eat
ure
s

Summary
• Main Features.
• Why ZEM 2 ALL was necessary
• Consortium Members.
• Requirements.
• Verification Packages.
• Services.
• Hardware and software.
• Participants and trips.
• Key Findings.
• Traffic Data Management.
• EV usage.
• Demand Monitoring, Prediction and Demand Response
• Driving Analysis
• Participants’ Satisfaction.
9
Sum
mar
y
Main Features
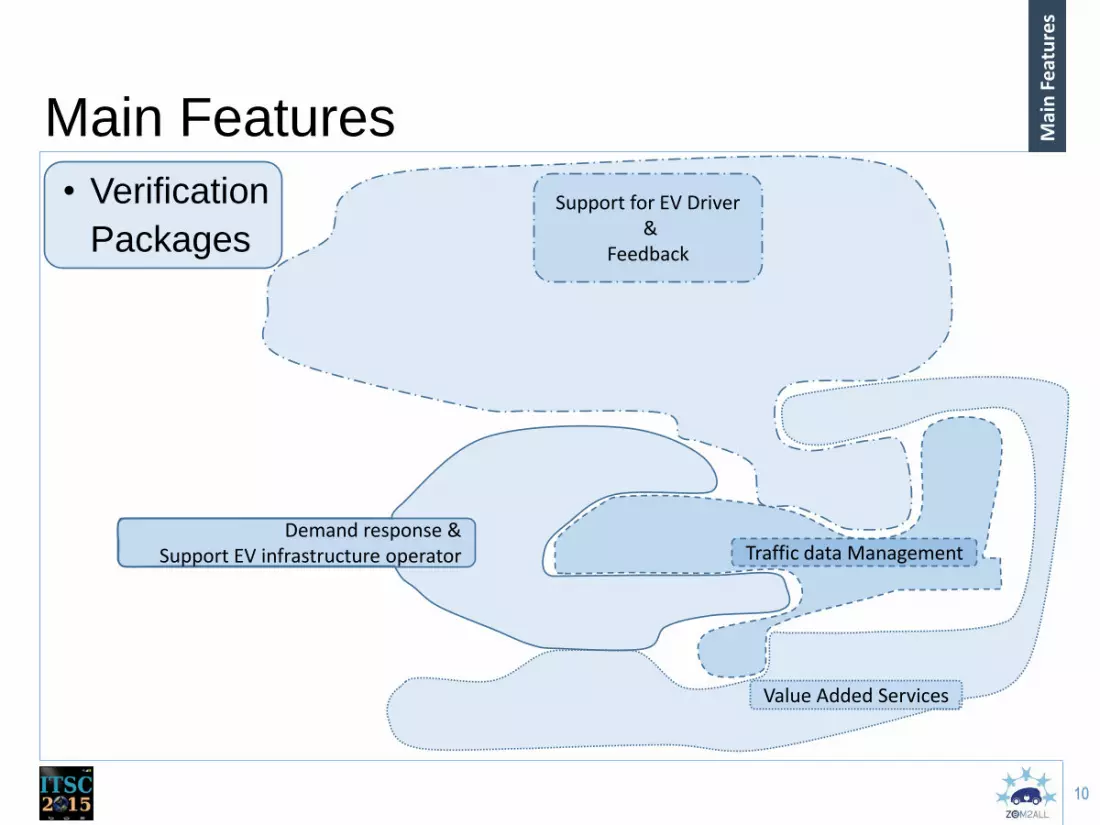
• Verification
Packages
10
Mai
n F
eat
ure
s
Support for EV Driver &
Feedback
Demand response & Support EV infrastructure operator Traffic data Management
Value Added Services

Summary
• Main Features.
• Why ZEM 2 ALL was necessary
• Consortium Members.
• Requirements.
• Verification Packages.
• Services.
• Hardware and software.
• Participants and trips.
• Key Findings.
• Traffic Data Management.
• EV usage.
• Demand Monitoring, Prediction and Demand Response
• Driving Analysis
• Participants’ Satisfaction.
11
Sum
mar
y

Main Features
• Services
12
Mai
n F
eat
ure
s
Demand response & Support EV infrastructure operator
Traffic data Management
Value Added Services
Support for EV Driver &
Feedback
Verification Packages

Summary
• Main Features.
• Why ZEM 2 ALL was necessary
• Consortium Members.
• Requirements.
• Verification Packages.
• Services.
• Hardware and software.
• Participants and trips.
• Key Findings.
• Traffic Data Management.
• EV usage.
• Demand Monitoring, Prediction and Demand Response
• Driving Analysis
• Participants’ Satisfaction.
13
Sum
mar
y
Main Features
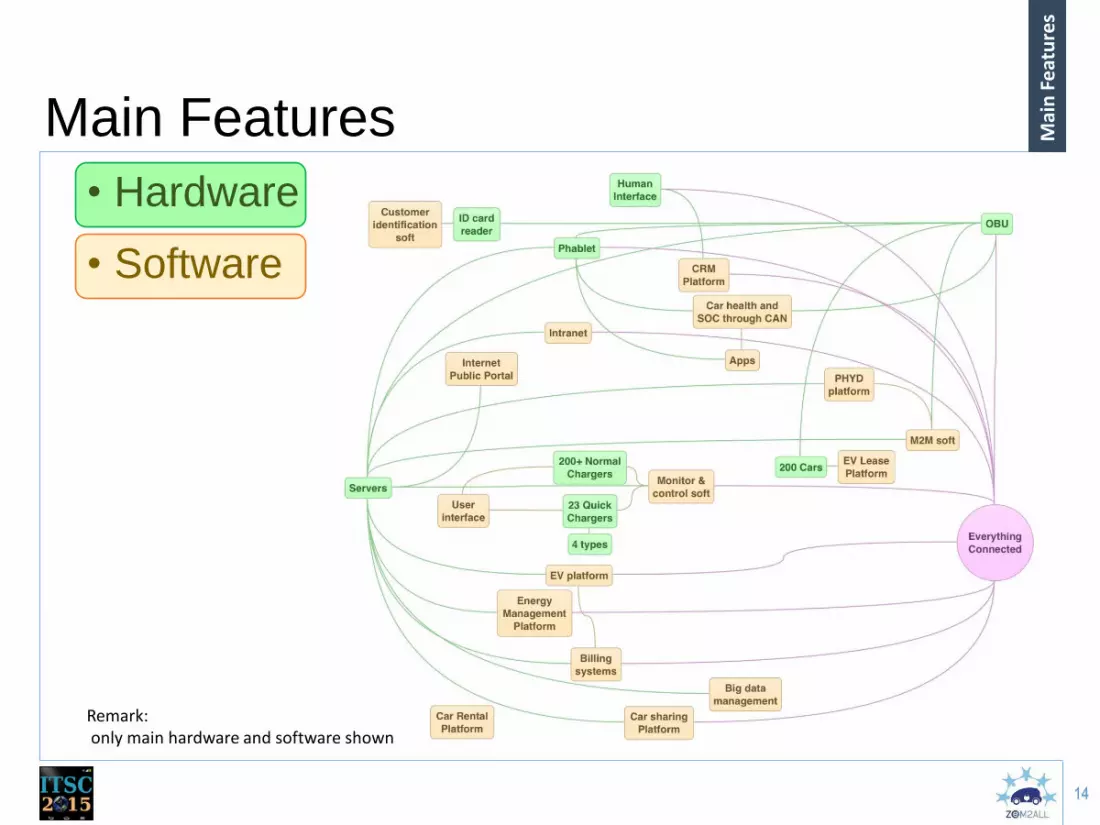
• Hardware
• Software
14
Mai
n F
eat
ure
s
Remark: only main hardware and software shown

Main Features
15
Mai
n F
eat
ure
s

Summary
• Main Features.
• Why ZEM 2 ALL was necessary
• Consortium Members.
• Requirements.
• Verification Packages.
• Services.
• Hardware and software.
• Participants and trips.
• Key Findings.
• Traffic Data Management.
• EV usage.
• Demand Monitoring, Prediction and Demand Response
• Driving Analysis
• Participants’ Satisfaction.
16
Sum
mar
y

Participants and trips
17
Mai
n F
eat
ure
s
32%
29%
14%
10% 15%
Individual
Private Company
Public Company
Municipality
Rent & Car sharing
Participants’ types
Trip patterns
Fleet

Summary
• Main Features.
• Why ZEM 2 ALL was necessary
• Consortium Members.
• Requirements.
• Verification Packages.
• Services.
• Hardware and software.
• Participants and trips.
• Key Findings.
• Traffic Data Management.
• EV usage.
• Demand Monitoring, Prediction and Demand Response
• Driving Analysis
• Participants’ Satisfaction.
18
Sum
mar
y

Key Findings: Traffic Data Management
• By Cumulating probes from cars along some period of time, it could be made a map of average speed on each city point.
19
Traf
fic
Dat
a
Virtual Traffic Data Stations (TDS) They can be set in any position: Comparison between hourly data from actual TDS (red) and from virtual TDS made using vehicle probes.

Key Findings: Traffic Data Management • Study can be done in a specific road.
20
Traf
fic
Dat
a
Spe
ed
• Or check the length of the queue at a light signal depending on hour

Key Findings: Traffic Data Management • It can be done an animation for better understanding the situation
21
Traf
fic
Dat
a
Speed Km/h

Summary
• Main Features.
• Why ZEM 2 ALL was necessary
• Consortium Members.
• Requirements.
• Verification Packages.
• Services.
• Hardware and software.
• Participants and trips.
• Key Findings.
• Traffic Data Management.
• EV usage.
• Demand Monitoring, Prediction and Demand Response
• Driving Analysis
• Participants’ Satisfaction.
22
Sum
mar
y

Key Findings: EV usage • Each car is supplying thousands of data and usage can be easily monitored:
23
EV u
sage
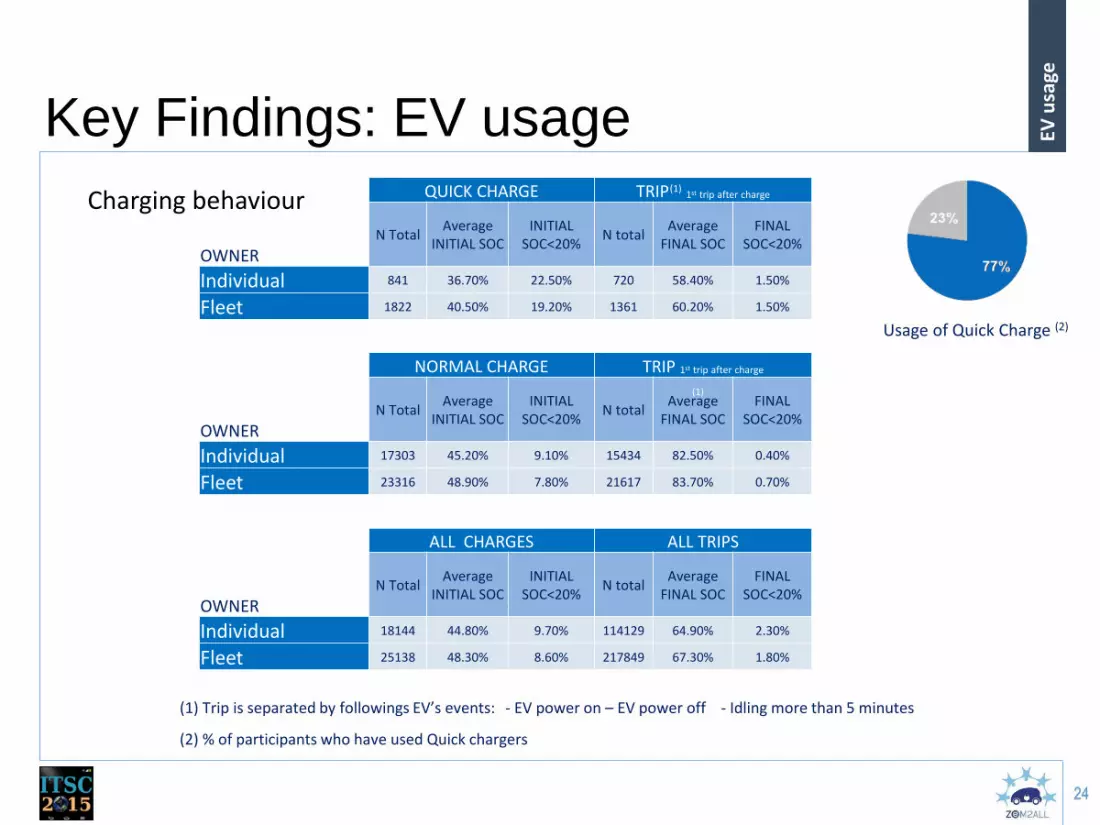
Key Findings: EV usage
24
EV u
sage
QUICK CHARGE TRIP 1st trip after charge
OWNER N Total
Average INITIAL SOC
INITIAL SOC<20%
N total Average
FINAL SOC FINAL
SOC<20%
Individual 841 36.70% 22.50% 720 58.40% 1.50%
Fleet 1822 40.50% 19.20% 1361 60.20% 1.50%
NORMAL CHARGE TRIP 1st trip after charge
OWNER N Total
Average INITIAL SOC
INITIAL SOC<20%
N total Average
FINAL SOC FINAL
SOC<20%
Individual 17303 45.20% 9.10% 15434 82.50% 0.40%
Fleet 23316 48.90% 7.80% 21617 83.70% 0.70%
ALL CHARGES ALL TRIPS
OWNER N Total
Average INITIAL SOC
INITIAL SOC<20%
N total Average
FINAL SOC FINAL
SOC<20%
Individual 18144 44.80% 9.70% 114129 64.90% 2.30%
Fleet 25138 48.30% 8.60% 217849 67.30% 1.80%
(1)
(1)
(1)
(1) Trip is separated by followings EV’s events: - EV power on – EV power off - Idling more than 5 minutes
Charging behaviour
Usage of Quick Charge (2)
(2) % of participants who have used Quick chargers

Summary
• Main Features.
• Why ZEM 2 ALL was necessary
• Consortium Members.
• Requirements.
• Verification Packages.
• Services.
• Hardware and software.
• Participants and trips.
• Key Findings.
• Traffic Data Management.
• EV usage.
• Demand Monitoring, Prediction and Demand Response
• Driving Analysis
• Participants’ Satisfaction.
25
Sum
mar
y

Demand Monitoring and Prediction 1. Most of charges are normal charges.
3. Most of charges for each user take place in the same point.
26
De
man
d
2. Most of users have one dedicated NC point.
4. So Demand Prediction for most users could concentrate in only one point of Normal Charger.
Demand Monitoring and Prediction
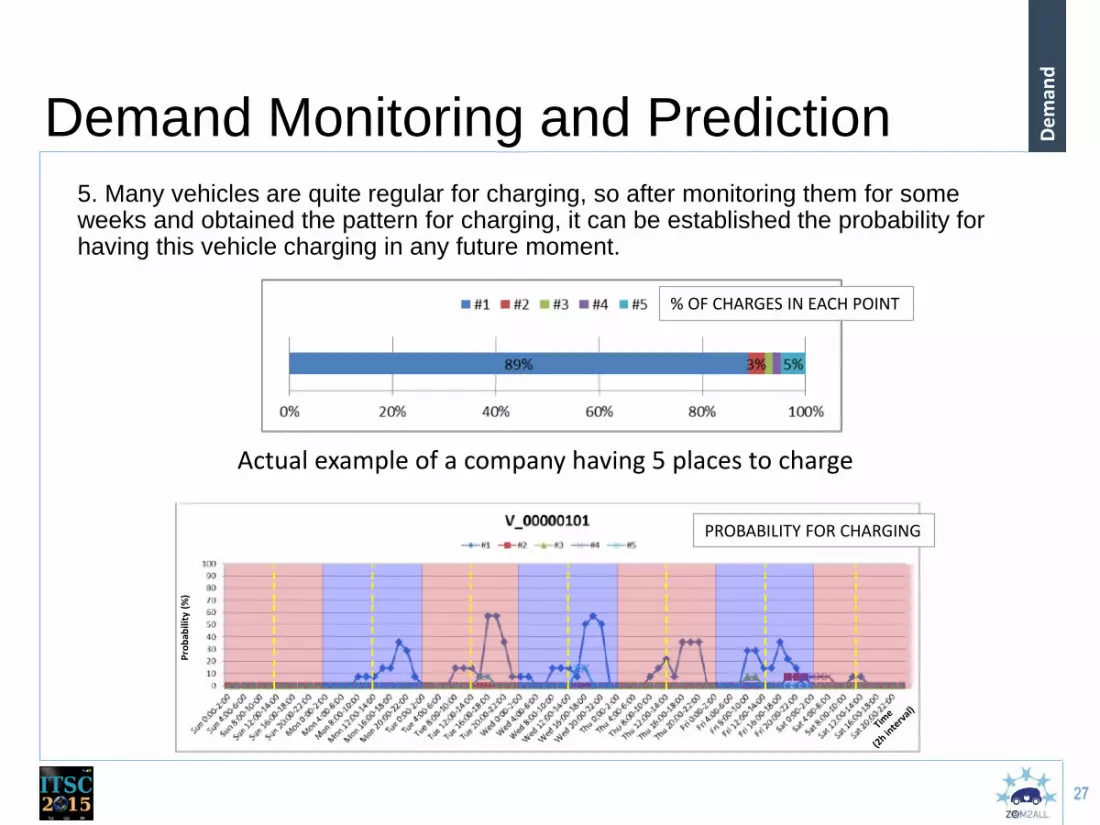
5. Many vehicles are quite regular for charging, so after monitoring them for some weeks and obtained the pattern for charging, it can be established the probability for having this vehicle charging in any future moment.
27
De
man
d
Actual example of a company having 5 places to charge
% OF CHARGES IN EACH POINT
PROBABILITY FOR CHARGING
Pro
bab
ility
(%
)
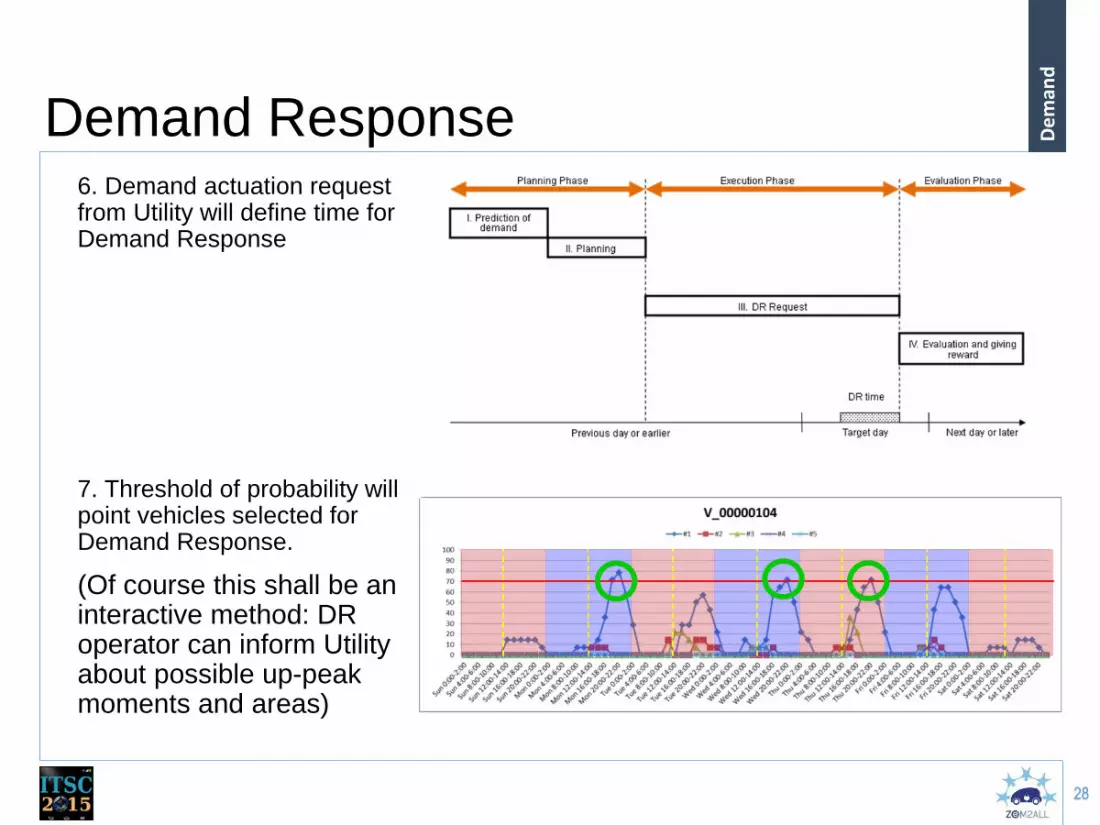
Demand Response 6. Demand actuation request from Utility will define time for Demand Response
7. Threshold of probability will point vehicles selected for Demand Response.
(Of course this shall be an interactive method: DR operator can inform Utility about possible up-peak moments and areas)
28
De
man
d

Summary
• Main Features.
• Why ZEM 2 ALL was necessary
• Consortium Members.
• Requirements.
• Verification Packages.
• Services.
• Hardware and software.
• Participants and trips.
• Key Findings.
• Traffic Data Management.
• EV usage.
• Demand Monitoring, Prediction and Demand Response
• Driving Analysis
• Participants’ Satisfaction.
29
Sum
mar
y

Driving Analysis
30
Dri
vin
g A
nal
ysis
Front Crash: http://www.youtube.com/watch?v=X5POAp3Uwz4&feature=plcp&context=C353fd7aUDOEgsToPDskJUkMWAS7R5i2aODGziFigT Rear Crash: http://www.youtube.com/watch?v=vKTmMP7ghwk&feature=plcp&context=C3d75089UDOEgsToPDskJVa1bf7TAuEoO_dGPwSyca

Driving Analysis
31
Dri
vin
g A
nal
ysis

Driving Analysis
32
Dri
vin
g A
nal
ysis

Summary
• Main Features.
• Why ZEM 2 ALL was necessary
• Consortium Members.
• Requirements.
• Verification Packages.
• Services.
• Hardware and software.
• Participants and trips.
• Key Findings.
• Traffic Data Management.
• EV usage.
• Demand Monitoring, Prediction and Demand Response
• Driving Analysis
• Participants’ Satisfaction.
33
Sum
mar
y

Participants’ survey.
34
Sati
sfac
tio
n
Universe: All zem2all participants Sample: 90% of participants in 2013, 85% in 2014 Methodology: Survey using Computer Assisted Telephone Interview (CATI) Field work: August 2013, and August 2014 Numeric scale: Participants answer to the questions in score 0-10

どうもありがとうございます
35
Than
k Yo
u
THANK YOU! Rafael del Rio Project Manager +34 630 960 976 [email protected]