ieee tmi 2008
TRANSCRIPT

IEEE TRANSACTIONS ON MEDICAL IMAGING, VOL. 27, NO. 5, MAY 2008 697
A Multichannel Watershed-Based SegmentationMethod for Multispectral Chromosome
ClassificationPetros S. Karvelis, Student Member, IEEE, Alexandros T. Tzallas, Student Member, IEEE,
Dimitrios I. Fotiadis*, Senior Member, IEEE, and Ioannis Georgiou
Abstract—Multiplex fluorescent in situ hybridization (M-FISH)is a recently developed chromosome imaging technique where eachchromosome class appears to have a distinct color. This techniquenot only facilitates the detection of subtle chromosomal aberrationsbut also makes the analysis of chromosome images easier; bothfor human inspection and computerized analysis. In this paper, anovel method for segmentation and classification of M-FISH chro-mosome images is presented. The segmentation is based on themultichannel watershed transform in order to define regions ofsimilar spatial and spectral characteristics. Then, a Bayes classi-fier, task-specific on region classification, is applied. Our methodconsists of four basic steps: 1) computation of the gradient mag-nitude of the image, 2) application of the watershed transform todecompose the image into a set of homogenous regions, 3) classifi-cation of each region, and 4) merging of similar adjacent regions.The method is evaluated using a publicly available chromosomeimage database and the obtained overall accuracy is 82.4%. Byintroducing the classification of each watershed region, the pro-posed method achieves substantially better results compared toother methods at a lower computational cost. The combination ofthe multichannel segmentation and the region-based classificationis found to improve the overall classification accuracy compared topixel-by-pixel approaches.
Index Terms—Bayes classification, chromosome images, kary-otyping, multichannel segmentation, multiplex fluorescent in situhybridization (M-fISH), watershed transform.
I. INTRODUCTION
CHROMOSOME analysis is an essential procedure for de-tecting genetic abnormalities in cells. Traditionally, cells
are classified according to their karyotype, which is a tabulararray where the chromosomes are aligned in pairs. Karyotyping
Manuscript received August 29, 2007; revised November 22, 2007. This workwas supported by the European Commission as part of the project MATCH (IST-2005- 027266). Asterisk indicates corresponding author.
P. S. Karvelis is with the Computer Science Department, University of Ioan-nina, GR 45110 Ioannina, Greece (e-mail: [email protected]).
A. T. Tzallas is with the Unit of Medical Technology and Intelligent Informa-tion Systems, Department of Computer Science, University of Ioannina, 45110Ioannina, Greece (e-mail: [email protected]).
*D. I. Fotiadis is with the Unit of Medical Technology and Intelligent In-formation Systems, Department of Computer Science, University of Ioannina,and also with the Biomedical Research Institute, FORTH, GR 45110 Ioannina,Greece (e-mail: [email protected]).
I. Georgiou is with Genetics Unit, Department of Obstetrics and Gynecology,Medical School, GR 45110 Ioannina, Greece (e-mail: [email protected]).
Color versions of one or more of the figures in this paper are available onlineat http://ieeexplore.ieee.org.
Digital Object Identifier 10.1109/TMI.2008.916962
is a useful tool to detect deviations from normal cell structuresince abnormal cells may have an excess or a deficit of chromo-somes [1]. Normal cells contain 46 chromosomes which con-sist of 22 pairs of similar, homologous chromosomes and twosex-determinative chromosomes (XY: male and XX: female).Normally, the procedure of assigning each chromosome to aclass (karyotyping) is based on the visual scanning of chromo-some images by experts (biologists, cytogeneticists). This visualinspection is a time consuming process and expensive. Hence,many attempts have been made to improve visual analysis ofchromosomes.
A newly developed cytogenetic technique has been proposed[2]; this technique, which is called multiplex fluorescence in situhybridization (M-FISH), has made chromosome analysis mucheasier not only for visual inspection but also for computer anal-ysis. M-FISH uses five different color dyes that attach to specificsequences of DNA in a way that each class of chromosomes ab-sorbs a unique combination of dyes. Also a DNA stain calledDAPI (4 in, 6-Diamidino-2-phenylindole) attaches to DNA andthus labels all chromosomes. Thus, at least dyes areneeded for combinatorial labeling to uniquely identify all 24chromosomes.
M-FISH images are captured with a fluorescent microscopewith multiple optical filters, where each of the dyes is visiblein one of the spectral channels. In this way, each pixel of thenew multispectral image is represented as a 5-D vector, whereeach element of the vector represents the magnitude of the dyeat that pixel of the image. Using this combinatorial labeling, itis possible to determine the most likely chromosomal origin foreach pixel of the image (Fig. 1).
This new imaging technique introduces several advantages.1) The chromosome classification is simplified [2]. Only the
spectral information from the multispectral image is esti-mated and no features such as length, centromere position,and band pattern are used.
2) Subtle chromosomal aberrations are detected [3]. Tradi-tional monochrome imaging techniques failed to detect re-arrangements of genetic material such as the translocationof telemetric chromatin, because it is difficult to detectthem with banding alone. M-FISH (color karyotyping) isable to sufficiently depict these anomalies.
3) It can be used for the identification of small geneticmarkers that remain elusive after banding [4].
M-FISH images are analyzed by experts to obtain vital in-formation about the health of an individual. However, manual
0278-0062/$25.00 © 2008 IEEE

698 IEEE TRANSACTIONS ON MEDICAL IMAGING, VOL. 27, NO. 5, MAY 2008
Fig. 1. (a) M-FISH chromosome image of a woman missing one chromosomefrom class 13 and (b) karyotype of the M-FISH image: 45 XX-13.
examination of these images is a laborious and difficult task re-quiring skilled lab technicians. Many attempts have been madeto automate parts of the chromosome image analysis procedure[2]–[12]. Digital image processing methods provide automatedcolor karyotyping making the decision of the expert more ob-jective. Despite their success, they report less than perfect clas-sification accuracy. Indeed, the size of misclassified regions issignificant compared to those of the small regions involved inthe complex chromosome abnormalities. However, it is highlydesirable to have accurate classification for reliable patient di-agnosis (e.g., cancer and genetic disease diagnosis).
In this work, the segmentation and classification of chromo-some M-FISH images are addressed effectively. A multichannelwatershed based segmentation method of the M-FISH imagesis proposed to produce an initial tessellation of the M-FISHimage into a large number of homogenous regions. Theseregions (watershed regions) are then classified using a Bayesianclassifier. Related methods, using pixel-by-pixel classificationproduce noisy results [5]. Indeed, for this type of classification,performances vary significantly through the M-FISH imagedataset. Accuracies above 90% have been reported for a part ofthe dataset [7]–[10] but the average classification accuracy for
Fig. 2. Flowchart of the proposed method.
the whole dataset was only 68% with standard deviation 17.5%[11]. For this reason, in a split step the image is subdivided intosmall homogenous regions where the watershed segmentationis applied. In a merge step, neighboring regions which belongto the same class (1, 2, , 22, , ) are grouped together.
Our approach is a two-stage process (Fig. 2). First, wesegment the image and second, we classify the resulting regions[12]. This is quite different from the classical pixel-by-pixelapproach, in which the spatial context is not considered andclassification is performed directly on the feature space. Untilnow, to our knowledge there is no method in the literaturerelated to multichannel chromosome image segmentation. Theproposed segmentation method segments the M-FISH imageinto homogeneous regions, with respect to their measuredcharacteristics such as intensity, color etc. This provides abetter segmentation scheme which resulted in higher clas-sification accuracy [13]. Furthermore, a region classificationmethod is introduced, for the first time in M-FISH chromosomeanalysis, eliminating pixel misclassification errors producedby pixel-by-pixel approaches. Finally, the ability of the re-gion-based classification to enhance the resolution in smallchromosomes is a promising aspect for small chromosomeabnormality detection.
II. RELATED WORK
Since M-FISH technology has been introduced, manyattempts have been reported which tackle the problem of seg-menting and classifying chromosomes [2], [5]–[12]. Semi-au-tomated analysis of M-FISH images was first introduced in themid-1990s [2]. The DAPI channel was used to create a binarymask. Then, for each pixel of the mask a threshold was appliedin order to detect the presence or absence of a fluor in that pixel.Each pixel class was determined by comparing the response ofthe combined fluors to that of a labeling table.
Region based classification approaches were also introduced[5], [6]. The method of Eils et al. [5] consisted of two stages: 1)spectral calibration and 2) adaptive region classification. During

KARVELIS et al.: A MULTICHANNEL WATERSHED-BASED SEGMENTATION METHOD 699
TABLE IADVANTAGES AND LIMITATIONS OF OTHER RELATED METHODS
the calibration stage a 5-D optimal vector called adaptive fea-ture vector, representing each class, was found by minimizingan energy term. The region classification stage was based ona Voronoi image tessellation algorithm. Then the closest adap-tive feature was computed determining the class for each re-gion. Neighboring regions were merged if they belong to thesame class or alternatively, when their color distance was belowa preset threshold.
Saracoglu et al. [6] modeled the problem using a method con-sisting of three steps: image tessellation, clustering, and clas-sification. The image was tessellated into regions with similarproperties using a region growing approach (tessellation step).Based on the “average” color information of the regions, clus-tering is performed. The region color vectors are grouped toform a known number of clusters (clustering step). Finally, eachcluster is assigned to one of the color class vectors (classifica-tion step).
Methods using pixel-by-pixel classification algorithms havebeen introduced in M-FISH analysis. These methods either clas-sify each pixel of the M-FISH image [7], [8] or create a binarymask of the DAPI image using edge detection algorithms, andclassify each pixel of the mask [9], [10]. Recently, a method forjoint segmentation-classification of chromosome M-FISH im-ages was presented [11]. They introduced a probabilistic modelof M-FISH chromosomes which allows for simultaneous seg-mentation and classification. The additional information pro-vided by multiple spectra in chromosome images made it fea-sible to distinguish chromosomes that overlap and are in touchwithin clusters.
Table I presents the advantages and limitations of relatedstudies on chromosome segmentation and classification whichappeared in the literature. Most of these methods [7]–[11]deal with the above problem using pixel-by-pixel classificationtechniques; without taking into account neighborhood infor-mation. On the other hand, only few region-based methods [5],[6] have been proposed in the literature, which are based on alarge number of parameters which are determined heuristically.In addition, none of the aforementioned methods exploit themultichannel information provided by a multichannel segmen-tation method. The proposed study makes use of a multichannelsegmentation method in order to more accurately segment theM-FISH images while the use of a region-based classificationapproach improves the classification efficiency.
A very powerful segmentation method that has been widelyused in image segmentation problems is the watershed trans-form (WT) [14]–[20]. Since its original application on gray-scale images [14], [15], a very attractive computational form hasbeen derived [16] and extended to color images [17]. An exten-sive review of the watershed algorithms can be found in [20].
The watershed transform presents some advantages overother developed segmentation methods.
1) The watershed lines form closed and connected regions,where edge based techniques usually define disconnectedboundaries that need postprocessing to produce closed re-gions.
2) The watershed lines always correspond to obvious con-tours of objects which appear in the image.

700 IEEE TRANSACTIONS ON MEDICAL IMAGING, VOL. 27, NO. 5, MAY 2008
The main problem of over-segmentation, can be usuallyovercome by the use of preprocessing or postprocessing, pro-ducing a segmentation that better reflects the arrangement ofobjects within the image. Such preprocessing or postprocessingmethods include region merging [21], multiscale watershed[22], [23], marker-based watershed segmentation [24], [25],and watershed-based deformable models [26], [27].
III. WATERSHED BASED M-FISH IMAGE SEGMENTATION
In the first stage, segmentation of multispectral images usingthe watershed transform is realized in four steps (Fig. 2). Morespecifically, the gradient magnitude of the multispectral image iscomputed combining the contrast information from the differentspectral channels. Due to the high sensitivity of the watershedalgorithm in the variations of the gradient an automatic selec-tion of significant minima is realized in the next step, where thewatershed transform is applied and a large number of homoge-nous regions is produced. A binary mask of the DAPI channel iscomputed and superimposed to the tessellation in order to fur-ther reduce unwanted regions.
A. Multichannel Gradient Computation
To apply the watershed based segmentation algorithm to themultichannel data, the gradient of the multichannel image mustbe defined. The computation of a tensor gradient was intro-duced by DiZenzo et al. [28], instead of separately computingthe scalar gradient for each channel [29]. Drewniok [30] ex-tended this work to multispectral images. Assuming a multi-channel image , for M-FISH images,the direction is defined by the angle
...(1)
(2)
, are the components (channels) of theM-FISH image.
The directional derivative of the function con-sists of the directional derivatives of each component of
.Projecting each directional derivative in the direction , we
have
......
...(3)
where , is the Jacobian matrixand and are the derivatives of the th component in theand direction, respectively.
Next, the direction which corresponds to the maximum ofthe directional derivative is found, by maximizing theEuclidean norm
(4)
The symmetric matrix can be written as
(5)
The extrema of the quantity , are given by theeigenvalues of the matrix [30]. The final outcome of thisstep is: where the gradient magnitudeand the maximum eigenvalue. Sobel operators are used tocompute the directional derivatives in theand directions, respectively. It should be mentioned that priorto the computation of the multichannel gradient magnitude allimage channels are filtered using a 3 3 median filter.
B. Minima Selection
Direct application of the watershed algorithm to a gradientimage usually leads to over segmentation due to noise and otherlocal irregularities of the gradient. A practical solution to thisproblem is to limit the number of allowable regions by reducingthe number of irrelevant minima. Several algorithms have beenproposed for minima selection. The simplest is interactive se-lection by the user [31] or by using a priori knowledge of theimage [32]. The dynamics approach [33] orders all minima andselects only those above a threshold.
We have used the dynamics approach [34] to reduce thenumber of unwanted minima, as it provides an intuitive se-lection scheme controlled by a single parameter using thegrayscale reconstruction [35]. Let and be two binaryimages taking their values from the discrete set {0,1}, suchthat and are the connectedcomponents of . The reconstruction of (mask)
from (marker) is
(6)
Based on the threshold superposition principle [34], thegrayscale reconstruction of two grayscale images andtaking their values from the discrete set , suchthat (i.e., for each pixel , ), isdefined as:
(7)
where , and is the number ofintensity levels.
To reduce the number of minima, we apply the grayscale re-construction to the gradient magnitude
(8)
where , , is the gradient mag-nitude image, denotes the complement operator where inthe gradient case , , and is thegrayscale reconstructed gradient magnitude.

KARVELIS et al.: A MULTICHANNEL WATERSHED-BASED SEGMENTATION METHOD 701
Fig. 3. Example of regional minima, catchment basins, and watershed linesproduced by the watershed transform.
C. Watershed Transform
Watersheds are defined in terms of the drainage patterns ofrainfall. Generally, regions of terrain that drain to the same pointare defined to be part of the same watershed. The same analysiscan be applied to grayscale images based on the visualizationof gray level into its topographic representation. This analysisincludes three basic notions: minima, catchment basins, and wa-tershed lines. Let be a grayscale image, a (regional) minimum
is a connected set of pixels with intensity , from which itis impossible to reach a pixel intensity without having to passfrom a pixel of intensity , where .
The catchment basin associated with the minimumis a set of pixels such that if a drop of water falls at any pixel in
, then it will flow down to the minimum . Watershedsare defined as the lines separating the catchment basins whichbelong to different minima. Fig. 3 illustrates the above featuresof the watershed transform.
We adopted an efficient implementation of the watershedtransform [16]. The watershed computation algorithm usedhere is based on the Immersion Approach: imagine that a holeis drilled in each minimum of the surface, and water is floodedinto different catchment basins from the holes. As a result, thewater starts filling all catchment basins, which have minimaunder the water level. If two catchment basins would merge asa result of further immersion, a dam is built all the way to thehighest surface altitude and the dam represents the watershedlines. This flooding process will eventually reach a stage whenonly the top of the dam is visible above the water line.
The output of the watershed algorithm is a tessellation of theinput image into its different catchment basins, each one charac-terized by a unique label. The pixels that belong to the watershedlines are assigned a special label. Fig. 4(a) illustrates the initialsegmentation produced by the watershed transform. In Fig. 4(b)all the watershed regions are represented by the average colorof each region, which is valuable information for the cytoge-neticist.
Fig. 4. Watershed segmentation of an M-FISH image: (a) watershed regionssuperimposed (white line) on the M-FISH image and (b) watershed regions arelabeled with the average color of each region.
D. Creation of the Binary Mask
This step was incorporated into the watershed scheme in orderto correct two types of segmentation errors: 1) regions that hy-bridize (Fig. 5, Case A) but do not belong to chromosomes, asit appears in the segmentation map and 2) regions that fail hy-bridization (Fig. 5, Case B) and thus fail to appear in the seg-mentation map. Thus, watershed segmentation had to be refined,by adding or removing regions of interest. This was done by cre-ating a binary mask of the DAPI channel and combining it withthe watershed segmentation map.
The binary image (mask), , is created using the Otsu’smethod [36]. Otsu’s method is a nonparametric technique thatprovides a fast and simple way [37], [38] to select automaticallya threshold value. This thresholding procedure is considered asthe partitioning of the pixels of an image into two classes
(background) and(objects) where is the total number of gray levels in the image.The pixels that belong to objects (chromosomes) are labelled“1” and “0” otherwise. In order to segment all the chromosomes,Otsu’s method was applied only to the DAPI image which dyesall the chromosome classes. The threshold value is found bymaximizing the following measure of class separability:
(9)
where is the between-class variance and is the totalvariance of the histogram. Thus, the optimal threshold is de-fined as
(10)
702 IEEE TRANSACTIONS ON MEDICAL IMAGING, VOL. 27, NO. 5, MAY 2008
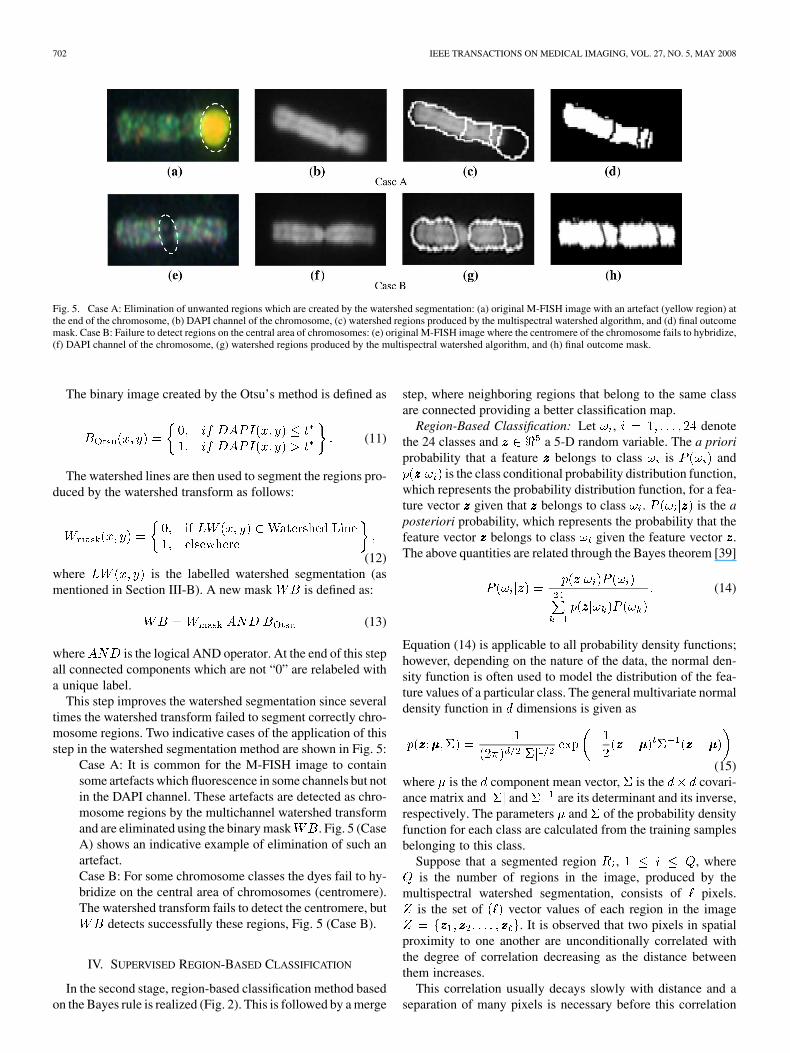
Fig. 5. Case A: Elimination of unwanted regions which are created by the watershed segmentation: (a) original M-FISH image with an artefact (yellow region) atthe end of the chromosome, (b) DAPI channel of the chromosome, (c) watershed regions produced by the multispectral watershed algorithm, and (d) final outcomemask. Case B: Failure to detect regions on the central area of chromosomes: (e) original M-FISH image where the centromere of the chromosome fails to hybridize,(f) DAPI channel of the chromosome, (g) watershed regions produced by the multispectral watershed algorithm, and (h) final outcome mask.
The binary image created by the Otsu’s method is defined as
(11)
The watershed lines are then used to segment the regions pro-duced by the watershed transform as follows:
(12)where is the labelled watershed segmentation (asmentioned in Section III-B). A new mask is defined as:
(13)
where is the logical AND operator. At the end of this stepall connected components which are not “0” are relabeled witha unique label.
This step improves the watershed segmentation since severaltimes the watershed transform failed to segment correctly chro-mosome regions. Two indicative cases of the application of thisstep in the watershed segmentation method are shown in Fig. 5:
Case A: It is common for the M-FISH image to containsome artefacts which fluorescence in some channels but notin the DAPI channel. These artefacts are detected as chro-mosome regions by the multichannel watershed transformand are eliminated using the binary mask . Fig. 5 (CaseA) shows an indicative example of elimination of such anartefact.Case B: For some chromosome classes the dyes fail to hy-bridize on the central area of chromosomes (centromere).The watershed transform fails to detect the centromere, but
detects successfully these regions, Fig. 5 (Case B).
IV. SUPERVISED REGION-BASED CLASSIFICATION
In the second stage, region-based classification method basedon the Bayes rule is realized (Fig. 2). This is followed by a merge
step, where neighboring regions that belong to the same classare connected providing a better classification map.
Region-Based Classification: Let , denotethe 24 classes and a 5-D random variable. The a prioriprobability that a feature belongs to class is and
is the class conditional probability distribution function,which represents the probability distribution function, for a fea-ture vector given that belongs to class . is the aposteriori probability, which represents the probability that thefeature vector belongs to class given the feature vector .The above quantities are related through the Bayes theorem [39]
(14)
Equation (14) is applicable to all probability density functions;however, depending on the nature of the data, the normal den-sity function is often used to model the distribution of the fea-ture values of a particular class. The general multivariate normaldensity function in dimensions is given as
(15)where is the component mean vector, is the covari-ance matrix and and are its determinant and its inverse,respectively. The parameters and of the probability densityfunction for each class are calculated from the training samplesbelonging to this class.
Suppose that a segmented region , , whereis the number of regions in the image, produced by the
multispectral watershed segmentation, consists of pixels.is the set of vector values of each region in the image
. It is observed that two pixels in spatialproximity to one another are unconditionally correlated withthe degree of correlation decreasing as the distance betweenthem increases.
This correlation usually decays slowly with distance and aseparation of many pixels is necessary before this correlation

KARVELIS et al.: A MULTICHANNEL WATERSHED-BASED SEGMENTATION METHOD 703
Fig. 6. The a priori probabilities for the chromosome classes 1–22, X and Y.
decays to an insignificant value. However, Kettig [40] and Land-grebe [41] found that pixels within a homogenous region canbe considered independent. Assuming that the watershed trans-form segments the image into homogenous regions the likeli-hood is computed as
(16)
Working with the natural logarithm and dropping all termsthat are the same for all classes, the Bayes decision rule assignsa region to class if
(17)
where
(18)The a priori class probabilities for each class (14), arecomputed using a training set. Then is calculated as thepercentage of all chromosome pixels in the training data thatbelong to class
(19)
where is the relative chromosome size of chromosomeclass .
It is well known that the chromosome class reflects the sizeof each chromosome in descending order (i.e., chromosome 1is the largest and chromosome 22 is the smallest). From Fig. 6,it is obvious that as the chromosome size decreases its a prioriprobability also decreases.
Fig. 7. Example of an M-FISH image segmentation and classification: (a) orig-inal M-FISH image, (b) the segmented image using the multichannel watershedsegmentation, (c) region classification, and (d) the final classification map usingregion merging.
There are still regions that could be merged resulting into ameaningful classification map based on the principle that adja-cent regions of the same class could be merged to one single re-gion. Adjacency is a symmetric relationship which can be easilyrepresented by the region adjacency graph (RAG), where twonodes (representing two distinct regions) are connected if thosetwo regions are adjacent in the image. Two regions are adjacentif they have a common boundary. Therefore, for each region allthe adjacent regions that share the same class are connected. Wehave employed a simple approach for the connection of adjacentregions, based only on the class of each region; more sophisti-cated methods can be employed.
The application of our method in an M-FISH image is shownin Fig. 7. Initially the image is segmented with the multichannelwatershed segmentation [Fig. 7(b)] and then the segmented re-gions are classified based on the region Bayes classificationmethod [Fig. 7(c)]. The final classification map after the regionmerging step is shown in Fig. 7(d). A separate color was usedto represent each chromosome class in the image.
V. RESULTS
A. Dataset
The method is tested on the ADIR M-FISH chromosomeimage database [42]. The database consists of 200 multispectralimages having dimension 517 645 pixels. In this database,there is no annotation for 17 images which are reported as“difficult to karyotype” [42]. These images were also extremelydifficult to karyotype even by our experienced cytogeneticists

704 IEEE TRANSACTIONS ON MEDICAL IMAGING, VOL. 27, NO. 5, MAY 2008
Fig. 8. Three examples of exchange of genetic material (translocation) betweentwo different chromosomes and regions produced by the multichannel water-shed algorithm. Case A: Translocation t(5;17)1, Case B: Translocation t(9;14) ,and Case C: Small translocation t(14;15) .
due to tightly packed chromosomes. Therefore, we excludedthese images from the evaluation of our method. The databasecontains five-channel image sets recorded at different wave-lengths. In addition, a DAPI image file is included for eachM-FISH image. The specimens were prepared with probe setsfrom four different laboratories: Applied Spectral Imaging(Migdal HaEmek, Israel), Advanced Digital Imaging Research(ADIR; League City, TX), Cytocell Technologies (Cambridge,U.K.), and Vysis (Downers Grove, IL).
The dataset includes a classification map, stored as an imagefile established by experienced cytogeneticists [10]. This imageis labelled so that the gray level of each pixel represents its classnumber (chromosome class). In addition, background pixels are0, and pixels in a region of overlap are 1. This data file servesas “ground truth” to test the accuracy of the M-FISH imagesclassification. The specimens include 76 normal male spreads,eight normal female spreads, 99 abnormal spreads.
There are 50 different chromosomal aberrations represented,including numerical abnormalities and structural arrangements.The quality of the spread ranges from excellent to very low.
B. Segmentation
The performance of the segmentation step is evaluated usingthe overall and chromosome segmentation accuracy, defined as
(20)
(21)
The overall segmentation accuracy is 98% with standarddeviation 1% and the chromosome segmentation accuracy is82% with standard deviation 12%. Since a majority of thepixels are background pixels, the chromosome segmentationaccuracy mainly reflects chromosome segmentation. For thisreason, the overall segmentation accuracy (20) was substan-tially higher than chromosome segmentation accuracy (21).Translocation is the most significant rearrangement. It involvestwo nonhomologous chromosomes which result from a breakin each of the chromosomes, and subsequent reunion [43].The detection of translocations is difficult even for an expert.A change in the color of a chromosome tip may be due tonoise, staining, or an actual translocation. Three examplesof translocations are shown in Fig. 8. The translocations areaccentuated due to the variation of the color between tworegions of the same chromosome. It is clear from Fig. 8 that thesegmentation method succeeds in defining regions of the samecolor information which correspond to the translocation. Thus,a more acceptable segmentation map is provided to the expertin order to recognize more easily and accurately chromosomerearrangements.
C. Classification
The classification accuracy is also obtained. Four imageswere chosen randomly three times from the dataset and thetest was performed with the remaining images. Thus threedifferent training subsets ( , , ) were created.The training dataset consists of all chromosome classes andno overlap between the training and testing data exists. Alsopixels belonging to two or more chromosomes (chromosomeoverlaps) were not included for training and testing.
The proposed method was compared with a Bayes pixel-by-pixel classification technique [7], which is the main classifica-tion scheme for several related works in the literature [8]–[11].Pixel-by-pixel classification is performed for the pixels in thesegmented regions of chromosomes. We have trained and eval-uated both methods using the same training and testing set. Theaverage chromosome classification accuracy obtained for eachM-FISH training subset: , , and is shown inTable II.
The number of images in the test dataset is sufficiently large,thus the error rate, defined as: , where is theclassification accuracy, can be approximated using normal dis-tributions [44]. The observed difference in is defined as,
1Where t(��� ;��� ): is the translocation between class- ��� and Class- ���chromosomes.

KARVELIS et al.: A MULTICHANNEL WATERSHED-BASED SEGMENTATION METHOD 705
TABLE IICHROMOSOME CLASSIFICATION ACCURACY USING THE PROPOSED
METHOD AND A PIXEL-BY-PIXEL CLASSIFICATION METHOD
Fig. 9. Region classification accuracy versus segmentation accuracy.
, where is also normally distributed with variance, where
is the number of test images, is the ac-curacy of the pixel-by-pixel classifier and is the accuracyof the region based classification classifier. At 95% confidencelevel, the upper bound for the normal distribution is 1.96 andthus, the confidence interval for the true difference for is:
. Using the first training set theconfidence interval for at 95% confidence level is 0.1140.0 86, which does not span the zero value and thus the differ-ence is statistically significant. Using the other two sets for thesame confidence interval (95%) the confidence level is 0.1180.0 86 and 0. 122 0.0 85, respectively, which does not spanthe zero value and thus they are also statistical significant.
The relationship between segmentation accuracy and re-gion classification accuracy is shown in Fig. 9. It should bementioned, that the segmentation and classification stages aretwo independent methods. Therefore, an almost perfect seg-mentation result cannot ensure the best classification accuracy.Fig. 10(a) depicts the classification accuracy difference betweenthe two methods (the proposed and the one presented in [7])for each chromosome class. From Fig. 10(b), we can concludethat with the proposed method high accuracy is obtained forsmall chromosomes where the difference in class classificationincreases.
D. Pixel-by-Pixel Limitations
Our method divides the M-FISH image into regions, i.e.,groups of pixels which are assumed to be members of the
Fig. 10. (a) Comparison of the classification accuracy of the two methods (pro-posed versus pixel-by-pixel) for each chromosome class and (b) classificationaccuracy difference between the two methods for each chromosome class.
same chromosome class. The method compares a set of pixelswith the training class distributions instead of comparing adata vector (i.e., a pixel) with the distributions of the trainedclasses in a 5-D space. Two indicative cases where the proposedmethod is superior compared to the pixel-by-pixel classifi-cation method are presented in Fig. 11. In these two cases,pixel-by-pixel classification produces noisy results makingthe decision of the expert difficult since these artefacts can bemisinterpreted as chromosome abnormalities.
Another advantage of the proposed method is its computationefficiency. The average classification time was 36.4 s ( 10.9)compared to the pixel-by-pixel method, which is 53.5 s ( 13.5)on a Pentium P4 2-GHz PC, with 512 MB RAM.
E. Influence of
The only tuneable parameter of the proposed method iswhich enters the grayscale reconstruction function. In the aboveexperiment, it was fixed to . Several experiments wereperformed varying from 0–250 (with step 10). corre-sponds to the finest tessellation and corresponds to acoarse tessellation. The mean classification accuracy versus as

706 IEEE TRANSACTIONS ON MEDICAL IMAGING, VOL. 27, NO. 5, MAY 2008
Fig. 11. Examples where the pixel-by-pixel classification produces noisy results.
Fig. 12. Classification accuracy versus � and region size versus � .
well as the region size versus is shown in Fig. 12. The classifi-cation accuracy varies from 81% to 88%. Initially as increasesthe classification accuracy increases but for values itremains constant. This is due to the fact that when is large, themean size of the regions increases since regions with same spa-tial and color characteristics are merged. However, when the re-gion size increases adjacent chromosomes regions with differentcolor information are connected, which often leads to classifica-tion errors (Fig. 13). It is obvious that as increases the averageCPU time for region classification decreases (Fig. 14).
VI. DISCUSSION AND CONCLUSION
We described a new fully automated chromosome segmenta-tion and classification method for M-FISH images. The methodutilizes a multichannel watershed segmentation algorithm, and aregion-based classification technique. Initially, the chromosomeimage is decomposed into a set of homogeneous regions usingthe multichannel watershed algorithm. These regions of chro-mosomes are then classified using a region Bayes classifier and
Fig. 13. Example of region misclassification due to the high � value: (a) initialimage where the ground truth segmentation is indicated (white border), (b) theground truth classification map, (c–d) image segmentation for � = 190 and thecorresponding classification map, (e–f) image segmentation with � = 200 andthe corresponding classification map.
Fig. 14. Average CPU time needed for region classification vs. � .
finally, a merging step is performed, providing a better classifi-cation map. To evaluate our method we used a publicly available

KARVELIS et al.: A MULTICHANNEL WATERSHED-BASED SEGMENTATION METHOD 707
database which contains 200 M-FISH images [42]. The evalu-ation results are very promising, resulting in overall accuracy82.5%.
Several methods used for M-FISH image segmentation andclassification [7]–[12] have been presented in the literature.These methods either use the segmentation of the greyscalechannel DAPI in order to classify pixels [9], [10], [12] or di-rectly classify the pixels of the image using the background asa new class [7], [11]. The proposed method is based on an alter-native approach, using a multichannel segmentation method tosegment the M-FISH image into homogenous spectral regionswhich combines spectral information from different channels.This is advantageous since it is an effective way to incorporatespatial characteristics into the analysis, which leads to superiorperformance in terms of classification accuracy.
The segmentation of each chromosome into regions emulatesthe procedure followed by an expert to identify chromosome re-arrangements (anomalies). As we have already seen in Fig. 8, re-gions with different color information (translocations) are accu-rately defined by the proposed method. It is important to be men-tioned that the segmentation by itself already gives the cytoge-neticist an advantage in his/her medical assessment, (Fig. 4). Onthe other hand, the employment of the Otsu binarization methodgreatly simplifies the detection of chromosome regions that havenot been hybridized (Fig. 5), providing a more accurate seg-mentation of the M-FISH image. In addition, the binary mask,created by the Otsu method, makes use of the DAPI channelin order to eliminate artefacts appearing in the M-FISH image.In our method we initially applied the multichannel watershedsegmentation and then we used the binary mask. An alternativeapproach, based in the same philosophy, would be to initiallyapply the binary mask and then do the multichannel watershedsegmentation only inside the mask. This will be addressed in afuture communication.
If a classification is performed on a pixel-by-pixel basis,the classification will be dominated by noisy painting inho-mogeneities. This is obvious by the misclassifications errorsproduced by the pixel-by-pixel algorithm as it is shown inFig. 11. In contrary region-based classification avoids thesetypes of errors since pixels with similar spectral informa-tion contribute in the classification. Moreover, region-basedclassification provides better classification accuracy than themaximum a posteriori pixel-by-pixel classifier. This allowssmaller rearrangements to be identified and enables the methodto resolve complex rearrangements when applied to patient di-agnosis. More specifically, the increased classification accuracyof the proposed method in cases of small chromosomes is animportant feature in clinical cytogenetics [45]. Small chromo-somes are often involved in simple or complex rearrangements,either in genetic disorders or in cancer. In this way, geneticanalysis becomes more reliable and may explain unidentifiedaberrations in clinical cases. Finally, it should be mentionedthat the classifier requires the same training statistics and iscomputationally more efficient than the corresponding pixelclassifier.
Another important aspect is that the produced classificationand segmentation map could be used as a decision support toolfor cytogeneticists during their daily clinical practice. Fig. 7(d)
TABLE IIICOMPARISON OF THE PROPOSED METHOD AND OTHER METHODS APPEARED IN
THE LITERATURE IN TERMS OF CHROMOSOME CLASSIFICATION ACCURACY
Average chromosome pixel classification
is an indicative example that is provided to the experts. It is no-ticeable that regions of the same class appear more than twotimes (e.g., regions of class “10”) in the map. This can be inter-preted as either a possible translocation, and thus its identifica-tion is very important, or a classification error of our method;the final decision is made by the cytogeneticist.
There is a tradeoff between the choice of the parameter andthe segmentation-classification accuracy. Based on our experi-ments related to the effect of the value of , we concluded thatthe larger the size of the initial segments is, the better are thefinal segmentation-classification. However, in the experimentsconducted during this study, the value of is relatively low sincehigh values cause the connection of regions with different colorinformation; this is shown in Fig. 13(e). In general, the optimalvalue of the could be estimated using as criterion the homo-geneity of the regions produced by the segmentation.
Table III shows a comparison of several different seg-mentation and classification algorithms. All methods employpixel-by-pixel classification schemes and use the whole [11]or part of the ADIR M-FISH dataset [42]. In [12], an analo-gous approach has been developed having however significantdifferences with the proposed method. The most importantis that the gradient computation was based only on the DAPIchannel, not taking into consideration information from theother five channels. Thus, chromosome anomalies could notbe effectively detected. Furthermore, the classification stagewas based on the mean intensity estimator of each region. Inthis work, the multichannel gradient magnitude was computedwhile classification was based on the intensities of all pixelsbelonging to a specific region. In general, it is difficult to com-pare the methods directly since those methods rarely use ratesdirectly comparable to our work. Accuracies higher than 90%have been achieved when a part of the dataset is used but as faras we know the average pixel-by-pixel classification accuracyfor the whole set was only 68% with standard deviation 17.5%[11].
REFERENCES
[1] M. Thompson, R. McInnes, and H. Willard, Genetics in Medicine.Kingston, ON, Canada: Saunders, 1991.
708 IEEE TRANSACTIONS ON MEDICAL IMAGING, VOL. 27, NO. 5, MAY 2008
[2] M. R. Speicher, S. G. Ballard, and D. C. Ward, “Karyotyping humanchromosomes by combinatorial multi-fluor FISH,” Nat. Genet., vol. 12,pp. 368–375, 1996.
[3] T. Veldman, C. Vignon, E. Schröck, J. D. Rowley, and T. Ried, “Hiddenchromosome abnormalities in haematological malignancies detectedby multicolor spectral karyotyping,” Nat. Genet., vol. 15, pp. 406–410,Apr. 1997.
[4] T. Ried, M. Liyanage, S. Manoir, K. Heselmeyer, G. Auer, M.Macville, and E. Schröck, “Tumor cytogenetics revisited: Compara-tive genomic hybridization and spectral karyotyping,” J. Mol. Med.,vol. 75, no. 11–12, pp. 801–814, Nov.–Dec. 1997.
[5] R. Eils, S. Uhrig, K. Saracoglu, K. Satzler, A. Bolzer, I. Petersen, J.Chassery, M. Ganser, and M. R. Speicher, “An optimized fully auto-mated system for fast and accurate identification of chromosomal re-arrangements by multiplex-FISH (M-FISH),” Cytogenet. Cell Genet.,vol. 82, no. 3–4, pp. 160–171, 1998.
[6] K. Saracoglu, J. Brown, L. Kearney, S. Uhrig, J. Azofeifa, C. Fauth, M.Speicher, and R. Eils, “New concepts to improve resolution and sensi-tivity of molecular cytogenetic diagnostics by multicolor fluorescencein situ hybridization,” Cytometry, vol. 44, no. 1, pp. 7–15, May 2001.
[7] M. P. Sampat, A. C. Bovik, J. K. Aggarwal, and K. R. Castleman,“Pixel-by-pixel classification of MFISH images,” in Proc. 24th IEEEAnn. Intern. Conf. (EMBS), Houston, TX, 2002, pp. 999–1000.
[8] H. Choi, K. R. Castleman, and A. Bovik, “Joint segmentation and clas-sification of M-FISH chromosome images,” in Proc. 26th IEEE Ann.Intern. Conf. (EMBS), San Francisco, CA, 2004, pp. 1636–1639.
[9] M. P. Sampat, A. C. Bovik, J. K. Aggarwal, and K. R. Castleman, “Su-pervised parametric and non-parametric classification of chromosomeimages,” Pattern Recognit., vol. 38, pp. 1209–1223, Aug. 2005.
[10] Y. Wang and K. R. Castleman, “Normalization of multicolor fluores-cence in situ hybridization (M-FISH) images for improving color kary-otyping,” Cytometry, vol. 64, pp. 101–109, Apr. 2005.
[11] W. C. Schwartzkopf, A. C. Bovik, and B. L. Evans, “Maximum-likeli-hood techniques for joint segmentation-classification of multispectralchromosome images,” IEEE Trans. Med. Imag., vol. 24, no. 12, pp.1593–1610, Dec. 2005.
[12] P. S. Karvelis, D. I. Fotiadis, M. Syrrou, and I. Georgiou, “A water-shed based segmentation method for multispectral chromosome im-ages classification,” in Proc. 28th IEEE Ann. Intern. Conf. (EMBS),New York, 2006, pp. 3009–3012.
[13] A. Sarkar, M. J. Biswas, and K. M. Sharma, “A MRF model-based seg-mentation approach to classification for multispectral imagery,” IEEETrans. Geosci. Remote Sens., vol. 40, no. 5, pp. 1102–1113, May 2002.
[14] S. Beucher and C. Lantuejoul, “Use of watersheds in contour detec-tion,” in Proc. Int. Workshop Image Process., Real-Time Edge MotionDetection/Estimation, Rennes, France, 1979, pp. 17–21.
[15] S. Beucher, “The watershed transformation applied to image segmen-tation,” Scan. Micros. Intern., vol. 6, pp. 299–314, 1992.
[16] L. Vincent and P. Soille, “Watershed in digital spaces: An efficient al-gorithm based on immersion simulations,” IEEE Trans. Pattern Anal.Mach. Intell., vol. 13, no. 6, pp. 583–598, Jun. 1991.
[17] F. Meyer, “Color image segmentation,” in Proc. Int. Conf. ImageProcess. Appl., 1992, pp. 303–306.
[18] V. Grau, A. U. Mewes, M. Alcaniz, R. Kikinis, and S. K. Warfield,“Improved watershed transform for medical image segmentationusing prior information,” IEEE Trans. Med. Imag., vol. 23, no. 4, pp.447–458, Apr. 2004.
[19] K. Haris, S. Efstratiadis, N. Maglaveras, C. Pappas, J. Gourassas, andG. Louridas, “Model-based morphological segmentation and labellingof coronary angiograms,” IEEE Trans. Med. Imag., vol. 18, no. 10, pp.1003–1015, Oct. 1999.
[20] J. Roerdink and A. Meijster, “The watershed transform: Definitions,algorithms and parallelization strategies,” Fundamenta Informaticae,vol. 41, pp. 187–228, 2001.
[21] K. Haris, S. Efstratiadis, N. Maglaveras, and A. Katsaggelos, “Hybridimage segmentation using watersheds and fast region merging,” IEEETrans. Image Process., vol. 7, no. 12, pp. 1684–1699, Dec. 1998.
[22] J. Gaugh, “Image segmentation and analysis via multiscale gradientwatershed hierarchies,” IEEE Trans. Image Process., vol. 8, no. 1, pp.69–79, Jan. 1999.
[23] D. Wang, “A multiscale gradient algorithm for image segmentationusing watersheds,” Pattern Recognit., vol. 30, no. 12, pp. 2043–2052,Dec. 1997.
[24] N. Malpica, C. Solorzano, J. Vaquero, A. Santos, I. Vallcoba, J.Sagredo, and F. Pozo, “Applying watershed algorithms to the seg-mentation of clustered nuclei,” Cytometry, vol. 28, pp. 289–297, Aug.1997.
[25] R. Lofuto and W. Silva, “Minimal set of markers for the watershedtransform,” in Proc. 6th Int. Symp. Math. Morphol., Sydney, Australia,2002, pp. 359–369.
[26] J. Park and J. Keller, “Snakes on the watershed,” IEEE Trans. PatternAnal. Machine Intell., vol. 23, no. 10, pp. 1201–1205, Oct. 2001.
[27] J. Cheng, S. Foo, and S. Krishnan, “Watershed-presegmented snake forboundary detection and tracking of left ventricle in echocardiographicimages,” IEEE Trans. Inf. Techn. Biomed., vol. 10, no. 2, pp. 414–416,Apr. 2006.
[28] S. DiZenzo, “A note on the gradient of a multi-image,” Comput. Vis.Graph. Image Process., vol. 33, pp. 116–125, 1986.
[29] A. Cumani, P. Grattoni, and A. Giuducci, “An edge-based descriptionof color images,” Comput. Vis. Graph. Image Process., vol. 53, pp.313–323, July 1991.
[30] C. Drewniok, “Multi-spectral edge detection—Some experiments ondata from Landsat-TM,” Int. J. Remote. Sens., vol. 15, no. 18, pp.3743–3765, 1994.
[31] Y. Yan, S. Zhao, L. Wang, A. Zelenetz, and H. Schwartz, “Marker-con-trolled watershed for lymphoma segmentation in sequential CT im-ages,” Med. Phys., vol. 33, no. 7, pp. 2452–2460, Jul. 2006.
[32] S. Beucher and F. Meyer, “Morphological segmentation,” J. Vis.Comm. Image Representation, vol. 1, no. 1, pp. 21–46, Sep. 1990.
[33] L. Najman and M. Schmitt, “Geodesic saliency of watershed contoursand hierarchical segmentation,” IEEE Trans. Pattern Anal. Mach. In-tell., vol. 18, no. 12, pp. 1163–1173, Dec. 1996.
[34] M. Grimaud, “A new measure of contrast: Dynamics,” Image AlgebraMorphological Processing III, vol. 1769, pp. 292–305, Jul. 1995.
[35] L. Vincent, “Morphological grayscale reconstruction in image analysis:Applications and efficient algorithms,” IEEE Trans. Image Process.,vol. 2, no. 2, pp. 176–201, Apr. 1993.
[36] N. Otsu, “A threshold selection method from gray-level histograms,”IEEE Trans. Syst., Man, Cybern., vol. 9, no. 1, pp. 62–66, Jan. 1979.
[37] T. Sund and K. Eilertsen, “An algorithm for fast adaptive image bina-rization with applications in radiotherapy imaging,” IEEE Trans. Med.Imag., vol. 22, no. 1, pp. 22–28, Jan. 2003.
[38] O. D. Trier and T. M. Taxt, “Evaluation of binarization methods fordocument images,” IEEE Trans. Pattern Anal. Mach. Intell., vol. 17,no. 3, pp. 312–315, Mar. 1995.
[39] K. Fukunaga, Introduction to Statistical Pattern Recognition. NewYork: Academic, 1990.
[40] R. L. Kettig and D. A. Landgrebe, “Classification of multispectralimage data by extraction and classification of homogenous objects,”IEEE Trans. Geosci. Electron., vol. 14, no. 1, pp. 19–26, Jan. 1976.
[41] D. A. Landgrebe, “The development of a spectral-spatial classifierfor earth observational data,” Pattern Recognit., vol. 12, no. 3, pp.165–175, 1980.
[42] The ADIR M-FISH Image Database [Online]. Available: http://www.adires.com/05/Project/MFISH_DB/MFISH_DB.shtml
[43] I. Belyaev, “Molecular targets and mechanisms in formation of chro-mosomal aberrations: Contributions of Soviet scientists,” Cytogenet.Genome Res., vol. 104, pp. 56–64, 2004.
[44] P. Tan, M. Steinbach, and V. Kumar, Introduction to Data Mining.New York: Pearson Addison Wesley, 2006.
[45] T. Liehr, U. Claussen, and H. Starke, “Small supernumerary markerchromosomes (sSMC) in humans,” Cytogenet. Genome Res., vol. 107,pp. 55–67, 2004.