you must give appropriate credit, provide - core
TRANSCRIPT

COPYRIGHT AND CITATION CONSIDERATIONS FOR THIS THESIS/ DISSERTATION
o Attribution — You must give appropriate credit, provide a link to the license, and indicate ifchanges were made. You may do so in any reasonable manner, but not in any way thatsuggests the licensor endorses you or your use.
o NonCommercial — You may not use the material for commercial purposes.
o ShareAlike — If you remix, transform, or build upon the material, you must distribute yourcontributions under the same license as the original.
How to cite this thesis
Surname, Initial(s). (2012). Title of the thesis or dissertation (Doctoral Thesis / Master’s Dissertation). Johannesburg: University of Johannesburg. Available from: http://hdl.handle.net/102000/0002 (Accessed: 22 August 2017).

Surface Composites and Functionalisation: Enhancement of
Aluminium Alloy 7075-T651 via Friction Stir Processing
Omolayo Michael IKUMAPAYI
A THESIS SUBMITTED TO THE UNIVERSITY OF JOHANNESBURG
IN FULFILMENT OF THE REQUIREMENTS FOR THE DEGREE OF
DOCTOR OF PHILOSOPHY (PhD)
IN
MECHANICAL ENGINEERING SCIENCE
THE FACULTY OF ENGINEERING AND THE BUILT ENVIRONMENT
SUPERVISOR: Prof. E. T. Akinlabi
CO - SUPERVISOR: Prof. J. D. Majumdar
June, 2020

ii
DEDICATION
This thesis work is dedicated to Almighty God who makes the program a huge success and who
provides finances for the completion of the program, who has been my help in the past and my
hope in the years to come.
Also,
Dedicated to my Late Parents (Mr Olaniyan Joseph IKUMAPAYI and Mrs Fayomade Beatrice
IKUMAPAYI), who toiled and sweated to ensure that I get western education and be successful in
life.

iii
ACKNOWLEDGEMENTS
All Praises, Honour and Adoration be unto God, the Giver of Wisdom, knowledge and
understanding – THE ALMIGHTY GOD who has been my help in ages past and my hope in years
to come; and also, for His preservation, provision and protection during the course of this research
work.
I am deeply indebted to my Supervisors, Professor Esther Titilayo Akinlabi and Professor Jyotsna
Dutta Majumdar for their invaluable supervision, assistance, love, advice, guidance and support
throughout these studies. Special appreciation to Prof. E. T. Akinlabi for her mentorship,
encouragement and for playing a motherly role beyond supervisor in the course of this program
and for making herself available for consultation at all times and her constant technical support,
proofreading of the research work despite her tight schedule to see to the success of this program.
THANK YOU for your financial, technical and moral support. I cannot thank you enough, may
the Lord God who is the rewarder of good deed reward you bountifully. Thank you for believing
in me and for reinforcing me with confidence, and this has propelled me to go beyond the limit
and ensured timely finishing of the research work.
My profound gratitude goes to the Head of the department, Prof. T. C. Jen for overseeing the affairs
of the department. I cannot but appreciate the effort and unalloyed contributions of my highly
esteemed school Father and a Brother (Dr Stephen A. Akinlabi) for making himself available for
consultation to see to the success of this research work.
My immense appreciation goes to Prof. Suryan K. Pal of the department of Mechanical
Engineering, and Prof. J. D. Majumdar of the Department of Metallurgical and Materials
Engineering for hosting us during the course of research trip to Indian Institute of Technology

iv
(IIT), Kharagpur, India. Special Thanks to Prof. S. K. Pal for his technical advice during the
experimental study. At this juncture, I want to register my unalloyed appreciation to the following
Doctoral Research Scholars at Friction Stir Welding Lab for their assistance, the like of Abhishek
Sharma, Vyas Sharma, Suryakanta Sahu, Raju Prasad Mahto, Omkar Mypati, Debasish Mishra,
Debolina Sen, Pooja Sarkar, Soumya Sangita Nayak, Ranjan Vishwakarma, Abhijit Sadhu, Md
Perwej Igbal as well as Gupta and VJ Sharma (The Machinists). Thank you all for your assistance
and love during our stay at IIT, Kharagpur. I also appreciate the efforts of other PhD scholars at
the Department of Metallurgical and Materials Engineering, in the person of, Mr Shree Krishna
and Mr Jeetendra Singh and a host of others that have assisted in one way or the other.
Special and warm acknowledgement is due to Dr Philip Oladijo for hosting me at Botswana
International University of Science and Technology (BIUST), Botswana. Thank you, sir, for your
love and technical support during my stay. Similar appreciation goes to the technical staff of the
materials laboratory of BIUST most especially Mr Resego Phiri and Mr Leso. I cannot but thank
Mr Keagistswe Setswalo and Mr Kinsman for their brotherly love during the time I was at BIUST.
Let me use this medium to thank Dr Ojo Sunday Isaac Fayomi of department of Mechanical
Engineering, Covenant University, Ota, Nigeria for the permission granted to make use of the
facility at his Surface Engineering Laboratory. I also thank Mr Godwin Akande for assisting me
during the tests.
I will never forget my Mentors Professor Josiah Adeyemo of Department of Civil Engineering,
University of Washington, USA; Dr Sikiru O. Ismail of the School of Engineering and Computer
Science, University of Hertfordshire, England, UK; and Engr. Dr Adeniran Afolalu of the
department of Mechanical Engineering, Covenant University, Ota, for their brotherly bits of advice
at all times. The roles of my very good friends are highly appreciated, Engr. Sunday Temitope

v
Oyinbo as well as Engr. Philip Ojo Bodunde, a PhD student of the Department of Mechanical and
Automation Engineering, The Chinese University of Hong Kong, New Territories, Hong Kong
Special Administrative Region. Thank you all for being there for me.
I want to specially register my unreserved appreciation to all the following Researchers that we
embarked the research trip to IIT, Kharagpur, India together (Dr. O.S. Fatoba – The Team Leader,
Olatunji Abolusoro – my room-mate, Olayinka Abegunde – the Man of the people, Damola
Kayode, Tawanda Marazani, Benjamin Ileh Attah as well as Dr. Damilare Baruwa and Dr Fredrick
Mwema. Thank you all for your love and care. My Friends and Research Colleagues in our
common research group - Modern and Advanced Manufacturing System (MAMS) are not left out
of this appreciation. No 21 Auckland Avenue researchers are not left out, the like of Adedeji Paul,
Babarinde Taiwo, Oluah, Simeon, Chibuike as well as Dr. Michael C. Agarana (The Postdoctoral
Fellow). Thank you all for working as a team in all our involvement.
My immense gratitude always goes to my beloved wife – Folake Mary for her prayers and
encouragement all through the course of the program and I also thank my Children – Fiyinfoluwa
Treasure and Fogofoluwa Triumph for their love and co-operation. Thank you all for giving me
rest of mind in the course of the program.
Omolayo Michael IKUMAPAYI

vi
DECLARATION
Statement of originality
I, Omolayo Michael Ikumapayi, hereby declare that this PhD thesis report represents my original
work and it is legitimate, unique and has not been previously submitted to any university or similar
institution for academic credit or any degree either by myself or another person. I understand what
plagiarism implies and declare that this PhD thesis is my own ideas, words, phrases, arguments,
graphics, figures, results and organization except where reference is explicitly made to another’s
work. Information and data obtained from other sources are hereby acknowledged by means of
references. I understand further that any unethical academic behaviour, which includes plagiarism,
is seen in a serious light by the University of Johannesburg and is punishable by disciplinary action.
This thesis is solely submitted to the University of Johannesburg, Auckland Park Kingsway
Campus, Johannesburg, South Africa, for a Doctoral Degree in Mechanical Engineering Science
in the Faculty of Engineering and the Built Environment (FEBE).
Signed by: Omolayo Michael IKUMAPAYI
-------------------------------------------------------------------------------------------------------------
21 Jun 2020
vii
ABSTRACT
This research work is aimed at modifying and enhancing the properties of aluminium alloy 7075-
T651 through the friction stir processing (FSP) technique, in order to improve the mechanical,
electrochemical, structural, tribological as well as the metallurgical properties which include
micro- and macro- structural analysis through XRD and Image processing of grain size and grain
flow patterns determination, by reinforcing the parent metal. The surface modification of the parent
metal has been made possible in the past via different techniques, such as laser surfacing, electron-
beam welding and thermal spraying; but in recent years, the friction stir processing (FSP)
technology has been adopted to cater for the complex methods of surface enhancement. FSP is
well-renowned for its short route of fabrication, densification, grain refinement, homogenization
of the precipitates of composite substances, nugget zone homogeneity. These have led to the
efficient surface enhancement, significant and remarkable improvement in hardness, ductility,
strength, increased fatigue life, as well as formability within which the bulk properties are still
intact. The use of FSP in the fabrication of metal matrix composites (MMCs), especially
aluminium matrix composites (AMCs) and aluminium hybrid composites (AHCs) were dealt with
in this study.
These properties have made it widely accepted in various industries, ranging from aerospace,
marine, construction, automobile, and nuclear, to mention but a few of the surface modification
tools in modern technology, as well as the advanced manufacturing and production systems.
In this study, the friction stir processing of aluminium alloy 7075-T651 was carried out, using both
organic and inorganic-reinforced particles. The organic (agrowaste) reinforced particles used were:

viii
palm-kernel shell ash (PKSA), wood-fly ash (WFA), coconut-shell ash (CSA), cow-bone ash
(CBA), and coal-fly ash (CFA); while the inorganic (metallic) reinforced particles employed in
this study were: stainless steel micro-particles (17-4PH) and alpha-beta titanium alloy (Ti–6Al–
2Sn–2Zr–2Mo–2Cr–0.25Si) powders. These metallic powders were used because of their low
density, high strength, as well as their good corrosion resistance. The morphological characteristics
of all the powders developed (agrowaste powders) and purchased (metallic powders) were studied
by using the Scanning Electron Microscopy (SEM); while their elemental compositions were
established with the aid of Energy Dispersive X-rays (EDX); and their chemical compositions
were analyzed with X-Ray Fluorescence (XRF). Furthermore, X-Ray diffraction (XRD) was also
used to analyse the grain structure of some of the selected developed agrowaste powders, metallic
powders, as well as all the fabricated metal matrix composites (MMCs). Both the metallic and
agrowastes powders were used to produce either aluminium matrix composites (AMC), or
aluminium hybrid composites (AHC). In order to enclose the reinforcement within the parent
metal, a grooved (micro-channel) was created on the substrate with dimensions of 2.0 mm width
and a 3.5 mm depth and this was maintained for the fabrication of aluminium matrix and hybrid
composites (AMHC).
The varying parameters were rotational speeds of 1200 rpm, 1500 rpm and 1800 rpm; and the
following parameters were kept constant: a travel speed of 20 mm/min, a tilt angle of 3 degrees,
in addition to a plunge depth of 0.3 mm. Two passes were employed with 100 % inter-pass overlap.
The tool design was made from AISI H13 tool steel of a cylindrical shape, tapped with an 18 mm
shoulder diameter, while both the pin length and the pin diameter were 5 mm respectively.
The fabricated samples in the matrix and the hybrid composites were evaluated for their
performance; and the following tests were conducted on the fabricated AMC and the AHC: the
ix
mechanical properties, the tribological properties, and the electrochemical properties, as well as
the structural properties were evaluated. Surface-roughness analysis was conducted on all the
fabricated AMHC, in order to evaluate their surface qualities by using the Mitutoyo surf test SJ-
210 surface roughness tester (SRT). The following surface roughness parametric values were read
and documented: the root mean square roughness (Rq), the maximum height (Ry), the arithmetical
mean, the roughness value (Ra), mean roughness depth (Rz).
It was confirmed that the influence of the reinforced particles greatly affects the quality of the
fabricated aluminium matrix surface composites (AMSC) produced.
Wear behaviours of the fabricated AMSC were confirmed by using a Rtec Universal tribometer
MTF 5000; and the following wear parameters were evaluated: wear rate, wear resistance, wear
volume (volume loss), wear depth, frictional force, and the coefficient of friction (COF). The wear
behaviors were carried out in dry sliding conditions, with varying loads of 20 N and 50 N. It was
noticed that the reinforced particles significantly reduced the wear rate, COF, as well as the wear
volume, while the wear resistance was said to still be high. The results showed that the higher load
of 50 N was found to perform better under the same experimental conditions, when compared to
the 20 N applied load. Less wear debris was found, when the 50 N applied force was used.
Furthermore, wear parameters, such as wear rate, volume loss and COF were significantly reduced
with an applied load of 50 N, compared to 20 N under the same fabricated composites. In the same
vein, tensile tests were conducted on the fabricated AMHC; and the experiments were carried out
using the X-force P-type of Zwick/Roell Z250 tensile tester and the following parametric values
were measured, computed and recorded: the maximum stress value (Rm), also known as the
ultimate tensile strength, the stress at 0.1 % offset strain (Rp0.1), the breaking-fracture force,
x
Young’s modulus (ME), the tensile strength, the stress at 0.2% offset strain (Rp0.2), as well as the
stress at 0.5% offset strain (Rp0.5).
The fractured surfaces were studied using the Scanning Electron Microscopy (SEM) to examine
the morphologies. The examined fractured surfaces of the fabricated composites were permeated
with a fine, network and the equiaxed dimples with cup and cone attributes, thereby confirming
the superficial interfacial bonding. And the failure mode was ductile on most of the surfaces.
Similarly, the corrosion behaviours of the fabricated AMHCs were studied by using a
Potentiostat/Galvanostat; and these were conducted in 3.5% NaCl solution. The fabricated
AMHCs were tested for corrosion susceptibility and corrosion-barrier efficacy.
The following were measured and computed: polarization resistance (PR), percentage inhibition,
performance efficiency (IPE %), corrosion rate (CR), corrosion-current density (𝑗𝑐𝑜𝑟𝑟 ), anodic
slope (ba), corrosion potential(𝐸𝑐𝑜𝑟𝑟), the cathodic slope (bc). It was revealed that the reinforced
particles have a great influence on the corrosion resistance, when compared with the processed
parent material, or with the unprocessed parent material. The corroded samples were studied, using
Scanning Electron Microscopy, as well as Optical Microscopy (OM), and reasonable conclusions
were reached from the study and reported. The morphology of the corroded surfaces revealed that
there were more pits, attacks and micro-cracks, which may have occurred due to the intergranular
corrosion on the surfaces.
From the experimental research carried out, it was established that the surface roughness analysis
results showed that WFA produced the best surface integrity with average mean value of Ra of
2.48 µm, 1.60 µm and 1.92 µm at 1200, 1500 and 1800 rpm respectively. In the metallic powders,
titanium alloy powder alloy (Ti–6Al–2Sn–2Zr–2Mo–2Cr–0.25Si) produced the best surface
integrity of Ra with 2.67 µm, 3.05 µm and 3.02 µm at 1200, 1500 and 1800 rpm respectively. The

xi
corrosion results showed that titanium alloy powder performed better than stainless steel powder
with 98.26 % inhibition performance efficiency (%IPE) while that of stainless steel was 90 % with
reference to base material. In the electrochemical test, the corrosion rate of the titanium alloy
powder produced 0.087675 mm/year as against that of stainless-steel powder of 0.47744 mm/year
and this established that titanium alloy powder performed better in the case of metallic powder.
Whereas, in the agrowastes powders used, it was revealed that reinforcing with PKSA has the best
corrosion rate with 0.4357 mm/year while that of CSA was 0.8291 mm/year and the least corrosion
rate among agrowastes powders was CBA with 1.4228 mm/year. It was further revealed that WFA
performed better than CFA in resisting corrosion with %IPE of 97.61 % as against 63.9 % while
the corrosion rate was 0.12068 mm/year of WFA and 0.84241 mm/year of CFA.
From the tribological experimental results, it was established that WFA has a wear rate of 12.920
mm3/m and the wear volume was 0.038761 mm3 at 20 N applied load while the friction stir base
metal (FSPed AA7075-T651) has wear rate of 14.104 mm3/m and wear volume of 0.042313 mm3.
Similarly, at 50 N applied load, the wear rate was 2.0174 mm3/m for WFA, and the wear volume
was 0.010087 mm3 while that of friction stir based metal (FSPed AA7075-T651) was 2.878
mm3/m wear rate and 0.014390 mm3 wear volume. This shows that WFA at 50 N load performed
better. Similarly, at 20 N applied force, the COF was 0.4209 when stainless-steel powder was used,
and the wear rate was 10.859 mm3/m while wear volume was 0.032578 mm3. At 50 N applied
load, the COF under the influence of stainless-steel powder was 0.1168, wear rate was 2.275
mm3/m and the wear volume was 0.011374 mm3. The mean particle size after 60 minutes milled
on CFA was 2.44 µm and 3.20 µm for WFA. The overall average mean particles increased from
75 µm to 200 nm.

xii
The reinforced composites possess excellent mechanical, electrochemical, tribological and
metallurgical properties; and can be recommended in applications in harsh conditions, especially
in construction, automobile, aerospace, marine, manufacturing, food processing as well as oil and
gas industries due to their remarkable material properties, excellent corrosion and wear resistance,
low density, high strength-to-weight and stiffness-to-weight ratios.
Keywords: Agrowaste nano-particles; Aluminium matrix and hybrid composites; Coal-Fly Ash
(CFA); Coconut-Shell Ash (CSA); Corrosion test; Cow-Bone Ash (CBA); Energy dispersive X-
Ray (EDX); Fractography; Microstructure; Optical Microscopy (OM); Palm-kernel Shell Ash
(PKSA); Scanning electron microscope (SEM); Surface Roughness; Tensile test; Wear test;
Wood-Fly Ash (WFA); X-Ray Diffraction (XRD); X-Ray Fluorescence (XRF).

xiii
TABLE OF CONTENTS
DEDICATION............................................................................................................................... ii
ACKNOWLEDGEMENTS......................................................................................................... iii
DECLARATION.......................................................................................................................... vi
ABSTRACT ................................................................................................................................. vii
TABLE OF CONTENTS .......................................................................................................... xiii
LIST OF FIGURES .................................................................................................................. xvii
LIST OF TABLES ................................................................................................................... xviii
ABBREVIATIONS .................................................................................................................... xix
NOMENCLATURE ................................................................................................................. xxiii
STANDARD TEST SPECIFICATIONS ............................................................................... xxvi
GLOSSARY OF TERMS ....................................................................................................... xxvii
LIST OF PUBLICATIONS .......................................................................................................... l
1 CHAPTER ONE: THE INTRODUCTION ........................................................................ 1
1.1 BACKGROUND .................................................................................................................. 1
1.2 PROBLEM STATEMENT ..................................................................................................... 8
1.3 MOTIVATION .................................................................................................................. 10
1.4 HYPOTHESIS STATEMENT ............................................................................................... 11
1.5 AIM OF THE STUDY ......................................................................................................... 12
1.6 OBJECTIVES OF THE STUDY ............................................................................................ 12
1.7 THE SCOPE OF THE WORK .............................................................................................. 13
1.8 OVERVIEW OF THE THESIS.............................................................................................. 15

xiv
1.9 CONTRIBUTIONS TO KNOWLEDGE ................................................................................. 16
1.10 STATE OF THE ART .......................................................................................................... 17
1.11 POSSIBLE COMMERCIALIZATION OF THE FABRICATED ALUMINIUM-BASED MATRIX
COMPOSITES.............................................................................................................................. 18
2 CHAPTER 2: ISI AND SCOPUS-LISTED PEER-REVIEWED PUBLISHED
ARTICLES, ACCEPTED AND SUBMITTED MANUSCRIPTS ......................................... 20
2.1 INTRODUCTION .............................................................................................................. 20
2.2 ARTICLE I ......................................................................................................................... 21
Experimental Data on Surface Roughness and Force-Feedback Analysis in Friction Stir
Processed AA7075-T651 Aluminium-Metal Composites .......................................................... 21
2.3 ARTICLE II ........................................................................................................................ 26
The Efficacy of α-ꞵ grade Titanium-alloy powder (Ti-6Al-2Sn-2Zr-2Mo-2Cr- 0.25Si) in surface
modification and corrosion mitigation in 3.5 % NaCl on friction stir processed armour grade
7075-T651 Aluminum alloys – Insight in Defence Applications ................................................ 26
2.4 ARTICLE III ....................................................................................................................... 29
The characterization of High-Strength Aluminium-Based Surface Matrix Composite reinforced
with Low-cost PKSA Fabricated by the Friction Stir Processing ................................................ 29
2.5 ARTICLE IV....................................................................................................................... 31
The influence of Carbonaceous Agrowaste Nanoparticles on the Physical and Mechanical
Properties of the Friction Stir Processed AA7075-T651 Metal Matrix Composites.................. 31
2.6 ARTICLE V........................................................................................................................ 33
The influence of 17-4PH stainless steel and α+ꞵ titanium alloy powders on the corrosion
susceptibility of friction stir processed AA7075-T651 Aluminium Matrix Composites. ........... 33
2.7 ARTICLE VI....................................................................................................................... 35
Comparative Assessment of Tensile Strength and Corrosion Protection in Friction Stir
Processed AA7075-T651 Matrix Composites Using Fly Ashes Nano-particles as the
Reinforcement Inhibitors in 3.5 % NaCl .................................................................................... 35
2.8 ARTICLE VII...................................................................................................................... 37
The data showing the effects of vibratory-disc milling time on the microstructural
characteristics of Coconut-Shell Nano-particles (CS-NPs) ........................................................ 37
2.9 ARTICLE VIII..................................................................................................................... 38
xv
A review of the thermal, thermo-mechanical and thermal-stress distribution properties during
friction stir welding.................................................................................................................... 38
2.10 ARTICLE IX ....................................................................................................................... 40
The composition, characteristics and socio-economic benefits of Palm-kernel Shell Exploitation
– An Overview ........................................................................................................................... 40
2.11 ARTICLE X ........................................................................................................................ 42
The effects of Vibratory-Disc Milling on the Physicochemical and Morphological Properties of
Coal-Fly Ash Nano-particles....................................................................................................... 42
2.12 ARTICLE XI ....................................................................................................................... 44
Image-Processing and Particle-Size Analysis of Coconut-Shell Nano-particles ........................ 44
2.13 ARTICLE XII ...................................................................................................................... 45
The image Segmentation and Grain Size measurements of Palm-Kernel Shell Powder .......... 45
2.14 ARTICLE XIII ..................................................................................................................... 47
The effect of Friction Stir Processing on the tensile behaviour and the corrosion study of armour
grade AA7075 – T651 ................................................................................................................ 47
2.15 ARTICLE XIV..................................................................................................................... 49
The Preparation, Characterization, Image Segmentation and Particle Size Analysis of Cow-Bone
Nano-particles for composite applications ............................................................................... 49
2.16 ARTICLE XV...................................................................................................................... 50
Corrosion Study and Quantitative Measurement of Crystallite Size of High-Strength Aluminium
Hybrid Composites developed via Friction Stir Processing ....................................................... 50
2.17 ARTICLE XVI..................................................................................................................... 52
The Tribological, Structural and Mechanical Characteristics of friction stir processed
aluminium-based matrix composites reinforced with stainless steel micro-particles ............. 52
3 CHAPTER 3: PEER-REVIEWED/SCOPUS-INDEXED CONFERENCES ................ 54
3.1 INTRODUCTION .............................................................................................................. 54
3.2 ARTICLE I ......................................................................................................................... 55
A survey on the reinforcements used in the friction stir processing of aluminium-metal matrix
and the hybrid composites. ....................................................................................................... 55
3.3 ARTICLE II ........................................................................................................................ 57
Recent advances in Keyhole Defect Repairs via Refilling Friction Stir Spot Welding................ 57

xvi
3.4 ARTICLE III ....................................................................................................................... 59
Comparative study of the Variability in the compositions and the effect of milling time on coal-
fly ash and wood-fly ash nanoparticles ..................................................................................... 59
3.5 ARTICLE IV....................................................................................................................... 61
Characterizations of the evolving properties during the milling time of Wood Fly-Ash
Nanoparticles (WFA-NPs) .......................................................................................................... 61
3.6 ARTICLE V........................................................................................................................ 63
A study on the effects of the milling time on the Physicochemical and Morphological
Characteristics of Cow-Bone Powder (CBP) .............................................................................. 63
3.7 ARTICLE VI....................................................................................................................... 65
Electrochemical investigation of calcined agrowastes powders on friction stir processing of
aluminium-based matrix composites. ....................................................................................... 65
3.8 ARTICLE VII...................................................................................................................... 67
The effect of milling time on the particle sizes of coal-fly ash and wood-fly ash, when using the
Otsu Method for thresholding .................................................................................................. 67
3.9 ARTICLE VIII..................................................................................................................... 69
The influence of Wood-Fly Ash Reinforcement on the Wear Behaviour of Friction Stir Processed
Aluminium-Based Surface Matrix Composite ........................................................................... 69
4 CHAPTER 4: PEER-REVIEWED/SCOPUS INDEXED BOOK CHAPTER .............. 71
4.1 INTRODUCTION .............................................................................................................. 71
4.2 ARTICLE I ......................................................................................................................... 72
Applications of coconut shell ash/particles in modern manufacturing: a case study of friction
stir processing............................................................................................................................ 72
5 CHAPTER 5: CONCLUSIONS AND RECOMMENDATIONS ................................... 74
5.1 CONCLUSIONS ................................................................................................................ 74
5.2 RECOMMENDATIONS AND FUTURE WORK ................................................................... 79
REFERENCES ............................................................................................................................ 81
APPENDIX .................................................................................................................................. 86

xvii
LIST OF FIGURES
Figure 1 1: 2010 Volvo S60 Body Structure showing different metal alloys configurations........ 2
Figure 1 2: 2019 Volvo S60 Body Structure showing different metal-alloy configurations ......... 3
Figure 1 3: Fighter Jet - F-35 Lightning II showing parts and the location made of composites [12]
......................................................................................................................................................... 5
Figure 1 4: A schematic diagram showing the enhanced properties with and without reinforcement
during FSP ...................................................................................................................................... 6
Figure 1 5: The evolution of enhanced properties with various emerging friction stir processing
technologies .................................................................................................................................... 7
Figure 1 6: Flowchart of the experimental procedures and the characterization methodology
applied ........................................................................................................................................... 14

xviii
LIST OF TABLES
Table 2. 1: Chemical Composition of the Base Metal Used (AA7075 – T651) .......................... 23
Table 2. 2: Mechanical Properties of the parent metal used (AA7075 – T651) .......................... 23
Table 2. 3: Friction Stir Processing Parameters (Variable and Constant).................................... 24
Table 2. 4: Chemical Composition of Titanium alloy powder (Ti-6Al-2Sn-2Zr-2Mo-2Cr-0.25 Si)
– as received .................................................................................................................................. 28
Table 2. 5: Wear-Test Experimental Parameters ......................................................................... 30
Table 2. 6: The Chemical Composition Analysis of CS-NPs using XRF.................................... 37

xix
ABBREVIATIONS
AA Aluminium Alloy
Al Aluminium
ABSMCs Aluminium-based surface matrix composites
AMC Aluminium Matrix Composites
AMMC Aluminium Metal Matrix Composites
AMMHC Aluminium Metal Matrix and Hybrid Composite
AS Advancing Side
ASTM American Society for Testing and Materials
AW As Welded
BM Base Material
CBA Cow Bone Ash
CE Counter Electrode
CFA Coal Fly Ash
CFSW Conventional Friction Stir Welding
Cr Corrosion Rate
CSA Coconut Shell Ash
Cu Copper

xx
EDS Energy Dispersive Spectroscopy
FA Fly Ash(es)
FSP Friction Stir Processing
FSPed Friction Stir Processed
FSSW Friction Stir Spot Welding
FS Welding Friction Stir Weld
FSW Friction Stir Welding
GPa Giga Pascal
HAZ Heat Affected Zone
HRC Rockwell Hardness
HV Vickers hardness
IE Inhibition Efficiency
IIT Indian Institute of Technology
IPE Inhibitor Performance Efficiency
kN Kilo-Newton
mm /min Millimetres per minute
MPa Mega Pascal
ME Modulus of Elasticity
xxi
NPs Nanoparticles
OCP Open Circuit Potential
OM Optical Microscope
PBM Processed Base Metal
PCE Potassium Chloride Electrode
PDP Potentiodynamic Polarisation
PKSA Palm kernel Shell Ash
PR Polarization Resistance
PWHT Post Weld Heat Treatment
rpm Revolution per minute
RS Retreating Side
SAZ Shoulder affected Zone
SEM Scanning Electron Microscope
SiC Silicon Carbide
SZ Stir Zone
SSFSW Stationary Shoulder Friction Stir Welding
TMAZ Thermo-Mechanically Affected Zone
TWI The Welding Institute

xxii
UBM Unprocessed Base Metal
UTS Ultimate Tensile Strength
WEDM Wire Electric Discharge Machining
WFA Wood Fly Ash
XRD X-Ray Diffraction
XRF X-Ray Fluorescence

xxiii
NOMENCLATURE
AAxxx Aluminium Association alloy designation
α Alpha
ꞵ Beta
Ph Precipitation-hardened
Fx Advancing Force (N) in the direction of processing
q Heat Flux (W/m2)
Fy Uniaxial force (N) perpendicular to the Fx during the processing
τ Shear Stress (MPa)
x, y, z Space Coordinate (m)
Fz Vertical downward force (N) on the tool
Q Heat Input (J/min)
T Torque (Nm)
f Feed rate (mm/min)
(°) Degree
Ω Ohms
ɸ Diameter
ω Rotational Speed (rev/min)

xxiv
η Efficiency Factor
ɛ Strain
έ Strain rate
h Convection heat transfer coefficient (W/m2.°C)
µ Coefficient of Friction
% Percentage
NaCl Sodium Chloride
Ra Arithmetical mean roughness value
Ry Maximum height
Rz Mean roughness depth
Rm Maximum Stress (MPa)
Rq Root mean square roughness
Rp0.1 The stress at 0.1 % offset strain
Rp0.2 The stress at 0.2 % offset strain
Rp0.5 The stress at 0.5 % offset strain
jcorr The inhibited corrosion current density
jocorr The uninhibited corrosion current density
Ecorr Polarization potential

xxv
icorr Current density
Ꝋ Surface Courage
Σ Summation
x Magnification
2θ Bragg angles
ba Acidic Slope
bc Cathodic Slope
xxvi
STANDARD TEST SPECIFICATIONS
ASTM-G5-14 - Standard Reference corrosion test procedures used in the
measurement of Potentiodynamic Anodic Polarization
ASTM G133-05 - Standard used for tribological wear for linearly
Reciprocating Ball-on-Flat Sliding
ASTM B557M-10 - Tensile Test
ASTM E8M-13 - Tensile Test Cutting Standard
ASTM E112 – 12 - Standard for Determining Average Grain size
ASTM E3-95 - Standard for Metallographic Samples preparation
ASTM E92 – 82 - Standard test for microhardness

xxvii
GLOSSARY OF TERMS
A
Advancing side – Is the side of the weld or processed samples where the plasticized
material is drawn, which is the location at which solid materials
begin to transform into semi-solid and it will then flow around the
tool pin that is plunged into the materials. The side in which the local
direction of the rotating tool is the same direction of travel.
Alloy – A substance that consists of metallic bonding character which
composed of two or more chemical elements wherein at least one
must be metal
Alloying element – Is the element that is added to metal and remains in the metal to form
homogeneous mixture which changes its properties and structure.
Alpha alloys – They are not heat treatable but very weldable. They contain low to
medium strength, unbeatable cryogenic temperature properties,
good ductility as well as excellent notch toughness
Alpha - Beta – are weldable, metastable with high strength and respond to heat
treatment, as well as possessing high elevated-temperature strength
Anodic reaction – This is the process whereby metal is oxidized, thereby releasing
electrons into the metal.

xxviii
B
Backing plate – This is a layered plate that is placed beneath the material to be
processed. It gives the surface a rigid clamping as well opposes the
vertical downward force on the materials, at the same time protect
the machine bed.
Beta alloys – Are readily heat treatable and weldable with high strength up to
intermediate temperature levels.
Bending stress – It is normal stress which is evoked at a point in a body under the
applied loads that causes it to bend.
Breaking load/force – Is the side load or force at which fracture occurs in a tensile test
Brittleness – Capability of a substance, especially metals, to fail or fracture with
little application of a small amount of shock, force or impact without
first undergoing significant plastic deformation.
Brittle fracture – Fracture that occurs on material or metal without remarkable prior
plastic deformation
Butt weld– A weld where two pieces of materials, or metals to be joined, are in
the same plane without overlapping.
C
Cathodic reaction – Cathodic reaction of corrosion is the depletion of hydrogen ions as
well as oxygen to the point or junction at which this corroding metal
reaction occurred is called the cathode.

xxix
Clamping System – This is an apparatus that is used to hold workpiece rigidly to a
location whereby avoiding moving and slipping of workpiece during
the application of forces and stirring in friction stir processing
operation.
Coalescence – The merging or joining of two or more entities such as metals and
reinforcements to form a unity mass.
Coal fly ash – This is a pulverised fuel ash or flue ash which is a combustion
product from coal which consists of particulates that are thrust out
of the coal-fired boilers alongside with the flue gases.
Coefficient of Variation – It is the amount of the residual discrepancy of the data relative to
the size of the means. It can also be referred to as the percentage
representation of the standard of the deviation all over dependent
mean.
Corrosion – a process by which a material especially metal is gradually destroys
or slowly damaged by rain, rust or acidic water, chemical and/or
electrochemical processes by interacting the environment. It is an
irreversible interfacial reaction of a material
Corrosion current – Is that current that formed during an electrochemical cell reaction
leading to corrosion formation.
Corrosion inhibitor – This is a chemical compound which can either be organic or
inorganic substance that significantly reduces corrosion rate when
added in a minute quantity in order to increase service life.

xxx
Corrosion rate – is the speed of deterioration of metal in a specific environment. It is
the quantity of corrosion loss per year in thickness
Corrosion resistance – refers to the degree of resistance offered by a material (usually
metal) to withstand adverse conditions induced by oxidization or
other chemical reactions that can corrode the metal.
Counter electrode – This is also known as (auxiliary electrode) and this was designed to
close the current circuit in the electrochemical cell. This electrode
comes in form of inert materials such as graphite, platinum, glassy
carbon and gold). This electrode does not involve in the
electrochemical reaction.
Current density – is the amount of electric current that flows via a unit cross-sectional
area of a material.
D
Defect – This is imperfection or misalignment that occur during weld or
processing that renders the fabricated parts unsuitable to meet up
acceptable standards of the design specifications for market values.
Deformation – This is a variation or malformation in the form of geometry usually,
shape and size of a body as a result of force or stress applied.
Diffraction – Is the spreading of electrons waves by any crystalline material,
through discrete angles depending only on the lattice spacing of the

xxxi
material and the velocity of the electrons, usually accompanied by
interference between the wave-forms produced.
Dimple fracture – Is a material failure on a metal’s surface that is characterized by the
formation and collection of micro-voids along the granular
boundary of the metal.
Ductility – This is the tendency of a material to withstand remarkable plastic
deformation before fracture occurs.
Dwell time – This is a short time spent (usually in seconds) at a spot between the
plunging of tool and traversing of the tool which leads to generation
of heat that caused plastic deformation to the material.
E
Elastic region – This is a region at which a stressed or stretched body is said to
returned to its original geometry usually shape, size and forms after
an applied load has been removed.
Elastic deformation – This is temporary change in geometry usually shape, size and forms
that is recoverable after an applied load has been removed.
Elastic limit – This is the highest or maximum stretch or applied load that a solid
body can be subjected to without permanently alter its geometry
such as shape, size and forms.
Elongation – This is the extent by which a material is compressed or stretched
during mechanical testing prior to fracture.

xxxii
% Elongation – is the percentage increase in the gauge (original) length during the
tensile testing that results to ductility.
Engineering strain – This is a dimensionless or unitless value and is the ratio of material
total deformation to the original (initial) length of the material, e =
ΔL
L0.
Engineering stress – It is the normal stress, expressed as the ratio of applied load, F, to
the original cross-sectional area, Ao; that is, Ѕ = 𝐹 Ao⁄
Equilibrium – A state of dynamic balance between the opposing actions, reactions
or velocities of a reversible process.
Etchant – It is an acid or corrosive chemical used in etching to reveal structural
and microstructural details; a mordant
Etching – is a conventional procedure of exposing the surface of a material
(usually metal) to preferential chemical or electrolytic attack to
reveal its microstructural details for metallographic analysis
Exit hole – A hole that was created at the end of the weld or processing when
FSP or FSW tool is withdrawn, resulting from the displacement of
material during the plunge. Some special techniques such as refilling
methods are in-use to prevent this defect or prevent the occurrence
of this hole.
Effect – This is referred to as the change in average response when a factor
transforms from its low level to its high level or vice versa.

xxxiii
F
Failure – A failure breakdown of an object, especially metal, plastic or
concrete, as a result of some factors that inhibit the strength,
chemical composition and stability of the object’s structure.
Material failure can either be a brittle failure (fracture) or ductile
failure (yield).
Feed rate – This is the distance that the cutting tool travels or advances for each
revolution of the part.
Filler metal – This can be a metal or metallic reinforcement added during welding,
processing, brazing, soldering operations
Force control – This is stage during the friction stir processing or welding wherein
an established force from previous processed part is added to other
input process parameters, in order to fabricate metal matric
composite.
Fusion – The melting together of filler materials with the parent material, or
the parent metal only, which produces coalescence.
Fusion Welding – Is the welding that involved melting of filler materials with the
parent materials of close compositions and melting points.
Fractography – is the mechanism of analysing fractured surfaces of materials. It is a
method used to examine the effect of failure in any engineering
materials or structures in most, especially in the product failure

xxxiv
thereby employing the practice of failure analysis or forensic
engineering.
Fracture – Is separation of a material or an object into two or more pieces
usually under the influence of stress.
Friction – Is the resistance offered by an object or surface when another solid
body moves in opposing direction.
Friction Stir Welding – is a technique developed at The Welding Institute (TWI) that uses
local friction heating to produce continuous solid-state seams. The
process allows for both the lap and butt joints to be fabricated
without the use of filler materials. It is a solid-state joining method
that utilizes a non-consumable tool to join two facing workpieces
without melting the workpiece materials. The solid-state low
distortion welds fabricated are achieved with relatively low costs,
using simple and energy efficient mechanical equipment.
G
Grain – This is an Individual particle size (crystallite size) in metals
Grain growth – This is simply increase in size of grains due to high temperature
Grain size – this is also known as particle size and it is a measure of individual
crystallite size.

xxxv
Grain boundary – Is a connection across two grains, or crystallites, where lattice
configuration switches from grain orientation to other grain
orientation.
Grinding – This is a metal removal technique in which material are being
removed from the surface of a workpiece by means of a grinding
wheel or abrasive grindings papers.
H
Hardness – This is a resistance offered by a material to plastic deformation,
penetration or indentation via scratching, drilling, wear and or
abrasion.
Hardness test – Is the measures of resistance of a material to indentation, penetration
or deformation by means of wear, abrasion, scratching, drilling,
impact or sharp object
Hardening – Increased hardness through appropriate treatment
Heat-Affected Zone – The part of either the base metal or a non-melted thermoplastic
component whose mechanical properties are modified by welding
heat or energy intensive cutting operations.
Homogeneous – A chemical structure and physical condition of any small portion of
the body, and that is the same as any other part.
Hot-working – The process in which metals deform plastically, above their
recrystallization temperature.

xxxvi
I
Indentation hardness – Is a test performed to establish a material's hardness to deform. It is
the hardness as estimated from the measurements of a portion of an
indentation created by pressing a given indenter into a material's
surface under defined static load conditions.
Inhibitor – is a substance or an agent when added reduces, slows, suppresses or
lower the activity of a particular reactant such as lowering the
corrosion rate of metal or an alloy.
ImageJ – is a Java-based image processing program developed at the National
Institute of Health and the Laboratory for Optical and
Computational Institutes (LOCI).
Intensity (X-rays) – The energy of a light per unit of time per unit area perpendicular to
the propagation path.
Intensity region – Processed substrate boundary showing the pin location and shoulder
diameter during processing technique.
Intermetallic compounds – It includes any solid material, consisting in a substantial amount
from two or more metal atoms that have a precise composition and
distinguish from those of its parental materials.
J
Joint efficiency – Typically measured in terms of the performance ratio of a
component to the intensity of the base metal.

xxxvii
K
Keyhole – This is an exit hole left in the centre of the friction stir spot welding
and at the end of the friction stir welding or processing generally
called defects.
L
Lap joint – The joint made by placing one metal or material over the other by
making them overlap. The overlapping joint can be made as a single
joint either by spot weld, fillet, plug or slot-weld.
M
Macrograph – A graphical characterization of a specimen's qualified surface at a
magnification not exceeding 25x.
Macrostructure – The structure of metals or materials exposed with little or no
magnification by electronic or macroscopic inspection of the
engraved surface of a polished sample.
Magnification – The ratio of the length of a line in the image plane to the length of a
line on the imaged material.
Material Test Report – A file on which the product supplier documents the results of the
tests or treatments needed by the description of the material.
Matlab (Matrix Lab) – Is a mega-paradigm quantitative computational environment and
MathWorks patented programming language.

xxxviii
Maximum roughness – This is measured from the top of the uppermost crest to the bottom
of the lowermost valley
Mean Square – This is referred to as the sum of the squares divided by the number
of degrees of freedom.
Mechanical properties – The attributes of a component specifying desirable mechanical
requirements which reveal its elastic or inelastic nature when
applying force.
Mechanical testing – The determination of mechanical properties
Metallographic Exam – Is sample planning for forensic examination and microstructure
experiment in relation to the physiological and mechanical
characteristics of a particular material. A mechanism of etching will
reveal the metal's microstructure.
Metallurgy – The science and technology of metals and their alloys, including
methods of extraction and the use thereof.
Microstructure – The structure of a formulated metal surface as confirmed at a
specific magnification by a microscope.
Milling– This is the machining process, using rotary cutters to remove
material by moving a cutter into a piece of work. This can be done
on one or more axes, cutter head speed, and pressure in multiple
directions.

xxxix
Milling machine– This is an equipment where a horizontal arbor or vertical spindle
rotates a cutting tool above a horizontal table used to move a
workpiece.
Model – Is a graphical, mathematical (symbolic), a physical representation of
a concept, structure, plan or system which shows what it looks like
or how it works.
O
Onion-skin flow pattern – a characteristic process pattern featuring a cyclic ring, or onion skin-
like profile.
Open circuit potential – The open circuit potential (OCP) is the potential of the working
electrode (metal specimen) relative to the reference electrode when
the corrosion system is not subject to any potential or current. OCP
of an electrode is generally a thermodynamic variable that informs
about the thermodynamic tendency of that metallic material to
engage with the surrounding medium in the electrochemical
corrosion reactions. It is the potential of the electrode at which, in
the absence of applied potential in a given corrosive context, the
cathodic and anodic response rates are in equilibrium.
Oxidation– The addition of oxygen to a compound

xl
P
Parameter– The lowest and highest variables that characterize a parameter's
operating range.
Parent material– This is the sheet metal rolled plate as supplied in its manufactured
form.
Pitting – This is the process of forming a hollow or indentation (pit) on the
surface of a material.
Plastic deformation – This is a distortion of materials or permanent deformation of
material developed as a result of sufficient load or stress which may
lead to a permanent change in size of material without fracture or in
shape after the release of load or stress that caused it.
Plasticity - This is the propensity of a material to undergo flexibility to be
changed into new form, that is irreversible deformation of a
material.
Plunge depth – This is the highest depth that the processing or welding tool shoulder
can penetrate into the materials during friction stir welding or
processing operations.
Plunge force – The vertical downward force in the direction of Z-axis during
plunging stage of the processing or welding pin in FSP/W is
normally referred to as the plunging force.

xli
Polarization – This is the potential change from a controlled state, e.g. from the
potential of the open-circuit electrode as a result of the current
passage. This can also be referred to as “overvoltage” or
“overpotential”.
Polished Surface – This is a glossy surface that in a peculiar way reflects a significant
portion of the incident light.
Potentiodynamic – This refers to a polarization strategy wherein the electrode's
potential differs by applying a current through the electrolyte over a
reasonably large potential domain at a selected rate.
Position control – This is the mode in FSP/FSW in which the welding or processing
machine automatically adjusts the forces
Porosity (Void fraction) – A rounded, or elongated cavity created during cool-down or
solidification by gas trapping, i.e. measurement of void spaces in a
material.
Pressure plates – These are plates that are placed above the material to be processed.
It gives the substrate (material) a rigid clamping as well opposes the
vertical downward force on the materials, at the same time protect
the machine bed.
Processed base metal – This is the base metal (substrate) that was processed and
characterised without any reinforcement or particle added during
FSP.

xlii
Processing– The act or process of treating or preparing a material by a special
method towards a known goal or end result, bypassing it through a
series or a sequence of actions.
Process nugget or stir zone– The recrystallized central area of the material interface
R
Recrystallization – A transition from one crystal structure to another, including when
heated and/or cooled, by a critical temperature.
Reference electrode – A reference electrode is an electrode type that has both a more well-
known and sustainable potential for an electrode.
Residual stress – Are stresses in a body that is at rest, in balance, and at a standardised
temperature, and will continue to exist in solid materials after
removal of the ultimate cause of stress.
Retreating side – The retreating side of the processing tool is where the local direction
of the weld or process surface due to tool rotation and the direction
of the traverse are in the opposite direction.
Rolling direction – This translates to the direction; the billet was rolled in during the
production of sheet metal plate.
Root Mean Square – This is the average profile height deviation from the mean line.
Rotational Speed – The processing tool rotational speed is the rate of angular rotation
(usually specified in rpm) of the tool about the rotational axis and is

xliii
also the number of turns of the object divided by time, specified as
revolutions per minute, cycles per second, radians per second, etc.
Roughness surface – It is a measure of surface texture, topography and surface integrity
of the processed metal matrix composites
S
SEM – An electron microscope wherein the image is created by a beam
working at the same time as the object being scanned by an electron
probe.
Side flash – In FSP, it is a build-up of material loss, normally on the retreating
side of the rotating tool which has a “peel-like” effect; this is termed
side flash
Sliding wear – This can be typified as a reference frame between two smooth solid
surfaces in contact under load, during which surface devastation is
not caused by deep surface grooving due to asperity penetration or
foreign particles during translational sliding.
Solid-phase – A theoretically monolithic and distinct component of a solid-state
product process
Spindle speed – This is also known as rotational speed, the velocity of the working
holding device (chuck) is evaluated in revolution per minute.
Spindle torque – The spindle torque needed to turn the FSP device within and around
the workpiece in the processing zone (Nm)

xliv
Stress – This is the load introduced to a substrate; and it tends to create
elongation that is resisted by the internal forces established within
the components, which are called stresses. The stress intensity is
predicted as the force on the cross-section area of the unit, namely:
as Newton per square meter or as Pascal.
Stir Zone– The optimally recrystallized zone is also known as this. It is a zone
of severely deformed material that, during welding or processing,
approximately matches the location of the pin. The grains in the stir
zone are roughly equiaxed and often smaller than the grains in the
parent material in order of magnitude.
Substrate – This is the base material on which processing is conducted to
produce new materials, such as a metal matrix and hybrid
composites
Surface finish – Is categorizing the performance or conformity of a surface to
requirements by measuring its local height variability over a
significant distance.
Surface Integrity – Is the surface condition of a workpiece after being enhanced by a
manufacturing process.
Surface roughness – A measurement for the distribution and growth of surface structures
during friction stir processing.

xlv
Surface texture – This is also called topography of the surface or surface finish. It is
the nature of a surface as described by the three wave, lay, and
surface roughness characteristics.
T
Taffel Plot/Curve – Is a graphical (usually logarithmic) plot that shows the correlation
between the current developed in an electrochemical cell and a
particular metal's electrode potential.
Tensile Strength – The highest possible stress that can be sustained by a material.
During a tension test to rupture, the tensile strength is computed
from the peak load as well as the initial cross-sectional area of the
specimen.
Tensile test – Measures the response of a material to a slowly applied axial force.
The yield strength, tensile strength, modulus of elasticity and
ductility are obtained.
Tool displacement – To adjust the device at a range from the centre line of the process /
weld.
Tool Shoulder – Part of the processing tool that rotates; it is normally disk-shaped.
Tool pin – The part of the tool that rotates in contact with the surface of the
workpiece and penetrates into the substrate during plunge depth.
Tool plunge– The process of forcing the tool into the material at the start of the
process/weld.
xlvi
Tool tilt angle – The angle at which the FSP tool is placed relative to the surface of
the workpiece; that is, the angle of zero tilt is situated perpendicular
to the surface of the workpiece (degree).
Traverse speed – The speed at which the rotating FSP is translated along the joint line
(mm / min) can also be referred to as the feed rate or processing
speed.
Tribometer – This is a measuring device for tribological quantities, including
friction coefficient, friction force, and wear volume between two
contact surfaces.
Topography – This is a local deviation of a surface from a perfect plane. This
substantially affects the bulk properties of the material. Surface
topography is also known as surface profile, surface texture as well
as surface finish.
V
Vickers’ hardness number – This is a proportion attributed to the load applied by a
square-based pyramid diamond indenter and the surface area of the
permanent impression.
Void– The space around particulates or gains that exists. Vacuum is
normally associated with faults in manufacturing or welding.
Volume loss – This is also known as wear volume. It is the total volume of material
removed during the wear test.

xlvii
U
Ultimate tensile strength– This is the optimum stress a material can endure until failing or
breaking while being stretched or pulled. This happens after yield in
the plastic region of stress-strain curves.
Unaffected material – This is the bulk of material which is not affected by either heat or
deformation during the friction stir processing operation.
Unprocessed base metal – This referred to as base metal that was not processed at all. This is
also known as a substrate.
W
Waterjet Cutter– This is also regarded as a water jet or waterjet; it is a manufacturing
instrument that can cut a wide variety of applications using a very
elevated-pressure water jet, or a mixture of water and abrasive
substance.
Wear– This is the material on solid surfaces that is destructive, gradual
removal or deformation. Metal wear occurs through both the plastic
deformation of surface and near-surface material and the separation
of wear debris from particles.
Welding– The joining method, in which components are allowed under the
combined action of heat and pressure to form metallurgical bonds.
Weld nugget or stir zone– The joint interface's recrystallized central field.

xlviii
Weld root– The part of the joint profile opposite the shoulder has designated the
root of the weld.
Welding speed– This is also known as traverse speed. This is the speed (usually
specified in mm/min) of the tool traversing along the workpiece per
specified time.
Workpiece– The component to be processed or welded
Working Electrode– Is the electrode on which the reaction of interest occurs in an
electrochemical process.
Worn holes– A flaw in welding or processing of FS, typically on the
advancing side of the rotating device caused by a lack of mixing or
re-bonding of the plasticized material.
X
X-Axis– Relating to a specific axis (horizontal) or a fixed-line determining
the direction of movement, or placement in a 2-Dimensional or 3-
Dimensional co-ordinate system.
Y
Y-Axis– Relating to a specific axis (perpendicular to the x-axis) or a fixed-
line determining the direction of movement or placement in a 2-
Dimensional or 3-Dimensional co-ordinate system

xlix
Yield Strength– The yield point is that point on a stress-strain curve which reveals
the elastic nature threshold and the flexible behaviour that begins.
Z
Z-Axis– Relating to a specific axis (vertical) or a fixed-line determining the
direction of movement, or placement in a 2-Dimensional or 3-
Dimensional co-ordinate system

l
LIST OF PUBLICATIONS
Journal articles
1. Ikumapayi O. M, and Akinlabi, E. T. (2019). “Experimental data on surface roughness
and force feedback analysis in friction stir processed AA7075-T651 aluminium metal
composites”. Data in Brief., Vol 23, page 103710.
https://doi.org/10.1016/j.dib.2019.103710.
2. Ikumapayi O. M, and Akinlabi, E. T. (2019). “Efficacy of α-ꞵ grade titanium alloy powder
(Ti-6Al-2Sn-2Zr-2Mo-2Cr-0.25Si) in surface modification and corrosion mitigation in 3.5
% NaCl on friction stir processed armour grade 7075-T651 aluminium alloys – Insight in
Defence Applications”. Materials Research Express, Vol 6, Issue 7, pp. 1- 15.
https://doi.org/10.1088/2053-1591/ab1566,
3. Ikumapayi, O. M, Akinlabi, E. T, Majumdar, J. D, Akinlabi, S.A. (2019).
“Characterization of High Strength Aluminium – Based Surface Matrix Composite
reinforced with Low-cost PKSA Fabricated by Friction Stir Processing”. Materials
Research Express, Vol 6, Issue 10, pp. 1-27. https://doi.org/10.1088/2053-1591/ab395b
4. Ikumapayi O. M, Akinlabi, E. T, Majumdar, J. D. (2019). “Influence of Carbonaceous
Agrowaste Nanoparticles on Physical and Mechanical Properties of Friction Stir Processed
AA7075-T651 Metal Matrix Composites”. Surface Topography: Metrology and
Properties, Vol 7, Number 3, pp. 1-17. https://doi.org/10.1088/2051-672X/ab3aae
li
5. Ikumapayi O. M, Akinlabi E. T, Majumdar J. D, Akinlabi S. A. (2019). “Influence of 17-
4PH stainless steel and α+ꞵ titanium alloy powders for corrosion susceptibility on friction
stir processed AA7075-T651 Aluminium Matrix Composites”. Journal of Bio- Tribo-
corrosion, Vol 5, issue 4, pp. 1-11. https://doi.org/10.1007/s40735-019-0294-9
6. Ikumapayi O. M and Akinlabi, E. T. (2019). “Comparative Assessment of Tensile Strength
and Corrosion Protection in Friction Stir Processed AA7075-T651 Matrix Composites
using Fly Ashes Nanoparticle as Reinforcement Inhibitors in 3.5 % NaCl”. International
Journal of Mechanical and Production Engineering Research and Development . Vol. 9,
Issue 3, 839-854. https://doi.org/10.24247/ijmperdjun201992
7. Ikumapayi O. M, and Akinlabi, E. T. (2019). “Data showing the effects of vibratory disc
milling time on the microstructural characteristics of Coconut Shell Nanoparticles (CS-
NPs),” Data in Brief., vol. 22, pp. 537–545, https://doi.org/10.1016/j.dib.2018.12.067
8. Ikumapayi O. M, Akinlabi E. T. and Majumdar J. D. (2018). “Review on Thermal,
Thermo-Mechanical and Thermal Stress Distribution during Friction Stir Welding”,
International Journal of Mechanical Engineering and Technology, 9(8), pp.534–
548.http://www.iaeme.com/ijmet/issues.asp?JType=IJMET&VType=9&IType=8

lii
9. Ikumapayi O. M, and Akinlabi, E. T. (2018). “Composition, characteristics and
socioeconomic benefits of palm kernel shell exploitation-an overview”. J. Environ. Sci.
Technol., 11: 220-232. https://doi.org/10.3923/jest.2018.220.232
10. Ikumapayi O. M, and Akinlabi, E. T. (2019). “Effects of Vibratory Disc Milling Time on
the Physiochemical and Morphological Properties of Coal Fly Ash Nanoparticle,” Key
Engineering Materials., vol. 796, pp. 38–45, doi: 10.4028/www.scientific.net/KEM.796.38
11. Ikumapayi O. M, and Akinlabi, E. T. (2019). “Image Processing and Particle Size Analysis
of Coconut Shell Nanoparticles”. International Journal of Civil Engineering and
Technology, Volume 10, Issue 02, pp. 2475–2482.
http://www.iaeme.com/ijmet/issues.asp?JType=IJCIET&VType=10&IType=2
12. Ikumapayi O.M., Akinlabi E.T. (2020). “Image Segmentation and Grain Size
Measurements of Palm Kernel Shell Powder”. In: Awang M., Emamian S., Yusof F.
(Eds) Advances in Material Sciences and Engineering. Lecture Notes in Mechanical
Engineering. Springer, Singapore, page 265 – 274.
https://doi.org/10.1007/978-981-13-8297-0_29
13. Ikumapayi O. M, Akinlabi E. T, and Majumdar J. D. (2019). “Effect of Friction Stir
Processing on tensile behaviour and corrosion study of armour grade AA7075 – T651”.
Accepted for publication in Lecture Notes in Mechanical Engineering

liii
14. Ikumapayi, O. M., Akinlabi, E.T., Adedeji, P.A., Akinlabi, S.A. (2020). “Preparation,
Characterization, Image Segmentation and Particle Size Analysis of Cow Bone
Nanoparticle for composite applications”. In press at Lecture Notes in Mechanical
Engineering. https://doi.org/10.1007/978-981-15-4745-4_25
15. Ikumapayi O. M., Akinlabi E.T., Majumdar J.D., Fayomi O.S.I., Akinlabi S. A. (2020).
Corrosion Study and Quantitative Measurement of Crystallite Size of High Strength
Aluminium Hybrid Composite developed via Friction Stir Processing. Material Science and
Engineering Technology (Materialwissenschaft Und Werkstofftechnik). Vol 51, issue 6,
page 732-739. https://doi.org/10.1002/mawe.202000003.
16. Ikumapayi O. M., Akinlabi E. T., Sharma A., Sharma V., and Oladijo O. P. (2020).
Tribological, Structural and Mechanical Characteristics of friction stir processed
aluminium-based matrix composites reinforced with stainless steel micro-particles.
Engineering Solid Mechanics, Vol 8, Issue 3, https://doi.org/10.5267/j.esm.2019.12.001,
Peer-reviewed conference Proceedings
17. Ikumapayi O. M., Akinlabi E. T., Pal S. K, Majumdar J. D. (2019). “A survey on
reinforcements used in friction stir processing of aluminium metal matrix and hybrid
composites”. 2nd International Conference on Sustainable Materials Processing and
liv
Manufacturing, SMPM 2019, Sun City Resort, South Africa, 08 – 10 March 2019.
Published in Procedia Manufacturing, Vol 35, Page 935 – 940,
https://doi.org/10.1016/j.promfg.2019.06.039
18. Ikumapayi O. M., Akinlabi E. T. (2019). “Recent advances in keyhole defect repairs via
refilling friction stir spot welding”. 9th International Conference on Materials Processing
and Characterization, ICMPC 2019, Hyderabad, India, 8th – 10th March 2019. Published in
Materials Today: Proceedings 18, pp 2201–2208. 10.1016/j.matpr.2019.06.663
19. Ikumapayi O. M., Akinlabi E. T. (2019). “Comparative Study of The Variability in the
Compositions and the effect of milling time on coal fly ash and wood fly ash Nanoparticles”.
9th International Conference on Materials Processing and Characterization, ICMPC 2019,
Hyderabad, India, 8th – 10th March 201. Published in Materials today: proceedings 18:5556-
5564, 10.1016/j.matpr.2019.07.005
20. Ikumapayi O. M., Akinlabi E. T. (2018). “Characterizations of the evolving properties
during the milling time of Wood Fly Ash Nanoparticles (WFA-NPs)”. Published in
Proceedings of the International Conference on Industrial Engineering and Operations
Management Pretoria / Johannesburg, South Africa, October 29 – November 1, 2018, pp.
2040-2049.

lv
21. Ikumapayi O. M., Akinlabi E. T. (2018). “A Study into the effects of the milling time on
the Physiochemical and Morphological Characteristics of Cow Bone Powder ( CBP ),”
Published in Proceedings of the International Conference on Industrial Engineering and
Operations Management Pretoria / Johannesburg, South Africa, October 29 – November
1, 2018, pp. 2050-2058.
22. Ikumapayi O. M, Akinlabi, E. T, Abegude O.O and Fayomi, O.S.I (2020).
“Electrochemical investigation of calcined agrowastes powders on friction stir processing
of aluminium-based matrix composites”. Materials Today: Proceedings 26, pp 3238–3245
https://doi.org/10.1016/j.matpr.2020.02.906
23. Ikumapayi, O. M., Akinlabi, E.T., Adedeji, P.A., Akinlabi, S.A. (2019). “Effect of milling
time on the particle sizes of coal fly ash and wood fly ash using otsu method for
thresholding”. Presented at the 3rd International Conference on Engineering for a
Sustainable World ICESW, July 3rd – 8th, 2019. Journal of Physics: Conference Series,
1378 (2019) 042075, page 1-9. https://doi.org/10.1088/1742-6596/1378/4/042075
24. Ikumapayi O. M, Akinlabi E. T, and Majumdar J. D, Oladijo O.P and Akinlabi S.A. (2019).
“Influence of Wood Fly Ash Reinforcement on the Wear Behaviour of Friction Stir
Processed Aluminium-Based Surface Matrix Composite”. Published in the Proceedings of
the International Conference on Industrial Engineering and Operations Management,
Toronto, Canada, October 23-25, 2019, page 966 – 977.

lvi
Peer-reviewed book chapter
25. O. M. Ikumapayi, E.T. Akinlabi, J.D. Majumdar, S. A. Akinlabi. (2020). Applications of
coconut shell ash/particles in modern manufacturing: a case study of friction stir processing.
Modern Manufacturing Processes. Pp 69 – 95 , ISBN 978-0-12-819496-6 .
https://doi.org/10.1016/B978-0-12-819496-6.00004-X.

1
1 CHAPTER ONE: THE INTRODUCTION
1.1 BACKGROUND
Aluminium-based matrix composites (AMC) have been used in the manufacturing sector for the
fabrication of the following components: brake drums, pistons, as well as the cylindrical blocks,
in which friction, corrosion and wear play important roles. Aluminium-based matrix composites
(AMCs) have been reported to also find applications in most of aerospace, aviation, transportation,
marine, buildings and construction, automobile, packaging industry, sports and recreation, and
nuclear sectors, as one of the advanced and modern engineering and manufacturing materials used.
AMCs have several remarkable and excellent isotopic, structural, metallurgical, ease-of-
fabrication, mechanical and electrochemical properties, which make them suitable for the building
of defence and military equipment. These properties are not limited to low thermal expansion, high
thermal conductivity, excellent wear-resistance, weldability, excellent formability, high fatigue
strength, high creep resistance, promising damping capacity, high ductility, as well as high
stiffness [1,2].
It has been reported that the lower series of aluminium alloys have low thermal stability, poor
corrosion-resistance, low hardness, as well as low tensile strength; and such, series comprise of
pure aluminium (1xxx) which are used in electrical current cable, corrosion resistant in specific
environment; copper-based (2xxx) series are used in the aerospace and automobile engineering;
The manganese-based (3xxx) series are used as air conditioners, heat exchangers, in the food
industry as well as vehicle engineering; while the silicon-based (4xxx) series finds applications in
architecture especially in construction panel, welding or brazing filler alloy as well as anodizing
quality; the magnesium-based (5xxx) series are used in shipping engineering, apparatus,

2
architecture as well as automobile; as also the series 6xxx used in electrical engineering,
automobile, architecture and anodizing quality [3–5]. These deficiencies have been overturned by
high strength aluminium alloys, which have improved the structural, mechanical and chemical
properties.
The high-grade aluminium alloys are said to have improved mechanical , metallurgical and
electrochemical properties over the lower series, examples of such series are Zinc-based (7xxx)
series which finds applications in aerospace, as well as automobile; as well as the new series of
8xxx which are used in space shuttle and aerospace and 9xxx which are not so popular [6,7]. It
has been established that lightweight materials, such as magnesium, aluminium, and titanium offer
dynamic and enterprising advantages over the traditional steel metal, because of their high specific
strength and low density [8,9]; and these are promising metal alloys that can be used in the
automotive industry, as shown in Figures 1.1 and 1.2.
Source: http://www.boronextrication.com/2010/05/29/2010-volvo-v60-body-structure-safety-cage/ [10]
Figure 1 1: 2010 Volvo S60 Body Structure showing different metal alloys configurations

3
Figure 1 2: 2019 Volvo S60 Body Structure showing different metal-alloy configurations
Source: http://www.boronextrication.com/2019/03/14/2019-volvo-s60-t8-plug-in-hybrid/ [10]
In the future, steel might go into extinction [10-11], whereas high-strength and low-density
materials, such as aluminium, titanium, and magnesium might well replace steel. However, since
titanium is very costly and magnesium is self-explosive, consequently aluminium might become
the metal that will probably replace steel in some of the prominent industries, in which steel
functions today: such as transportation, aerospace, automobiles, and defence sectors [10 -11], even
though the strength might not be higher like that of steel, this will be compensated by the
reinforcement particles such as titanium particle, stainless steel particle or other particles deem fit
for the enhancement of the properties.
From Figures 1.1 and 1.2, it is observed that magnesium alloys have been eliminated in the
production of the Volvo in 2019, as shown in Figure 1.2; and this may be attributed to the safety
4
technology adopted by the Volvo company against the accidents that occurred in the earlier
production (2010 model), in which magnesium alloys that are very soft were incorporated. In
addition, some of the parts made with high-strength steel have also been changed to high-strength
aluminium alloys, as revealed in the latest version 2019.
In the latest production, more aluminium has been incorporated. The utilization of any of these
engineering materials effectively and efficiently is of paramount importance for the manufacturing
and designing of various structures, machines, as well as vehicles, etc. It is essential to note that
engineering materials must meet some fundamental integration of properties, like toughness,
strength, density, and stiffness. The combination of any of these properties may be absent from the
conventional polymer, metal or ceramic. On this note, the fabrication of composite materials which
will, therefore, have some amalgamated properties that conventional metal, ceramics or polymer
were unable to meet.
An application of composites in the Fighter Jet - F-35 Lightning II is illustrated in Figure 1.3 [12].
A structural material containing the combination of two or more constituents must have distinctive
chemical or physical property, which remain on the macroscopic level, in order that the final
structure can be termed composite. A composite is a multiphase substance, in which the targeted
properties can be produced by interfacial bonding between the reinforcement and the matrix
substrate[13].
It has been observed that aluminium and its alloys have been under-utilized as industrial materials
because of some poor mechanical, structural and tribological properties. The surface modification
of the base material is being altered via electron-beam welding, thermal spraying, as well as laser

5
surfacing [14]. Nowadays, the friction stir process technology has been adopted to cater for the
complex methods of surface modification.
Figure 1 3: Fighter Jet - F-35 Lightning II showing parts and the location made of composites [12]
Friction stir processing (FSP) technology was initially derived in 1999 from the work of Mishra,
R. S. [15–17], which took its origin from a novel technique called friction stir welding (FSW) that
was invented in 1991 and patented by The Welding Institute (TWI) of UK, as a solid-state joining
method. Since the use of FSP in 1999, thousands of articles, hundreds of patents, thousands of
textbooks, as well as reviewed and peer-reviewed magazines, have been in circulation, which have
been utilized for research and development. It is worth knowing that many benefits emerge from
the FSP, which include, but are not limited to, short-route of fabrication, densification, grain
refinement, homogenization of precipitates of composite substance and aluminum alloys, nugget-

6
zone homogeneity and enhanced properties compared to parent material[18], as shown in Figure
1.4.
FSP have been well known for their surface modification, significant and remarkable improvement
in hardness, ductility, strength, increased fatigue life, as well as formability, in which the bulk
properties are still present [19]; and the steps to achieve the aforementioned properties are
illustrated in Figure 1.5. However, some difficulties are still being encountered in the course of
modifying these surfaces using FSP, especially with reinforcement particles. It has been reported
that the backing plates usually stick to the workpiece, when a thin or small diameter that is less
than 1 mm is being processed, when proper optimum parameters are not being chosen, many
flashes may be experienced during the FSP techniques, considerable wear may be encountered
during the fabrication of the composites, due to the abrasive influence of the particles used for
reinforcement [20].
Figure 1. 1. Figure 1 4: A schematic diagram showing the enhanced properties with and without reinforcement during FSP

7
Therefore, to achieve a defect-free material in the fabricated composites samples with good surface
finish, the experimental parameters must be adequately controlled. The processing parameters
must be optimized, in order to obtain a fabricated composite free of defects with high surface
integrity. It is, therefore, imperative to note that the following parameters must be adequately
controlled to give the best results. Such parameters include proper tool design, i.e. shoulder
diameter geometry, as well as a pin profile; while the groove dimensions in terms of depth and
width should be well designed; furthermore, the machine variables must be controlled, such as
tool-plunge depth, tool-tilt angle, tool-rotational speed, and tool-traverse speed. In the same vein,
the amount of heat input and the methods of heating and cooling must be controlled significantly;
while the material properties must be known before and after the processing, such as the
mechanical, chemical, thermal and the electrical properties [15,21–25].
Several researchers have done significant work on the behaviour of aluminium alloy 7075 at
different tapered conditions, using various reinforcement particles, ranging from metallic powders
to agrowastes powders, which are carried out experimentally and theoretically [26–29].
Figure 1 5: The evolution of enhanced properties with various emerging friction stir processing technologies
8
1.2 PROBLEM STATEMENT
Many challenges are hindering the viability of the commercialization of FSP technology.
The mechanical, electrochemical and tribological properties for several light-weight alloys would
be enriched by the utilization of FSP. It is worth noting that the significant areas that are critical
for the acceptability of its commercialization are to process fully the sheet, and to study and
analyze the surface roughness, tensile strength, microstructures, corrosion, as well as the wear and
microhardness results. The major areas of application of FSP, such as the aerospace and the
automotive industries demand such an analysis. On this note, several reinforcement phases have
been employed to study the mechanical, electrochemical, tribological and metallurgical
characteristics.
Two different categories of reinforcement powders are used in this study, such as the metallic
powders and the nanoparticles developed from the agrowastes powders in the matrix and in the
hybrid composites form.
The metallic powders are two inorganic powders (Titanium Powder (Ti-6Al-2Sn-2Zr-2Mo-2Cr-
0.25Si)). It was established that titanium-based alloys powders have excellent properties such as
corrosion resistance, high strength and hardness as well as remarkable mechanical properties when
judged on a density-corrected basis. On this note, they are mostly and widely used for structural
application that requires high performance especially in aerospace and automobile sectors. Hence,
the reason for the selection of this titanium alloy powder used in this research. The second metallic
powder is stainless steel (17-4Ph) and the reasons for the selection was that, 17-4PH stainless steel
was reported to have possessed remarkable corrosion resistance due to the presence of chromium

9
content and a low carbon level, it has outstanding mechanical properties and well suitable for
applications that required ease of fabrication as well as improved strength/hardness for reliability
and structural integrity. These properties made it mostly used in maintaining firearms accuracy
and widely used in aerospace, automobile and defence sectors; and five organic carbonaceous
powders, which are (Palm Kernel Shell Ash (PKSA), Coconut Shell Ash (CSA), Cow Bone Ash
(CBA), Wood Fly Ash (WFA) and Coal Fly Ash (CFA)) as reinforcements. These substances have
been creating environmental pollution, thereby posing a great hazard to the health of the people
living around the place where they are processed because there is a serious issue on the storing of
these agrowastes such as water contamination, disease carrying pests, bad impact on human and
animal health as well as marine life.
It was established that agrowastes particles has been pivotal reinforcements constituents for metal
matrix composites (MMC) and can serve as promising alternative to metallic powders because
agrowastes particles are readily available with low-cost, they are rich in silica, alumina and
magnesium oxide constituents which are primarily used as value-added in engineering products.
They have high coefficient of thermal expansion, low elastic modulus and low wear resistance.
They also have low weight and as such improve the efficiency of aerospace and automobile
industries by lowering their fuel consumptions and at the same time reduce the pollutions on
environment. Agrowastes particles are very rich in carbon black as a result of its outstanding
natural structure and reduction in ash contents and this made it suitable for the fabrication of light
weight metal matrix composites components with excellent thermal resistance. Hence, the reason
for the selection.
On this note, the effective utilization of carbonaceous agrowastes powders for reinforcement was
developed as an alternative to metallic powders. This, in turn, would reduce its impact on the

10
environment where they are disposed of, while at the same time producing high levels of value-
added products that are cost-effective.
It has been established by a few researchers that have used the selected agrowastes for
reinforcement in other applications and to attest to their superior physical and mechanical
properties: while at the same time being less susceptible to chemical attack, especially Fly Ashes.
It is expected that the selected agrowastes powders will add toughness and ductility, will enhance
the tensile strength, and will reduce wear and corrosion resistance, thereby increasing the useful
life of the materials, by improving fatigue and creep resistance in the processed materials.
An additional novel and new area in this research is the application of new agrowastes
nanoparticles, such as carbonaceous Palm Kernel Shell Ash (PKSA), Coconut Shell Ash (CSA),
Cow Bone Ash (CBA), Wood Fly Ash (WFA) that have not been used in FSP applications before
and the comparison of the resultant microstructure, tensile strength, corrosion and wear behaviours
and micro hardness analyses.
1.3 MOTIVATION
One of the motives behind this research work was to establish the efficacy of friction stir
processing as surface modification technique in order to enhance the surface integrity. Similarly,
to establish the potency of the developed agrowastes powders (AP) and the selected metallic
powder (MP) in strengthening metal matrix and hybrid composites through mechanical,
metallurgical, tribological, structural and the electrochemical properties, as well as the
microstructure. The FSP is novel in its approach and relatively new concept of processing. Its
applications cover so many areas, such as transportation (aviation, railway, aircraft etc.), marine
11
and automotive. It is designed for surface modification, in order to enhance the mechanical and
metallurgical behaviour of the metal by varying the processing parameters to achieve optimum
results.
This research work aims at processing AA7075-T651, as one of the newest and high-strength
aerospace alloys; and it also finds great potentials in transport applications. FSP has been
established for surface improvement of metal alloys properties, improvements in ductility,
formability, high hardness, and enhanced strength; as well as increasing the fatigue life, without
altering the bulk metal properties.
One of the benefits of FSP includes grain refinement, homogeneity of the processed zone,
densification and homogenization of the precipitates of aluminium alloys and composite materials.
1.4 HYPOTHESIS STATEMENT
Aluminium Alloys 7075-T651 are expected to be processed by using different reinforcement
particles, by the novel method of friction stir processing. Processing quality assurance, i.e. the
integrity of the processed surface will be characterized with different methods. It is expected that
the material characterization employed in this research will dictate the optimum process
parameters. This is expected to produce fabricated composites with high performance qualities
during service conditions. The mechanical, electrochemical, tribological and metallurgical
integrity of the processed parts can be expected to dictate the reliability and the quality assurance
of the processed parts.

12
1.5 AIM OF THE STUDY
The aim of this thesis study is to successfully fabricate high-strength aluminium alloy 7075-T651
via friction stir processing, using developed carbonaceous agrowaste particles, together with some
selected metallic powders, as reinforcements in matrix and hybrid composites, in order to enhance
its physical, mechanical, structural, tribological and electrochemical properties. The main focus
will be on ensuring the homogeneous and uniform distribution of the reinforcement particle and
improving the strength, hardness, and wear and corrosion resistance through the application of
different second phases (reinforcements).
1.6 OBJECTIVES OF THE STUDY
The research aims were achieved through the following specific objectives:
i. To develop, characterize and utilize carbonaceous agrowaste powders as bioprocessing
agents, such as palm kernel shell Ash, coconut Shell Ash, Cow Bone Ash, Wood Fly Ash
and Coal Fly Ash generated in large quantities, as alternative reinforcement materials.
ii. To utilize selected powder metallurgy, such as Titanium Powder ((Ti-6Al-2Sn-2Zr-2Mo-
2Cr-0.25Si) and Stainless-Steel powder (17-4PH), as the second phase in the formation of
Aluminium matrix and its hybrid composites.
iii. To experimentally study the Friction-Stir Processing (FSP) of Aluminium Alloy 7075-
T651 and to obtain a uniform dispersion of the selected agrowaste powders and metallic
powder at different rotational speeds.

13
iv. To improve the surface composites through reinforcement; and the carrying out of
mechanical, structural, tribological, electrochemical and metallurgical characterizations of
the fabricated Aluminium Alloy 7075-T651 matrix composite.
v. To explore the possibility of utilizing FSP-processed composite materials for engineering
applications.
1.7 THE SCOPE OF THE WORK
Commercially available aviation (aerospace) aluminium alloy 7075-T651 with 6.00 mm thickness
was studied with different reinforcement phases. The reinforcement particles used in this study
were two types (Two Organic and Five Inorganic Powders). Two metallic powder (MP)- (Titanium
Powder (Ti-6Al-2Sn-2Zr-2Mo-2Cr-0.25Si) and Stainless Steel (17-4Ph); and five agrowaste
powders (AP)- (Palm kernel Shell powder, Coconut Shell Powder, Cow Bone powder, Coal Fly
Ash and Wood Fly Ash) which were carbonized through heat treatment.
The friction stir processed samples were then subjected to mechanical, structural, tribological,
electrochemical, and metallurgical testing. The reinforcement was done singly, as metal-matrix
composites (MMC), as well as a combination of MP with AP to achieve metal hybrid composites
(MHC). Figure 1.6 summarizes the different experimental procedures and characterizations of the
methodology applied.

14
Figure 1 6: Flowchart of the experimental procedures and the characterization methodology applied

15
1.8 OVERVIEW OF THE THESIS
This thesis consists of four chapters; and the summary of each chapter has been provided below,
in addition to how each chapter links with the other chapters.
CHAPTER ONE:
Chapter one presents an introduction to aluminium alloys, as well as a brief introduction to friction
stir processing. The aim and the objectives of the research are covered here, together with a brief
explanation of the outcome and the expected results, in addition to the problem statement, the
scope of the research, the hypothesis statement, the experimental layout of the research project,
the research methods and the chapter summary. These are all covered in this chapter.
CHAPTER TWO
Chapter two presents all the published, accepted and submitted peer-reviewed journal articles that
are indexed in ISI/Scopus; and that are also listed in DHE-accredited journals. Sixteen (16) journal
manuscripts were written, submitted and peer-reviewed from this work; and these are presented in
this section. The agrowaste powders used for the reinforcement of the aluminium matrix were
firstly characterised and published – before they were applied as reinforcements. Developed
agrowastes were calcined or carbonized – before they were applied.
Six articles were developed from the agrowaste powder used, while ten articles were developed
from the application of the agrowaste substances and the metallic particles on the aluminium-metal
matrix and the hybrid composites. Detailed experimental procedures, materials, methodologies,
analyses and the results that produced each article were presented in this chapter, together with the
discussions and conclusion drawn.

16
CHAPTER THREE:
Chapter three presents the published, accepted and submitted peer-reviewed conferences
proceedings that are currently international and local, which have been indexed by Scopus. The
research work produced eight (8) conference articles that are listed in this chapter. The conference
papers were written exclusively by the author of this thesis, under professional supervision. The
experimental data acquired were analyzed; and the results were prepared and presented for
publication after each conference. The proceedings from each conference are hereby attached in
this section.
CHAPTER FOUR:
Chapter four encloses one (1) book-chapter written, submitted, accepted, peer-reviewed and
published in a book entitled: Modern Manufacturing Processes which was published by Elsevier
and indexed in Scopus data-base.
CHAPTER FIVE:
This chapter concludes this research work, together with a summary, conclusions and the
recommendations for a future research study.
1.9 CONTRIBUTIONS TO KNOWLEDGE
1. The development of agrowaste nanoparticles for the reinforcement of the metal matrix and
hybrid composites were prepared via the friction stir process.
17
2. The establishment of corrosion susceptibility between stainless steel alloy powder (17-4Ph)
and (α+ꞵ) titanium alloy powder (Ti-6Al-2Sn-2Zr-2Mo-2Cr-0.25 Si) was confirmed; and
similarly, among the developed agrowaste powders.
3. The potency of (α+ꞵ) titanium alloy powder (Ti-6Al-2Sn-2Zr-2Mo-2Cr-0.25 Si) as
reinforcement in the fabrication of composites in defence application via the friction stir
process was established.
4. The optimum parameters that would yield defect-free results during the fabrication of high-
strength aerospace alloys via the friction stir processing were established.
5. The mechanical, electrochemical, metallographic, tribological, as well as structural test
data for the friction stir processing of armour grade aluminium alloys (AA7075-T651) in
near-service conditions to assist researchers, scholars, manufacturers, as well as the
captains of industries for decision-making on the best possible fabrication route were
revealed.
1.10 STATE OF THE ART
The weldability of high strength wrought aluminium alloys of the 7000 series brings advantages
in the highly stressed areas of lightweight construction applications, e.g. aerospace and automotive
engineering. Aluminium alloys can be welded using FSW or processed using FSP, which are
generally considered unsuitable for welding or processing. The (finely divided) precipitations,
which are responsible for the high strength of the 7000 alloys and the Al2CuMg and Mg2Zn phases
that form due to natural aging or temperature aging, are influenced by the FSW process. The
corrosion behaviour varies depending on the area (stirring zone, thermomechanically influenced
zone, thermally influenced zone, base material) and the position (Retreating side, advancing side).
By influencing the shape, type, size and distribution of the perceptions by the FSW/FSP, however,

18
the high strength of the base material is also negatively affected. There are approaches to improve
the tendency of FSP-processed aluminium alloys to corrode, but most of them have not been
investigated for 7000 alloys or are associated with a significantly increased production effort (e.g.
shot peening to reduce pitting or stress corrosion cracking) and therefore especially for Small and
medium-sized enterprises (SMEs) not attractive. Approaches to improve the mechanical-
technological properties of friction stir processed components (e.g. by means of underwater
friction stir processing) have not been systematically examined with regard to their influence on
the corrosion behaviour.
1.11 POSSIBLE COMMERCIALIZATION OF THE FABRICATED
ALUMINIUM-BASED MATRIX COMPOSITES
The Global markets for aluminium-based fabricated composites products can be found in some
industries like structural material, manufacturing, defence, aerospace, automobile, and other
industrial sectors. The commercialization of aluminium-based composites in scale production was
noted to have grown significantly in recent years, since many companies in China has ventured
into the market and China happened to be one of the largest manufacturers of the aluminium-based
composites across the globe. It is a known fact that the cost of production in large volume will be
extreme high and as such will not be feasibility for individual without any financial assistance.
The success of the commercialization of the fabricated aluminium matrix composites will go
beyond the development of the fabricated material as well as the discovery of the potential
applications. It is expected that the fabricated aluminium-based composites will be introduced to
China markets by first of all, approach a designated aluminium-based composites companies for
partnership such as Duralcan, a subsidiary of Alcan Aluminium Limited or sourcing for link in US

19
for partnership as well as Africa. By and large, the fabricated composites will find its way into a
global world, after it has been tested and confirmed. It is also expected that for the new fabricated
materials to find its way into a global market for large potential users, adequate production capacity
must be put in place by lowering the costs in order to meet the target.
20
2 CHAPTER 2: ISI AND SCOPUS-LISTED PEER-REVIEWED
PUBLISHED ARTICLES, ACCEPTED AND SUBMITTED
MANUSCRIPTS
2.1 INTRODUCTION
This chapter includes the published, accepted and submitted manuscripts that are indexed in ISI,
Scopus; and that are also listed in the DHET-accredited list of Journals. The presented published,
accepted and submitted articles in this thesis were done in conformity to the requirements of each
journal’s guidelines. A concise summary of each article is presented before the insertion of the
main article.
It is essential to emphasise here that the first, corresponding and the principal contributor
of all the published articles, as well as the accepted and submitted manuscripts attached hereto
were written by the author of this thesis. The author carried out the entire literature review,
sourcing for materials (matrix and reinforcements), the experiments, the characterizations, the
analyses, as well as the writing-up of the all the manuscripts presented in this chapter.

21
2.2 ARTICLE I
Experimental Data on Surface Roughness and Force-Feedback Analysis in
Friction Stir Processed AA7075-T651 Aluminium-Metal Composites
Published in Data in Brief, Vol 23, 2019, Pages 103710.
DOI: https://doi.org/10.1016/j.dib.2019.103710,
ISSN: 2352-3409
In this published article, the integrity of the friction stir processed (FSPed) surfaces was evaluated
by using the surface-roughness Tester (SRT), and the forced feedback during the friction stir
processing (FSP) operation at various reinforcements particles, such as coal-fly ash (CFA), wood-
fly ash (WFA) [30], cow-bone ash (CBA) [31], coconut-shell ash (CSA) [32], palm-kernel shell
ash (PKSA) [33]; and metallic powders, such as stainless-steel alloy powder (17-4Ph) and
titanium-alloy powder (Ti-6Al-2Sn-2Zr-2Mo-2Cr-0.25 Si) that were also obtained from the
machine and presented.
The surface-roughness analyses were investigated at the various surfaces of application of the
reinforced particles after the fabrication of the aluminium-metal matrix and the hybrid (AMHC)
surface composites. In this article, a groove of 2.0 mm depth was created with a horizontal milling
machine having a width of 3.5 mm, in order to house the various reinforcement particles applied.
The following processing parameters were used on the machine during the FSP: a varying
rotational speed of 1200 rpm, 1500 rpm and 1800 rpm; while a constant processing/travel speed
of 20 mm/min was maintained.
22
A plunge depth of 0.3 mm was enabled on the 6 mm thickness of the aluminium alloy 7075-T651
with the chemical compositions presented in Table 2.1 and its mechanical properties in Table 2.2.
The tilt angle of 3 degrees was used; and a cylindrical tap made from AISI H13 steel tool was also
employed for the stirring and mixing of the reinforcement particles in the friction stir welding
machine. This H13 steel tool was designed in such a way that the diameter of the shoulder was 18
mm; while the diameter of the pin and the length of the pin/probe were each 5.0 mm. The summary
of the processing parameters is presented in Table 2.3.
It is therefore essential to mention that the following parameters were measured, recorded and
computed by using SRT: the mean-roughness depth (Rz); the arithmetical mean-roughness value
(Ra), the root mean-square roughness (Rq) and the maximum height (Ry). The readings were taken
at three different points on a workpiece, in order to ensure the reproducibility; and the average
value was computed and recorded. The generated force feedback at different reinforcement values
of the particles applied was presented graphically in the published manuscript. This indicates the
three different stages used during the FSP operation, such as the plunging stage, the dwelling stage
and the traversing stage, as illustrated in Figure 2.1.
It was established that during the plunging stage, the tool makes contacts with the substrate
(workpiece) and then penetrates it, until the shoulder of the tool interacts with the workpiece. There
would then be a sudden jump in the peak force (axial load), as a result of the resistance force
offered by the substrate. After the completion of the plunging stage, a short dwell time was noticed,
as a result of the rotation of the processing tool within the substrate because of the interaction. This
interaction of the tool within the workpiece generated heat that softens the workpiece and the
reinforcement.
23
At the traversing stage, a relatively linear motion of the workpiece along the processing tool, a
rotational motion was observed; during this traversing processing stage, a steady value of an axial
load (force) was attained. This published article has been able to address some of the objectives of
the study especially those in item I to III and V
Table 2. 1: Chemical Composition of the Base Metal Used (AA7075 – T651)
Elements Si Fe Cu Mn Cr Zn Ti Mg
Al
Wt.%
Composition
0.05 0.15 1.93 0.01 0.193 5.92 0.02 2.8 Bal
Table 2. 2: Mechanical Properties of the parent metal used (AA7075 – T651)
Properties Value
Ultimate Tensile Strength (UTS) 570 MPa
Yield Strength 500 MPa
Shear Strength 330 MPa
Shear Modulus 26 GPa
Fatigue Strength 160 MPa
Elastic Modulus (Young’s, Tensile) 70 GPa
Poisson’s Ratio 0.32
Brinell Hardness 150
Elongation at Break 8.2 %

24
Table 2. 3: Friction Stir Processing Parameters (Variable and Constant)
S/N PROCESS PARAMETER VALUE
1 Processing Speed (mm/min) – Pinless (Probeless) 100
2 Rotational Speed (rpm) – Pinless (Probeless) 1000
3 Processing Speed (mm/min) – Tool with Pin 20
4 Rotational Speed (rpm) – Tool with Pin 1200, 1500, 1800
5 Tool Tilt Angle (°) 3
6 Tool Penetration (Plunge) Depth (mm) 0.3
7 Pass (no) 2
8 Plunge Rate (mm/min) 30
9 Processing Configuration Position Controlled
TOOL DESIGN
1 Tool Material H13 Hot-working tool steel
2 Tool Shoulder Diameter (mm) 18
3 Tool Pin Diameter (mm) 5
4 Tool Pin Length (mm) 5
5 Tool Pin Profile (Shape), Outer Surface Cylindrical
6 Tool Pin Profile (Shape), End Surface tapered
GROOVE DESIGN
1 Plate Dimensions (mm3) 300 x 125 x 6
2 Groove Width (mm) 2
3 Groove Depth (mm) 3.5
4 Groove Length (mm) 280

25
Figure 2.1. FSP feedback diagram showing: (a) the Plunging; (b) the Dwelling; and (c) the Traversing Stages

Data in brief 23 (2019) 103710
Contents lists available at ScienceDirect
Data in brief
journal homepage: www.elsevier .com/locate/dib
Data Article
Experimental data on surface roughness andforce feedback analysis in friction stir processedAA7075 e T651 aluminium metal composites
Omolayo M. Ikumapayi*, Esther T. AkinlabiDepartment of Mechanical Engineering Science, University of Johannesburg, Auckland Park KingswayCampus, Johannesburg, 2006, South Africa
a r t i c l e i n f o
Article history:Received 1 January 2019Received in revised form 22 January 2019Accepted 23 January 2019Available online 8 March 2019
Keywords:Friction stir processingSurface roughness analysisReinforcementsForce feedback
* Corresponding author.E-mail address: [email protected] (O.M. Iku
https://doi.org/10.1016/j.dib.2019.1037102352-3409/© 2019 The Author(s). Published by Ecreativecommons.org/licenses/by/4.0/).
a b s t r a c t
Friction Stir Processing (FSP) is a surface modification techniqueused to enhance the mechanical properties and improve the sur-face integrity of the processed material. In the present datacollection, aluminium alloy 7075-T651 was studied under differentreinforcement conditions. Microchannel of dimension 3.5 mmdepth and 2.0 mm width were machined on the aluminium platesto accommodate the particles. The process was conducted atdifferent rotational speed of 1200 rpm, 1500 rpm and 1800 rpmwith constant processing speed of 20 mm/min, plunge depth of0.3 mm and tilt angles of 3. Double passes were achieved for eachparameter with 100% inter-pass overlap. A cylindrical tapped, AISIH13 steel tool with shoulder diameter 18 mm, pin length of5.0 mm, pin diameter 5 mm at the top and 6 mm at the end with10 taper was used during friction stir process. Surface integrityanalysis was carried out with the aid of mitutoyo surftest SJ-210surface roughness tester (SRT). The analysis was carried out atthree different points on a parameter for a particular workpieceand the average reading for each parameter is calculated in orderto ensure precision of the measurements and the coverage surfacearea. The following surface roughness parameters were measuredand recorded, arithmetical mean roughness value (Ra), maximumheight (Ry), mean roughness depth (Rz) and root mean squareroughness (Rq). Force feedback from the machine data for selected
mapayi).
lsevier Inc. This is an open access article under the CC BY license (http://

O.M. Ikumapayi, E.T. Akinlabi / Data in brief 23 (2019) 1037102
Specifications table
Subject area Mechanical EngineeringMore specific
subject areaFriction Stir Processing
Type of data Tables and GraphsHow data wasacquired
Experimental data in thmeasurement of the pracquired during procesbeing process.
Data format Raw, and AnalysedExperimentalfactors
Microchannel of dimen7075-T651 aluminiumat different rotationalspeed of 20 mm/min, aparameter with 100% into carry out the FSP exdiameter 5 mm at thethree different points o
Experimentalfeatures
FSP was carried out atThe tool tilt angle wasdirection of the plate s
Data source location Indian Institute of TechData accessibility The availability of the d
Value of the data The FSP parameters presented here is an optim
for various second phases into AA7075-T651 t Similar optimum processing parameters can b Reported process parameters will help and guid
aluminium alloy without going through rigoro The reported force feedback data will help the f
will look like when applying the parameters a Chemical compositions and the mechanical pr
reinforcement particles with respected to processing times and x-positions are also presented.© 2019 The Author(s). Published by Elsevier Inc. This is an openaccess article under the CC BY license (http://creativecommons.
org/licenses/by/4.0/).
& Material Scienceand Surface Engineering
e tables were acquired through surface roughnessocessed aluminium metal composites. The graphs weresing operation from the force feedback on the workpiece
sion 3.5 mm depth and 2.0 mm width were machined on theplates to accommodate the particles. The process was conductedspeed of 1200 rpm, 1500 rpm and 1800 rpm with constant processingnd plunge depth of 0.3 mm. Double passes were achieved for eachter-pass overlap. A cylindrical tapped, AISI H13 steel tool was usedperiments with 18 mm shoulder diameter, pin length of 5.0 mm, and pintop and 6 mm at the end. The Surface roughness analysis was carried out atn a processed parameter.room temperature along initial rolling direction of the plate.kept constant at 3 throughout the operations relative to the normalurface.nology, Kharagpur, INDIAataset is within the peripheral of this article
um parameters that give defect free zone and provide processing windowo make compositese applied to other metal matrix compositese other researchers to select suitable process parameters for AA7075-T651us trials and errors.uture researchers to know how the surface finish of their processing plates well as the reinforcements.operties of AA7075-T651 will be of valuable data for future users.
1. Data
The Data presented are from the characterization of friction stir processed of Aluminium Alloy7075-T651 with different reinforcement agro-waste powders such as coal fly ash (CFA), wood fly ash(WFA) [1], cow bone ash (CBA) [2], coconut shell ash (CSA) [3], palm kernel shell ash (PKSA) [4]; andmetallic powders such as stainless steel alloy powder (17-4Ph) and titanium alloy powder (Ti-6Al-2Sn-2Zr-2Mo-2Cr-0.25 Si). The agro-waste powders were firstly milled into nanoparticle individually andthen pour inside pure graphite crucible and heat treated in amuffle furnace set at 500 C for 1 hour andthen cooled inside the furnace to room temperature before applying it on the substrate for processing.The chemical composition of the parent metal is presented in Table 1 while the Mechanical propertiesare presented in Table 2. The process parameters used in the data collection of the frictions stir pro-cessed of Aluminium Alloy 7075-T651are in Table 3 the variable parameter is tool rotational speed andreinforcement phases; and the constant parameters are processing speed, tool tilt angle, and plunge

Table 4Experimental data of surface roughness analysis for friction stir processed base metal (AA7075-T651).
AA7075-T651
Rotationalspeed (rpm)
Processingspeed (mm/min)
Point ofmeasurement
Ra(mm)
Mean Ra(mm)
Ry (mm) Mean Ry(mm)
Rz(mm)
Mean Rz(mm)
Rq(mm)
Mean Rq(mm)
1200 20 P1 11.34 11.55 75.26 75.67 58.84 59.24 14.16 14.27P2 11.67 76.02 59.68 14.46P3 11.65 75.74 59.20 14.20
1500 20 P1 12.05 11.61 78.87 76.65 60.92 59.47 15.80 14.62P2 11.24 75.11 58.42 14.02P3 11.53 75.98 59.07 14.05
1800 20 P1 9.11 11.05 63.86 72.44 47.19 57.27 11.49 13.41P2 10.20 65.39 53.23 12.40P3 13.84 88.07 71.28 16.33
Table 3Friction stir processing parameters (variable and constant).
S/N Process parameter Value
1 Processing speed (mm/min) e pinless (probeless) 1002 Rotational speed (rpm) e pinless (probeless) 10003 Processing speed (mm/min) e tool with pin 204 Rotational speed (rpm) e tool with pin 1200, 1500, 18005 Tool tilt angle () 36 Tool penetration (plunge) depth (mm) 0.37 Pass (no) 28 Plunge rate (mm/min) 309 Processing configuration Position controlledTool design1 Tool material H13 Hot-working tool steel2 Tool shoulder diameter (mm) 183 Tool pin diameter (mm) 54 Tool pin length (mm) 55 Tool pin profile (shape), outer surface Cylindrical6 Tool pin profile (shape), end surface taperedGroove design1 Plate dimensions (mm3) 300 125 x 62 Groove width (mm) 23 Groove depth (mm) 3.54 Groove length (mm) 280
Table 2Mechanical Properties of the parent metal used (AA7475 e T651).
Properties Value
Ultimate tensile strength (UTS) 570 MPaYield strength 500 MPaShear strength 330 MPaShear modulus 26 GPaFatigue strength 160 MPaElastic modulus (young's, tensile) 70 GPaPoisson's ratio 0.32Brinell hardness 150Elongation at break 8.2%
Table 1Chemical composition of the parent metal used (AA7475 e T651).
Elements Si Fe Cu Mn Cr Zn Ti Mg Al
Wt.% composition 0.05 0.15 1.93 0.01 0.193 5.92 0.02 2.8 Bal
O.M. Ikumapayi, E.T. Akinlabi / Data in brief 23 (2019) 103710 3

Table 5Experimental data of surface roughness analysis for friction stir processed AA7075-T651/CFA matrix composites.
AA7075-T651/CFA
Rotationalspeed (rpm)
Processingspeed (mm/min)
Point ofmeasurement
Ra(mm)
Mean Ra(mm)
Ry(mm)
Mean Ry(mm)
Rz(mm)
Mean Rz(mm)
Rq(mm)
Mean Rq(mm)
1200 20 P1 5.00 5.20 39.82 37.10 27.82 26.48 6.42 6.47P2 3.97 23.93 21.04 4.51P3 6.62 47.50 30.58 8.48
1500 20 P1 6.88 7.50 48.23 52.69 30.31 37.79 8.58 8.86P2 8.40 59.71 44.99 9.12P3 7.23 50.12 38.06 8.90
1800 20 P1 4.99 5.76 43.08 45.20 28.16 35.56 6.68 9.75P2 6.75 49.89 48.06 14.45P3 5.53 42.52 30.47 8.13
Table 6Experimental data of surface roughness analysis for friction stir processed AA7075-T651/CBA matrix composites.
AA7075-T651/CBA
Rotational speed (rpm) Processingspeed(mm/min)
Point ofmeasurement
Ra(mm)
Mean Ra(mm)
Ry(mm)
Mean Ry(mm)
Rz(mm)
Mean Rz(mm)
Rq(mm)
Mean Rq(mm)
1200 20 P1 2.31 2.00 20.44 17.53 11.05 10.78 3.28 2.70P2 1.85 19.86 10.52 2.60P3 1.82 12.29 10.78 2.23
1500 20 P1 2.87 2.81 19.84 20.24 14.31 14.82 3.68 3.56P2 2.89 20.56 15.42 3.53P3 2.68 20.31 14.75 3.46
1800 20 P1 2.79 2.36 19.95 17.24 14.40 13.05 3.64 3.08P2 2.24 14.57 12.53 2.78P3 2.06 17.21 12.22 2.82
O.M. Ikumapayi, E.T. Akinlabi / Data in brief 23 (2019) 1037104
depth. Dataset for the tool design used also presented. Data from Surface roughness Tester for theprocessed samples for the prediction of surface integrity were also presented in Tables 4e14. Data fromthe force feedback on the processed samples are also presented in (Figs 7e14). Various equipment usedand their methods for data collections are also presented.
2. Experimental design, materials and methods
The parent material used in this data collection was high strength aluminium alloy (AA7075-T651)which was received in a dimension of 500 600 6 mm3, this was later sectioned into required
Table 7Experimental data of surface roughness analysis for friction stir processed AA7075-T651/WFA matrix composites.
AA7075-T651/WFA
Rotationalspeed (rpm)
Processingspeed (mm/min)
Point ofmeasurement
Ra(mm)
Mean Ra(mm)
Ry(mm)
Mean Ry(mm)
Rz(mm)
Mean Rz(mm)
Rq(mm)
Mean Rq(mm)
1200 20 P1 2.51 2.48 24.95 24.42 16.43 16.00 3.88 3.72P2 2.76 25.81 16.79 3.96P3 2.17 22.52 14.79 3.32
1500 20 P1 2.13 1.60 16.97 12.63 14.55 9.99 2.66 1.98P2 1.17 9.89 6.30 1.47P3 1.48 11.02 9.12 1.83
1800 20 P1 1.78 1.92 14.83 19.71 11.43 11.83 2.26 2.59P2 1.49 20.65 9.38 2.13P3 2.48 23.64 14.69 3.38
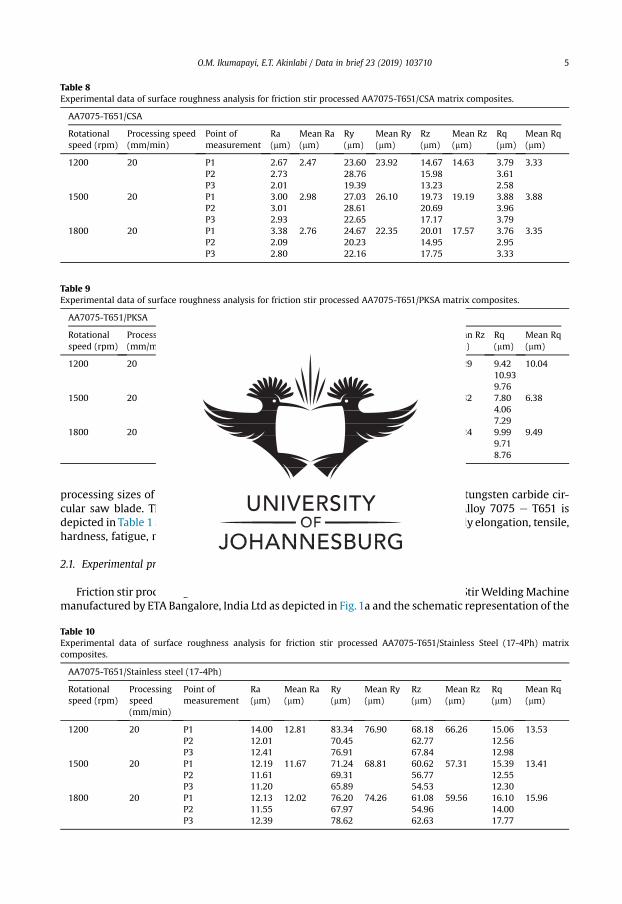
Table 8Experimental data of surface roughness analysis for friction stir processed AA7075-T651/CSA matrix composites.
AA7075-T651/CSA
Rotationalspeed (rpm)
Processing speed(mm/min)
Point ofmeasurement
Ra(mm)
Mean Ra(mm)
Ry(mm)
Mean Ry(mm)
Rz(mm)
Mean Rz(mm)
Rq(mm)
Mean Rq(mm)
1200 20 P1 2.67 2.47 23.60 23.92 14.67 14.63 3.79 3.33P2 2.73 28.76 15.98 3.61P3 2.01 19.39 13.23 2.58
1500 20 P1 3.00 2.98 27.03 26.10 19.73 19.19 3.88 3.88P2 3.01 28.61 20.69 3.96P3 2.93 22.65 17.17 3.79
1800 20 P1 3.38 2.76 24.67 22.35 20.01 17.57 3.76 3.35P2 2.09 20.23 14.95 2.95P3 2.80 22.16 17.75 3.33
Table 9Experimental data of surface roughness analysis for friction stir processed AA7075-T651/PKSA matrix composites.
AA7075-T651/PKSA
Rotationalspeed (rpm)
Processing speed(mm/min)
Point ofmeasurement
Ra(mm)
Mean Ra(mm)
Ry(mm)
Mean Ry(mm)
Rz(mm)
Mean Rz(mm)
Rq(mm)
Mean Rq(mm)
1200 20 P1 4.89 5.32 50.23 65.91 25.76 27.29 9.42 10.04P2 5.80 82.20 28.76 10.93P3 5.27 65.30 27.36 9.76
1500 20 P1 5.10 4.43 62.87 44.56 29.61 24.82 7.80 6.38P2 2.91 25.01 16.07 4.06P3 5.30 45.79 28.78 7.29
1800 20 P1 5.69 5.20 52.49 50.28 32.17 29.24 9.99 9.49P2 5.23 47.64 28.71 9.71P3 4.68 50.70 26.84 8.76
O.M. Ikumapayi, E.T. Akinlabi / Data in brief 23 (2019) 103710 5
processing sizes of 300 125 6 mm3 using Bosch professional GDC 120 with tungsten carbide cir-cular saw blade. The spectrometric analysis of the base metal e Aluminium Alloy 7075 e T651 isdepicted in Table 1 and the various mechanical properties of AA7075e T65, namely elongation, tensile,hardness, fatigue, modulus etc are reported in Table 2.
2.1. Experimental procedure and methodology for friction stir processing
Friction stir processing was conducted on a 2 Ton linear NC controlled Friction StirWeldingMachinemanufactured by ETA Bangalore, India Ltd as depicted in Fig.1a and the schematic representation of the
Table 10Experimental data of surface roughness analysis for friction stir processed AA7075-T651/Stainless Steel (17-4Ph) matrixcomposites.
AA7075-T651/Stainless steel (17-4Ph)
Rotationalspeed (rpm)
Processingspeed(mm/min)
Point ofmeasurement
Ra(mm)
Mean Ra(mm)
Ry(mm)
Mean Ry(mm)
Rz(mm)
Mean Rz(mm)
Rq(mm)
Mean Rq(mm)
1200 20 P1 14.00 12.81 83.34 76.90 68.18 66.26 15.06 13.53P2 12.01 70.45 62.77 12.56P3 12.41 76.91 67.84 12.98
1500 20 P1 12.19 11.67 71.24 68.81 60.62 57.31 15.39 13.41P2 11.61 69.31 56.77 12.55P3 11.20 65.89 54.53 12.30
1800 20 P1 12.13 12.02 76.20 74.26 61.08 59.56 16.10 15.96P2 11.55 67.97 54.96 14.00P3 12.39 78.62 62.63 17.77

Table 11Experimental data of surface roughness analysis for friction stir processed AA7075-T651/Ti-6Al-2Sn-2Zr-2Mo-2Cr-0.25 Si matrixcomposites.
AA7075-T651/Ti-6Al-2Sn-2Zr-2Mo-2Cr-0.25 Si
Rotationalspeed (rpm)
Processing speed(mm/min)
Point ofmeasurement
Ra(mm)
Mean Ra(mm)
Ry(mm)
Mean Ry(mm)
Rz(mm)
Mean Rz(mm)
Rq(mm)
Mean Rq(mm)
1200 20 P1 2.29 2.67 21.49 20.72 15.08 16.82 3.02 3.66P2 3.43 24.60 21.81 4.38P3 2.31 16.08 13.59 3.59
1500 20 P1 2.79 3.05 21.73 22.65 16.38 19.00 3.83 4.08P2 3.22 23.88 20.00 4.34P3 3.13 22.35 20.63 4.09
1800 20 P1 3.04 3.02 23.86 28.14 20.60 21.12 3.90 3.97P2 2.61 36.59 19.44 4.03P3 3.42 23.96 23.33 3.99
Table 12Experimental data of surface roughness analysis for friction stir processed AA7075-T651/WFA/Ti-6Al-2Sn-2Zr-2Mo-2Cr-0.25 Sihybrid composites.
AA7075-T651/WFA/Ti-6Al-2Sn-2Zr-2Mo-2Cr-0.25 Si
Rotationalspeed (rpm)
Processing speed(mm/min)
Point ofmeasurement
Ra(mm)
MeanRa (mm)
Ry(mm)
Mean Ry(mm)
Rz(mm)
Mean Rz(mm)
Rq(mm)
Mean Rq(mm)
1200 20 P1 9.55 9.40 95.34 95.41 55.34 54.26 14.64 13.35P2 9.74 97.28 56.59 15.20P3 8.91 93.61 50.87 13.22
1500 20 P1 9.80 9.27 95.76 95.67 55.45 54.37 14.24 14.23P2 9.79 97.91 56.76 15.12P3 8.21 93.34 50.90 13.34
1800 20 P1 9.88 9.49 95.54 95.68 55.95 54.22 14.67 14.49P2 9.39 97.65 56.18 15.14P3 9.19 93.87 50.54 13.65
Table 13Experimental data of surface roughness analysis for friction stir processed AA7075-T651/CFA/Ti-6Al-2Sn-2Zr-2Mo-2Cr-0.25 Sihybrid composites.
AA7075-T651/CFA/Ti-6Al-2Sn-2Zr-2Mo-2Cr-0.25 Si
Rotationalspeed (rpm)
Processingspeed (mm/min)
Point ofmeasurement
Ra(mm)
Mean Ra(mm)
Ry(mm)
Mean Ry(mm)
Rz(mm)
Mean Rz(mm)
Rq(mm)
Mean Rq(mm)
1200 20 P1 5.62 5.37 60.38 54.40 26.33 25.29 7.56 7.62P2 4.98 41.90 23.46 6.74P3 5.51 60.93 26.09 8.56
1500 20 P1 5.46 5.42 59.74 55.43 24.99 24.66 7.67 7.38P2 4.83 45.46 23.65 6.99P3 5.97 61.08 25.34 7.47
1800 20 P1 5.12 5.15 58.36 52.85 25.41 24.71 7.15 7.37P2 4.52 41.04 22.85 6.08P3 5.80 59.17 25.88 8.87
O.M. Ikumapayi, E.T. Akinlabi / Data in brief 23 (2019) 1037106
arrangement is shown in Fig. 1b. A load cell is integrated into the machine to record forces along Zdirection. Several integrated sensors also incorporated into the machine to record velocity along xeaxis, x e position of the tool, z e position, x e load etc. The machine is incorporated with a LabVIEWsoftware for acquiring data in real-time. The measurement data for the vertical axial load from the loadcell was then extracted and used for the processing. Aluminium Alloy 7075-T651 of 6 mm thicknesswas processed with various reinforcement. Horizontal milling machine was employed to make a

Table 14Experimental data of surface roughness analysis for friction stir processed AA7075-T651/PKSA/Ti-6Al-2Sn-2Zr-2Mo-2Cr-0.25 Sihybrid composites.
AA7075-T651/PKSA/Ti-6Al-2Sn-2Zr-2Mo-2Cr-0.25 Si
Rotationalspeed (rpm)
Processingspeed (mm/min)
Point ofmeasurement
Ra(mm)
Mean Ra(mm)
Ry(mm)
Mean Ry(mm)
Rz(mm)
Mean Rz(mm)
Rq(mm)
Mean Rq(mm)
1200 20 P1 2.38 2.50 16.84 17.52 11.95 12.09 2.87 3.17P2 2.92 19.79 12.57 3.99P3 2.21 15.93 11.76 2.67
1500 20 P1 2.34 2.62 16.33 17.39 11.87 12.09 2.98 3.21P2 2.80 19.98 12.92 3.83P3 2.73 15.87 11.49 2.84
1800 20 P1 2.26 2.27 16.56 16.97 11.14 11.56 2.82 3.00P2 2.48 19.24 12.12 3.57P3 2.06 15.11 11.43 2.61
O.M. Ikumapayi, E.T. Akinlabi / Data in brief 23 (2019) 103710 7
microchannel of 3.5 mm depth and 2.0 mmwidth into the plate as shown in Fig. 2a. The reinforcementparticle was then packed into the groove (microchannel) as depicted in Fig. 2b. Two different toolsmade of AISI H13 tool steel were used in this experiment. The Pinless tool of shoulder diameter 18 mmand length 25 mm for powder compartment as depicted in Fig. 2c; and the cylindrical tapered pin toolwith 18 mm shoulder diameter, 5 mm pin diameter and 5 mm pin height with 10 taper were used forstirring and processing as shown in Fig. 2d. The schematic representation of the experimental pro-cedure is as shown in Fig. 2. Friction stir processing (FSP) is carried out on Friction stir welding (FSW)machine by positioning the aluminium plate that is being processing in a manner showing advancingside (AS) and retreating side (RS) as indicated in Fig. 3 and also placing the pressure plates (Fig. 1b) ontop on Al-plate AA7075-T651 that is being worked on to enable rigid clamping and to ensure properstirring andmixing of thematerials and finishing by rotation and translationmovement of the tool. Thetilt of the tool towards trailing direction ensured that the shoulder of the tool held the stirred materialby a cylindrical tapper pin and moved material effectively and efficiently from the front to the back ofthe pin. The amount of the penetration of a pin depth and tool shoulder radius contacting the work-piece is decided by the pin length. Pin profile design criteria are helpful in avoiding processes with theexcessive flash, inner channel, local thinning and surface groove of the processed plates. The calcu-lations of the proportion of the groove to the second phase materials are as shown in Eqs. (1)e(3) [5].
Volume of Fraction ¼ Area of grooveProjected Area of tool pin
100 (1)
Fig. 1. a: FSW machine showing force feedback on the Screen; b: Representation of the set eup Machine.

Fig. 2. (a): Groove (b) Reinforcement (c) Compartment with pinless (d) Processed with tool with pin.
O.M. Ikumapayi, E.T. Akinlabi / Data in brief 23 (2019) 1037108
Area of the groove ¼ Groove width Goove depth (2)
Projected Area ofthe tool pin ¼ Pin diameter Pin length (3)
2.2. Processing parameters
In the experiment, two different processing parameters were used. They are variable process pa-rameters and constant process parameters. The variable process parameters used was rotational speed
Fig. 3. Schematic of FSP showing Advancing and Retreating Side.

O.M. Ikumapayi, E.T. Akinlabi / Data in brief 23 (2019) 103710 9
of 1200, 1500 and 1800 rpm with constant processing parameter of 20 mm/min processing speed, tiltangle of 3, double passes were observed in all the processes, 0.3 mm plunge depth was achievedwhich was distributed thus, 0.2 mm first pass and 0.1 mm second pass. Good surface finish was ach-ieved due to carefully selected processing parameters. The processing parameters used workpieceexperimental is as showed in Table 3.
2.3. Surface roughness analysis
Surface roughness analysis is a key factor to evaluate process integrity and the quality of anyprocessed material will be determined by surface topography, hardness test [6], wear [7], micro-structural analysis etc. In this present data collection, surface roughness analysis has been the keyfactor of the investigation. Surface integrity analysis was carried out with the aid of mitutoyo surftestSJ-210 surface roughness tester (SRT). The analysis was carried out at three different points on aparameter for a particular workpiece and the average reading for each parameter is calculated in orderto ensure precision of the measurements and the coverage surface area. The following surfaceroughness parameters were measured and recorded; arithmetical mean roughness value (Ra),maximum height (Ry), mean roughness depth (Rz) and root mean square roughness (Rq). Theexperimental data recorded are presented in Tables (4e14). This research therefore aimed at investi-gating the surface roughness obtained in friction stir processed composites and correlate it with forcefeed. The macrographs indicating the points of measurements on the SRT are display in Fig. 4 andsamples of the measured plates are display in Fig. 5.
2.4. Material removal rate
The material removal rate (MRR) in friction stir processing operation is said to be the volume atwhich material or metal that is being worked on is removed during processing operation per unit timein mm3/s. This may be in form of flash or material loss in the case of reinforcements. Material is beingremoved or loss for each revolution of the tool. Surface roughness is determined by material removalrate. If lots of flash is observed during FSP, is thenmean that the surface of the workpiece may be roughbut if less or no flash is observed during processing operation, there is a tendency of having goodsurface finish which must be controlled by processing parameters. The material removal rate in mm3/scan be calculated as depicted in Eq. (4) [8]:
MRR ¼p4D
20L p
4D2i L
LFRs
(4)
Fig. 4. Display of surface roughness test.
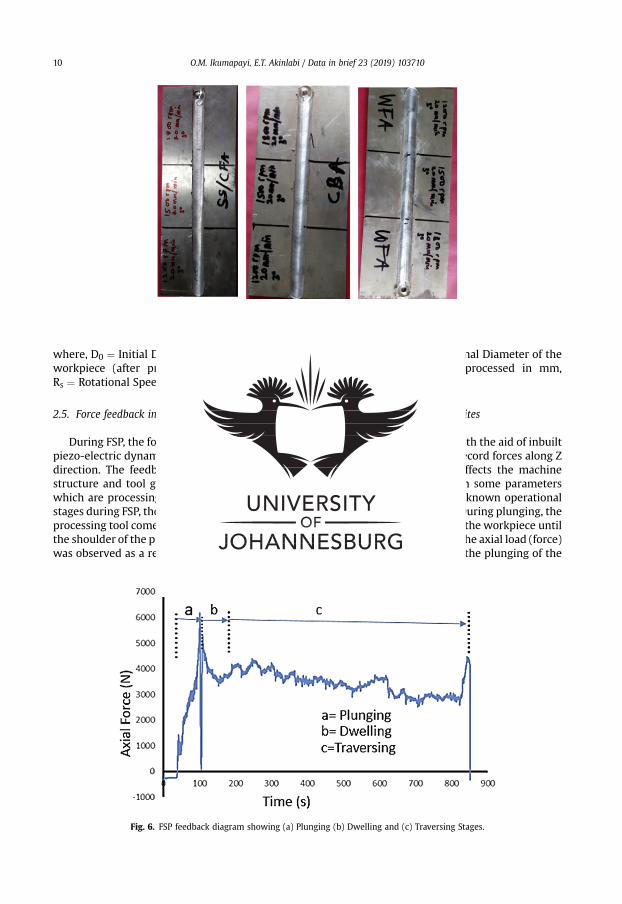
Fig. 5. Macrographs of some processed plates.
O.M. Ikumapayi, E.T. Akinlabi / Data in brief 23 (2019) 10371010
where, D0 ¼ Initial Diameter of the workpiece (before processing) in mm, Di ¼ Final Diameter of theworkpiece (after processing) in mm, L ¼ Length of the workpiece to be processed in mm,Rs ¼ Rotational Speed in rpm and F ¼ feed rate in mm/rev.
2.5. Force feedback in friction stir processing of AA7075-T651 aluminium metal composites
During FSP, the force (axial load) was measured by the FSWmachine (Fig. 1a) with the aid of inbuiltpiezo-electric dynamometer device. A load cell is integrated into the machine to record forces along Zdirection. The feedback data from axial load (force) is very essential as this affects the machinestructure and tool geometry during processing. The processing force depends on some parameterswhich are processing speed as well as rotational speed [9]. There are three well known operationalstages during FSP, they are, plunging, dwelling and traversing as depicted in Fig. 6. During plunging, theprocessing tool comes in contact with the workpiece and makes a penetration into the workpiece untilthe shoulder of the processing tool interacts with theworkpiece, a sudden jump in the axial load (force)was observed as a result of the resistance force offered by the workpiece. During the plunging of the
Fig. 6. FSP feedback diagram showing (a) Plunging (b) Dwelling and (c) Traversing Stages.

Fig. 7. Force Feedback Variation (a) Plot of force vs time for the processed based material AA7075-T651 without reinforcement (b)Plot of force vs x-position for the processed based material AA7075-T651 without reinforcement.
O.M. Ikumapayi, E.T. Akinlabi / Data in brief 23 (2019) 103710 11
shoulder into the workpiece, a peak load (force) is noticed and when the plunging was completed, ashort dwell time (rotation of the tool at a position) was observed on the workpiece by interacting withthe tool which heated up the material by friction between the shoulder of the tool and the workpiece.This heat generated led to the softening of the workpiece and the force (axial load) decreases to nearly40% of the peak load. During traversing stage, a relative linear motion on the workpiece along theprocessing tool rotational motionwas observed, during this traversing processing stage, a steady valueof an axial load (force) was attained during further processing. Force feedback from the machine data
Fig. 8. Force Feedback Variation (a) Plot of force vs time for matrix composite of stainless steel (17-4Ph)/titanium alloy (Ti-6Al-2Sn-2Zr-2Mo-2Cr-0.25 Si) reinforced processed AA7075-T651 (b) Plot of force vs x-position for matrix composite of stainless steel (17-4Ph)/titanium alloy (Ti-6Al-2Sn-2Zr-2Mo-2Cr-0.25 Si) reinforced processed AA7075-T651.
Fig. 9. Force Feedback Variation (a) Plot of force vs time for matrix composite of stainless steel (17-4Ph)/WFA reinforced processedAA7075-T651 (b) Plot of force vs x-position for matrix composite of stainless steel (17-4Ph)/WFA reinforced processed AA7075-T651.

Fig. 10. Force Feedback Variation (a) Plot of force vs time for matrix composite of titanium alloy (Ti-6Al-2Sn-2Zr-2Mo-2Cr-0.25 Si)/CSA reinforced processed AA7075-T651 (b) Plot of force vs x-position for matrix composite of titanium alloy (Ti-6Al-2Sn-2Zr-2Mo-2Cr-0.25 Si)/CSA reinforced processed AA7075-T651.
Fig. 11. Force Feedback Variation (a) Plot of force vs time for cow bone ash (CBA) reinforced processed AA7075-T651 (b) Plot of forcevs x-position for cow bone ash (CBA) reinforced processed AA7075-T651.
O.M. Ikumapayi, E.T. Akinlabi / Data in brief 23 (2019) 10371012
during the friction stir processing of this work has showcased five reinforcement variations of axialforces as presented in Figs. 7e14.
Surface roughness analysis is of key to manufacturing/production industries that deal with surfacefinish of the final product [10] especially in processing field in order to ascertain the surface integrity ofthe product for marketability, achieving high quality in terms of workpiece dimensional accuracy,ensuring less flash for economy of the processing in terms of cost saving, give simple mean of finisherfor the product and increasing the performance of the product. The ability to control the process forbetter quality of the final product is of paramount importance. In FSP the surface roughness is usually
Fig. 12. Force Feedback Variation (a) Plot of force vs time for matrix composite of stainless steel (17-4Ph)/CSA reinforced processedAA7075-T651 (b) Plot of force vs x-position for matrix composite of stainless steel (17-4Ph)/CSA reinforced processed AA7075-T651.

Fig. 13. Force Feedback Variation (a) Plot of force vs time for coal fly ash (CFA) reinforced processed AA7075-T651 (b) Plot of force vsx-position for coal fly ash (CFA) reinforced processed AA7075-T651.
Fig. 14. Force Feedback Variation (a) Plot of force vs time for palm kernel shell ash (PKSA) reinforced processed AA7075-T651 (b) Plotof force vs x-position for palm kernel shell ash (PKSA) reinforced processed AA7075-T651.
O.M. Ikumapayi, E.T. Akinlabi / Data in brief 23 (2019) 103710 13
depend on certain variables such the processing speed, feed rate, rotational speed, axial force feed,radial and axial depth.
It is pertinent to note, that rough surfaces usually have higher friction coefficients and wear morequickly than smooth surfaces. Figs. 7e11 indicate that the surface of the processed workpieces aresmooth as shown on the graphs. The results from the graphs will help the users to know the behaviourof the selected aluminium alloy AA7075-T651 when interacted with different reinforcement particlesas shown on the graphs.
Acknowledgements
Appreciation goes to the Indian Institute of Technology (IIT) Kharagpur especially Mechanical En-gineering Department for the permission to work on both Friction Stir Welding Machine and SurfaceRoughness Tester for obtaining the data used for this analysis and also the University of Johannesburg,South Africa for her financial support for the Research Trip to India.
Transparency document
Transparency document associated with this article can be found in the online version at https://doi.org/10.1016/j.dib.2019.103710.
References
[1] O.M. Ikumapayi, E.T. Akinlabi, Characterizations of the Evolving Properties during the Milling Time of Wood Fly AshNanoparticles ( WFA-NPs ), Proceedings of the International Conference on Industrial Engineering and Operations Man-agement Pretoria/Johannesburg, South Africa, October 29 e November 1, 2018, pp. 2040e2049.

O.M. Ikumapayi, E.T. Akinlabi / Data in brief 23 (2019) 10371014
[2] O.M. Ikumapayi, E.t. Akinlabi, A Study into the Effects of the Milling Time on the Physiochemical and MorphologicalCharacteristics of Cow Bone Powder ( CBP ), Proceedings of the International Conference on Industrial Engineering andOperations Management Pretoria/Johannesburg, South Africa, October 29 e November 1, 2018, pp. 2050e2058.
[3] O.M. Ikumapayi, E.T. Akinlabi, Data showing the effects of vibratory disc milling time on the microstructural characteristicsof coconut shell nanoparticles ( CS-NPs ), Data Br. 22 (2019) 537e545.
[4] O.M. Ikumapayi, E.T. Akinlabi, Composition , characteristics and socioeconomic benefits of palm kernel shell exploitation-an overview, J. Environ. Sci. Technol. 11 (6) (2018) 1e13.
[5] S. Joyson, A. Isaac, D. Jebaraj, D. Raja, S. Esther, T. Akinlabi, Microstructural characterization and tensile behavior of rutile (TiO2 ) - microstructural characterization and tensile behavior of rutile ( TiO 2 ) - reinforced AA6063 aluminum matrixcomposites prepared by friction stir processing, Acta Metall. Sin. (2018) 1e12.
[6] O.M. Ikumapayi, I.P. Okokpujie, S.A. Afolalu, O.O. Ajayi, E.T. Akilabi, O.P. Bodunde, Effects of quenchants on impact strengthof single-vee butt welded joint of mild steel, IOP Conf. Ser. Mater. Sci. Eng. 391 (2018) 012007.
[7] S.A. Afolalu, A.A. Abioye, M.O. Udo, O.R. Adetunji, O.M. Ikumapayi, S.B. Adejuyigbe, Data showing the effects of temper-ature and time variances on nano-additives treatment of mild steel during machining, Data Br. 19 (2018) 456e461.
[8] M. Gupta, S. Kumar, Investigation of surface roughness and MRR for turning of UD-GFRP using PCA and Taguchi method,Eng. Sci. Technol. an Int. J. 18 (1) (2015) 70e81.
[9] O.M. Ikumapayi, E.T. Akinlabi, J.D. Majumdar, Review on thermal , thermo- mechanical and thermal stress distributionduring friction stir welding, Int. J. Mech. Eng. Technol. 9 (8) (2018) 534e548.
[10] I.P. Okokpujie, et al., Modeling and optimization of surface roughness in end milling of aluminium using least squareapproximation method and response surface methodology, Int. J. Mech. Eng. Technol. 9 (1) (2018) 587e600.

26
2.3 ARTICLE II
The Efficacy of α-ꞵ grade Titanium-alloy powder (Ti-6Al-2Sn-2Zr-2Mo-2Cr-
0.25Si) in surface modification and corrosion mitigation in 3.5 % NaCl on
friction stir processed armour grade 7075-T651 Aluminum alloys – Insight
in Defence Applications
Published in Material Research Express, 2019, Vol 6, Number 7, pages 1 - 16
DOI: https://doi.org/10.1088/2053-1591/ab1566
ISSN Print: 2053-1591 and ISSN Online: 2053-1591
The effects of α-β grade Titanium alloy (Ti–6Al–2Sn–2Zr–2Mo–2Cr–0.25Si) powder were
investigated on the friction stir processed high strength, armour grade aluminium alloy AA7075-
T651. In this investigation, the efficacy of the α-β grade Titanium alloy powder was carried out on
the corrosion behaviours, the tensile properties, the surface roughness and the surface
modification. The α-β grade Titanium alloy powder used was procured from TLS Technik GmbH
&Co, having average sizes of 45-90 µm.
This range of particle sizes was compacted into the micro-channel created to accommodate the
reinforcements. The chemical composition of the as-received α-β grade Titanium alloy powder is
depicted in Table 2.4. The processing parameters used during this experimental study were 1500
rpm, 20 mm/min, 3 degrees, and 0.3 mm for the rotational speed, travel speed, tilt angle and plunge
depth, respectively. The corrosion study was carried out by using the potentiodynamic polarization
technique at 25 degrees ambient temperatures, with a corrosive medium of 3.5% NaCl solution.
27
The tensile properties were investigated by using X-force P-type of the Zwick/Roell Z250 tensile
testing machine; while the surface roughness analysis was carried out, by using the Mitutoyo surf
test SJ-210 surface-roughness tester. It is essential to mention here that apart from the fabricated
titanium alloy reinforced aluminium-matrix composites (AMC), the unreinforced friction stir
processed base metal (PBM- AA7075-T651) and the unprocessed base metal (UBM– AA7075-
T651) were also investigated; but they served merely as control experiments.
It was established that the addition of α-β grade Titanium alloy powder to aluminium alloy 7075-
T651 greatly affected the surface roughness, by reducing the roughness surface value from
11.61µm to 3.05 µm. The reinforcement also had a great influence on the corrosion protection by
98.26 % percentage inhibition protection (%IPE), as against the processed base metal (PBM) –
AA7075-T651 with 63.99 % IPE.
It was also revealed that the corrosion rate was 0.0876 mm/year, with the addition of titanium alloy
powder on the substrate; while it was 1.829 mm/year, when it was just processed, without any
reinforcement; and it was 5.0718 mm/year, when it was not processed at all (base metal). It was
noticed that the fabricated AA7075-T651/ Ti–6Al–2Sn–2Zr–2Mo–2Cr–0.25Si matrix composite
had an ultimate tensile strength value of 624.2 MPa; while the fracture force was 25 .4 kN; while
that of PBM was 620.9 MPa UTS and 22.35 kN breaking force; whereas the UBM was 170.6 MPa
UTS and 6.14 kN breaking force, rendering it the lowest value among them. This published article
has been able to address some of the objectives of the study especially those in item II, IV to V.
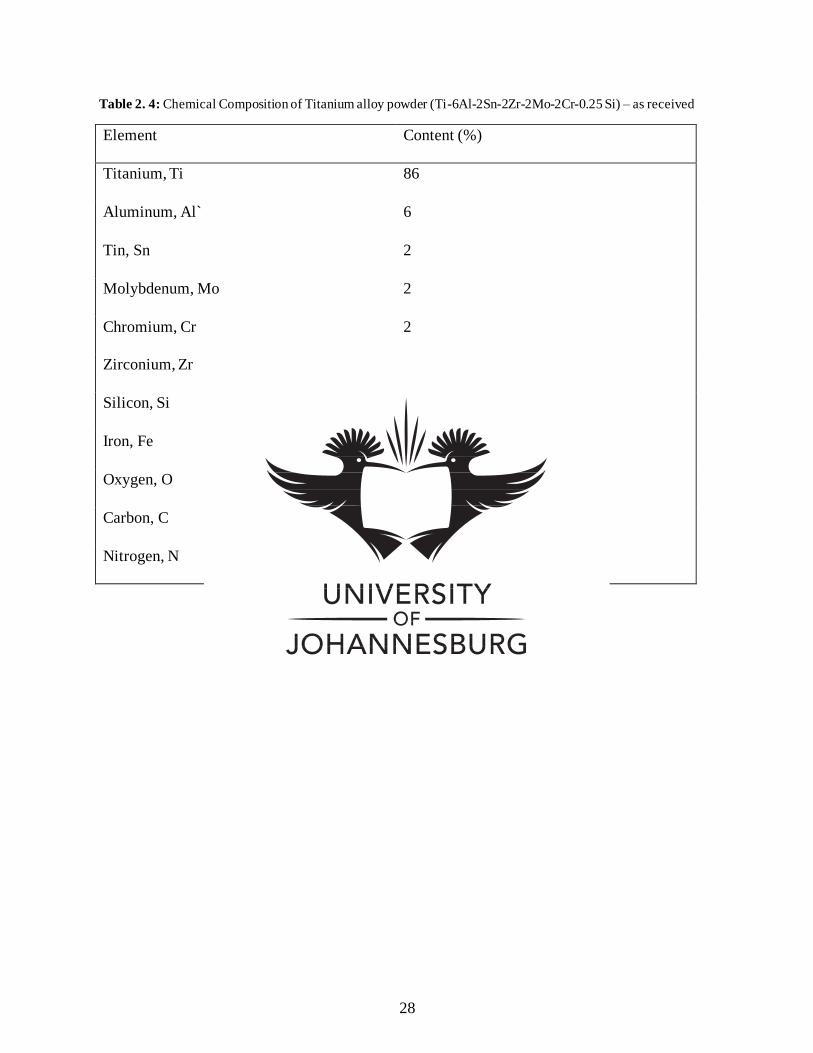
28
Table 2. 4: Chemical Composition of Titanium alloy powder (Ti-6Al-2Sn-2Zr-2Mo-2Cr-0.25 Si) – as received
Element Content (%)
Titanium, Ti 86
Aluminum, Al` 6
Tin, Sn 2
Molybdenum, Mo 2
Chromium, Cr 2
Zirconium, Zr 2
Silicon, Si 0.25
Iron, Fe ≤ 0.25
Oxygen, O ≤ 0.14
Carbon, C ≤ 0.040
Nitrogen, N ≤ 0.030

Materials Research Express
PAPER
Efficacy of α-β grade titanium alloy powder(Ti–6Al–2Sn–2Zr–2Mo–2Cr–0.25Si) in surface modification and corrosionmitigation in 3.5% NaCl on friction stir processed armour grade 7075-T651 aluminum alloys—insight in defence applicationsTo cite this article: Omolayo M Ikumapayi and Esther T Akinlabi 2019 Mater. Res. Express 6 076546
View the article online for updates and enhancements.
This content was downloaded from IP address 152.106.6.250 on 12/04/2019 at 14:32

Mater. Res. Express 6 (2019) 076546 https://doi.org/10.1088/2053-1591/ab1566
PAPER
Efficacy ofα-β grade titanium alloy powder (Ti–6Al–2Sn–2Zr–2Mo–2Cr–0.25Si) in surfacemodification and corrosionmitigation in3.5%NaCl on friction stir processed armour grade 7075-T651aluminum alloys—insight in defence applications
OmolayoM Ikumapayi1,3 and Esther TAkinlabi2
1 Department ofMechanical Engineering Science, University of Johannesburg, Auckland ParkKingswayCampus, Johannesburg, 2006,SouthAfrica
2 Department ofMechanical Engineering, CovenantUniversity, Ota,Nigeria3 Author towhomany correspondence should be addressed.
E-mail: [email protected] and [email protected]
Keywords: aluminium alloy, compositematerials, corrosion inhibition, titanium alloy powder, tensile strength, friction stir processing
AbstractAluminium alloyAA7075-T651 is one of the newest and promising commercials rolled sheetmetal forstructural applications in defensive areas likemilitary, space and air vehicle, aerospace because of itsexcellent and unbeatable combination of high strength-to-weight ratio and good corrosion resistance,high fatigue strength. In this study friction stir processing (FSP)was performed onAA7075-T651aluminiummetal composite (AMC) reinforcedwithα-β grade Titanium alloy powder (Ti–6Al–2Sn–2Zr–2Mo–2Cr–0.25Si)which is an excellent reinforcementmaterial in airframe and jet engineapplications for corrosion resistance and exceptional strength-to-weight ratio. The processingparameters usedwere the rotational speed of 1500 rpm, processing speed of 20mmmin−1, and tiltangle of 3°. Two passes were carried out on the FSP parameters with 100% inter-pass overlap i.e.plunge depth of 0.3mmwas usedwhichwas distributed thus, 0.2 mmplunge depth onfirst pass and0.1mmplunge depth second pass.Mechanical characterizationwas carried out to study the influenceofα-β grade Titanium alloy powder (Ti–6Al–2Sn–2Zr–2Mo–2Cr–0.25Si), in this tensile strengthwasstudied using Xforce P type of Zwick/Roell Z250 tensile testingmachine and surface roughnessanalysis was conducted onMitutoyo surf test SJ-210 surface roughness tester. Corrosion behaviour ofthe processed AMCwas studied using potentiodynamic polarization technique in 3.5%NaCl solutionat an ambient temperature of 25°. It was established thatα-β grade Titanium alloy powder asreinforcement inhibitor produced the highest percentage of inhibition performance efficiency (IPE)of 98.26%while the processed basemetal (PBM) gave IPE of 63.99%with reference to the unprocessedbasemetal (UBM). Therewas an extraordinary improvement in corrosion rate with a reduction from5.0718mm/year to 0.087 675mm/year whenα-β grade Titaniumalloy powderwas used as inhibitor.AA7075-T651/Ti–6Al–2Sn–2Zr–2Mo–2Cr–0.25Si AMChas highest ultimate tensile strength (UTS)of 624MPawhich has a close value of 620.903MPa to that of AA7075-T651without reinforcementbut theUTS forUBMwas far away from them.
Introduction
Aluminummetalmatrix composites (AMMC) arewidely used today as part of the components for defensiveequipment inmilitary,fighter aircraft, jet engine, aviation, space and air vehicle applications because of itsexceptional and unbeatablemechanical, chemical and structural behaviours such as low density, high specificstrength, superior damping capacities, high fatigue strength, highwear and creep resistance as well as highformability. The properties andmanymore led to the universal acceptance of 7075-T651Aluminumalloys
RECEIVED
21 February 2019
REVISED
15March 2019
ACCEPTED FOR PUBLICATION
2April 2019
PUBLISHED
12April 2019
© 2019 IOPPublishing Ltd
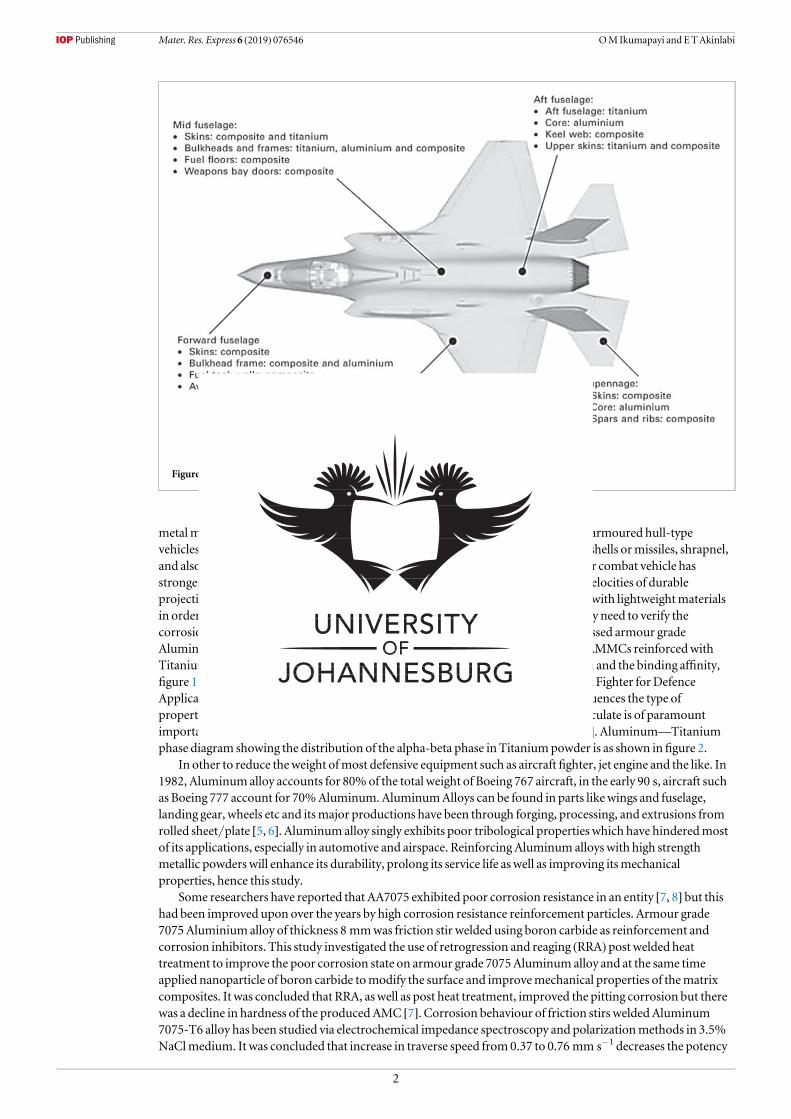
metalmatrix composites to be used in the blast and ballistic protections especially in armoured hull-typevehicles such as aircrafts, ships and tanks in order towithstand the impact of bullets, shells ormissiles, shrapnel,and also protecting personnel inside from enemyfire. It is worthy of note that armour combat vehicle hasstronger and tougher structuralmaterials properties in the past, this is to resist high velocities of durableprojectiles. Nowadays, researchers have progressively developed armour equipment with lightweightmaterialsin order to improve fuel economy as against heavier armour and as such, there is every need to verify thecorrosion protection rate of this Aluminumgradewithout processing and also processed armour gradeAluminum7075 alloys with andwithout reinforcement particles. The properties of AMMCs reinforcedwithTitanium alloy powders dependwholly on the type, content, size, special distribution and the binding affinity,figure 1 shows the applications of composites of Titanium andAluminum alloy in Jet Fighter forDefenceApplication. It is worthmentioning that the production of AMMCs significantly influences the type ofproperties that will be achieved at the end. Therefore, the type of reinforcement particulate is of paramountimportance in achieving better and excellent AMMCs and corrosionmitigation [1, 2]. Aluminum—Titaniumphase diagram showing the distribution of the alpha-beta phase in Titaniumpowder is as shown infigure 2.
In other to reduce theweight ofmost defensive equipment such as aircraft fighter, jet engine and the like. In1982, Aluminumalloy accounts for 80%of the total weight of Boeing 767 aircraft, in the early 90 s, aircraft suchas Boeing 777 account for 70%Aluminum. AluminumAlloys can be found in parts likewings and fuselage,landing gear, wheels etc and itsmajor productions have been through forging, processing, and extrusions fromrolled sheet/plate [5, 6]. Aluminum alloy singly exhibits poor tribological properties which have hinderedmostof its applications, especially in automotive and airspace. Reinforcing Aluminum alloys with high strengthmetallic powders will enhance its durability, prolong its service life as well as improving itsmechanicalproperties, hence this study.
Some researchers have reported that AA7075 exhibited poor corrosion resistance in an entity [7, 8] but thishad been improved upon over the years by high corrosion resistance reinforcement particles. Armour grade7075Aluminium alloy of thickness 8 mmwas friction stir welded using boron carbide as reinforcement andcorrosion inhibitors. This study investigated the use of retrogression and reaging (RRA) post welded heattreatment to improve the poor corrosion state on armour grade 7075Aluminum alloy and at the same timeapplied nanoparticle of boron carbide tomodify the surface and improvemechanical properties of thematrixcomposites. It was concluded that RRA, aswell as post heat treatment, improved the pitting corrosion but therewas a decline in hardness of the produced AMC [7]. Corrosion behaviour of friction stirs weldedAluminum7075-T6 alloy has been studied via electrochemical impedance spectroscopy and polarizationmethods in 3.5%NaClmedium. It was concluded that increase in traverse speed from0.37 to 0.76 mm s−1 decreases the potency
Figure 1.Application of composites in thefighter Jet - F-35 Lightning II [3].
2
Mater. Res. Express 6 (2019) 076546 OMIkumapayi and ETAkinlabi
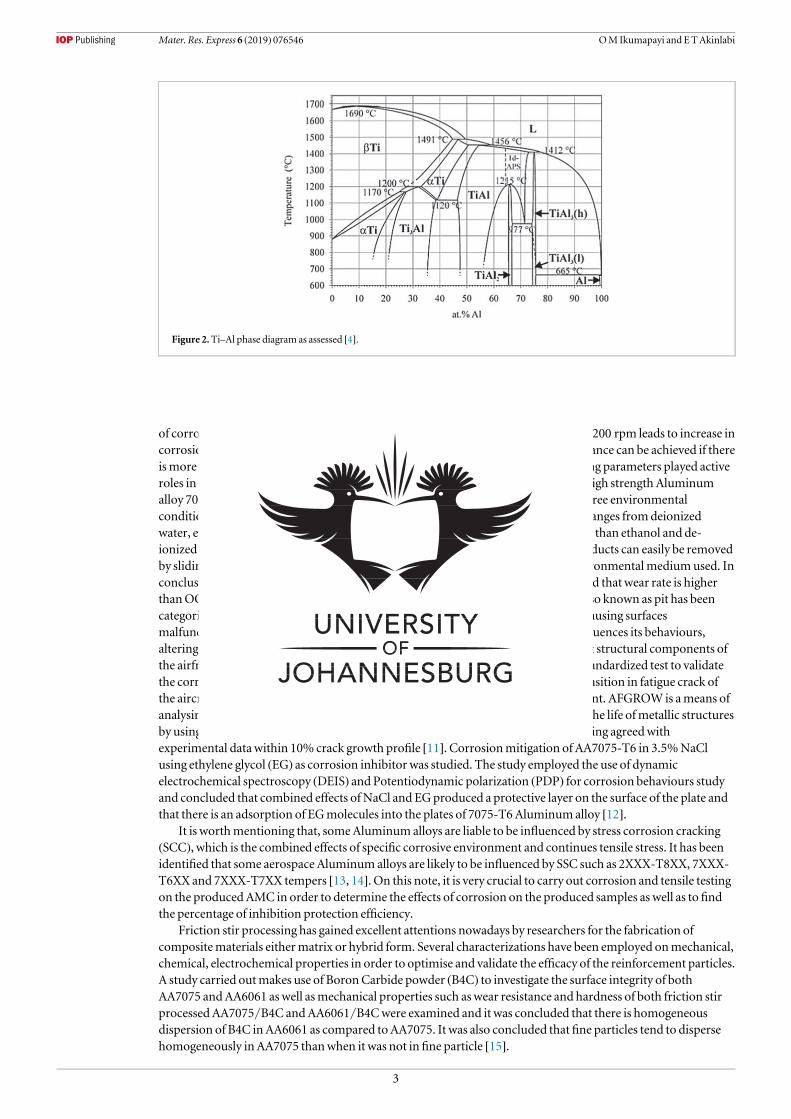
of corrosionmitigation inAA7075 but increase in rotation speed from1000 rpm to 1200 rpm leads to increase incorrosion protection efficiency. It was further concluded that higher corrosion resistance can be achieved if thereismore dissolution and breaking downof inter-metallic particles and those processing parameters played activeroles in corrosion resistance ability [9]. Combined effects of corrosion andwears of high strengthAluminumalloy 7075-T6were studied. Two series of wear experiments were conductedwhile three environmentalconditionswere used for corrosion inhibition protection efficiency via potentiostat ranges fromdeionizedwater, ethanol, and seawater. It was concluded that thewear rate in seawater is higher than ethanol and de-ionizedwater because seawater has higher corrosion rate andmore so, corrosion products can easily be removedby slidingmovement; and that seawater is themost corrosive amongst the three environmentalmediumused. Inconclusion, a higher corrosion rate leads to higher wear rate and it was also established thatwear rate is higherthanOCPwhen the anodic potential was applied [10]. Corrosion damagewhich is also known as pit has beencategorised as stress raiser that can have hazardous effects on the fatigue life such as causing surfacesmalfunction, causes embrittlement condition in the surfacematerial and thereby influences its behaviours,altering the durability phase of life as well as damage tolerance assessment of themost structural components ofthe airframe. Corrosion pit fatigue stress was investigated inAA7075-T651 using a standardized test to validatethe corrosion pit. AFGROW (Air ForceGrowth)modellingwas used to study the transition in fatigue crack ofthe aircraft structure and to evaluate the integrity and the decision offleetmanagement. AFGROWis ameans ofanalysing crack initiation, fatigue crack growth as well as fracture in order to predict the life ofmetallic structuresby usingDTA (Damage Tolerance Analysis) framework. It was predicted thatmodelling agreedwithexperimental data within 10% crack growth profile [11]. Corrosionmitigation of AA7075-T6 in 3.5%NaClusing ethylene glycol (EG) as corrosion inhibitor was studied. The study employed the use of dynamicelectrochemical spectroscopy (DEIS) and Potentiodynamic polarization (PDP) for corrosion behaviours studyand concluded that combined effects ofNaCl and EGproduced a protective layer on the surface of the plate andthat there is an adsorption of EGmolecules into the plates of 7075-T6Aluminumalloy [12].
It is worthmentioning that, someAluminumalloys are liable to be influenced by stress corrosion cracking(SCC), which is the combined effects of specific corrosive environment and continues tensile stress. It has beenidentified that some aerospace Aluminum alloys are likely to be influenced by SSC such as 2XXX-T8XX, 7XXX-T6XX and 7XXX-T7XX tempers [13, 14]. On this note, it is very crucial to carry out corrosion and tensile testingon the producedAMC in order to determine the effects of corrosion on the produced samples as well as tofindthe percentage of inhibition protection efficiency.
Friction stir processing has gained excellent attentions nowadays by researchers for the fabrication ofcompositematerials eithermatrix or hybrid form. Several characterizations have been employed onmechanical,chemical, electrochemical properties in order to optimise and validate the efficacy of the reinforcement particles.A study carried outmakes use of BoronCarbide powder (B4C) to investigate the surface integrity of bothAA7075 andAA6061 as well asmechanical properties such aswear resistance and hardness of both friction stirprocessed AA7075/B4C andAA6061/B4Cwere examined and it was concluded that there is homogeneousdispersion of B4C inAA6061 as compared toAA7075. It was also concluded that fine particles tend to dispersehomogeneously in AA7075 thanwhen it was not infine particle [15].
Figure 2.Ti–Al phase diagram as assessed [4].
3
Mater. Res. Express 6 (2019) 076546 OMIkumapayi and ETAkinlabi
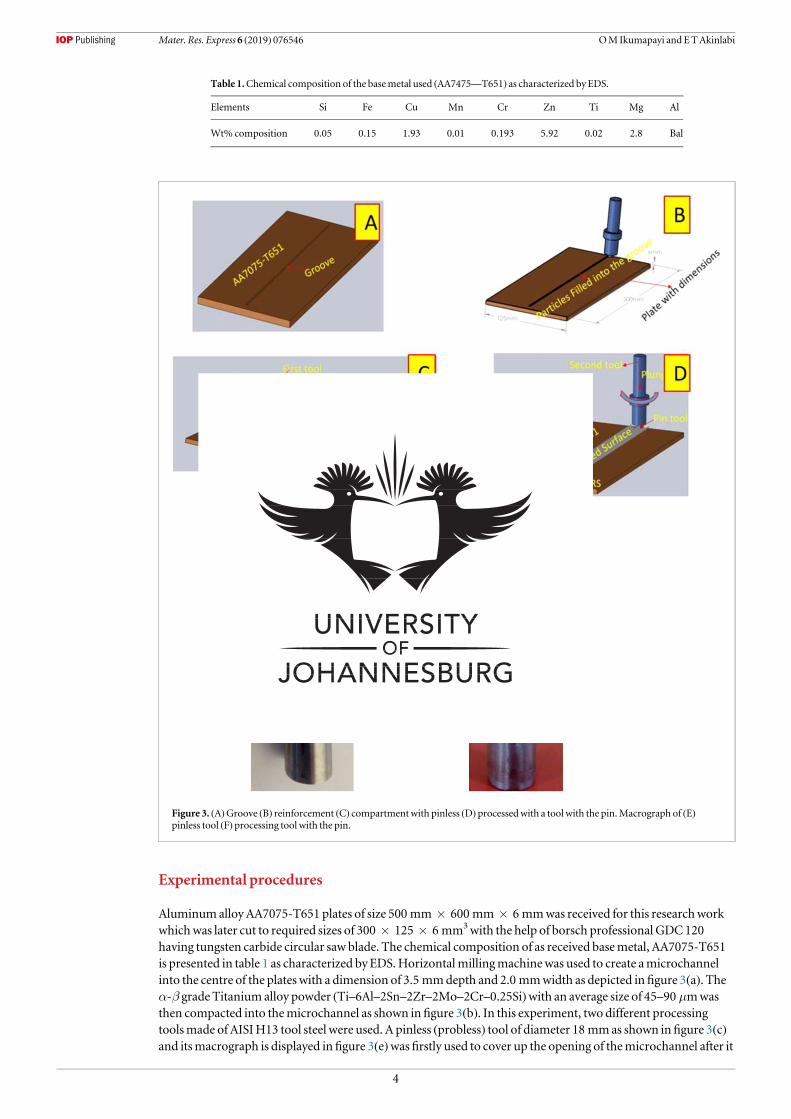
Experimental procedures
Aluminumalloy AA7075-T651 plates of size 500 mm×600 mm×6 mmwas received for this researchworkwhichwas later cut to required sizes of 300×125×6 mm3with the help of borsch professional GDC120having tungsten carbide circular saw blade. The chemical composition of as received basemetal, AA7075-T651is presented in table 1 as characterized by EDS.Horizontalmillingmachinewas used to create amicrochannelinto the centre of the plates with a dimension of 3.5 mmdepth and 2.0 mmwidth as depicted infigure 3(a). Theα-β grade Titanium alloy powder (Ti–6Al–2Sn–2Zr–2Mo–2Cr–0.25Si)with an average size of 45–90 μmwasthen compacted into themicrochannel as shown infigure 3(b). In this experiment, two different processingtoolsmade of AISIH13 tool steel were used. A pinless (probless) tool of diameter 18 mmas shown infigure 3(c)and itsmacrograph is displayed infigure 3(e)wasfirstly used to cover up the opening of themicrochannel after it
Table 1.Chemical composition of the basemetal used (AA7475—T651) as characterized by EDS.
Elements Si Fe Cu Mn Cr Zn Ti Mg Al
Wt%composition 0.05 0.15 1.93 0.01 0.193 5.92 0.02 2.8 Bal
Figure 3. (A)Groove (B) reinforcement (C) compartmentwith pinless (D) processedwith a tool with the pin.Macrograph of (E)pinless tool (F) processing tool with the pin.
4
Mater. Res. Express 6 (2019) 076546 OMIkumapayi and ETAkinlabi

has been filled upwithα-β grade Titanium alloy powder (Ti–6Al–2Sn–2Zr–2Mo–2Cr–0.25Si) as demonstratedinfigure 3(d). A processing tool with a cylindrical tapered pin profile was used for this present research. The tooldesign configurationswere 18 mm shoulder diameter, 5 mmpin diameter, and 5 mmpin length is shown infigure 3(f) andwere used for stirring and processing of the AA7075-T651/Ti–6Al–2Sn–2Zr–2Mo–2Cr–0.25Si AMC.
Friction stir processing proceduresTwo (2) ton linear numerical control (NC) friction stir welding (FSW)machinewhichwasmanufactured byETABanglore, India Ltdwas used to carry out friction stir processing (FSP) used in this research as shown infigure 4(a). The 3Dmodel of the operational procedure is represented infigure 4(b). A load cell is integrated intothemachine to record forces along the Z direction. Some integrated sensors were incorporated into the FSWmachine in order to record somemachine parameters such as velocity along the x-axis, x—load, z- position aswell as x—position of the tool. Themeasured and recorded data for the vertical axial load from the load cell werethen extracted from themachine and used for the processing. Aluminumplate that is beingworked onmust beplaced in such away that will be showing advancing side (AS) and retreating side (RS) as shown infigure 4(b) andalso place a pressure plates on top of the substratematerial—AA7075-T651 that was packedwith reinforcementparticles in order to ensure rigid clamping and also enable proper stirring andmixing of the reinforcementparticles with the substratematerial and finishing by rotation and translationmovement of the tool. The tilt ofthe tool towards trailing direction ensured that the shoulder of the tool held the stirredmaterial by a cylindricaltaper pin andmovedmaterial effectively and efficiently from the front to the back of the pin. The effective andefficient stirring andmixing of the substrate with the particles are determined by the amount of penetration ofthe pin length and tool shoulder radius in contact with theworkpiece. Proper and effective pin profile design isessential in avoiding processes with the excessive flash, local thinning, inner channel, and surface groove of theprocessed plates whichmay cause surface defects. The equations (1) to (3) represent the calculations of theproportion of the groove to the second phasematerials [16]
Volume of FractionArea of groove
Projected Area of tool pin100 1= ´ ( )
Area of the groove Groove width Goove depth 2= ´ ( )
Projected Area of the tool pin Pin diameter Pin length 3= ´ ( )
Processing parametersIn the study, there two different processing parameters used. The first one is variable processing parameters andthe second one is constant processing parameters. The variable parameter used in this studywas rotational speedof 1500 rpmand 1800 rpmwhile the constant parameters used are processing speed of 20 mmmin−1, tilt angleof 3°, two passes were applied in the same directionwith 100% inter-pass overlap in order to achieve betterdistribution ofα-β grade Titanium alloy powder (Ti–6Al–2Sn–2Zr–2Mo–2Cr–0.25Si) and the distribution ofthe passes are, 0.2 mmdepthwasfirst pass and 0.1 mmdepth second pass. A very good surface finishwas
Figure 4. (a)NC-controlled FSWmachine used (b) schematic 3Dmodel of FSP.
5
Mater. Res. Express 6 (2019) 076546 OMIkumapayi and ETAkinlabi

achieved as a result of carefully selected processing parameters. The processing parameters used are displayed intable 2.
Electrochemical testCorrosion test sample preparationThe friction stir processed Aluminum alloyAA7075-T651/Ti–6Al–2Sn–2Zr–2Mo–2Cr–0.25Si AMCused forcorrosion study are of the dimensions of 24 mm×10 mm×6 mm. The corrosion studywas also carried outon the unprocessed basemetal—AA7075-T651 and processed AA7075-T61without reinforcement these serveas a control experiment. The samples werewell polishedwith emery papers of various grades and rinsedwithdistilledwater. A corrosivemediumwas prepared using 3.5%NaCl—this serves as seawater.
Electrochemical measurementThe electrochemical characterization of AA7075—T651was carried out bymeans of open circuit potential(OCP) and potentiodynamic polarisationmeasurements usingAutoLab PGSTAT101Metrohmpotentiostat/galvanostat with embedded 2.1.2 version ofNOVA software and an electrochemical cell with a three-electrodeassemblage and it was conducted at an ambient temperature of 25 degrees. Both the processed (reinforced andunreinforced) and unprocessed (basemetal)Aluminumalloy AA7075-T651 acted as theworking electrode. Thecounter electrode usedwas a graphite rodwhile the reference electrode usedwas potassium chloride electrode(PCE). The range of potentiodynamic polarization curves was set to−1.5 V (cathodic potential) to 1.5 (anodicpotential) against open circuit potential at a scan rate (sweep rate) of 0.005 m s−1. Theworking electrode i.e.Aluminumalloy AA7075-T651 both processed and unprocessed (basemetal)were immersed individually in theelectrolyte solution of 3.5%NaCl and theOCPwasmeasured for 10 min in order to attain steady-state potentialand also themeasurement for potentiodynamic polarisationwas recorded just immediately after theOCPvalues. In order to confirm reproducibility, each sample of the experiment was carried out three times. Therecorded datawhich are current density ( jcorr) and polarization potential (Ecorr)were extracted from the Tafelplots while the percentage inhibition performance efficiency (IPE%) i.e. the percentage protection ability andthe surface courage (θ)were evaluated from the equations (4) to (5) [12, 17–19].
j
j1 4corr
0corr
q = - ( )
Table 2. Friction stir processing parameters (variable and constant).
S/N Process parameter Value
1 Processing Speed (mm min−1)—Pinless (Probeless) 100
2 Rotational Speed (rpm)—Pinless (Probeless) 1000
3 Processing Speed (mm min−1)—tool with Pin 20
4 Rotational Speed (rpm)—Toolwith Pin 1500
5 Tool Tilt Angle (°) 3
6 Tool Penetration (Plunge)Depth (mm) 0.3
7 Pass (no) 2
8 Plunge Rate (mm min−1) 30
9 Processing Configuration PositionControlled
Tool design
1 ToolMaterial H13Hot-working tool steel
2 Tool ShoulderDiameter (mm) 18
3 Tool PinDiameter (mm) 5
4 Tool Pin Length (mm) 5
5 Tool Pin Profile (Shape), Outer Surface Cylindrical
6 Tool Pin Profile (Shape), End Surface tapered
Groove design
1 Plate Dimensions (mm3) 300×125×62 GrooveWidth (mm) 2
3 GrooveDepth (mm) 3.5
4 Groove Length (mm) 280
6
Mater. Res. Express 6 (2019) 076546 OMIkumapayi and ETAkinlabi

IPEj
j% 1 100 5corr
0corr
= - ´ ( )
Where jcorr is the inhibited corrosion current densities and jocorr is the uninhibited corrosion current density.
Surface roughness analysis of the friction stir processedAA7075-T651To further verify the influence on reinforcement ofα-β grade Titanium alloy powder (Ti–6Al–2Sn–2Zr–2Mo–2Cr–0.25Si) onAluminumalloy AA7075-T651, surface roughness analysis was carried out on both theprocessed basemetal (BM) andTitanium alloy reinforced AA7075-T651AMC. Surface roughness is one of thecriteria to analyse process integrity of the processed surface by determining its surface topography, corrosionandwear [20], hardness test [21] etc. In this study, surface roughness test (SRT)was conducted on the processedsurface usingMitutoyo surf test SJ-210 surface roughness tester (SRT) as shown in figure 5(a). The analysis wasconducted on a substrate at three different points on a process parameter and the average readingwas taken foreach parameter to ensure precision of themeasurement data at the same time ensuring coverage of the surfacearea. The surface roughness parameters such as arithmeticalmean roughness value (Ra), maximumheight (Ry),mean roughness depth (Rz) and rootmean square roughness (Rq)were thenmeasured as displayed infigure 5(b)and recorded. The recorded experimental results are displayed in tables 4 and 5 and themacrograph of theprocessed basemetal is represented infigure 5(b).
Microstructural characterizationMicrographswere carried on the powder, basemetal and processed AMCby a TESCANmodel, typeVEGA3LMHscanning electronmicroscope (SEM)machine equippedwith EnergyDispersive x-ray spectrometer(EDXS) semi-quantitative analysis using the beam intensity of 12 and accelerating voltage of 20 k, spot size of 40andworking distance of 15 mm.
Tensile testingAflat tensile tests specimens in accordance withASTMB557M-10 of thickness 6 mmand sub-standard size of100 mm longweremachined to specifications onwaterjetmachine. Themacrograph of the test specimens isshown infigure 6(a). Tensile tests were carried out at room temperature on aXforce P type of Zwick/Roell Z250tensile testingmachine (see set-up) infigure 5(d)with normal force of 250 kN and characteristic of 2 mV/vincorporatedwith testXpert II software for data acquisition and the tests were performed at theMaterial andMetallurgical Laboratory located at theDepartment ofMechanical Engineering Science, University ofJohannesburg, SouthAfrica. A load cell of 10 kN capacity was employed tomeasure the applied load. The tensiletests were conducted on three specimens; Basematerial (Unprocessed), Basematerial (processed) andAluminumalloymatrix compositematerial (AA7075-T651/Ti–6Al–2Sn–2Zr–2Mo–2Cr–0.25Si. The followingparametric valueswere taken and recorded, stress-strain curves,MaximumStress value (UTS)—Rm, Young
Figure 5. (A) SurfaceRoughness Tester (B)meaurement of surface composite integrity produced by FSP (C)macrographs of processedbasemetal (BM).
7
Mater. Res. Express 6 (2019) 076546 OMIkumapayi and ETAkinlabi
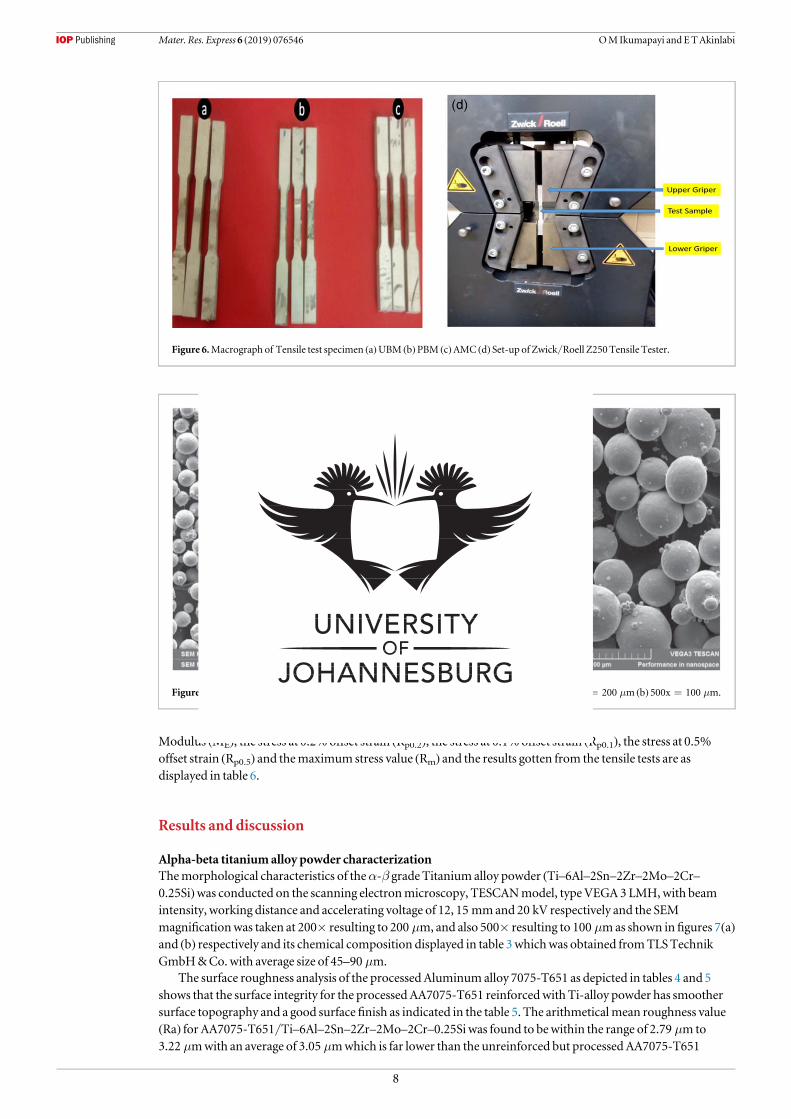
Modulus (ME), the stress at 0.2%offset strain (Rp0.2), the stress at 0.1%offset strain (Rp0.1), the stress at 0.5%offset strain (Rp0.5) and themaximum stress value (Rm) and the results gotten from the tensile tests are asdisplayed in table 6.
Results and discussion
Alpha-beta titaniumalloy powder characterizationThemorphological characteristics of theα-β grade Titanium alloy powder (Ti–6Al–2Sn–2Zr–2Mo–2Cr–0.25Si)was conducted on the scanning electronmicroscopy, TESCANmodel, typeVEGA3LMH,with beamintensity, working distance and accelerating voltage of 12, 15 mmand 20 kV respectively and the SEMmagnificationwas taken at 200× resulting to 200 μm, and also 500× resulting to 100 μmas shown infigures 7(a)and (b) respectively and its chemical composition displayed in table 3whichwas obtained fromTLSTechnikGmbH&Co.with average size of 45–90 μm.
The surface roughness analysis of the processed Aluminum alloy 7075-T651 as depicted in tables 4 and 5shows that the surface integrity for the processed AA7075-T651 reinforcedwith Ti-alloy powder has smoothersurface topography and a good surfacefinish as indicated in the table 5. The arithmeticalmean roughness value(Ra) for AA7075-T651/Ti–6Al–2Sn–2Zr–2Mo–2Cr–0.25Si was found to bewithin the range of 2.79 μmto3.22 μmwith an average of 3.05 μmwhich is far lower than the unreinforced but processed AA7075-T651
Figure 6.Macrograph of Tensile test specimen (a)UBM (b)PBM (c)AMC (d) Set-up of Zwick/Roell Z250Tensile Tester.
Figure 7. SEMMicrographs of TitaniumAlloy - Ti–6Al–2Sn–2Zr–2Mo–2Cr–0.25Si powder (a) 200x=200 μm (b) 500x=100 μm.
8
Mater. Res. Express 6 (2019) 076546 OMIkumapayi and ETAkinlabi

(PBM)which has Rawithin the range of 11.24 to 12.05 μmwith an average of 11.61 μmas depicted in table 4.Themean roughness depth (Rz) for AA7075-T651/Ti–6Al–2Sn–2Zr–2Mo–2Cr–0.25Si AMCwas recorded tobe between 16.38 and 20.63 μmwhile that of PBMwas found to be between 58.42 and 60.92 μm.The surfaceroughness analysis has predicted in tables 4 and 5were in agreementwith theworks [22–25]. The lower the valueof Ra andRq, the better the surface integrity. Overall, the values arithmeticalmean roughness value (Ra),maximumheight (Ry), mean roughness depth (Rz) and rootmean square roughness (Rq)were lower inAA7075-T651/Ti–6Al–2Sn–2Zr–2Mo–2Cr–0.25Si AMC than processed AA7075-T651 (PBM). This indicatedthat the addition ofα-β grade Titanium alloy powder (Ti–6Al–2Sn–2Zr–2Mo–2Cr–0.25Si) as reinforcement inthematrix gives an excellent surface finish and good quality.
Force feedback analysis of the friction stir processed AA7075-T651AMCDuring the friction stir processing, the axial forcewas recorded as the processing experimented on the FSWmachinewith the help of an embedded piezo-electric dynamometer device. The incorporation of a load cell intothe systemhelps in recording the forces (axial load) along the Z direction. The feedback force results from theaxial force are important because this affects the tool geometry andmachine structure during FSP operation.Some processing parameters such as rotational speed and processing speed affect the axial force [26] and duringFSP operation, there three potential stages as illustrated infigure 8(a), they are (a) plunging (b) dwelling and (c)traversing [27, 28]. During plunging stage, the tool comes in contact with the substrate (workpiece) andmakes apenetration into the substrate until the shoulder of the tool swiftly and energetically drive in and aninstantaneous jump (peak) in the axial force was noticed because of the opposition (resistance force) offered bythe substrate and upon the completion of this stage, a short and quick dwell time (rotation of the tool at a
Table 3.Chemical composition oftitanium alloy powder (Ti–6Al–2Sn–2Zr–2Mo–2Cr–0.25Si)—as received.
Element Content (%)
Titanium, Ti 86
Aluminum, Al′ 6
Tin, Sn 2
Molybdenum,Mo 2
Chromium, Cr 2
Zirconium, Zr 2
Silicon, Si 0.25
Iron, Fe 0.25
Oxygen, O 0.14
Carbon, C 0.040
Nitrogen, N 0.030
Table 4. Surface roughnessmeasured data for friction stir processed basemetal (AA7075-T651).
AA7075-T651
Rotational
Speed
(rpm)
Processing
Speed
(mm min−1)Point of
Measurement Ra (μm)
Mean
Ra
(μm) Ry (μm)
Mean
Ry
(μm) Rz (μm)
Mean
Rz
(μm) Rq (μm)
Mean
Rq
(μm)
1500 20 P1 12.05 11.61 78.87 76.65 60.92 59.47 15.80 14.62
P2 11.24 75.11 58.42 14.02
P3 11.53 75.98 59.07 14.05
Table 5. Surface roughnessmeasured data for friction stir processedAA7075-T651/Ti–6Al–2Sn–2Zr–2Mo–2Cr–0.25Simatrix composites.
AA7075-T651/Ti–6Al–2Sn–2Zr–2Mo–2Cr–0.25Si
Rotational
Speed
(rpm)
Processing
Speed
(mm min−1)Point of
Measurement Ra (μm)
Mean
Ra
(μm) Ry (μm)
Mean
Ry
(μm) Rz (μm)
Mean
Rz
(μm) Rq (μm)
Mean
Rq
(μm)
1500 20 P1 2.79 3.05 21.73 22.65 16.38 19.00 3.83 4.08
P2 3.22 23.88 20.00 4.34
P3 3.13 22.35 20.63 4.09
9
Mater. Res. Express 6 (2019) 076546 OMIkumapayi and ETAkinlabi

position)was noticed too due to the interaction of the substrate with the tool causing the substrate to be heatedup by the friction generated by the interaction. This heat generated during dwelling stage lead to the softening oftheworkpiece and subsequently the axial force decreases to nearly 40%of the initial peak load [29, 30].Traversing stage is a relative linearmotion on the substrate along tool rotationalmotion, in this stage, the steadyvalue of axial loadwas achieved. The force feedback data recorded for processing basematerial withoutreinforcement andwith reinforcement are displayed infigures 8(b) and (c).
Tensile test results
In order to ascertain further the efficacy ofα-β grade Titanium alloy powder (Ti–6Al–2Sn–2Zr–2Mo–2Cr–0.25Si) on the amour grade Aluminumalloy AA7075-T651, some parametric properties for the unprocessedbasematerial, the processed basematerial and a compositematrix of AA7075-T651 reinforcedwith Titanium-alloy powderwere investigated. It is worthy ofmentioning that the amount of tensile strength determines theefficacy and the selection of any engineeringmaterials for application. On this note, tensile tests were conductedon the unprocessed basematerial, processed basematerial and the produced compositematerial and theirresults are represented in table 6 andfigure 9.
Table 6 presents tensile strength results for unprocessed basemetal (UBM), processed basemetal (PBM) aswell asmatrix composites of AA7075-T651when reinforcedwithα-β grade Titanium alloy powderwhich is alsoevidential infigure 9. It can be inferred from the results that AA7075-T651, when reinforcedwithα-β gradeTitanium alloy powder, has the highest braking force (Fm) of 25.4 kNwhich is also very close to PBMwith Fmof22.3 kN to fracturewhileUBMhas the least Fm value of 6.1 kN. The processed AA7075-T651without
Figure 8. (a). FSP feedback diagram showing (a)Plunging (b)Dwelling and (c)Traversing Stages (b). Force FeedbackVariation (b)Plot of force versus time for the processed basedmaterial AA7075-T651without reinforcement (c)Plot of force versus time forAA7075-T65/Ti–6Al–2Sn–2Zr–2Mo–2Cr–0.25Si composite.
Table 6. Strength results for the unprocessed and processed AA7075-T651 as recorded byZwick/Roell Z250Tensile Tester.
mE Rp0.1 Rp0.2 Rp0.5 Rt0.5 Rm Fm At(corr.)
GPa MPa MPa MPa MPa MPa kN %
PBM (AA7075-T651) 9.381 65 559.0751 572.9528 588.4694 7.334 991 620.903 22.352 51 9.732 209
AA7075-T651/Ti-alloy 9.753 406 558.5873 570.7303 585.4097 8.758 867 624.2276 25.4002 10.1461
UBM (AA7075 - T651) 4.796 754 207.9201 216.6022 218.0884 6.350 522 170.6334 6.142 802 7.224 781
10
Mater. Res. Express 6 (2019) 076546 OMIkumapayi and ETAkinlabi
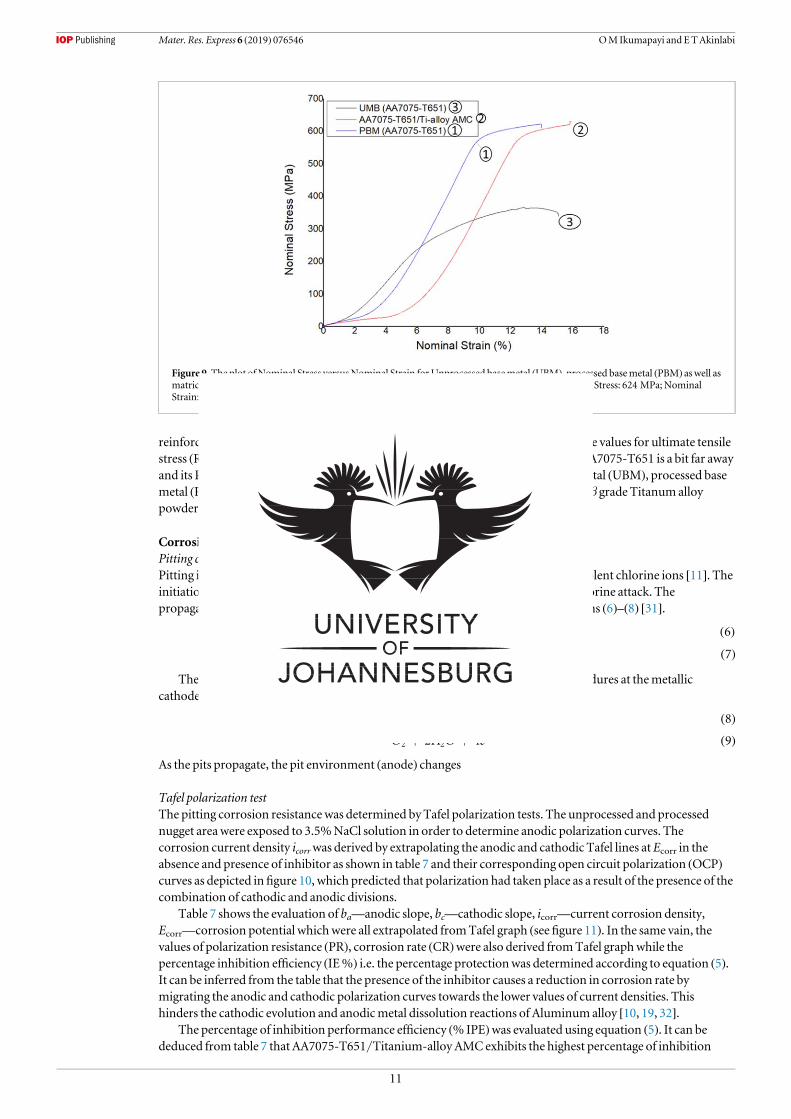
reinforcement and the processed AA7075-T651with reinforcement exhibit very close values for ultimate tensilestress (Rm)which are 620.903 MPa and 624.2 MPa respectively while unprocessedAA7075-T651 is a bit far awayand its Rm is 170.6 MPa. Similarly, the elasticmodulus (ME) for unprocessed basemetal (UBM), processed basemetal (PBM) as well asmatrix composites of AA7075-T651when reinforcedwithα-β grade Titanumalloypowder are 4796.54 MPa, 9381.65MPa and 9753.41MPa respectively.
Corrosion behaviourPitting corrosionPitting is a particularly localized kind of corrosion in the presence of dynamic and violent chlorine ions [11]. Theinitiation of pits occurs at theweak sites in the oxide in the presence of aggressive chlorine attack. Thepropagation of pits can be demonstrated in accordance with the reactions in equations (6)–(8) [31].
eAl Al 3 63 + - ( )
OAl 3H Al OH 3H 72 3+ + +( ) ( )
The evolution of hydrogen and reduction of oxygen are the vital reduction procedures at themetalliccathodes
e2H 2 H 82+ + ( )
eO 2H O 4 92 2+ + ( )
As the pits propagate, the pit environment (anode) changes
Tafel polarization testThe pitting corrosion resistancewas determined by Tafel polarization tests. The unprocessed and processednugget area were exposed to 3.5%NaCl solution in order to determine anodic polarization curves. Thecorrosion current density icorrwas derived by extrapolating the anodic and cathodic Tafel lines atEcorr in theabsence and presence of inhibitor as shown in table 7 and their corresponding open circuit polarization (OCP)curves as depicted infigure 10, which predicted that polarization had taken place as a result of the presence of thecombination of cathodic and anodic divisions.
Table 7 shows the evaluation of ba—anodic slope, bc—cathodic slope, icorr—current corrosion density,Ecorr—corrosion potential whichwere all extrapolated fromTafel graph (see figure 11). In the same vain, thevalues of polarization resistance (PR), corrosion rate (CR)were also derived fromTafel graphwhile thepercentage inhibition efficiency (IE%) i.e. the percentage protectionwas determined according to equation (5).It can be inferred from the table that the presence of the inhibitor causes a reduction in corrosion rate bymigrating the anodic and cathodic polarization curves towards the lower values of current densities. Thishinders the cathodic evolution and anodicmetal dissolution reactions of Aluminumalloy [10, 19, 32].
The percentage of inhibition performance efficiency (%IPE)was evaluated using equation (5). It can bededuced from table 7 that AA7075-T651/Titanium-alloy AMCexhibits the highest percentage of inhibition
Figure 9.The plot ofNominal Stress versusNominal Strain forUnprocessed basemetal (UBM), processed basemetal (PBM) aswell asmatric composites of AA7075-T651when reinforcedwithα-β grade Titanium alloy powder (Nominal Stress: 624 MPa;NominalStrain: 16%).
11
Mater. Res. Express 6 (2019) 076546 OMIkumapayi and ETAkinlabi

Table 7.Potentiodynamic polarization data for unprocessed basemetal (UBM), processed basemetal (PBM) andAA7075-T651/Ti-alloy AMC in 3.5%NaCl solution at an ambient temperature of 25 °C.
Corrosion potential Corrosion current Corrosion rate Polarization resistance Anodic Tafel slope Cathodic Tafel slope Open circuit potential % Inhibition efficiency
Samples Ecorr (mV) jcorr (μA cm−2) Cr (mm/year) Pr (Ω) |ba| (mV/dec) |bc| (mV/dec) OCP (V) %IE
Control 1 (UBM) −1425.8 436 5.0718 98.597 169.62 238.31 −0.969 54 0
Control 2 (PBM) −1424 157 1.829 178.14 88.564 238.24 −1.009 22 63.99
AA7075-T651/Ti-Alloy AMC −1392.8 7.55 0.087 675 2240.7 56.057 12.741 −1.0318 98.26
12
Mater.R
es.Express6
(2019)076546OM
Ikumapayian
dETAkin
labi

performance efficiency (%IPE) of 98.26%—thismight account for the presence of reinforcement particles. Thecorrosion rate of AA7075-T651 inhibitedwithα-β grade Titanium alloy powder (Ti–6Al–2Sn–2Zr–2Mo–2Cr–0.25Si)was found to be 0.087 675 mm/yearwith polarization resistance of 2240.7Ω as against processed basemetal (PBM) of 1.829 mm/year corrosion rate and its polarization resistancewas found to be 178.14Ωwhileunprocessed basemetal (UBM) has a corrosion rate of 5.0718 mm/year which is far higher than PBMandAMC;and a polarization resistance of 98.597Ω. The negative shift in the corrosion potential, Ecorr reveals thepredominant cathodic protection nature of the effects of processing aswell as reinforcement particle.
Conclusion
The following conclusions can be drawn from the study
1. The Investigation reveals exceptionally high improvement in corrosion resistance of FSP of AA7075-T651/Titanium-alloy AMCwhen exposed to 3.5%NaCl solution in ambient temperature by potentiodynamicpolarization technique.
Figure 10.Evolution of open circuit potential (OCP) versus exposure time for theUnprocessed BaseMetal (UBM), Processed BaseMetal (PBM) andα-β grade Titaniumalloy powder (Ti–6Al–2Sn–2Zr–2Mo–2Cr–0.25Si) reinforcedAA7075-T651AMC in 3.5%NaClmedium at an ambient temperature of 25 °C.
Figure 11.Tafel Potentiodynamic Polarization curves forUnprocessed BaseMetal (UBM), Processed BaseMetal (PBM) andα-βgrade Titanium alloy powder (Ti–6Al–2Sn–2Zr–2Mo–2Cr–0.25Si) reinforced AA7075-T651AMC in 3.5%NaClmedium at anambient temperature of 25 °C
13
Mater. Res. Express 6 (2019) 076546 OMIkumapayi and ETAkinlabi

2. The Alpha—Beta Titanium alloy powder used has proven to have the highest percentage of inhibitionperformance efficiency of 98.26%while the processed basemetal (PBM)—without reinforcement wasfound to be 63.99%with reference to the unprocessed basemetal (UBM).
3. The corrosion experimental results show that AA7075-T651 reinforced with α-β grade Titanium alloypowder (Ti–6Al–2Sn–2Zr–2Mo–2Cr–0.25Si) exhibits an extraordinary improvement in corrosion ratewith a reduction from5.0718 mm/year to 0.087 675 mm/year.
4. It can be inferred from the table 7, that polarization resistance is inversely proportional to corrosion rate, i.e.the corrosion rate of 0.087 675 mm/year has the highest polarization resistance of 2240.7Ωwith a very lowamount of current density of 7.55 μA cm−2.
5. The surface roughness analysis result shows that there is a better improvement in surface integrity whenreinforcedwith Titanium-alloy powder thanwhen processedwithout reinforcement. The arithmeticalmean roughness value (Ra) for AA7075-T651/Titanium-alloy AMCwas found between the ranges of2.67–3.05which the processed basemetal (PBM)without reinforcement has its arithmeticalmeanroughness value (Ra) between the ranges of 11.05–11.61.
6. The Ultimate Tensile Strength (UTS) for unprocessed base metal (UBM)- AA7075-T651, processed basemetal (PBM) aswell as reinforced basemetal withα-β grade Titanium alloy powder (Ti–6Al–2Sn–2Zr–2Mo–2Cr–0.25Si)were found to 170.6, 620.9 and 624.2 MPa respectively.
7. The modulus of Elasticity for unprocessed base metal (UBM)- AA7075-T651, processed base metal (PBM)aswell as reinforced basemetal withα-β grade Titanium alloy powder (Ti–6Al–2Sn–2Zr–2Mo–2Cr–0.25Si)were found to 4796.54 MPa, 93 826.5 MPa and 97 534.06MPa respectively
ORCID iDs
OmolayoM Ikumapayi https://orcid.org/0000-0002-9217-8476
References
[1] MeolaC, Boccardi S andCarlomagnoGM2018CompositeMaterial Overview and Its Testing for Aerospace Components (Amsterdam:Elsevier)
[2] ZhangY et al 2019Dynamic precipitation, segregation and strengthening of anAl–Zn–Mg–Cu alloy (AA7075) processed by high-pressure torsionActaMater. 162 19–32
[3] LimitedWP2012 Fibre–Polymer Composites for Aerospace Structures and EnginesNo.Ch. 15 338–93[4] Schuster J C and PalmM2006Reassessment of the binary aluminum-titaniumphase diagram J. Phase Equilibria Diffus. 27 255–77[5] DashwoodR J andGrimes R 2010 StructuralMaterials: Aluminumand Its Alloys—Properties 1–12[6] ElatharasanG andKumarV S S 2012Microstructural characterization andmechanical properties in friction stir welding of Aa7075
aluminiumalloyAdv.Mater. Res. 622–623 330–4[7] VijayaKumar P,Madhusudhan ReddyG and Srinivasa RaoK 2015Microstructure and pitting corrosion of armor gradeAA7075
aluminumalloy friction stir weld nugget zone—effect of post weld heat treatment and addition of boron carbideDef. Technol. 11166–73
[8] NavaneethakrishnanT andGanesh P 2015 Effect of welding parameters on friction stir welded dissimilar aluminumalloys 7075 and6082with various tool pin profiles J. Chem. Pharm. Sci. 463–8
[9] ElatharasanG andKumarV S S 2014Corrosion analysis of friction stir-welded aa 7075 aluminium alloy Stroj. Vestnik/JournalMech.Eng. 60 29–34
[10] Liu Y and Janssen JMCMGCAM2016Combined corrosion andwear of aluminium alloy 7075-T6 J. Bio- Tribo-Corrosion 2 1–7[11] ManthaD and Fawaz S A 2014 Standardized testmethod for corrosion pit-to-fatigue crack transition for AA7075-T651 aluminum
alloyAdv.Mater. Res. 891–892 205–10[12] GerengiH, SolomonMM,Bagci F E andAbai E J 2018An evaluation of the anticorrosion e ff ect of ethylene glycol for AA7075-T6 alloy
in 3.5%NaCl solutionMeasurement 116 264–72[13] Rambabu P, PrasadNE andKutumbaraoVV2017AerospaceMaterials andMaterial Technologies 29–52[14] Adetunla A andAkinlabi E 2018 Influence of reinforcements in friction stir processedmagnesium alloys: insight inmedical
applicationsMater. Res. Express 6 025406[15] RanaH, BadhekaV, KumarA and SatyaprasadA 2018 Strategical parametric investigation onmanufacturing of Al–Mg–Zn–Cu alloy
surface composites using FSPMater.Manuf. Process. 33 534–45[16] Joyson S, IsaacA, Jebaraj D, RajaD, Esther S andAkinlabi T 2018Microstructural characterization and tensile behavior of rutile
(TiO2)—microstructural characterization and tensile behavior of rutile (TiO2)—reinforced AA6063 aluminummatrix compositesprepared by friction stir processingActaMetall. Sin. (English Lett. no. August 1–12
[17] Akande I G,OluwoleOO and FayomiOS I 2018Optimizing the defensive characteristics ofmild steel via the electrodeposition ofZn–Si3N4 reinforcing particlesDef. Technol. 1–7
[18] FayomiOS I andAkande I G 2019Corrosionmitigation of aluminium in 3.65%NaClmediumusing hexamine J. Bio- Tribo-Corrosion5 1–7
[19] FayomiOS I and Popoola I GAAP I 2018Corrosion protection effect of chitosan on the performance characteristics of A6063 alloyJ. Bio- Tribo-Corrosion 4 1–6
14
Mater. Res. Express 6 (2019) 076546 OMIkumapayi and ETAkinlabi

[20] Afolalu S A, Abioye AA,UdoMO,Adetunji OR, IkumapayiOMandAdejuyigbe S B 2018Data showing the effects of temperature andtime variances on nano-additives treatment ofmild steel duringmachiningData Br. 19 456–61
[21] IkumapayiOM,Okokpujie I P, Afolalu SA, AjayiOO,Akilabi E T andBodundeOP 2018 Effects of quenchants on impact strength ofsingle-vee butt welded joint ofmild steel IOPConf. Ser.:Mater. Sci. Eng. 391 1–10
[22] Boromei I, Ceschini L,Morri A andGaragnaniG L 2006 Friction stir weldiong of Aluminiumbased composites reinforcedwithAl2O3
particles: effects onmicrostructureMetall. Sci. Technol. 24 12–21[23] Khodabakhshi F,MarzbanradB, Shah LH, JahedH andGerlichAP 2017 Friction-stir processing of a cold sprayedAA7075 coating
layer on theAZ31B substrate: structural homogeneity,microstructures and hardness Surf. Coatings Technol. 331 116–28[24] HatamlehO, Smith J, CohenD andBradley R 2009 Surface roughness and friction coefficient in peened friction stir welded 2195
aluminumalloyAppl. Surf. Sci. 255 7414–26[25] LukinV I, Ioda EN, SkupovAA, PanteleevMD,OvchinnikovVV andMalovDV2017 Effect of the surface roughness of friction stir
welded joints on the fatigue characteristics of welded joints inV-1461 andV-1469 aluminium–lithium alloysWeld. Int. 31 974–8[26] IkumapayiOM,Akinlabi E T andMajumdar JD 2018Review on thermal, thermo-mechanical and thermal stress distribution during
friction stir welding Int. J.Mech. Eng. Technol. 9 534–48[27] AbegundeOO,Akinlabi E T andMadyiraDM2016 Force feedback analysis: friction stir welding of aluminiummetalmatrix
composite Lect. Notes Eng. Comput. Sci. 2224 1–6[28] MahtoRP,Kumar R, Pal SK and Panda SK2018A comprehensive study on force, temperature,mechanical properties andmicro-
structural characterizations in friction stir lapwelding of dissimilarmaterials (AA6061-T6&AISI304) J.Manuf. Process. 31 624–39[29] SharmaA, SharmaVM,Mewar S, Pal SK and Paul J 2018 Friction stir processing of Al6061-SiC-graphite hybrid surface composites
Mater.Manuf. Process. 33 795–804[30] SharmaA, SharmaVM, Sahoo B, Joseph J and Paul J 2018 Study of nano-mechanical, electrochemical and raman spectroscopic
behavior of Al6061-SiC-graphite hybrid surface composite fabricated through friction stir processing J. Compos. Sci. 2 1–17[31] RaguramanD,MuruganandamDandDhas LKK2014Corrosion study in friction stir welded plates of AA6061 andAA7075 Int. J.
Chem. Tech. Res. 6 2577–82[32] ElODL,HamedGOandEl S J A 2019Anticorrosive formulation based of the epoxy resin—polyaminoamide containing zinc
phosphate inhibitive pigment applied on sulfo-tartaric anodizedAA7075-T6 inNaClmedium J. Bio- Tribo-Corrosion 5 1–9
15
Mater. Res. Express 6 (2019) 076546 OMIkumapayi and ETAkinlabi

29
2.4 ARTICLE III
The characterization of High-Strength Aluminium-Based Surface Matrix
Composite reinforced with Low-cost PKSA Fabricated by the Friction Stir
Processing
Published in Material Research Express, 2019, Vol 6, Number 10, Pages 1 – 27
DOI: https://doi.org/10.1088/2053-1591/ab395b
ISSN Print: 2053-1591 and ISSN Online: 2053-1591
This article exploits the utilization of low-cost Palm Kernel Shell Ash (PKSA) in enhancing the
mechanical, metallurgical, and the electrochemical properties of aluminium metal matrix
composite (AMMC). Various experimental tests were carried out, in order to ascertain the efficacy
of PKSA in surface modification. The influence of PKSA on AA7075-T651 was investigated via
the corrosion and wear behaviours, the tensile and fractographic properties, as well as the surface
integrity, after the addition of PKSA.
In this study, the agrowaste palm-kernel shell was grounded into powder and then carbonized,
before the application on the groove of the substrate for enclosure and processing. Tribometer
equipment was used to carry out the wear test; while the potentiostat/galvanostat was employed
for the corrosion study, the scanning electron microscopy (SEM) for the morphological study,
Energy dispersive X-ray (EDX) for the elemental composition, X-Ray Fluorescence (XRF) for the
chemical compositions, and X-Ray Diffraction (XRD) for the crystal phases and grain size formed.
Two loads of 20 N and 50 N were varied during the wear test; and it was carried out under the dry
sliding conditions and the experimental wear parameters used are presented in Table 2.5.

30
It was established that the applied load of 50 N performed better under the same conditions. At 50
N applied load, the wear resistance for the fabricated AA7075-T651/PKSA was found to be
721938.26 m/mm3 ; while it was 70911.93 m/mm3 for the 20 N applied load same AMC. The wear
properties were tremendously improved at the applied load of 50 N across all the tested samples.
The addition of PKSA on AA7075-T651 also brought about a reduction in the crystallite size from
48.7 nm UBM to 31.9 nm for AA7075-T651/PKSA. The reinforcement with PKSA improved the
corrosion protection by 91.40 % percentage inhibition efficiency; while the friction stir processed
AA7075-T651 (PBM) was 63.99 % with reference to the UBM. The corrosion rate was 0.43574
mm/year for AA7075-T651/PKSA, as against 5.0718 mm/year for the unprocessed base metal
(UBM). This published article has been able to address some of the objectives of the study
especially those in item I, III to V.
Table 2. 5: Wear-Test Experimental Parameters
Item Parameter
Loads 20 N, 50 N
Sliding time 5 mins
Wear Type Cyclic, ball-on-Flat test
Sliding Distance 3 mm, 5 mm
Sliding Speed 3 mm/s
Ball Size 6.35 mm
Ball-type Alloy steel E52100
Ball Grade 25
Lubrication Dry/unlubricated
Loading type Constant
Materials Research Express
PAPER
Characterization of high strength aluminium–based surface matrixcomposite reinforced with low-cost PKSA fabricated by friction stirprocessingTo cite this article: O M Ikumapayi et al 2019 Mater. Res. Express 6 106554
View the article online for updates and enhancements.
This content was downloaded from IP address 152.106.6.250 on 21/08/2019 at 17:35

Mater. Res. Express 6 (2019) 106554 https://doi.org/10.1088/2053-1591/ab395b
PAPER
Characterization of high strength aluminium–based surfacematrixcomposite reinforced with low-cost PKSA fabricated by friction stirprocessing
OMIkumapayi1 , E TAkinlabi1,2, J DMajumdar 3 and SAAkinlabi2,4
1 Department ofMechanical Engineering Science, University of Johannesburg, Auckland ParkKingswayCampus, Johannesburg, 2006,SouthAfrica
2 Department ofMechanical Engineering, CovenantUniversity, Ota,Nigeria3 Department ofMetallurgical andMaterials Engineering, Indian Institute of Technology, Kharagpur, India4 Department ofMechanical and Industrial Engineering, University of Johannesburg, Doornfontein Campus, Johannesburg, 2006, South
Africa
E-mail: [email protected]
Keywords:AA7075, aluminiummatrix composites, corrosion, wear, friction stir processing, palm kernel shell ash
AbstractIn the quest to achieving a low cost of production and a cleaner environment has engenderedresearchers into using agricultural waste that will serve as a potential and promising alternative tometallic powders as reinforcement inmetalmatrix composites (MMC). On awareness of this search,palmkernel shell ash (PKSA)has been developed in this study as reinforcement particles in friction stirprocessing (FSP) of high strength, armour grade, AA7075-T651 aluminiummatrix composites(AMC). Surface and structural integrity, friction andwear study, corrosion behaviours, tensileproperties, and its fractographywere investigated. Tribometer, surface roughness tester (SRT),potentiostat/galvanostat, scanning electronmicroscopy (SEM), Energy dispersive x-ray (EDX), x-rayFluorescence (XRF), and x-rayDiffraction (XRD)were employed in the analysis. Corrosion behaviourwas tested in 3.5%NaCl, two different loads of 20 N and 50Nwere applied duringwear test.Reinforcingwith PKSAhas greatly improved and enhanced the friction andwear properties, corrosionbehavious, surface and structural integrity in the fabricated AA7075-T651/PKSA except in tensileproperties inwhich basemetal, AA7075-T651 has higher tensile strength. The details of XRDstructural analysis, themorphology of worn surfaces, corroded surfaces and fractured surfaces arepresented in this paper.
1. Introduction
Aluminium-based surfacematrix composites (ABSMCs) have been extensively used nowadays as principalmaterials in construction, nuclear,marine, automobile and aerospace industries as one of the essential classes ofmodern and advanced processing,manufacturing and engineeringmaterials. It has gained debut entrance intobuilding ofmilitary and defence equipment because of its remarkable and promising isotropicmechanical,structural, easy fabrication and electrochemical properties such as high thermal conductivity, weldability, lowthermal expansion, excellent wear resistance, high ductility, excellent formability, high specific strength, highfatigue strength, unbeatable damping capacities, high creep resistance, and high stiffness [1]. Lower series ofaluminiumalloys such as series 1xxx (pure aluminium), 2xxx (copper-based), 3xxx (manganese-based), 4xxx(silicon-based, 5xxx (magnesium ) and 6xxx (silicon-based) have been reported to have poor corrosionresistance, low tensile strength, low thermal stability, and lowhardness amongwrought alloys [2–4]. In contrast,high-grade aluminiumalloys are said to have improvedmechanical and chemical properties over the lowerseries such as 7xxx (zinc-based), 8xxx and 9xxx, this set of aluminium alloys have better and improved corrosionmitigation and high strength properties [5, 6]. The influence of reinforcements either organic (agro-wastes both
RECEIVED
28 June 2019
REVISED
31 July 2019
ACCEPTED FOR PUBLICATION
7August 2019
PUBLISHED
21August 2019
© 2019 IOPPublishing Ltd

domestic and industrials powders) or inorganic (majorlymetallic powders) have greatly improved the propertiesof aluminium alloys of different series and upgrading them toABSMCsmaterials and thusmaking themusefulapplications inmany industries today. It worthmentioning that the cost of producing ABSMCs usingmetallicpowders as reinforcements are very high, thereby reducing its production and usage in larger quantities [7]. Onthis note, it is very vital to develop low-cost ABSMCs using naturalminerals, industrial and domestic agro-wastes particles as reinforcement that will be affordable and abundantly available for all and sundry to produceas against the use of conventionalmetallic and ceramics reinforcement particles. It has been reported thatreinforcingwith agricultural wastes and natural fibers such as rice husk, palm kernel shell, hemp fiber, wheathusk, coconut shell, etc have recently captured the attention of young researchers not only for engineering,scientific and technological application integration but also for economic, and social points of view because theyare very cheap and renewable, non-toxic, low density, fully biodegradable, environmentally friendly andabundantly available [8, 9]. In the recent past, few researchers have successfully used PKS/PKSA in variouscategories of composites production either in stir casting, friction stir processing/welding, compo casting,additivemanufacturing [4, 10–12]. Palm kernel shell ash (PKSA)has been developed in this study to serve as apromising and alternative reinforcement particle to conventionally appliedmetallic and ceramic particles. Palmkernel shell (PKS)which produced PKSA is a biowaste cum agro-wastes that are readily available in largequantities across the globe and predominantly in the tropical belt of Brazil, Africa andAsia [13].
Friction stir processing (FSP) is a remarkable and novel surface engineering processing technique advancedfrom friction stir welding (FSW)which got its debut entrance into the globe in 1991 andwas patented by thewelding institute (TWI) ofUK as a solid-state joining technique. It has been reported that the first article inwhich FSPwasfirst discussedwas published in 1999 byMishra, R.S [14–16] and since its entrance, thousands ofarticles, patents in hundreds, textbooks, andmany review papers on FSP had been established. It is facile, updateand cost-effective to prepare ABSMCs using FSP [17]. Benefits of FSP include grain refinement, homogeneity ofthe processed zone, densification, and homogenization of precipitates of aluminumalloys and compositesmaterials [18]. FSP has been established for the improvement of the surface properties of themetal alloys,improvement in ductility, formability, hardness, and strength as well as increase the fatigue life without alteringthe bulkmetal properties [19]. In order to improve the surface quality by FSP, some challenges are encounteredduring the process of reinforcing the compositematerials such as excessive wear during the fabrication of thecomposites as a result of abrasive effect of the reinforcing particles, tool wear, sticking of the substrate to thebacking plate especially when theworkpiece thickness less than 1 mm, challenges on how to improve fatigueproperty and joining strength,many optimizationsmay be required to obtain optimumparameters and thismaylead to the usage ofmanymaterials[16, 20]. Few researchers haveworked on FSP of AA7075 amongwhich are:
Refat et al, [21] carried out experimental of friction stir processed AA7075-O reinforcedwith 40 nmofalumina nanoparticles (Al2O3) by observing four passes on a process parameter which are 40 mmmin−1,500 rpm and 3° for a corresponding traverse speed, rotational speed and tilt angle. The aging process was carriedout at 120 °C for varying time up to 60 h. Toughness,microstructure, impact and hardness properties wereinvestigated. It was observed that hardness properties increased from65HVas a basemetal to 100HVwithoutreinforcement butwith 4-passes and 140HVwith reinforcement with alumina. It was also noticed that therewasa tremendous improvement in impact toughness of thematerial which resulted in 181 J when no reinforcementwas involved and 134 Jwhen reinforcement was applied. Gbolami et al, [22] characterized 10 mm thickness offriction stir processed AA7075 and employed SEM,TEM, andOM in this study. The study involved agingtreatment of FSPAA7075 and it was reported thatwear rate reduced after friction stir processing and the furtherreductionwas noticed after the aging process. In this study, 1200 rpm rotational speed and 50 mmmin−1
traverse speedwith 3° tilt angles were used as experimental parameters. Hardness values were noticed to haveincreased by 30% in stir zone and by 80% in the basemetal. Intergranular and pitting corrosion of friction stirprocessed AA7075was investigated at varying rotational speed of 1600 rpm, 1000 rpmaswell as 630 rpmwhiletraverse speed of 100 mmmin−1 wasmaintained. It was concluded at the process parameter of 1600 rpm, thereexist outstanding pitting corrosionmitigation. There was no intergranular corrosion attack in the heat-affectedzone but pitting corrosionwas noticed conspicuously atHAZ [23].
In this current study, aluminium alloy 7075-T651whichwas reinforcedwith5 μmparticles of PKSA.Friction andwear, corrosion study, tensile properties, and its fractography, surface roughness, and structuralbehaviours were analysed. Two control experiments were usedwhich are friction stir processed (FSPed)AA7075-T651 and unprocessed basemetal–AA7075-T651. Details of experimental procedures were explicitlypresented.
2
Mater. Res. Express 6 (2019) 106554 OMIkumapayi et al

2. Experimentalmaterials and procedures
Rolled aluminium7075-T651 alloy plates, each of thickness 6 mmwas employed as thematrix (basematerial) inthis present workwhichwas obtained fromBharat AerospaceMetals,Mumbai, India in a dimension500×600×6 mm3. This was later sectioned into required dimensions of length 300 mmand breadth 125 mmwith the aid of bosch professional GDC120with tungsten carbide circular saw blade. The chemical compositionof the basematerial –AA7075-T651 is Zn (5.92%),Mg (2.8%), Si (0.05%), Cu (1.93%), Fe (0.15%), Cr (0.193%),Ti (0.02%),Mn (0.01%), andAl (88.93%) based on the optical emission spectrometry analysis while itsmechanical properties in as received form are Brinell Hardness (150), shear strength (330MPa), Poisson’s Ratio(0.32), ShearModulus (26 GPa), Fatigue strength (160Mpa) and its ElasticModulus, Ultimate tensile strength(UTS) andYield Strength are 70 GPa, 570MPa, and 500MPa respectively [24]. The groove (microchannel)wasmachined at themiddle of each plates using a horizontalmillingmachine to accommodate the palmkernel shellash (PKSA) reinforcement particles. The length, depth, andwidth of the grooves were respectively 280 mm,3.5 mmand 2.0 mm. Researchers have established that the percentage by volume of reinforcing particles playedvital roles in enhancing the properties of the basematerial when the sample is fabricated by friction stirprocessing and it has been proven that about 20% to 30%by volumewill sufficiently strengthen the basematerials [10, 25]. Therefore, themicrochannel dimensions equivalents to 28%volume fraction of PKSAreinforcement particles and this was packed into the grooves.Mathematical expressions presented inequations (1)–(3)were used to estimate the volume fraction of PKSA [26]. Themicrochannel was carefullycompacted to the brimwith PKSAparticles (5 μm). It is worthmentioning that palm kernel shell (PKS)whichwas processed frompalmkernel fruits as shown infigure 1(A)was collected locally frompalmoil processingmillsituated atOta town inNigeria. The collected PKSwere carefully sorted as shown infigure 1(B) by separate anyappearance of nuts and other unwantedmaterials, it was thenwashedwith liquid soap and rinsedwith anabundance of water, this is to remove any impurities such as dirt and dust, and lastly it was sun-dried for 48 h andto ensure absolute dryness, it was further dried in an electric oven set at 50 °C for 24 h. The dried PKSwas thencrushed and then pulverized as shown in figure 1(C) and the pulverized PKSwas furthermilled for 60 min usingdigital vibratory discmillingmachine (VDMM).
Milled palm kernel shell powder (PKS-P)was then calcined at a controlled temperature of 500 °C in amufflefurnace for 2 h to allow for phase transition, thermal decomposition, thermal stability as well as removal of avolatile fraction from the PKSA before application and this was done to improve the strength, texture, thermalstability. After the 2 h, the furnace was put off and the carbonaceous powderwas allowed to cool to roomtemperature inside the furnace before it was brought out for use and then further grindwas performed onPKSAto ensure smoothness of the carbonaceous powder before use. PKSA SEM Image and it elemental composition[13] as analysed by energy dispersive x-ray spectrometer (EDXS) are presented infigure 2 and the chemicalcompositions of palmkernel shell powder (PKS-P)were characterised by x-ray Fluorescence (XRF)with thefollowing resultant chemicals,MgO (0.667%), Al2O3 (4.921%), SiO2 (46.23%), K2O (4.254%), SO3 (2.257%),CaO (4.786%), Fe2O3 (31.013%), P2O5 (2.448%), TiO2 (0.218%), Cr2O3 (0.267%),MnO2 (0.088%) andNa2O(1.32%).
Figure 3(a) represents the experimental setup used for the fabrication of AA7075/PKSA via friction stirprocessing. The experiment was conducted on the two-ton numerical controlled friction stir weldingmachine(FSWm)manufactured by ETABanglore, India Ltd The three-dimensional schematic representation of theoperational procedure is depicted in figure 3(b). A load cell is embedded into themachine in order to recordaxial forces along Z-axis direction through an inbuilt piezo-electric dynamometer device. Some sensors werealso embedded into the FSWm tohelp in recording x-position of the tool, z-position, velocity of x-axis andx-load, etc Tool geometry of the cutting tool and the structural component of the FSWm is being influenced by
Figure 1. (A)Palmkernel fruits (B)PalmKernel Shell (C)Pulverised PKS.
3
Mater. Res. Express 6 (2019) 106554 OMIkumapayi et al

the axial load (force) during FSP. The axial force recorded depends on the processing parameters used during theoperationwhich are rotational speed and processing speed [27, 28].
During friction stir processing (FSP) operations a rigid andfirm clamping of theworkpiece others known asthe substratemust be ensured by the use of pressure plates to allow for effective, rigorous and thoroughmixingof the reinforcement particle with thematrix at the same time allows for effective penetration of the tool pin intothematrix by so doing therewill be an interaction of the tool shoulder diameter with thematrix via toolrotational and translational [29, 30]. There are three stages of operation during FSP operation, we have plunging,dwelling and traversing [31] as represented infigure 3(c). The beginning of FSP operation is plunging stageduringwhich pin length penetrates into the substrate until there is an interaction between the tool shoulder thematrix, at the stage instantaneous peak load (axial)was noticed. The next stage is dwelling stage, at this stage,short and swift dwell timewas observed, this enables the tool tomake frictional interactionwith thematrix whenthe tool is rotating at spot and heat energy is building upwhich eventually softening thematrix consequentlyreduces the peak of axial force by 40%. In the last stagewhich is the traversing stage, linearmovement of the toolalong the tool rotationwas observed and this led to a steady-state of the axial force (load) as noticed infigure 3(c)while the force feedback for the friction stir processed basemetal – FSPedAA7075-T651 and FSPedAA7075-T651/PKSA composite are represented infigures 3(d) and (e).
Volume of FractionArea of groove
Projected Area of tool pin100 1= ´ ( )
Area of the groove Groove width Goove depth 2= ´ ( )
Projected Area of the tool pin Pin diameter Pin length 3= ´ ( )
Twodifferent types of tools were fabricated for friction stir processing technique in this work, the tools weremade fromAISIH13 hot-working tool steel. Thefirst tool wasmadewith pinless with shoulder diameter of18 mm, this tool wasfirst employed to compact the particles of PKSA into the groove created and close up themicrochannel. This was done on the rotational speed of 1000 rpmand processing speed of 100 mmmin−1. Thesecond tool usedwasmade up of cylindrical tapered tool with a shoulder diameter of 18 mmand a pin profiledimension of 5 mmpin length and 5 mmpin diameter. This second processing tool was used for stirring andmixing ofmatrix basemetal with the reinforcementmaterials which is the second phase to formmatrixcomposite. This was achieved at processing parameters of 1500 rpmand 20 mmmin−1 respectively forrotational and processing speed. The processingwas carried outwith two passes and 100% inter-pass overlapwas observed. It is essential tomention that 0.3 mmplunge depth and 30 mmmin−1 plunge rate were used onthe processing plates and 3° tilt angle was used on themachine. The 3D illustrations of the friction stir processingare displayed infigures 4(a)–(d) starting from the creation of groove, reinforcing the groovewith particles tocompacting the groove and reinforcement with a pinless tool to close up themicrochannel and also stirringwiththe tool with a pin formixing and homogeneity of the surface composites
Figure 2. SEM Image of PKSAparticle and its EDX.
4
Mater. Res. Express 6 (2019) 106554 OMIkumapayi et al

2.1.Diffraction analysisIn this study, PHILIPSX’Pert whichwasmade inHollandwith themodel number (12NC: 943003040601) andoperating parameters, PW: 3040/60, 240 V, 8.5 kVA, and 50 Hzwas employed to study and obtain the ultimatequality of diffraction data of the samples. X-ray diffraction (XRD)was employed for phase analysis in frictionstirred zones. X-ray diffractometer with the following processing parameters: Current 30 mA, excitation voltageof 40 kV, K-betafiller, scan speed /duration time 1.0000 deg min−1 (2/seg), scan range (2) between 5° and90°was employed in this study. The diffraction pattern for FSPedAA7075-T651/PKSAAMC,AA7075-T651,and FSPedAA7075 is as depicted infigure 16. TheXRDwas acquired usingCuK-alpha radiation (λ=1.54Å)andCuK-beta radiation (λ=1.39Å),whereK is constant (0.94 approx), scintillation counter was used as
Figure 3. (a)Processing Set-Up (b). Schematic 3Dmodel of FSP. (c): FSP feedback diagram showing (a)Plunging (b)Dwelling and (c)Traversing Stages. Force FeedbackVariation (d)Plot of force versus time for the processed basedmaterial FSPedAA7075-T651 (e)Plot of force versus time for FSPedAA7075-T65/PKSAComposite.
5
Mater. Res. Express 6 (2019) 106554 OMIkumapayi et al

detector, stepwidth 0.0100 deg and an 2/3 deg incident slit; i.e., an irradiated sample length that is independentof the Bragg angles ((2θ) in degree)with a continuous scanmode. Besides, dislocation density, grain refinementandmicro-strain induced are estimated theoretically by the use of the Scherrermethod in order to estimate themicrostructural changes in AA7075-T651, FSPedAA7075-T651, and FSPedAA7075-T651/PKSAAMC
2.2. Tensile testingFurther investigations were conducted on the fabricated samples. Tensile testingwas conducted on thefabricated samples in accordancewith ASTMB557M-10 standard test and the test was carried out on 100 mmlong substandard specificationwith 6 mm thickness. The samples weremachinedwith the aid of thewaterjetmachine and the cut-out tensile samples were tested on theXforce P-type Zwick/Roell Z250Tensile testingmachinewith 250 kNnormal force. The tensile specimens were cut across the processing zone as shown infigure 5(a)while the schematic diagram for the tensile sample is displayed infigure 5(b) and themacrograph ofthe fracture samples was shown infigure 5(c). The acquisition of tensile results was obtained on testXpert IIsoftware and the test was carried out at an ambient temperature of 25 °C.Themachine has a characteristic of2 mV v−1 and the schematic of the set-up of the test specimen is shown infigure 5(d). The test specimenwascarried out in triplicate in order to allow for reproducibility and the average values were recorded. Some selectedtensile parametric properties were taken and recorded during the course of the experiment such as stress –elongation relationship curve, the ultimate tensile stress, the yield stress, themodulus of elasticity, the breakingforce, the stress at 0.1, 0.2 and 0.5%offset strain, etc. The fractography of the fracture samples was studied usingSEMexamination to analysis the fracturemorphology.
Figure 4. (A)Groove (B)Reinforcement on the groove (C)Compartment with pinless (D)Processedwith a tool with the pin.
Figure 5. (a) Scheme of how tensile samples were cut (b) tensile test schematic diagram (c)Tensile fractured samples (d) Set-up ofZwick/Roell Z250Tensile Tester.
6
Mater. Res. Express 6 (2019) 106554 OMIkumapayi et al
2.2.1. Surface roughness examinationIn the same vein, the surface integrity of the fabricated samples was investigated. This was carried out usingsurface roughness tester (SRT) of typeMitutoyo surf test SJ-210. It has been established that one of the keyfactors to test for surface integrity of the processed samples is by determining its hardness test [30], surfacetopography as well wear and corrosion test [32]. In this study, surface roughness tests were conducted only onthe fabricated samples. The tests were conducted at three different points on the processed samples, FSPedAA7075-T651 and FSPedAA7075-T651/PKSAAMCand the average values of each investigated parameterswere taken and recorded. The following roughness surface parameters weremeasured and recorded such as Rz,Ra, Rq andRywhich are respectively formean roughness depth, arithmeticalmean roughness value, rootmeansquare roughness andmaximumheight.
2.3. Corrosion studyCorrosion studies were conducted on 24 mm×10 mm×6 mmsizes for themetalmatrix composite – FSPedAA7075-T651/PKSA, FSPedAA7075-T651 andUnprocessed basemetal- AA7075-T651were examined usingpotentiodynamic polarisation (PD)measurements and open circuit potential (OCP). The corrosion tests wereconducted on the AutoLab PGSTAT101Metrohmpotentiostat/galvanostat with embedded 2.1.2 version ofNOVA software. The corrosion samples were prepared according toASTM-G5-14 and the surface of eachsamplewas cleanedwith emery papers of different grades to smoothen the surface and to remove any impuritiesthatmay alter thefinal results and this was then rinsedwith abundant distilledwater. A corrosive testmediumwas preparedwith 35 g ofNaCl and one litre of distilledwater which resulted in a 3.5%NaCl solution aftercomplete dissolution is achieved. Three electrode connections weremade on the electrochemical cell circuit, thereference electrode (RE)which contains potassium chloride electrode (PCE), theworking electrodes (WE)which are the testmaterials, in this case, they are FSPedAA7075-T651/PKSA, AA7075-T651, and FSPedAA7075-T651 likewise, we have a counter electrodewhich is graphite rod. The potentiodynamic polarizationplots range from−1.5 V to 1.5 V for cathodic and anodic potentials respectively, the scan rate during the testperiod is 0.005 V s−1 while the test samples were immersed into the corrosivemedium (NaCl) for 10 min beforetheOCPwas recorded – this is to give room for steady-state potential and this was also in agreementwithworkreported by Bordo et al [33] andDin et al [34]. Each experiment was repeated in triplicate to ensurereproducibility. Polarization potential (Ecorr), current density ( jcorr)were obtained from the Tafel graphs andpercentage inhibition performance efficiency (IPE%) i.e. the percentage protection ability and the surfacecourage (θ)were calculated from the results extracted using equations (4) and (5) [35–38].
j
j1 4corr
corr0
q = - ( )
IPEj
j% 1 100 5corr
corr0
= - ´ ( )
Where jcorr is the inhibited corrosion current densities and jocorr is the uninhibited corrosion current density.The SEM images of the corroded surfaces were then taken and studied.
2.4. Tribology–wear behaviourDry Slidingwear examinationswere carried out on 24 mm×10 mm× 6 mm sizes for FSPedAA7075-T651,AA7075-T651, and FSPedAA7075-T651/PKSAAMC, using RtecUniversal tribometerMTF 5000which hasintegrated 3D in-line profilometer for Imaging and is capable of performing the test on nano,micro, andmacroload. It has a force sensor, temperature, and humidity controller, environmental isolation panel to reduceacoustic interference as well as data acquisition andmotion controller. In this study, a Cyclic, ball onflat discwear testmodewas usedwith E52100 alloy steel ball of grade 25 and the ball diameter of 6.35 mmand the testswere conducted in accordancewithASTMG133-05 standards [39]. Two different types of loads were applied onthe surface of each sample which is 20 N and 50 Nwith sliding distance 3 mmand 5 mmrespectively while bothhave a sliding speed of 3 mm s−1. Thewear tracks were capturedwith an attachedmicroscope on the tribometer.The datawere acquired fromMFT17 software installed on the computer that was linked to RtecUniversaltribometer for analysis. The coefficient of friction (COF), wear volume, friction force for all the tested samplesand other parameters were acquired fromMTF17 software. The experiments were conducted at an ambienttemperature of 25 ° C.The summary of thewear test experimental parameters is presented in table 1.
7
Mater. Res. Express 6 (2019) 106554 OMIkumapayi et al

3. Results and discussion
3.1. Surface integrity assessmentSurface roughness has been proven to be one of the key factors that enhance the quality and the integrity of thefinal product during processing andmachining operation [40]. The quality of thefinal surface of the product willdictate the dimensional accuracy of the fabricated ormachined product,marketability of the products,reduction in thematerial lost during processing andmachining in formofflash and chips and also save cost andincrease productivity [41, 42]. If the fabricated samples have higher value of roughness surface in terms offriction coefficient, it doesmeans that the surfacewill wear faster than thosewith less roughness surface values,i.e. the smoother surface. Table 2 showsmean surface roughness for the FSPedAA7075-T651 and FSPedAA7075-T561/PKSAAMC.
Table 2 reveals that arithmeticalmean roughness surface for fabricated of FSPedAA7075-T651/PKSAhasRa value of 4.43 μmwhich ismuch smoother than the FSPedAA7075-T651without reinforcement with Ravalue of 11.61 μm,whichmeans that reinforcement plays a vital role in surfacemodification as it gives bettersurfacefinish than the unreinforced surface. Similar observations were noticedwith the value of Rq, Rz, andRyfor FSPedAA7075-T651/PKSAAMCwhich gave 6.38 μm, 24.82 μm, and 44.56 μmrespectively as againstFSPedAA7075-T651which has its own value as 14.62, 59.47 and 76.65 respectively. It can be deduced fromfigure 6 that FSPedAA7075-T651/PKSAAMChas better surfacefinish than FSPedAA7075-T651 because allthe values of Ra, Ry, Rz, andRq are lower in FSPedAA7075-T651/PKSA than FSPedAA7075-T651whichindicated that they have smooth and better surface topography.
3.2. Tensile test analysis resultsTensile tests were conducted on the FSPedAA7075-T651 as control experiment 2 (CE2), unprocessed basemetal–AA7075-T651 as control experiment 1 (CE1) and FSPedAA7075-T651/PKSAAMCas focus experiment (FE).In this present study, the following tensile properties were derived from the test data of the experiment: the stressat 0.1%offset strain (Rp0.1), stress –elongation plots, the stress at 0.5%offset strain (Rp0.5), the breaking force(Fm), the stress at 0.2%offset strain (Rp0.2) as well asUltimate tensile stress (Rm). The results of the tensile testsare presented in table 3while the representation of the stress-elongation relationship comprising all the testedsamples is presented infigure 7(a). The fracture surfaces of the fabricated samples were examinedwith the use ofSEMand the fractographic are displayed infigures 7(b)–(d).
Table 3 shows the results of the tensile properties conducted on the AA7075-T651, FSPedAA7075-T651 andFSPedAA7075-T651/PKSA and it can be deduced that AA7075-T651 has the highest ultimate tensile strength(Rm) of 620.9 MPa followed by FSPedAA7075-T651which has Rmof 362.9 MPawhile the fabricatedmatrixcomposite FSPedAA7075-T651/PKSAhas the least Rmof 327.1 MPa, this is in agreementwith theworks ofsome researchers [43, 44] and this reduction in tensile behaviors of the processed samplesmay be as a result oftensile samples orientation as shown infigures 5(a) and (b), If the tensile samples had been cut along theprocessed zone rather than across the processed zone, the tensile properties would have been improved. It worthmentioning here that the effects of tensile samples orientationwill be studied extensively in another article toestablish this assertion. The breaking force (Fm)was noticed to be higher inAA7075-T651 than in FSPedAA7075-T651 and FSPedAA7075-T651/PKSAwhich accounts for 22.35 kN, 13.06 kN, and 11.7 kNrespectively. The values for the stress at 0.1%, 0.2% and 0.5%offset strainwere far higher in AA7075-T651u thanthe rest of the test samples investigatedwith 559.07MPa, 572.95 MPa, and 588.46MPa respectively while theone for FSPedAA7075-T651 and FSPedAA7075-T651/PKSAAMCwere very close as noticed in table 3 and thisreduction in the processed and fabricated tensile tests parametric resultsmay be as a result of the samplepreparation section/cut orientation or geometry. Looking at figure 7(a), one could that the percentage
Table 1.Wear test experimental parameters.
Item Parameter
Loads 20 N, 50 N
Sliding time 5 min
Wear type Cyclic, ball-on-Flat test
Sliding distance 3 mm, 5 mm
Sliding speed 3 mm s−1
Ball size 6.35 mm
Ball-type Alloy steel E52100
Ball grade 25
Lubrication Dry/unlubricated
Loading type Constant
8
Mater. Res. Express 6 (2019) 106554 OMIkumapayi et al

Table 2. Surface roughness evaluation for FSPedAA7075-T651 and FSPedAA7075-T651/PKSA.
MeanRa (μm) MeanRy (μm) MeanRz (μm) MeanRq (μm) Er±5 (%)Rotational speed (rpm) Processing speed (mm min−1) Samples Ra Ry Rz Rq Ra
1500 20 FSPedAA7075-T651 11.61 76.65 59.47 14.62 0.5805
AA7075-T651/PKSA 4.43 44.56 24.82 6.38 0.2215
9
Mater.R
es.Express6
(2019)106554OM
Ikumapayietal

elongation of AA7075-T651 (CE1) and FSPedAA7075-T651 (CE2) are almost the samewhich is approximately16%whichmeans that they aremore ductile than the FSPedAA7075-T651/PKSA composite which haspercentage elongation of 10%.
3.3. Fractography analysisSome parametric factors have been traced to the fracturemechanismof aluminiummetal composites (AMC)which are particles sizes – this has to do if they are inNano size,micro-size ormacro size, type of reinforcementand thematerial used- this has to do if the second phase ismetallic, ceramic or agro or bioparticles, etc, the typeofmatrix aswell as interface properties such as surface roughness, interfacial bonding, porosity content, andprecipitation effects, and lastly the distributions or homogeneity of the reinforcement particles [45]. Generally,the failure of the fabricated compositematrices had been attributedwith interfacial decohesion in thereinforcementmatrix, reinforcement fracture as well as failure in thematrix [46].
SEM images of the fracture surfaces for fabricated aluminiummatrix composite – FSPedAA7075-T651/PKSAAMC, unprocessed basemetal –AA7075-T651 and FSPedAA7075-T651 are presented infigures 7(b)–(d)at 5000magnificationwhile at lowermagnification of 1000 are presented infigures 7(bi)–(di).
Figures 7(b) and (bi) show elongated gains and stretched dimples which imply that the fracture surface isductile in nature. This type of fracture shows that there was substantial plastic deformation and necking justbefore fracture takes place. This ductility behaviour of the fracture surface was as a result of vast and large plasticdeformation caused enormous load as it can be seen in table 3. Figures 7(c) and (ci) show a large number ofdimples networkswhich revealed bimodal distribution in themorphology of the fracture surface which furtherconfirms the efficacy of FSP on the aluminiummatrix. This network of large dimples on themorphology of thefracture surfaces enhanced excellent interfacial bonding between the reinforcement and themetalmatrices andat the same time improve the tensile strength. This type of fracture infigures 7(c) and (ci) can also be attributedto equiaxed dimples which exhibits cup and cone shape like has revealed at largermagnification of 5000, this alsodictates that is ductile in nature, this can also be confirmed infigure 7(a)which both unprocessed basemetal-
Figure 6. Showing surface roughness profile parameters for FSPedAA7075 andAA7075-T651/PKSA.
Table 3.Tensile Test results for AA7075-T651u, AA7075-T651p andAA7075-T651/PKSA.
Rp0.1 Rp0.2 Rp0.5 Rt0.5 Rm Fm At (corr.)
Compositesmatrix MPa MPa MPa MPa MPa KN %
AA7075-T651 559.0751 572.9528 588.4694 7.334991 620.9030 22.35251 9.732209
FSPedAA7075 - T651 213.24 228.2679 251.8613 7.607991 362.9048 13.06457 14.30768
AA7075-T651/PKSA 227.769 242.5084 266.179 8.222344 327.0142 11.77251 8.419101
10
Mater. Res. Express 6 (2019) 106554 OMIkumapayi et al

AA7075-T651 and processed basemetal- FSPedAA7075-T651 has percentage elongation 16%while that ofaluminiummatrix composite – FSPedAA7075-T651/PKSAhas an elongation of 10% and this was also noticedin themorphology of the fracture surface showed infigures 7(d) and (di). This behaviour can be attributed to thebrittle nature of the fabricated AMC. It was observed from its SEM Image that the intergranular fractureoccurred in a hardened, brittle nanocompositemetalmatrix, this has precipitates that weakened the grainboundaries. This type of failure can be caused by impact loading of thematrix which resulted in low ductility,hence formed ‘RockCandy fracture’ as noticed infigures 7(d) and (di).
Figure 7. (a)The plot of stress against elongation for the basemetal and fabricated AMC. SEM Images of the fractured surfaces at 5000MAG for (b)AA7075-T651 (c) FSPedAA7075-T651 (d) FSPedAA7075-T651/PKSAAMC;while at 1000MAG (bi)AA7075-T651 (ci)FSPedAA7075-T651 (di) FSPedAA7075-T651/PKSAAMC.
11
Mater. Res. Express 6 (2019) 106554 OMIkumapayi et al

3.4. Corrosionmitigation analysis3.4.1. Pitting corrosionPitting corrosion takes lion’s share of the destructive formof localized type of corrosion attackwhich happens asa result of the dynamic, agitated, and violent chlorine ions [47]. The crack or pits initiation occurs at theweakestpoint in the oxide in the presence of aggressive chlorine attack [48]. The pits propagation can be demonstratedby the reactions illustrated in equations (6)–(11) [49], andwas as a result of electrochemical reactions that occurbetween aluminium and its alloys in a seawater environment, the following anodic reaction for anodicpolarization of aluminium is expected [50].
Al Al 3e 63 + - ( )
Al 3H O Al OH 3H 3e 72 3+ + ++( ) ( )
It worthmentioning that there is a coexistence between the pitting potential and the resting potential as a resultof this, dissolution of aluminiumoccurred base on the formation of the pit, which eventually causes themovement of chloride ions into the pit and consequently formed aluminium chloride inside the pit inaccordancewith the equation (8).
Al 3Cl AlCl 833+ + - ( )
However, the following electrochemical reactions, equations ix to xi are expected to occur at the cathodicpolarization of aluminium. The evolution of hydrogen and reduction of oxygen are the essential reductionprocedures at themetallic cathodes
O 2H O 4e 4OH 92 2+ + - ( )
2H O 2e 2OH H 102 2+ +- ( )
2H 2e H 112+ + ( )
As the pits propagate, the pit environment that is an anode also changes
3.4.2. Potentiodynamic polarization (PDP) analysisTafel polarization analysis was used to examine the effect of pitting corrosion attack and resistance on theworking electrodes (WE)which are FSPed 7075-T651, unprocessed basemetal- AA 7075-T651 and fabricatedaluminiummatrix composite –AA7075-T651/PKSA. The nugget zone of unreinforced but processed-FSPedAA7075-T651; and reinforced and processed - FSPedAA7075-T651/PKSA samples were exposed to thesolution ofNaCl containing 3.5% concentration in order to determine anodic polarization plots. To determineand extract corrosion current density icorr and Ecorr – corrosion potential respectively in the presence andabsence of corrosion inhibitor, the extrapolations for bothAnodic and cathodic Tafel lines were determine asdepicted in table 4, and their corresponding open circuit potential (OCP) graph as shown infigure 8(a), and thepotentiodynamic polarization (PDP) plot is depicted infigure 8(b), which dictated that the presence of thecombined effects of anodic and cathodic braches had caused polarization to take place.
Themeasured and recorded values for cathodic slope (bc), corrosion current density ( jcorr), anodic slope(ba), corrosion potential E ,corr( ) as well as open circuit potential (OCP) values were all derived from the Tafelgraph as shown in table 4. Similarly, the values for polarization resistance (PR), and corrosion rate (CR), werealso extracted from the Tafel Plot while the percentage inhibition performance efficiency (IPE%) i.e. thepercentage protectionwere calculated using Equation (2). The presentation of values in table 4 suggested that thepresence of inhibitorsmitigated the corrosion attack bymigrating the cathodic and anodic polarization plotstowards the lower values of current densities. This hinders the cathodic evolution and anodicmetal dissolutionreactions of aluminium alloy [37].
3.4.3. Open circuit potential (OCP)measurementThe plot of open circuit potential (OCP) versus exposure time for AA7075-T651which serve as Controlexperiment 1 (CE1), FSPedAA7075-T651which serve as control experiment 2 (CE2) and that of aluminiummatrix composite (AMC) - AA7075-T651/PKSA in 3.5%NaClmediumwas presented infigure 8(a). OCP ispotential of theworking electrode (AA7075-T651, FSPedAA7075-T651, and FSPedAA7075-T651/PKSA)withrespected to reference electrodewhen there is no existing current in the cell at the same time no potential isapplied. The variation in theOCP as depicted in table 4 can be traced to theflowof current across the electrode/electrolyte interface [37, 49, 51, 52]. As it can be noticed infigure 8(a), the presence of PKSA inhibitor hasinfluenced theOCP curve by shifting it toward themore negative direction and this can be associatedwith thefact that there is cathodic reaction aremore reactive than anodic reaction. It was revealed that FSPedAA7075-T651/PKSAAMChas the highest negativeOCP and thus has the best performance. The FSPedAA7075-T651andAA7075-T651 have relatively closeOCP values. The values ofOCPpotential for inhibited sample (AA7075-
12
Mater. Res. Express 6 (2019) 106554 OMIkumapayi et al

Table 4.Corrosion results for AA7075-T651, FSPedAA7075-T651 and FSPedAA7075-T651/PKSA.
% inhibition efficiency Corrosionn potential Open circuit potential Corrosion current Anodic tafel slope Corrosion rate Polarization resistance Cathodic tafel slope
Samples % IE Ecorr (mV) OCP (V) jcorr (μA/cm2) |ba| (mV/dec) Cr (mm/year) Pr (Ω) |bc| (mV/dec)
AA7075-T651 0 −1425.8 −0.96954 436 169.62 5.0718 98.597 238.31
FSPedAA7075 63.99 −1424 −0.97839 157 88.564 1.829 178.14 238.24
AA7075-T651/PKSA 91.40 −1217.7 −1.00922 37.5 33.397 0.43574 1075.6 11.898
13
Mater.R
es.Express6
(2019)106554OM
Ikumapayietal
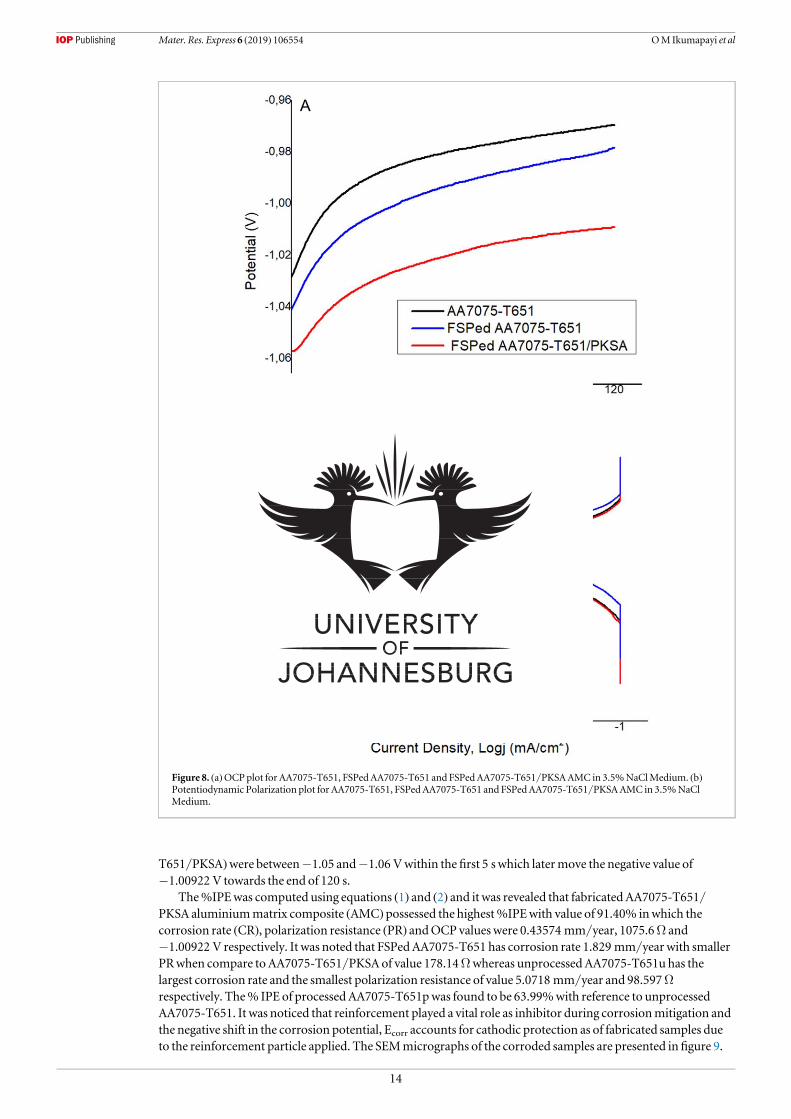
T651/PKSA)were between−1.05 and−1.06 Vwithin the first 5 swhich latermove the negative value of−1.00922 V towards the end of 120 s.
The%IPEwas computed using equations (1) and (2) and it was revealed that fabricated AA7075-T651/PKSA aluminiummatrix composite (AMC)possessed the highest%IPEwith value of 91.40% inwhich thecorrosion rate (CR), polarization resistance (PR) andOCP valueswere 0.43574 mm/year, 1075.6Ω and−1.00922 V respectively. It was noted that FSPedAA7075-T651 has corrosion rate 1.829 mm/year with smallerPRwhen compare to AA7075-T651/PKSAof value 178.14Ωwhereas unprocessedAA7075-T651u has thelargest corrosion rate and the smallest polarization resistance of value 5.0718 mm/year and 98.597Ωrespectively. The% IPE of processed AA7075-T651pwas found to be 63.99%with reference to unprocessedAA7075-T651. It was noticed that reinforcement played a vital role as inhibitor during corrosionmitigation andthe negative shift in the corrosion potential, Ecorr accounts for cathodic protection as of fabricated samples dueto the reinforcement particle applied. The SEMmicrographs of the corroded samples are presented infigure 9.
Figure 8. (a)OCPplot for AA7075-T651, FSPedAA7075-T651 and FSPedAA7075-T651/PKSAAMC in 3.5%NaClMedium. (b)Potentiodynamic Polarization plot for AA7075-T651, FSPedAA7075-T651 and FSPedAA7075-T651/PKSAAMC in 3.5%NaClMedium.
14
Mater. Res. Express 6 (2019) 106554 OMIkumapayi et al
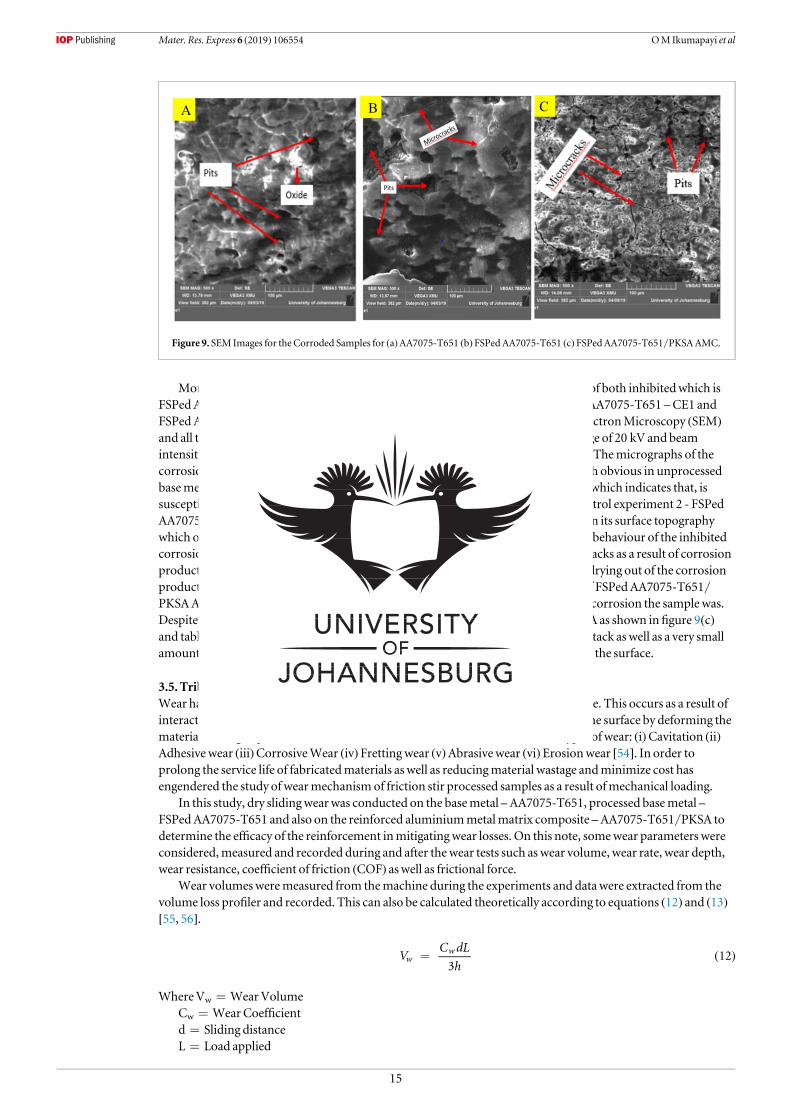
Morphological characteristics and surface topography for the corroded samples of both inhibitedwhich isFSPedAA7075-T651/PKSAAMCand uninhibited samples which are unprocessedAA7075-T651 –CE1 andFSPedAA7075-T651 –CE2were studied using TESCANVEGA3 LMHScanning ElectronMicroscopy (SEM)and all the SEM Imageswere taken at amagnification of 500xwith accelerating voltage of 20 kV and beamintensity of 10 having varyingworking distance ranges from13.78 mm to 14.06 mm.Themicrographs of thecorrosion samples are presented infigures 9(a)–(c). Pits corrosion attacks are somuch obvious in unprocessedbasemetal which is the control experiment 1- AA7075-T651, as shown infigure 9(a)which indicates that, issusceptible to corrosion attack, figure 9(b)which is processed basemetal and as a control experiment 2 - FSPedAA7075-T651 also shown considerable amount of pits attack aswell asmicrocracks in its surface topographywhich occur as a result of intergranular corrosion on the surface. Themorphological behaviour of the inhibitedcorrosion sample under the influence of PKSAwas characterisedwithmuchmicrocracks as a result of corrosionproducts formed due to polarization and desiccation cracks (mud cracks) caused by drying out of the corrosionproducts [53] and pits attackwhichwas found in aminimal number on the surface of FSPedAA7075-T651/PKSAAMCas depicted infigure 9(c), the surface behaviour shows how resistance to corrosion the sample was.Despite the high rate of corrosion resistance exhibited by FSPedAA7075-T651/PKSA as shown infigure 9(c)and table 4, the surface topographywas characterisedwith intergranular corrosion attack as well as a very smallamount of pits attack and formation offlakes that is, oxide layer was also observed on the surface.
3.5. Tribology-Wearmechanisms of aluminium–based surfacematrix compositeWear has been described as the gradual removal ofmaterial fromoperating solid-state. This occurs as a result ofinteraction between two solidmaterials which results in the plastic displacement of the surface by deforming thematerial leading to particles removal that formwear debris. There are different types of wear: (i)Cavitation (ii)Adhesive wear (iii)CorrosiveWear (iv) Fretting wear (v)Abrasivewear (vi)Erosionwear [54]. In order toprolong the service life of fabricatedmaterials as well as reducingmaterial wastage andminimize cost hasengendered the study of wearmechanism of friction stir processed samples as a result ofmechanical loading.
In this study, dry slidingwearwas conducted on the basemetal –AA7075-T651, processed basemetal –FSPedAA7075-T651 and also on the reinforced aluminiummetalmatrix composite –AA7075-T651/PKSA todetermine the efficacy of the reinforcement inmitigatingwear losses. On this note, somewear parameters wereconsidered,measured and recorded during and after thewear tests such as wear volume, wear rate, wear depth,wear resistance, coefficient of friction (COF) aswell as frictional force.
Wear volumesweremeasured from themachine during the experiments and datawere extracted from thevolume loss profiler and recorded. This can also be calculated theoretically according to equations (12) and (13)[55, 56].
VC dL
h312w
w= ( )
WhereVw=WearVolumeCw=WearCoefficientd=Sliding distanceL=Load applied
Figure 9. SEM Images for theCorroded Samples for (a)AA7075-T651 (b) FSPedAA7075-T651 (c) FSPedAA7075-T651/PKSAAMC.
15
Mater. Res. Express 6 (2019) 106554 OMIkumapayi et al

h=Substrate bulk hardness
Volume loss mmWeight loss g
Densityg
mm
1000 133
3
= ´⎜ ⎟
⎛
⎝
⎜⎜⎜⎜ ⎛⎝
⎞⎠
⎞
⎠
⎟⎟⎟⎟( ) ( ) ( )
The SEM images of theworn surfaces at 20 N and 50 N applied loadwas taken at 100xmagnification resulting in500 μmsize. The SEM images were taken to determine thewearwidth in thewear track. The schematic diagramof thewear track is illustrated infigure 10which shows thewear depth, wearwidth, wear cross-sectional area.Thewearwidthswere taken in triplicate on the SEM images as shown infigure 11 to ensure reproducibility andthe average value of wear width for each sample was calculated and recorded in order to determine the extent ofthewear.
Wear rate for each sample was estimated by using the value obtained fromvolume loss whichwas extractedfrom themachine and this was divided by sliding distance according to equation (14) and the reciprocal ofequation (14) resulted towear resistance according to equation (15) [56–58], Friction force was also estimated bythe use of equation (16) [59].
Volume loss mm
Sliding distance mWear rate mm m 1000 143
3
= ´⎛⎝⎜
⎞⎠⎟( ) ( )
( )( )/
Sliding distance m
Volume loss mmWear resistance m mm 1000 153
3´
⎛⎝⎜
⎞⎠⎟( ) ( )
( )( )/
Friction Force F
Applied Load LCoefficient of friction 16
fm =( )( )( )
( )
Figures 11(a)–(c): the abrasive and delamination are the predominantmechanisms of wear. Figure 11(a),there are clear and continuous (longitudinal) abrasivemarks along the direction of the steel ball, with the deepestmarks/scratches at themid of thewear track. At the end of thewear track largewear debris can be observed; withobvious free bright (small) particles (debris) fully delaminated from the tested sample (unprocessed basemetal –AA7075-T651). These small particles are dominant at the edges of thewear grooves. Infigure 11(b), the scratchmarks along the direction of the reciprocating steel ball are discontinuous, with large (partially bright) particlesrandomly distributed throughout thewear track. The discontinuous scratches are indicators of some formofwear resistance by the large particles distributed on thewear tracks [60]. Infigure 11(c), thewear debris are alsodistributed randomly but appear dense and fully broken. In these samples, the free broken particles get attachedor pushed by the steel ball onto the substrate, thereby enhancing grooving and contribute to 3 bodywearmechanism.
Figures 11(a1)–(c1): In these samples, thewear is predominated by delamination and adhesion. Due tohigher loads (50 N), there is the generation of heat, which degrades themechanical properties of the samples andtherefore enhancing softening and plastic deformation ofmaterial along thewear paths. Softening and plasticdeformation of thematerial along thewear path ensures that thematerial being removed gets ‘smeared’ onto thewalls of thewear track or onto the steel ball and as such, it is not obvious to see thewear debris as it is the case at20 N (figures 11(a)–(c).
Figure 10. (a) Schematic of wear track. (b) Illustration of tribometer setup.
16
Mater. Res. Express 6 (2019) 106554 OMIkumapayi et al

3.5.1. Effects of applied loads onwear resistanceTable 5 shows the results of wear for applied load 20 N, at a sliding distance of 3 mm, sliding speed of 3 mm s−1,and cyclic time of 5 min at ambient temperature. Likewise, table 6 shows thewear results for an applied load of50 Nwith a sliding distance of 5 mm, sliding speed of 3 mm s−1 and its sliding timewas 5 min.
It was observed fromSEMmicrographs of theworn-out surfaces infigure 11 thatmore debris were formedwhen 20 N loadwas applied thanwhen 50 N loadwas applied and thismay be as a result of intense heatgenerated during the reciprocating slidingmovement of the steel ball on theworkpiece and as such leads todegeneration ofmechanical properties by causing plastic deformation and softening thewear paths, therebyremoving the depositedwear debris along thewear track. Also, averagewearwidthsmeasured from the SEMImages infigure 11were larger in 20 N applied load than in 50 N applied Load.Wear tracks were conspicuouswith lots of wear debris when 20 N loadwas applied thanwhen 50 N loadwas applied. Delaminationwas alsonoticed in thewear tracks when 20 N loadwear applied thanwhen 50 N loadwas applied. Figures 12 and 13show thewear tracks for 20 N load and 50 N load respectively. Thewear profiling at different testing stages, i.e.AA7075-T651, FSPedAA7075-T651, and FSPedAA7075-T651/PKSAAMCwere also presented and 3Dgeometry of 50 N load for AA7075-T651, FSPedAA7075-T651 and FSPedAA7075-T651/PKSAAMCwere alsopresented.
The fabricated aluminium alloymatrix composite –AA7075-T651/PKSAwas noticed at 50 N, its wearvolumewas 0.006926 mm3while that of 20 N loadwas 0.042306 mm3, this performs better than either FSPedAA7075-T651 andAA7075-T651. Thewear rate was 1.385 mm3m−1 in 50 N loadwhile it was 14.102 mm3m−1
in 20 N load; thewear resistancewas 721938.26 mmm−3 in 50 N load and that of 20 N loadwas70911.93 mmm−3. TheCOFwas lower in 50 Nwhichwas 0.1158 and that of 20 Nwas 0.4507. Overall, it wasobserved that AA7075-T651/PKSAAMCperformed better than FSPedAA7075-T651 andAA7075-T651 interms of wear rate as well as wear resistance. Therewere fluctuations in the coefficient of friction as showed infigures 14(a) and (b) and this is due to the interaction of the ballmaterial and the processed samples andsubstrate surface. Thefluctuations observed are due to the breakage and detachment of the hardAA7075-T651layer from the surface during sliding under the occurrence of abrasive wear behaviour [61]. It was observed thattherewas overlapping in theCOFpredominantly at 20 N than in 50 N and this is due to the closeness in the valueof COF as noted in 20 N than in 50 N. Thefluctuation can also be attributed to the fact that tangentialmovement
Figure 11. SEM Images forWear track showingwear width of 20 NLoad (a)AA7075-T651 (b) FSPedAA7075-T651 (c)AA7075-T651/PKSA; SEM Images forWear track showingwearwidth of 50 NLoad (ai)AA7075-T651 (bi) FSPedAA7075-T651 (ci)AA7075-T651/PKSA.
17
Mater. Res. Express 6 (2019) 106554 OMIkumapayi et al

Table 5.Wear results conducted at ambient temperature for load of 20 N.
Parameters20 N, 5 min, 3 mmand 3 mm/s
Sample Wear depth (mm) COF (μ) Wear volume (mm3) Wear rate (mm3/m) Wear resistance (m/mm3) Wearwidth (μm) Friction force (N)
AA7075-T651 0.0213 0.4680 0.049940 16.647 60072.09 920.22 9.360
FSPedAA7075-T651 0.0714 0.4568 0.042313 14.104 70900.19 1099.76 9.136
AA7075-T651/PKSA 0.0854 0.4507 0.042306 14.102 70911.93 1146.97 9.014
18
Mater.R
es.Express6
(2019)106554OM
Ikumapayietal

Table 6.Wear Results conducted at ambient temperature for load of 50 N.
Parameters50 N, 5 min, 5 mmand 3 mm/s
Sample Wear depth (mm) COF (μ) Wear volume (mm3) Wear rate (mm3/m) Wear resistance (m/mm3) Wearwidth (μm) Friction force (N)
AA7075-T651 0.0288 0.1969 0.028358 5.672 176317.09 401.65 9.845
FSPedAA7075 0.1135 0.1320 0.014390 2.878 347463.51 355.27 6.6
AA7075-T651/PKSA 0.0561 0.1158 0.006926 1.385 721938.26 659.20 5.79
19
Mater.R
es.Express6
(2019)106554OM
Ikumapayietal
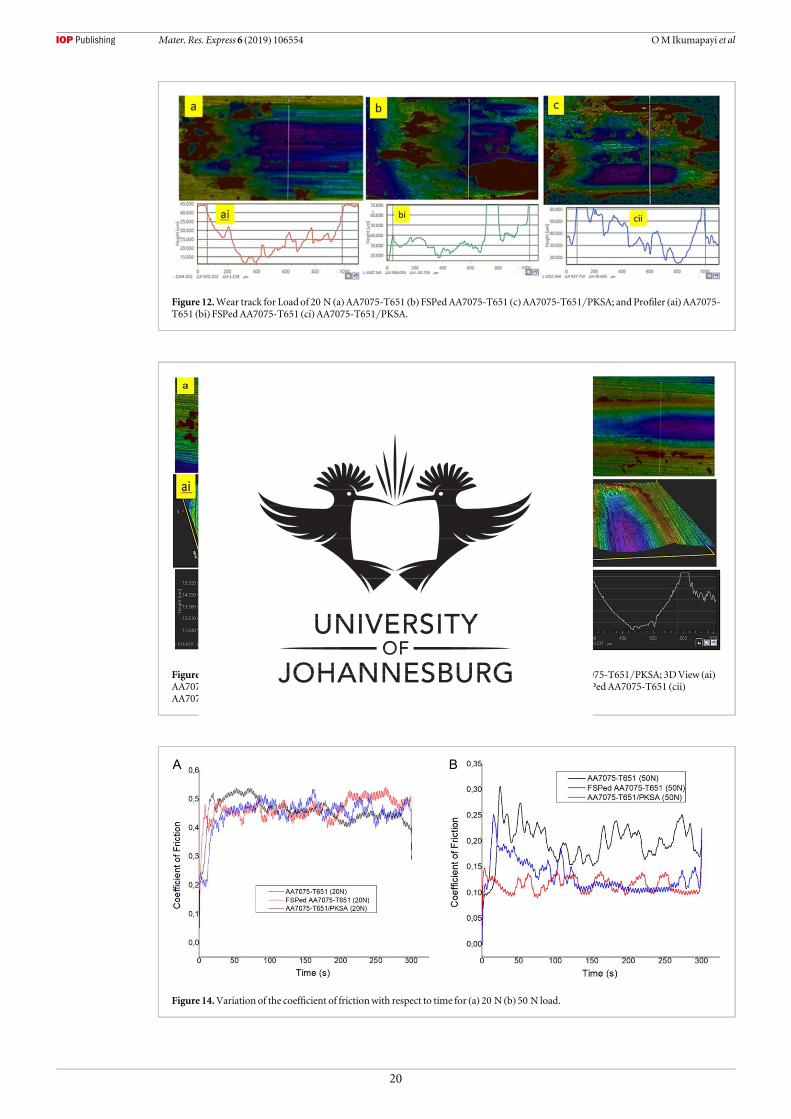
Figure 12.Wear track for Load of 20 N (a)AA7075-T651 (b) FSPedAA7075-T651 (c)AA7075-T651/PKSA; and Profiler (ai)AA7075-T651 (bi) FSPedAA7075-T651 (ci)AA7075-T651/PKSA.
Figure 13. 2DView ofWear track for Load of 50 N (a)AA7075-T651 (b) FSPedAA7075-T651 (c)AA7075-T651/PKSA; 3DView (ai)AA7075-T651 (bi) FSPedAA7075-T651 (ci)AA7075-T651/PKSA; Profiler (aii)AA7075-T651 (bii) FSPedAA7075-T651 (cii)AA7075-T651/PKSA.
Figure 14.Variation of the coefficient of frictionwith respect to time for (a) 20 N (b) 50 N load.
20
Mater. Res. Express 6 (2019) 106554 OMIkumapayi et al
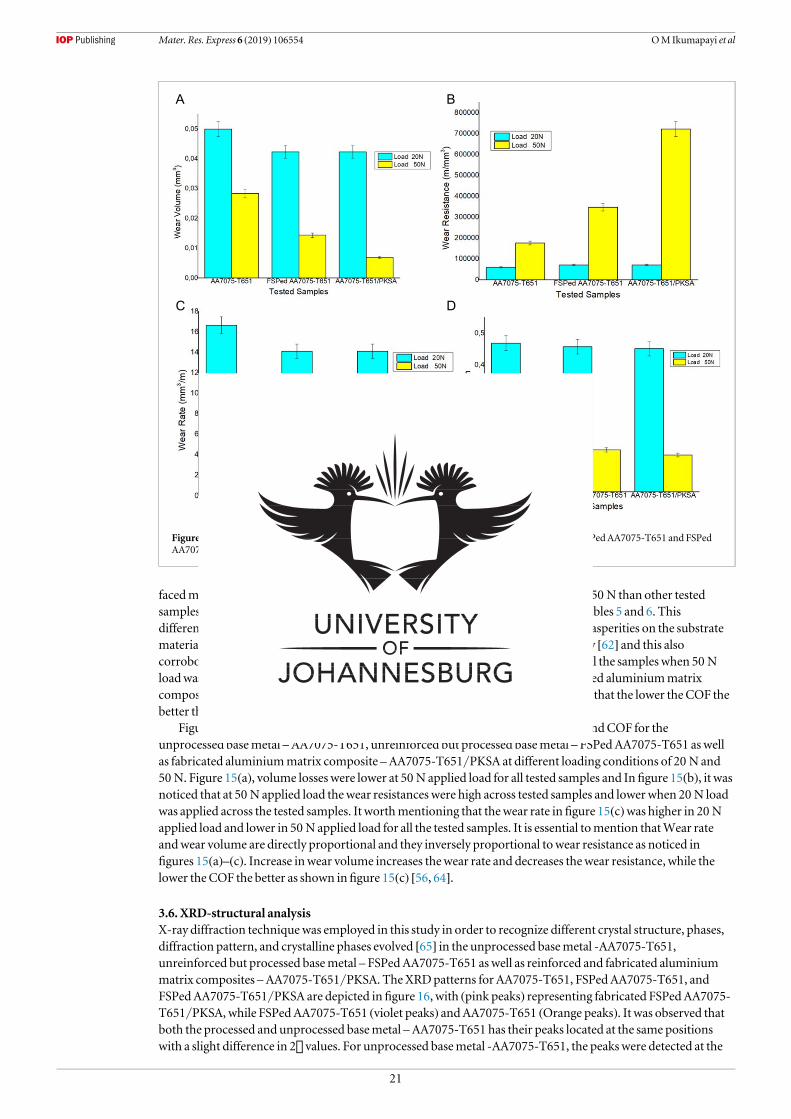
facedmore resistance from fabricated FSPedAA7075-T651/PKSA in both 20 N and 50 N than other testedsamplesmaking it have the least values of COF at both 20 N and 50 N as revealed in tables 5 and 6. Thisdifferences in friction coefficient are primarily due to themechanical interlocking of asperities on the substratematerial during FSP hence enhancing different wear failuremechanism susceptibility [62] and this alsocorroborated thework of Prasad et al [63]. It was established that COFwas lower in all the samples when 50 Nloadwas appliedwhile that of 20 Nwas higher in the same sample. However, fabricated aluminiummatrixcomposites have the lowest of COF at 20 N load aswell as at 50 N load, which implies that the lower theCOF thebetter thewear resistance.
Figures 15(a)–(d) represent the plots of wear volume, wear resistance, wear rate andCOF for theunprocessed basemetal –AA7075-T651, unreinforced but processed basemetal – FSPedAA7075-T651 as wellas fabricated aluminiummatrix composite –AA7075-T651/PKSA at different loading conditions of 20 N and50 N. Figure 15(a), volume losses were lower at 50 N applied load for all tested samples and Infigure 15(b), it wasnoticed that at 50 N applied load thewear resistances were high across tested samples and lowerwhen 20 N loadwas applied across the tested samples. It worthmentioning that thewear rate infigure 15(c)was higher in 20 Napplied load and lower in 50 N applied load for all the tested samples. It is essential tomention thatWear rateandwear volume are directly proportional and they inversely proportional towear resistance as noticed infigures 15(a)–(c). Increase inwear volume increases thewear rate and decreases thewear resistance, while thelower theCOF the better as shown infigure 15(c) [56, 64].
3.6. XRD-structural analysisX-ray diffraction techniquewas employed in this study in order to recognize different crystal structure, phases,diffraction pattern, and crystalline phases evolved [65] in the unprocessed basemetal -AA7075-T651,unreinforced but processed basemetal – FSPedAA7075-T651 as well as reinforced and fabricated aluminiummatrix composites –AA7075-T651/PKSA. TheXRDpatterns for AA7075-T651, FSPedAA7075-T651, andFSPedAA7075-T651/PKSA are depicted infigure 16, with (pink peaks) representing fabricated FSPedAA7075-T651/PKSA, while FSPedAA7075-T651 (violet peaks) andAA7075-T651 (Orange peaks). It was observed thatboth the processed and unprocessed basemetal –AA7075-T651 has their peaks located at the same positionswith a slight difference in 2 values. For unprocessed basemetal -AA7075-T651, the peakswere detected at the
Figure 15. (a)WearVolume (b)WearResistance (c)WearRate (d)Average COF for AA7075-T651, FSPedAA7075-T651 and FSPedAA7075-T651/PKSAAMCat load 20 N and 50 N.
21
Mater. Res. Express 6 (2019) 106554 OMIkumapayi et al
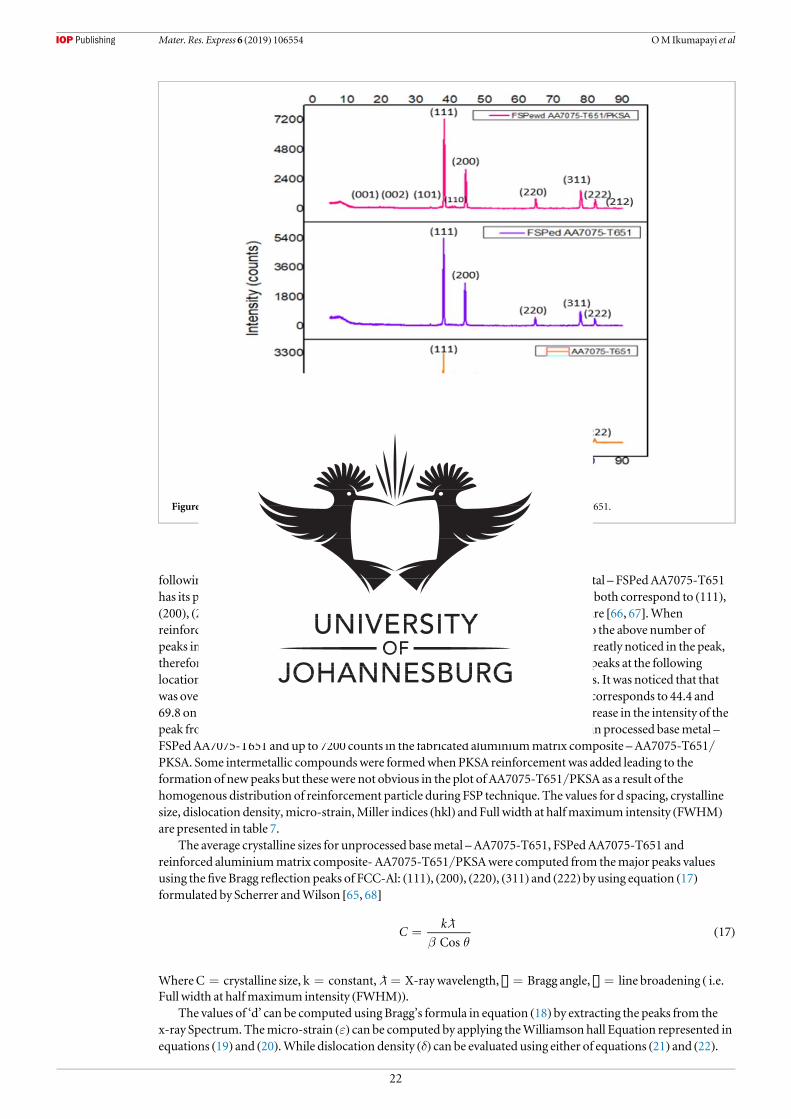
following positions of 2: 38.1, 44.3, 64.4, 77.4, and 81.5while the processed basemetal – FSPedAA7075-T651has its peaks at the following positions of 2: 38.2, 44.4, 64.7, 77.7, and 81.9 inwhich, both correspond to (111),(200), (220), (311) and (222)which is in agreementwith someworks found in literature [66, 67].Whenreinforcedwith PKSA, the number of peakswere seen to have increased in addition to the above number ofpeaks in the basemetal. The influence of PKSA reinforcement inAA7075-T651was greatly noticed in the peak,therefore, the fabricatedmatrix composite –AA7075-T651/PKSAhas the following peaks at the followinglocation of 2: 38.1, 44.3, 64.5, 77.49, and 81.6which corresponds to basemetal peaks. It was noticed that thatwas overlaps of phases in the fabricated aluminiummetal composites at (200)which corresponds to 44.4 and69.8 on the 2 axis. It was also observed that, at peak (111), there exits progressive increase in the intensity of thepeak fromunprocessed basemetal –AA7075-T651with 3300 counts to 5400 counts in processed basemetal –FSPedAA7075-T651 and up to 7200 counts in the fabricated aluminiummatrix composite –AA7075-T651/PKSA. Some intermetallic compoundswere formedwhen PKSA reinforcement was added leading to theformation of new peaks but thesewere not obvious in the plot of AA7075-T651/PKSA as a result of thehomogenous distribution of reinforcement particle during FSP technique. The values for d spacing, crystallinesize, dislocation density,micro-strain,Miller indices (hkl) and Full width at halfmaximum intensity (FWHM)are presented in table 7.
The average crystalline sizes for unprocessed basemetal –AA7075-T651, FSPedAA7075-T651 andreinforced aluminiummatrix composite- AA7075-T651/PKSAwere computed from themajor peaks valuesusing the five Bragg reflection peaks of FCC-Al: (111), (200), (220), (311) and (222) by using equation (17)formulated by Scherrer andWilson [65, 68]
Ck
Cos17
b q=
( )
WhereC=crystalline size, k=constant,D=X-raywavelength,=Bragg angle, =line broadening ( i.e.Full width at halfmaximum intensity (FWHM)).
The values of ‘d’ can be computed using Bragg’s formula in equation (18) by extracting the peaks from thex-ray Spectrum. Themicro-strain (ε) can be computed by applying theWilliamson hall Equation represented inequations (19) and (20).While dislocation density (δ) can be evaluated using either of equations (21) and (22).
Figure 16.X-ray diffraction for (a) FSPedAA7075-T651/PKSA (b) FSPedAA7075-T651 (c)AA7075-T651.
22
Mater. Res. Express 6 (2019) 106554 OMIkumapayi et al

Table 7.Values of Crystalline size, FWHM, dislocation density, interplanar distance, andmicro-strain.
Samples 2 (°) d spacing (Å) FWHM, (°) Crystallite size, C (nm) Micro strain (ε)×10–2 Dislocation density (δ) (Lines/m2)×1014 hkl
AA7075-T651 38.1 2.36470 0.180 48.7 4.2535 4.2164 111
FSPedAA7075-T651 38.1 2.36456 0.2132 41.2 5.0381 5.8912 111
AA7075-T651/PKSA 38.2 2.35551 0.275 31.9 6.497 9.8269 111
23
Mater.R
es.Express6
(2019)106554OM
Ikumapayietal

nd
2 Sin18=
( )
Where n=1,D=wavelength (D=1.54 Å for CuKα and=Bragg’s angle
cos
419e
b q= ( )
k
Ccos 4 Sin 20b q q= +
⎡⎣⎢
⎤⎦⎥ έ[ ] ( )
Where έ is the rootmean square ofmicro-strain
C
121
2d = ( )
Cb
3 21
2 22
2
dp e
=< >
( )
Where b is the Burgers vector ( b=a/ 2 for FCCStructure and ‘a’ is a lattice parameterTable 7 showsXRD analysis results of the highest broadening of peaks located at 38.1 (2) havingmiller
index of 111 for all investigated samples –AA7075-T651, FSPedAA7075-T651, and FSPedAA7075-T651/PKSA. Scherrer andWilson’s formulawas employed to compute crystallite size whichwas then comparedwiththe extracted fromXRDpeak list. It was found that the unprocessed basemetal –AA7075-T651 has the highestcrystallite size of 48.7 nmwhile the fabricated aluminiummatrix composite reinforcedwith PKSA –AA7075-T651/PKSAhas the lowest values of crystallite size of 31.9 nm. TheMicro-strainwas noticed to be far higher infabricated AMC –AA7075-T651/PKSAwith 6.497while unprocessed basemetal –AA7075-T651 has the lowestvalue ofmicro-strainwith 4.2535. Dislocation density was also higher in the fabricated AMC followed byprocessed basemetal – FSPedAA7075-T651 and the onewith least valuewas unprocessed basemetal –AA7075-T651 as evidence in table 7. The above results are in agreementwith theworks ofmany researchers [65, 68, 69].
4. Conclusion
The conclusions are drawn from surface roughness analysis, tensile behaviour, friction andwear analysis, XRDstructural study and corrosion behaviour of FSPedAA7075-T651/PKSA composite with reference to FSPedAA7075-T651 andAA7075-T651 as the basemetal.
i. Aluminium alloy 7075-T651 reinforced with 5 μm PKSA particles was successfully fabricated with twopasses having 100% interpass overlap
ii. At higher load, flaky and near to zero wear debris was obtained while at lower load, compacted wear debriswas generated
iii. At a higher load of 50 N, wear rate, coefficient of friction, and wear volume was noticed to be smaller invalues for the fabricated FSPedAA7075-T651/PKSA in all instancewhile thewear resistancewas large. Thisimplies that PKSAhas greatly influenced the behaviours of wear.
iv. It was observed that tensile properties for the fabricated FSPed AA7075-T651/PKSA were lower in allmanners when comparedwith FSPedAA7075-T7651 andAA7075-T651 of basemetal. This reduction intensile propertiesmay be attributed to the orientation of cutting of the tensile specimenwhichwas doneacross the nugget zone rather than along the nugget zone.
v. It was established that the crystallite size was lower in the fabricated AA7075-T651/PKSA AMC and higherin unprocessed basemetal- AA7075-T651which dictates that PKSAhas excellently influenced the structurephases and thereby refining the grain size.
vi. It was further established that the use of PKSA has remarkably improved the corrosion protection rate byhaving 91.40%percentage inhibition protection efficiency in the fabricated AA7075-T651/PKSAwhile thatof FSPedAA7075-T651was 63.99%with reference to an unprocessed basemetal –AA7075-T651.
vii. The corrosion rate generated in fabricated AA7075-T651/PKSA was lower, having 0.43574 mm/year asagainst those in FSPedAA7075-T651whichwas 1.829 mm/year and that of unprocessed basemetal of5.0718 mm/year.
24
Mater. Res. Express 6 (2019) 106554 OMIkumapayi et al

viii. It was noticed that fabricated AA7075-T651/PKSA AMC has a lower value of surface roughness (Ra) ofvalue 4.43 μmwhile FSPedAA7075-T651 has 11.61 μmwhich implies that fabricated AA7075-T651/PKSAAMChas a better surface finish, surface topography, and surface integrity.
Acknowledgments
Appreciation goes to theChairman of Friction StirWelding Laboratory, Prof S KPal for the permission grantedto us towork on both the friction stir weldingmachine and surface roughness tester at the Indian Institute ofTechnology (IIT)Kharagpur, India; Also, DrO S I Fayomi, theHead of Surface Engineering ResearchCentre,CovenantUniversity, Ota,Nigeria, where the corrosion tests were carried out; DrOPOladijo and the technicalstaff ofmaterial Lab of Botswana International University of Science and technologywhere thewear tests wereconducted; also to the Technical Staff ofMaterial andMetallurgical Laboratory at theDepartment ofMechanicalEngineering Science, University of Johannesburg, SouthAfrica where the tensile tests were conducted and lastlyto theUniversity of Johannesburg, SouthAfrica for the research trip support to India andBotswana.
Conflict of interest
The authors declared that there is no known conflict of interests.
ORCID iDs
OMIkumapayi https://orcid.org/0000-0002-9217-8476
References
[1] HuangG,HouWand ShenY 2018 Evaluation of themicrostructure andmechanical properties ofWCparticle reinforced aluminummatrix composites fabricated by friction stir processingMater. Charact. 138 26–37
[2] VijayaKumar P,Madhusudhan ReddyG and Srinivasa RaoK 2015Microstructure and pitting corrosion of armor gradeAA7075aluminumalloy friction stir weld nugget zone–effect of post weld heat treatment and addition of boron carbideDef Technol 11 166–73
[3] NavaneethakrishnanT andGanesh P 2015 Effect of welding parameters on friction stir welded dissimilar aluminumalloys 7075 and6082with various tool pin profiles J ChemPharm Sci 2015-April 463–8
[4] Adetunla A andAkinlabi E 2018 Significantly improvedmechanical properties of 1100 aluminium alloy via particle reinforcement 5thInt. Conf. Innov. Sci. Technol. (Barcelona - Spain) p 79–87
[5] Rambabu P, PrasadNE andKutumbaraoVV2017AerospaceMaterials andMaterial Technologies (https://doi.org/10.1007/978-981-10-2143-5)
[6] Fayomi J, Popoola A P I,OladijoOP, PopoolaOMand FayomiO S I 2019 Experimental study of ZrB2-Si3N4 on themicrostructure ,mechanical and electrical properties of high gradeAA8011metalmatrix composites J. Alloys Compd. 790 610–5
[7] Dinaharan I, KalaiselvanK andMuruganN2017 Influence of rice husk ash particles onmicrostructure and tensile behavior of AA6061aluminummatrix composites produced using friction stir processingCompos Commun 3 42–6
[8] OlumuyiwaA J, Isaac T S, AdewunmiOA andOloladeA I 2012 Effects of palmkernel shell on themicrostructure andmechanicalproperties of recycled polyethylene/palmkernel shell particulate composites JMinerMater Charact Eng 11 825–31
[9] Dagwa IM, Builders P F andAchebo J 2012Characterization of palm kernel shell powder for use in polymermatrix composites Int JMechMechatronics Eng 12 88–93
[10] Adetunla A andAkinlabi E 2019 Influence of reinforcements in friction stir processedmagnesium alloys: insight inmedicalapplicationsMater. Res. Express 6 1–11
[11] Fono-TamoR S andKoyaOA2017 Influence of palm kernel shell particle size on fade and recovery behaviour of non-asbestos organicfrictionmaterialProcediaManuf 7 440–51
[12] Fono-TamoR S, IdowuOOandKoya FO2014Development of pulverized palmkernel shells based particleboard Int JMaterMechEng 3 54
[13] IkumapayiOMandAkinlabi E T 2018Composition, characteristics and socioeconomic benefits of palm kernel shell exploitation-anoverview J. Environ. Sci. Technol. 11 1–13
[14] Mishra R S andMaZY 2005 Friction stir welding and processingMater Sci Eng RReports 50 1–78[15] Mishra R S,De P S andKumarN2014 Friction StirWelding and Processing 259–96[16] Gerlich AP 2017Critical assessment 25: friction stir processing, potential and problems critical assessmentMater. Sci. Technol. 33
1139–44[17] Dinaharan I 2016 Influence of ceramic particulate type onmicrostructure and tensile strength of aluminummatrix composites
produced using friction stir processing J AsianCeram Soc 4 209–18[18] Sanusi KO andAkinlabi E T 2017 Friction-stir processing of a composite aluminium alloy (AA1050) reinforcedwith titanium carbide
powderMater Tehnol 51 427–35[19] FatchurrohmanN, FarhanaN andMarini CD2018 Investigation on the effect of friction stir processing parameters onmicro-
structure andmicro-hardness of rice husk ash reinforced Al6061metalmatrix composites IOPConf. Ser.:Mater. Sci. Eng. 319 0–6[20] GanYX, SolomonD andReinboltM2010 Friction stir processing of particle reinforced compositematerialsMaterials (Basel) 3 329–50[21] RefatM et al 2016Microstructure, hardness and impact toughness of heat-treated nanodispersed surface and friction stir-processed
aluminumalloy AA7075 J.Mater. Eng. Perform. 25 5087–101
25
Mater. Res. Express 6 (2019) 106554 OMIkumapayi et al

[22] Gholami S, Emadoddin E, TajallyM andBorhani E 2015 Friction stir processing of 7075Al alloy and subsequent aging treatmentTransNonferrousMet Soc China (English Ed 25 2847–55
[23] NavaserM andAtapourM2017 Effect of friction stir processing on pitting corrosion and intergranular attack of 7075 aluminum alloyJ.Mater. Sci. Technol. 33 155–65
[24] IkumapayiOMandAkinlabi E T 2019Experimental data on surface roughness and force feedback analysis in friction stir processedAA7075-T651 aluminiummetal compositesData Br 23 103710
[25] Adetunla A andAkinlabi E 2018Mechanical characterization of Al/Ti-6Al-4V surface composite fabricated via FSP: a comparison oftool geometry and number of passes keywordsMater. Res. Express 5 1–13
[26] Joyson S, IsaacA, Jebaraj D, RajaD, Esther S andAkinlabi T 2018Microstructural characterization and tensile behavior of rutile (TiO2)-microstructural characterization and tensile behavior of rutile (TiO2) - reinforced AA6063 aluminummatrix composites prepared byfriction stir processingActaMetall Sin (English Lett 1–12
[27] MahtoRP,Kumar R, Pal SK and Panda SK2018A comprehensive study on force, temperature,mechanical properties andmicro-structural characterizations in friction stir lapwelding of dissimilarmaterials (AA6061-T6&AISI304) JManuf Process 31 624–39
[28] MahtoRP, Bhoje R, Pal SK, JoshiH S andDas S 2016A study onmechanical properties in friction stir lapwelding of AA 6061-T6 andAISI 304Mater. Sci. Eng. A 652 136–44
[29] IkumapayiOM,Akinlabi E T andMajumdar JD 2018Review on thermal, thermo-mechanical and thermal stress distribution duringfriction stir welding Int JMech Eng Technol 9 534–48
[30] IkumapayiOM,Okokpujie I P, Afolalu SA, AjayiOO,Akilabi E T andBodundeOP 2018 Effects of quenchants on impact strength ofsingle-vee butt welded joint ofmild steel IOPConf. Ser.:Mater. Sci. Eng. 391 1–10
[31] RoyRB et al 2018Weld defect identification in friction stir welding through optimizedwavelet transformation of signals and validationthrough x-raymicro-CT scan Int. J. Adv.Manuf. Technol. 391 1–11
[32] Afolalu S A, Abioye AA,UdoMO,Adetunji OR, IkumapayiOMandAdejuyigbe S B 2018Data showing the effects of temperature andtime variances on nano-additives treatment ofmild steel duringmachiningData Br 19 456–61
[33] BordoK,GudlaVC, Peguet L, AfsethA andAmbat R 2018Electrochemical profiling ofmulti-clad aluminium sheets used inautomotive heat exchangersCorros. Sci. 131 28–37
[34] DinRU,Gudla VC, JellesenMS andAmbat R 2016Microstructure and corrosion performance of steam-based conversion coatingsproduced in the presence of TiO2 particles on aluminium alloys Surf. Coat. Technol. 296 1–12
[35] Akande I G,OluwoleOO and FayomiOS I 2018Optimizing the defensive characteristics ofmild steel via the electrodeposition ofZn–Si3N4 reinforcing particlesDef Technol 1–7
[36] FayomiOS I andAkande I G 2019Corrosionmitigation of aluminium in 3. 65%NaClmediumusing hexamine J Bio-Tribo-Corrosion5 0
[37] FayomiOS I 2018 Popoola IGAAPI. corrosion protection effect of chitosan on the performance characteristics of A6063Alloy J Bio-Tribo-Corrosion 4 1–6
[38] GerengiH, SolomonMM,Bagci F E andAbai E J 2018An evaluation of the anticorrosion effect of ethylene glycol for AA7075-T6 alloyin 3. 5%NaCl solutionMeasurement 116 264–72
[39] ErinoshoMF et al 2017 Laser surfacemodification of Ti6Al4V-Cu for improvedmicrohardness andwear resistance propertiesMater.Res. 20 1143–52
[40] Okokpujie I P et al 2018Modeling and optimization of surface roughness in endmilling of aluminiumusing least squareapproximationmethod and response surfacemethodology Int JMech Eng Technol 9 587–600
[41] HartmannM, BöhmS and Schüddekopf S 2014 Influence of surface roughness of tools on the friction stir welding process JWeld Join32 12
[42] IkumapayiOMandAkinlabi E T 2019Efficacy ofα- grade Titanium alloy powder (Ti-6Al-2Sn-2Zr-2Mo-2Cr- 0. 25Si) in surfacemodification and corrosionmitigation in 3. 5%NaCl on friction stir processed armour grade 7075-T651 aluminumalloys – insight indefence applicationsMater. Res. 6 1–20
[43] Bayazid SM, FarhangiH, AsgharzadehH, Radan L,Ghahramani A andMirhaji A 2016Effect of cyclic solution treatment onmicrostructure andmechanical properties of friction stir welded 7075Al alloyMater. Sci. Eng. A 649 293–300
[44] Ikumapayi OMandAkinlabi E T 2019A comparative assessment of tensile strength and corrosion protection in friction stir processedAA7075-T651matrix composites using fly ashes nanoparticles as reinforcement inhibitors in 3.5%NaCl Int JMech Prod Eng ResDeveleopment 9 839–54
[45] LiH, Chen P,Wang Z, Zhu F, Song R andZheng Z 2019ATensile properties ,microstructures and fracture behaviors of anAl–Zn–Mg–Cu alloy during ageing after solution treating and cold-rollingMater. Sci. Eng. A 742 798–812
[46] HaoZ, FuX,MenX andZhouB 2019 Study on tensile and fracture properties of 7050-T7451 aluminumalloy based onmaterialforming texture characteristicsMater. Res. Express 6 1–10
[47] ManthaD and Fawaz S A 2014 Standardized testmethod for corrosion pit-to-fatigue crack transition for AA7075-T651 aluminumalloyAdv.Mater. Res. 891–892 205–10
[48] AbolusoroOP andAkinlabi E T 2019Wear and corrosion behaviour of friction stir welded aluminium alloys-an overview Int JMechProd EngRes Dev 9 967–82
[49] RaguramanD,MuruganandamDandDhas LKK2014Corrosion study in friction stir welded plates of AA6061 andAA7075 Int JChemTechRes 6 2577–82
[50] Abbass PMK, Prof A, Anaee RA and Jabar EMM2016Corrosion behavior of friction stir welded of similar and dissimilar Al2024-T3andAl7075-T73 alloys Int J Ser Eng Sci 2 13–27
[51] ZhangC,HuangG, CaoY,WuX,HuangX and LiuQ 2019Optimization of tensile and corrosion properties of dissimilar friction stirweldedAA2024-7075 joints J.Mater. Eng. Perform. 28 183–99
[52] ElODL,HamedGOandEl S J A 2019Anticorrosive formulation based of the epoxy resin – polyaminoamide containing zincphosphate inhibitive pigment applied on sulfo- tartaric anodizedAA7075-T6 inNaClmedium J Bio- Tribo-Corrosion 5 1–9
[53] Giovanni G, Zaffaroni B, Gudla VC,Din RU andAmbat R 2019Characterization of blisters on powder coated aluminiumAA5006architectural profilesEng. Fail. Anal. 103 347–60
[54] Bhaskar KV, Sundarrajan S, Rao B S andRavindra K 2018 Effect of reinforcement andwear parameters on dry slidingwear ofaluminumcomposites-a reviewMater Today Proc 5 5891–900
[55] Deuis R L, SubramanianC andYellup JM1997 Slidingwear of aluminium composites-a reviewCompos. Sci. Technol. 3538 415–35[56] SudhakarD, JeyasimmanD andDuraiselvamM2015Dry slidingwear behavior of Cr3 C2-NiCr coating on austenitic stainless steel Int J
Core EngManag 1 215–25
26
Mater. Res. Express 6 (2019) 106554 OMIkumapayi et al

[57] BaruwaAD,OladijoOP,Maledi N andAkinlabi E T 2018 Influence of surface Treatment on dry slidingwear behavior of hydrophobicsilane coating onAISI 304 IOPConf. Ser.:Mater. Sci. Eng. 423 012158
[58] Kumar P andWaniMF2017 Friction andWear Behaviour ofHypereutectic Al–Si alloy/Steel Tribopair Under Dry and LubricatedConditions 15 21–49
[59] JeyaprakashN, YangC,DuraiselvamMandPrabuG 2019Microstructure and tribological evolution during laser alloyingWC-12%CoandCr3C2−25%NiCr powders on nodular iron surfaceResults Phys 12 1610–20
[60] BaradeswaranA and Perumal A E 2014Wear andmechanical characteristics of Al 7075/graphite compositesCompos Part B 56 472–6[61] Phiri RR,OladijoOP,Maledi N andAkinlabi E T 2018Effect of coating thickness onwear performance of inconel 625 coating IOP
Conf. Ser.:Mater. Sci. Eng. 423 1–5[62] ChakravarthyGV,ChandranM, Bhattacharya S S, RaoMSR andKamarajM2012A comparative study onwear behavior of TiN and
diamond coatedWC–Co substrates against hypereutectic Al–Si alloysAppl. Surf. Sci. 261 520–7[63] PrasadR, Tewari S P and Singh J K 2019Microstructural andwear characterization of friction stir processed ZrB2/AA7075 in-situ
compositesMater. Res. Express 6 086514[64] IrfanM,HaqU andAnandA 2018Dry sliding friction andwear behavior of AA7075-Si3N4 composite Silicon 10 1819–29[65] PandeyV, Singh J K, Chattopadhyay K, SrinivasNC S and SinghV 2017 Influence of ultrasonic shot peening on corrosion behavior of
7075 aluminumalloy J. Alloys Compd. 723 826–40[66] Sivanesh PrabhuM, Elaya Perumal A, Arulvel S and Franklin Issac R 2019 Friction andwearmeasurements of friction stir processed
aluminium alloy 6082/CaCO3 compositeMeas J IntMeas Confed 142 10–20[67] Liu R,WuC, Zhang J, LuoG, ShenQ andZhang L 2018Microstructure andmechanical behaviors of the ultrafine grainedAA7075/
B4C composites synthesized via one-step consolidation J. Alloys Compd. 748 737–44[68] Offor PO,Okorie BA, Ezema F I, AigbodionV S andDaniel-mkpumeCC2015 Synthesis and characterization of nanocrystalline zinc
sulphide thin fi lms by chemical spray pyrolysis J. Alloys Compd. 650 381–5[69] Sanj R, Sathiskumar R, KumarKG, Jerome S and Jebaraj AV 2019 Friction based joining process for high strength aerospace
aluminium alloyMater. Res. Express 6 1–12
27
Mater. Res. Express 6 (2019) 106554 OMIkumapayi et al

31
2.5 ARTICLE IV
The influence of Carbonaceous Agrowaste Nanoparticles on the Physical and
Mechanical Properties of the Friction Stir Processed AA7075-T651 Metal
Matrix Composites
Published in Surface topography: metrology and properties, 2019,
Vol 7, Number 3, Page: 1- 17 DOI: https://doi.org/10.1088/2051-672X/ab3aae
ISSN: 2051-672X
This published paper assessed the potency of the application of carbonaceous agrowaste powders,
such as cow-bone ash (CBA), coconut shell ash (CSA), wood fly ash (WFA), palm kernel shell
ash (PKSA) and coal fly ash (CFA) on the aluminium alloy AA7075-T651 for tensile properties
and their fractography, as well as their surface integrity. The developed agrowaste powders were
characterized by using the scanning electron microscopy (SEM) for morphological examination;
and the Energy Dispersive X-ray Spectrometer (EDXS) was used for the elemental composition
assessment; while X-Ray Fluorescence (XRF) was used for the analysis of the chemical
compositions; and the results were presented in the published article.
The developed agrowaste powders were calcined at 500 °C for two hours based on similar heat
treatment available in the literatures for homogeneity, and in order to remove any impurity or
foreign materials that may have been trapped therein. It was established that the unprocessed-base
metal (UBM) performed better than any of the reinforced metal matrix composites (MMC), as
regards the tensile properties. Among the reinforced MMC, the one reinforced with coconut-shell
ash (CSA) had the highest tensile strength of 379 MPa UTS, followed by wood-fly ash (WFA) and
coal-fly ash (CFA), in which both had 367 MPa; while the UBM had 620 MPa. Nevertheless, the

32
roughness surface produced from the carbonaceous agrowastes gave the best surface integrity. It
was noticed that after carbonization, the WFA overall produced the best surface roughness, by
having 1.60 µm; this was followed by the nano-composites formed by CBA; while the processed
base metal (PBM), without any reinforcement, produced the highest value of surface roughness
with a value of 11.83 µm, thereby indicating that this value was the roughest among them. From
the above analogue, it may be concluded that agrowaste nanoparticles influenced the mechanical
and the physical properties in terms of the tensile examination and the surface-integrity
assessment.
It is essential to mention that most of the fractured surface areas of the nanocomposites were
dominated by the dimple-induced transgranular structure, thereby agreeing with the remarkable
interfacial bonding, with the aluminium matrix composites, and the mode of failure. These facts
were also captured by the SEM fractographic assessment, as presented and discussed. This
published article has been able to address some of the objectives of the study especially those in
item I, III to V.

Surface Topography: Metrology and Properties
PAPER
Influence of carbonaceous agrowastes nanoparticles on physical andMechanical properties of friction stir processed AA7075-T651 metalmatrix compositesTo cite this article: O M Ikumapayi et al 2019 Surf. Topogr.: Metrol. Prop. 7 035013
View the article online for updates and enhancements.
This content was downloaded from IP address 152.106.6.250 on 06/09/2019 at 10:35

Surf. Topogr.:Metrol. Prop. 7 (2019) 035013 https://doi.org/10.1088/2051-672X/ab3aae
PAPER
Influence of carbonaceous agrowastes nanoparticles on physicalandMechanical properties of friction stir processed AA7075-T651metal matrix composites
OMIkumapayi1 , E TAkinlabi1,2 and JDMajumdar3
1 Department ofMechanical Engineering Science, University of Johannesburg, Auckland, ParkKingswayCampus, Johannesburg, 2006,SouthAfrica
2 Department ofMechanical Engineering, CovenantUniversity, Ota,Nigeria3 Department ofMetallurgical andMaterials Engineering, Indian Institute of Technology, Kharagpur, India
E-mail: [email protected]
Keywords: aluminium alloy, agrowastes, friction stir processing, fracture, nanoparticles, tensile strength, surface roughness
AbstractFriction Stir Processing (FSP) is amode of surface enhancement used to improve the properties andthe surface quality of the fabricated samples. Themain focus of this researchwas tomake acomparative performance assessment using economical and eco-friendly carbonaceous agro-wastesnanoparticle as reinforcement in AA7075-T651 during FSP and to determine the surface roughnessand the tensile strength of the produced samples. Nanoparticles ofWood fly ash (WFA), coconut shellash (CSA), coalfly ash (CFA), palm kernel shell ash (PKSA) and cowbone ash (CBA)were developed.The processing parameters used on the FSPmachinewere rotational speed of 1500 rpm,20mmmin−1 processing speed, 3° tilt angle, and 0.3mmplunge depth. The physical and themechanical properties of the fabricated samples were studied. Results revealed thatmetalmatrixcomposites (MMC) reinforcedwithWFA-NPs has the best surface integrity with the least Ra of1.60 μm, followed byAA7075-T651/CBA-NPswith Ra value of 2.81 μmwhile unreinforced butprocessed basemetal (UBM)- AA7075-T651was the roughest with Ra value of 11.61 μm. It wasfurther observed thatUBMproduced the highest ultimate tensile strength (UTS), Rmwith a value of620.9MPa, and this also produced the highest yield strength at 0.1%, 0.2% and 0.5%off strain giventhe following values 599.1, 572.9 and 588.5MPa respectively. Amongst the fabricatedMMC, the onereinforcedwith carbonaceous CSA-NPs produced the highestUTS, Rmwith 379.9MPawhile therewas tie values inUTS, Rm forWFA-NPs andCFA-NPswhichwas 367.8MPa andAA7075-T61/CBA-NPs gave the least value ofUTS, Rmwith a value 298.1MPa.Most of the fractured surface areas of thenanocomposites are dominated by the dimples-induced transgranular agreeing with the remarkableinterfacial bondingwith the aluminiummatrix composites.
1. Introduction
Armour grade, high strength aluminium 7075-T651alloy is one of the promising heat treatable commercialrolled sheet metals which has gained debut entranceinto structural applications in defensive areas such asautomotive, aircraft, military, marine, aviation, air-frame, jet engine, space and air vehicles due to itsunbeatable and excellent properties such ashigh spe-cific strength, high fatigue strength, superior dampingcapacities, creep resistance, high wear resistance, lowdensity and high formability [1–5]. Nevertheless, the
application of aluminium alloy in marine environ-ments exhibits poor corrosion performance in itsentity. It worth mentioning that lightweight materialsoffered a competitive advantage over conventionalsteel due to its low density and high specific strength[6, 7]. There is every possibility that in near future,steel might totally be replaced with low densityandhigh strength non-ferrous alloys materials liketitanium, aluminium and magnesium alloys in aero-space, defense, automobiles, and transportation sec-tors. In light of this, aluminium might be the one thatwill likely replace steel in these sectors because
RECEIVED
5April 2019
REVISED
15 July 2019
ACCEPTED FOR PUBLICATION
13August 2019
PUBLISHED
6 September 2019
© 2019 IOPPublishing Ltd

titanium is expensive while magnesium is self-explosive [8]. FSP is an excellent, promising and anovel materials processing techniques [9, 10] derivedfrom Friction Stir Welding (FSW) whereby a groove(microchannel) that will house the second phase(reinforcement particles) may be created or may notbe created on the substrate [11, 12]. FSP has been usedwidely in many industries today to modify themechanical properties and surface integrity of theworkpiece. It is facile and economical, update andcost-effectiveto using FSP in the preparation ofaluminium metal matrix composites [13, 14]. Lots ofbenefits attributed to the used of FSP amongst whichare the homogeneity of the processed zone, homo-genization of precipitates, grain refinement, densifica-tion of aluminium alloys and composites materials[15]. FSP is a new technology for surface propertiesimprovement of the alloy metals, hardness, ductility,formability improvements and also to enhance thestrength of the metal and elongate the fatigue lifewithout any alteration to the properties of the bulkmetal [16]. FSP has been employed for several applica-tions ranging from rectification of defects in casting,homogenization ofmaterials, grain refinement, super-plastic forming as well as surface modification [10].This new and promising technology can be used tomodify casting of alloy, increase the fatigue strength ofthe processed substrate, modify the chemical compo-sitions of the surface layer, susceptibility to plasticdeformation can be increased and also fabricating newalloys with special properties, as well as achieving thestate of over-plasticity [17]. FSP has been usedextensively used for modification of surface partsespecially in aerospace, automation, and railway forthe fabrication of load-bearing components due to itsenvironmental friendliness and high efficiency [18].Many researchers have carried out the various tests ontensile behaviours of aluminium alloy 7075 usingdifferent reinforcement particle to confirm the efficacyof the fabricated samples under tensile loading[19–22]. It is worth mentioning thatscanty works havebeen reported on the use of eco-friendly agro-wasteparticles. Nevertheless, lots of works have beenreported with metallic power reinforcement, Influ-ence of SiC nanoparticle was investigated on the tensilestrength of AA7075 with 20% of SiC powder asreinforcement particle was used. In this study, FSWwas carried out with 1250 rpm rotational speed and40 mmmin−1 welding speed. It was revealed that theaddition of SiC improves the surface and enhancedductility of thematerial compare to basematerial [23].Surface composite of aluminium alloy AA7075-T651reinforced with silicon carbide (SiC) was fabricatedwith FSP. It was revealed that the fabricated sampleshave higher microhardness when compared with thebase metal and the maximum hardness of 211 HVwasachieved at 1460 rpm rotational speed while the travelspeed of 60 mmmin−1 [24]. Armour grade highstrength aluminium alloy AA7075-T651 was friction
stir processed using different reinforcement particlesand the surface integrity of the fabricated samples wasinvestigated using surface roughness analysis. Theparameters used were rotational speed of step 300 rpmstarting with 1200 rpm, 1500 rpm and 1800 rpmwhilethe processing speed usedwas 20 mmmin−1 [25].
Fewer researchers have worked on the use of someagrowastes particles for reinforcement during FSPvarying from rice husk ash (RHA), coal fly ash (CFA),wood fly ash (WFA), palm kernel shell ash (PKSA),coconut shell ash (CSA) to mention but a few. Dina-hara et al [26] investigated the efficacy of rice husk ash(RHA) on aluminiummetal matrix composites duringFSP. The study shows that, addition of RHA greatlyimproved tensile properties and an outstanding inter-facial bondingwithAMCwas achieved.
Kumar et al [27] utilized fly ash to reinforce copperbased alloy to form matrix composite via FSP. Effectsof wear, tensile, corrosion and structural analyses wereexamined. It was noted that the wear and corrosionperformances when fly ash was added were improvedsignificantly, tensile and hardness properties were alsosaid to have improved. Likewise, corrosion and oxida-tion resistance were also enhanced by the addition offly ash. Other researchers that have used fly ash as rein-forcement duringmetal matrices composites develop-ment and FSP with outstanding performance inharness, strength, wear and corrosion behaviours[28–33]
Adetunla and Akinlabi [34] investigated thepotency of PKSA, Fly Ash, Titanium alloy powder (Ti-6Al-4V) and stainless steel alloy powder (304 s) asreinforcement on the magnesium alloy AZ31 metalmatrix composite fabricated via FSP to be used inmedical applications. The findings show that samplesreinforced with 304 s has the best ductile properties,followed by Ti-6Al-4V, then fly ash and lastly PKSA.The elongation and tensile strength when reinforcedwith Ti-6Al-4V and PKSA were very closed with thevalues 70.47% and 70.34% respectively for elongationwhile 305.54 MPa and 281.71MPa respectively fortensile strength. The findings further show that corro-sion rate when reinforced with fly ash and PKSA were0.2421 mm/year and 0.2696 mm/year which are farbetter than when reinforced with Ti-6Al-4V of0.4771 mm/year. The above particles were alsoexperimented on aluminium alloy AA1100 by thesame authors. It was revealed that samples reinforcedwith 304 s has the highest hardness values of 95.23HV,followed by Ti-6222 with 77.56 HV and then by PKSAwith 75.3HV and lastly by fly ashwith 62.14 HV [35].
Raju and Rao [36] assessed wear properties on alu-minium metal matrix composite (AMMC) usingcoconut shell ash (CSA). It was confirmed that addi-tion of CSA has tremendously reduced the wear ratefrom 4.887 mm3 N−1 m−1 to 1.830 mm3 N−1 m−1. Itwas noted that coefficient of friction reduced and wearresistance increased with the addition of CSA. Agun-loye et al [37] has established the efficacy of coconut
2
Surf. Topogr.:Metrol. Prop. 7 (2019) 035013 OMIkumapayi et al

shell particle reinforcement in polymer matrix com-posite, it was noted that addition of coconut shell par-ticles enhanced the hardness, modulus of elasticity,absorption rate and tensile properties. Similar estab-lishment was reported by Salleh et al [38], in this work,addition of coconut shell ash (CSA) greatly improvedboth the tensile and impact behaviours of the epoxyresin experimented. Coconut shell particles have alsobeen used for metal matrix composites with improvedhardness, tensile strength and with better structuralintegrity [39, 40].
The focus of this present study is to make a com-parative assessment on the mechanical and physicalproperties of armour grade, high strength aluminiumalloy 7075-T651 at different calcined agro-wastes rein-forcement particles.
2. Experimental design,materials andmethods
2.1.MaterialsIn this data analysis, the base material used forexperimental data acquisition was Aluminium AlloyAA7075-T651 of dimensions 300×125×6 mm3
with a chemical compositions of Al (88.93%), Zn(5.92%), Si (0.05%), Fe (0.15%), Cu (1.93%), Mn(0.01%), Cr (0.193%), Ti (0.02%) and Mg (2.8%) anditsmechanical properties as received are shear strength(330MPa), Brinell Hardness (150), Fatigue strength(160Mpa), Poisson’s Ratio (0.32), Shear Modulus(26 GPa) while Elastic Modulus, Ultimate tensilestrength (UTS) and Yield Strength are 70 GPa,570MPa, and 500MPa respectively. The materialsused for the reinforcement during the FSP are woodfly ash nanoparticle (WFA-NPs) [41], coal fly ashnanoparticle (CFA-NPs) [29, 42], cow boneash nanoparticles (CBA-NPs) [43], Coconut shell AshNanoparticles (CSA-NPs) [44, 45] and palm kernelshell ash nanoparticles (PKSA-NPs) [46]. All thepowders undergone carbonization and calcinationprocess before using them as reinforcement duringFSP process, this is to induce thermal stability, phasetransition, thermal decomposition as well as removalof a volatile fraction from the material before using.This is done to improve the strength, texture, andthermal stability. The presented data also comparedthe chemical and elemental compositions of theselected agro-wastes and juxtaposed them as shown intables 1 and 2. Comparative performance assessment
Table 1.Variability in the Chemical Compositions of the SelectedAgrowastes Powders.
Chemical Composition (%) PKSA-NPs CSA-NPs CBA-NPs CFA-NPs WFA-NPs
CaO 4.786 0.78 45.06 6.75 3.002
SiO2 46.23 45.6 0.08 51.43 46.31
MgO 0.667 19.4 0.65 1.95 0.36
TiO2 0.218 — 0.06 1.74 0.933
Fe2O3 31.013 8.98 0.25 2.29 17.28
SO3 2.257 — — 0.54 3.423
Al2O3 4.921 16.76 0.16 30.93 10.7
MnO — 0.17 0.01 0.02 —
MnO2 0.088 — — — 0.047
Na2O 1.32 0.41 0.17 0.54 2.48
P2O5 2.4481 — 34.60 — 0.113
P2O3 — — — 1.08 —
K2O 4.254 0.42 0.12 0.77 2.53
Cr2O3 0.267 — — 0.77 —
ZnO — 0.39 0.02 — —
LOI — — 16.28 1.21 8.00
Table 2. Summary of the Elemental Compositions of the Selected Agrowastes Powders.
Elemental Composition (%) PKSA-NPs CSA-NPs CBA-NPs CFA-NPs WFA-NPs
Si 0.9 12.8 5.0 50.7 22.4
Al 0.2 1.9 1.5 29.2 14.8
Ca 0.1 8.8 84.9 9.9 3.7
Fe 0.2 6.2 1.8 4.6 3.3
K 0.1 39.2 3.8 — —
Ti — — — 2.6 0.9
Mg — 3.0 3.0 2.9 1.0
C 64.4 — — — —
O 34.1 — — — —
P — 2.2 — — —
Na — 4.3 — — —
3
Surf. Topogr.:Metrol. Prop. 7 (2019) 035013 OMIkumapayi et al

data for tensile behaviourson the Unprocessed, Pro-cessed and reinforced AA7075-T651 is also presentedin table 3.
2.2. Friction stir processingmethodology(FSP) of aluminium alloy AA7075-T651 was carriedout on a 2 tons linear Numerical controlled (LNC)friction stir welding machine (FSW-M) which wasmanufactured by ETA Bangalore, India Ltd as shownin figure 1(a), and there is a load cell that isincorporated on FSW-M which is responsible fortaking the forces along the Z-axis direction. Theinterface of the LNC-FSW-M is integrated with Lab-View software features capable for real-time dataacquisition. The processing set up indicating theprocessed zone, the reinforcement in the microchan-nel is as shown in figure 1(b) while the 3-dimensionalmodel for operational procedures is shown infigure 1(c). The placement of pressure plate as shownin figure 1(c) on the workpiece was to enable rigidclamping and at the same time proper and rigorousstirring for effective mixing of the materials throughthe tool pin penetration and the interaction of theshoulder with the workpiece via the tool translationaland rotational [47, 48]. The calculation for thefractional volume, the area of the groove and theprojected area of the tool pin is as shown inequations (1) to (3) [49]. Excellent surfaces wereachieved on the processed plate due to differentiallyselected processing parameters.
Volume of FractionArea of groove
Projected Area of tool pin
1001
=
´( )
Area of the groove Groove width Goove depth
2
= ´( )
Projected Area of the tool pin Pin diameter
Pin length 3
=´ ( )
The Labview software that was integrated into LNC-FSW-M was embedded with an inbuilt piezo-electricdynamometer device to record the forces along theZdirectionwhich can be seen on the screen offigure 1(a).This axial load is a force that affects the structural comp-onent of the machine as well as the tool geometry of thecutting tool during FSP. The axial force recorded dependson the processing parameters used during the operationwhich are rotational speed and processing speed [50, 51].It is pertinent to mention that there are three stagesinvolved during FSP, these are, plunging, dwelling andtraversing [52] as depicted in figure 2. In the Plungingprocess, when the toolmakes contact with theworkpiece,it penetrated into the workpiece (substrate) until there isan interaction between the workpiece and the toolshoulder diameter, there and then a peak load (force) isobserved and at this stage, the plunging is said to be com-pleted. The next stage is the dwelling stage in which thereis a very minute dwell time, at this stage processing toolrotates at a spot to allow for interaction of the tool and theworkpiece which resulted to heating effects as a result ofthe frictional force of the shoulder interacting with
Table 3. Friction Stir Processing Parameters (Variable andConstant).
S/N PROCESS PARAMETER VALUE
1 Processing Configuration PositionControlled
2 Processing Speed (mm min−1)—Pinless (Probeless) 100
3 Processing Speed (mm min−1)—tool with Pin 20
4 Rotational Speed (rpm)—Toolwith Pin 1500
5 Rotational Speed (rpm)—Pinless (Probeless) 1000
6 Plunge Rate (mm min−1) 30
7 Tool Tilt Angle (°) 3
8 Pass (no) 2
9 Tool Penetration (Plunge)Depth (mm) 0.3
TOOLDESIGN
1 Tool Pin Profile (Shape), Outer Surface Cylindrical
2 ToolMaterial H13Hot-working tool steel
3 Tool Pin Profile (Shape), End Surface tapered
4 Tool Pin Length (mm) 5
5 Tool ShoulderDiameter (mm) 18
6 Tool PinDiameter (mm) 5
GROOVEDESIGN
1 PlateDimensions (mm3) 300×125×62 GrooveWidth (mm) 2
3 GrooveDepth (mm) 3.5
4 Groove Length (mm) 280
4
Surf. Topogr.:Metrol. Prop. 7 (2019) 035013 OMIkumapayi et al

workpiece and this heat led to the softening of the work-piece and at the stage, it was observed that the peak of theaxial load decreased by 40%. At the traversing stage, thereis a relative linearmovement of the tool on theworkpiecealong the rotation of the tool and there exists a steadyvalue for the axial load asdepicted infigure2.
2.3. Process parametersIn this present research work, the process parametersthat were engaged are 1500 rpm of rotational speed,
20mmmin−1 of processing speed, plunge depth of0.3mmand the distributionwas carried in the followingmanner, first pass has 0.2mm plunge depth whilesecondpass had 0.1 mmplungedepth, the tilt angle usedwas 3°, double passes were achieved in all the processedsamples. The summary of process parameters engagedduring FSP of this work is as presented in table 3. Thegroove was machined on the plates using a horizontalmilling machine and the dimensions of the groove are2.0mmwidth and 3.5 mmdepth on the 6mmthickness
Figure 1. (a)NC-controlledFSWmachineused (b)Processing Set -Up. (c)Schematic 3Dmodel of FSP. (d)Pinless tool (e)Toolwithpin.
Figure 2. FSP feedback diagram showing (a)Plunging (b)Dwelling and (c)Traversing Stages.
5
Surf. Topogr.:Metrol. Prop. 7 (2019) 035013 OMIkumapayi et al

plate. Two different processing tools were used in thisresearchwork, the 18mmdiameter pinless toolwhich isdepicted in figure 1(d), was used to seal up the openingof the groove by compartment process. While this isdone, the tool with a pin (see figure 1(e))made of AISIH13 tool steel of shoulder diameter 18mm, pindiameter 5mm and pin length of 5mm with 10° taperwas then employed for stirring andmixing.
2.4. Characterizations of agro-wastes powdersdevelopedThe morphological characterizations of the agro-wastes powders used were carried out with the aid of
TESCAN model, type VEGA 3 lMH ScanningElectron Microscopy (SEM) coupled with EnergyDispersive x-ray Spectrometer (EDXS), the SEMImage that was captured are displayed in figure 3.X-Ray Fluorescence (XRF) analyses of the selectedagro-based reinforcement particles were also exam-ined and the data acquired is displayed in table 1while the EDXS data acquired by the use of SEMMachine is also presented in table 2. The SEM Imagescapturing were carried out before the calcinationprocess to ascertain the chemical and elementalcompositions present in each agro-waste powderbefore applying them as reinforcement.
Figure 3. (a): SEM Images of PKSA-NPs and its EDS. (b): SEM Images of CSA-NPs and its EDS. (c): SEM Images of CBA-NPs and itsEDS. (d): SEM Images of CFA-NPs and its EDS. (e): SEM Images ofWFA-NPs.
6
Surf. Topogr.:Metrol. Prop. 7 (2019) 035013 OMIkumapayi et al

2.5. Carbonaceous process of agrowastesnanoparticlesCalcination or carbonization or carbonaceous processis simply mean the method of pyrolysis or heating asubstance with a controlled temperature and con-trolled environment, i.e. thermal treatment process ofmaterial in the absence or limited supply of air in orderto induce thermal stability, phase transition, thermaldecomposition as well as removal of a volatile fractionfrom the material before using. This is done toimprove the strength, texture, thermal stability, etc.The milled Agrowastes nanoparticles cannot beapplied directly as reinforcement to the workpiece thatwill be processed without first of all conditioned to astable temperature to remove the impurities andcontaminants that may be trapped within. On thisnote, the processed powders were first undergonecalcination, which is, conditioning process to ensurethermal stability. The calcination of each powder wascarried out by putting each PKSA-NPs, WFA-NPs,CSA-NPs, CBA-NPs, and CFA-NPs in a separate puregraphite crucible and then put them carefully insidethemuffle furnace (See figure 4) set at 500 °C one afterthe other for two (2) hours, after the 2 h the furnacewas put off and the carbonaceous powder was allowedto cool to room temperature inside the furnace beforeit was brought out for use and then further groundwas
performed on each powder to ensure smoothness ofthe carbonaceous powder
2.6. Tensile testingFlat tensile samples of substandard size 100 mm long,6 mm thickness were machined to size by the use ofwaterjet and the tensile samples were experimentedbased on the ASTMB557M-10 specifications [53]. Thetests were performed on the Xforce P type of Zwick/Roell Z250 tensile testing machine in which the set-upis shown in figure 5(a) with a normal force of 250 KNand characteristic of 2 mV/v incorporated with testX-pert II software for data acquisition and the test wascarried out at the ambient temperature. The tests werecarried out at the Material and Metallurgical Labora-tory located at the Department of Mechanical Engi-neering Science, University of Johannesburg, SouthAfrica. Themacrograph of themachined tensile speci-mens is presented in figure 5(b) and the fracturalmacrographs for the tensile samples are also presentedin figure 5(c). The tensile tests were carried out on thefollowing AA7075-T651/WFA-NPs, AA7075-T651/PKSA-NPs, AA7075-T651/CBA-NPs, AA7075-T651/CFA-NPs, AA7075-T651/CSA-NPs, PBM and UBM;the tensile tests were conducted on seven (7)differentspecimens as mentioned above where Base material(Unprocessed) served as control 1 and Base material
Figure 3. (Continued.)
7
Surf. Topogr.:Metrol. Prop. 7 (2019) 035013 OMIkumapayi et al

(processed)without reinforcement served as control 2.The following parametric values were measured andrecorded, Young Modulus (ME), stress-strain curves,the maximum stress value (Rm), the stress at 0.2%offset strain (Rp0.2), the stress at 0.5% offset strain(Rp0.5), the stress at 0.1% offset strain (Rp0.1). Table 4shows the results acquired from the tensile tests. Theschematic diagram for the tensilespecimen is shown infigure 5(d).
2.7. Surface topography analysisSurface roughness as a characteristic effect of surfacetopography which is local deviations from thenormal surface was measured in this study withdifferent carbonaceous agro-wastesnanoparticlessuch as
WFA-NPs, CFA-NPs, PKSA-NPs, CSA-NPs, and CBA-NPs on the aluminium alloy 7075-T651 as reinforcementmatrix composites and also on the processed sample platewithout reinforcement. This was carried out to evaluatethe surface quality and the integrity of the processedsample plates with different reinforcement. Surfaceroughness has proven to be one of the surface reliabilityparameters to evaluate the surfacefinish and texture of theprocessed surface plates by analyzing its surface topogra-phy, hardness test [48], wear and corrosion [54], etc. Inthis present study, the surface topography (roughnesssurface) was investigated using Mitutoyosurf test SJ-210surface roughness tester (SRT) as depicted in figure 6(a),also the macrograph illustrating the measurement pointsis presented in figure 6(b). The measurements were
Figure 4.CalcinationMuffle Furnace set at 500 °C.Macrographs (b) tensile test specimen (c) Fractured specimen (d) tensile testschematic diagram.
Figure 5. (a) Set-up of Zwick/Roell Z250Tensile.
8
Surf. Topogr.:Metrol. Prop. 7 (2019) 035013 OMIkumapayi et al

carried out at three different points on a sample toensure precision of the measurement data at the sametime ensuring coverage of the surface area and then thearithmeticalmean roughness value (Ra)of thepointswererecorded.Theexperimental resultis as shown in table 5.
3. Results and discussions
3.1. Tensile test resultsForcomparative performance assessment and theefficacy of agro-wasteson the tensile strength of amourgrade aluminium alloy AA7075-T651, the followingtensile behaviours parametric properties, YoungMod-ulus (ME), stress-strain curves, the maximum stressvalue (Rm), the stress at 0.2% offset strain (Rp0.2), thestress at 0.5% offset strain (Rp0.5), the stress at 0.1%offset strain (Rp0.1) were evaluated and recorded forthe unprocessed base material, the processed basematerial and a composite matrix of AA7075-T651reinforced with CBA-NPs, CFA-NPs, PKSA-NPs,WFA-NPs, and CSA-NPs. It is worthy of mentioningthat the amount of tensile strength determines theefficacy and the selection of any engineering materialsfor a specific application. On this note, tensile testswere conducted on the unprocessed base material and
processed base material to serve as control experimentat the same time on the produced composite materialsand acquired data arepresented in table 3 andfigures 7(a)–(e) represent strength results at differentagro-wastes reinforcement on the aluminium alloyplates, each of the graph makes reference to unpro-cessed base metal (UBM) as control 1 and processedbase metal (PBM) as control 2, while figure 7(f) iscompared all the tensile strength together. The frac-ture surfaces of thematrix of the compositemade fromdifferent carbonaceous agro-wastes nanoparticleswere studied with the aid of SEM. The SEM fracto-graphies are presented infigures 10(a)–(g).
It can be observed from figure 7(a) that unpro-cessed parentmaterial has the highest ductility proper-ties followed by processed base metal of AA7075-T651this was also in agreement with the work reportedbySharma et al [55] and Imran et al [56] but the compo-sites made from cow bone nanoparticles, AA7075-T651/CBA-NPs exhibited brittleness properties as ithas the least elongation before fracture takes placewhich is less than 10% and also it has the least tensilestrength of 298MPa as compared to the unprocessedbase metal and processed base metal of 362MPa and620MPa respectively. In figure 7(b), the elongation
Figure 6. (A) Surface Roughness Tester (B)measurement of surface topography on the produced samples.
Table 4.Comparative performance assessment data for tensile behaviourson theUnprocessed, Processed and reinforced AA7075-T651.
Composites mE Rp0.1 Rp0.2 Rp0.5 Rt0.5 Rm Fm At (corr.)
GPa MPa MPa MPa MPa MPa KN %
UBM (AA7075-T651) 9.381 65 559.0751 572.9528 588.4694 7.334 991 620.9030 22.352 51 9.732 209
PBM (AA7075 - T651) 5.353 51 213.24 228.2679 251.8613 7.607 991 362.9048 13.064 57 14.307 68
AA7075-T651/PKSA-NPs 5.504 18 227.769 242.5084 266.179 8.222 344 327.0142 11.772 51 8.419 101
AA7075-T651/CSA-NPs 5.924 73 241.3738 254.1496 277.5694 8.963 831 379.6816 13.668 54 11.806 71
AA7075-T651/CBA-NPs 5.618 17 223.1818 234.8255 257.1239 8.842 94 298.0776 10.730 79 6.923 724
AA7075-T651/WFA-NPs 5.828 18 223.6769 237.2417 260.1043 8.392 041 367.8804 13.2437 14.636 01
AA7075-T651/CFA-NPs 5.144 02 241.9172 254.6327 277.3155 7.749 521 367.7832 13.2402 14.196 52
9
Surf. Topogr.:Metrol. Prop. 7 (2019) 035013 OMIkumapayi et al

Table 5. Surface Roughness Evaluation on the Friction stir processedAA7075-T651matrix composites.
Rotational Speed (rpm) Processing Speed (mm min−1) SamplesSurface Roughness, Ra (μm)
MeanRa (μm) Er±5 (%)Ra1 Ra2 Ra3 Ra Ra
1500 20 Processed AA7075-T651 12.05 11.24 11.53 11.61 0.5805
AA7075-T651/CFA-NPs 6.88 8.40 7.23 7.50 0.375
AA7075-T651/CBA-NPs 2.87 2.89 2.68 2.81 0.1405
AA7075-T651/WFA-NPs 2.13 1.17 1.48 1.60 0.0805
AA7075-T651/PKSA-NPs 5.10 2.91 5.30 4.43 0.2215
AA7075-T651/CSA-NPs 3.00 3.01 2.93 2.98 0.149
10
Surf.Topogr.:M
etrol.Prop.7
(2019)035013OM
Ikumapayietal

with the composite made from coconut shell nano-particle—AA7075-T651/CSA-NPs was 14% of thetotal 18% and it has a tensile strength of 379MPahigher than processed base metal (PBM) of 362MPa.Figure 7(c) which is the composites made from palmkernel shell ash nanoparticles - AA7075-T651/PKSA-NPs with elongation of 10% of 18% which is higherthan that from AA7075-T651/CBA-NPs and also itstensile strength of 327MPa is higher than that ofAA7075-T651/CBA-NPs which is 298MPa. It can be
deduced from figures 7(d) and (e) that processed basemetal (PBM) has almost equal elongation of 17% of18% with composites made from wood fly ash nano-particles- AA7075-T651/WFA-NPs and coal fly ashnanoparticles- AA7075-T651/CFA-NPs. The tensilestrength of AA7075-T651/CFA-NPs and AA7075-T651/WFA-NPs is 367MPa each which is higher thanthat of processed base metal (PBM) of 362MPa but isless than that of unprocessed base metal (UBM), thiswas also in conformity with the works reported in
(e)
Figure 7. (f)The plot of Stress versus Elongation of theComparative performance assessment for tensile behavioursonunprocessedbasemetal (UBM), processed basemetal (PBM) aswell as compositesmatrix of AA7075-T651 reinforced PKSA-NPs, CSA-NPs, CBA-NPsWFA-NPs, andCFA-NPs.
11
Surf. Topogr.:Metrol. Prop. 7 (2019) 035013 OMIkumapayi et al

[27, 57, 58]. Figure 7(f) presented the comparativeanalysis of the performance of all the agro-wastesnanoparticles used for composites in AA7075-T651.
Table 4 presented comparative performanceassessment data for tensile behaviours under the influ-ence of different calcined agro-wastes nanoparticles asWFA, CFA, CBA, CSA as well as PKSA as reinforce-ment during FSP of aluminium alloy 7075-T651. In
the same vein, the comparison was extended to boththe unprocessed basemetal (UBM) and processed basemetal (PBM) without reinforcement and they serve ascontrol 1 and 2 respectively. It can be deduced fromtable 4 that the unprocessed base metal (UBM) whichwas control 1 has the highest ultimate tensile strength(Rm), breaking force (Fm), Modulus of Elasticity (ME)and the stress at 0.2% offset strain (Rp0.2) to be
Figure 8.The plot of Stress and stress at 0.1%, 0.2%and 0.5%offset strain for unprocessed basemetal (UBM), processed basemetal(PBM), as well as compositesmatrix of AA7075-T651, reinforced PKSA-NPs, CSA-NPs, CBA-NPsWFA-NPs, andCFA-NPs.
Figure 9.The plotmodulus of elasticity for unprocessed basemetal (UBM), processed basemetal (PBM) aswell as compositesmatrixof AA7075-T651 reinforced PKSA-NPs, CSA-NPs, CBA-NPsWFA-NPs, andCFA-NPs indicating error bar at 5%uncertainties.
12
Surf. Topogr.:Metrol. Prop. 7 (2019) 035013 OMIkumapayi et al
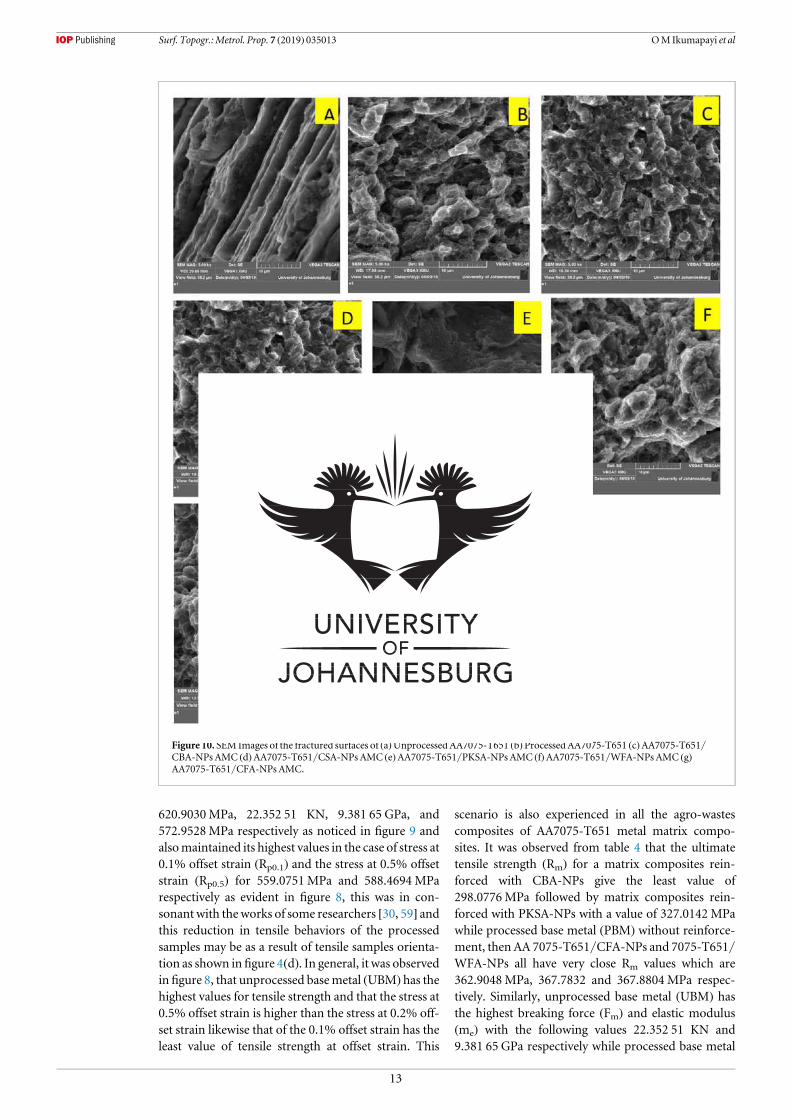
620.9030MPa, 22.352 51 KN, 9.381 65 GPa, and572.9528MPa respectively as noticed in figure 9 andalsomaintained its highest values in the case of stress at0.1% offset strain (Rp0.1) and the stress at 0.5% offsetstrain (Rp0.5) for 559.0751 MPa and 588.4694 MParespectively as evident in figure 8, this was in con-sonant with the works of some researchers [30, 59] andthis reduction in tensile behaviors of the processedsamples may be as a result of tensile samples orienta-tion as shown in figure 4(d). In general, it was observedin figure 8, that unprocessed basemetal (UBM) has thehighest values for tensile strength and that the stress at0.5% offset strain is higher than the stress at 0.2% off-set strain likewise that of the 0.1% offset strain has theleast value of tensile strength at offset strain. This
scenario is also experienced in all the agro-wastescomposites of AA7075-T651 metal matrix compo-sites. It was observed from table 4 that the ultimatetensile strength (Rm) for a matrix composites rein-forced with CBA-NPs give the least value of298.0776MPa followed by matrix composites rein-forced with PKSA-NPs with a value of 327.0142 MPawhile processed base metal (PBM) without reinforce-ment, then AA 7075-T651/CFA-NPs and 7075-T651/WFA-NPs all have very close Rm values which are362.9048MPa, 367.7832 and 367.8804 MPa respec-tively. Similarly, unprocessed base metal (UBM) hasthe highest breaking force (Fm) and elastic modulus(me) with the following values 22.352 51 KN and9.381 65 GPa respectively while processed base metal
Figure 10. SEM Images of the fractured surfaces of (a)UnprocessedAA7075-T651 (b)Processed AA7075-T651 (c)AA7075-T651/CBA-NPsAMC (d)AA7075-T651/CSA-NPs AMC (e)AA7075-T651/PKSA-NPsAMC (f)AA7075-T651/WFA-NPsAMC (g)AA7075-T651/CFA-NPs AMC.
13
Surf. Topogr.:Metrol. Prop. 7 (2019) 035013 OMIkumapayi et al

(PBM), AA7075-T651/CSA-NPs, AA7075-T651/WFA-NPs, and AA7075-T651/CFA-NPs have almostequal values of breaking force (Fm) with the values13.064 57 KN, 13.668 54 KN, 13.2437 KN, and 13.240KN respectively, which indicated that UBM has thehighest ultimate tensile strength (Rm) with the highestelongation (%).
3.2. Fracture characteristicsThe fracture mechanism of Aluminium Metal Com-posites (AMC) are influenced by some parametricfactors such as volume of reinforcement, type ofreinforcement and material used, distributions of thereinforcement particles, the size of the particleswhether is in macro, micro or Nano, more so thematrix as well as the interface properties—this mayencompass interfacial bonding strength, precipita-tions effect, surface roughness, porosity content, [60],etc. It is worth mentioning that particulate reinforce-ment failure in AMC has been traced to three differentsources and they are reinforcement fracture, failure inthe matrix as well as interfacial decohesion in thereinforcementmatrix [61].
SEM fractography infigures 10(a)–(g) represent frac-ture surfaces of the aluminiummatrices and compositesmade from carbonaceous agro-wastes particles. Infigure 10(a)which represents fracture surface for unpro-cessed AA7075-T651, it was observed that it has largeand stretched dimples with elongated grain which dic-tates that is ductile in nature. Figures 10(b), (c), (d), (f),and (g) possessed a large network of dimples whichrevealed bimodal distribution in the morphology of thefracture surfacewhich further tells the nature of the com-posite fabricated. This network of large dimples on themorphology of the fracture surfaces enhanced excellentinterfacial bonding between the reinforcement and the
metal matrices and at the same time improve the tensilestrength as it can be seen infigures 7(f) and 8where thosefabricated nanocomposites have reasonable values fortensile strength. It can be deduced from themorphologyof the fracture surfaces that the fabricated metal nano-composites will exhibit stronger bonding as there was nointerfacial reaction that can weaken the interfacebetween the aluminiummatrices and the reinforcement.This ductility behaviour of the fracture surface was as aresult of vast and large plastic deformation caused enor-mous load. In contrast to the above norm, the morph-ology of figure 10(e) dictates that the fabricated metalcomposites exhibit brittleness. It was observed from itsSEM Image that the intergranular fracture occurred in ahardened, brittle nanocomposite metal matrix, this hasprecipitates that weakened the grain boundaries. Thistype of failure can be caused by impact loading of thematrix which resulted in low ductility, hence formed‘RockCandy fracture’ as noticed infigure 10(e).
3.3. Surface topography evaluationSurface roughness evaluation is a vital ingredient inthe area of processing, manufacturing as well asproduction industries. This enhance the surface topo-graphy of the final product [62] as well as achievinghigh quality when it comes to the accuracy of thedimension of the workpiece, for marketability of theproduced products, to save cost by minimize materiallost in form of flash during FSP and also give simplemean of finisher for the produced product by raisingthe performance of the product [63, 64]. It is worthmentioning that surface topography with higher meanvalues of roughness surface in terms of frictioncoefficient, wear faster than those with less value ofroughness surface which is smoother. Figures 11(a)and (b) showed the surface roughness of the produced
Figure 11. (a)Mean Surface Roughness Evaluation at different reinforcement indicating error bar at 5%uncertainties (b)Plot ofsurface roughness for different reinforcement at 3 points ofmeasurement.
14
Surf. Topogr.:Metrol. Prop. 7 (2019) 035013 OMIkumapayi et al

samples by using carbonaceous agro-wastes nanopar-ticle as reinforcement particles.
The surface roughness of the processed compo-sites plates of AA7075-T651 was investigated. Table 5shows that processed base metal without any reinfor-cement has the roughest surface with average rough-ness values of 11.61 μm while the compositesfabricated from wood fly ash nanoparticles i.e.AA7075-T651/WFA-NPs proven to have the smooth-est surface finish with Average roughness surface valueof 1.60 μm followed by the composite fabricated fromcow bone ash nanoparticles i.e. AA7075-T651-CBA-NPs with average surface roughness value of 2.81 μmwhile composites manufactured from coconut shellnanoparticles—AA7075-T651/CSA-NPs, palm ker-nel shell ash nanoparticles i.e. AA7075-T651/PKSA-NPs and the one from coal fly ash nanoparticles—AA7075-T651/CFA-NPs have their average surfaceroughness to be 2.98 μm, 4.43 μm, and 7.50 μmrespectively and this was also evident in figure 11(a)while the plot of the points measurement on eachfabricated composite sample is represented infigure 11(b).
4. Conclusion
Experimental results and their discussions, it can beconcluded that unprocessed base metal (AA7075-T651- Control 1) has the highest values for tensileproperties such as ultimate tensile strength (Rm),breaking force (Fm), Modulus of Elasticity (ME) andthe stress at 0.2% offset strain (Rp0.2) to be620.9030MPa, 22.352 51 KN, 9.381 65 GPa, and572.9528MPa respectively over the other metal com-posites, this is also evidence in the SEM fractograph forunprocessed base metal as it has large and elongateddimples and grain structures which tells that it is aductilematerial.Whereas, the ultimate tensile strength(Rm) for processed base metal (PBM)—Control 2,AA7075-T651/CSA-NPs, AA7075-T651/CFA-NPs,and AA7075-T651/WFA-NPs are relatively close asdepicted in table 4 and figures 7(f) and 8, this closenessin their values were also observed in the trend of thefracture morphology of the above metal matricescomposites in whichmost of themhad a large networkof dimples which also dictates ductile nature of thefabricated nanocomposites. It was observed thatreinforcing with carbonaceous CSA-NPs, WFA-NPsand CFA-NPs produced a composites with excellenttensile strength higher than the processed base metal(AA7075-T651-p) as also noticed and also reinforcingwith PKSA-NPs and CBA-NPs had produced very lowtensile strength as noticed in figure 8, and this is alsoin-line with the results presented in figure 10 asrevealed. When applied the selected carbonaceousagro-wastes on the metal matrix and the surface of thenanocomposites were subjected to surface test, it was
observed that carbonaceous WFA-NPs produced thebest surface finish with an average surface roughnessof 1.60 μm and reinforcing with nanoparticle of CBA-NPs and CSA-NPs produced roughness surface rela-tively close which are 2.81 and 2.98 μm, whileprocessed base metal—AA7075-T651 has the highestroughness surface followed by AA7075-T651/WFA-NPs. It can be concluded from the tensile fractogra-phies that unprocessed base metal- AA7075-T651pro-duced the highest ductility as noticed in figure 10(a), inthis there observed large and stretched network ofdimples which confirmed the ductility nature of thebase material while large network of dimples withtransgranular fracture are noticed in figures 10(b), (c),(d), (f) and (g) with less intergranular fractures.
Acknowledgments
Appreciation goes to the Indian Institute of Technol-ogy (IIT) Kharagpur, India especially MechanicalEngineering Department for the permission to workon both Friction Stir Welding Machine and surfaceroughness tester for obtaining the data used for thisanalysis; technical Staff of Material and MetallurgicalLaboratory at the Department of Mechanical Engi-neering Science, University of Johannesburg, SouthAfrica where the tensile tests were conducted and alsothe University of Johannesburg, South Africa for thetrip support to India.
Conflict of interest
The authors declared that there is no known conflict ofinterests
ORCID iDs
OMIkumapayi https://orcid.org/0000-0002-9217-8476
References
[1] Cadoni E, DottaM, ForniD andKaufmannH2017Tensilebehaviour of commercial aluminium alloys used in armourapplications at high strain rate Procedia Eng 197 168–75
[2] Bobbili R,MadhuV andGogia AK 2016Tensile behaviour ofaluminium7017 alloy at various temperatures and strain ratesJMater Res Technol 5 190–7
[3] Vani VV andChak SK2018The effect of process parametersin aluminummetalmatrix composites with powdermetallurgyManuf. Rev. 7 1–13
[4] Koli DK, Agnihotri G and Purohit R 2014A review onproperties, behaviour and processingmethods for Al-NanoAl2O3 composites ProcediaMater Sci 6 567–89
[5] Cerit AA, KaramişMB, FehmiN andKemal Y 2008 Effect ofreinforcement particle size and volume fraction onwearbehaviour ofmetalmatrix compositesTribol Ind 30 31–6
[6] Garcia C, Azpilgain Z, Aginagalde A, Esnaola J A,Galdos L andTorca I 2009Tensile behaviour of 6082 aluminium alloy sheetunder different conditions of heat treatment, temperature andstrain rateKey Eng.Mater. 423 105–12
15
Surf. Topogr.:Metrol. Prop. 7 (2019) 035013 OMIkumapayi et al

[7] VascoM, Tserpes K and Pantelakis S 2018Numericalsimulation of tensile behavior of corroded aluminumalloy2024T3 considering the hydrogen embrittlementMetals(Basel) 8 56
[8] Sudhakar I,MadhusudhanReddyG and Srinivasa RaoK 2016Ballistic behavior of boron carbide reinforcedAA7075aluminiumalloy using friction stir processing—anexperimental study and analytical approachDef Technol 1225–31
[9] HussainG andHashemiR 2015 Fabrication ofMetal-MatrixAL7075T651/TiNNanoComposite Employing Friction StirProcess (https://doi.org/10.1177/0954405415596695)
[10] Al-GhamdiKA,HussainG andHashemiR 2017 Fabricationofmetal-matrix AL7075T651/TiNnano composite employingfriction stir process Proc. Inst.Mech. Eng. Part B J. Eng.Manuf.231 1319–31
[11] SudhakarM, Srinivasa RaoCHandMeera SahebK 2018Production of surface composites by friction stir processingMater Today Proc 5 929–35
[12] Bawdekar A and Singh S 2017 Surface hardening andmicrostructural evolution of high carbon steel by friction stirprocessing Int JMech Prod Eng ResDev 7 343–54
[13] Dinaharan I 2016 Influence of ceramic particulate type onmicrostructure and tensile strength of aluminummatrixcomposites produced using friction stir processing J AsianCeram Soc 4 209–18
[14] Kumar PMand Jerome S 2018 Effect of eccentricity pingeometry on the fabrication of surface composite (AL6061-T6/SIC) by friction stir processing Int JMech Prod Eng ResDev8 249–54
[15] Sanusi KO andAkinlabi E T 2017 Friction-stir processing of acomposite aluminiumalloy (AA1050) reinforcedwithtitanium carbide powderMater Tehnol 51 427–35
[16] FatchurrohmanN, FarhanaN andMarini CD2018Investigation on the effect of friction stir processingparameters onmicro-structure andmicro-hardness of ricehusk ash reinforced Al6061metalmatrix composites IOPConf.Ser.:Mater. Sci. Eng. 319 0–6
[17] St.WęglowskiM2014 Friction stir processing technology—newopportunitiesWeld. Int. 28 583–92
[18] Lin S et al 2018Microstructure,mechanical properties andstress corrosion behavior of friction stir welded joint ofAl–Mg–Si alloy extrusionRareMet. 1–11
[19] Kubit A, KluzR, Trzepieciński T,Wydrzyński D andBochnowskiW2018Analysis of themechanical properties andofmicrographs of refill friction stir spot welded 7075-T6aluminium sheetsArchCivMech Eng 18 235–44
[20] Johannes LB andMishra R S 2007Multiple passes of frictionstir processing for the creation of superplastic 7075 aluminumMater. Sci. Eng.A 464 255–60
[21] RanaHG, BadhekaV J andKumar A 2016 Fabrication ofAl7075/B4C surface composite by novel friction stirprocessing (FSP) and investigation onwear properties ProcediaTechnol 23 519–28
[22] PadhyGK,WuCS andGao S 2017 Friction stir basedweldingand processing technologies - processes, parameters,microstructures and applications: a review J.Mater. Sci.Technol. 34 1–38
[23] BahramiM,HelmiN,Dehghani K andGiviMKB 2014Exploring the effects of SiC reinforcement incorporation onmechanical properties of friction stir welded 7075 aluminumalloy: fatigue life, impact energy, tensile strengthMater. Sci.Eng.A 595 173–8
[24] TakhakhAMHHA2017 Surfacemodification of AA 7075-T651 Plate using friction stir processingwith sic particlesEmirates J Eng Res 22 1–10
[25] IkumapayiOMandAkinlabi E T 2019Experimental data onsurface roughness and force feedback analysis in friction stirprocessedAA7075—T651 aluminiummetal compositesDataBr 23 1–14
[26] Dinaharan I, KalaiselvanK andMuruganN2017 Influence ofrice husk ash particles onmicrostructure and tensile behavior
of AA6061 aluminummatrix composites produced usingfriction stir processingCompos Commun 3 42–6
[27] KumarH,PrasadR, SrivastavaA,VashistaMandKhanMZ2018Utilisation of industrial waste (Fly ash) in synthesis ofcopperbased surface composite through friction stir processingroute forwear applications J. Clean. Prod. 196 460–8
[28] Dinaharan I andAkinlabi E T 2018 Low costmetalmatrixcomposites based on aluminum,magnesium and copperreinforcedwith fly ash prepared using friction stir processingCompos Commun 9 22–6
[29] Dinaharan I, NelsonR, Vijay S J andAkinlabi E T 2016Microstructure andwear characterization of aluminummatrixcomposites reinforcedwith industrial wastefly ash particulatessynthesized by friction stir processingMater. Charact. 118149–58
[30] IkumapayiOMandAkinlabi E T 2019A comparativeassessment of tensile strength and corrosion protection infriction stir processed AA7075-T651matrix composites usingfly ashes nanoparticles as reinforcement inhibitors in 3.5%NaCl Int JMech Prod Eng ResDeveleopment 9 839–54
[31] ElangovanR andRavikumarMM2015 Performance of al-flyashmetalmatrix compositesARPN J EngAppl Sci 10 1691–6
[32] Senapati AK, Bhatta A,Mohanty S,Mishra PC andRoutra BC2014An extensive literature review on the usage offly ash as areinforcing agent for differentmatrices Int J Innov SciMod Eng2 4–9
[33] Rathee S,Maheshwari S, Siddiquee AN and SrivastavaM2018A review of recent progress in solid state fabrication ofcomposites and functionally graded systems via friction stirprocessingCrit. Rev. Solid StateMater. Sci. 43 334–66
[34] Adetunla A andAkinlabi E 2019 Influence of reinforcements infriction stir processedmagnesium alloys: insight inmedicalapplicationsMater. Res. Express 1–11
[35] Adetunla A andAkinlabi E 2018 Significantly improvedmechanical properties of 1100 aluminium alloy via particlereinforcement 5th Int. Conf. Innov. Sci. Technol. (Barcelona -Spain) pp 79–87
[36] Raju S S andRaoGS 2017Assessments of desirability wearbehaviour onAl- coconut shell ash -metalmatrix compositeusing grey - Fuzzy reasoning grade Indian J Sci Technol 101–11
[37] Agunsosoye JO, Isaac T S and Samuel SO2012 Study ofmechanical behaviour of coconut shell reinforced polymermatrix composite JMinerMater Charact Eng 2012774–9
[38] Salleh Z, IslamMM,YusopMYMand IdrusMAMM2014Mechanical properties of activated carbon (AC) coconut shellreinforced polypropylene composites encapsulatedwith epoxyresinAPCBEEProcedia 9 92–6
[39] Agunsoye JO, Talabi S I, Bello SA andAwe IO2014Theeffects of Cocos nucifera (coconut shell) on themechanical andtribological properties of recycledwaste aluminium cancompositesTribol Ind 36 155–62
[40] Lancaster L, LungMH, SujanD andAshAC S 2013Utilizationof agro-industrial waste inmetalmatrix composites : towardssustainability Environ Ecol Eng -World Acad Sci Eng Technol 735–43
[41] IkumapayiOMandAkinlabi E T 2018Characterizations of theevolving properties during themilling time ofwood fly ashnanoparticles (WFA-NPs)Proc Int Conf Ind EngOperManag(Pretoria/Johannesburg, South Africa, Oct 29—Novemb 1, 2018)pp 2040–9
[42] IkumapayiOMandAkinlabi E T 2019Effects of vibratory discmilling time on the physiochemical andmorphologicalproperties of coalflyAsh nanoparticlesKey Eng.Mater. 79638–45
[43] IkumapayiOM2018A Study into the effects of themillingtime on the Physiochemical andMorphologicalCharacteristics of CowBone Powder (CBP). Proceedings of theInternational Conference on Industrial Engineering andOperationsManagement Pretoria, (Johannesburg, SouthAfrica, 2018) pp 2050–8
16
Surf. Topogr.:Metrol. Prop. 7 (2019) 035013 OMIkumapayi et al
[44] IkumapayiOMandAkinlabi E T 2019Data in brief datashowing the effects of vibratory discmilling time on themicrostructural characteristics of coconut shell nanoparticles(CS-NPs)Data Br 22 537–45
[45] IkumapayiOMandAkinlabi E T 2019 Image processing andparticle size analysis of coconut shell Int J Civ Eng Technol 102475–82
[46] IkumapayiOMandAkinlabi E T 2018Composition,characteristics and socioeconomic benefits of palm kernel shellexploitation-an overview J. Environ. Sci. Technol. 11 1–13
[47] IkumapayiOM,Akinlabi E T andMajumdar JD 2018Reviewon thermal, thermo-mechanical and thermal stressdistribution during friction stir welding Int JMech Eng Technol9 534–48
[48] IkumapayiOM,Okokpujie I P, Afolalu SA, AjayiOO,Akilabi E T andBodundeOP 2018 Effects of quenchants onimpact strength of single-vee butt welded joint ofmild steelIOPConf. Ser.:Mater. Sci. Eng. 391 1–10
[49] Joyson S, IsaacA, Jebaraj D, RajaD, Esther S andAkinlabi T2018Microstructural characterization and tensile behavior ofrutile (TiO2) -microstructural characterization and tensilebehavior of rutile (TiO2) - reinforced AA6063 aluminummatrix composites prepared by friction stir processingActaMetall Sin (English Lett 1–12
[50] MahtoRP,Kumar R, Pal SK and Panda SK2018Acomprehensive study on force, temperature,mechanicalproperties andmicro-structural characterizations in frictionstir lapwelding of dissimilarmaterials (AA6061-T6&AISI304)JManuf Process 31 624–39
[51] MahtoRP, Bhoje R, Pal SK, JoshiH S andDas S 2016A studyonmechanical properties in friction stir lapwelding of AA6061-T6 andAISI 304Mater. Sci. Eng.A 652 136–44
[52] RoyRB et al 2018Weld defect identification in friction stirwelding through optimizedwavelet transformation of signalsand validation through x-raymicro-CT scan Int. J. Adv.Manuf. Technol. 1–11
[53] IkumapayiOM,Ojolo S J andAfolalu SA 2015 Experimentaland theoretical investigation of tensile stress distributionduring aluminiumwire drawing Eur Sci J 11 1857–7881
[54] Afolalu S A, Abioye AA,UdoMO,Adetunji OR,IkumapayiOMandAdejuyigbe S B 2018Data showing the
effects of temperature and time variances on nano-additivestreatment ofmild steel duringmachiningData Br 19 456–61
[55] SharmaA, SharmaVMandPaul J 2019 Fabrication of bulkaluminum-graphene nanocomposite through friction stiralloying J. Compos.Mater. 1–16
[56] ImranM,KhanARA,Megeri S and Sadik S 2016 Study ofhardness and tensile strength of Aluminium-7075 percentagevarying reinforcedwith graphite and bagasse-ash compositesResour Technol 2 81–8
[57] SharmaC,Dwivedi DK andKumar P 2014 Fatigue behavior offriction stir weld joints of Al-Zn-Mg alloy AA7039 developedusing basemetal in different temper conditionMater. Des. 64334–44
[58] Kumar PV, ReddyGMandRaoKS 2015Microstructure,mechanical and corrosion behavior of high strength AA7075aluminium alloy friction stir welds—effect of post weld heattreatmentDef Technol 11 362–9
[59] Bayazid SM, FarhangiH, AsgharzadehH, Radan L,Ghahramani A andMirhaji A 2016 Effect of cyclic solutiontreatment onmicrostructure andmechanical properties offriction stir welded 7075Al alloyMater. Sci. Eng.A 649293–300
[60] LiH, Chen P,Wang Z, Zhu F, Song R andZheng Z 2019Atensile properties,microstructures and fracture behaviors of anAl-Zn-Mg-Cu alloy during ageing after solution treating andcold-rollingMater. Sci. Eng.A 742 798–812
[61] HaoZ, FuX,MenX andZhouB 2019 Study on tensile andfracture properties of 7050-T7451 aluminumalloy based onmaterial forming texture characteristicsMater. Res. Express 6
[62] Okokpujie I P et al 2018Modeling and optimization of surfaceroughness in endmilling of aluminiumusing least squareapproximationmethod and response surfacemethodology IntJMech Eng Technol 9 587–600
[63] HartmannM, BöhmS and Schüddekopf S 2014 Influence ofsurface roughness of tools on the friction stir welding process JWeld Join 32 12
[64] IkumapayiOMandAkinlabi E T 2019Efficacy ofα- gradetitanium alloy powder (Ti-6Al-2Sn-2Zr-2Mo-2Cr- 0. 25Si ) insurfacemodification and corrosionmitigation in 3. 5%NaClon friction stir processed armour grade 7075-T651 aluminumalloys—insight in defence applicationsMater. Res. 6 1–20
17
Surf. Topogr.:Metrol. Prop. 7 (2019) 035013 OMIkumapayi et al

33
2.6 ARTICLE V
The influence of 17-4PH stainless steel and α+ꞵ titanium alloy powders on the
corrosion susceptibility of friction stir processed AA7075-T651 Aluminium
Matrix Composites.
Published in the Journal of Bio- Tribo- corrosion, Vol 5, issue 4, pp. 1-11, 2019.
DOI: https://doi.org/10.1007/s40735-019-0294-9
ISSN Print: 2198-4220 and ISSN Online: 2198-4239
In this article, the corrosion behaviours of two different fabricated aluminium alloys 7075-T651
matrix composites were studied. The fabricated aluminium matrix composites (AMC) were
reinforced with 17-4PH stainless steel powder and α+ꞵ titanium alloy (Ti-6Al-2Sn-2Zr-2Mo-2Cr-
0.25Si) powder. The following parameters were measured during the corrosion tests: the corrosion
rate (CR), the percentage inhibition-performance efficiency (%IPE), the polarization resistance
(PR), the corrosion current (CC) and the corrosion potential (CP), as well as the open-circuit
potentials (OCP). The processing parameters for the friction stir processing operations in this study
were, tilt angle and plunge depth of 3° and 0.3mm were respectively employed; while 1500 rpm
and 20 mm/min were, respectively used for the rotational and the travel speeds.
The corrosion study was conducted by using the Potentiodynamic Polarization technique in 3.5 %
NaCl solution. From the experimental results, it was revealed that the AMC, reinforced with α+ꞵ
titanium alloy, performed better in all ramifications. The %IPE for α+ꞵ titanium alloy was recorded
to be 98.26 %; while the one reinforced with 17-4PH stainless steel powder has %IPE of 90.57 %;
and the FSPed AA7075-T651, without any reinforcement, was found to be 63.99 % with reference
to the base material – AA7075-T651. The CR for AA7075-T651/ α+ꞵ titanium alloy was far lower

34
than that of the other fabricated AMC, which was found to be 0.087675 mm/year; while that
reinforced with 17-4PH, was 0.47744 mm/year and FSPed AA7075-T651 was 1.829 mm/year;
while the base materials had 5.0718 mm/year. This, in turn, produced the PR for the fabricated
AMC reinforced with α+ꞵ titanium alloy as 2240.7 Ω; while that of stainless steel was 191.06 Ω.
The SEM images of the corroded samples revealed the presence of pits and intergranular corrosion
attack, together with a trace of flakes on the surface. This published article has been able to address
some of the objectives of the study especially those in item II to V.

Vol.:(0123456789)1 3
Journal of Bio- and Tribo-Corrosion (2019) 5:98 https://doi.org/10.1007/s40735-019-0294-9
Influences of 17‑4PH Stainless Steel and α + β Titanium Alloy Powders for Corrosion Susceptibility on Friction Stir‑Processed AA7075‑T651 Aluminium Matrix Composites
O. M. Ikumapayi1 · E. T. Akinlabi1,2 · J. D. Majumdar3 · S. A. Akinlabi4
Received: 22 April 2019 / Revised: 23 September 2019 / Accepted: 27 September 2019 © Springer Nature Switzerland AG 2019
AbstractStainless steel (17-4PH) and α + β titanium alloy (Ti–6Al–2Sn–2Zr–2Mo–2Cr–0.25Si) powders have been known for their high strength with low density as well as promising mechanical properties and remarkable corrosion resistance. In view of this, a comparative performance assessment was carried out to evaluate their percentage inhibition performance efficiencies (%IPEs) on the friction stir-processed 7075-T651 aluminium matrix composites (AMC) reinforced with 17-4PH and Ti–6Al–2Sn–2Zr–2Mo–2Cr–0.25Si powders. The process parameters used were the plunge depth of 0.3 mm, processing speed of 20 mm/min, the tilt angle of 3°, the rotational speed of 1500 rpm and 100% inter-pass overlap with double passes. Corrosion study was carried out in a concentration of 3.5% NaCl medium at an ambient temperature of 25 °C using potentiodynamic polarization technique on AA7075-T651/17-4PH AMC and AA7075-T651/Ti–6Al–2Sn–2Zr–2Mo–2Cr–0.25Si AMC with reference to the processed and unprocessed base metal. It was revealed that the AA7075-T651/Ti–6Al–2Sn–2Zr–2Mo–2Cr–0.25Si AMC has higher %IPE of 98.26%, while AA7075-T651/17-4PH AMC exhibited %IPE of 90.57%. The corrosion rate was extraordinarily reduced from 5.0718 to 0.087675 mm/year using α + β titanium alloy powder as corrosion resist-ance while that of 17-4PH stainless steel reduced to 0.47744 mm/year. The polarization resistance was greatly high when inhibition α + β titanium alloy powder was used and found to be 2240.7 Ω as against 191.06 Ω when 17-4PH stainless steel was used as a corrosion barrier. The SEM images of the corroded samples revealed the presences of pits and intergranular corrosion attack with the trace of flakes on the surfaces.
Keywords Aluminium alloy · AA7075 · Corrosion resistance · Stainless steel powder · Titanium powder
1 Introduction
Aluminium matrix composites (AMC) of high-strength metal especially 7075-T651 are daily gaining importance in the components used for the fabrication of the structural
components especially in aerospace and air defence applica-tions. This debut entrance has been traced to its remarkable properties such as high formability, high fatigue strength, low density, superior damping capacities, high creep resist-ance, high specific strength, high wear resistance and good corrosion resistance. These unbeatable and exceptional mechanical, structural, and chemical properties had made 7075-T651 AMC to be universally accepted for blast and ballistic protection during defensive application so that it will able to withstand the impact of high-velocity missiles, shells, bullets, shrapnel, etc. It is worth mentioning that in the past, the defensive equipment especially armour com-bat vehicle has recorded excellent properties that made it tougher, stronger and durable but its heaviness and fuel con-sumption was high. Notwithstanding, the researchers have developed armour equipment with improved fuel efficiency and lightweight [1] with the incorporation of composite materials as reinforcements such as silicon carbide, titanium
* O. M. Ikumapayi [email protected]
1 Department of Mechanical Engineering Science, University of Johannesburg, Auckland Park Kingsway Campus, Johannesburg 2006, South Africa
2 Department of Mechanical Engineering, Covenant University, Ota, Nigeria
3 Department of Metallurgical and Materials Engineering, Indian Institute of Technology, Kharagpur, India
4 Department of Mechanical and Industrial Engineering, University of Johannesburg, Doornfontein Campus, Johannesburg 2006, South Africa
Journal of Bio- and Tribo-Corrosion (2019) 5:98
1 3
98 Page 2 of 11
alloy, graphene, iron, stainless steel, nitrides, oxides, etc. [2–4] and fewer works have been reported on organic pow-ders (i.e. bioprocessing using agro-wastes powders) such as fly ash, palm kernel shell ash, coconut shell ash, rice husk ash [5]. Many researchers have established the roles of rein-forcements in the modification of surface and texture of the reinforced metal matrix or hybrid composite material and how it enhanced the mechanical and metallurgical properties of the materials via intense, localized plastic deformation compare to the base material [6, 7]. It has been reported by some researchers that aluminium alloy 7075-T651 on its own exhibits poor corrosion resistance [8, 9] but this defi-ciency has been improved upon over the years by the fabrica-tion of 7075-T651 aluminium matrix composites. Since the AA7075-T651 has been proven to have poor tribological properties in its entity, this had reduced its application in most of the industries that are susceptible to corrosion attack especially marine, aerospace and automotive industries [10, 11]. This deficiency can be eliminated by reinforcing the base metal (AA7075-T651) with high-strength metallic pow-ders to form composites either in matrix or hybrid form and this will enhance durability and increase its service life by so doing improving its mechanical, structural and chemical integrity of the fabricated component.
The following literature survey is reported on the corro-sion behaviours of high-strength aluminium alloy AA7075. Corrosion attack such as pitting has been classified as stress raiser that reduced the service life of most of aerospace and airframe components and other defensive applications which also affects its fatigue life [12]. The pitting creates hazard-ous effects such as damage tolerance assessment, causes embrittlement condition on the surface topography of the materials, changes the durability phase of life, causes surface malfunction, etc.
Corrosion study of friction-based joining of 7075-T651 aluminium alloy was carried out in a solution containing 33.5% concentration of NaCl using electrochemical imped-ance spectroscopy and polarization methods. It was revealed that there was a reduction in corrosion mitigation as the trav-erse speed increased from 22 to 46 mm/min, but it reversed in the case when the rotation speed was increased from 1000 to 1200 rpm, and this led to the increase in the corrosion mitigation efficiency. It was concluded that AA7075-T651 will resist higher level of corrosion attack if there is break-down of intermetallic particles and there is higher dissolu-tion; at the same time, if process parameters are actively involved, then corrosion resistance can be highly mitigated [13].
Corrosion study was conducted on 7075 armour grade aluminium alloy to combat its poor corrosion state using ret-rogression and re-ageing (RRA) post-welded heat-treatment operation. In addition, boron carbide nanoparticle was used as reinforcement to enhance its surface modification and
improve the mechanical properties of the fabricated AMC. There was decrease in the hardness value of the fabricated sample, but pitting corrosion is said to have been improved [8].
Corrosion and wear were studied on high-strength armour grade 7075-T6 with three environmental conditions and two series of wear tests. The study on percentage inhibition per-formance efficiency was carried out using potentiostat in ethanol, seawater and deionized water. Wear rate was said to be higher in seawater than in deionized water since seawater is more corrosive than deionized water. Corrosion products can be removed by sliding movement. It was also noticed that among the three mediums under investigation, seawater proved to be the most corrosive environment. It was con-cluded that the increasing corrosion rate increases the wear rate, and also with applied anodic potential, it was observed that OCP was lower than the wear rate when ethanol was used [14].
Corrosion study was conducted on AA7075-T6 high-strength metal in a solution containing 3.5% NaCl, and ethylene glycol (EG) was used as inhibitive substance. The corrosion behaviour was examined using potentiodynamic polarization (PDP) as well as dynamic electrochemical spectroscopy (DEIS). It was concluded that EG as corrosion inhibitor protected aluminium alloy AA7075-T6 in a cor-rosive seawater environment, and there occurs the adsorp-tion of the EG molecules onto the surface of the aluminium plate [15].
Corrosion study was conducted via a standardized test. A model called AFGROW (Air Force Growth) was developed to validate corrosion pit fatigue stress in AA7075-T651. This was developed to monitor transition in fatigue crack of the aircraft structure, and, at the same time, to investigate the quality and aid in the fleet management decision. AFGROW was developed to evaluate the initiation of the crack, the growth of fatigue crack, and also the fracture. This method promotes the prediction of the expectant life of the metallic structure by employing damage tolerance analysis (DTA) frameworks. The developed model was inconsonant with the experimental data within 10% crack growth profile [16].
The above literature reviews centred majorly on the corro-sion behaviour of aluminium alloy especially 7075-T651 dur-ing the friction stir welding and friction stir processing. It is essential to mention that, the development and the fabrication of the surface, as well as bulk composites of the aluminium substrate, have been made possible by a novel technique called friction stir processing (FSP). Solid-state friction-based pro-cessing technique has been proven to have numerous advan-tages over conventional metalworking-processing technique. This has been traced to its homogeneity, short-route, and den-sification as well as refined microstructures. It is worth men-tioning that metallurgical, structural, chemical and mechanical properties of the processed zone can be controlled through

Journal of Bio- and Tribo-Corrosion (2019) 5:98
1 3
Page 3 of 11 98
well-selected process parameters such as travel speed, plunge rate, rotational speed, cooling/heating methods, heat inputs, etc.; through optimization of tool geometry such as pin length and diameter, shoulder-length and diameter, shoulder profile and pin profile; and lastly, groove dimensions which can be groove length, depth and width [17–22].
In the present work, surface composites of high-strength aluminium 7075-T651 alloy via friction stir processing were achieved by the carefully selected process parameters, proper tool design as well as effective groove (microchan-nel) design. The focus of the present work was to investigate the potency of using stainless steel (17-4PH) and α + β tita-nium alloy (Ti–6Al–2Sn–2Zr–2Mo–2Cr–0.25Si) powders as reinforcement in friction stir processing of aluminium 7075-T651 alloy and to study which of them can offer greater cor-rosion resistance when subjected to corrosive environment during service life. In this vein, some corrosion parameters such as corrosion rate, polarization resistance, open-circuit potential as well as inhibition performance efficiency were measured to ascertain the degree of each powder to corro-sion susceptibility.
1.1 Pitting Corrosion
Pitting has been recognized as a localized type of corrosion attack which occurs in the presence of agitated, dynamic and violent chlorine ions [16]. The crack or pits initiation occurs at the weakest point in the oxide in the presence of aggres-sive chlorine attack. The pits’ propagation can be demon-strated by the reactions illustrated in Eqs. 1–6 [23], and was observed as a result of electrochemical reactions that occur between aluminium and its alloys in a seawater environment; the following anodic reaction for anodic polarization of alu-minium is expected [24]:
It is worth mentioning that there is a correlation between the pitting potential and the resting potential as a result of which dissolution of aluminium occurred based on the for-mation of the pit, which eventually causes the movement of chloride ions into the pit and consequently forms aluminium chloride inside the pit in accordance with the Eq. 3.
However, the following electrochemical reactions, Eqs. 4–6 are expected to occur at the cathodic polarization of aluminium. The evolution of hydrogen and reduction of oxygen are the essential reduction procedures at the metal-lic cathodes.
(1)Al → Al3 + 3e−
(2)Al + 3H2O → Al(OH)3 + 3H + + 3e
(3)Al + 3 + 3Cl− → AlCl3
(4)O2 + 2H2O + 4e → 4OH−
(5)2H2O + 2e → 2OH− + H2
As the pits propagate, the pit environment that is an anode also changes.
2 Experimental Design, Materials and Methods
2.1 Materials
The rolled plates of base material of aluminium alloy 7075-T651 of dimension 500 × 600 × 6 mm3 were received from Bharat Aerospace Metals, Mumbai, India. The Aluminium alloy AA7075-T651 metals were later sectioned into dimen-sions of 300 mm length, 125 mm breadth and 6 mm thick-ness, and then used for the friction stir processing having the following chemical compositions Zn (5.92%), Mg (2.8%), Si (0.05%), Cu (1.93%), Fe (0.15%), Cr (0.193%), Ti (0.02%), Mn (0.01%), and Al (88.93%), while its mechanical proper-ties in the as-received form are Brinell hardness (150), shear strength (330 MPa), Poisson’s Ratio (0.32), Shear modulus (26 GPa), fatigue strength (160Mpa); its Elastic modulus, Ultimate tensile strength (UTS) and Yield strength are 70 GPa, 570 MPa, and 500 MPa, respectively. The base mate-rial was reinforced with two different metallic micropar-ticles: 17-4 PH stainless steel powders and α + β titanium alloy powders (Ti–6Al–2Sn–2Zr–2Mo–2Cr–0.25Si).
2.2 Characterizations of Reinforcement Powders Used
The morphological and elemental characteristics of the stainless steel (17-4PH) powder and those of α + β titanium alloy powder (Ti–6Al–2Sn–2Zr–2Mo–2Cr–0.25Si) which were obtained from TLS Technik GmbH & Co with average sizes of 45–90 µm, were carried out using TESCAN VEGA 3 LMH scanning electron microscopy (SEM)—equipped with energy-dispersive X-ray spectrometer (EDXS) oper-ated by Oxford software. The SEM images were taken at a magnification of × 200 with an accelerating voltage of 20 kV, a beam intensity of 10 and a working distance ranging from 16.22 mm to 16.25 mm between the specimen and the detec-tor. The SEM images and their corresponding EDXS are presented in Fig. 1, and the summary of the elemental com-positions is presented in Table 1.
2.3 Experimental Procedure and methodology for Friction Stir Processing
The friction stir processing was conducted on a two-tonne numerically controlled friction stir-welding machine (see Fig. 2a) manufactured by ETA Bangalore, India Ltd. A
(6)2H+ + 2e → H2

Journal of Bio- and Tribo-Corrosion (2019) 5:98
1 3
98 Page 4 of 11
microchannel (groove) was created on the plates with dimen-sions, 3.5 mm depth, 280 mm length and 2. 0 mm width, while AISI H13 hot-working tool steel was employed for stirring and mixing. The processing tool has 18 mm shoul-der diameter, 5 mm pin diameter and 5 mm pin length. Two passes were carried out with the optimal processing parame-ters with 100% inter-pass overlap. The first pass was done on the processing parameters having 100 mm/min travel speed and 1000 rpm rotational speed with the pinless processing tool of 18 mm shoulder diameter. The second pass was done with 20 mm/min travel speed and 1500 rpm rotational speed with plunge depth of 0.1 for first pass and 0.2 for second
pass and tilt angle of 3°. The schematic three-dimensional model of the friction stir processing is depicted in Fig. 2b. In order to ensure rigid clamping of the workpiece (substrate) and to avoid shifting of the workpiece during operations at the same time to maintain rigorous and effective mixing of the reinforcement with the substrate, two pressure plates were positioned to hold the workpiece in a rigid position; this allowed for the complete penetration of the pin length of the tool and also gives room for the interactions of the shoulder diameter with the substrate through tool rotational and translational motions [25, 26]. In order to ensure proper, efficient and effective mixing, and to avoid excessive flash,
Fig. 1 a SEM images of 17-4 PH stainless steel powder and its EDS. b SEM images of α + β titanium alloy powder (Ti–6Al–2Sn–2Zr–2Mo–2Cr–0.25Si) and its EDS

Journal of Bio- and Tribo-Corrosion (2019) 5:98
1 3
Page 5 of 11 98
inner channel and local thinning and to eliminate any defects on the surface plates, a well-calculated groove design and reinforcement estimation must be employed. This can be achieved using Eqs. 7–9 [27].
(7)
Volume of Fraction =Area of groove
ProjectedArea of toolpin× 100
(8)Area of the groove = Groove width × Goovedepth
(9)ProjectedArea ofthe toolpin = Pin diameter × Pin length
2.4 Electrochemical Test
2.4.1 Corrosion Test Sample Preparation
A cross-section with dimensions of 24 mm × 10 mm × 6 mm was cut from aluminium alloy AA7075-T651 for corrosion study. Corrosion behaviours of aluminium alloy metal matrix composites of AA7075-T651/17-4PH stainless steel and AA7075-T651/Ti–6Al–2Sn–2Zr–2Mo–2Cr–0.25Si α + β titanium alloy powders were employed in this study in order to evaluate the percentage inhibition performance efficiency (%IPE) using both corrosion barriers. Corrosion studies for processed base metal (PBM) and the unprocessed base metal (UBM) were also conducted in this work to serve as control experiments 2 and 1, respectively. The surface of each sam-ple was cleaned with silicon carbide emery papers of grades 1000 and 1200 grit and rinsed with sufficient distilled water in order to wash away the presence of any foreign materials and in accordance with ASTM G1-03 Standard [28]. A cor-rosive medium was prepared using 3.5% NaCl.
2.4.2 Method of Preparation of the Electrolyte
The 3.5% of sodium chloride solution (NaCl) was prepared by measuring 35 g of sodium chloride salt (NaCl) and dilut-ing it in 1 L of distilled water with vigorous stirring until absolute dissolution is achieved to form a solution of NaCl. During preparation, the temperature of the electrolyte was kept constant at room temperature.
Table 1 Summary of the elemental compositions of for 17-4 PH stainless steel and α + β titanium alloy powders as analysed by EDS
17–4 PH stainless steel powder α + β titanium alloy powder
Element Weight% Atomic% Element Weight% Atomic%
Si 0.77 1.50 Al 6.27 10.85Cr 17.96 19.01 Si 0.34 0.43Mn 1.03 1.04 Ti 86.01 84.02Fe 72.94 71.87 Zr 1.95 1.00Ni 3.76 3.53 Mo 3.53 1.72Cu 3.53 3.06 Sn 0.12 0.05Total 100.00 Cr 1.66 1.90
Pt 0.12 0.03Total 100.00
Fig. 2 a Processing setup. b Schematic 3D model of FSP

Journal of Bio- and Tribo-Corrosion (2019) 5:98
1 3
98 Page 6 of 11
2.5 Electrochemical Measurement
The electrochemical study of aluminium alloy 7075-T651 matrix composites reinforced with two dif-ferent high-strength inorganic powder such as Stainless steel (17-4PH) and α + β titanium alloy (Ti–6Al–2Sn–2Zr–2Mo–2Cr–0.25Si) powders which are centre of investigation while unprocessed base metal- AA7075-T651-u and processed base metal—AA7075-T651-p were studied alongside to serve as control experiment 1 and 2 respectively. The investigations tend to examine PDP and open-circuit potential (OCP) and these were achieved by employed AutoLab PGSTAT 101 Metrohm potentiostat/galvanostat with embedded 2.1.2 version of NOVA software and an electrochemical cell having 3-electrode connections which are working elec-trode (WE), the counter electrode (CE) as well as refer-ence electrode (RE) and it was performed in an ambient temperature of 25 °C. The reinforced, processed and the unreinforced base metal—AA7075-T651 served as work-ing electrodes, while the counter electrode employed was graphite rod, and the reference electrode employed in this study was potassium chloride electrode (PCE). Cathodic potential (− 1.5 V) and anodic potential (1.5 V) were taken as the range for potentiodynamic polarization plot ver-sus OCP at a sweep rate of 0.005 V/s (scan rate). The reinforced and processed AA7075-T651, processed but unreinforced AA7075-T651, and unreinforced as well as unprocessed base metal—AA7075-T651 which are work-ing electrodes were distinctively immersed into an electro-lyte medium of 3.5% NaCl solution for 10 min before the OCP was recorded—this is done to give room for steady-state potential, and this was also in agreement with work reported by Bordo et al. [29] and Din et al. [30]; the values of potentiodynamic polarization (PDP) were measured and
recorded just immediately after OCP values were taken. To ensure reproducibility, the experiment on each corro-sion sample was performed three more times. The average value as well as the standard deviation was computed and reported to compare groups of data. The recorded values for current density (jcorr) and polarization potential (Ecorr) were extracted from the Tafel curves, while the percentage inhibition performance efficiency (%IPE), i.e. the percent-age protection ability was evaluated using the Eqs. 10 [5, 15, 31–33].
where jcorr is the inhibited corrosion current densities and jocorr is the uninhibited corrosion current density.
3 Results and Discussion
3.1 Corrosion Behaviour
Table 2 represents the results obtained from corrosion experiment. The following parameters were measured and recorded, corrosion current density
(
jcorr)
, corrosion potential
(
Ecorr
)
, cathodic slope (bc), anodic slope (ba), corrosion rate (CR), polarization resistance (PR) while the percentage inhibition performance efficiency (%IPE) i.e. the percentage protection was calculated using Eq. 10. The presentation of values in Table 2 suggested that the presence of corrosion barriers mitigated the corrosion attack by shifting the cathodic and anodic polarization plots towards the lower values of current densities. This hinders the cathodic evolution and anodic metal’s dissolu-tion reactions of aluminium alloy [33].
(10)IPE% = 1 −jcorr
j0corr× 100
Table 2 Potentiodynamic polarization data for unprocessed base metal (UBM); processed base metal (PBM); AA7075-T651/17-4PH AMC and AA7075-T651/Ti-alloy AMC in 3.5% NaCl medium in an ambient temperature of 25 °C
Corrosion potential
Corrosion current
Corrosion rate Polariza-tion resist-ance
Anodic Tafel slope
Cathodic Tafel slope
Open-circuit potential
% Inhibition performance efficiency
Samples Ecorr (mV) jcorr (µA/cm2) Cr (mm/year) Pr (Ω) |ba| (mV/dec) |bc| (mV/dec) OCP (V) % IPE
Control 1 (UBM)
− 1425.8 436 ± 0.04 5.0718 98.597 169.62 238.31 − 0.96954 –
Control 2 (PBM)
− 1424 157 ± 0.01 1.829 178.14 88.564 238.24 − 0.97839 63.99
AA7075-T651/17-4PH AMC
− 1282.5 41.1 ± 0.05 0.47744 191.06 36.252 36.051 − 1.00922 90.57
AA7075-T651/Ti-alloy AMC
− 1392.8 7.55 ± 0.02 0.087675 2240.7 56.057 12.741 − 1.0318 98.26

Journal of Bio- and Tribo-Corrosion (2019) 5:98
1 3
Page 7 of 11 98
3.2 Open‑Circuit Potential (OCP) Measurement
Figure 3 shows the plot for OCP against exposure time for the unprocessed base metal (AA7075-T651-u), processed base metal (AA7075-T651-p), AA7075-T651/17-4PH AMC, and AA7075-T651/Ti–6Al–2Sn–2Zr–2Mo–2Cr–0.25Si AMC in 3.5% NaCl medium in an ambient temperature of 25 °C. The potential in the working electrode (WE) rela-tive to the reference electrode is the OCP, whereas there is no potential or current existing in the cell. The change in the OCP results during polarization was a result of cur-rent flowing across the electrode/electrolyte interface [23, 33–35]. It can be deduced from Fig. 3 that the presence of corrosion barriers tend to shift the OCP steady-state poten-tial towards the more negative direction, and other factors that could be responsible for this shift can be traced to the force exerted during FSP process as well as the choice of process parameters, that is, whether the rotational speed or traverse speed used was high or low. This can also occur after the shift because the AMC will experience com-pression when the force is exerted on it. This shift dic-tates that anodic reaction is less reactive compared to the cathodic reaction. It was revealed that α + β titanium alloy (Ti–6Al–2Sn–2Zr–2Mo–2Cr–0.25Si) powder used as a cor-rosion barrier performed better than 17-4PH stainless steel used as corrosion-susceptible alloy under the same envi-ronmental conditions as shown in Table 2 and Fig. 3. The OCPs of the uninhibited base metal (AA7075-T651-u) and the uninhibited processed base metal (AA7075-T651-p) are relatively close, while the OCPs for inhibited samples were also very close. It was observed that the OCP potential for the inhibited samples for the first 5 s was within the range
of − 1.056 and − 1.066 V and then was later moved to more negative values towards the end of 120 s which were within a range of − 1.009 V and − 1.031 V.
The estimated percentage inhibition performance effi-ciency (%IPE) with reference to the unprocessed base metal (UBM)—AA7075-T651-u was calculated using Eqs. 10 It can be inferred from Table 2 that aluminium alloy AA7075-T651 reinforced with α + β titanium alloy powders (Ti–6Al–2Sn–2Zr–2Mo–2Cr–0.25Si) has been proven to have the highest %IPE and polarization resistance (PR) of 98.26% and 2240.7 Ω, respectively, with the corresponding corrosion rate of 0.087675 mm/year, and it was observed at this point that the OCP values were found to be − 1.0318 as noticed in Fig. 3. Tafel Potentiodynamic Polarization plot for the unprocessed base metal (AA7075-T651-u), processed base metal (AA7075-T651-p), AA7075-T651/17-4PH AMC, and AA7075-T651/Ti–6Al–2Sn–2Zr–2Mo–2Cr–0.25Si AMC in 3.5% NaCl medium at an ambient temperature of 25 °C is depicted in Fig. 4.
In the same vein, AA7075-T651/17.4PH stainless steel AMC also had an outstanding %IPE of 90.57% with a polar-ization resistance (PR) of 191.06 Ω, and this gave a corre-sponding corrosion rate of 0.47744 mm/year. It can also be deduced that the processed AA7075-T651-p (control exper-iment 2) without any reinforcement had %IPE relatively above average which was computed to be 63.99%, while its polarization resistance was 191.06 Ω with OCP, with the corresponding corrosion rates (CR) of − 0.97839 and 1.829 mm/year, respectively. In contrast, the unprocessed base metal—AA7075-T651-u—was taken as reference point (control experiment 1), and as such %IPE was found to be
Fig. 3 Evolution of open-circuit potential (OCP) versus exposure time for the unprocessed base metal (AA7075-T651-u), processed base metal (AA7075-T651-p), AA7075-T651/17-4PH AMC, and AA7075-T651/Ti–6Al–2Sn–2Zr–2Mo–2Cr–0.25Si AMC in 3.5% NaCl medium at an ambient temperature of 25 °C
Fig. 4 Tafel potentiodynamic polarization plots for the unprocessed base metal (AA7075-T651-u), processed base metal (AA7075-T651-p), AA7075-T651/17-4PH AMC, and AA7075-T651/Ti–6Al–2Sn–2Zr–2Mo–2Cr–0.25Si AMC in 3.5% NaCl medium at an ambi-ent temperature of 25 °C

Journal of Bio- and Tribo-Corrosion (2019) 5:98
1 3
98 Page 8 of 11
zero (0). At this point, the OCP was − 0.96954, and this was observed to have the least polarization resistance of 98.597 Ω with the highest corrosion rate of 5.0718 mm/year.
It was evident that the presence of α + β titanium alloy powders (Ti–6Al–2Sn–2Zr–2Mo–2Cr–0.25Si) as reinforce-ment and as corrosion resistant material has produced the lowest corrosion rate, as a result of pushing effect of acidic and cathodic polarization plots towards the lower end of current density. There was a drastic reduction in the current density as depicted in Table 2, and this may be traced to the occlusion on the active sites of the aluminium alloy. Not-withstanding this, a little discrepancy was noticed in Ecorr values as reinforcement corrosion barrier was changed from titanium powder to stainless steel powder. This negative shift in the corrosion potential has occurred because Ecorr contains the prevailing cathodic protection nature of the processing as well as reinforcement particle.
3.3 SEM Micrographs for Corroded Samples
Morphological characteristics and surface topog-raphy for the corroded samples of both inhibited—AA7075-T651/17-4PH AMC, and AA7075-T651/Ti–6Al–2Sn–2Zr–2Mo–2Cr–0.25Si AMC—and the unin-hibited samples—unprocessed base metal (AA7075-T651-u) and processed base metal (AA7075-T651-p)—were studied using TESCAN VEGA 3 LMH Scanning Electron Micros-copy (SEM), and all the SEM Images were taken at a mag-nification of × 500 with an accelerating voltage of 20 kV and beam intensity of 10 having varying working distances ranging from 13.46 to 14.72 mm. The micrographs of the corrosion experiment are presented in Fig. 5a–d. Pits’ cor-rosion attacks are so much obvious in unprocessed base metal (AA7075-T651-u) as shown in Fig. 5a which indi-cates that it is susceptible to corrosion attack; Fig. 5b which is the processed base metal (AA7075-T651-p) also shows considerable amount of pits’ attacks as well as microcracks in its surface topography, which occur as a result of inter-granular corrosion on the surface. The morphological behav-iour of the inhibited corrosion sample under the influence of stainless steel powder (17-4PH) was characterized with only pits’ attacks which were found in a minimal number on the surface of AA7075-T651/17-4PH AMC as depicted in Fig. 5c; this surface behaviour also shows how resist-ant to corrosion attack the sample was. Despite the high rate of corrosion resistance exhibited by AA7075-T651/Ti–6Al–2Sn–2Zr–2Mo–2Cr–0.25Si AMC as shown in Fig. 5d, the surface topography was characterized with inter-granular corrosion attack, as well as a very small amount of pits’ attack and formation of flakes, that is, oxide layer for-mation was also observed on the surface. The SEM images for uncorroded samples for the base metal—AA7075-T651-u, processed base metal—AA7075-T651-p, processed
base metal reinforced with stainless steel powder—AA7075-T651/17-4PH AMC, as well as the processed base metal reinforced with titanium alloy powder—AA7075-T651/Ti–6Al–2Sn–2Zr–2Mo–2Cr–0.25Si AMC are presented, respectively, in Fig. 5ai–di.
4 Conclusion
Based on the experimental procedures, results and the rel-evant discussions, the following inferences can be concluded on the corrosion study carried out at an ambient temperature and in a saline environment containing 3.5% NaCl:
(1) It can be concluded that the percentage inhibition performance efficiencies (%IPEs) of AA7075-T651/Ti–6Al–2Sn–2Zr–2Mo–2Cr–0.25Si AMC and AA7075-T651/17-4PH AMC stainless steels are rela-tively close with a difference of approximately 8% in favour of AA7075-T651/Ti–6Al–2Sn–2Zr–2Mo–2Cr–0.25Si AMC, but there exists a huge gap in the polari-zation resistance of the aluminium matrix composites (AMCs).
(2) There exists an exceptional improvement in the inhibi-tion performance efficiency with α + β titanium alloy powders (Ti–6Al–2Sn–2Zr–2Mo–2Cr–0.25Si) as reinforcement and corrosion-susceptible alloy, which led to the improved percentage efficiency of 98.26% as against those reinforcing and inhibiting materials with 17-4PH stainless steel powder that has %IPE of 90.57%.
(3) Reinforcement and inhibition with α + β titanium alloy powders (Ti–6Al–2Sn–2Zr–2Mo–2Cr–0.25Si) offered higher polarization resistance of 2240.7 Ω as against 191.06 Ω that was offered when stainless steel (17-4PH) powder type was used.
(4) The corrosion rate was far lower when aluminium alloy AA7075-T651 was inhibited with α + β titanium alloy powders (Ti–6Al–2Sn–2Zr–2Mo–2Cr–0.25Si) which gave reduction from 5.0718 mm/year to 0.087675 mm/year unlike the case when inhibited with 17-4PH stain-less steel powder which led to a reduction from 5.0718 to 0.47744 mm/year.
(5) The ultimate value of OCP for AA7075-T651/(Ti–6Al–2Sn–2Zr–2Mo–2Cr–0.25Si) AMC was found to be − 1.031 V which is more negative than AA7075-T651/17-4 stainless steel AMC of − 1.009 V, AA7075-T651-p with OCP value of − 0.97839 and AA7075-T651-u with OCP value of − 0.96954.
(6) The morphology and surface topography characteris-tics of the corroded aluminium alloy when immersed in 3.5% NaCl reveal that α + β titanium alloy powders (Ti–6Al–2Sn–2Zr–2Mo–2Cr–0.25Si) showed fewer

Journal of Bio- and Tribo-Corrosion (2019) 5:98
1 3
Page 9 of 11 98
Fig. 5 SEM Images for the cor-roded samples for a AA7075-T651-u, b AA7075-T651-p, c AA7075-T651/17-4PH AMC, d AA7075-T651/Ti–6Al–2Sn–2Zr–2Mo–2Cr–0.25Si AMC. SEM images for uncorroded samples for ai AA7075-T651-u, bi AA7075-T651-p, ci AA7075-T651/17-4PH AMC, di AA7075-T651/Ti–6Al–2Sn–2Zr–2Mo–2Cr–0.25Si AMC

Journal of Bio- and Tribo-Corrosion (2019) 5:98
1 3
98 Page 10 of 11
pits’ and intergranular corrosion attacks in the pres-ence of Oxides (flakes) at the surface, while more pits with no microcracks were seen on the surface of the samples inhibited with 17-4PH stainless steel powder, but large volumes of pits’ and intergranular corrosion attacks were observed on the morphology of the pro-cessed base metal (AA7075-T651-p) and the unpro-cessed base metal (AA7075-T651-u); this morphology thus resulted occurred due to the lack of inhibition on the corroded samples.
Acknowledgements Appreciation goes to the Indian Institute of Tech-nology (IIT) Kharagpur, India especially their Mechanical Engineering Department for according the permission to work on the friction stir-welding machine to enable obtain the data used for this analysis; also, both the Surface Engineering Research Centre, Covenant University, Ota, Nigeria where the corrosion tests were carried out, and the Uni-versity of Johannesburg, South Africa for their financial support for the Research Trip to India also merit our grateful thanks.
Compliance with ethical standards
Conflict of interest All the authors declare that there are no conflicts of interests with regard to this research.
References
1. Sudhakar I, Madhu V, Madhusudhan Reddy G, Srinivasa Rao K (2015) Enhancement of wear and ballistic resistance of armour grade AA7075 aluminium alloy using friction stir processing. Def Technol 11:10–17. https ://doi.org/10.1016/j.dt.2014.08.003
2. Sudhakar I, Madhusudhan Reddy G, Srinivasa Rao K (2016) Ballistic behavior of boron carbide reinforced AA7075 alumin-ium alloy using friction stir processing–An experimental study and analytical approach. Def Technol 12:25–31. https ://doi.org/10.1016/j.dt.2015.04.005
3. Ikumapayi OM, Akinlabi ET, Pal SK, Majumdar JD (2019) A survey on reinforcements used during friction stir processing of aluminium metal matrix hybrid composites. Procedia Manuf 35:935–940. https ://doi.org/10.1016/j.promf g.2019.06.039
4. Yuvaraj N, Aravindan S (2015) Fabrication of Al5083/B4C sur-face composite by friction stir processing and its tribological char-acterization. Integr Med Res 4:398–410. https ://doi.org/10.1016/j.jmrt.2015.02.006
5. Ikumapayi OM, Akinlabi ET, Majumdar JD, Akinlabi S (2019) Characterization of high strength aluminium–based surface matrix composite reinforced with low-cost PKSA fabricated by friction stir processing. Mater Res Express 6:1–27. https ://doi.org/10.1088/2053-1591/ab395 b
6. Cerit AA, Karamiş MB, Fehmi N, Kemal Y (2008) Effect of rein-forcement particle size and volume fraction on wear behaviour of metal matrix composites. Tribol Ind 30:31–36
7. Sun N, Apelian D (2011) Friction stir processing of aluminum cast alloys for high performance applications. Alum Form 63(11):44–50
8. Vijaya Kumar P, Madhusudhan Reddy G, Srinivasa Rao K (2015) Microstructure and pitting corrosion of armor grade AA7075 aluminum alloy friction stir weld nugget zone–Effect
of post weld heat treatment and addition of boron carbide. Def Technol 11:166–173. https ://doi.org/10.1016/j.dt.2015.01.002
9. Navaneethakrishnan T, Ganesh P (2015) Effect of welding parameters on friction stir welded dissimilar aluminum alloys 7075 and 6082 with various tool pin profiles. J Chem Pharm Sci 2015:463–468
10. Dashwood RJ, Grimes R (2010) Structural materials: alu-minum and its alloys-properties. Encycl Aerosp Eng. https ://doi.org/10.1002/97804 70686 652.eae19 5
11. Elatharasan G, Senthil Kumar VS (2012) Microstructural char-acterization and mechanical properties in friction stir welding of Aa7075 aluminium alloy. Adv Mater Res 622–623:330–334. https ://doi.org/10.4028/www.scien tific .net/AMR.622-623.330
12. Saeidi M, Barmouz M, Givi MKB (2015) Investigation on AA5083/AA7075 + Al2O3 joint fabricated by friction stir welding: characterizing microstructure, corrosion and toughness behavior. Mater Res 18:1156–1162. https ://doi.org/10.1590/1516-1439.35771 4
13. Elatharasan G, Kumar VSS (2014) Corrosion analysis of friction stir-welded aa 7075 aluminium alloy. Stroj Vestnik/J Mech Eng 60:29–34. https ://doi.org/10.5545/sv-jme.2012.711
14. Liu Y, Mol MC, Janssen GCAM (2016) Combined corrosion and wear of aluminium alloy 7075-T6. J Bio- Tribo-Corros 2:1–7. https ://doi.org/10.1007/s4073 5-016-0042-3
15. Gerengi H, Solomon MM, Bagci FE, Abai EJ (2018) An evalu-ation of the anticorrosion effect of ethylene glycol for AA7075-T6 alloy in 3.5% NaCl solution. Measurement 116:264–272. https ://doi.org/10.1016/j.measu remen t.2017.11.030
16. Mantha D, Fawaz SA (2014) Standardized test method for cor-rosion pit-to-fatigue crack transition for AA7075-T651 alu-minum alloy. Adv Mater Res 891–892:205–210. https ://doi.org/10.4028/www.scien tific .net/AMR.891-892.205
17. Kumar K, Gulati P, Gupta A, Shukla DK (2017) A review of friction stir processing of aluminium alloys using different types of reinforcements. Int J Mech Eng Technol 8:1638–1651
18. Koli DK, Agnihotri G, Purohit R (2014) A review on properties, behaviour and processing methods for Al- nano Al2O3 compos-ites. Procedia Mater Sci 6:567–589. https ://doi.org/10.1016/j.mspro .2014.07.072
19. Sharma V, Prakash U, Kumar BVM (2015) Surface composites by friction stir processing: a review. J Mater Process Technol 224:117–134. https ://doi.org/10.1016/j.jmatp rotec .2015.04.019
20. Das H, Mondal M, Hong S-T, Chun D-M, Han HN (2018) Join-ing and fabrication of metal matrix composites by friction stir welding/processing. Int J Precis Eng Manuf Technol 5:151–172. https ://doi.org/10.1007/s4068 4-018-0016-7
21. Mishra RS, Ma ZY (2005) Friction stir welding and process-ing. Mater Sci Eng, R 50:1–78. https ://doi.org/10.1016/j.mser.2005.07.001
22. Ikumapayi OM, Akinlabi Esther T, Majumdar JD (2019) Influ-ence of carbonaceous agrowastes nanoparticles on physical and mechanical properties of friction stir processed AA7075-T651 metal matrix composites. Surf Topogr Metrol Prop 7:1–17. https ://doi.org/10.1088/2051-672X/ab3aa e
23. Raguraman D, Muruganandam D, Dhas LKK (2014) Corrosion study in friction stir welded plates of AA6061 and AA7075. Int J ChemTech Res 6:2577–2582
24. Abbass PMK, Prof A, Anaee RA, Jabar EMM (2016) Corro-sion behavior of friction stir welded of similar and dissimilar Al2024-T3 and Al7075-T73 alloys. Int J Ser Eng Sci 2:13–27
25. Ikumapayi OM, Akinlabi ET, Majumdar JD (2018) Review on thermal, thermo- mechanical and thermal stress distribution during friction stir welding. Int J Mech Eng Technol 9:534–548
26. Ikumapayi OM, Okokpujie IP, Afolalu SA, Ajayi OO, Akil-abi ET, Bodunde OP (2018) Effects of quenchants on impact strength of single-vee butt welded joint of mild steel. IOP Conf
Journal of Bio- and Tribo-Corrosion (2019) 5:98
1 3
Page 11 of 11 98
Ser Mater Sci Eng 391:1–10. https ://doi.org/10.1088/1757-899X/391/1/01200 7
27. Joyson S, Isaac A, Jebaraj D, Raja D, Esther S, Akinlabi T (2018) Microstructural characterization and tensile behavior of rutile (TiO2)—microstructural characterization and tensile behavior of rutile (TiO2)—reinforced AA6063 aluminum matrix composites prepared by friction stir processing. Acta Metall Sin (English Lett). https ://doi.org/10.1007/s4019 5-018-0806-5
28. Arockiasamy P, Sheela XQR, Thenmozhi G, Franco M, Sahayaraj JW, Santhi RJ (2014) Evaluation of corrosion inhibition of mild steel in 1 M hydrochloric acid solution by mollugo cerviana. Int J Corros 2014:1–7. https ://doi.org/10.1155/2014/67919 2
29. Bordo K, Gudla VC, Peguet L, Afseth A, Ambat R (2018) Elec-trochemical profiling of multi-clad aluminium sheets used in automotive heat exchangers. Corros Sci 131:28–37. https ://doi.org/10.1016/j.corsc i.2017.11.011
30. Din RU, Gudla VC, Jellesen MS, Ambat R (2016) Microstructure and corrosion performance of steam-based conversion coatings produced in the presence of TiO2 particles on aluminium alloys. Surf Coat Technol 296:1–12. https ://doi.org/10.1016/j.surfc oat.2016.03.093
31. Akande IG, Oluwole OO, Fayomi OSI (2018) Optimizing the defensive characteristics of mild steel via the electrodeposi-tion of Zn–Si3N4 reinforcing particles. Def Technol. https ://doi.org/10.1016/j.dt.2018.11.001
32. Fayomi OSI, Akande IG (2019) Corrosion mitigation of alumin-ium in 3.65% NaCl medium using hexamine. J Bio- Tribo-Corros. https ://doi.org/10.1007/s4073 5-018-0214-4
33. Fayomi OSI, Popoola IGAAPI (2018) Corrosion protection effect of chitosan on the performance characteristics of A6063 alloy. J Bio- Tribo-Corrosion 4:1–6. https ://doi.org/10.1007/s4073 5-018-0192-6
34. Zhang C, Huang G, Cao Y, Wu X, Huang X, Liu Q (2019) Optimi-zation of tensile and corrosion properties of dissimilar friction stir welded AA2024-7075 joints. J Mater Eng Perform 28:183–199. https ://doi.org/10.1007/s1166 5-018-3785-9
35. El ODL, Hamed GO, El SJA (2019) Anticorrosive formulation based of the epoxy resin—polyaminoamide containing zinc phos-phate inhibitive pigment applied on sulfo- tartaric anodized AA 7075-T6 in NaCl medium. J Bio- Tribo-Corros 5:1–9. https ://doi.org/10.1007/s4073 5-019-0218-8
Publisher’s Note Springer Nature remains neutral with regard to jurisdictional claims in published maps and institutional affiliations.

35
2.7 ARTICLE VI
Comparative Assessment of Tensile Strength and Corrosion Protection in
Friction Stir Processed AA7075-T651 Matrix Composites Using Fly Ashes
Nano-particles as the Reinforcement Inhibitors in 3.5 % NaCl
Published in the International Journal of Mechanical and Production Engineering Research and
Development, Vol. 9, Issue 3, Jun 2019, 839-854.
DOI: https://doi.org/10.24247/ijmperdjun201992
ISSN Print: 2249-6890 ISSN Online: 22498001
Performance assessment was carried out on the potency of using nano-particles derived from
wood-fly ash (WFA) and coal-fly ash (CFA) in the friction stir processing of AA7075-T651. The
two nano-particles were characterized by using SEM-EDX, XRD, and XRF. The developed fly
ashes were carbonized at 500 °C for two hours, for homogeneity and to remove any impurity or
foreign materials that may have been trapped therein, before they were used for reinforcement. An
assessment was done on the tensile behaviour and the corrosion protection of the eco-friendly
domestic (WFA) and industrial (CFA) waste products.
The corrosion test was conducted in 3.5 % NaCl medium at an ambient temperature of 25 °C and
at a stable pH of 7. It was established that the nano-particles derived from the wood-fly ash
performed better than coal fly ash as regards the corrosion test. The WFA had a 97.61 % percentage
inhibition performance efficiency, whereas the CFA was 83.74 %. It was also noted that the
corrosion rate was 0.12068 mm/year with WFA; and 0.8241 mm/year inhibiting with CFA and
this gave polarization resistance to 776.22 Ω and 417.28 Ω respectively. It was observed that both
the WFA and CFA had approximately the same values for breaking force which 13 N and also

36
their ultimate tensile strength (UTS) was also the same, recorded as 367 MPa. This published
article has been able to address some of the objectives of the study especially those in item I, III
to V.

www.tjprc.org SCOPUS Indexed Journal [email protected]
A COMPARATIVE ASSESSMENT OF TENSILE STRENGTH AND CORROSION
PROTECTION IN FRICTION STIR PROCESSED AA7075-T651 MATRIX
COMPOSITES USING FLY ASHES NANOPARTICLES AS
REINFORCEMENT INHIBITORS IN 3.5 % NaCl
OMOLAYO M. IKUMAPAYI 1* & ESTHER T. AKINLABI 1,2
1Department of Mechanical Engineering Science, University of Johannesburg, Auckland Park Kingsway Campus,
Johannesburg, South Africa 2Department of Mechanical Engineering, Covenant University, Ota, Nigeria
ABSTRACT
This research presents the performance of eco-friendly waste materials, which are wood fly ash nanoparticle
(WFA-NPs) and coal fly ash nanoparticles (CFA-NPs) as economical reinforcements corrosion inhibitors on friction
stir processed Aluminium 7075-T651 alloy in 3.5 % NaCl solution at room temperature and at a stable pH of 7.
This study investigated the tendency of using domestic waste wood fly ash and industrial waste coal fly ash as a
promising and potential alternative to metallic powders for reinforcements and corrosion mitigation in friction stir
processed (FSP)armour grade aluminium 7075-T651 alloy and at the same time compare their efficacy. Microchannel
of 3.5 mm depth and 2.0 mm width was machined on each aluminium plate with the aid of horizontal milling machine
to deposit fly ashes (FAs) nanoparticles. Optimum process parameters chosen for the FSP experimentation are
processing speed, rotational speed, tool tilt angle and plunging depth which were 20 mm/min, 1500 rpm, 3 ° and 0.3
mm respectively. Two passes on each parameter with 100 % inter-pass overlap was achieved. A cutting tool with a
tapered cylindrical pin profile made of AISI H13 steel tool was employed for FSP with a shoulder diameter of 18 mm,
pin diameter of 5 mm and a pin length of 5 mm. In this study, the tensile strength was investigated using X force P type
of Zwick/Roell Z250 tensile testing machine with a normal force of 250 KN and characteristic of 2mV/v.
It was revealed that unprocessed and untreated base metal (UBM) has the highest values for ultimate tensile strength
which were 620.9030 MPa and its breaking force was 22.35252 KN with an elastic modulus of 9.38165 GPa.
There was no significant improvement in tensile strength properties when processed and or reinforced with either
WFA-NPs or CFA-NPs. In contrast, there was tremendous and excellent improvement in corrosion protection ability of
calcined WFA-NPs as against CFA-NPs when applied as reinforcement inhibitor which lead to reduction in corrosion
rate from 5.0718 to 0.12068 mm/year with the highest percentage corrosion inhibitive performance efficiency (%IPE)
from 63.9 % on reinforced to 97.61 % reinforced with WFA-NPs.
KEYWORDS: Corrosion Rate, Coal Fly Ash, Wood Fly Ash, Tensile Strength & Friction Stir Processing
Received: Feb 10, 2019; Accepted: Mar 04, 2019; Published: May 16, 2019; Paper Id.: IJMPERDJUN201992
INTRODUCTION
Many researchers in recent years and nowadays have investigated the tensile strength and the corrosion
behaviours of AA7075 at different tapered conditions using different approaches varying from using different
second phases as reinforcement particles and corrosion inhibitors at different concentrations of seawater and other
Original A
rticle International Journal of Mechanical and Production Engineering Research and Development (IJMPERD) ISSN(P): 2249-6890; ISSN(E): 2249-8001 Vol. 9, Issue 3, Jun 2019, 839-854 © TJPRC Pvt. Ltd.

840 Omolayo M. Ikumapayi & Esther T. Akinlabi
Impact Factor (JCC): 7.6197 SCOPUS Indexed Journal NAAS Rating: 3.11
medium in order to exploit the tensile strength and corrosion mitigation efficiency to using numerical simulation
approaches to predict the strength and corrosion protection of AA7075. In this study, wood and coal fly ashes
nanoparticleshave been used as reinforcement particles and corrosion inhibition in friction stir processed aluminium alloy
7075-T651 using 3.5 % NaCl solution as seawater corrosive environmental medium.
Aluminium alloys in general especially commercials available rolled sheet, amour grade, high strength alloy such
as 7075 series has gained promising interest as part of the components for defensive equipment. Its areas of applications
including the following in defence technologies but not limited to the jet engine, ballistic, space and air vehicles, aviation,
military armour tank, fighter aircraft[1]–[3]. Other applications can be traced to automotive, electrical, tribological, thermal
structures, shipbuilding and also cryogenic areas of usage in order to optimise fuel consumption in transportation industry
and many more due to its exceptional, excellent and unbeatable combination and integration of mechanical, chemical,
structural as well as metallurgical properties such as good corrosion resistance, high strength-to-weight ratio, low
coefficient thermal expansion, high specific stiffness and strength, oxidation and wear resistance, high plastic flow
strength, high thermal and electrical conductivity, high fatigue strength, superior damping capacities, creep resistance, etc.
[4], [5].
Friction stir processing is a promising and a novel processing techniques derived from Friction Stir Welding
(FSW) whereby a groove (microchannel) that will house the second phase (reinforcement particles) may be created or may
not be created on the substrate [6], [7]. FSP has been used widely in many industries today to modify the mechanical
properties and surface integrity of the workpiece. It is facile and economical, update and cost-effectiveto using FSP in the
preparation of aluminium metal matrix composites[8], [9]. Lots of benefits attributed to the use of FSP amongst which are
the homogeneity of the processed zone, homogenization of precipitates, grain refinement, densification of aluminium
alloys and composites materials [10]. FSP is a new technology for surface properties improvement of the alloy metals,
hardness, ductility, formability improvements and also to enhance the strength of the metal and elongate the fatigue life
without any alteration to the properties of the bulk metal [11]. In order to improve the surface quality by FSP, some
challenges are encountered during the process of reinforcing the composite materials such as tool wear, sticking of the
substrate to the backing plate especially when the job is in thickness between 1mm to 2mm, challenge on how to improve
fatigue property and joining strength, many optimizations may be required to obtain optimum parameters and this may lead
to the usage of many materials[12]–[15].
Friction stir processing (FSP) for the fabrication of composites be it matrix or hybrid has gotten the attention of
researchers nowadays. In order to optimise and validate the potency of reinforcement particulates on electrochemical,
metallurgical, and mechanical properties, several characterisations had been carried out. Surface integrity of aluminium
alloy 7075 and 6061 were investigated using Boron Carbide powder (B4C). Their hardness, wear and mechanical
properties were evaluated after fabricated using friction stir processing. It was revealed that more homogeneous dispersion
were seen in the fabricated AA6061/B4C than AA7075/B4C. It was then concluded that fine particles may tend to disperse
in AA7075 than when they are not in fine particle [16].
Wear behaviour of friction stir processed Al7075-T651 aluminium alloy using SiC reinforcement was
investigated. The processing parameters were at a constant rotational speed of 710 rpm with a varying processing speed of
20, 40 and 56 mm/min. The wear behaviour was carried out using ball-on-disk configuration techniques with normal loads
of 2, 4 and 5 N and a linear speed of 2.5 cm/s. A metallographic investigation such as SEM-EDX was carried out on the

A Comparative Assessment of Tensile Strength and Corrosion Protection in Friction 841 Stir Processed AA7075-T651 Matrix Composites using Fly Ashes Nanoparticles as Reinforcement Inhibitors in 3.5 % NaCl
www.tjprc.org SCOPUS Indexed Journal [email protected]
wear samples and it was revealed that under 2N normal load, there exist better wear properties, even though, there was a
reduction in average hardness of the SiC processed samples[17]. Dry sliding behaviour of friction stir processed of
Aluminium alloy AA7075/ZrB2 matrix composites was studied. The particle sizes of the reinforcement phases were
between 5–15 % by weight and the applied loads were between 20 – 80 N with varying sling speed of 0.8 – 2.0 m/s at a
constant sliding speed of 3000 m. Formation of oxide rich tribolayer in the worn surface led to a reduction of COF. It was
revealed that increase in reinforcement particles leads to an increase in hardness of the matrix composites[18].
MATERIALS AND METHODS
Commercially available amour grade aluminium 7075-T651 alloy plates of thickness 6 mm was employed as the
base material (substrate) in this study. The plates were dimensioned to have a length of 300 mm and a breadth of 125 mm
(i. e. 300 x 125 x 6 mm3). The spark spectrometry was carried out on the base material – Aluminium Alloy 7075 – T651
and the result is furnished in Table 1 and the various mechanical properties of AA7075 – T65, namely hardness, young
modulus, tensile, fatigue, elongation etc. are presented in Table 2.
Table 1: Chemical Composition AA7075-T651 Aluminium Alloy
Elements Mg Fe Ti Si Mn Zn Cu Cr Al Wt.% Composition 2.8 0.15 0.02 0.05 0.01 5.92 1.93 0.193 Bal
Table 2: Mechanical Properties AA7475 – T651
Properties Value Fatigue Strength 160 MPa Ultimate Tensile Strength (UTS) 570 MPa Elongation at Break 8.2 % Shear Strength 330 MPa Brinell Hardness 150 Poisson’s Ratio 0.32 Elastic Modulus (Young’s, Tensile) 70 GPa Yield Strength 500 MPa Shear Modulus 26 GPa
Reinforcement and Inhibitive Materials Collection and Preparations
Coal Fly Ash (CFA) and Wood Fly Ash (WFA) are the major reinforcement particles used in this study.
Each particle was obtained in their micro level and then undergone a milling process for 60 minutes to obtain nanoparticle
using a vibratory disc milling machine. The CFA was collected at ESKOM coal power station located at Majuba,
Mpumalanga province of South Africa while the WFA was collected from the complete combustion of bunches of
firewood. After the collection of the two fly ashes (FA), they were sieved, washed with de-ionized water to remove
contaminants and impurities that may be present within, the water was then drained and the FAs were then dried at ambient
temperature for 72 hours, after which it was then dried further inside an electric oven set at 80 °C for further 48 hours, this
is to ensure complete dryness before characterization. After oven dried, the FAs were then sieved using ASTM meshes
standard made of King Test Sieve Shaker (VB 200/300), the initial sieving was taken at a 75µm size which was taken to be
0 min milled, after which progressive milling took place for 20, 40 and 60 minutes. Nanoparticles were said to be achieved
at 60 minutes milled and the characterizations of the Wood fly ash nanoparticle (WFA-NPs) and coal fly ash nanoparticle
(CFA-NPs) were then carried out. The flowchart for the preparations and characterizations of fly ashes is shown in Figure
1.

842
Impact Factor (JCC): 7.6197
Figure 1: Schematic
Method of Conditioning Wood and Coal Fly Ashes Nanoparticles
Calcination process is process or
environment, i. e. thermal treatment process of
stability, phase transition, thermal decomposition as well as
using. This is done to improve the strength, texture, thermal stability etc. The milled FAs nanopa
directly as reinforcement to the workpiece that will be processed without first of all conditioned to a stable temperature to
remove the impurities and contaminants that may
undergone calcination, which is, conditioning process to ensure thermal stability. The calcination of each powder was
carried out by putting each WFA-NPs and CFA
the muffle furnace set at 500 °C one after the other for two (2) hours, after the 2 hours the furnace was put off and the
carbonaceous powder was allowed to cool to room temperature inside the furnace before it was brought out for use and
then further ground was performed on each powder to ensure smoothness of the carbonaceous powder before use.
EXPERIMENTAL PROCEDURES
Friction stir processing (FSP)
(FSW) machine produced by ETA Bangalore, India Ltd as shown in
that is responsible to take forces along the
2b. The machine has several embedded sensors that are capable of recording velocities
the tool, and x – load etc. The machine has a Lab
and stored vertical axis loads were then extracted and used for the processing.
plate is position in such a way that advancing side
side at which plasticized material is drawn by the tool shoulder
Omolayo M. Ikumapayi & Esther T. Akinlabi
.6197 SCOPUS Indexed Journal
Figure 1: Schematic Diagram for the Preparation and Characterizations of CFA & WFA
Method of Conditioning Wood and Coal Fly Ashes Nanoparticles
process or method of heating a substance with controlled temperature and controlled
e. thermal treatment process of material in the absence or limited supply of air in order to induce thermal
stability, phase transition, thermal decomposition as well as the removal of a volatile fraction from the material before
. This is done to improve the strength, texture, thermal stability etc. The milled FAs nanopa
directly as reinforcement to the workpiece that will be processed without first of all conditioned to a stable temperature to
remove the impurities and contaminants that may be trapped within. On this note, the processed powders w
undergone calcination, which is, conditioning process to ensure thermal stability. The calcination of each powder was
NPs and CFA-NPs in a separate pure graphite crucible and then put them carefully inside
C one after the other for two (2) hours, after the 2 hours the furnace was put off and the
carbonaceous powder was allowed to cool to room temperature inside the furnace before it was brought out for use and
was performed on each powder to ensure smoothness of the carbonaceous powder before use.
EXPERIMENTAL PROCEDURES USED IN FRICTION STIR PROCESSING
(FSP) was carried out on a two Ton linear numerical controlled friction stir weldin
machine produced by ETA Bangalore, India Ltd as shown in Figure 2a, the machine is equipped with a load cell
the Z direction. The schematic representation of the arrangement is shown in
b. The machine has several embedded sensors that are capable of recording velocities x-axis
The machine has a Lab View software features capable of acquiring real
vertical axis loads were then extracted and used for the processing. During FSP,
plate is position in such a way that advancing side (AS) will be positioned along the tool clockwise rotation
material is drawn by the tool shoulder while the retreating side (RS)
Omolayo M. Ikumapayi & Esther T. Akinlabi
NAAS Rating: 3.11
method of heating a substance with controlled temperature and controlled
y of air in order to induce thermal
removal of a volatile fraction from the material before
. This is done to improve the strength, texture, thermal stability etc. The milled FAs nanoparticles cannot be applied
directly as reinforcement to the workpiece that will be processed without first of all conditioned to a stable temperature to
within. On this note, the processed powders were first
undergone calcination, which is, conditioning process to ensure thermal stability. The calcination of each powder was
NPs in a separate pure graphite crucible and then put them carefully inside
C one after the other for two (2) hours, after the 2 hours the furnace was put off and the
carbonaceous powder was allowed to cool to room temperature inside the furnace before it was brought out for use and
was performed on each powder to ensure smoothness of the carbonaceous powder before use.
USED IN FRICTION STIR PROCESSING
was carried out on a two Ton linear numerical controlled friction stir welding
a, the machine is equipped with a load cell
direction. The schematic representation of the arrangement is shown in Figure
axis, z – position, x- position of
View software features capable of acquiring real-time data. The recorded
During FSP, aluminium 7075-T651 alloy
will be positioned along the tool clockwise rotation, that is, the
(RS) will be positioned in reverse
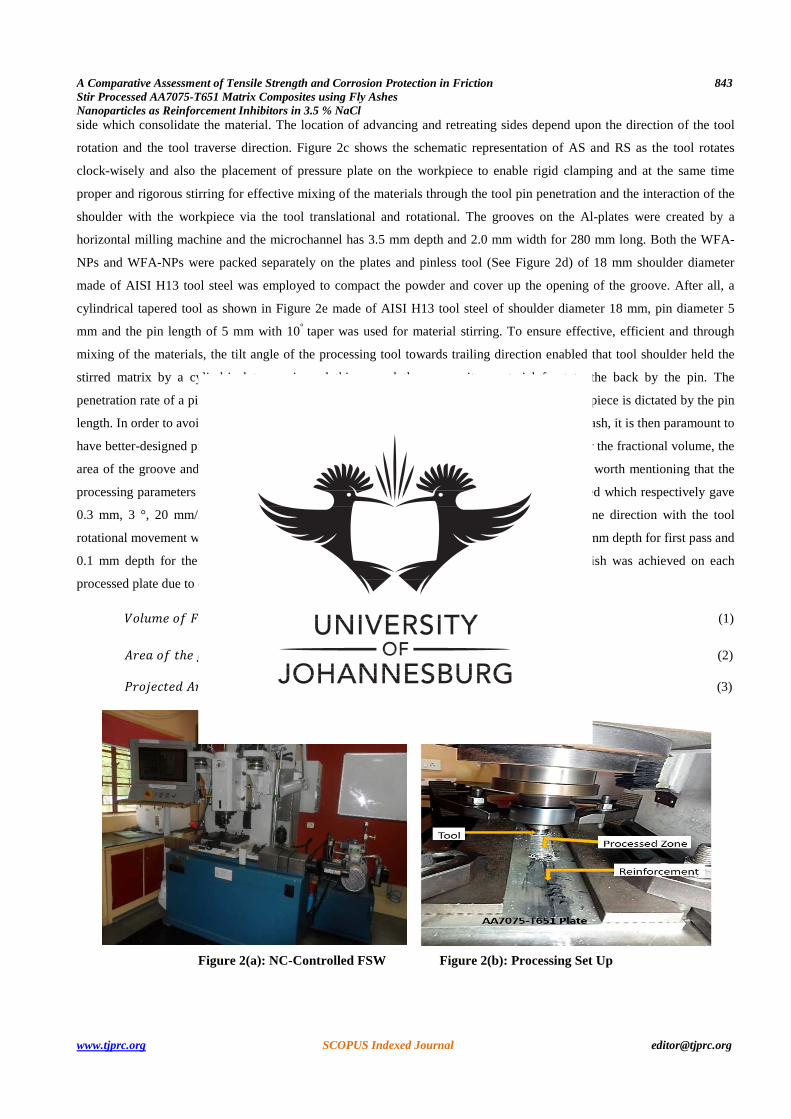
A Comparative Assessment of Tensile Strength and Corrosion Protection in Friction 843 Stir Processed AA7075-T651 Matrix Composites using Fly Ashes Nanoparticles as Reinforcement Inhibitors in 3.5 % NaCl
www.tjprc.org SCOPUS Indexed Journal [email protected]
side which consolidate the material. The location of advancing and retreating sides depend upon the direction of the tool
rotation and the tool traverse direction. Figure 2c shows the schematic representation of AS and RS as the tool rotates
clock-wisely and also the placement of pressure plate on the workpiece to enable rigid clamping and at the same time
proper and rigorous stirring for effective mixing of the materials through the tool pin penetration and the interaction of the
shoulder with the workpiece via the tool translational and rotational. The grooves on the Al-plates were created by a
horizontal milling machine and the microchannel has 3.5 mm depth and 2.0 mm width for 280 mm long. Both the WFA-
NPs and WFA-NPs were packed separately on the plates and pinless tool (See Figure 2d) of 18 mm shoulder diameter
made of AISI H13 tool steel was employed to compact the powder and cover up the opening of the groove. After all, a
cylindrical tapered tool as shown in Figure 2e made of AISI H13 tool steel of shoulder diameter 18 mm, pin diameter 5
mm and the pin length of 5 mm with 10° taper was used for material stirring. To ensure effective, efficient and through
mixing of the materials, the tilt angle of the processing tool towards trailing direction enabled that tool shoulder held the
stirred matrix by a cylindrical taper pin and this moved the composites material front to the back by the pin. The
penetration rate of a pin depth as well as the tool shoulder radius when in contact with the workpiece is dictated by the pin
length. In order to avoid defects in surface groove, inner channel, local thinning and excessive flash, it is then paramount to
have better-designed pin profile to process the plates and ensure defects free. The calculation for the fractional volume, the
area of the groove and the projected area of the tool pin is as shown in equation i to iii[19]. It worth mentioning that the
processing parameters used were plunge depth, tilt angles, processing speed and rotational speed which respectively gave
0.3 mm, 3 °, 20 mm/min and 1500 rpm. Two passes on each process parameters in the same direction with the tool
rotational movement with 100 % inter-pass overlap. The distribution of the double passes is 0.2 mm depth for first pass and
0.1 mm depth for the second pass with 100 % inter-pass overlap. A remarkable surface finish was achieved on each
processed plate due to differentially selected processing parameters
=
! " 100 (1)
% ℎ '( = )( *+ ℎ " )( +, ℎ (2)
-. + % ℎ , = - + " - ' ℎ (3)
Figure 2(a): NC-Controlled FSW Figure 2(b): Processing Set Up

844
Impact Factor (JCC): 7.6197
Figure 2(c): Schematic 3D
TENSILE TESTING
Tensile test specimens were prepared in conformance to the standard test requirement ASTM B557M
The tests samples were 6mm thickness is a substandard size of 100 mm long were cut to specification using waterjet
Figure 3a shows the three dimensional model at different orientation of the test sample while Figure 3b shows the
photograph images of the test samples before and after fracture had taken place. Figure 3c represents the X
Zwick/Roell Z250 tensile testing machine which has the capacity of 250 kN force and 2mV/v characteristics.
The data were acquired on testXpert II software installed on a PC. The tests were carried out on AA7075
AA7075-T651/CFA-NPs, processed AA7075
triplicate and the average values were taken and recorded for plotting and analysis. The following parameters were
recorded and evaluated the maximum stress value (R
at 0.5 % offset strain (Rp0.5), stress-longitudinal plots, and
Figure 3(a): 3D Model
Omolayo M. Ikumapayi & Esther T. Akinlabi
.6197 SCOPUS Indexed Journal
3D Model of FSP Figure 2(d) & (e): Pinless Tool
Tensile test specimens were prepared in conformance to the standard test requirement ASTM B557M
The tests samples were 6mm thickness is a substandard size of 100 mm long were cut to specification using waterjet
Figure 3a shows the three dimensional model at different orientation of the test sample while Figure 3b shows the
photograph images of the test samples before and after fracture had taken place. Figure 3c represents the X
ll Z250 tensile testing machine which has the capacity of 250 kN force and 2mV/v characteristics.
The data were acquired on testXpert II software installed on a PC. The tests were carried out on AA7075
ocessed AA7075-T651 and unprocessed AA7075-T651. The tests were conducted in a
triplicate and the average values were taken and recorded for plotting and analysis. The following parameters were
the maximum stress value (Rm), the stress at 0.1 % offset strain (Rp0.1), Young Modulus (M
longitudinal plots, and the stress at 0.2 % offset strain (Rp0.2
Model of the Tensile Specimen used at Different Geometry
Omolayo M. Ikumapayi & Esther T. Akinlabi
NAAS Rating: 3.11
Tool & Tool with Pin
Tensile test specimens were prepared in conformance to the standard test requirement ASTM B557M-10.
The tests samples were 6mm thickness is a substandard size of 100 mm long were cut to specification using waterjet cutter.
Figure 3a shows the three dimensional model at different orientation of the test sample while Figure 3b shows the
photograph images of the test samples before and after fracture had taken place. Figure 3c represents the X force P type of
ll Z250 tensile testing machine which has the capacity of 250 kN force and 2mV/v characteristics.
The data were acquired on testXpert II software installed on a PC. The tests were carried out on AA7075-T651/WFA-NPs,
T651. The tests were conducted in a
triplicate and the average values were taken and recorded for plotting and analysis. The following parameters were
), Young Modulus (ME), stress
p0.2) as depicted in Figure 6.
Different Geometry

A Comparative Assessment of Tensile Strength and Corrosion Protection in Friction 845 Stir Processed AA7075-T651 Matrix Composites using Fly Ashes Nanoparticles as Reinforcement Inhibitors in 3.5 % NaCl
www.tjprc.org SCOPUS Indexed Journal [email protected]
Figure 3(b): Macrograph of Tensile Test Specimen
Figure 3(c): Zwick/Roell Z250 Tensile Testing Machine
CORROSION TEST
Corrosion Sample Preparation
The percentage inhibition performance efficiency (%IPE) was conducted on friction stir processed aluminium
alloy matrix composites of AA7075-T651/WFA-NPs and AA7075-T651/CFA-NPs. The corrosion test samples are in the
dimensions 24 mm x 10 mm x 6 mm. The corrosion tests were also conducted on the unprocessed base metal (UBM) and
processed base metal (PBM) without reinforcement to as control experiment 1and 2 respectively. The samples were
prepared for corrosion test by grinding and polishing them in different grades of emery papers varying from 280, 350, 500,
and 800 to 1200 grades and were well rinsed in sufficient distilled water. A corrosive medium containing 3.5 % NaCl
solution to serve as seawater for the test.
Electrochemical Measurement
The electrochemical behaviours of the friction stir processed aluminium alloy matrix composites (AMC)
containing the following samples tests AA7075-T651/WFA-NPs, AA7075-T651/CFA-NPs, PBM and UBM were
examined by using open circuit potential (OCP) and potentiodynamic polarisation measurements were also carried out
using Autolab PGSTAT 101 Metrohm potentiostat/galvanostat in which NOVA software 2.1.2 version was incorporated

846 Omolayo M. Ikumapayi & Esther T. Akinlabi
Impact Factor (JCC): 7.6197 SCOPUS Indexed Journal NAAS Rating: 3.11
and an electrochemical cell which has 3-electrode connections was used and the test was performed at an ambient
temperature of 25°C containing 100 ml of 3.5 % NaCl solution as electrolyte. The working electrodes (WE) in this study
were AA7075-T651/WFA-NPs, AA7075-T651/CFA-NPs, PBM and UBM; the counter electrode (CE) which is the
auxiliary electrode in the study was graphite and the reference electrode (RE) was potassium chloride electrode (PCE). The
potentiodynamic polarization plots were set at a cathodic potential of -1.5 V and anodic potential of 1.5 V against open
circuit potential with 0.005 m/s sweep rate, i. e. scan rate. The working electrodes were individually immersed in the 3.54
% NaCl medium of electrolytes while the OCP of each WE were estimated in a span of 10 minutes and for a steady-state
potential to be attained, at the same time potentiodynamic polarisation values were recorded after the OCP values were
taken. To ensure and confirm reproducibility corrosion test was performed three times on each WE. The following data
were extracted from the Tafel curves and recorded, polarization potential (Ecorr), current density (jcorr), while the
percentage inhibition performance efficiency (IPE %) i.e. the percentage corrosion mitigation ability and the surface
courage () were calculated using equations iv to v[20]–[23].
/ = 1 − 1233
41233 (4)
5-6 % = 1 − 1233
41233 " 100 (5)
Where jcorr is the inhibited corrosion current densities and jocorr is the uninhibited corrosion current density.
RESULTS AND DISCUSSIONS
Characterizations of WFA-NPs and CFA-NPs
Morphological and physiological behaviours of FAs were carried using different tools to analyse them.
The chemical composition of the FAs was carried out using X-Ray Fluorescence (XRF) spectroscopy (model PHILIP
PW1404 XRF) Wavelength Disperse Spectrometer and the analysis of the investigation is as displayed in Table 3.
Table 3: The Chemical Composition of CFA-NPs and WFA-NPs
Chemical Formula CFA (wt%) WFA (wt%) Al 2O3 30.93 10.7 SiO2 51.43 46.31 MgO 1.95 0.36 TiO2 1.74 0.933 Fe2O3 2.29 17.28 CaO 6.75 3.002 MnO 0.02 - MnO2 - 0.0471 Na2O 0.54 2.48 P2O3 1.08 - P2O5 - 0.113 Cr2O3 0.77 - K2O 0.77 2.53 N2O 0.01 - SO3 0.54 3.423 LOI 1.21 8
Σ= 99.28 Σ= 87.17
The Scanning electron microscope (SEM) of model TESCAN and type VEGA 3 LMH coupled with Energy
Dispersive Spectrometer (EDS) was employed for the morphological study of the FAs. Each sample was first sputter-
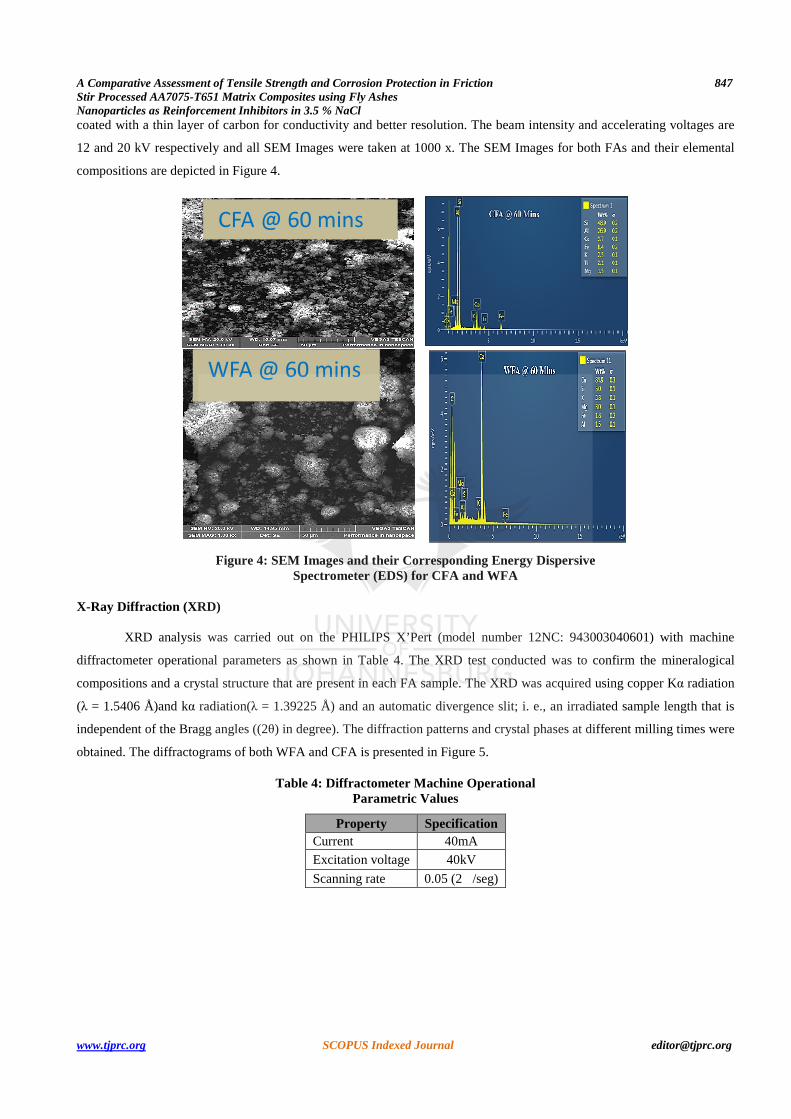
A Comparative Assessment of Tensile Strength and Corrosion Protection in Friction 847 Stir Processed AA7075-T651 Matrix Composites using Fly Ashes Nanoparticles as Reinforcement Inhibitors in 3.5 % NaCl
www.tjprc.org SCOPUS Indexed Journal [email protected]
coated with a thin layer of carbon for conductivity and better resolution. The beam intensity and accelerating voltages are
12 and 20 kV respectively and all SEM Images were taken at 1000 x. The SEM Images for both FAs and their elemental
compositions are depicted in Figure 4.
Figure 4: SEM Images and their Corresponding Energy Dispersive Spectrometer (EDS) for CFA and WFA
X-Ray Diffraction (XRD)
XRD analysis was carried out on the PHILIPS X’Pert (model number 12NC: 943003040601) with machine
diffractometer operational parameters as shown in Table 4. The XRD test conducted was to confirm the mineralogical
compositions and a crystal structure that are present in each FA sample. The XRD was acquired using copper Kα radiation
(λ = 1.5406 Å)and kα radiation(λ = 1.39225 Å) and an automatic divergence slit; i. e., an irradiated sample length that is
independent of the Bragg angles ((2θ) in degree). The diffraction patterns and crystal phases at different milling times were
obtained. The diffractograms of both WFA and CFA is presented in Figure 5.
Table 4: Diffractometer Machine Operational Parametric Values
Property Specification Current 40mA
Excitation voltage 40kV
Scanning rate 0.05 (2/seg)
WFA @ 60 mins
CFA @ 60 mins

848 Omolayo M. Ikumapayi & Esther T. Akinlabi
Impact Factor (JCC): 7.6197 SCOPUS Indexed Journal NAAS Rating: 3.11
Figure 5: XRD Diffractograms of CFA-NPs & WFA-NPs at different Milling Time
In Figure 5, the intensity decreased with milling time for the WFA, which remained almost constant for CFA.
Also, comparing the peak intensity of CFA with WFA, a higher value of count was observed at every stage of milling
CFA. At almost 30° (2) CFA and 30° (2) WFA, the peaks were observed to higher. When considering, CFA, it was higher
in 0 minutes and at 20, 40 and 60 minutes, the intensity maintained almost same peak, which dictates that there is the
stability of quality in CFA while in WFA, 0 minutes proved to have the highest peak and there was a gradual reduction as
the milling time increases. This reduction could be as a result of contaminations in WFA from the source of preparation or
the nature of the timber or wood-fired to generate ash. Hence, the integrity of the CFA remained evenly and subjective of
the fact that it is a suitable material (powder reinforcement and corrosion inhibitor) and with relative to its elemental
composition; show in high percentage proportion of Al2O3 and less of Iron Oxides. The opposite is the case of WFA.
The crystal phases detected by the XRD in WFA are rhombohedral, hexagonal, cubic and tetragonal while that of CFA are
anorthic, orthorhombic, hexagonal, and rhombohedral. XRD analysis also revealed that the minerals that are dominated in
wood fly ash are calcite (CaC03), quartz (SiO2), Sylvite (KCl), Lime (CaO), maghemite-Q (Ɣ-Fe2O3), nitratetine
(Na(NO3)) and magnetite (Fe3O4) while that of coal fly ash is Hematite (Fe2O3), Mullite (Al2.32Si0.68O4.84), Sillimanite
(Al 2(SiO4)O, Quartz (SiO2), Microcline (KAlSi3O8), Calcite high (CaCO3),.
TENSILE TEST RESULTS
Table 5 shows the results of the tensile tests conducted on the fabricated matrix composites by the use of Xforce P
type of Zwick/Roell Z250 tensile testing machine. The tests were conducted to evaluate the efficacy and potency of the
reinforcement such as WFA-NPs as well CFA-NPs on tensile behaviour. The tests were carried out on fabricated matrix
composites made up of AA7075-T651/WFA-NPs and also on the AA7075-T651/CFA-NPs aluminium matrix composites.
The tests were done in triplicate and their average values were taken and recorded. The tests were being conducted on the
processed base metal AA7075-T651 and unprocessed base material AA7075-T651 as both are serve as control
experiments. The combine plots for all the test samples is represented in Figure 6.
A Comparative Assessment of Tensile Strength and Corrosion Protection in Friction 849 Stir Processed AA7075-T651 Matrix Composites using Fly Ashes Nanoparticles as Reinforcement Inhibitors in 3.5 % NaCl
www.tjprc.org SCOPUS Indexed Journal [email protected]
Table 5: Tensile Results for AA7075-T651/WFA-NPs AMC, Unprocessed AA7075-T651, AA7075-T651/CFA-NPs AMC and Processed AA7075-T651
mE Rm Fm Rp0.1 Rp0.2 Rp0.5 Rt0.5 A t (corr.) GPa MPa kN MPa MPa MPa MPa %
PBM (AA7075 - T651)
5.35351 362.9048 13.06457 213.24 228.2679 251.8613 7.607991 14.30768
UBM (AA7075-T651)
9.38165 620.9030 22.35251 559.0751 572.9528 588.4694 7.334991 9.732209
AA7075-T651/WFA-NPs
5.82818 367.8804 13.2437 223.6769 237.2417 260.1043 8.392041 14.63601
AA7075-T651/CFA-NPs
5.14402 367.7832 13.2402 241.9172 254.6327 277.3155 7.749521 14.19652
Figure 6: Nominal Stress Versus Nominal Strain for AA7075-T651/WFA-NPs AMC, Unprocessed AA7075-T651, AA7075-T651/CFA-NPs AMC
and Processed AA7075-T651
Table 5presented the comparison tensile strength values on using coal fly ash and wood fly ash as reinforcement
particles on high strength aluminium alloy 7075-T651 and the result is being compared with processing aluminium alloy
7075-T651 without reinforcement as control 2 and unprocessed aluminium alloy 7075-T651 as control 1. It can be deduced
from Table 5that unprocessed base metal (UBM) which was control 1 has the highest ultimate tensile strength (Rm),
breaking force (Fm), Modulus of Elasticity (ME) and the stress at 0.2 % offset strain (Rp0.2) to be 620 MPa, 22.35251 KN,
9.38165 GPa, 237.2417 MPa respectively and also maintained its highest values in the case of stress at 0.1 % offset strain
(Rp0.1) and the stress at 0.5 % offset strain (Rp0.5) for 559.051 MPa and 588.4696 MPa respectively.
It was observed in Table 5that processed base metal (PBM) of AA7075-T651 without reinforcement has the
lowest values for ultimate tensile strength (Rm), breaking force (Fm), and the stress at 0.2 % offset strain (Rp0.2) as 362.9048
MPa, 13.06457 KN, and 228.2679 MPa respectively. Placing the tensile strength of friction stir processed of AA7075-
T651/WFA-NPs and AA7075-T651-CFA-NPs matrix composites and at the same time compare the tensile values with the
control experiments. It was observed that both matrix composites of AA7075-T651/CFA-NPs and AA7075-T651/WFA-
NPs have relatively equal tensile strength values, the ultimate tensile strength (Rm) for AA7075-T651/WFA-NPs was
367.8804 MPa while that of AA7075-T651/CFA-NPs was 367.7832 MPa this was also evident in Figure 6. Both the
AA7075-T651/CFA-NPs and AA7075-T651/WFA-NPs have a relatively equal number of breaking force (Fm) of 13.2402
and 13.2437 KN respectively which is slightlyhigher than that of PBM. Similar relative values for AA7075-T651/CFA-

850 Omolayo M. Ikumapayi & Esther T. Akinlabi
Impact Factor (JCC): 7.6197 SCOPUS Indexed Journal NAAS Rating: 3.11
NPs and AA7075-T651/WFA-NPs were recorded in Modulus of Elasticity (ME) and the stress at 0.2 % offset strain (Rp0.2)
which are 5.14402 and 5.82818 respectively which are also close to the value of PBM. The reinforcement of AA7075-
T651 with nanoparticles of WFA and CFA has no significant effects on the tensile strength of aluminium alloy 7075-T651
when compared with processed base metal – AA7075-T651 without reinforcement as they all have extremely close values
for tensile data which was also predicted in stress vs strain curves depicted in Figure 6.
Corrosion Mitigation Assessments
Pitting Corrosion
Pit corrosion attack is the type of corrosion that occur in the presence of aggressive, vigorous and active chlorine
ions [24]. Crack initiation during pitting attacks usually occur at the weakest sites in the oxides as a result of the violet and
effective chlorine attack. Equations vi–ix presents chemical equation for the illustration pit propagation[25].
% → %9 + 3< (6)
% + 3=>? → %(?=)9 + 3=B (7)
The most crucial reduction procedures is the reduction of oxygen in the reaction and the evolution of hydrogen at
the metallic cathodes
2=B + 2 → => (8)
?> + 2=>? + 4 (9)
It was observed that increase in the pits propagations changes the anodic pit environment.
Tafel Polarization Test
The Tafel polarization tests were used to measure the degree of pitting corrosion resistance. The nugget area of
the processed test samples such as AA7075-T651/WFA-NPs, AA7075-T651/CFA-NPs and processed AA7075-T651
without reinforcement as well as unprocessed base metal AA7075-T651 were all exposed to 3.5 % NaCl medium for the
determination of anodic polarization plots. The value of corrosion rate (CR), corrosion density (), anodic slope (ba),
polarization resistance (PR), corrosion potential (6), and cathodic slope (bc) were derived by interpolating cathodic and
anodic tafel plots in the presence and absence of reinforcement inhibitors as shown in Table 6 and Figure 8 while Equation
5 was employed to evaluate percentage inhibition efficiency (IE %). The corresponding values for OCP has been presented
in Table 6 and Figure 7 which reveals that polarization has taken place by combine integrated effects of anodic and
cathodic branches. It can be deduced from experimental results that corrosion protection rate is influenced by the presence
of inhibitors which greatly reduced corrosion rate and there exists in the cathodic and anodic polarization plots a migration
in the values of corrosion rate towards the current densities. Evolution of cathodic reaction and dissolution of anodic
reactions in the matrix of aluminium alloy are hindered by this migration [22], [26], [27].
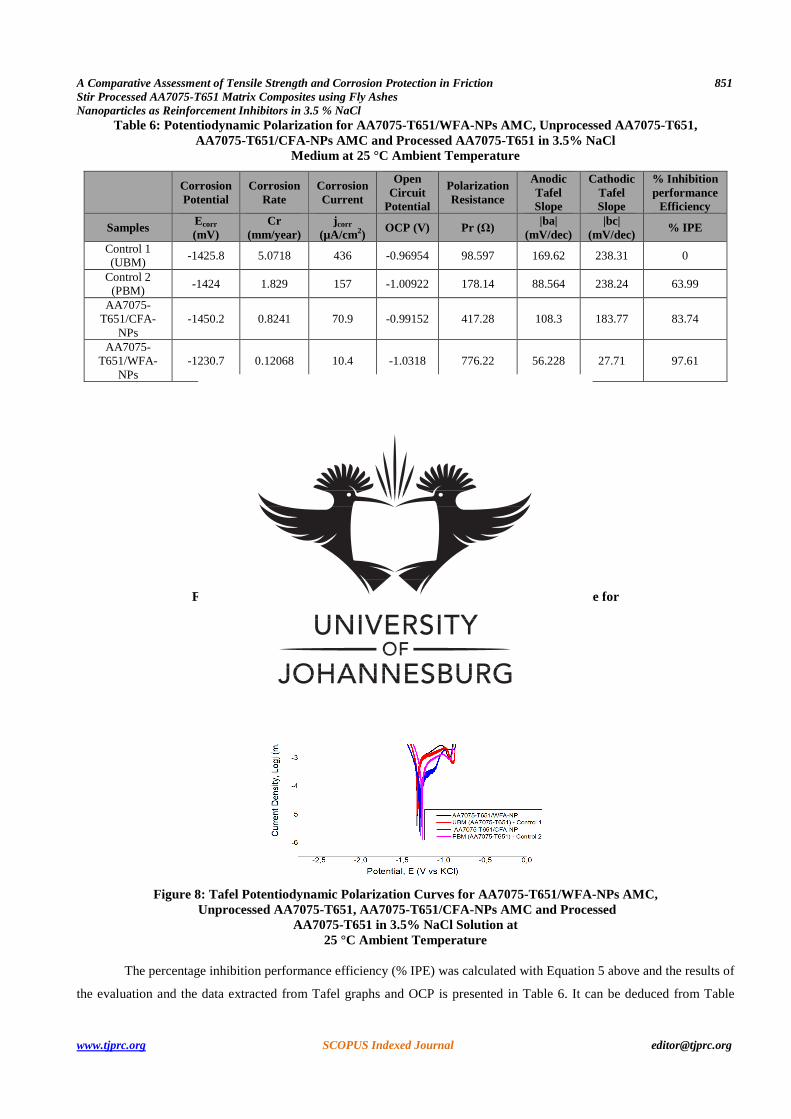
A Comparative Assessment of Tensile Strength and Corrosion Protection in Friction 851 Stir Processed AA7075-T651 Matrix Composites using Fly Ashes Nanoparticles as Reinforcement Inhibitors in 3.5 % NaCl
www.tjprc.org SCOPUS Indexed Journal [email protected]
Table 6: Potentiodynamic Polarization for AA7075-T651/WFA-NPs AMC, Unprocessed AA7075-T651, AA7075-T651/CFA-NPs AMC and Processed AA7075-T651 in 3.5% NaCl
Medium at 25 °C Ambient Temperature
Corrosion Potential
Corrosion Rate
Corrosion Current
Open Circuit
Potential
Polarization Resistance
Anodic Tafel Slope
Cathodic Tafel Slope
% Inhibition performance
Efficiency
Samples Ecorr
(mV) Cr
(mm/year) j corr
(µA/cm2) OCP (V) Pr (Ω) |ba|
(mV/dec) |bc|
(mV/dec) % IPE
Control 1 (UBM)
-1425.8 5.0718 436 -0.96954 98.597 169.62 238.31 0
Control 2 (PBM)
-1424 1.829 157 -1.00922 178.14 88.564 238.24 63.99
AA7075-T651/CFA-
NPs -1450.2 0.8241 70.9 -0.99152 417.28 108.3 183.77 83.74
AA7075-T651/WFA-
NPs -1230.7 0.12068 10.4 -1.0318 776.22 56.228 27.71 97.61
Figure 7: Evolution of Open Circuit Potential (OCP) vs. Exposure Time for AA7075-T651/WFA-NPs AMC, Unprocessed AA7075-T651,
AA7075-T651/CFA-NPs AMC and Processed AA7075-T651 in 3.5% NaCl Solution at
Ambient Temperature of 25 °C
Figure 8: Tafel Potentiodynamic Polarization Curves for AA7075-T651/WFA-NPs AMC, Unprocessed AA7075-T651, AA7075-T651/CFA-NPs AMC and Processed
AA7075-T651 in 3.5% NaCl Solution at 25 °C Ambient Temperature
The percentage inhibition performance efficiency (% IPE) was calculated with Equation 5 above and the results of
the evaluation and the data extracted from Tafel graphs and OCP is presented in Table 6. It can be deduced from Table

852 Omolayo M. Ikumapayi & Esther T. Akinlabi
Impact Factor (JCC): 7.6197 SCOPUS Indexed Journal NAAS Rating: 3.11
6that matrix composites AA7075-T651/WFA-NPs exhibits the highest corrosion protection performance with % IPE of
97.61 % as against AA7075-T651/CFA-NPs corrosion protection performance efficiency with %IPE of 83.74 %.
This trend was also manifested in the values of corrosion rate for AA7075-T651/WFA-NPs and AA7075-T651/CFA-NPs
which are 0.12068 and 0.8241 mm/year and with polarization resistances of 776.22 Ω and 417.28 Ω respectively. The two
matrix composites under investigations performed far better than the control experiments. Control 1 which was untreated
base metal (UBM) and has been taken as reference point of study with corrosion rate of 5.0718 mm/year and polarization
resistance of 98.597 Ω while control experiment 2 which was processed or treated base metal (PBM) without
reinforcement has a corrosion rate of 1.829 mm/year which is very close to the value got for AA7075-T651/CFA-NPs and
its polarization resistance was 178.14 Ω with a % IPE of 63.9 %. The trend observed in Table 6 was also supported by
Figures 7 and 8. In general, one could see that reinforcement with wood fly ash nanoparticles in friction stir processing
resists corrosion attack than coal fly ash nanoparticles under the same environmental corrosion mitigation medium.
The shift in the negative trends of the corrosion potential values (Ecorr) suggests potency of cathodic protection of the
processing technique and the reinforcement applied.
CONCLUSIONS
From the experimental procedures, results and conclusions, the following assertions can be made:
• The Investigations reveals an excellent performance of wood fly ash nanoparticles when used for reinforcement
and corrosion inhibition in friction stir processed AA7075-T651 when immersed in 3.5 % NaCl medium in
ambient temperature by potentiodynamic polarization method.
• Aluminium 7075-T651 alloy Metal Matrix composites reinforced with wood fly ash exhibits the largest
percentage of inhibition performance efficiency (%IPE) with a value of 97.61 % and that of coal fly ash inhibitive
reinforcement particle has % IPE of 83.74 which also shows high corrosion protection has compared to PBM-
control 2.
• It can be inferred from the results that AA7075-T61/WFA-NPs has an outstanding corrosion reduction rate which
got reduced from the corrosion rate of unprocessed base metal AA7075-T651 which was observed to be 5.0718
mm/year to that made of AA7075-T61/WFA-NPs matrix composites which was 0.12068 mm/year.
• It can be concluded that the higher the polarization resistance the better the rate of corrosion protection, AA7075-
T61/WFA-NPs aluminium matrix which had the lowest corrosion rate at the same time highest polarization
resistance which are 0.12068 mm/year and 776.22 Ω respectively with a reduction in amount of current density
which is 10.4 µA/cm2.
• The unprocessed and untreated base metal (UBM) – control 1 has the highest tensile strength of 620.9030 MPa
with breaking force of 22.35251 KN and highest elastic modulus of 9.38165 GPa among others. UBM isproved to
have exceptional tensile strength behavioural characteristics.
• It was revealed that tensile strength values when AA7075-T651 was reinforced with WFA-NPs and CFA-NPs are
very close which was 367.8804 and 367.7832 MPa, this was also observed to be in a close range with procced
base metal (PBM) –control 2 which has a tensile strength of 362.9048 MPa. By this, it can be deduced that FAs
nanoparticles have no significant influence of the reinforcement of friction stir processed AA7075-T651.

A Comparative Assessment of Tensile Strength and Corrosion Protection in Friction 853 Stir Processed AA7075-T651 Matrix Composites using Fly Ashes Nanoparticles as Reinforcement Inhibitors in 3.5 % NaCl
www.tjprc.org SCOPUS Indexed Journal [email protected]
Appreciation
We want to sincerely thank the Chairman of Friction Stir Welding Laboratory, Prof. S. K. Pal for the permission
granted to us to work on the friction stir welding machine at the Indian Institute of Technology (IIT) Kharagpur, India;
Also, Dr. O. S. I. Fayomi, the Head of Surface Engineering Research Centre, Covenant University, Ota, Nigeria, for the
permission to work on corrosion testing equipment; To the management of Material and Metallurgical Laboratory,
Department of Mechanical Engineering Science, University of Johannesburg, South Africa where the tensile tests were
conducted and also the University of Johannesburg, South Africa for the research trip support to India.
Conflict of Interest
The authors declared that there is no known conflict of interests
REFERENCES
1. O. M. Ikumapayi, E. T. Akinlabi, and J. D. Majumdar, “Review on thermal, thermo- mechanical and thermal stress
distribution during friction stir welding,” Int. J. Mech. Eng. Technol., vol. 9, no. 8, pp. 534–548, 2018.
2. Krishnaja Devireddy et al., “Analysis of the Influence of Friction Stir processing on Gas Tungsten Arc Welding of 2024
Aluminum Alloy Weld Zone,” Int. J. Mech. Prod. Eng. Res. Dev., vol. 8, no. 1, pp. 243–252, 2018.
3. A. Cerit, M. B. Karamiş, N. Fehmi, and Y. Kemal, “Effect of reinforcement particle size and volume fraction on wear
behaviour of metal matrix composites,” Tribol. Ind., vol. 30, no. 3–4, pp. 31–36, 2008.
4. D. N. Sun and Apelian, “Friction Stir Processing of Aluminum Cast Alloys for High Performance Applications,” Alum. Form.,
pp. 44–50, 2011.
5. Sudhakar. M; Srinivasa Rao. CH; Meera Saheb. K, “Production of Surface Composites by Friction Stir Processing,” Mater.
Today Proc., vol. 5, no. 1, pp. 929–935, 2018.
6. Bawdekar and S. Singh, “Surface hardening and microstructural evolution of high carbon steel by friction stir processing,”
Int. J. Mech. Prod. Eng. Res. Dev., vol. 7, no. 3, pp. 343–354, 2017.
7. Dinaharan, “Influence of ceramic particulate type on microstructure and tensile strength of aluminum matrix composites
produced using friction stir processing,” J. Asian Ceram. Soc., vol. 4, no. 2, pp. 209–218, 2016.
8. P. M. Kumar and S. Jerome, “Effect Of Eccentricity Pin Geometry On The Fabrication Of Surface Composite (Al6061-T6
/Sic) By Friction Stir Processing,” Int. J. Mech. Prod. Eng. Res. Dev., vol. 8, no. 6, pp. 249–254, 2018.
9. O. Sanusi and E. T. Akinlabi, “Friction-stir processing of a composite aluminium alloy (AA 1050) reinforced with titanium
carbide powder,” Mater. Tehnol., vol. 51, no. 3, pp. 427–435, 2017.
10. N. Fatchurrohman, N. Farhana, and C. D. Marini, “Investigation on the effect of Friction Stir Processing Parameters on
Micro-structure and Micro-hardness of Rice Husk Ash reinforced Al6061 Metal Matrix Composites,” IOP Conf. Ser. Mater.
Sci. Eng., vol. 319, no. 1, pp. 0–6, 2018.
11. Y. X. Gan, D. Solomon, and M. Reinbolt, “Friction stir processing of particle reinforced composite materials,” Materials
(Basel)., vol. 3, no. 1, pp. 329–350, 2010.
12. S. A. Afolalu, A. A. Abioye, M. O. Udo, O. R. Adetunji, O. M. Ikumapayi, and S. B. Adejuyigbe, “Data showing the effects of
temperature and time variances on nano-additives treatment of mild steel during machining,” Data Br., vol. 19, pp. 456–461,
2018.

854 Omolayo M. Ikumapayi & Esther T. Akinlabi
Impact Factor (JCC): 7.6197 SCOPUS Indexed Journal NAAS Rating: 3.11
13. Kumar, R., Pedgopu, V., Kumar, Anil., Thakur, Robin., & Pundir, Anil. (2013). CFD based analysis heat transfer and friction
characteristics of broken multiple rib roughened solar air heater duct. Int J Mech Prod Eng Res Dev, 3, 165-172.
14. A. Daniyan, A. M. Omokhuale, A. A. Aderoba, O. M. Ikumapayi, and B. A. Adaramola, “Development and performance
evaluation of organic fertilizer machinery,” Cogent Eng., vol. 8, no. 1, pp. 1–22, 2017.
15. H. Rana, V. Badheka, A. Kumar, and A. Satyaprasad, “Strategical parametric investigation on manufacturing of Al–Mg–Zn–
Cu alloy surface composites using FSP,” Mater. Manuf. Process., vol. 33, no. 5, pp. 534–545, 2018
16. Sert and O. N. Celik, “Wear behavior of SiC-reinforced surface composite Al7075-T651 aluminum alloy produced using
friction stir processing,” Indian J. Eng. Mater. Sci., vol. 21, no. February, pp. 35–43, 2014.
17. P. Loganathan, A. Gnanavelbabu, and K. Rajkumar, “Analysis and characterization of friction behaviour on AA7075 / ZrB 2
composite under dry sliding condition Analysis and characterization of friction behaviour on AA7075 / ZrB 2 composite under
dry sliding condition,” Mater. Res. Express, vol. 6, pp. 1–14, 2019.
18. S. Joyson, A. Isaac, D. Jebaraj, D. Raja, S. Esther, and T. Akinlabi, “Microstructural Characterization and Tensile Behavior
of Rutile ( TiO2 ) - Microstructural Characterization and Tensile Behavior of Rutile ( TiO 2 ) - Reinforced AA6063 Aluminum
Matrix Composites Prepared by Friction Stir Processing,” Acta Metall. Sin. (English Lett., no. August, pp. 1–12, 2018.
19. G. Akande, O. O. Oluwole, and O. S. I. Fayomi, “Optimizing the defensive characteristics of mild steel via the
electrodeposition of Zn–Si3N4 reinforcing particles,” Def. Technol., no. xxxx, pp. 1–7, 2018.
20. O. S. I. Fayomi and I. G. Akande, “Corrosion Mitigation of Aluminium in 3. 65 % NaCl Medium Using Hexamine,” J. Bio-
Tribo-Corrosion, vol. 5, no. 23, p. 0, 2019.
21. H. Gerengi, M. M. Solomon, F. E. Bagci, and E. J. Abai, “An evaluation of the anticorrosion e ff ect of ethylene glycol for
AA7075-T6 alloy in 3. 5 % NaCl solution,” Measurement, vol. 116, no. November 2018, pp. 264–272, 2018.
22. D. Mantha and S. A. Fawaz, “Standardized Test Method for Corrosion Pit-to-Fatigue Crack Transition for AA7075-T651
Aluminum Alloy,” Adv. Mater. Res., vol. 891–892, pp. 205–210, 2014.
23. Yadav, D., & Gaikwad, A. (2015). Comparison and testing of tensile strength for low & medium carbon steel. International
Journal of Mechanical Engineering (IJME), 4(5), 1-8.
24. D. Raguraman, D. Muruganandam, and L. K. K. Dhas, “Corrosion study in friction stir welded plates of AA6061 and
AA7075,” Int. J. ChemTech Res., vol. 6, no. 4, pp. 2577–2582, 2014.
25. Y. Liu and J. M. C. M. G. C. A. M. Janssen, “Combined Corrosion and Wear of Aluminium Alloy 7075-T6,” J. Bio- Tribo-
Corrosion, vol. 2, no. 2, pp. 1–7, 2016.
26. O. D. L. El, G. O. Hamed, and S. J. A. El, “Anticorrosive Formulation Based of the Epoxy Resin – Polyaminoamide
Containing Zinc Phosphate Inhibitive Pigment Applied on Sulfo- Tartaric Anodized AA 7075-T6 in NaCl Medium,” J. Bio-
Tribo-Corrosion, vol. 5, no. 25, pp. 1–9, 2019.

37
2.8 ARTICLE VII
The data showing the effects of vibratory-disc milling time on the
microstructural characteristics of Coconut-Shell Nano-particles (CS-NPs)
Published in Data in Brief, Vol 22, 2019, Pages 537 - 545.
DOI: https://doi.org/10.1016/j.dib.2018.12.067,
ISSN: 2352-3409
In this research article, Coconut Shell (CS) was milled into powder with the aid of the vibratory
disc milling/grinding machine. The powder was characterised by using different tools, such as the
scanning electron microscopy (SEM), X-Ray Fluorescence (XRF), and the Energy Dispersive X-
ray (EDX) analyses. The milling was carried out at different milling times, such as 0 min, 20
minutes, 40 minutes, in addition to 60 minutes; and the SEM Images were captured at different
magnifications, such as 1.00 kx, 2.00 kx and 5.00 kx, which produced respectively 50 µm, 20 µm
and 10 µm, in order to give clearer insight to the study. The SEM was used to capture the
morphological images at different milling times; while the EDX captured the elemental
compositions present in Coconut Shell Nano-particles (CS-NPs); and the XRF examined the
chemical compositions present in CS-NPs, as depicted in Table 2.6. The statistical measurement
of the grain sizes was taken, such as the Mean area, the Standard deviation, the number of particle
Sizes, the Minimum and the Maximum Area of the particle sizes were evaluated and recorded.
This published article has been able to address the objective of the study in item I.
Table 2. 6: The Chemical Composition Analysis of CS-NPs using XRF

Contents lists available at ScienceDirect
Data in Brief
Data in Brief 22 (2019) 537–545
https://d2352-34(http://c
n CorrE-m
journal homepage: www.elsevier.com/locate/dib
Data Article
Data showing the effects of vibratory disc millingtime on the microstructural characteristics ofCoconut Shell Nanoparticles (CS-NPs)
Omolayo M. Ikumapayi n, Esther T. AkinlabiDepartment of Mechanical Engineering Science, University of Johannesburg, Auckland Park KingswayCampus, Johannesburg, 2006, South Africa
a r t i c l e i n f o
Article history:Received 3 July 2018Received in revised form20 December 2018Accepted 20 December 2018Available online 24 December 2018
Keywords:Coconut shellEDXMilling timeNanoparticleSEMXRF
oi.org/10.1016/j.dib.2018.12.06709/& 2019 The Authors. Published by Elsereativecommons.org/licenses/by/4.0/).
esponding author.ail address: [email protected] (O.M. Iku
a b s t r a c t
Coconut Shell (CS) as agricultural lignocellulosic biomaterial andagro-waste is predominantly available in India, Malaysia, Nigeria,Thailand, Sri Lanka, and Indonesia. It has proven to have effectivedurability characteristic, good abstractive resistance, high tough-ness, and good adsorption properties, and is most suitable for longstanding use in many applications such as reinforcement, source ofenergy, fillers as well as activated carbon and its performance,efficiency and effectiveness depend wholly on whether is in formof nano-, micro-, and macro- particles. In this data, effects ofmilling time on morphological characteristics was experimentedusing Scanning Electron Microscopy (SEM), Energy DispersiveX-ray (EDX), and X-Ray Fluorescence (XRF) analyses. The SEMimages were taken at magnifications of 1.00kx, 2.00kx and 5.00kxwhich gives respective 50 mm, 20 mm and 10 mm in different millingtime of 0, 20, 40 and 60mins. Digital Vibratory Disc MillingMachine (VDMM) rated 380 V/50 Hz at 940 rpm was employed forthe grinding and the morphology of the milled nanoparticles werecharacterised. It was revealed from the data collected that 0min(i.e. 75 mm sieved) has the highest mean area value of 16.105 mm2
and area standard deviation of 200.738 mm2 with least value of anumber of particle size distribution of 809 mm. In contrast, 60mins
vier Inc. This is an open access article under the CC BY license
mapayi).

SMTH
DE
E
D
O.M. Ikumapayi, E.T. Akinlabi / Data in Brief 22 (2019) 537–545538
milled has the lowest values for mean area and area standarddeviation of 8.945 mm2 and 115.851 mm2 respectively with thehighest number of particle size distribution of 2032 mm. It wasobserved that milling time increases the number of particle sizesdistributions and reduces the area of particle size.
& 2019 The Authors. Published by Elsevier Inc. This is an openaccess article under the CC BY license
(http://creativecommons.org/licenses/by/4.0/).
Specifications table
ubject area
Mechanical Engineering & Material Science ore specific subject area Nanoparticle of Biomaterials ype of data Micrographs, graphs and table ow data was acquired Coconut shell was obtained from coconut fruits. It was then crushed,grinded and milled into nano-size with the help of vibratory discmilling machine. The milled and unmilled samples were then takenfor testing and characterisation using SEM-EDX as well as XRF
ata format
Raw and Analysed xperimental factors The milling time was taken at 0, 20, 40 and 60min using VibratoryDisc Milling Machine (VDMM). The SEM images were taken atmagnifications of 1.00kx, 2.00kx and 5.00kx for 50 mm, 20 mm and10 mm respectively.
xperimental features
Micrographs of the milled and unmilled samples, elemental com-position of tested samples at different milling times using EDX andalso chemical compositions of the sample.ata source location
University of Johannesburg, Johannesburg, South Africa ata accessibility The availability of the data is within the peripheral of this article DValue of the data
The data is very valuable in a manner that the users will be able to know the variation in elementalcompositions at different milling time as well as unmilled coconut shell nanoparticle (CS-NPs) asrevealed by EDX.
The data obtained can be used in investigating surface processing as well as aggregate, filler andreinforcement in both polymer and metal matrix composite at different milling time.
The data revealed the micrographs of the milled and unmilled coconut shell at different millingtime, the users will be able to see the trend and patterns of the milled coconut shell which can alsopredict the absorption rate of CS-NPs at any applications.
The data also presented various chemical compositions that are in Coconut Shell powder asrevealed by the XRF.
1. Data
The data presented are the characterizations derived from coconut shell powder in Fig. 2 that wasmilled using digital vibratory disc milling machine (VDMM) in Fig. 3. Chemical composition of thecoconut shell powder is presented in Table 1 as analysed by X-Ray Fluorescence (XRF). Micro-structural data from Scanning Electron Microscopy (SEM) in Fig. 4 were taken at different magnifi-cations of 1.00kx, 2.00kx and 5.00kx are presented in Fig. 5. Statistical data from the coconut shellnanoparticles such as particle sizes, mean area, standard deviation at different milling time as

Fig. 2. Grinded Coconut shell Powder (CS-P).
Fig. 1. a: Coconut fruits b: Coconut Shell (CS) c: Broken CS.
Fig. 3. Diagram of vibratory disc milling machine.
O.M. Ikumapayi, E.T. Akinlabi / Data in Brief 22 (2019) 537–545 539

Table 1The chemical composition analysis of CS-NPs using XRF.
Chemical Formula Al2O3 Ca0 MgO K2O Na2O SiO2 Fe2O3 MnO ZnO
CS-NPs (%) 16.76 0.78 19.4 0.42 0.41 45.6 8.98 0.17 0.39
Fig. 4. SEM-EDX analysis machine.
O.M. Ikumapayi, E.T. Akinlabi / Data in Brief 22 (2019) 537–545540
analysed by ImageJ are shown in Table 3. Details variable elemental compositions from the investi-gated coconut shell nanoparticles at different milling time of 0, 20, 40 and 60min as analysed byEnergy Dispersive X-ray (EDX) are presented in Fig. 6 and Table 4.
2. Experimental design, materials and methods
Matured and edible Coconuts Fruits (Fig. 1a) were obtained from commercial market at Johannesburg,South Africa and the outer part of the coconut fruits (exocarp) were removed with the aid of cutlass afterwhich they were then broken into smaller and irregular chunks in sizes which ranges from 2 to 10mm(Fig. 1b), the coconut water inside of them were drained and the edible part of them (mesocarp) wereremoved from the hard and woody part (endocarp) which was known as coconut shell (CS) - lig-nocellulosic agro-waste [1–3], the shell was then washed and cleaned with deionized water and acetoneto remove any unwanted contaminants (Fig. 1c) and this was then placed in an electric oven at 50 °C for5 days to remove any traces of moisture that may be present before taken for crushing.
2.1. Experimental methodology
The coconut shell obtained were dried at 50 °C in an electric oven for 5 days to ensure effectiveand total dryness of any moisture that may likely present therein. The coconut shell were then takenfor crushing with the aid of a crusher. The crusher was thoroughly washed, dried and cleaned withacetone before and after use to remove any contaminants within. The crusher was used to pulverizedit into small macro particles, this was further milled into smaller particles and sieved using ASTMmeshes standard range by employing KingTest Sieve of 75 mm size on KingTest Sieve Shaker(VB 200/300) having an operating voltage of 220 V/50 Hz and 5 A. The Coconut Shell powder (CS-P)

Fig. 5. (A –C) Unmilled CN-NPs at 1.0kx, 2.0kx and 5.0kx respectively, (D – F) 20min milled of CN-NPs at 1.0kx, 2.0kx and 5.0kxrespectively, (G – I) 40min milled of CN-NPs at 1.0kx, 2.0kx and 5.0kx respectively, (J – L) 60min milled of CN-NPs at 1.0kx,2.0kx and 5.0kx respectively.
O.M. Ikumapayi, E.T. Akinlabi / Data in Brief 22 (2019) 537–545 541

O.M. Ikumapayi, E.T. Akinlabi / Data in Brief 22 (2019) 537–545542
(Fig. 2) proportion that passed through the mesh size of 75 mmwas then taken for milling at differentmilling times.
2.2. X-ray fluorescence (XRF) analysis
In this research, PHILIPS PW1404 X-Ray Fluorescence (XRF) Spectrometer was used to analyse thechemical composition of CS-NPs after sieved with 75 mm ASTM standard sieve and the data gottenfrom the analysis is presented in Table 1.
2.3. Vibratory disc milling machine (VDMM)
Mechanical Dry milling (MDM) operation was performed using a digitalized vibratory disc millingmachine (Model 2MZ-200). The machine was thoroughly washed, dried and cleaned with acetonebefore and after use to remove any contaminants that may be present. 30 g of coconut samples werecharged into each bowl and then set for running. The machine was interrupted every 5min ofoperation in order to avoid a rise in temperature and at the same time to limit adherence of thepowder within the container walls, the cooling interval before the next running was 20min. Themachine has specification as presented in Table 2 and the milling effects on the particle size and meanarea of the sample is presented in Table 3 as analysed by ImageJ software.
It was revealed by ImageJ software processing analysis used for Table 3 data collection that at 0min (i.e. 75 mm sieved) has the highest mean area value of 16.105 mm2 and area standard deviation of200.738 mm2 with least value of a number of particle size distribution of 809 mm. In contrast, 60minsmilled has the lowest values for mean area and area standard deviation of 8.945 mm2 and 115.851 mm2
respectively with the highest number of particle size distribution of 2032 mm. It was observed thatmilling time increases the number of particle sizes distributions and reduces the area of particle size.It was revealed that progressive milling leads to an increase in particle size distributions and decreasein the area of the particle size as noted in Table 3.
2.4. Microstructural analysis
Coconut Shell Nanoparticles (CS-NPs) obtained were then characterised by the use of scanningelectron microscopy (SEM) and Energy dispersive X-ray spectroscopy (EDXS). These tools wereemployed to determine the morphology and the elemental composition at different milling time of
Table 2Vibratory disc milling machine specification.
Property Specification
Dimension 740 740 950mmNumber of bowls 2Capacity per bowl 200 gFeed Size o 15mmMotor 380 V/ 50 Hz, 1.5 KWMotor speed 940 rpm
Table 3Measurements of particle size area of CS-NPs at unmilled and varying milling time.
Milling Time (min) Mean Area (mm2) STD Area (mm2) Min. Area (mm2) Max. Area (mm2) No. of Particle Sizes (mm)
0 16.105 200.738 0.074 4,988.486 80920 14.384 178.957. 0.065 2,599.508 137940 12.528 147.684 0.057 908.293 163160 8.945 115.851 0.004 47.889 2032

O.M. Ikumapayi, E.T. Akinlabi / Data in Brief 22 (2019) 537–545 543
20, 40, 60min and unmilled samples. ImageJ software was employed to analyse the statisticalmeasurement of the SEM Image as displayed in Table 3.
2.5. Data acquisition
In this data article, mechanical dry milling (MDM) was carried out with different process millingtime of 20, 40 and 60min and powder of CS-NPs were studied using SEM-EDS. It was establishedfrom the data collected that the durations of MDM affected volume, surface area, particle size, poresize distributions, microstructure and some other mechanical properties as well as morphology of thepowders were affected.
2.6. Scanning electron microscope
TESCAN model, type VEGA 3 LMH and model no VG9731276ZA (Fig. 4) with the following details50/60 Hz, 230 V and 1300 VA was the type of SEM machine that was employed for the studies. Inorder to have the sample more conductive and to have better resolution, the samples were sputtercoated with a thin layer of carbon just before the scanning electron microscope analyses coupled withEnergy Dispersive X-ray spectrometer (EDXS) analyses. The beam intensity used in the analysis was12 and the accelerating voltage used was 20 kV, all micrographs were taken at SEM magnification of1.00kx, 2.00kx and 5.00kx for different milling times of 20, 40 and 60mins. The elemental compo-sitions of CS-NPs was also analysed at different milling times was analysed by SEM. The SEMmicrographs of different milling time were presented in Fig. 5 and the EDXS data were presented inFig. 6 and the data collected has been presented in Table 4. Sizes of CS-NPs were determined usingSEM/software.
Fig. 5(A – C) represent the micrographs for the unmilled Coconut Shell Powder at 1.0kx, 2.0kx and5.0kx amounting to 50 mm, 20 mm and 10 mm respectively. Fig. 5(D – F) show the micrographs of thesamples after 20 minutes of milling at 1.0kx, 2.0kx and 5.0kx giving 50 mm, 20 mm and 10 mmrespectively. Fig. 5(G – I) presented the micrographs of 40min milling at 1.0kx, 2.0kx and 5.0kxproducing 50 mm, 20 mm and 10 mm respectively while Fig. 5(J – L) represent the micrographs of60min milling at 1.0kx, 2.0kx and 5.0kx amounting to 50 mm, 20 mm and 10 mm respectively. The
Fig. 6. Elemental compositions at different milling time as analysed by EDXS.

Table 4Variable in elemental compositions of CS-NPs as analysed by EDXS.
Powder Element Elemental composition at different milling times
0min (Unmilled) 20min 40min 60min
CS-NPs C 65.0 66.2 65.2 66.3O 31.4 25.4 32.4 27.4K 2.3 3,9 1.2 2.5Cl 0.8 1.5 0.7 1.3Si n. d 0.4 0.3 0.8Ca 0.1 0.6 0.1 0.5Fe n. d 0.7 0.1 0.3Na n. d 0.3 n. d 0.3Cu 0.1 0.3 n. d 0.2Mg n. d 0.2 n. d 0.2P 0.2 0.2 n. d 0.1S 0.1 0.2 n. d 0.1Al n. d n. d n. d 0.1
n. d ( not detected)
O.M. Ikumapayi, E.T. Akinlabi / Data in Brief 22 (2019) 537–545544
micrographs revealed that unmilled has the largest particle sizes when compare to other milledpowder. The duration of milling greatly affects the distribution of the particles and how thecrystalline are arranged.
It was revealed by EDX analysis, that the main constituents of CS-NPs are Carbon, Oxygen,Potassium, Calcium, Phosphorous, Copper, silicon and Chlorine as evidenced in Fig. 6. It has also beenrevealed by XRF that the main chemical composition constituents in coconut shell powder are CaO,Al2O3, MgO, K2O, Na2O, MnO, ZnO, SiO2 as well as Fe2O3.
Table 4 showed the main elemental constituents of CS-NPs and their variable percentage com-positions. Carbon which is the major element has a range of 65.0 to 66.2%, Oxygen has percentagecomposition between 25.4 and 32.4%, Potassium is between 1.2 and 3.9%, and Chlorine is between0.7 and 1.5%, Calcium composition ranges from 0.1 to 0.6%. While Silicon, Iron, Sodium, Sulphur,Magnesium are not detected at all milling phases and as such may not be empirically regarded aselements detected.
2.7. Data areas of application
i. Carbonaceous coconut shell nanoparticle can be used as reinforcement when carbonized duringfriction stir processing and welding [4] and can also find application in other reinforcements.
ii. It can be used as raw material for activated carbon industries. In all activated carbon producer,coconut shell has been proven to produce top grade active carbon charcoal which got greatperformance [5–8].
iii. It can be used as filler for synthetic resin glues (thermoset moulding powder) in plywood andlaminating board companies [9,10].
iv. It can also be used as compound filler in the production of phenol formaldehyde mouldingpowder (Bakelite plastic) as filler and extender [11].
v. In South Asian countries, CS-NPs has been used as mosquito repellent by making it into mosquitocoils as a burning medium and as a means of controlling fungus in the wood [12].
vi. It can be used as lost circulation materials in the oil well drilling companies [13].vii. It can also be used in resin casting, mastic adhesives as well as bituminous products [14].
O.M. Ikumapayi, E.T. Akinlabi / Data in Brief 22 (2019) 537–545 545
Acknowledgements
The authors wish to acknowledge the financial support offered by the University of Johannesburg,South Africa in form of Supervisor-Linked and Merit Bursaries in actualisation of this research workfor publication.
Transparency document. Supporting information
Transparency data associated with this article can be found in the online version at https://doi.org/10.1016/j.dib.2018.12.067.
References
[1] O.I. Oluwole, K.L. Oluwaseun, Mechanical, abrasion and water absorption characteristics of coconut shell ash and charcoalbased polyester composites, West Indian J. Eng. 16 (2) (2016) 51–67.
[2] S.O. Agunsosoye, J.O. Isaac, T.S. Samuel, Study of mechanical behaviour of coconut shell reinforced polymer matrixcomposite, J. Miner. Mater. Charact. Eng. 2012 (11) (2012) 774–779.
[3] R. Rajakumar, T.M. Midhun, K. Anoop, S. Aiswarya, K.R. Deepthi, and A.D. Anusree, Coconut Shell as an Alternative forAsbestos in Asbestos Cement Sheets, no. June, pp. 10–11, 2015.
[4] O.M. Ikumapayi, E.T. Akinlabi, J.D. Majumdar, Review on thermal, thermo- mechanical and thermal stress distributionduring friction stir welding, Int. J. Mech. Eng. Technol. 9 (8) (2018) 534–548.
[5] A. Melati, E. Hidayati, Synthesis and characterization of carbon nanotube from coconut shells activated carbon, J. Phys.Conf. Ser. 694 (1) (2016).
[6] Z. Salleh, M.M. Islam, M.Y.M. Yusop, M.A.M.M. Idrus, Mechanical properties of activated carbon (AC) coconut shell rein-forced polypropylene composites encapsulated with epoxy resin, APCBEE Proc. 9 (2014) 92–96 (no. Icbee 2013).
[7] M.N. Mohd Iqbaldin, I. Khudzir, M.I. Mohd Azlan, A.G. Zaidi, B. Surani, Z. Zubri, Properties of coconut shell activated carbon,J. Trop. Sci. 25 (4) (2013) 497–503.
[8] S.N.A. Jabal, Y.B. Seok, W.F. Hoon, The potential of coconut shell powder (CSP) and coconut shell activated carbon (CSAC)composites as electromagnetic interference (EMI) absorbing material, Malays. J. Anal. Sci. 20 (2) (2016) 444–451.
[9] C.D. Liyanage, M. Pieris, A physico-chemical analysis of coconut shell powder, Proc. Chem. 16 (2015) 222–228.[10] A.K. Balan, S. Mottakkunnu Parambil, S. Vakyath, J. Thulissery Velayudhan, S. Naduparambath, P. Etathil, Coconut shell
powder reinforced thermoplastic polyurethane/natural rubber blend-composites: effect of silane coupling agents on themechanical and thermal properties of the composites,, J. Mater. Sci. 52 (11) (2017) 6712–6725.
[11] M. Faisal, S, k, P. Mazenan, S. Shahidan, J. Irwan, Review of coal bottom ash and coconut shell in the production of concreteReview of coal bottom ash and coconut shell in the production of concrete, IOP Conference Ser. Mater. Sci. Eng., vol. 342,pp. 1–6, 2018.
[12] K.S. Shiny, R. Sundararaj, G. Vijayalakshmi, Potential use of coconut shell pyrolytic oil distillate (CSPOD) as woodprotectant against decay fungi, Eur. J. Wood Wood Prod. 76 (2) (2018) 767–773.
[13] K. Vinukumar, A. Azhagurajan, S.C. Vettivel, N. Vedaraman, A. Haiter Lenin, Biodiesel with nano additives from coconutshell for decreasing emissions in diesel engines, Fuel 222 (2018) 180–184.
[14] F.E. Hunedoara, I. Journal, E.T. Xv, E. Hunedoara, E.S. Nnochiri, O.M. Ogundipe, Effects of coconut shell ash on limestabilized lateritic soil for road construction, Ann. Fac. Eng. Hunedoara- Int. J. Eng. (2017) 55–60.

38
2.9 ARTICLE VIII
A review of the thermal, thermo-mechanical and thermal-stress distribution
properties during friction stir welding
Published in the International Journal of Mechanical Engineering and Technology, Vol 9, Issue 8,
August 2018, pp. 534–548, ISSN Print: 0976-6340 and ISSN Online: 0976-6359
Link: http://www.iaeme.com/ijmet/issues.asp?JType=IJMET&VType=9&IType=8
This review article centred on the thermal energy distribution during the friction stir welding. It
was established that thermal, or heat energy, helps the metal structures in re-arranging the
molecular structure, as well as the grain sizes of the metal, thereby making it stronger after
welding. In this review paper, the thermal and heat effects on the welded parts were being studied
and documented. Boundary-value problems (BVP) with the steady and transient state were
documented for revealing the residual stress during the welding.
Thermo-mechanical effects, thermal and heat modelling and their governing equations were
studied. At the same time, the thermal stresses in friction stir welding and the simulation-flowchart
process for computing the thermal behaviour, distortions, as well as the residual stresses, were
presented. It was concluded in this review paper that most thermo-mechanical models can either
be 2-dimensional or 3-dimensional model criteria; and that the most frequently used model types
are: Solid Mechanics (SM) or Computational Solid Mechanics (CSM), such as Deform 3D,
Abaqus, Ansys, as well as Fatigue 3; Fluid Dynamics (FD), or Computational-Fluid Dynamics
(CFD), such as the fluent and Multiphysics (CSM-CFD) model, which is capable of modelling

39
temperature distribution, residual stress from the different thermal conditions and elastic strain, in
addition to the thermal coefficient across the welded part.

http://www.iaeme.com/IJMET/index.asp 534 [email protected]
International Journal of Mechanical Engineering and Technology (IJMET)
Volume 9, Issue 8, August 2018, pp. 534–548, Article ID: IJMET_09_08_057
Available online at http://www.iaeme.com/ijmet/issues.asp?JType=IJMET&VType=9&IType=8
ISSN Print: 0976-6340 and ISSN Online: 0976-6359
© IAEME Publication Scopus Indexed
REVIEW ON THERMAL, THERMO-
MECHANICAL AND THERMAL STRESS
DISTRIBUTION DURING FRICTION STIR
WELDING
Omolayo M. Ikumapayi* and Esther T. Akinlabi
Department of Mechanical Engineering Science, University of Johannesburg,
Auckland Park Kingsway Campus, Johannesburg, 2006, South Africa
*Corresponding author
Jyotsna D. Majumdar
Department of Metallurgical and Materials Engineering, Indian Institute of Technology,
Kharagpur, West Bengal – 721 3012, INDIA
ABSTRACT
Thermal has significant effects on the metal structure during welding process; it
plays vital roles in rearranging molecular structure of the metal being welded. It is of
great importance to have the knowledge of thermal, temperature, thermo-mechanical
and heat distribution on the workpiece in friction stir welding as this will help in
designing process and the model parameters for welding application in the following
welded joints, edge butt, lap, square butt, T lap, fillet, multiple lap etc. The physics of
heat generation must be explored in order to understand the workability of friction stir
welding (FSW). The FSW process begun with initial friction of mechanical that took
place between the tool and the welded surface resulting in the generation of heat.
Since the discovery of Friction Stir Welding (FSW) in 1991, many researchers have
done tremendous investigations into the process and many experimental, theoretical,
numerical, empirical, computational and analytical methods have been carried out in
order to analyse and optimize FSW and to understand the complex mechanism in
friction stir welding at the same time to deal with effects of various parameters
relating to thermal profile during the process of FSW.
Keywords: Thermal, Thermo mechanical, Thermal stress, Friction Stir Welding,
Temperature
Cite this Article: Omolayo M. Ikumapayi, Esther T. Akinlabi and Jyotsna D.
Majumdar, Review on Thermal, Thermo-Mechanical and Thermal Stress Distribution
during Friction Stir Welding, International Journal of Mechanical Engineering and
Technology, 9(8), 2018, pp. 534–548.
http://www.iaeme.com/IJMET/issues.asp?JType=IJMET&VType=9&IType=8
Review on Thermal, Thermo-Mechanical and Thermal Stress Distribution during Friction Stir
Welding
http://www.iaeme.com/IJMET/index.asp 535 [email protected]
1. INTRODUCTION
The role of welding in manufacturing industries and the direct influence it has on the
components integrity, thermal and mechanical behaviours during service cannot be
overemphasized. Owing to the importance of the manufacturing process, significant progress
in the development of various types of welding techniques has been achieved. The most vital
development in the joining of metals in recent past is considered to be FSW and is a ―green‖
technology as a result of its environmental friendliness, energy efficiency and versatile[1].
FSW consumes less energy, no flux or cover gas used as such the process is environmentally
friendly, unlike the conventional welding process.
In some years back, FSW has become a prominent technique for joining structures of
aluminium that are difficult to be welded by the use of traditional or conventional fusion
welding technique[2]. This type of welding is a solid-state welding technique (in which the
base metal does not melt during the process) that uses thermo mechanical control of the
rotating welding tool on the base metal (parent Material) resulting in monolith joint weld.
When the wedding tools and parent material are in contact, and there is significant
stirring, parent material will deform as a result of the partial transformation of mechanical
energy into thermal energy. FSW process makes use of a specially designed rotating pin that
takes debut entrance into the adjoining edges of the blank plates with appropriate tilt angle
and then navigated along the welding line (Fig. 1). This pin will then produce plastic and
frictional deformation in the welded zone, it is paramount to know that no melting of material
was observed in FSW. Besides, the movement of tool forced the material to flow around the
tool in a complex flow pattern.
Figure 1 The principle of the FSW[2]–[4]
Thermal has significant effects on the metal structure during a welding process; it plays
vital roles in rearranging the molecular structure of the metal being welded. Researchers have
done marvelous works in the area of thermal studies during the friction stir welding process,
below is the review of great works carried out in the area of thermal, thermo-mechanical, heat
and temperature distributions during FSW.
2. THERMAL AND HEAT EFFECTS
Despite notable advancement in the applications of FSW as the newest welding technique for
welding aluminium and its alloys, the basic and the essential knowledge of the effects of
thermal processes are still not well understood. A lot of studies have gone into investigating
the effects of thermal on FSW using various means. Several researchers have done great
works using various materials and methods in the course of their findings.
Hosseini et al.(2016)[5] investigated the optimization of thermal and simultaneous cooling
on FSW using inverse approach. These findings centered on the experimental and numerical

Omolayo M. Ikumapayi, Esther T. Akinlabi and Jyotsna D. Majumdar
http://www.iaeme.com/IJMET/index.asp 536 [email protected]
study of heat inputs of tools of Aluminium Al5052 which was based on limited measurement.
Performance of cooling, optimization of normal force and other process parameters were
carried out using finite element model of three dimensions to predict the results. It was
recorded that numerical predictions agreed with experimental results.
Theoretical and experimental evaluations of the residual stresses and thermal histories of
dissimilar friction stir welding of Aluminium Alloys 5058 and 6061was researched (Jamshidi
et al., 2012)[6]. A three-dimensional model was employed and ABAQUS software was used
for FE analysis (Abbasi et al., 2015; Ikumapayi et al. 2015)[7], [8] on AA6061-T6. The model
results were compared with the experimental data and there was a reasonable agreement
between the two which indicated that welding fixtures affect the tensile residual stresses
significantly. In the same vein, (Raouache et al., 2016)[9] presented the effect of the tool
geometries on thermal analysis of the friction stir welding. In this presentation, COSMOL
MULTIPHYSICS was used in the investigation and analysis of temperature distribution of
workpiece and tool during FSW operation. 3-Dimensional FE was developed to study the
thermal transient as also demonstrated(Oyinbo et al., 2015)[10]. It was also established that
analyzed results were the same as the one found in the literature. It was also concluded that as
the temperature increases, holding time and speed of rotation also increase. The effects of
thermal boundary conditions of 6.35mm thick plates of AA7050-T7 was conducted during
FSW conducted by (Upadhyay and Reynolds, 2010)[11]. Welding process was carried out at a
sub-ambient temperature of – 250C, this temperature measurement was made in the probe
center and the least hardness location of the weld. Parametric variables such as joint strength,
nugget grain size, and hardness distribution were recorded and compared with boundary
conditions. It was concluded that submerged welds improve the tensile strength and
elongation of the welds.
Thermal effects of Butt Friction Stir Welded joints of Aluminium Alloys was
characterized by (Beccari et al., 2005)[12]. Temperature distribution and Time were analyzed
by the embedded thermocouples and thermography respectively in order to study the
materials conditions during FSW process and also to analyze the process parameters such as
feed rate, tool rotating speed as well as thermal effects on temperature distributions.
Su and Wu, 2014 [13] did work on thermal energy generation and distribution in friction
stir welding of aluminum alloys. In this work, the coefficient of friction and slip rate was
measured with the new methods of integrative calculation. The energy required to plastically
deform and interfacial friction were considered. It was also observed that the predicted
maximum temperature values were in agreement with the experimentally measured ones.
Experimental and Numerical investigation of heat transfer in Friction Stir Welding was
studied by Chao et al. (2003)[14]. It was revealed that the quality of the weld, distortion and
residual stress in the workpiece will be determined by the amount of the heat conducted. Two
boundary value problems (BVP) was adopted in formulating heat transfer processing which is
transient BVP and steady-state BVP. It was further revealed that heat generation that was
transferred into the workpiece was about 95% and the remaining 5% flow into the tool. The
BVP for the tool and workpiece is as depicted in Figure 2 and the Energy balance during
FSW at any time in the tool and workpiece is as shown in equations 1 and 2 respectively.
1
2
Where Q3 is the heat flux to the tool from the friction between the tool and the workpiece;
is the heat lost from the surface of the tool to the environment convection;
Q4 is the heat transferred to the machine head in which the tool is mounted;
Review on Thermal, Thermo-Mechanical and Thermal Stress Distribution during Friction Stir
Welding
http://www.iaeme.com/IJMET/index.asp 537 [email protected]
Q2 is the heat conducted from the bottom surface of the workpiece to the backing plate on
the machine;
is the heat lost from the surface of the workpiece to the environment through
convection;
Q is the increase of the heat content in the workpiece
Figure 2 Heat transfer in tool and workpiece in friction stir welding, One-half of the tool model is
shown due to symmetry [14].
Akinlabi and Akinlabi (2012) (Akinlabi and Akinlabi 2012) investigated friction stir
welding between Aluminium and copper and examined how heat input affects the properties
of the materials under study. In this research, dissimilar welding between aluminium and
copper was made by the help of three shoulder diameter tools which are 15, 18 and 25mm, the
rotational speed was varying between 600 and 1200rpm and that of transverse speed was also
varying between 50 and 300mm/min. Microstructural, Microhardness and grain size were
characterized and electrical resistivities of the joints were also measured. It was concluded
that electrical resistivities increased with increase in heat input.
3. THERMOMECHANICAL EFFECTS
The thermal computations are coupled to the mechanical ones – this is called thermo
mechanical. Heat generated by material deformation and by the friction with the tool during
FSW produced thermal effects which can be in form of conduction, convection, and radiation.
Several findings have been done in the modeling of thermo mechanical effects during
friction stir welding. Malde (2009)[16] Stated that the first step towards the knowledge of
thermo mechanical interaction that takes place in the Friction Stir welding process is to first
understand the heat generation as well as temperature history during the welding process.
Finite Element Analysis (FEA) was used by Chen and Kovacevic (2004) [17] to model
force and thermo mechanical effects during FSW. In this work, a parametric study of the
effects of the longitudinal and rotational speed of the tool on the vertical, lateral and
longitudinal forces was investigated in order to estimate appropriate applied clamping force
on the plates. It was revealed that the measurement values by the load cells of vertical,
longitudinal, and lateral directions are in agreement with numerical calculations. Similarly,
finite element modeling of friction stir welding—thermal and thermo mechanical analysis was
also conducted by Chen and Kovacevic (2003)[18]. The research used the 3D thermo
mechanical model to study the effects of mechanical and thermo mechanical actions on the FS
Omolayo M. Ikumapayi, Esther T. Akinlabi and Jyotsna D. Majumdar
http://www.iaeme.com/IJMET/index.asp 538 [email protected]
welded 6061-T6 Al alloy. It was concluded that the higher the transverse speed, the higher the
stress zone at the longitudinal; and the lower the stress zone at the lateral of the weld.
Thermo mechanical modeling of steady state of friction stir welding was conducted by
Bastier et al. (2006)[19]. The work aimed at predicting material flow, final residual stresses
and temperature field during final joining with FSW. This work incorporates Eulerian model
with 3D FEM to establish the flow of material, pressure field, and temperature distribution
during FSW. It was concluded that the steady state phase of the FSW was simulated which
eventually lead to a drastic reduction in time of computation.
Other great researchers that have done tremendous works in the area of thermo
mechanical effects and modellings of FSW are (Butan and Monaghan, 2009; Hilgert et al.,
2011;Schmidt and Hattel, 2008) (Butan & Monaghan, 2009; Hilgert, Schmidt, Dos Santos, &
Huber, 2011; Jacquin et al., 2011; Nourani, Milani, & Yannacopoulos, 2014; Schmidt &
Hattel, 2008). It is worthy of note that (Butan and Monaghan, 2009; lammlein, 2010 and
Okokpujie et al., 2018) [23], [25], [26] used thermo mechanically coupled, as well as rigid-
viscoplastic of DEFORM 2D and DEFORM 3D to analyse and predict the force, strains,
stresses, strain rates as well as temperature distribution in the FSW of 4.89mm thick sheets of
Aluminuim 2024-T3 (Alclad) and AA6061-T6 . Input/output of 2D and 3D models flow
diagram is as depicted in figure 3.
Figure 3 Input/output flow diagram for the 2D and 3D models[25].
A review on thermo mechanical models of friction stir welding was carried out by
Nourani et al. (2014)[20] and it was summarized in this findings that the commonness used
thermo mechanical models during FSW and their characterizations are Fluid Dynamics-based
models, Mechanics-based models, and hybrid or multiphysics models. Thermo mechanical
model using simple Eulerian method during friction stir welding was studied[24]. The 3D
thermo mechanical model was employed to investigate the tribological properties of AA2024-
T351 sheet metal. It was concluded that the amount of sliding seems to be greatly influenced
by the speed of rotational and welding.
A thermo mechanical hot channel (THC) approach for friction stir welding was studied by
Mandal and Williamson, 2006 [27]. In this paper, THC aimed at lowering wear tool by
decreasing the demand for frictional heat from the pin and tool shoulder. 2D analytical model
based on Rosenthal‘s model was employed in this study for analysis of thermal distribution.
The main aim is to integrate FSW which has a pre-heat source that creates a thermo
mechanical hot channel (THC) ahead of the welding tool. The reason behind this is to have
the workpiece preheated as well as reducing the quantity of frictional heat which in-turn
reduce the wear rate (Fig. 4).

Review on Thermal, Thermo-Mechanical and Thermal Stress Distribution during Friction Stir
Welding
http://www.iaeme.com/IJMET/index.asp 539 [email protected]
Figure 4 Diagram of FSW coupled to THC[27].
Thermal modeling of friction stir welding of stainless steel 304L was investigated Darvazi
and Iranmanesh, 2014 [28]. The thermal equation was solved using nonlinear FE code
ABAQUS, and the measurement of heat generated at thermo mechanically affected zone by
dissipation of plastic strain energy by the conventional heat transfer coefficient and the new
technique was also adopted. The numerical and experimental results shown that asymmetric
nature of temperature distribution of both results is in agreements. It was concluded that the
heat convection coefficient has a greater impact on the temperature distributions.
4. THERMAL AND HEAT MODELLINGS AND GOVERNING
EQUATIONS
Many researchers have done great and mighty works in the area of FSW from one material to
the other. This aspect will only focus on the review of modeling of thermal effects during
FSW processes. Several theoretical approaches have been adopted in the past in order to solve
thermal effects on FSW varying from numerical, empirical, computational and analytical
methods. Thermal Modeling during FSW process is crucial in order to have better knowledge
of welding mechanism and optimizing process parameters. It is also found useful to predict
temperature near tool shoulder/workpiece interface. Lammlein, 2010[25] affirmed that the
heat produced during the welding process is amounting to the input power into weld tool,
minus some losses as a result of microstructural and other potential effects. Schmidt and
Hattel, 2008 ; Hilgert et al. 2011[21], [22] investigated thermal pseudo-mechanical (TPM)
model in which heat generation is controlled by the temperature-dependent yield stress of the
weld material.
A steady-state algorithm was used Bastier et al., 2006 [19] to measure the state of residual
induced by the process. This measurement must be accountable for the whole mechanical
history of the material; this is because of the algorithm by the integration of the particles of
trajectories. The value of residual stress of FS welded assembling was obtained.
Another important investigation was the thermo-mechanical model of AL6061 with
adaptive boundary conditions for friction stir welding was carried out Soundararajan et al.,
2005 [29]. This model was to predict the active stress as well as thermal history with adaptive
contact conductance at the workpiece interface as well as the backing plate. Considering the
uniform contact conductance, the developed stress at the interface are used to evaluate the
contours of the contact conductance
Heat transfer modeling during friction stir welding of 12.7mm thick A6061-T6 plates by
the use of a meshless particle method was studied by Xiao et al, 2017[30]. The research used
a particle approximation with first-order consistency to discretize the governing heat transfer
equation. It was also proposed a penalty method to impose different thermal boundary

Omolayo M. Ikumapayi, Esther T. Akinlabi and Jyotsna D. Majumdar
http://www.iaeme.com/IJMET/index.asp 540 [email protected]
conditions, numerical stability was also enhanced by smoothing algorithm. The verification of
the accuracy and the effect of parameters of the meshless particle methods were first carried
out by two examples. The measured and computed FEM of temperature distributions were
compared. There was a good agreement in thermal cycle obtained from experimental and
theoretica
To save computational cost and to consider problem symmetry, only one of the two
workpieces was modeled. The diagrammatic representation of heat transfer model for FSW
with boundary conditions for various surfaces of the workpiece is as shown in Fig. 5 and the
heat transfer governing equation (eqn 3) was also presented Medhi et al., 2015; Phanikumar et
al., 2011 and Xiao et al., 2013[30]–[33].
(
)
(
)
(
) 3
Where T is the temperature, is the density, t is the time, c is the specific heat, k is the
thermal conductivity, and Q is the volumetric heat source term consisting of two parts i.e. Qs
and Qb, which are the heat resulted from the friction between the tool pin‘s side and the
workpiece and the friction between the tool pin‘s bottom surface and the workpiece,
respectively and x, y, and z are the coordinates.
Figure 5 Schematic diagram for heat transfer model of FSW process[30]
Numerical simulation of thermal history, as well as residual stresses in friction stir
welding of Al 2014-T, was investigated by rajamanickan and balusamy, 2009[34] and it has
been established that during service life, residual stresses can affect the welded components.
ANSYS package was used to model a 3-D non-linear thermo-mechanical finite element
(NLTMFE) for 2014-T6 butt-welded aluminium alloy. Experimental validation was done
with NLTMFE and it was concluded that there was a close agreement in the experimental and
modeling values for residual stress patterns and temperature history.
The study provides prior knowledge about residual stress contour along with thermal
history in order to design stress relief techniques, while designing FSW based aluminum alloy
structures. A monolithic solution technique or an implicit nonlinear consistent (INC) was used
to dictate shear band formation and to evaluate the absorption energy and strain failure of a
friction stir welded aluminium joint by McAuliffe et al., 2014 [35] during FSW. Different
high strain loading conditions using plasticity model that is rate dependent and thermal
softening was investigated. This model accounts for thermal diffusion which maintains the
problem in the softening region and it was evaluated by the method of the monolithic
nonlinear solver. It was shown that the initiation of material failures at the interface can be
Review on Thermal, Thermo-Mechanical and Thermal Stress Distribution during Friction Stir
Welding
http://www.iaeme.com/IJMET/index.asp 541 [email protected]
predicted, and that abruption of materials properties gradients greatly contributes to the failure
of joints during FSW.
Song and Kovacevic, 2003 [36] used A 3-D heat transfer to model FSW and introduced a
moving coordinate to reduce the difficulty in the modeling of moving tool. Heat input from
the tool shoulder and that of tool pin are the parameters considered in the model. The control
equation was solved by the application of finite difference. According to Song and
Kovacevic[36], the heat generated by the tool pin consists of the following three parts as
depicted in equation 4; (1) heat generated by material shearing; (2) heat generated by the
frictional threaded surface of the pin; and (3) heat generated by frictional vertical surface
of the pin.
√
√ ( )
4
Where ( )
( )
( )
and is the pin tool radius, h is the workpiece thickness, Ȳ is the material‘s
average shear stress, is the Welding translation force, and is the helix angle of the thread,
and µ is the coefficient of friction. The tool pin is assumed to be a cylinder with no thread,
only the first item in Eq. (4) is calculated as the heat input from the tool pin. The dissipated
heat by the tool can be compared with some measured values of the cumulative heat input to
produce the ratio of weld efficiency as given in equation 5 by lammlein, 2010 [25].
( ) is used here for clarity). It is expected that this ratio varies with parameters
and experimental set-up.
5
Thermal modeling and process parametric effects in friction stir welding were
experimented by Medhi et al., 2015 [31]. In this investigation, a Tribometer was used to
understand the variation of coefficient of friction between a high strength tools (die steel) with
a base metal of 6061-T6 aluminium alloy, in order to develop a realistic thermal model. A
thermomechanical model using the obtained value of the coefficient of friction was also
developed using Finite Element software, Comsol Multiphysics. Analysis of thermal was
done and welding parametric effects were investigated.
Both the thermal and mechanical modeling of Friction Stir Welding of AA2024-T351
alloy was researched by Heurtier et al., 2006 [37], like every other thermal modeling, a three-
dimensional thermo mechanical model was employed in this study. The model provides the
trajectory of each elemental material for the strain, the weld, strain rates and as well estimates
the micro-hardness and temperature in the welded zones. It was established that to optimize
welding conditions, there must be a good interrelationship between thermal modeling and
kinetic modeling and that heat increase comes from the following sources:
the friction of the shoulder on the surface of the workpieces
the plastic strain
the friction of the pin on the material
Thermal optimization of friction stir welding with simultaneous cooling using inverse
approach was investigated by Mir et al., 2016 [38]. This research studied how heat input was
obtained with the help of simultaneous cooling during FSW using inverse heat transfer
approach. 3D finite element model was used to dictate the parametric conditions. It was
established that normal force and cooling performance of FSW of Al5052 sheet were
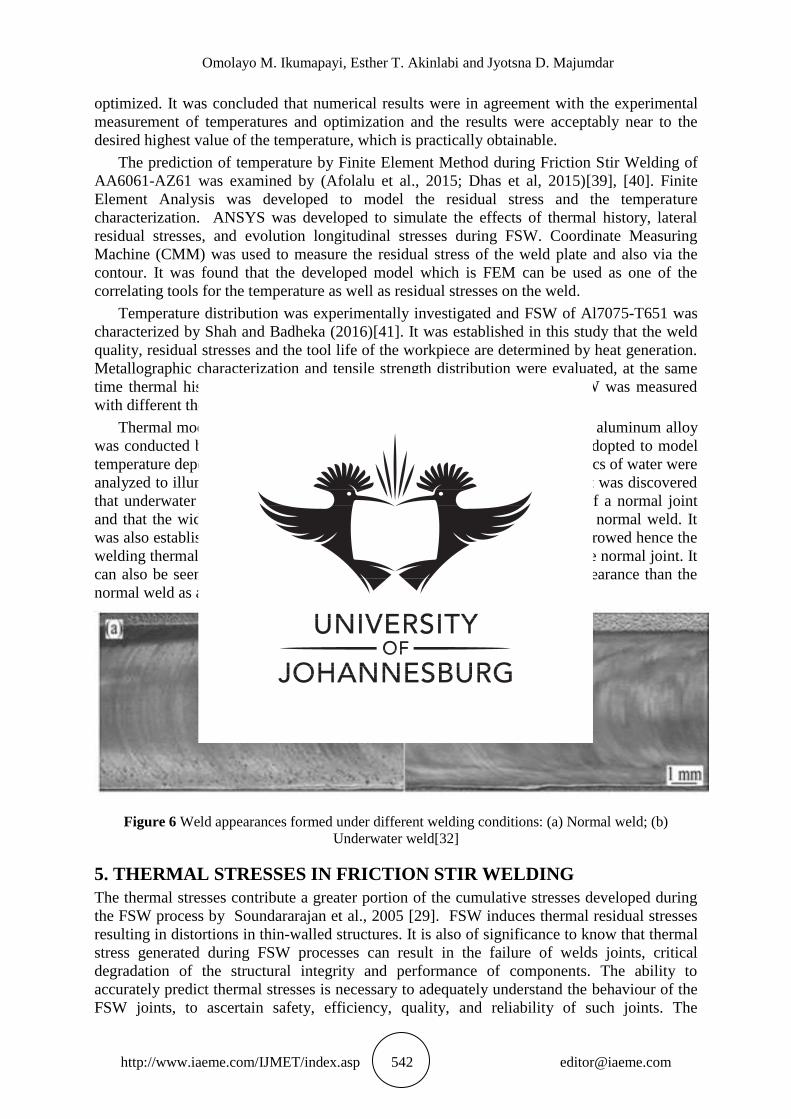
Omolayo M. Ikumapayi, Esther T. Akinlabi and Jyotsna D. Majumdar
http://www.iaeme.com/IJMET/index.asp 542 [email protected]
optimized. It was concluded that numerical results were in agreement with the experimental
measurement of temperatures and optimization and the results were acceptably near to the
desired highest value of the temperature, which is practically obtainable.
The prediction of temperature by Finite Element Method during Friction Stir Welding of
AA6061-AZ61 was examined by (Afolalu et al., 2015; Dhas et al, 2015)[39], [40]. Finite
Element Analysis was developed to model the residual stress and the temperature
characterization. ANSYS was developed to simulate the effects of thermal history, lateral
residual stresses, and evolution longitudinal stresses during FSW. Coordinate Measuring
Machine (CMM) was used to measure the residual stress of the weld plate and also via the
contour. It was found that the developed model which is FEM can be used as one of the
correlating tools for the temperature as well as residual stresses on the weld.
Temperature distribution was experimentally investigated and FSW of Al7075-T651 was
characterized by Shah and Badheka (2016)[41]. It was established in this study that the weld
quality, residual stresses and the tool life of the workpiece are determined by heat generation.
Metallographic characterization and tensile strength distribution were evaluated, at the same
time thermal histories were explored. The transient temperature during FSW was measured
with different thermocouple layouts.
Thermal modeling of underwater friction stir welding of the high strength aluminum alloy
was conducted by Zhang et al., 2013 [32]. A 3-D heat transfer model was adopted to model
temperature dependent properties of the materials and vaporizing characteristics of water were
analyzed to illuminate the boundary conditions of underwater during FSW. It was discovered
that underwater maximum peak temperature is drastically lower than that of a normal joint
and that the width of the underwater weld is a bit smaller compared to that normal weld. It
was also established that high-temperature distributing area is sufficiently narrowed hence the
welding thermal cycles in different zones are effectively controlled, unlike the normal joint. It
can also be seen from Figure 6 that underwater weld exhibits smoother appearance than the
normal weld as a result of a reduction in oxidation in the water environment.
Figure 6 Weld appearances formed under different welding conditions: (a) Normal weld; (b)
Underwater weld[32]
5. THERMAL STRESSES IN FRICTION STIR WELDING
The thermal stresses contribute a greater portion of the cumulative stresses developed during
the FSW process by Soundararajan et al., 2005 [29]. FSW induces thermal residual stresses
resulting in distortions in thin-walled structures. It is also of significance to know that thermal
stress generated during FSW processes can result in the failure of welds joints, critical
degradation of the structural integrity and performance of components. The ability to
accurately predict thermal stresses is necessary to adequately understand the behaviour of the
FSW joints, to ascertain safety, efficiency, quality, and reliability of such joints. The

Review on Thermal, Thermo-Mechanical and Thermal Stress Distribution during Friction Stir
Welding
http://www.iaeme.com/IJMET/index.asp 543 [email protected]
expansion and contraction of material during heating and cooling resulted in thermal stress
and occurs in the constrained welded plates by Riahi and Nazari, 2011[42].
Prediction, as well as measurements of thermal residual stresses in Aluminium Alloy
2024- T3 Friction Stir Welds as a Function of Welding Parameters, was investigated by
Dubourg et al., 2010[43] ; Similar investigation was carried out by Khandkar et al., 2006 [44].
Application of 3D FEM model was used in both cases to predict the process and was
validated by neutron diffraction. It was discovered that ―the application of ‗hot‘ welding
conditions such as high rotational speed and reduction in the speed of welding increased the
residual stresses and temperatures significantly mainly in the transverse direction. Meanwhile,
‗cold‘ welding conditions reduced the residual stresses‖. The result of this research shown
that there is a cordial agreement between the recorded and the predicted residual stresses in
Aluminium Alloy 2024-T3 studied.
Analysis of transient temperature and also that of thermal residual stresses in friction stir
welding of aluminum alloy 6061-T6 via numerical simulation as depicted in figure 7 was
also conducted by Riahi and Nazari, 2013 (Riahi & Nazari, 2013) and it was discovered that
heat distribution varies along the thickness and is asymmetrical and it was also established
that longitudinal residual stresses in the weld zone increases as speed of process and tool
movement decreases, this is in agreement with the work of Dubourg et al. (2010)[43]
Figure 7 Predicted 3-D residual stress distribution in the welded plate. (a) Longitudinal residual stress
and (b) transverse residual stress (ν = 280 mm/min; ω = 1,250 rpm)[42]
Buglioni et al.(2015) [45] presented an article on the thermal cycles and residual stresses
in FSW of 7075-T651 aluminum alloys plates of 150x75x4 mm. Experimental measurements
and numerical models were carried out to analyze stress distribution. The Stress variation,
residual strains, and stress values were calculated against weld centerline distance and null
stress position vary in different ways for each method. It was concluded in this research that
the prediction of the numerical model is higher than measured longitudinal stress gradient. It
was also noted that higher travel speed will lead to higher longitudinal stresses until certain
value.
Omolayo M. Ikumapayi, Esther T. Akinlabi and Jyotsna D. Majumdar
http://www.iaeme.com/IJMET/index.asp 544 [email protected]
The Evaluation of residual stresses in AA2024-T3 Friction Stir Welded Joints was carried
out by Milan et al., 2007 [46]. In this study, inverse weight function method was used to
measure initial residual stress profile. It was concluded in this work that predominant region
for fatigue crack nucleation to occur for the longitudinal direction will be the location on the
advancing side of the heat affected zone or thermo mechanically affected zone (TMAZ).
Dresbach et al. (2015) [47] investigated the Simulation of thermal behavior during friction
stir welding process for predicting residual stresses. Transient Thermal FEA was adopted to
carry out thermal behaviours during FSW process. This paper established that in order to
determine the quantity of deformation caused by the thermal residual stresses, thermo
mechanical material properties, temperature history, and thermal contact must be known. It
was observed that the calculated values of the distortion were lower compared to experimental
measurements. Figure 8 shows the principle procedure of the simulation process chain.
Figure 8 Simulation flowchart process for calculating the thermal behavior, distortion as well as
residual stresses in FSW process[47].
The effect of hardening laws, as well as thermal softening on modeling residual stresses in
FSW of aluminum alloy 2024-T3, was conducted by Sonne et al., 2013[48]. In this study, heat
transfer analysis based on the thermal pseudo-Mechanical (TPM) model for heat generation
was employed by numerical method. A sequentially coupled quasi-statics stress analyzer was
implemented in ABAQUS and Isotropic and kinematic rules of hardening were used in order
to study the effects of the hardening on the residual stresses. At the same time, the 1D satoch
test was modeled. It was concluded that there was a good agreement regarding temperatures
and there were discrepancies in residual stresses while comparing cold and hot welding
conditions
Khandkar et al., (2006)[44] researched on the prediction of residual thermal stresses in
friction stir welded metals. In this study, three different materials were considered and they
are AA2024, AA6061, and SS304L. Residual stresses caused by the thermal cycle during
FSW were modeled using a sequentially coupled FEM, this was used to predict residual
thermal stresses. It was concluded that the shapes of the simulated stress profiles were in good
agreement with stress profile reconstructed through equilibrium-based weighted least square
method.
A microstructure, as well as residual stress distributions of dissimilar aluminium alloys
during friction stir welding, was studied by Jamshidi Aval (2015) (Jamshidi Aval H., 2015).

Review on Thermal, Thermo-Mechanical and Thermal Stress Distribution during Friction Stir
Welding
http://www.iaeme.com/IJMET/index.asp 545 [email protected]
This study was aimed to examine the effect of welding heat input and post weld natural aging
on residual stress microstructure, and precipitation distribution in different zones of dissimilar
FSW between Aluminium Alloy 6082-T6 and 7075-T6. It was concluded that atomic
diffusion occurs at the interface of the materials in the stir zone of the joints.
The relationship between Welding Rates as well as Residual Stresses in Friction Stir
Welding of Aluminum Alloy 6056-T4 was conducted by Dada and Cornish ( 2013)[50].
Residual Stress at the top of the weld in the longitudinal direction was measured by the
standard electric gauge based technique. It was concluded that the minimum and the
maximum tensile longitudinal residual stress at the retreating side of the weld lowered with
increased translational velocity as well as advance per revolution.
Numerical simulation of residual stresses, as well as transient temperature in friction stir
welding of 304L stainless steel, was also investigated by Zhu and Chao, 2004 [51]. Nonlinear
3D thermal and thermo mechanical numerical simulations were conducted. WELSIM was the
Finite Element Analysis Code developed. The study aimed at the residual stress and variation
of transient temperature in FSW of 304L stainless steel. Neutron diffraction technique was
employed to measure residual stress which was compared with the 3D elastic-plastic thermos-
mechanical simulation results and they were found to be in agreement.
CONCLUSION
An overview of the effects of thermo mechanical, thermal stresses and thermal/heat
distribution during Friction Stir Welding (FSW) process has been summarized. The study
centered on the experimental and theoretical review such as modeling of thermal stresses and
thermal effects as well as temperature distribution during FSW.
From the literature review gathered, it can be concluded that thermal, thermal stresses and
thermo mechanical played vital roles when it comes to FSW as they all affect both the process
and model parameters.
It can also be inferred from the review that most modeling on thermal and thermo
mechanical use either 2-Dimensional or 3-Dimensional model criteria. It was also reported in
the review that thermal modeling can either be Solid Mechanics (SM) which compute strain,
temperature, and residual stresses distributions, such SM is computational solid mechanics
(CSM), examples are Abaques, Deform 3D, Ansys and Fatigue 3 etc. Another Model use
mostly in the review was Fluid Dynamics (FD) which was able to predict strain rate e.g.
computational fluid dynamics (CFD) such as fluent; lastly Multiphysics (CSM-CFM) model
that was capable of modeling both residual stress from different elastic and thermal strain
across the welded part as well as predicting temperature distribution and thermal coefficients
of expansion.
REFERENCE
[1] R. S. Mishra and Z. Y. Ma, ―Friction stir welding and processing,‖ Mater. Sci. Eng. R
Reports, vol. 50, no. 1–2, pp. 1–78, 2005.
[2] M. Mijajlovi, D. Mileie, V. Nikolie-Stanojevic, and M. Mileie, ―Numerical Simulation of
Friction Stir Welding on Aluminum Alloy 2024-T351 Plates,‖ Sci. Publ. state Univ. Novi
pazar, vol. 4, no. 2, p. 6, 2012.
[3] R. Rai, A. De, H. K. D. H. Bhadeshia, and T. DebRoy, ―Review: friction stir welding
tools,‖ Sci. Technol. Weld. Join., vol. 16, no. 4, pp. 325–342, 2013.
[4] O. S. Salih, H. Ou, W. Sun, and D. G. McCartney, ―A review of friction stir welding of
aluminium matrix composites,‖ Mater. Des., vol. 86, pp. 61–71, 2015.

Omolayo M. Ikumapayi, Esther T. Akinlabi and Jyotsna D. Majumdar
http://www.iaeme.com/IJMET/index.asp 546 [email protected]
[5] M. M. Hosseini, H. Basirat Tabrizi, and N. Jalili, ―Thermal optimization of friction stir
welding with simultaneous cooling using inverse approach,‖ Appl. Therm. Eng., vol. 108,
pp. 751–763, 2016.
[6] H. Jamshidi Aval, S. Serajzadeh, and A. H. Kokabi, ―Experimental and theoretical
evaluations of thermal histories and residual stresses in dissimilar friction stir welding of
AA5086-AA6061,‖ Int. J. Adv. Manuf. Technol., vol. 61, no. 1–4, pp. 149–160, 2012.
[7] M. Abbasi, B. Bagheri, and R. Keivani, ―Thermal analysis of friction stir welding process
and investigation into affective parameters using simulation,‖ J. Mech. Sci. Technol., vol.
29, no. 2, pp. 861–866, 2015.
[8] O. M. Ikumapayi, S. J. Ojolo, and S. A. Afolalu, ―Experimental and Theoretical
Investigation of Tensile Stress Distribution During Aluminium Wire Drawing,‖ Eur. Sci.
J., vol. 11, no. 18, pp. 1857–7881, 2015.
[9] E. Raouache, Z. Driss, M. Guidara, and F. Khalfallah, ―Effect of the Tool Geometries on
Thermal Analysis of the Friction Stir Welding,‖ Int. J. Mech. Appl., vol. 6, no. 1, pp. 1–7,
2016.
[10] S. T. Oyinbo, O. M. Ikumapayi, J. S. Ajiboye, and S. A. Afolalu, ―Numerical Simulation
of Axisymmetric and Asymmetric Extrusion Process Using Finite Element Method,‖ Int.
J. Sci. Eng. Res., vol. 6, no. 6, 2015.
[11] P. Upadhyay and A. P. Reynolds, ―Effects of thermal boundary conditions in friction stir
welded AA7050-T7 sheets,‖ Mater. Sci. Eng. A, vol. 527, no. 6, pp. 1537–1543, 2010.
[12] S. Beccari, L. D‘Acquisto, L. Fratini, and C. Salamone, ―Thermal Characterization of
Friction Stir Welded Butt Joints,‖ Adv. Mater. Res., vol. 6–8, pp. 583–590, 2005.
[13] H. Su, C. S. Wu, A. Pittner, and M. Rethmeier, ―Thermal energy generation and
distribution in friction stir welding of aluminum alloys,‖ Energy, vol. 77, no. July 2015,
pp. 720–731, 2014.
[14] Y. J. Chao, X. Qi, and W. Tang, ―Heat Transfer in Friction Stir Welding—Experimental
and Numerical Studies,‖ J. Manuf. Sci. Eng., vol. 125, no. 1, p. 138, 2003.
[15] S. A. Akinlabi , E.T and Akinlabi, ―Effect of Heat Input on the Properties of Dissimilar
Friction Stir Welds of Aluminium and Copper,‖ Am. J. Mater. Sci., vol. 2, no. 5, pp. 147–
152, 2012.
[16] M. Malde, ―Thermomechanical Modeling and Optimization of Friction Stir Welding,‖ no.
December, p. 74, 2009.
[17] C. Chen and R. Kovacevic, ―Thermomechanical modelling and force analysis of friction
stir welding by the finite element method,‖ Proc. Inst. Mech. Eng. Part C J. Mech. Eng.
Sci., vol. 218, no. 5, pp. 509–520, 2004.
[18] C. M. Chen and R. Kovacevic, ―Finite element modeling of friction stir welding - Thermal
and thermo mechanical analysis,‖ Int. J. Mach. Tools Manuf., vol. 43, no. 13, pp. 1319–
1326, 2003.
[19] A. Bastier, M. H. Maitournam, K. Dang Van, and F. Roger, ―Steady state thermo
mechanical modelling of friction stir welding,‖ Sci. Technol. Weld. Join., vol. 11, no. 3,
pp. 278–288, 2006.
[20] M. Nourani, A. S. Milani, and S. Yannacopoulos, ―A review on thermo mechanical
models of friction stir welding,‖ Adv. Mater. Res., vol. 922, pp. 553–559, 2014.
[21] H. B. Schmidt and J. H. Hattel, ―Thermal modelling of friction stir welding,‖ Scr. Mater.,
vol. 58, no. 5, pp. 332–337, 2008.
[22] J. Hilgert, H. N. B. Schmidt, J. F. Dos Santos, and N. Huber, ―Thermal models for bobbin
tool friction stir welding,‖ J. Mater. Process. Technol., vol. 211, no. 2, pp. 197–204, 2011.
[23] D. Butan and J. Monaghan, ―Thermomechanical modelling friction stir welding
aluminium 2024-T3,‖ vol. 2, no. 1, pp. 63–72, 2009.
Review on Thermal, Thermo-Mechanical and Thermal Stress Distribution during Friction Stir
Welding
http://www.iaeme.com/IJMET/index.asp 547 [email protected]
[24] D. Jacquin, B. De Meester, A. Simar, D. Deloison, F. Montheillet, and C. Desrayaud, ―A
simple Eulerian thermo mechanical modeling of friction stir welding,‖ J. Mater. Process.
Technol., vol. 211, no. 1, pp. 57–65, 2011.
[25] D. H. Lammlein, ―FRICTION STIR WELDING OF SPHERES, CYLINDERS, AND T-
JOINTS: DESIGN, EXPERIMENT, MODELLING, AND ANALYSIS,‖ Vanderbilt
University, 2010.
[26] I. P. Okokpujie et al., ―Modeling and optimization of surface roughness in end milling of
aluminium using least square approximation method and response surface methodology,‖
Int. J. Mech. Eng. Technol., vol. 9, no. 1, pp. 587–600, 2018.
[27] S. Mandal and K. Williamson, ―A thermo mechanical hot channel approach for friction
stir welding,‖ J. Mater. Process. Technol., vol. 174, no. 1–3, pp. 190–194, 2006.
[28] A. R. Darvazi and M. Iranmanesh, ―Thermal modeling of friction stir welding of stainless
steel 304L,‖ Int. J. Adv. Manuf. Technol., vol. 75, no. 9–12, pp. 1299–1307, 2014.
[29] V. Soundararajan, S. Zekovic, and R. Kovacevic, ―Thermo-mechanical model with
adaptive boundary conditions for friction stir welding of Al 6061,‖ Int. J. Mach. Tools
Manuf., vol. 45, no. 14, pp. 1577–1587, 2005.
[30] Y. Xiao, H. Zhan, Y. Gu, and Q. Li, ―Modeling heat transfer during friction stir welding
using a meshless particle method,‖ vol. 104, pp. 288–300, 2017.
[31] T. Medhi, B. S. Roy, S. Debbarma, and S. C. Saha, ―Thermal modelling and effect of
process parameters in friction stir welding,‖ Mater. Today Proc., vol. 2, no. 4–5, pp.
3178–3187, 2015.
[32] H. J. Zhang, H. J. Liu, and L. Yu, ―Thermal modeling of underwater friction stir welding
of high strength aluminum alloy,‖ Trans. Nonferrous Met. Soc. China (English Ed., vol.
23, no. 4, pp. 1114–1122, 2013.
[33] G. Phanikumar, K. Chattopadhyay, and P. Dutta, ―Joining of dissimilar metals: issues and
modelling techniques,‖ Sci. Technol. Weld. Join., vol. 16, no. 4, pp. 313–317, 2011.
[34] N. Rajamanickam and V. Balusamy, ―Numerical simulation of thermal history and
residual stresses in friction stir welding of Al 2014-T6,‖ J. Sci. …, vol. 68, no. MARCH
2009, pp. 192–198, 2009.
[35] C. McAuliffe, R. Karkkainen, C. Yen, and H. Waisman, ―Numerical modeling of friction
stir welded aluminum joints under high rate loading,‖ Finite Elem. Anal. Des., vol. 89, pp.
8–18, 2014.
[36] M. Song and R. Kovacevic, ―Thermal modeling of friction stir welding in a moving
coordinate system and its validation,‖ Int. J. Mach. Tools Manuf., vol. 43, no. 6, pp. 605–
615, 2003.
[37] P. Heurtier, M. J. Jones, C. Desrayaud, J. H. Driver, F. Montheillet, and D. Allehaux,
―Mechanical and thermal modelling of Friction Stir Welding,‖ J. Mater. Process.
Technol., vol. 171, no. 3, pp. 348–357, 2006.
[38] M. M. Hosseini, H. Basirat Tabrizi, and N. Jalili, ―Thermal optimization of friction stir
welding with simultaneous cooling using inverse approach,‖ Appl. Therm. Eng., vol. 108,
pp. 751–763, 2016.
[39] L. A. K. Dhas, D. Raguraman, D. Muruganandam, and B. Senthilkumar, ―Temperature
Prediction using Finite Element Modeling on Friction Stir Welding of AA6061-AZ61,‖
vol. 8, no. 31, pp. 1–7, 2015.
[40] S. A. Afolalu, O. O. Ajayi, O. M. Ikumapayi, and S. B. Adejuyigbe, ―Modeling-and-
Simulation-of-Wave-load-on-Periodic-Support-for-Isolation-system-of-offshore-
platform,‖ Int. J. Sci. Eng. Res., vol. 6, no. 5, pp. 441–447, 2015.
[41] P. H. Shah and V. Badheka, ―An Experimental Investigation of Temperature Distribution
and Joint Properties of Al 7075 T651 Friction Stir Welded Aluminium Alloys,‖ Procedia
Technol., vol. 23, pp. 543–550, 2016.
Omolayo M. Ikumapayi, Esther T. Akinlabi and Jyotsna D. Majumdar
http://www.iaeme.com/IJMET/index.asp 548 [email protected]
[42] M. Riahi and H. Nazari, ―Analysis of transient temperature and residual thermal stresses
in friction stir welding of aluminum alloy 6061-T6 via numerical simulation,‖ Int. J. Adv.
Manuf. Technol., vol. 55, no. 1–4, pp. 143–152, 2011.
[43] L. Dubourg, P. Doran, M. a. Gharghouri, S. Larose, and M. Jahazi, ―Prediction and
Measurements of Thermal Residual Stresses in AA2024-T3 Friction Stir Welds as a
Function of Welding Parameters,‖ Mater. Sci. Forum, vol. 638–642, pp. 1215–1220,
2010.
[44] M. Z. H. Khandkar, J. A. Khan, A. P. Reynolds, and M. A. Sutton, ―Predicting residual
thermal stresses in friction stir welded metals,‖ J. Mater. Process. Technol., vol. 174, no.
1–3, pp. 195–203, 2006.
[45] L. Buglioni, L. N. Tufaro, and H. G. Svoboda, ―Thermal Cycles and Residual Stresses in
FSW of Aluminum Alloys: Experimental Measurements and Numerical Models,‖
Procedia Mater. Sci., vol. 9, pp. 87–96, 2015.
[46] M. T. Milan et al., ―Residual stress evaluation of AA2024-T3 friction stir welded joints,‖
J. Mater. Eng. Perform., vol. 16, no. 1, pp. 86–92, 2007.
[47] C. Dresbach, M. J. van Enkhuizen, U. Alfaro Mercado, and S. Reh, ―Simulation of
thermal behavior during friction stir welding process for predicting residual stresses,‖
CEAS Aeronaut. J., vol. 6, no. 2, pp. 271–278, 2015.
[48] M. R. Sonne, C. C. Tutum, J. H. Hattel, A. Simar, and B. De Meester, ―The effect of
hardening laws and thermal softening on modeling residual stresses in FSW of aluminum
alloy 2024-T3,‖ J. Mater. Process. Technol., vol. 213, no. 3, pp. 477–486, 2013.
[49] H. Jamshidi Aval, ―Microstructure and residual stress distributions in friction stir welding
of dissimilar aluminium alloys,‖ Mater. Des., vol. 87, pp. 405–413, 2015.
[50] O. J. Dada and L. a Cornish, ―Relationship between Residual Stresses and Welding Rates
in Friction Stir Welded AA6056-T4,‖ Proc. Int. Multi Conf. Eng. Comput. Sci. 2013, vol.
II, pp. 6–10, 2013.
[51] X. K. Zhu and Y. J. Chao, ―Numerical simulation of transient temperature and residual
stresses in friction stir welding of 304L stainless steel,‖ J. Mater. Process. Technol., vol.
146, no. 2, pp. 263–272, 2004.

40
2.10 ARTICLE IX
The composition, characteristics and socio-economic benefits of Palm-kernel
Shell Exploitation – An Overview
Published in the Journal of Environmental Science and Technology, Vol 11, Issue 5, 2018,
Pages 220 - 232. DOI: https://doi.org/10.3923/jest.2018.220.232
ISSN: 1994 -7887
This overview work encompassed both the review and the experimental work on palm-kernel shell
(PKS). The experimental aspect involved the characterization of PKS after milling, with a digital-
vibratory disc-milling machine; and it was sieved with a 300 µm ASTM standard sieve before the
actual milling was done. The milling times were 0 taken at 300 µm, 10 minutes, 15 minutes and
20 minutes.
The scanning electron microscopy (SEM) and the energy dispersive X-ray (EDX) were employed
for the morphological and the elemental analyses, respectively; and the results were presented.
Also, the ultimate, the proximate and the structural analysis of PKS was reported in this paper. In
the same vein, the review works covered the utilization of palm-kernel shell in engineering
applications, as one of the agrowaste materials. The review summarized the applications of PKS
as reinforcement, aggregate and additive – especially in building technology and concrete
applications. The contributions and the area of focus for the researchers who worked, using PKS,
were noted in the paper.
The literature review also covers the applications in water purification, as well as in activated
carbon. It was established from the review that activated carbon (AC) can be developed from PKS;
41
and its use in water purification, absorbing and the removal of colourants and impurities from the
body of water. Several researchers that worked in this area were also noted. Lastly, the review also
examined the utilization of PKS in the area of fuel and energy production and generation. PKS has
been recognized as the main biomass energy resource used in the biomass power plant; and also,
its great potential feedstock for biochar, bio-oil, as well as biogas production, were documented.
Its economic value, in terms of exportation and importation from those countries, in which PKS is
abundantly found, were also discussed. Its potential utilization in metal matrix composites was
projected, especially in the friction stir processing (FSP), due to its remarkable properties produced
from the usage during reinforcements, additives and aggregates. This published journal article has
been able to address the objective of the study in item I.


OPEN ACCESS Journal of Environmental Science and Technology
ISSN 1994-7887DOI: 10.3923/jest.2018.220.232
Review ArticleComposition, Characteristics and Socioeconomic Benefits of PalmKernel Shell Exploitation-An Overview
Omolayo M. Ikumapayi and Esther T. Akinlabi
Department of Mechanical Engineering Science, University of Johannesburg, Auckland Park Kingsway Campus, 2006 Johannesburg, South Africa
AbstractIntensive research has increased the creation of new biomaterials with specific engineered properties. It is on record that a large amountof these biomaterials waste are generated by the processing of palm oil that invariably causes an environmental problem. This reviewstudy sheds light on various applications that palm kernel shell (PKS) has been used for in the recent years and applications that couldalso be considered in the near future. It has been reported that tropical belt of Africa, Asia and Brazil are the highest producers andexporters of palm oil across the globe and by implication the most producers of the PKS. The PKS as a biomaterial waste product got afterthe processing of palm oil has been extensively utilized in the various form of applications for both technical and environmental benefitsvarying from additive, energy production, reinforcement, aggregation, water purification and as well as a composite matrix. It wasobserved that great use of this waste product is prominent in the structural components, automotive parts as well as water detoxifier.The PKS-powder has been characterized in this review through the use of Scanning Electron Microscopy (SEM) and Energy Dispersive X-ray(EDX) analysis. The milling was done with the aid of digital Vibratory disc milling machine for 0, 10, 15 and 20 min. Zero min was takento be when it was sieved with a 300 µm ASTM standard sieve. It was established in the study that the duration of the milling affectsvolume, surface area, particle size, pore size distributions, micro structure and some other mechanical properties as well as themorphology of the powder. The particles size got reduced from 300 µm to average diameter of 200 nm. The variations in elementalcompositions of palm kernel shell powder from as they were affected by milling. The micrographs revealed that there was a tremendousreduction in grain size from 300 µm to about 200 nm.
Key words: Biomass, palm kernel shell, reinforcement, waste product, SEM-EDX, palm oil, biomaterials, composite matrix
Citation: Omolayo M. Ikumapayi and Esther T. Akinlabi, 2018. Composition, characteristics and socioeconomic benefits of palm kernel shell exploitation-anoverview. J. Environ. Sci. Technol., 11: 220-232.
Corresponding Author: Omolayo M. Ikumapayi, Department of Mechanical Engineering Science, University of Johannesburg, Auckland Park KingswayCampus, Johannesburg, 2006, South Africa
Copyright: © 2018 Omolayo M. Ikumapayi and Esther T. Akinlabi. This is an open access article distributed under the terms of the creative commonsattribution License, which permits unrestricted use, distribution and reproduction in any medium, provided the original author and source are credited.
Competing Interest: The authors have declared that no competing interest exists.
Data Availability: All relevant data are within the paper and its supporting information files.

J. Environ. Sci. Technol., 11 (5): 220-232, 2018
INTRODUCTION
Palm kernel Shell (PKS) also referred to as Oil Palm KernelShell (OPKS) and Oil palm Shell (OPS) in literature are highlylignocellulosic biogenic waste generated from the processingof crude palm oil1. This is the shell parts that remained afterthe nut has been removed and after crushing in the palm oilmill and is obtained as residual waste in the extraction of thekernel from the nut. Oil palm is cultivated in plantations ofabout two to three decades rotational farming followed byremoval and replanting2,3. Its moisture content is low whichhas been reported to range between 11-13%. In the year 2001alone the estimated value of 3.06 million metric tons wasproduced by Indonesia and Malaysia. The PKS is the hard partthat enclosed the nut of palm kernel fruit (Fig. 1) that housesthe palm kernel seed of the palm tree (Elaeis guineensis)4. ThePKS can be obtained by crushing into sections then separatingto remove the palm seed during the processing of palm kerneloil. During the process of removing or extracting ripe, fleshyand fresh fruit from the bunches at the mills, residues andwaste are generated in form of solid and liquid. These residuesand waste include fibres, empty fruit bunches (EFB), shells andliquid waste in form of sewage (palm oil mill effluent (POME))
with several uses, these include prevention of the fibres frominsect and pest attack, also in weaving baskets and mostespecially for domestic use as a means of energy generationduring cooking. The PKS has proven to be the first choice ofbiomass waste after which EFB pellet, followed by the woodchip, then sawdust pellet, shredded EFB5,6. Researchers haveestablished that the palm kernel shell has estimated value ofabout 34.5% of a single ripe, fresh fruit7,8. From the estimatedvalue of 34.5% PKS from a single fruit, one can see that thedisposal of these biomass waste will continue to pose majorenvironmental problems9. Figure 1a and b showed the palmkernel fruits and the Palm Kernel Shell, respectively and Fig. 1cshown the pulverized PKS.
REVIEW PALM KERNEL SHELL
Palm kernel shell (PKS): The Agro-waste (PKS) was obtainedlocally as shown in Fig. 1b and pulverized into powder asshown in Fig. 1c and this was then characterized usingSEM-EDX. Vibratory disc milling machine (VDMM): Milling operationwas performed using a digitalized vibratory disc milling
Fig. 1(a-c): (a) Palm kernel fruits, (b) Palm kernel shell and (c) Pulverised PKS
221
(a) (b)
(c)
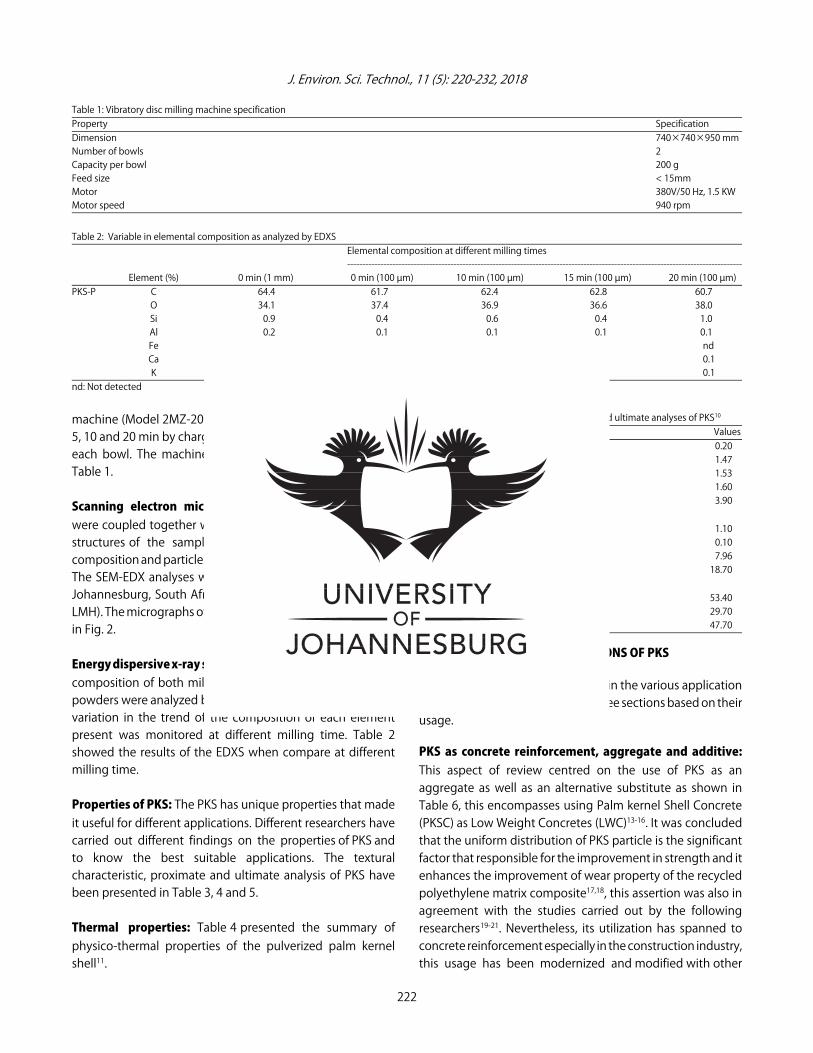
J. Environ. Sci. Technol., 11 (5): 220-232, 2018
Table 1: Vibratory disc milling machine specificationProperty SpecificationDimension 740×740×950 mmNumber of bowls 2Capacity per bowl 200 gFeed size < 15mmMotor 380V/50 Hz, 1.5 KWMotor speed 940 rpm
Table 2: Variable in elemental composition as analyzed by EDXSElemental composition at different milling times----------------------------------------------------------------------------------------------------------------------------------
Element (%) 0 min (1 mm) 0 min (100 µm) 10 min (100 µm) 15 min (100 µm) 20 min (100 µm)PKS-P C 64.4 61.7 62.4 62.8 60.7
O 34.1 37.4 36.9 36.6 38.0Si 0.9 0.4 0.6 0.4 1.0Al 0.2 0.1 0.1 0.1 0.1Fe 0.2 0.2 nd nd ndCa 0.1 0.3 nd 0.1 0.1K 0.1 nd nd nd 0.1
nd: Not detected
machine (Model 2MZ-200). The milling was carried out for5, 10 and 20 min by charging 40 g of the powder sample intoeach bowl. The machine has specification as presented inTable 1.
Scanning electron microscope (SEM): The SEM and EDXwere coupled together which was used to determine microstructures of the samples which revealed its morphology,composition and particle surface crystallography information.The SEM-EDX analyses were conducted at the University ofJohannesburg, South Africa (A TESCAN model, type VEGA 3LMH). The micrographs of different milling time are presentedin Fig. 2.
Energy dispersive x-ray spectroscopy (EDXS): The elementalcomposition of both milled and unmilled palm kernel shellpowders were analyzed by the use of SEM-EDX machine. Thevariation in the trend of the composition of each elementpresent was monitored at different milling time. Table 2showed the results of the EDXS when compare at differentmilling time.
Properties of PKS: The PKS has unique properties that madeit useful for different applications. Different researchers havecarried out different findings on the properties of PKS andto know the best suitable applications. The texturalcharacteristic, proximate and ultimate analysis of PKS havebeen presented in Table 3, 4 and 5.
Thermal properties: Table 4 presented the summary ofphysico-thermal properties of the pulverized palm kernelshell11.
Table 3: Textural characteristics, proximate and ultimate analyses of PKS10
Properties ValuesMicropore surface area (m2 gG1) 0.20Apparent density (g cmG3) 1.47Solid density (g cmG3) 1.53BET surface area (m2 gG1) 1.60Porosity (%) 3.90Proximate analysis (wt, %)Ash 1.10Volatile 0.10Moisture 7.96Carbon 18.70Structural analysis (wt, %)Lignin 53.40Cellulose 29.70Halocellulose 47.70
VARIOUS APPLICATIONS OF PKS
PKS has been used extensively in the various applicationwhich has been categorized into three sections based on theirusage.
PKS as concrete reinforcement, aggregate and additive:This aspect of review centred on the use of PKS as anaggregate as well as an alternative substitute as shown inTable 6, this encompasses using Palm kernel Shell Concrete(PKSC) as Low Weight Concretes (LWC)13-16. It was concludedthat the uniform distribution of PKS particle is the significantfactor that responsible for the improvement in strength and itenhances the improvement of wear property of the recycledpolyethylene matrix composite17,18, this assertion was also inagreement with the studies carried out by the followingresearchers19-21. Nevertheless, its utilization has spanned toconcrete reinforcement especially in the construction industry,this usage has been modernized and modified with other
222

J. Environ. Sci. Technol., 11 (5): 220-232, 2018
Fig. 2: Continue
223
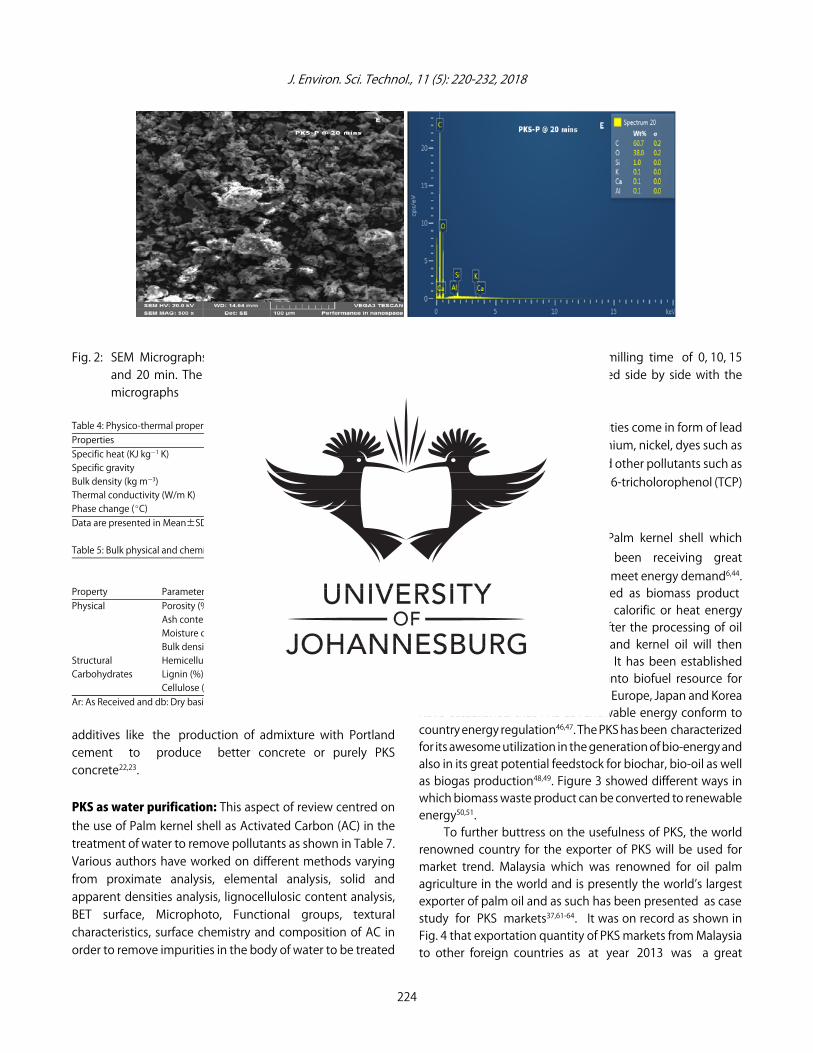
J. Environ. Sci. Technol., 11 (5): 220-232, 2018
Fig. 2: SEM Micrographs of palm kernel shell powder (PKS-Ps) at 500x SEM MAG at different milling time of 0, 10, 15and 20 min. The EDX that shows elemental compositions at different milling time is placed side by side with themicrographs
Table 4: Physico-thermal properties of pulverised PKS11
Properties PKS particlesSpecific heat (KJ kgG1 K) 1.983±0.01Specific gravity 1.26±0.07Bulk density (kg mG3) 560±17.4Thermal conductivity (W/m K) 0.68±0.05Phase change (EC) 101.4Data are presented in Mean±SD
Table 5: Bulk physical and chemical characteristics of palm kernel shell12
Values------------------------------
Property Parameters Ar dbPhysical Porosity (%) 28.00 650
Ash content (%) 8.68 -Moisture content (%) 6.11 -Bulk density (kg mG3) 740.00 9.24
Structural Hemicellulose (%) 26.16Carbohydrates Lignin (%) 53.85
Cellulose (%) 6.92Ar: As Received and db: Dry basis)
additives like the production of admixture with Portlandcement to produce better concrete or purely PKSconcrete22,23.
PKS as water purification: This aspect of review centred onthe use of Palm kernel shell as Activated Carbon (AC) in thetreatment of water to remove pollutants as shown in Table 7.Various authors have worked on different methods varyingfrom proximate analysis, elemental analysis, solid andapparent densities analysis, lignocellulosic content analysis,BET surface, Microphoto, Functional groups, texturalcharacteristics, surface chemistry and composition of AC inorder to remove impurities in the body of water to be treated
using AC from PKS38,39. These impurities come in form of leadions, copper ions, Hexavalent chromium, nickel, dyes such asBasic Blue 9 and Methylene Blue and other pollutants such asPhenol, 4-chrologuaiacol (4CG), 2, 4, 6-tricholorophenol (TCP)and iodine40,41.
PKS as energy/fuel production: Palm kernel shell whichgenerated renewable energy has been receiving great attentions nowadays as a means to meet energy demand6,44.Palm kernel shell has been recognized as biomass product as a result of its small size and high calorific or heat energyvalue as summarised in Table 8. After the processing of oilpalm fruit, PKS will be separated and kernel oil will thenundergo further distilled process45. It has been establishedthat PKS has made debut entrance into biofuel resource for t he production of biomass product. Europe, Japan and Koreahave established that PKS as renewable energy conform tocountry energy regulation46,47. The PKS has been characterizedfor its awesome utilization in the generation of bio-energy andalso in its great potential feedstock for biochar, bio-oil as wellas biogas production48,49. Figure 3 showed different ways inwhich biomass waste product can be converted to renewableenergy50,51.
To further buttress on the usefulness of PKS, the worldrenowned country for the exporter of PKS will be used formarket trend. Malaysia which was renowned for oil palmagriculture in the world and is presently the world’s largestexporter of palm oil and as such has been presented as casestudy for PKS markets37,61-64. It was on record as shown inFig. 4 that exportation quantity of PKS markets from Malaysiato other foreign countries as at year 2013 was a great
224

J. Environ. Sci. Technol., 11 (5): 220-232, 2018
225
Table 6: Summary of the present study on PKS as concrete reinforcement, aggregate and additive
References
Focus
Contribution(s)/conclusion(s)
Alengaram et al.1
Comparison between OPKSC and NWC with regards to strength,
It was concluded that OPKS and cement matrix has proven to be weaker in terms of bonding compared crushed granite and cement matrix. It
bond and fracture ability
was also established that 10% increase of silica fume further improved the sum total of OPKSC mechanical properties
Afolalu et al.2
HSS cutting tools were carburized at different temperatures of
It was found from the experiment carried out that cutting tool carburized at holding temperature and time of 800
EC and 90 min has the lowest
800,850,900 and 950EC with holding time of 60, 90 and 120 min,
cutting weight loss, volume and wear rate of 0.002 g, 0.00026 cm3 and 5.476×10⁻¹⁰ cm
2 with maximum wear resistance of 1.83×10⁹
respectively
Yusuf and Jimoh4
PKS has been used for road concrete construction
The authors concluded from their findings that it is cheaper to use PKS concrete for all levels of traffic road construction than using asphaltic and
normal concretes
Fono-Tamo et al.11
Production of PKS based particle boards which were compoundedIt was established that Standard particle boards were manufactured by the admixture of PKS and sawdust as a base material
with other additives like sawdust was the focal point
Alengaram et al.13
Comparison of Normal Weight Concrete (NWC) with the structural (1) It was established that the beam of PKSC was higher than NWC in terms of moment capacity
behavior of Palm Kernel Shell Concrete (PKSC)
(2) With testing for failure mode, PKSC beam proved ductile while NWC beam proved brittle
(3) As a result of ductility of PKSC beam under constant load, the deflection in the PKSC beam was higher than that of NWC beam which was brittle
and prone to failure without prior warning
Alengaram et al.14
Different seizes of PKS have been used with other aggregates to
(1) It was concluded that the smaller size gave higher density while the larger size of PKS gave higher toughness
produce concrete
(2) It was also affirmed that a mixture of different aggregates produced higher compressive strength
Ibhadode and Dagwa24
Using PKS to develop asbestos-free friction lining
(1) Manufacturing parameters and optimal friction materials were achieved by the use of taguchi optimization technique
(2) It was established that PKS is a good substitute for asbestos
Osei25
Replacing concrete made of Poland cement and crushed granite
(1) It was concluded that PKS and Pozzolana can potentially be used as an alternative replacement of Portland cement and crushed granite respectively
with concrete made of pozzolana and PKS
to produce cheaper lightweight concrete
(2) Pozzolana and PKS exhibited similar influences on the density and work ability of concrete both of which reduced as the pozzolana and PKS
contents increased
Mahmud et al.26
Varying sand content and incorporate mineral admixtures to
The results of this study confirmed that appropriate mixture of sand to cement in ratio 1:6 together with mineral admixtures have awesome effects
improve mechanical properties of PKSC
on the mechanical properties as against previous studies
Olanipekun et al.27
Analysis of cost and strength characteristics of concrete produced
It was concluded that coconut shell concrete has higher compressive strength than palm kernel shell concrete of the same proportion. Also, it
with crushed PKS and granular coconut Shell as alternative means
was established that coconut shell concrete produced has a cost reduction of 30% while palm kernel shell concrete has about 42% cost reduction
for conventional coarse aggregate
Oyedepo et al.28
The study used 20% each of CSA and PKSA for reinforcement in
This research has shown that PKSA and CSA can be used as an alternative replacement for cement concrete which will reduce production cost
cement and compare their compressive strength after 28 days
as well as environmental pollution caused by PKS and also enhance the reduction in the use of cement as concretes
Ekwueme et al.29
Carbonization of PKS at various temperatures at times interval was
(1) It was concluded that the smaller the filler particle size the better the reinforcement, this was as a result gotten where 100 µm performs better
the area of focus. The carbonized PKS was then sieved through
than 150 µm during reinforcement of natural rubber
100 and 150 µm mesh
(2) There should be moderation in the carbonization temperature. The optimum carbonization temperature was gotten to be 600EC
Afolalu et al.30
HSS cutting tools were subjected to different mechanical
(1) It was concluded that cutting tool carburized with PKS has higher impact/toughness value of 24J as against the control sample with 17J
tests such as impact, toughness for both carburized and
(2) Impact strength was progressively increased with increase in carburizing temperature and holding time which enhances improvement in impact
un-carburized samples
strength of the carburized tool over the un-carburized sample
Khankhaje et al.31
A comparative study on the effect of using two different sizes of oilIt was concluded that pervious concrete containing CS showed better properties than those of incorporating OPKS
palm kernel shell (OPKS) and cockleshell (CS) to serve as an
Apart from that, strong relationships between density, void content, permeability, compressive strength values indicated that they can be used
alternative replacement for the natural coarse aggregate to
as a pervious concrete quality control tests for prediction of properties of pervious concrete pavement before placement in the field
improve the properties of pervious concrete pavement
Muntohar and Rahman32
Oil Palm kernel shell was used to produce shell crete block
This research revealed that the compressive and flexural strength of the shell crete reduced by the increment in the amount of PKS in the mixture.
It was also showed that a Large amount of PKS content in the shellcrete absorbed water easily and subsequently lower its density
Adebayo33
The focus was to compare the effects of PKS in lattice
The results revealed that laterite blocks reinforced with pulverized PKS at the optimum ratio of (1:4) (PKS: Laterite) were 15% stronger than ordinary
blocks and Concrete with reference to crushed stone aggregate
plain laterite blocks. It was further revealed that crushed stone aggregate with PKS to form concrete blocks lower in strength by about 50%. It was
therefore, concluded that PKS cannot be used as a replacement for crushed stone aggregates in concrete.
Nwaobakata and
The focus here is on the use of palm kernel ash (PKA) as filler
The results revealed that PKA has improved and better fatigue and also permanent deformation characteristics which also showed a reduction
Agunwamba34
during hot asphalt mixing
in moisture susceptibility. The addition of 3% PKA has greatly improved asphalt concrete behaviors and eventually in the production of more durable
mixtures that will give higher resistance to distress
Ishola et al.35
The focus in on the production of Brake pad using non-asbestos
Non-asbestos organic (NAO) based PKS brake pad was successfully developed via compressive molding by varying the particle sizes of PKS
organic (NAO) which is PKS
Mgbemena et al.36
Focus here is using PKS develop brake lining which is
It was established that PKS based Brake friction lining produced high wear high than the Original Equipment Manufacturer (OEM) Lining Materials
non-asbestos friction materials
and that the PKS based Brake friction lining showed better thermal stability when compared to OEM
Dagwa et al.37
Characterization of pulverized PKS was to determine its suitability
This research concluded that PKS can be used as a filler in the production of the polymer composite. This was established by various characterizations
for composite materials formulation
conducted among which was SEM which revealed that PKS powder had a spherical shape, EDX analysis revealed that pulverized PKS had a high
carbon content of about 63 wt %, XRD pattern revealed that pulverized PKS was more of amorphous material with traces of microcrystalline material

J. Environ. Sci. Technol., 11 (5): 220-232, 2018
226
Table 7: Summary of the previous works on PKS as a water purifier
References
Focus
Contribution(s)/Conclusion(s)
Fuadi et al.10
AC was produced from PKS and use as an adsorbent to remove
It was established from the review that AC produced from PKS has been used extensively to remove heavy metal, dyes, paints and other pollutants
pollutants from the aqueous phase
from the body of waste water
Okoroigwe et al.12
This article focuses on the way PKS can be used for both
The characterizations results of PKS gotten by the use of x-ray diffraction (XRD) and x-ray photo-spectrometry (XPS) showed that PKS possessed
reinforcement as well as water purification
some surface elements, crystalline materials and morphological qualities that qualified PKS as a good material fillers in construction as well as
adsorption industries
Garcia et al.42
Production of AC from PKS was established which was used to
It was established that after 4 h contact time, about 90% adsorptions has been achieved. It was then concluded that Palm oil mill waste biomaterials
remove colorants from the body of water with the help of
can be efficiently used to remove colorants in the body of waste-waters
activating agent called ZnCl2
Muhammad et al.43
Activated Carbon produced from PKS was used to remove
In this research, three corrective models were employed in studying activities of AC produced from PKS, they were the modified extended
impurities such as zinc ion and cadmium ion from the aqueous
Redlich‒Peterson (MERP) and the modified extended Langmuir (MEL), as well as modified extended Freundlich (MEF). It was revealed that binary
solutions. The analysis was achieved by the use of
isotherm could be best described by the model called the modified extended Langmuir
Redlich‒Peterson isotherms, Freundlich and Langmuir
Table 8: Summary of the present study on PKS as energy/fuel generation
References
Focus
Contribution(s)/Conclusion(s)
Rahman et al.6
Pyrolysis of PKS was characterized and to be used for washing
The energy content in char was seen to increase as the ash content became lower. The presence of ash, which acts as a catalyst, promotes secondary
medium and pre-treatmnet process
reactions during pyrolysis and is thus considered a significant contributor to high water fractions in the organic liquid yield
Okoroigwe and Saffron
48The focus here is on Bioenergy generation via PKS
The findings showed that pyrolyzed PKS has higher percentage of Carbon content and moderate hydrogen value and as such high heating value.
It was established that PKS has greater potential to supply sustainable renewable energy to developing countries
Ugwu and Agbo52
PKS was carbonized and pulverized to produce Briquettes
It was established that PKS briquettes produced higher amount of calorific value than that produced from both the charcoal and sawdust and
that such briquettes generated can be utilized for cooking and ironing of clothes
Yacob et al.53
PKS has been utilized here to serve as chemical activated
In the process of using PKS as chemical activated carbon to produce Microwave, the characterization was carried out by the aid of Fourier Transform
carbon in order to produce Microwave-induced with larger
Infrared (FTIR) and other analysis were adopted to determine it effectiveness such as Thermal and Nitrogen gas adsorption Methods
surface area
Mohamad et al.54
This study focused on the use of PKS as steam gasification for
Steam generation from PKS was used to establish the effects of steam to biomass (S/B) and that of calcination temperature on product gas distribution
hydrogen production at the temperature of 700
EC in the
and it was concluded that the catalytic activity decreases with increasing calcination temperature. Also, the product generated which is Co and
presence of catalysts called Ni/BEA and Fe/BEA at 5% each
CH4 tend to increase with the increase in the ration of
Ninduangdee et al.55
The Characterizations and Combustions behaviours of Palm
It was observed that EFB exhibits tremendously higher combustive and thermal reactions than PKS as a result of reduction in burnout and ignition
Kernel Shell (PKS) and Empty Fruit Bunch (EFB) were
temperatures as well as lower activation energy
investigated using Thermogravimetric analyzer
Obi56
The Focus here was on how to form a composite briquette with
It was established that everlasting briquettes composite can be produced from the mixture of ground PKS and that of Sawdust in the ratio 50:50.
the PKS and sawdust by using the binding agent which
It was concluded that a relaxed density of 0.48 g cm
G3, a compressed density of 0.84 g cm
G3, compaction ratio of 1.41 and relaxation ratio of 1.76
was cassava starch
was achieved as well as durability rating of an amount of 73.40% and water resistance time was gotten to be 4.09 h
Febriansyah et al.57
The focus here was to replace fossil fuels with a well-designed
It was concluded that the biomass stove made of PKS performed excellently well under the following features height of 25 cm, burner air opening
and robust biomass stove made of PKS
at 75% with a combustion chamber diameter of 20 cm. It was established that mean combustion temperatures was gotten to be 682.59
EC and
overall efficiency of the biomass stove made of PKS was 66.63%
Lai et al.58
The study investigated how PKS pellet can affect the
It was concluded that PKS powders can be pelletized to moderately porosity without binders which was expected to be utilized in the pelletization
strength and process parameters
selection conditions for efficient and effective gasification
Bazargan et al.59
The focus here was how to generate briquettes/pellets from
It was recorded that the calorific value derived from the compacted PKS biochars was so high and exceeding normal values for biomass
compacted PKS biochars
Fono-Tamo and Koya60
Pulverized PKS was evaluated to enhance its diversification from
It was established that PKS could be diversified from waste to combustion fuel and other useful biomaterial composite utilization
waste and determine its elemental composition, physical
properties as well as thermal properties to exploit its utilization
in engineering and eco-friendly environment
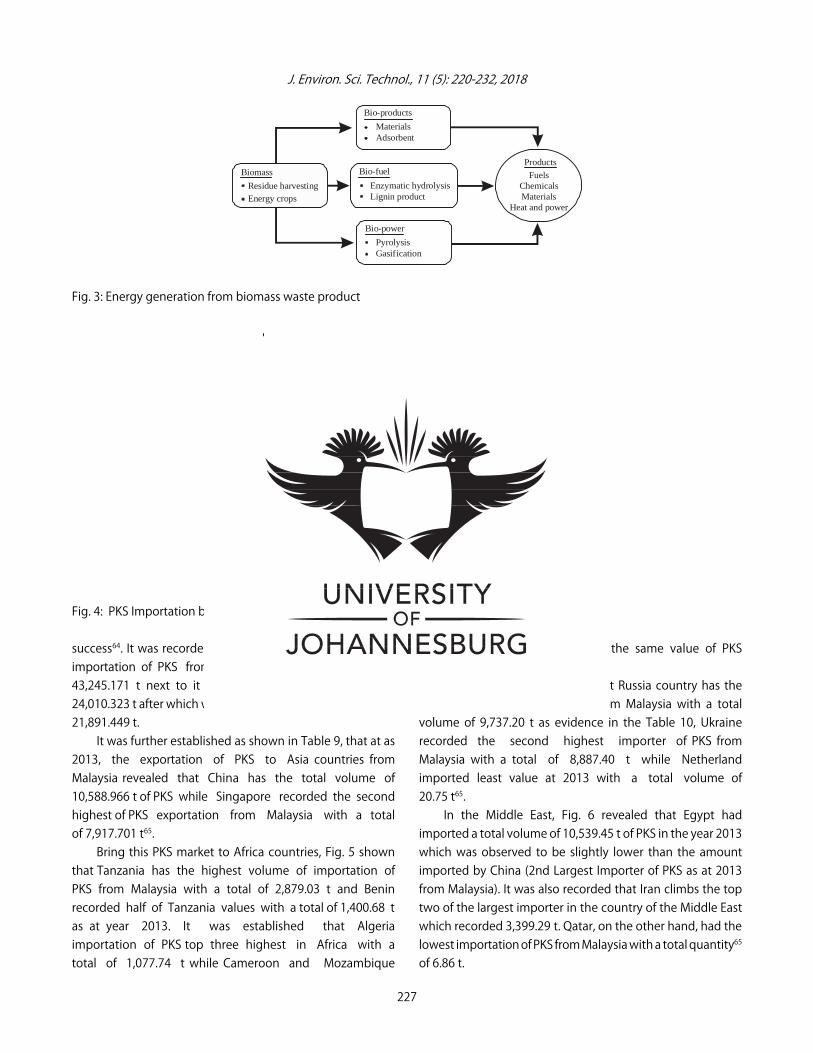
J. Environ. Sci. Technol., 11 (5): 220-232, 2018
40000
30000
20000
10000
0
Qua
ntit
y (t
)
Asia
Europ
e
Midd
le Eas
t
Ocean
ia
Africa
North
Amer
ica
South
Amer
ica
Region
Bio-products
Biomass
Bio-power
Bio-fuelProducts
MaterialsAdsorbent
Enzymatic hydrolysisLignin product
Residue harvesting
Energy crops
PyrolysisGasification
FuelsChemicalsMaterials
Heat and power
Fig. 3: Energy generation from biomass waste product
Fig. 4: PKS Importation by continents from Malaysia in the year 2013
success64. It was recorded that Asia country has the highestimportation of PKS from Malaysia with total volume of43,245.171 t next to it was Europe with total volume of24,010.323 t after which was Middle East with total volume of21,891.449 t.
It was further established as shown in Table 9, that at as2013, the exportation of PKS to Asia countries fromMalaysia revealed that China has the total volume of 10,588.966 t of PKS while Singapore recorded the second highest of PKS exportation from Malaysia with a total of 7,917.701 t65.
Bring this PKS market to Africa countries, Fig. 5 shownthat Tanzania has the highest volume of importation ofPKS from Malaysia with a total of 2,879.03 t and Beninrecorded half of Tanzania values with a total of 1,400.68 t as at year 2013. It was established that Algeria importation of PKS top three highest in Africa with a total of 1,077.74 t while Cameroon and Mozambique
countries imported least with the same value of PKSimportation65 of 22.40 t.
In Europe it was observed that Russia country has thehighest Importation of PKS from Malaysia with a totalvolume of 9,737.20 t as evidence in the Table 10, Ukrainerecorded the second highest importer of PKS fromMalaysia with a total of 8,887.40 t while Netherlandimported least value at 2013 with a total volume of20.75 t65.
In the Middle East, Fig. 6 revealed that Egypt hadimported a total volume of 10,539.45 t of PKS in the year 2013which was observed to be slightly lower than the amountimported by China (2nd Largest Importer of PKS as at 2013from Malaysia). It was also recorded that Iran climbs the toptwo of the largest importer in the country of the Middle Eastwhich recorded 3,399.29 t. Qatar, on the other hand, had thelowest importation of PKS from Malaysia with a total quantity65
of 6.86 t.
227

J. Environ. Sci. Technol., 11 (5): 220-232, 2018
310,1108,4
3399,3
21,0
1169,7
145,9
6,9815,8
2743,0
183,6
1606,5
10539,5
BahrainSyriaEgyptUAEKuwaitJordanSaudi ArabiaQatarLibyaLebanonOmanIran
Countries
3000
2500
2000
1500
1000
500
0
Algeria
Angola
Benin
Camero
on
Africa
n rep
ublic
Congo
Djibou
ti
Gabon
Ghana
Kenya
Mad
agas
car
Mala
wi
Mau
ritius
Mor
occo
Moz
ambiq
ue
Sene
gal
Sierra
Leone
Somali
a
South
Afri
ca
Tanz
ania
Togo
Countries
Qua
ntity
(t)
Fig. 5: Statistical data of PKS Imported by Africa Countries in 2013
Fig. 6: Statistical data on PKS exported by Malaysia to Middle East Countries in 2013
Table 9: Statistical data of PKS exported to Asia country in year 2013Countries Quantity (t)Thailand 43.97China 10,588.97Taiwan 508.84Indonesia 5.68Japan 2,348.44South Korea 2,737.22Kyrgyzstan 431.48Bangladesh 2,111Brunei 1.08Sri Lanka 525.11Hong Kong 340.26Singapore 7,917.70Kazakhstan 841.94Vietnam 10.00Pakistan 2,500.31Philippines 1.26India 398.89
As shown in Table 11 with reference to Oceania countriesin PKS markets, Australia has the highest Importer of PKS fromMalaysia with a total quantity of 11,251.37 t followed byNew Zealand which has a total volume of 3,880.77 t andNew Caledonia imported least value of PKS with an amount of18.81 t65.
In North America, it was on record as at 2013 as shownin Fig. 7 that Mexico top the list of the country with thehighest value of PKS importation from Malaysia with a totalof 512.72 t, it was observed that importation in North Americadoes not vary too much. Nevertheless, it has been recordedthat the Dominican Republic and the Bahamas behavedindifferently, in both cases, the importation of PKS was 224 tand 1.80 t, respectively65.
228

J. Environ. Sci. Technol., 11 (5): 220-232, 2018
500
400
300
200
100
0
Qua
ntity
(t)
United
state
s
Canad
a
Mex
ico
Domini
can rep
ublic
Trinid
ad an
d Tob
ago
Baham
as
Countries
Fig. 7: PKS imported by North America countries in the year 2013 from Malaysia
Table 10: Statistical data of PKS exportation by Malaysia to Europe in 2013 Countries Quantity (t)Georgia 411.44Lithuania 21.40Poland 85.26Turkey 3234.34Bulgaria 644.00Denmark 117.40Latvia 82.80Netherlands 20.75Slovenia 21.76Croatia 23.74Hungary 79.95Romania 642.88Ukraine 8887.40Russia 9737.20
Table 11: PKS imported by Oceania Countries in the year 2013 from Malaysia Countries Quantity (t)New Caledonia 18.81Papua New Guinea 81.13Fiji 23.85New Caledonia 18.81Australia 11251.37
CONCLUSION
After the extensive reviews and experimentation of palmkernel shell. It was revealed by EDX analysis, that the mainconstituents of PKS-powder are carbon, silicon, aluminium,iron, calcium, potassium and oxygen.
Aside being used as filler, additives, reinforcement inbuilding applications, energy generation, activated carbonand water purifier. PKS ash can also being use in thereinforcement of polymers, ceramics and metals matricescomposites especially during friction stir welding andprocessing.
SIGNIFICANCE STATEMENT
Palm kernel shell powder/ash has been used for severalapplications. It has been established that the performance,efficiency and effectiveness of palm kernel shell/ash in anyapplications be as reinforcement, fillers, activated carbon,water purification, additives as well as energy generationdepend whether is in form of nano-, micro- and macro-particles. In this review study, Palm kernel shell powder wasstudied to determine its usefulness in the area of surfaceengineering such texture and surface modification andfunctionalization. In our previous article, PKS powder wasused as carbon additive in the manufacturing of HSScutting tools used on lathe machine, in this study the endresult performed higher than the control tool importedabroad. This was one of the reasons that propelled thisstudy into using it for reinforcement in Friction StirProcessing (FSP) which no one has used both in matricesand hybrid composites, this will be used after it has beenheat treated to optimum calcination temperature to formash. PKS Ash has been proven significance in the field ofEngineering where they use it abundantly for reinforcementin concretes and polymers, water purifiers and energygeneration as fuel.
REFERENCES
1. Alengaram, U.J., H. Mahmud and M.Z. Jumaat, 2010.Comparison of mechanical and bond properties of oil palmkernel shell concrete with normal weight concrete. Int. J.Phys. Sci., 5: 1231-1239.
229

J. Environ. Sci. Technol., 11 (5): 220-232, 2018
2. Afolalu, S.A., E.Y. Salawu, I.P. Okokpujie, A.A. Abioye andO.P. Abioye et al., 2017. Experimental analysis of the wearproperties of carburized HSS (ASTM A600) cutting tool. Int. J.Applied Eng. Res., 12: 8995-9003.
3. Okokpujie, I.P., O.M. Ikumapayi, U.C. Okonkwo, E.Y. Salawu,S.A. Afolalu et al., 2017. Experimental and mathematicalmodeling for prediction of tool wear on the machining ofaluminium 6061 alloy by high speed steel tools. Open Eng.,7: 461-469.
4. Yusuf, I.T. and Y.A. Jimoh, 2012. Palm kernel shell wasterecycled concrete road as cheap and environmental friendlyfreeway on very poor subgrades. Sci. J. Civil Eng. Architect.,Vol. 2012.
5. Ahmad, R., N. Hamidin, U.F.M. Ali and C.Z.A. Abidin, 2014.Characterization of bio-oil from palm kernel shell pyrolysis.J. Mech. Eng. Sci., 7: 1134-1140.
6. Rahman, A.A., F. Sulaiman and N. Abdullah, 2016. Influenceof washing medium pre-treatment on pyrolysis yieldsand product characteristics of palm kernel shell. J. Phys. Sci.,27: 53-75.
7. Jagustyn, B., I. Patyna and A. Skawinska, 2013. Evaluation ofphysicochemical properties of palm kernel shell as agrobiomass used in the energy industry. CHEMIK, 67: 552-559.
8. Oladosu, K.O., B. Kareem, B.O. Akinnuli and A.O. Alade, 2016.Optimization of ash yield from the combustion of palm kernelshell and selected additives (Al2O3, CaO and MgO) usingD-optimal design. Leonardo Electron. J. Pract. Technol.,15: 9-18.
9. Daniyan, I.A., A.M. Omokhuale, A.A. Aderoba, O.M. Ikumapayiand B.A. Adaramola, 2017. Development and performanceevaluation of organic fertilizer machinery. Cogent Eng.,Vol. 4, No. 1. 10.1080/23311916.2017.1364044.
10. Fuadi, N.A.B., A.S. Ibrahim and K.N. Ismail, 2012. Review studyfor activated carbon from palm shell used for treatment ofwaste water. J. Purity Util. React. Environ., 1: 252-266.
11. Fono-Tamo, R.S., O.O. Idowu and F.O. Koya, 2014.Development of pulverized palm kernel shells basedparticleboard. Int. J. Mater. Mech. Eng., 3: 54-61.
12. Okoroigwe, E.C., C.M. Saffron and P.D. Kamdem, 2014.Characterization of palm kernel shell for materialsreinforcement and water treatment. J. Chem. Eng. Mater. Sci.,5: 1-6.
13. Alemgaram, U.J., M.Z. Jumaat and H. Mahmud, 2008. Ductilitybehaviour of reinforced palm kernel shell concrete beams.Eur. J. Sci. Res., 23: 406-420.
14. Alengaram, U.J., H. Mahmud, M.Z. Jumaat and S.M. Shirazi,2010. Effect of aggregate size and proportion on strengthproperties of palm kernel shell concrete. Int. J. Phys. Sci.,5: 1848-1856.
15. Gibigaye, M., G.F. Godonou, R. Katte and G. Degan, 2017.Structured mixture proportioning for oil palm kernel shellconcrete. Case Stud. Construct. Mater., 6: 219-224.
16. Olutoge, F.A., H.A. Quadri and O.S. Olafusi, 2012. Investigationof the strength properties of palm kernel shell ash concrete.Eng. Technol. Applied Sci. Res., 2: 315-319.
17. Olumuyiwa, A.J., T.S. Isaac, O.A. Adewunmi and A.I. Ololade,2012. Effects of palm kernel shell on the microstructure andmechanical properties of recycled polyethylene/palm kernelshell particulate composites. J. Miner. Mater. Charact. Eng.,11: 825-831.
18. Ndoke, P.N., 2006. Performance of palm kernel shells as apartial replacement for coarse aggregate in asphalt concrete.Leonardo Electron. J. Pract. Technol., 5: 145-152.
19. Afolalu, S.A., S.B. Adejuyigbe, O.R. Adetunji and O.I. Olusola,2015. Production of cutting tools from recycled steel withpalm kernel shell as carbon additives. Int. J. Innov. AppliedStud., 12: 110-122.
20. Itam, Z., S. Beddu, N.L.M. Kamal, M.A. Alam and U.I. Ayash,2016. The feasibility of palm kernel shell as a replacement forcoarse aggregate in lightweight concrete. IOP Conf. Ser.:Earth Environ. Sci., Vol. 32. 10.1088/1755-1315/32/1/012040.
21. Olutoge, F.A., 2010. Investigations on sawdust and palmkernel shells as aggregate replacement. ARPN J. Eng. AppliedSci., 5: 7-13.
22. Afolalu, S.A., A.A. Abioye, J. Idirisu, I.P. Okokpujie andO.M. Ikumapayi, 2018. Abrasion wear of cutting toolsdeveloped fromrecycled steel using Palm Kernel Shell (PKS)as carbon additive. Prog. Ind. Ecol.: Int. J. 10.1504/PIE2018.10014662.
23. Kuhe, A., H.A. Iortyer and E.I. Kucha, 2013. Experimentalinvestigation of a “throatless” downdraft gasifier with palmkernel shell. J. Renew. Sustain. Energy, Vol. 5. 10.1063/1.4811802.
24. Ibhadode, A.O.A. and I.M. Dagwa, 2008. Development ofasbestos-free friction lining material from palm kernel shell.J. Braz. Soc. Mech. Sci. Eng., 30: 166-173.
25. Osei, D.Y., 2013. Pozzolana and palm kernel shells asreplacements of portland cement and crushed granite inconcrete. Int. J. Eng. Invent., 2: 1-5.
26. Mahmud, H., M.Z. Jumaat and U.J. Alengaram, 2009. Influenceof sand/cement ratio on mechanical properties of palmkernel shell concrete. J. Applied Sci., 9: 1764-1769.
27. Olanipekun, E.A., K.O. Olusola and O. Ata, 2006. Acomparative study of concrete properties using coconut shelland palm kernel shell as coarse aggregates. Build. Environ.,41: 297-301.
28. Oyedepo, O.J., L.M. Olanitori and S.P. Akande, 2015.Performance of coconut shell ash and palm kernel shell ashas partial replacement for cement in concrete. J. Build. Mater.Struct., 2: 18-24.
29. Ekwueme, L., O. Ogbobe and O.G. Tenebe, 2016. Utilization ofcarbonized palm kernel shell as filler in natural rubbercomposite. Compos. Mater.: Int. J., 1: 1-8.
230

J. Environ. Sci. Technol., 11 (5): 220-232, 2018
30. Afolalu, S.A., S.B. Adejuyigbe, O.R. Adetunji and O.I. Olusola,2015. Effects of carburization on mechanical properties ofrecycled steel with Perm Kernel Shell (PKS) as carbonadditives. Int. J. Adv. Res., 3: 1-7.
31. Khankhaje, E., M. Rafieizonooz, M.R. Salim, J. Mirza, Salmiatiand M.W. Hussin, 2017. Comparing the effects of oil palmkernel shell and cockle shell on properties of perviousconcrete pavement. Int. J. Pavement Res. Technol.,10: 383-392.
32. Muntohar, A.S. and M.E. Rahman, 2014. Lightweightmasonry block from oil palm kernel shell. Construct. Build.Mater., 54: 477-484.
33. Adebayo, O., 2012. Assessment of palm kernel shells asaggregate in concrete and laterite blocks. J. Eng. Stud. Res.,18: 88-93.
34. Nwaobakata, C. and J.C. Agunwamba, 2014. Effect of palmkernel shells ash as filler on the mechanical properties of hotmix asphalt. Arch. Applied Sci. Res., 6: 42-49.
35. Ishola, M., O. Oladimeji and K. Paul, 2017. Development ofecofriendly automobile brake pad using different gradesizes of palm kernel shell powder. Curr. J. Applied Sci.Technol., 23: 1-14.
36. Mgbemena, C.O., C.E. Mgbemena and M.O. Okwu, 2014.Thermal stability of pulverized Palm Kernel Shell (PKS) basedfriction lining material locally developed from spent waste.ChemXpress, 5: 115-122.
37. Dagwa, I.M., P.F. Builders and J. Achebo, 2012.Characterization of palm kernel shell powder for use inpolymer matrix composites. Int. J. Mech. Mechatron. Eng.,12: 88-93.
38. Jumasiah, A., T.G. Chuah, J. Gimbon, T.S.Y. Choong and I. Azni,2005. Adsorption of basic dye onto palm kernel shellactivated carbon: Sorption equilibrium and kinetics studies.Desalination, 186: 57-64.
39. Mak, S.M., B.T. Tey, K.Y. Cheah, W.L. Siew and K.K. Tan,2009. Porosity characteristics and pore developments ofvarious particle sizes Palm Kernel Shells Activated Carbon(PKSAC) and its potential applications. Adsorption, 15: 507-519.
40. Ulfah, M., S. Raharjo, P. Hastuti and P. Darmadji, 2016. Thepotential of palm kernel shell activated carbon as anadsorbent for $-carotene recovery from crude palm oil. AIPConf. Proc., Vol. 1755. 10.1063/1.4958560.
41. Pam, A.A., A.H. Abdullah, T.Y. Ping and Z. Zainal,2018. Batch and fixed bed adsorption of Pb(II) fromaqueous solution using EDTA modified activatedcarbon derived from palm kernel shell. BioResources,13: 1235-1250.
42. Garcia, J.R., U. Sedran, M.A.A. Zaini and Z.A. Zakaria, 2018.Preparation, characterization and dye removal study ofactivated carbon prepared from palm kernel shell. Environ.Sci. Pollut. Res., 25: 5076-5085.
43. Muhammad, T.G. Chuah, Y. Robiah, A.R. Suraya andT.S.Y. Choong, 2011. Single and binary adsorptions isothermsof Cd(II) and Zn(II) on palm kernel shell based activatedcarbon. Desalination Water Treat., 29: 140-148.
44. Faizal, G., 2012. Application palm kernel shell charcoal in steelcarburizing process. B.Sc. Thesis, Mechanical EngineeringFaculty (Structure and Material), Universiti Ternikal Malaysia,Melaka.
45. Elham, P.B., 2001. The production of palm kernel shellcharcoal/by the continous kiln method. M.Sc. Thesis, Facultyof Forestry, Universiti Putra Malaysia, Malaysia.
46. Valdes, C.F., F. Chejne, G. Marrugo, R.J. Macias andC.A. Gomez et al., 2016. Co-gasification of sub-bituminouscoal with palm kernel shell in fluidized bed coupled to aceramic industry process. Applied Thermal Eng.,107: 1201-1209.
47. Asadullah, M., N.S. Ab Rasid, S.A.S.A. Kadir and A. Azdarpour,2013. Production and detailed characterization of bio-oilfrom fast pyrolysis of palm kernel shell. Biomass Bioenergy,59: 316-324.
48. Okoroigwe, E.C. and C.M. Saffron, 2012. Determination ofbio-energy potential of palm kernel shell by physicochemical characterization. Niger. J. Technol., 31: 329-335.
49. Uemura, Y., S. Saadon, N. Osman, N. Mansor and K.I. Tanoue,2015. Torrefaction of oil palm kernel shell in the presence ofoxygen and carbon dioxide. Fuel, 144: 171-179.
50. Kim, S.J., S.H. Jung and J.S. Kim, 2010. Fast pyrolysis of palmkernel shells: Influence of operation parameters on the bio-oilyield and the yield of phenol and phenolic compounds.Bioresour. Technol., 101: 9294-9300.
51. Sumathi, S., S.P. Chai and A.R. Mohamed, 2008. Utilization ofoil palm as a source of renewable energy in Malaysia. Renewable Sustainable Energy Rev., 9: 2404-2421.
52. Ugwu, K.E. and K.E. Agbo, 2011. Briquetting of palm kernelshell. J. Applied Sci. Environ. Manage., 15: 447-450.
53. Yacob, A.R., N. Wahab, N.H. Suhaimi and M.K.A.A. Mustajab,2013. Microwave induced carbon from waste palmkernel shell activated by phosphoric acid. Int. J. Eng. Technol.,5: 214-217.
54. Mohamad, M.F., A. Ramli, S.E.E. Misi and S. Yusup, 2011. Steamgasification of Palm Kernel Shell (PKS): Effect of Fe/BEA andNi/BEA catalysts and steam to biomass ratio on compositionof gaseous products. Int. J. Chem. Mol. Nuclear Mater. Metall.Eng., 5: 1085-1090.
55. Ninduangdee, P., V.I. Kuprianov, E.Y. Cha, R. Kaewrath,P. Youngyuen and W. Atthawethworawuth, 2015.Thermogravimetric studies of oil palm empty fruit bunch andpalm kernel shell: TG/DTG analysis and modeling. EnergyProc., 79: 453-458.
56. Obi, O.F., 2015. Evaluation of the physical properties ofcomposite briquette of sawdust and palm kernel shell.Biomass Convers. Biorefinery, 5: 271-277.
231

J. Environ. Sci. Technol., 11 (5): 220-232, 2018
57. Febriansyah, H., A.A. Setiawan, K. Suryopratomo andA. Setiawan, 2014. Gama stove: Biomass stove for palm kernelshells in Indonesia. Energy Proc., 47: 123-132.
58. Lai, Z.Y., H.B. Chua and S.M. Goh, 2013. Influence of processparameters on the strength of oil palm kernel shell pellets.J. Mater. Sci., 48: 1448-1456.
59. Bazargan, A., S.L. Rough and G. McKay, 2014. Compaction ofpalm kernel shell biochars for application as solid fuel.Biomass Bioenergy, 70: 489-497.
60. Fono-Tamo, R.S. and O.A. Koya, 2013. Characterisation ofpulverised palm kernel shell for sustainable wastediversification. Int. J. Scient. Eng. Res., 4: 6-10.
61. Oh, S.J., K.B. Park and J.S. Kim, 2017. Production of bio-oilfrom palm kernel shell in a newly developed two-stagepyrolyzer. Proceedings of the 5th International Conference onSustainable Solid Waste Management, June 21-24, 2017,Athens, Greece, pp: 2-3.
62. Emiero, C. and O.J. Oyedepo, 2012. An investigation on thestrength and workability of concrete using palm kernel shelland palm kernel fibre as a coarse aggregate. Int. J. Scient. Eng.Res., 3: 1-5.
63. Afolalu, S.A., I.P. Okokpujie, E.Y. Salawu, A.A. Abioyeand O.M. Ikumapayi, 2018. Study of the performances ofnano-case treatment cutting tools on carbon steel workmaterial during turning operation. AIP Conf. Proc., Vol. 1957.10.1063/1.5034331.
64. Afolalu, S.A., A.A. Abioye, M.O. Udo, O.R. Adetunji,O.M. Ikumapayi and S.B. Adejuyigbe, 2018. Data showingthe effects of temperature and time variances onnano-additives treatment of mild steel during machining.Data Brief, 19: 456-461.
65. DST., 2015. Palm kernel shell. http://biofuelresource.com/palm-kernel-shell/
232

42
2.11 ARTICLE X
The effects of Vibratory-Disc Milling on the Physicochemical and
Morphological Properties of Coal-Fly Ash Nano-particles
Published in Key Engineering Materials, Vol 796, 2019, Pages 38 - 45.
DOI: https://doi.org/10.4028/www.scientific.net/KEM.796.38,
ISSN: 1662-9795
The morphological and physicochemical characteristics of milled coal fly ash (CFA) collected
from ESKOM coal-fired power station situated at the Mpumalanga location in South Africa. The
CFA was milled in nano-particles, after 1 hour milled with the digital vibratory-disc milling
machine. Proper preparations were carried out on it, to ensure safety and the standard ethics of
handling during milling.
The milling times were 20 minutes, 40 minutes and 60 minutes. The milling times were selected
at a step of 20 minutes in order to produce fine particles at 60 minutes. The 75 µm was taken at 0
minutes. The milled samples were characterized, by using SEM-EDX, XRD, and XRF. The results
of the characterizations were presented in the paper. The crystal-structure analysis, using XRD
revealed that CFA has the following dominant minerals: Hematite (Fe2O3), Quartz (SiO2),
Sillimanite (Al2(SiO4)O, Mullite (Al2.32Si0.68O4.84), Microcline (KAlSi3O8), Calcite high (CaCO3).
It was further revealed from the XRD analysis that the crystal phases contained in CFA were
rhombohedral, hexagonal, anorthic, and orthorhombic.
Statistical analysis of the grain sizes after milling time was conducted; and the form-factor
histogram at different milling times was also presented. It was also established from the statistical

43
analysis, that there was a 62.54 % increase in the mean value of CFA, from 49.971 µm at 0 min to
81.223 µm mean value at 60 minutes. It was concluded from the results of the study that the milling
duration influenced the particle size, the morphology, the volume, the pore size distribution, and
the surface area. This published journal article has been able to address the objective of the study
in item I.
Effects of Vibratory Disc Milling Time on the Physiochemical and Morphological Properties of Coal Fly Ash Nanoparticles
Omolayo M. Ikumapayi1,a* and Esther T. Akinlabi2,b
1,2Department of Mechanical Engineering Science, University of Johannesburg, Auckland Park Kingsway Campus, Johannesburg, 2006, South Africa
*Corresponding Email: [email protected], [email protected], [email protected]
Keywords: SEM-EDX, Milling Time, Nanoparticle, Vibratory Disc Milling, Coal Fly Ash
Abstract. In this study, the mechanical disc milling of coal fly ash (CFA) produced by ESKOM thermal station in South Africa has been investigated. The present work covers the effects of milling time on the characteristics such as crystal phases, particle sizes, morphology and physiology of the powder. The produced nanoparticle powders were characterized by SEM-EDX, XRD, and XRF. The milling time was carried out at (𝑡𝑡 = 0, 20, 40, 60 𝑚𝑚𝑚𝑚𝑚𝑚𝑚𝑚𝑡𝑡𝑚𝑚𝑚𝑚)at a constant milling speed of 940 rpm. The results showed that mean area of the particles of the particle sizes increased from 75 µm size to approximately 200 nm which revealed that there was 62.5 % increase in the number of particle size as a result of disintegration of the area of particle sizes. The crystal phases detected by the XRD in CFA are hexagonal, orthorhombic, rhombohedral and anorthic. XRD analysis showed that the most dominant minerals in coal fly ash are Quartz (SiO2), Mullite (Al2.32Si0.68O4.84), Sillimanite (Al2(SiO4)O, Calcite high (CaCO3), Hematite (Fe2O3), Microcline (KAlSi3O8). It was also revealed by EDX that the main elemental compositions present in CFA are silicon, aluminium, calcium, iron, titanium and magnesium. It was established in the study that the duration of the milling affects volume, surface area, particle size, pore size distributions, as well as microstructure.
1. Introduction The fly ash (FA) is a powdery particulate biomaterial which is driven in the flue gas thereby collected either by mechanical or electrical means. Coal Fly ash (CFA) is a fly ash generated from thermal power stations in most countries of the worlds [1]. It was proven that combustion of CFA in thermal plants produces the emission of NOx, SOx and other toxic gases alongside with ample of FA. It is a storage for essential minerals but is deficient in phosphorus and nitrogen which are needed for agricultural productivity[2]. Fly ash has proved to have a good performance and is environmental friendliness; and is also as an economical substitute for the costly raw materials [3]. In recent years, many researchers have developed interest in exploiting the utilization and advances in up-cycling technologies of fly ash, by so doing promoting the value-added applications of fly ash such as reinforcements, fillers, additives, purifiers, as well as a suitable raw materials in brick making and concrete[4], [5], zeolite synthesis, geopolymers, remover of acid mine drainage[6], organic fertilizers, ceramic glazes, landfilling, forestry and agricultural applications, catalysis, soap making as caustic potash, roads and embankment, wasteland reclamation, waste treatment, adsorptions of metals and colours from wastewater, prevent topsoil loss etc [7], [8]. It was revealed that FA particles are fundamentally controlled by the temperature of the combustion, rate of cooling and particles compositions[9]. In the past to date, a huge amount of fly ash generated from the coal power station has pose challenges in storage and handling environmentally and economically. In the past, the fly has either been disposed of into the dams and lagoon or utilized in making bricks[10]. Fly ash has been proven to have high potent pesticides. FA has a porosity of nanopores and nano dimensions which will help to hold and load other nano-compounds, as a result serves as value-addition and lowering the cost of tiles lining floor and walls, kitchens, public toilets, hospitals, bathing ghats, as well as railway stations where bacterial contaminations are high[10], [11].
Key Engineering Materials Submitted: 2018-08-19ISSN: 1662-9795, Vol. 796, pp 38-45 Revised: 2018-11-26doi:10.4028/www.scientific.net/KEM.796.38 Accepted: 2018-12-27© 2019 Trans Tech Publications, Switzerland Online: 2019-03-22
All rights reserved. No part of contents of this paper may be reproduced or transmitted in any form or by any means without the written permission of TransTech Publications, www.scientific.net. (#113275199-11/03/19,11:35:25)

2.0 Materials and Methods
2.1 Material Collection and Processing:
The Coal Fly Ash (CFA) used in this analysis was collected from ESKOM coal-fired power station located at Mpumalanga area of South Africa. CFA was collected in a raw form, thereafter washed with distilled water to remove impurities and any other contaminants present, it was then discharged and drained to dry and later put inside an electric oven set at 800C for 48 hours to remove all the water content, it was then obtained dry.
2.2 Coal Fly Ash Preparation
After the Fly Ashes samples collected were washed with distilled water to remove impurities and they were dried in the oven at 800C for 48 hours in order to remove the water content, after it was dried, it was then sieved using ASTM meshes standard range by employing KingTest Sieve of 75µm size on KingTest Sieve Shaker (VB 200/300) with operating voltage of 220V/50Hz and 5A. The Fly Ashes proportion that passed through the Mesh size of 75µm was then taken for milling. The flowchart procedure of the powder preparation and characterizations is showed in Figure 1.
Figure 1: Flowchart for the preparation and characterizations of CFA 2.2 Vibratory Disc Milling Machine (VDMM) Milling operation was performed using a digitalized vibratory disc milling machine (Model 2MZ-200). The machine has specifications as presented in Table 1
Table 1: Vibratory disc milling machine specification
Property Specification Dimension 740 x 740 x 950 mm Number of bowls 2 Capacity per bowl 200g Feed Size < 15mm Motor 380V/ 50Hz, 1.5KW Motor speed 940rpm
Mechanical Milling was carried out using Digital Vibratory Disc Milling Machine for 20, 40 and 60 mins
Coal Fly Ash acquired from thermal Plant
Sieved, Washed with Distilled water and drained to dryness
Dried in ambient temperature for 72 hours
Further drying of CFA in an electric oven set at 80° C for 48 hours
Characterisations
SEM EDX XRD XRF
Key Engineering Materials Vol. 796 39

2.3 Characterizations of Coal Fly Ash Nanoparticles (CFA-NPs)
The milled and unmilled CFA were analyzed through various microstructural characterization processes such as Scanning Electron Microscopy (SEM), Energy Dispersive X-ray (EDX), X-Ray Diffraction (XRD), and X-Ray Fluorescence (XRF) etc.
2.3.1 Scanning Electron Microscope (SEM)
TESCAN model, type VEGA 3 LMH and model no VG9731276ZA with the following processing details 50/60Hz, 230V and 1300VA is the type of SEM machine employed for the studies. In order to have the samples more conductive and to have better resolution, the samples were sputter coated with a thin layer of carbon just before the scanning electron microscope analysis coupled with Energy Dispersive Spectrometer (EDS) analyses. The beam intensity used in the analysis was 12 and the accelerating voltage used was 20KV, all micrographs were taken at SEM magnification of 1000 (1.0 kx). The particle size and surface of CFA-NPs were analysed at different milling times and also the unmilled samples were also analysed by SEM. The micrographs of different milling time are presented in Figure 2.
2.3.2 X-Ray Fluorescence (XRF) Analysis
In this research, PHILIPS PW1404 X-Ray Fluorescence (XRF) Spectrometer was used to carry out the chemical composition of CFA in the as-received state (raw state) and the outcome of the analysis is presented in Table 2.
2.3.3 Energy Dispersive X-Ray Spectroscopy (EDXS)
The elemental composition of both milled and raw (unmilled) Coal Fly Ash was analysed qualitatively and quantitatively by the use of EDXS. It was revealed as shown in Table 3 that Silicon, Aluminium, Calcium, Iron, Titanium, and magnesium are present in CFA. The variation in the trend of the composition of each element present was monitored at different milling time.
2.3.4 X-Ray Diffraction (XRD) Analysis
PHILIPS X’Pert which was made in Holland with the model number (12NC: 943003040601) and operating parameters, PW: 3040/60, 240V, 8.5KVA, and 50Hz was employed to study and obtain the ultimate quality of diffraction data of the samples and to confirm the crystal structure of the samples used. Milled (CFA-NPs) at 20, 40 and 60 mins and unmilled samples were analysed with the aid of X-Ray diffraction (XRD) for determination of the existence of crystalline phases before and after disc milling and mineralogical compositions were obtained. After the completion of the milling process, the samples of CFA were analysed by X-ray diffractometer with the following processing parameters: Current 40mA, excitation voltage of 40kV, scanning rate 0.05 (2Ꝋ/seg), angle 2Ꝋ between 100 and 800, respectively. The diffraction pattern at different milling times is as depicted in Figure 3. The XRD was acquired using copper Kα radiation (λ = 1.5406 Å) and kꞵ radiation (λ = 1.39225 Å) and an automatic divergence slit; i.e., an irradiated sample length that is independent of the Bragg angles ((2θ) in degree).
3.0 Results and Discussion The Chemical and elemental compositions of CFA as analysed by XRF and EDXS are presented in Tables 2 and 3 respectively.
40 Advances on Manufacturing and Material Sciences II

Table 2: The Chemical Composition Analysis of CFA using XRF
CHEMICAL FORMULA CFA (%) Al2O3 30.9 SiO2 51.43 MgO 1.95 TiO2 1.74 Fe2O3 2.29 CaO 6.75 MnO 0.02 Na2O 0.54 P2O3 1.08 Cr2O3 0.77 K2O 0.77 N2O 0.01 SO3 0.54 LOI 1.21
𝟗𝟗𝟗𝟗.𝟐𝟐𝟐𝟐
Table 3: Variable in Elemental Composition as analysed by EDXS
NANOPARTICLE ELEMENT ELEMENTAL COMPOSITION AT DIFFERENT MILLING TIMES
0 Min (Unmilled)
20 Mins 40 Mins 60 Mins
CFA-NPs Si 50.7 55.5 52.3 48.9 Al 29.2 27.0 26.2 26.9 Ca 9.9 8.9 9.8 9.7 Fe 4.6 4.9 7.3 8.4 Ti 2.6 2.2 2.8 2.1 Mg 2.9 1.5 1.6 1.5
3.1 Scanning Electrons Microscopy (SEM) Analysis The SEM analysis was employed to examine the morphology and topology of the sample. It was revealed that CFA-NPs has smooth spherical particles of cenospheres and that the morphology interspersed with aggregates of crystalline compounds. It can be seen that CFA contains large particle size before milling as depicted in figure 2 (A1) at 50µm. In figure 2 (A2), it was observed that particle size becomes smaller in size at 50µm. Figure 2 (A3) shows that particle aggregation, the smaller particles sticking to larger ones as evidenced in the work of [12]. It was also established from the micrographs that further milling still affects the size of the particle and still an agglomeration of the particles. 3.2 Energy Dispersive X-Ray Spectroscopy (EDXS) The elemental compositions of the sieved CFA at 0 min (unmilled) using 75 µm ASTM standard sieve and 𝑡𝑡ℎ𝑚𝑚 𝑚𝑚𝑚𝑚𝑚𝑚𝑚𝑚𝑚𝑚𝑚𝑚𝑚𝑚 𝑎𝑎𝑡𝑡 (𝑡𝑡 = 20, 40, 60 𝑚𝑚𝑚𝑚𝑚𝑚𝑚𝑚𝑡𝑡𝑚𝑚𝑚𝑚) were also analyzed by the use of EDX in Figure 3. It was revealed that Silicon contents in CFA-NPs ranges between 48.9% and 55.5%, Aluminium contents in CFA-NPs was revealed to be between 26.2% and 19.2%, Calcium between 8.9% and 9.9%, iron contents were seen to be between 4.6% and 8.4%, this seen to be imbalance compared to other elements that fall within the same range, Titanium contents in CFA-NPs revealed to be between 2.1% and 2.8% which is still in acceptable contents, while Magnesium contents were revealed to fall between 1.5% and 2.9%.
Key Engineering Materials Vol. 796 41
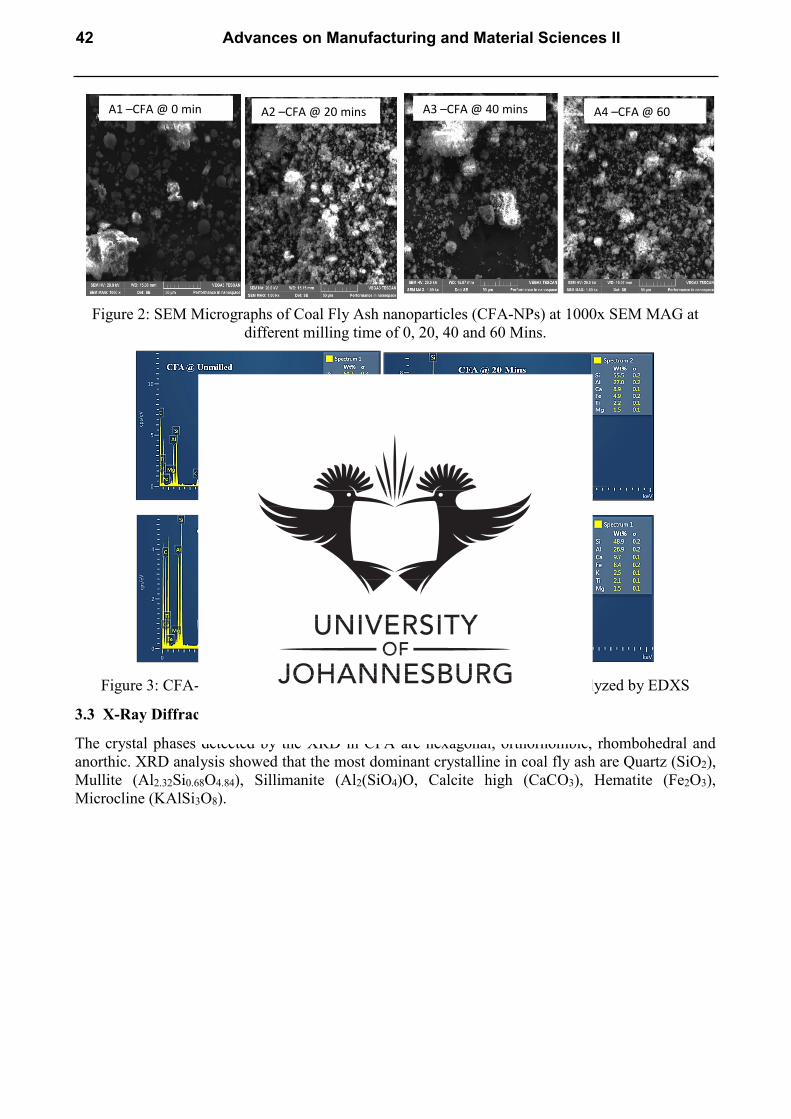
Figure 2: SEM Micrographs of Coal Fly Ash nanoparticles (CFA-NPs) at 1000x SEM MAG at different milling time of 0, 20, 40 and 60 Mins.
Figure 3: CFA-NPs Elemental Compositions at different Milling time as analyzed by EDXS
3.3 X-Ray Diffraction (XRD) Analysis
The crystal phases detected by the XRD in CFA are hexagonal, orthorhombic, rhombohedral and anorthic. XRD analysis showed that the most dominant crystalline in coal fly ash are Quartz (SiO2), Mullite (Al2.32Si0.68O4.84), Sillimanite (Al2(SiO4)O, Calcite high (CaCO3), Hematite (Fe2O3), Microcline (KAlSi3O8).
A3 –CFA @ 40 mins A4 –CFA @ 60
A1 –CFA @ 0 min A2 –CFA @ 20 mins
42 Advances on Manufacturing and Material Sciences II
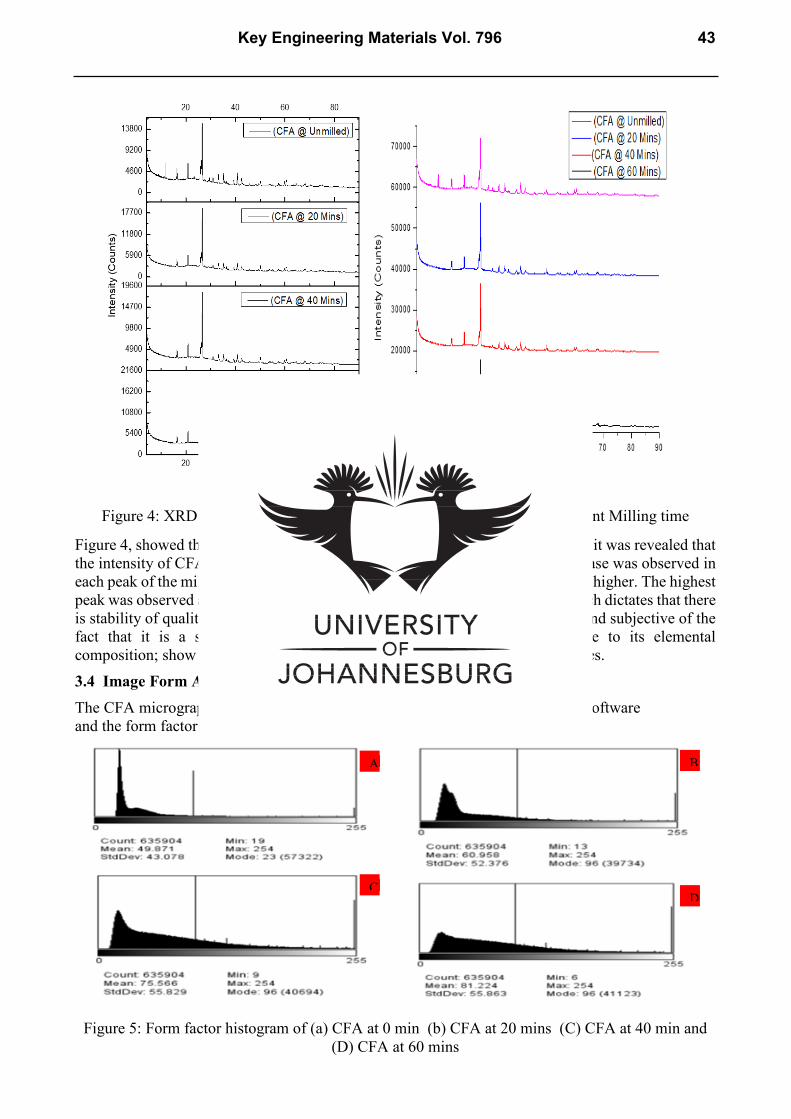
Figure 4: XRD diffractograms of Coal Fly Ash Ash Nano-Particles at different Milling time
Figure 4, showed that XRD diffractograms of coal fly ash nanoparticle produced, it was revealed that the intensity of CFA almost constant for all the milling times but a slightly increase was observed in each peak of the milling stage. At almost 30° (2Ꝋ), the peaks were observed to be higher. The highest peak was observed at approximately 28° (2Ꝋ) in all the stages of the milling, which dictates that there is stability of quality in CFA. Hence, the integrity of the CFA remained evenly and subjective of the fact that it is a suitable material (powder reinforcement) and with relative to its elemental composition; show in high percentage proportion of Al2O3 and less of Iron Oxides. 3.4 Image Form Analysis The CFA micrographs at 0, 20, 40 and 60 minutes were analysed using ImageJ software and the form factor distribution is presented in Figure 5.
Figure 5: Form factor histogram of (a) CFA at 0 min (b) CFA at 20 mins (C) CFA at 40 min and (D) CFA at 60 mins
A B
C D
Key Engineering Materials Vol. 796 43

To monitor the distributions of particle size from 0 minutes to 60 minutes of milling, the micrographs of CFA at 0 min to 60 mins processing time (i.e. Fig 5 A- D) were analysed by ImageJ software and the result was presented in Figure 5 and Table 4. It was observed that at a 0 minute which is Fig 5A, the mean particle distribution was analysed to be 49.897 with a minimum of 19, in the course of progressive milling to 60 minutes i.e. Fig 5D, the mean particle distribution has increased to 81.223 with a minimum of 6. This implies that there was an increase in the volume of particle size as a result of milling into smaller or finer sizes of about 62.54 % increase. By these analyses, milling time has significant effects on the microstructure and particle size distributions this was also evidence in Figure 4 of XRD.
Table 4: Microstructural Statistics of CFA at unmilled and varying milling time
Milling Time (mins) Mean (µm) STD (µm) 0 49.971 43.078 20 60.958 52.276 40 75.566 55.829 60 81.223 55.863
Conclusion and Contributions From the experimental results and their discussions, it can be concluded that:
i. Mechanical Dry Milling (MDM) was carried out with different process milling time of 20, 40 and 60 Mins and powder of CFA-NPs were studied using SEM-EDS, XRD and XRF. It was established in the study that the durations of MDM affected volume, surface area, particle size, pore size distributions, and microstructure.
ii. It was also established by SEM micrographs that fly ash particles contain mainly smooth spherical, and cenospheres in shape.
iii. It was also revealed by EDX that the main elemental compositions present in CFA are silicon, aluminium, calcium, iron, titanium and magnesium.
iv. The crystal phases detected by the XRD in CFA are hexagonal, orthorhombic, rhombohedral and anorthic. XRD analysis showed that the most dominant crystalline in coal fly ash was Quartz (SiO2), Mullite (Al2.32Si0.68O4.84), Sillimanite (Al2(SiO4)O, Calcite high (CaCO3), Hematite (Fe2O3), and Microcline (KAlSi3O8).
v. It was also established that there was 62.54 % increase in the mean value of CFA from 49.971 µm at 0 min to 81.223 µm mean value at 60 mins as revealed by form factor histogram.
References
[1] T. Hemalatha and A. Ramaswamy, “A review on fly ash characteristics e Towards promoting high volume utilization in developing sustainable concrete,” J. Clean. Prod., vol. 147, pp. 546–559, 2017.
[2] A. Malik and A. Thapliyal, Eco-friendly fly ash utilization: Potential for land application, vol. 39, no. 4. 2009.
[3] T. Sundum, K. Mészáros, and K. Kaewtatip, “Preparation and characterization of thermoplastic starch composites with fl y ash modi fi ed by planetary ball milling,” Carbohydr. Polym., vol. 191, no. February, pp. 198–204, 2018.
[4] B. Ma et al., “Utilization of pretreated fly ash to enhance the chloride binding capacity of cement-based material,” Constr. Build. Mater., vol. 175, pp. 726–734, 2018.
44 Advances on Manufacturing and Material Sciences II
[5] S. Masuka, W. Gwenzi, and T. Rukuni, “Development , engineering properties and potential applications of un fi red earth bricks reinforced by coal fl y ash , lime and wood aggregates,” J. Build. Eng., vol. 18, no. March, pp. 312–320, 2018.
[6] Y. Jia, H. Feng, D. Shen, Y. Zhou, and T. Chen, “High-performance microbial fuel cell anodes obtained from sewage sludge mixed with fl y ash,” J. Hazard. Mater., vol. 354, no. February, pp. 27–32, 2018.
[7] S. Kumar, S. Kumar, and S. C. Mishra, “Processing and Characterization of Fly-ash Compacts,” Mater. Today Proc., vol. 5, no. 2, pp. 3396–3402, 2018.
[8] C. Liu et al., “A novel process to enrich alumina and prepare silica nanoparticles from high-alumina fly ash,” Fuel Process. Technol., vol. 173, no. December 2017, pp. 40–47, 2018.
[9] G. Xu and X. Shi, “Resources , Conservation & Recycling Characteristics and applications of fl y ash as a sustainable construction material : A state-of-the-art review,” Resour. Conserv. Recycl., vol. 136, no. April, pp. 95–109, 2018.
[10] P. Patra et al., “Characterization of nanocomposites in flyash for possible pesticide application,” AIP Conf. Proc., vol. 1276, pp. 144–147, 2010.
[11] B. Sambandam, T. Devasena, V. Ibrahim, H. Islam, and B. M. Prakhya, “Characterization of coal fly ash nanoparticles and their induced in vitro cellular toxicity and oxidative DNA damage in different cell lines,” Indian J. Exp. Biol., vol. 53, no. September, pp. 585–593, 2015.
[12] S. Roberto, J. José, and D. O. Andrade, “Investigation of mechanical properties and carbonation of concretes with construction and demolition waste and fly ash,” Constr. Build. Mater. J., vol. 153, pp. 704–715, 2017.
Key Engineering Materials Vol. 796 45
44
2.12 ARTICLE XI
Image-Processing and Particle-Size Analysis of Coconut-Shell Nano-particles
Published in International Journal of Civil Engineering and Technology, Vol 10, Issues 02,
February 2019, pp. 2475–2482,
Link: http://www.iaeme.com/ijmet/issues.asp?JType=IJCIET&VType=10&IType=2
ISSN Print: 0976-6308 and ISSN Online: 0976-6316
In this published paper, the particle sizes of coconut-shell nano-particles were analysed, using
ImageJ software for image segmentation, which helps to distinguish between the foreground and
the background via thresholding. The coconut-shell powder that was milled at different milling
time of 20, 40 and 60 minutes, and then subjected to thresholding and processing. In this study,
the scanning electron microscope (SEM) was employed to study the morphology of the coconut
shell ash. Energy Dispersive X-ray (EDX) was used to analyze the elemental composition; and X-
Ray Fluorescence (XRF) was used to acquire the chemical compositions.
The statistical data were also employed to analyze the particle size. It was revealed that at 75 µm
taken at 0 minute milled, the area particle sizes was found to be 16.105 µm2 ; while its area as the
standard deviation distribution was recorded as 200.738 µm2 ; and the average particle-size
distribution was found to be 809 µm; whereas at 60 minutes milled, the average area distribution
was found to be 8.945 µm2;while the area standard deviation was recorded as 115.851µm2; and
the mean particle size distribution was 2032 µm, which revealed that there was a significant
improvement in the particle-size distribution after 60 minutes of milling. This published journal
article has been able to address the objective of the study in item I.
http://www.iaeme.com/IJCIET/index.asp 2475 [email protected]
International Journal of Civil Engineering and Technology (IJCIET)
Volume 10, Issue 02, February 2019, pp. 2475–2482, Article ID: IJCIET_10_02_245
Available online at http://www.iaeme.com/ijmet/issues.asp?JType=IJCIET&VType=10&IType=2
ISSN Print: 0976-6308 and ISSN Online: 0976-6316
© IAEME Publication Scopus Indexed
IMAGE PROCESSING AND PARTICLE SIZE
ANALYSIS OF COCONUT SHELL
NANOPARTICLES
Omolayo M. Ikumapayi
Department of Mechanical Engineering Science, University of Johannesburg,
Auckland Park Kingsway Campus, Johannesburg, 2006, South Africa
Esther T. Akinlabi
Department of Mechanical Engineering Science, University of Johannesburg,
Auckland Park Kingsway Campus, Johannesburg, 2006, South Africa
Department of Mechanical Engineering, Covenant University, Ota, Nigeria
*Corresponding Author E-mail address: [email protected];
ABSTRACT
The efficacy of coconut Shell nanoparticle (CS-NPs) in any application either as
activated carbon, filler, or reinforcement depend absolutely on if the particle is in the
form of macro-, micro-, and nano- particles. It has been established by various
authors that investigated the effect of milling on particles size that reductions in
particle size improve mechanical properties, absorption rate, and morphological
characteristics. Coconut Shell nanoparticles (CS-NPs) has been studied using
Scanning Electron Microscopy (SEM), Energy Dispersive X-ray (EDX), and X-Ray
Fluorescence (XRF) analyses. The SEM magnifications were taking at 1.00kx which
gives 50 µm at varying milling time of 0, 20, 40 and 60 Mins. A digitalized mechanical
vibratory disc milling machine was used for the grinding of the Coconut Shell. In this
study, processing of SEM images has been carried out using ImageJ software by the
method of thresholding segmentation. The processing was carried out to determine the
foreground from a background of the CS-NPs, this enhanced visual perception and a
better understanding of the Images at the same time high resolutions and better
quality of the final result of the analysis were achieved. It was revealed that at 0
minutes which has been taken as 75 µm sieved, the highest values for the mean
particle area was found to be 16.105 µm2 and its area standard deviation at that point
was found to be 200.738 µm2which gives the least value for a number of particle size
distribution as 809 µm. However, 60 minutes milling time was noted to have the least
mean particle area with area standard deviation value of 8.945 µm2 and the highest
value for the number of particle size was recorded at the point to be 2032 µm. In
overall, milling time is directly proportional to the increasing number of particle size
distribution and inversely proportional to the area of particle size.

Omolayo M. Ikumapayi and Esther T. Akinlabi
http://www.iaeme.com/IJCIET/index.asp 2476 [email protected]
Key words: Coconut Shell Nanoparticles; Milling time; SEM-EDX, Image
Processing.
Cite this Article: Omolayo M. Ikumapayi and Esther T. Akinlabi, Image Processing
and Particle Size Analysis of Coconut Shell Nanoparticles, International Journal of
Civil Engineering and Technology 10(2), 2019, pp. 2475–2482.
http://www.iaeme.com/IJCIET/issues.asp?JType=IJCIET&VType=10&IType=2
1. INTRODUCTION
Coconut shell is an agricultural biomaterial and agro-waste that has found great applications
in technological advancement, from activated carbon, purification, the source of energy,
reinforcement to filler and lots more. Coconut shell as agro-waste has posted lots of health
problems to the people where is widely cultivated and disposed of as solid waste. It is a major
source of water pollution for the people living around where it is processed. Notwithstanding,
it has lots of benefits that bring waste to wealth. Coconut Shell has been widely applied as
aggregate in concrete mixing especially construction industries [1]. It has been established
[2], [3] that CSP has tremendous effects on the strength, impact energy and hardness of
composite materials and has been proven as wood protectant[4]. Milling times of Coconut
Shell Powder into nanoparticles was studied [5] and the milling time was established to be
70h total span times and its effects were studied.
Coconut Shell has been tried and tested to have unbeatable and effective durability
characteristics[6], [7], high toughness, abstractive resistance, good adsorption effects [8] as
well as having suitable properties for longstanding use [9]. Coconut shell has been used in
carbon nanotube as activated carbon [10] and they are able to achieve a 179nm reduction in
the size of Coconut shell powder (CSP). Coconut shell (Figure 1a & b) has been proven to
have a different range of thicknesses, between 2 – 10 mm with an approximate density of
1.6g/cm3, [11] and Coconut Shell powder (Figure 1c) is light brown in colour with 0.7g/cm
3
bulk density.
Coconut Shell (CS) as lignocellulosic biomaterials is mostly available in Nigeria,
Malaysia, Thailand, Indonesia, and Sri Lanka[10], [12]. CS is very cheap and is readily
available in the aforementioned countries though seasonal. It was established that CS contains
65-70% volatile matter and moisture, these are always separated during the process of
calcination, that is, converting the CS into char [13].
2. MATERIALS AND METHODS
2.1. Material collection and processing
Matured and edible Coconut Fruits as shown in Figure 1a were purchased from Johannesburg
popular commercial Market, Hillbrow in South Africa. The exocarp which is the outer part of
the coconut fruit was first removed with a cutlass, it was then broken down into smaller and
uneven chunks with varying sizes ranging from 2 – 10 mm. The water inside the coconut fruit
was then drained and the whitish edible part which is also known as mesocarp was carefully
removed from the hard and woody part which also known as endocarp (Coconut Shell) [2],
[9], [13] as shown in Figure 1b. This lignocellulosic agro-waste was then washed with
deionized water and cleaned with acetone to remove any contaminants that might present
within. This was then placed inside an electric oven set at 50 °C for 5 days to ensure complete
dryness of moisture contents before crushing. The coconut shells (CS) were then crushed into
smaller sizes as shown in Figure 1c and pulverized into macro particles and further milling
was performed on it to ensure finer particles sizes of 75µm size. The Coconut Shell powder

Image Processing and Particle Size Analysis of Coconut Shell Nanoparticles
http://www.iaeme.com/IJCIET/index.asp 2477 [email protected]
(CS-P) sieved with 75µm ASTM meshes standard as shown in Figure 1d was then assumed 0-
minute milling and taken for characterizations.
Figure 1a: Coconut fruits Figure 1b: Coconut Shell (CS) Figure 1c: Broken CS Figure 1d: Pulverised CS
2.2. Vibratory Disc Milling Machine (VDMM)
Mechanical milling operation was carried out on the coconut shell with the aid of digitalized
Double chambered vibratory disc milling machine. The chambers (bowls) were thoroughly
washed with distilled water and cleaned with acetone before the milling operation to remove
every trace of contaminations within the system. The machine was set for 5 minutes operation
and then allowed to cool to room temperature (usually 20 minutes) and at the same time
reduce the adherence of the powder to the wall of the bowls before the next operation. The
machine parameters are shown in Table 1.
Table 1. Vibratory disc milling machine parameters
Parameters Value
Capacity per bowl 200g
Dimension 740 x 740 x 950 mm
Feed Size < 15mm
Motor speed 940rpm
Number of bowls 2
Motor 380V/ 50Hz, 1.5KW
2.3. Microstructural characterization
The characterizations of the Coconut Shell Nanoparticles (CS-NPs) produced were carried
with the use of Scanning Electron Microscopy (SEM), X-Ray Fluorescence (XRF), and
Energy Dispersive X-ray (EDX). These tools were used to study the physiochemical and
morphological behaviors CS-NPs at varying milling time of 0, 20, 40, 60 minutes.
2.3.1. Energy Dispersive X-Ray Spectroscopy (EDXS)
The elemental compositions of the sieved CS-NPs using 75 µm ASTM standard sieve was
carried out using EDX and the result are presented in Figure 2.
2.3.2. Scanning Electron Microscope (SEM)
The SEM Images were captured by SEM machine, TESCAN model, type VEGA 3 LMH
embedded with Energy Dispersive X-ray spectrometer (EDXS). The powders were first
sputter coated just before the Scanning using a thin layer of carbon to enable it to be more
conductive and for it to have better resolution. The intensity of the beam used was 12 and its
accelerating voltage was also noted to be 20 kV. All SEM images were taken at 1000x
resulting to and this was done at milling times of 0, 20, 40 and 60 minutes. The SEM
micrographs is presented in Figure 3.

Omolayo M. Ikumapayi and Esther T. Akinlabi
http://www.iaeme.com/IJCIET/index.asp 2478 [email protected]
2.3.3. X-Ray Fluorescence (XRF) Analysis
In this study, X-Ray Fluorescence Spectroscopy (XRF) was determined on CS-NPs with
PHILIPS PW1404 model machine. The chemical compositions of coconut shell nanoparticles
at 0 minutes, that is, after sieved with 75 µm ASTM standard sieve and its resulting values as
determined by XRF is presented in Table 2.
2.3.4. Image thresholding
Otsu’s method [14] was used for image thresholding. The technique is a nonparametric as
well as unsupervised thresholding technique, which selects optimum thresholds from
maximization of the intraclass variance of binary images. The global optimal threshold value
was obtained for the SEM images. To determine whether the milling time has a significant
effect on the microstructure, three time-steps were chosen for the experiment on the Coconut
Shell Nanoparticle (CS-NPs).
3. RESULTS AND DISCUSSION
The SEM images of CS-NPS were originally obtained in 768 by 828 pixels dimension at 110
dpi. The images were duplicated into 745 by 752 pixels at 600 dpi using ImageJ software for
processing. The Original Image was thresholding and then processed after which the particles
size in the foreground was measured leaving the background unmeasured. SEM images
obtained were binary images with the Coconut Shell powder (CSP) being of white in column
2 which is the processed images and green intensity in column 3 in thresholding Images and
red intensity in column 4 in particle size analysis; and the sputtering giving black shades in
column 2 and 3 which are processed and thresholding images and white in column 4 in
particle size analysis, numbering the particles in red intensity. Hence, an image
complementing process is essential. The resulting duplicated image was complemented, such
that white and black, green and black as well as red and white are revered in the binary
images. This makes the CS-NPs the regions of interest other than the black spots signifying
the sputtering. Actual size of the particles was obtained using ImageJ software, the result of
the processed, thresholding and particle size analysis results are presented in Figure 3. The
mean areas of the particle sizes, standard deviation, minimum and maximum areas of the
particle sizes are presented in Table 3.
Table 2: The Chemical Composition Analysis of CS-NPs using XRF
Chemical
Formula
Al2O3 MgO SiO2 CaO K2O Fe2O3 ZnO Na2O MnO
CS-NPs
(%)
16.76 19.4 45.6 0.78 0.42 8.98 0.39 0.41 0.17
Table 3. Measurements of particle size area of CS-NPs at unmilled and varying milling time
Milling Time
(mins)
Mean Area
(µm2)
STD Area (µm2) Min. Area
(µm2)
Max. Area
(µm2)
No. of
Particle
Sizes (µm)
0 16.105 200.738 0.074 4,988.486 809
20 14.384 178.957. 0.065 2,599.508 1379
40 12.528 147.684 0.057 908.293 1631
60 8.945 115.851 0.004 47.889 2032

Image Processing and Particle Size Analysis of Coconut Shell Nanoparticles
http://www.iaeme.com/IJCIET/index.asp 2479 [email protected]
Figure 2: The EDX Spectrograph of CS-NPs
Figure 3a: Original
micrograph at 50 µm of
75 µm sieved
Figure 3b: Processed
Image at 50 µm of 75
µm sieved
Figure 3c:
Thresholding Image
at 50 µm of 75 µm
sieved
Figure 3d: Particle
Size Analysis at 50
µm of 75 µm sieved
Figure 3e: Original
micrograph at 50 µm of
20 mins milled
Figure 3f: Processed
Image at 50 µm of 20
mins milled
Figure 3g:
Thresholding Image
at 50 µm of 20 mins
milled
Figure 3h: Particle
Size Analysis at 50
µm of 20 mins
milled

Omolayo M. Ikumapayi and Esther T. Akinlabi
http://www.iaeme.com/IJCIET/index.asp 2480 [email protected]
Figure 3i: Original
micrograph at 50 µm of
40 mins milled
Figure 3j: Processed
Image at 50 µm of 40
mins milled
Figure 3k:
Thresholding Image
at 50 µm of 40 mins
milled
Figure 3l: Particle
Size Analysis at 50
µm of 40 mins
milled
Figure 3m: Original
micrograph at 50 µm of
60 mins milled
Figure 3n: Processed
Image at 50 µm of 60
mins milled
Figure 3o:
Thresholding Image
at 50 µm of 60 mins
milled
Figure 3p: Particle
Size Analysis at 50
µm of 60 mins
milled
Figure 3: SEM Micrographs of Coconut Shell Nanoparticles (CS-NPs) at 1000x SEM MAG at
different milling time of 0, 20, 40 and 60 mins.
Figure 3(a – p) are the Original Images, processed images, thresholding images, and
particle size measurements for varying milling time of 0, 20, 40 and 60 respectively. This
has been grouped into four columns i.e. columns 1 to 4. Column 1 represents the Original
Images from the 75 µm sieved to 60 minutes milled.
Figure 3(a, e, i, and m) in column 1 are the original Images before the actual processing
takes place for unmilled (75 µm sieved i.e. 0 min), 20, 40 and 60 minutes respectively. There
was a gradual reduction in the area of the particle size from column 1 down the column (i.e.
3a – 3m) which was also evident in Table 3 as the number of particle sizes increases down the
column 1 as a result of milling time which disintegrated the particle size.
Figure 3(b, f, j, and n) are the processed Images from Original Images (a, e, i, and m)
which appeared in binary images by segmentation. The foreground is the white pixel (i.e. CS-
NPs) and the background is the black pixel (i.e. sputtering). Figure 3(c, g, k, and o) are the
thresholding images from the processed images (b, f, j, and n) where the foreground is a green
pixel which replaced the white pixel in the processed images but still maintained the
background which is a black pixel. Figure 3(d, h, l, and p) are the measured Images for
particle size analysis from the thresholding Images. It was observed in Table 3 that there was
Image Processing and Particle Size Analysis of Coconut Shell Nanoparticles
http://www.iaeme.com/IJCIET/index.asp 2481 [email protected]
increased in the number of particle sizes from 809 µm at 0 minutes to 2032 µm at 60 minutes
milled. This suggests that there was a significant influence of milling on the CS-NPs.
4. CONCLUSIONS
Image processing was used in this study to distinguish foreground pixel from the background
pixel and this was achieved through image manipulation using ImageJ software. The
manipulations of the Images were done in order to separate the foreground from a background
of the Original Images. Image processing analysis was investigated through thresholding
segmentation at varying milling times( ). It was revealed in this
study that an increase in milling time leads to an increase in the particle size distribution and
also leads to reduction in the particle area as depicted in Table 3. The main elemental
constituents of CS-NPs has revealed by EDX in Figure 2 are Oxygen, Calcium, Carbon,
Potassium, Chlorine, Phosphorous and Copper. It was observed that 0 minutes milling time,
that is, 75 µm sieved noted to have the highest mean area particle size of 16.105 µm2, its area
standard deviation was found to be 200.738 µm2 and 809 µm was recorded to be the number
of particle size distribution. In contrast, the lowest values of particle mean area was found at
60 minutes milling time which was 8.945 µm2
and its area standard deviation value was
115.851µm2 while 2032 µm was estimated to be
the highest number of particle size
distribution at this milling time. It can be concluded that, milling time is directly proportional
to particle size distribution and inversely proportional to area of particle size.
REFERENCES
[1] A. S. Leman et al., “Properties of concrete containing coconut shell powder (CSP) as a
filler,” IOP Conf. Ser. Mater. Sci. Eng., vol. 271, no. 1, pp. 0–8, 2017.
[2] S. O. Agunsosoye, J.O, Isaac, T.S, Samuel, “Study of Mechanical Behaviour of Coconut
Shell Reinforced Polymer Matrix Composite,” J. Miner. Mater. Charact. Eng., vol. 2012,
no. 11, pp. 774–779, 2012.
[3] M. D. Teli, P. Pandit, and S. Basak, “Coconut shell extract imparting multifunction
properties to ligno-cellulosic material,” J. Ind. Text., vol. 47, no. 6, pp. 1261–1290, 2018.
[4] K. S. Shiny, R. Sundararaj, and G. Vijayalakshmi, “Potential use of coconut shell
pyrolytic oil distillate (CSPOD) as wood protectant against decay fungi,” Eur. J. Wood
Wood Prod., vol. 76, no. 2, pp. 767–773, 2018.
[5] S. A. Bello, J. O. Agunsoye, and S. B. Hassan, “Synthesis of coconut shell nanoparticles
via a top down approach: Assessment of milling duration on the particle sizes and
morphologies of coconut shell nanoparticles,” Mater. Lett., vol. 159, pp. 514–519, 2015.
[6] Y. Nadir and A. Sujatha, “Durability Properties of Coconut Shell Aggregate Concrete,”
KSCE J. Civ. Eng., vol. 22, no. 5, pp. 1920–1926, 2018.
[7] R. Siva Sankara Raju, M. K. Panigrahi, R. I. Ganguly, and G. Srinivasa Rao,
“Investigation of Tribological Behavior of a Novel Hybrid Composite Prepared with Al-
Coconut Shell Ash Mixed with Graphite,” Metall. Mater. Trans. A Phys. Metall. Mater.
Sci., vol. 48, no. 8, pp. 3892–3903, 2017.
[8] P. S. Bhandari and P. R. Gogate, “Kinetic and thermodynamic study of adsorptive
removal of sodium dodecyl benzene sulfonate using adsorbent based on thermo-chemical
activation of coconut shell,” J. Mol. Liq., vol. 252, pp. 495–505, 2018.

Omolayo M. Ikumapayi and Esther T. Akinlabi
http://www.iaeme.com/IJCIET/index.asp 2482 [email protected]
[9] R. Rajakumar, T. M. Midhun, K. Anoop, S. Aiswarya, K. R. Deepthi, and A. D. Anusree,
“Coconut Shell as an Alternative for Asbestos in Asbestos Cement Sheets,” no. June, pp.
10–11, 2015.
[10] A. Melati and E. Hidayati, “Synthesis and characterization of carbon nanotube from
coconut shells activated carbon,” J. Phys. Conf. Ser., vol. 694, no. 1, 2016.
[11] A. S. Leman et al., “Durability of coconut shell powder (CSP) concrete,” IOP Conf. Ser.
Mater. Sci. Eng., vol. 271, no. 1, 2017.
[12] O. M. Ikumapayi and E. T. Akinlabi, “ Data showing the effects of vibratory disc milling
time on the microstructural characteristics of Coconut Shell Nanoparticles ( CS-NPs ),”
Data Br., vol. 22, pp. 537–545, 2019.
[13] O. I. Oluwole and K. L. Oluwaseun, “Mechanical , Abrasion and Water Absorption
Characteristics of Coconut Shell Ash and Charcoal Based Polyester Composites,” West
Indian J. Eng., vol. 16, no. 2, pp. 51–67, 2016.
[14] N. Otsu, “A Threshold Selection Method from Gray-Level Histograms,” IEEE Trans.
Syst. Man. Cybern., vol. 9, no. 1, pp. 62–66, 1979.

45
2.13 ARTICLE XII
The image Segmentation and Grain Size measurements of Palm-Kernel Shell
Powder
Published in Lecture Notes in Mechanical Engineering-Advances in Material Sciences and
Engineering (SPRINGER/Scopus), page 265- 274, 2020.
DOI: https://doi.org/10.1007/978-981-13-8297-0_29
ISSN – 2195-4364
In this article paper, ImageJ software was employed to segment and analyse the grain sizes of
mechanically milled palm-kernel shell powder (PKSP). This study enables the user to differentiate
between the foreground and the background of the processing powder via thresholding. The Digital
Vibratory milling machine was employed for the mechanical milling at the time intervals of 0, 10,
15 and 20 minutes; and it was then subjected to thresholding and processing. The following
characterizations were employed in this study: The sscanning electron microscope (SEM) was
employed to study the morphology of the PKSP; The Energy Dispersive X-ray (EDX) was used
to analyze the elemental composition; and the X-Ray Fluorescence (XRF) was used to acquire the
chemical compositions. Statistical data were also employed to analyze the particle size. The results
revealed that, at 300 µm, the sieved matter was taken as 0 min; while the average area of the
particle size was recorded as 127.169 µm2; and the area standard deviation was 4,091.487 µm2 ;
which was the highest value; but with the lowest number of particle-size distributions, recorded as
458 µm. However, at the end of 20 minutes milled, the average area of the particle sizes with the
standard deviation recorded had become lower with the values 52.913 µm2 and 795.413 µm2,
respectively; while the highest particle size distribution was noticed as 1315 µm, which further

46
revealed that the mechanical milling had a great influence on the particle-size distributions.
Furthermore, the EDX analysis revealed that Ca, Al, Si, Fe, C, K, and O were the main elemental
constituents of the PKS-powder. This published journal article has been able to address the
objective of the study in item I.

Image Segmentation and Grain SizeMeasurements of Palm Kernel ShellPowder
Omolayo M. Ikumapayi and Esther T. Akinlabi
Abstract Image segmentation is one of the essential tools to determine the fore-ground from background and at the same time enhance visual perception for betterunderstanding through image manipulation. It is very useful for pattern recognitionand image processing. This enables users to determine the high quality and highresolutions of the final result of the analysis. In this present study, PKS-Powderhas been characterized with the use of Scanning Electron Microscopy (SEM), andEnergy Dispersive X-ray (EDX) analyses. Digital Vibratory milling machine wasemployed for the mechanical milling at the time interval of 0, 10, 15 and 20 min.ImageJ software was employed for image processing by sectioning an image intovarious regions using thresholding segmentation method. It was revealed that at 0min (i.e. 300µm sieved), it has the highest mean area value of 127.169µm2 and areastandard deviation of 4,091.487µm2 with the least value of a number of particle sizedistribution of 458 µm. In contrast, 20 min milled has the lowest values for meanarea and area standard deviation of 52.913 µm2 and 795.413 µm2 respectively withthe highest number of particle size distribution of 1,315 µm. It was observed thatmilling time increases the number of particle sizes distributions and reduces the areaof particle size. EDX analysis revealed that Ca, Al, Si, Fe, C, K, and O are the mainelemental constituents of PKS-powder.
Keywords Palm kernel shell · Image segmentation · SEM-EDX ·Milling
O. M. Ikumapayi (B) · E. T. AkinlabiDepartment of Mechanical Engineering Science, University of Johannesburg, Auckland ParkKingsway Campus, Johannesburg 2006, South Africae-mail: [email protected]
E. T. AkinlabiDepartment of Mechanical Engineering, Covenant University, Ota, [email protected]
© Springer Nature Singapore Pte Ltd. 2020M. Awang et al. (eds.), Advances in Material Sciencesand Engineering, Lecture Notes in Mechanical Engineering,https://doi.org/10.1007/978-981-13-8297-0_29
265

266 O. M. Ikumapayi and E. T. Akinlabi
1 Introduction
Nowadays, the use of bio-waste materials especially agro-waste has been a subjectof interest, not only for scientific and technological point of view but also for socio-economic benefits in terms of employment, revenue generation such as exportationto other countries, as well as environmental issues [1–3]. Palm Kernel Shell (PKS)has been utilized in several applications today in form of macro-, micro- and nano-particles. Despite being bio-waste materials that pose a nuisance to the environment,its applications havemade it be environmentally friendly and at the same time, is costeffective. Palm kernel shell is that hard part that enclosed and houses the nut of palmkernel fruit (Elaeis guineensis) [3, 4] (see Fig. 1). The processing of PKS involvingthe crushing of the palm kernel seed into different sectional sizes and then removethe nut within it and the left over as waste product is known as palm kernel shell.Several residues and waste products can be obtained from the process of removingand extracting freshly ripe and fleshy palm fruits from the bunch either at the millsor at home. These residues can be in form of empty fruit bunches (EFB), fibres, palmkernel shells as well as liquid waste in form of sewage (palm oil mill effluent, POME)with various usage, amongst which are preventing the attack of fibres from pest andinsect. Other applications is found in weaving of baskets, as fuel for domestic use.
PKS is a bio-waste material from the processing of palm kernel fruit oil and hasbeen progressively used in the various applications for environmental and technicalbenefits varying from water purification, additives, and reinforcements in buildingtechnology [5], aggregates, energy generation and fuel. It was noted that a greateruse of this bio-waste material is mostly pronounced in the concrete application forstructural components, water detoxifier and in the making of brakes in automotiveparts. It has been established that in order to increase the environmental sustainabilityof by-product waste materials, there must be effective management. However, toreduce landfill during construction process using waste materials such as PKS, theremust be effective strategies to waste management, this will eventually bring clean,sustainable and green construction [6]. It was also established that a large amountof PKS residues are left over during the process of oil palm production and as such
Fig. 1 a Palm kernel fruits, b palm kernel shell, c pulverised PKS
Image Segmentation and Grain Size Measurements of Palm Kernel … 267
posed environmental challenges since it was discharged untreated. On this note,effective utilization of PKS is required to curb this menace. At present, the mostutilization of PKS has been traced to boiler fuel in direct-fired systems to generatesteam, nevertheless, there is still an under-utilization of this bio-waste material [7].
Several researchers have done a tremendous study using PKS in Macro, Micro,and Nano level to conduct various experiments [7]. However, there is an area that isstill left blank that the researchers are yet to address which is the motive behind thisinvestigation. PKS has been utilized in the area of reinforcement in cement, concretes[8], composites in polymers, metals, and ceramics by various researchers. It has beenutilized as fuel generation [9], carbon additives [10, 11] and pyrolysis up till today-Pyrolysis of PKS was characterized and to be used for washing medium and pre-treatment process [12]. Its usefulness has also been extended to water treatment interms of Activated Carbon (AC) [13]. AC was produced from PKS and used as anadsorbent to remove pollutants from the aqueous phase. Production of AC from PKSwas established which was used to remove colorants from the body of water with thehelp of activating agent called ZnCl2 [8, 14]. Literatures revealed that about 34.5%PKS is estimated from a single palm kernel fruit and the disposal of this biomasmaterial waste has been a major environmental issue as reported [3, 15–17]. Palmkernel fruits, palm kernel shell as well as pulverized palm kernel shell are depictedin Fig. 1a–c respectively.
2 Materials and Methods
2.1 Material Collection and Processing
About 50 kg of palm kernel shell (PKS) used for this research work was collectedfrom a local palm oil processing mill located at Ota, Ogun State Nigeria. The PKSwas first sorted by removing any appearance of nuts and other extraneous materials,after which it was then washed with soap and rinsed with sufficient water to removedirt, dust or any other impurities and free it from foreign materials. It was then air-dried naturally under the sun for 48 h. In order to ensure total dryness, it was furtherdried in an electric oven set at 50 °C for another 24 h before it was finally crushedusing digitalised vibratory disc milling machine.
2.2 Vibratory Disc Milling Machine (VDMM)
A Digital Vibratory Disc Grinding Mill Lab Pulveriser (740× 740× 950 mm) withMachine Model 2MZ-200 supplied by FTLAB Technology has 2 pieces of bowlwith a capacity of 200 g per bowl, feed size of less than 15 mm, pulverize time of3–5 min or more depends on the nature of the materials, while the operating voltage

268 O. M. Ikumapayi and E. T. Akinlabi
of 380 V/50 Hz, motor capacity of 1.5 KW with rotational speed of 940 rpm; wasemployed to carry out dry mechanical milling (DMM) at varying processing timeof 10, 15 and 20 min which enables the reduction in particle size from micron tonear-nano levels for palm kernel shell powder. The machine was thoroughly washed,dried and cleaned with acetone before and after use to remove any contaminants thatmay be present. 40 g of PKS-Powder sample was charged into each bowl and thenset for running. The machine was interrupted every 5 min of operation in order toavoid a rise in temperature and at the same time to limit adherence of the powderwithin the container walls, the cooling interval before the next running was 30 min.
2.3 Microstructural Characterization
Themilled and unmilled PKS-Pwere analyzed through variousmicrostructural char-acterization processes. For this study, the Scanning Electron Microscopy (SEM),Energy Dispersive X-ray (EDX), X-Ray Diffraction (XRD), and X-Ray Fluores-cence (XRF) were used. The processes involved are discussed as follows.
2.3.1 Scanning Electron Microscope (SEM)
TESCAN model, type VEGA 3 LMH with model number VG9731276ZA and thefollowing details 50/60 Hz, 230 V and 1,300 VA is the type of SEMmachine that wasemployed for the studies. In order to have the sample more conductive and to havebetter resolution, the samples were sputter coated with a thin layer of carbon justbefore the scanning electron microscope analyses coupled with Energy DispersiveSpectrometer (EDS) analyses. The beam intensity used in the analysis is 14 and theaccelerating voltage used is 20 kV, all micrographs were taken at SEMmagnificationof 500× except the unmilled PKS-Pwhichwas taken at 56× SEMMEG. The particlesize and surface of Palm kernel Shell Powder (PKS-P) were analyzed at differentmilling times and the unmilled samples were also analyzed by SEM—this was takenas the sieved size of 300 µm according to ASTM standard. The micrographs ofdifferent milling time were taken at 10, 15 and 20 min at 100 µm.
2.3.2 Energy Dispersive X-Ray Spectroscopy (EDXS)
The elemental compositions of palm kernel shell powder as analysed by EDXS isdepicted in Table 1.

Image Segmentation and Grain Size Measurements of Palm Kernel … 269
Table 1 The EDX showselemental compositions ofPKS-P
Element Composition (wt%)
C 64.4
O 34.1
Si 0.9
Al 0.2
Fe 0.2
Ca 0.1
K 0.1
Table 2 The chemicalcomposition analysis ofPKS-P using XRF
Chemical formula PKS-P (%)
MgO 0.667
Al2O3 4.921
SiO2 46.23
K2O 4.254
SO3 2.257
CaO 4.786
Fe2O3 31.013
P2O5 2.448
TiO2 0.218
Cr2O3 0.267
MnO2 0.088
Na2O 1.32
2.3.3 X-Ray Fluorescence (XRF) Analysis
In this research, PHILIPS PW1404 X-Ray Fluorescence (XRF) Spectrometer is usedto carry out the chemical composition of PKS-P when sieved with 300 µm ASTMstandard sieve and the outcome of the analysis is presented in Table 2.
2.3.4 Image Thresholding
Otsu’s method [18] was used for image thresholding. The technique is a nonparamet-ric aswell as unsupervised thresholding technique,which selects optimum thresholdsfrom a maximization of the intraclass variance of binary images. The global optimalthreshold value was obtained for the SEM images. To determine whether the millingtime has a significant effect on the microstructure, three time-steps were chosen forthe experiment on the palm kernel shell powder (PKS-P).

270 O. M. Ikumapayi and E. T. Akinlabi
3 Results and Discussion
3.1 Image Analysis
The SEM images of PKS-P are originally obtained in 758 by 753 pixels dimension.The images were cropped into 747 by 747 pixels. SEM images obtained were binaryimages with the palm kernel powder being of white in column 2, which is a processedimage and green intensity in column 3 in thresholding Images and red intensity incolumn 4 in particle size analysis; and the sputtering giving black shades in column 2and 3 which are processed and thresholding images and white in column 4 in particlesize analysis. Hence, an image complementing process is essential. The resultingcropped image was complemented, such that white and black, green and black aswell as red and white are revered in the binary images. This makes the PKS-P theregions of interest other than the black spots signifying the sputtering. Actual sizeof the particles was obtained using ImageJ software, the result of the processed,thresholding and particle size analysis results are presented in Fig. 2. The meanareas of the particle sizes, standard deviation, minimum and maximum areas of theparticle sizes are presented in Table 3.
Figure 2a–t contains the Original Images from 0, 10, 15 and 20 min milling timeas well as processed images, thresholding images and particle size measurements ofthe same milling time. This has been grouped into four columns i.e. columns 1–4.Column 1 represents the Original Image from 300 µm down to 20 min milled.
Figure 2a, e, I, m, q in column 1 is the original images before the actual processingtakes place for unmilled (300 µm sieved), 0, 10, 1 and 20 min respectively. Therewas a gradual reduction in the area of the particle from column 1 down the column(Fig. 2a–q) which was also evident in Table 3 as the number of particle sizes increasedown the column 1.
Figure 2b, f, j, n, r are the processed Images fromOriginal Images which appearedin binary images by segmentation. The foreground is the white pixel (i.e. PKS-P)and the background is the black pixel (i.e. sputtering).
Figure 2c, g, k, o, s are the thresholding images from the processed images wherethe foreground is a green pixel which replaced thewhite pixel in the processed imagesbut still maintained the background which is a black pixel.
Table 3 Measurements of particle size area of PKS-P at unmilled and varying milling time
Milling time(mins)
Mean area(µm2)
STD area(µm2)
Min. area(µm2)
Max. area(µm2)
No. ofparticle sizes(µm)
0 127.169 4091.487 0.291 166,163.117 458
10 97.163 1964.954 0.304 55,425.272 839
15 62.687 1431.954 0.295 47,156.624 1167
20 52.913 795.413 0.287 26,131.384 1315
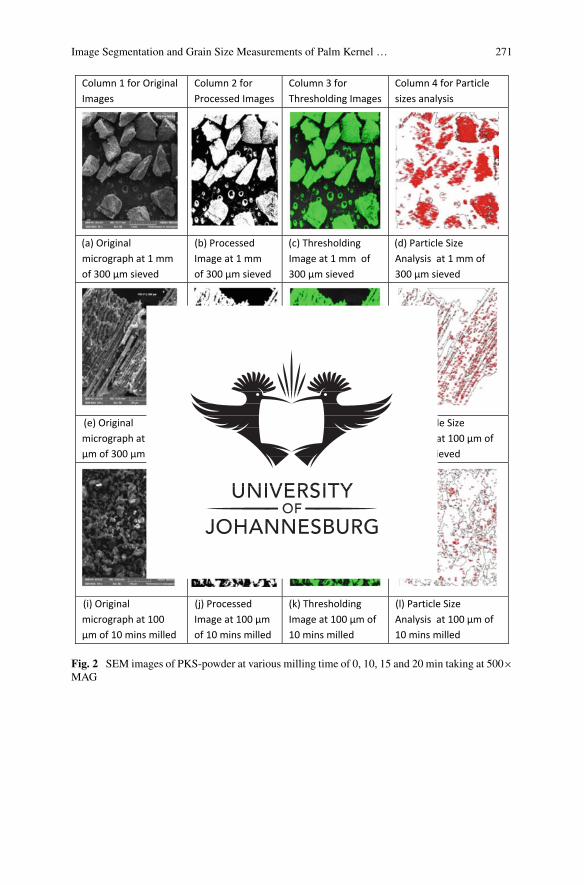
Image Segmentation and Grain Size Measurements of Palm Kernel … 271
Column 1 for OriginalImages
Column 2 forProcessed Images
Column 3 forThresholding Images
Column 4 for Particlesizes analysis
(a) Originalmicrograph at 1 mmof 300 μm sieved
(b) ProcessedImage at 1 mmof 300 μm sieved
(c) ThresholdingImage at 1 mm of300 μm sieved
(d) Particle SizeAnalysis at 1 mm of300 μm sieved
(e) Originalmicrograph at 100μm of 300 μm sieved
(f) ProcessedImage at 100 μmof 300 μm sieved
(g) ThresholdingImage at 100 μm of300 μm sieved
(h) Particle SizeAnalysis at 100 μm of300 μm sieved
(i) Originalmicrograph at 100μm of 10 mins milled
(j) ProcessedImage at 100 μmof 10 mins milled
(k) ThresholdingImage at 100 μm of10 mins milled
(l) Particle SizeAnalysis at 100 μm of10 mins milled
Fig. 2 SEM images of PKS-powder at various milling time of 0, 10, 15 and 20 min taking at 500×MAG

272 O. M. Ikumapayi and E. T. Akinlabi
(m) Originalmicrograph at 100μm of 15 mins milled
(n) ProcessedImage at 100 μmof 15 mins milled
(o) ThresholdingImage at 100 μm of15 mins milled
(p) Particle SizeAnalysis at 100 μm of15 mins milled
(q) Originalmicrograph at 100μm of 20 mins milled
(r) ProcessedImage at 100 μmof 20 mins milled
(s) ThresholdingImage at 100 μm of20 mins milled
(t) Particle SizeAnalysis at 100 μm of20 mins milled
Fig. 2 (continued)
Figure 2d, h, l, p, t are the measured images for particle size analysis taken at(300 µm sieved), 0, 10, 1 and 20 min. It was observed in Table 3 that there wasan increased in the number of particle sizes from 458 µm at 0 min to 1,315 µm at20 min milled. This suggests that there was a significant influence of milling on thePKS-P.
4 Conclusion
The method used in this work permitted the manipulations of micrographs in orderto have a true representation of the Powder distribution and at the same time dis-tinguishing foreground from background. Image processing analysis was investi-gated in this research through thresholding segmentation at varying milling times(t = 0, 20, 40, 60 min). It was revealed in the study that progressive milling leads toan increase in particle size distributions and decrease in the area of particle size as

Image Segmentation and Grain Size Measurements of Palm Kernel … 273
noted in Table 3. It was revealed that at 0 min (i.e. 300 µm sieved), the highest meanarea value of 127.169 µm2 and area standard deviation of 4091.487 µm2 with leastvalue of a number of particle size distribution of 458 µmwere observed. In contrast,20 min milled has the lowest values for mean area and area standard deviation of52.913 µm2 and 795.413 µm2 respectively with the highest number of particle sizedistribution of 1315 µm. It was observed that milling time increases the numberof particle sizes distributions and reduces the area of particle size. EDX analysisrevealed as showed in Fig. 1 that Ca, Al, Si, Fe, C, K, and O are the main elementalconstituents of PKS-powder. Applications of PKS-Powder are rooted in many areassuch as reinforcements in building and concretes applications, fillers, energy gener-ation and fuel, additives, activated carbon as well as water purification. PKS-powdercan also finds its near future applications in reinforcement of metal, ceramics andpolymers composites most especially in the friction stir processing and welding.
References
1. Dagwa IM, Builders PF, Achebo J (2012) Characterization of palm kernel shell powder for usein polymer matrix composites. Int J Mech Mechatron Eng 12(4):88–93
2. Olutoge FA, Quadri HA, Olafusi OS (2012) Investigation of the strength properties of palmkernel shell ash concrete. Eng Technol Appl Sci Res 2(6):315–319
3. Ikumapayi OM, Akinlabi ET (2018) Composition, characteristics and socioeconomic benefitsof palm kernel shell exploitation—an overview. J Environ Sci Technol 11(6):1–13
4. Peter Ndoke NDOKE (2006) Performance of palm kernel shells as a partial replacement forcoarse aggregate in asphalt concrete. Leonardo Electr J Pract Technol 5(9):145–152
5. Wang P, Zhang J, Shao Q, Wang G (2018) Physicochemical properties evolution of chars frompalm kernel shell pyrolysis. J Therm Anal Calorim 133(3):1–10
6. Khankhaje E, Rafieizonooz M, Salim MR, Mirza J, Salmiati, Hussin MW (2017) Comparingthe effects of oil palm kernel shell and cockle shell on properties of pervious concrete pavement.Int J Pavement Res Technol 10(5):383–392
7. Huang Y et al (2018) Relevance between chemical structure and pyrolysis behavior of palmkernel shell lignin. Sci Total Environ 633:785–795
8. Hamada HM, Jokhio GA, Yahaya FM, Humada AM, Gul Y (2018) The present state of theuse of palm oil fuel ash (POFA) in concrete. Constr Build Mater 175:26–40
9. Bediako M, Gawu SK, Adjaottor AA, Solomon Ankrah J, Atiemo E (2016) Analysis of co-fired clay and palm kernel shells as a cementitious material in Ghana. Case Stud Constr Mater5:46–52
10. Fono-Tamo RS, Idowu OO, Koya FO (2014) Development of pulverized palm kernel shellsbased particleboard. Int J Mater Mech Eng 3(3):54
11. Fono-Tamo RS, Koya OA (2017) Influence of palm kernel shell particle size on fade andrecovery behaviour of non-asbestos organic friction material. Procedia Manuf 7:440–451
12. Hidayu AR, Muda N (2016) Preparation and characterization of impregnated activated carbonfrom palm kernel shell and coconut shell for CO2 capture. Procedia Eng 148:106–113
13. Edmund CO, Christopher MS, Pascal DK (2014) Characterization of palm kernel shell formaterials reinforcement and water treatment. J Chem Eng Mater Sci 5(1):1–6
14. García JR, Sedran U, Zaini MAA, Zakaria ZA (2017) Preparation, characterization, and dyeremoval study of activated carbon prepared from palm kernel shell. Environ Sci Pollut Res1–10
15. Singh RP, Ibrahim MH, Esa N, Iliyana MS (2010) Composting of waste from palm oil mill: asustainable waste management practice. Rev Environ Sci Biotechnol 9(4):331–344

274 O. M. Ikumapayi and E. T. Akinlabi
16. Mgbemena CO,Mgbemena CE, OkwuMO (2014) Thermal stability of pulverized palm kernelshell (PKS) based friction lining material locally developed from spent waste. ChemXpress5(4):115–122
17. Anyaoha KE, Sakrabani R, Patchigolla K, Mouazen AM (2018) Evaluating oil palm fresh fruitbunch processing in Nigeria. Waste Manag Res 36(3):236–246
18. Otsu N (1979) A threshold selection method from gray-level histograms. IEEE Trans Syst ManCybern 9(1):62–66
47
2.14 ARTICLE XIII
The effect of Friction Stir Processing on the tensile behaviour and the corrosion
study of armour grade AA7075 – T651
Accepted for publication in Lecture Notes in Mechanical Engineering – Trends in Manufacturing
and Engineering Management (SPRINGER/Scopus), 2019.
ISSN – 2195-4364
The influence of friction stir processing (FSP) on the corrosion behaviour and the tensile study of
high strength, armour-grade aluminium 7075-T651 alloy were carried out. In this experiment,
unreinforced aluminium alloy 7075-T651 was investigated at the processed stage and at the
unprocessed stage (the base metal). The aim was to study the efficacy and the reaction of the
unprocessed (base metal) and the processed, but not reinforced AA7075-T651, when immersed in
a corrosive medium containing 3.5 % NaCl at ambient temperature, in addition to the tensile
properties and the fracture mechanism.
The FSP was carried out using the following parametric values: travel speed of 20 mm/min, plunge
depth of 0.3, and rotational speed of 1500 rpm, with a tilt angle of 0.3 mm. The potentiodynamic
polarization technique was used for the corrosion examination; while the X-force P-type of
Zwick/Roell Z250 tensile testing machine was employed for the tensile test; and the fractographic
and the corroded samples were taken by SEM for the morphological examination. The X-Ray
Diffraction (XRD) of the base metal was reported. The corrosion results showed that the processed
base metal had a better corrosion rate than the unprocessed metal, with 1.829 mm/year, as against
5.0718 mm/year; while the percentage inhibition efficiency for the processed metal was 63.99 %,

48
with reference to the unprocessed base metal. Overall, the corrosion properties for the processed
metal were vastly improved as against the unprocessed base metal. In contrast, the tensile
properties for the unprocessed base metal were found to be far better than those for the processed
base metal; and this may be attributed to the orientation of the tensile sample cutting across the
processed zone, as against the processed zone. This was also supported by the fractography of the
fractured surfaces, in which the unprocessed base metal had large, stretched and elongated grain,
which announced that the material is ductile; and more so, there was necking observation after the
fracture of the unprocessed base metal.
Nevertheless, the processed base metal also showed enormous network of dimples, which revealed
bimodal distribution in the morphology. This network of many dimples on the morphology of the
fractured surfaces enhanced the excellent interfacial bonding between the metal matrices; while at
the same time, this improved the tensile strength. This accepted journal article has been able to
address some of the objectives of the study especially those in item IV and V.

Effect of Friction Stir Processing on tensile behaviour
and corrosion study of armour grade AA7075 – T651
Ikumapayi, O. M1*, Akinlabi, E. T1,2, Majumdar, J. D3, Fatoba, O.S1
1 Department of Mechanical Engineering Science, University of Johannesburg, Auckland Park
Kingsway Campus, Johannesburg, 2006, South Africa 2Department of Mechanical Engineering, Covenant University, Ota, Nigeria
3Department of Metallurgical and Materials Engineering, Indian Institute of Technology,
Kharagpur, INDIA
Abstract.
Armour grade, high strength aluminium 7075-T651 alloy is one of the prom-
ising heat treatable commercial rolled sheet metals which has gained debut en-
trance into structural applications in defensive areas such as automotive, aircraft,
military, marine, aviation, airframe, jet engine, space and air vehicles due to its
unbeatable and excellent properties such as superior damping capacities, high
formability, low density, high creep resistance, high specific strength, high wear
and high fatigue strength. Nevertheless, the application of aluminium alloy in
marine environments exhibits poor corrosion performance. It is worth mention-
ing that most aluminium alloys cannot be welded by the use of fusion welding
processes as a result of solidification problems and nugget zone in microstructure
hence friction stir processing (FSP) enhances processing of reliable materials
with surface integrity in the solid state. The cutting tool that was used during FSP
was made from AISI H13 Steel with a cylindrical tapered profile having 5 mm
for both pin length and that of pin diameter and 18mm for the shoulder diameter.
The processing parameters are 0.3 mm, 1500 rpm, 3 °, and 20 mm/min for plunge
depth, rotational speed, tool tilt angle and processing speed respectively. Double
passes were employed with 100 % inter-pass overlap. The mechanical study was
carried out on tensile behaviours by the use of Xforce P type of Zwick/Roell Z250
tensile testing machine. Corrosion behaviour of the processed aluminium com-
posites and unprocessed base metal were examined with the use of potentiody-
namic polarization method in a corrosive medium containing 3.5 % NaCl solu-
tion at room temperature.
Keywords: Aluminium alloy, Corrosion inhibition, Friction stir processing,
Tensile Strength

2
1 Introduction
Armour grade, high strength aluminium 7075-T651 alloy are widely used in most of
the defence equipment as structural components especially in military, jet engine, avi-
ation, armoured vehicles- hull-type such as fighter aircraft, ships, space and air vehicle,
as well as armour tanks, this is to resist the impact of shrapnel, bullets, shell as well as
to serve as to safeguard the security personnel inside from being attack by the enemy
fire [1,2]. Similar applications are also manifested in automobile, marine [3] and trans-
portation sectors due to its significant, unbeatable and exceptional structural, chemical
and mechanical behavious such as high specific strength, good corrosion resistance,
low density, high fatigue strength, and superious damping capacities [4], high forma-
bility, high capability of energy absorbing, high wear and creep resistance. These re-
markable properties found in AA7075-T651 have made it be treasured, embraceable
and acceptable universally. It is worth mentioning that, in the olden days armour com-
bat was structurally designed to be tougher and stronger as well as to resist and with-
stand high impact projection but this design made the armour combat heavy. In the
present day, lightweight such as aluminium alloys have been developed to be used in
the fabrication of protective equipment by the researchers to serve the same purpose
and this has tremendously improved fuel utility and economically affordable [5,6] and
as such, it is imperative to verify the efficacy of the corrosion mitigation rate, impact
behaviours and ductility attributes of this Aluminum alloy grades without reinforce-
ment, as well processing and also with processing without reinforcements of the armour
grade Aluminum 7075 alloys.
It has been reported by some scholars that aluminium alloy 7075 in its entity exhib-
ited poor corrosion protection [7,8], by and large, this menace has been curbed and
improved upon by reinforcement and processing techniques. In the recent past, re-
searchers have exploited various means through experimental, analytical, mathemati-
cal, to numerical methods in order to understand the mechanism of tensile and corrosion
behaviours of armour grade aluminium 7075-T651 alloys. The focus of this work is to
make a sound judgement in friction stir processed AA7075-T651 for protective appli-
cations, the areas of concentration will be tensile and corrosion studies of the processed
and unprocessed base metal.
2 Materials and Methods
2.1 Material
In this data Sstudy, the base material used for experimental data acquisition was
Aluminium Alloy AA7075-T651 of dimensions 300 x 125 x 6 mm3 with a chemical
compositions of Al (88.93 %), Zn (5.92 %), Si (0.05 %), Fe (0.15 %), Cu (1.93 %) ,
3
Mn (0.01 %), Cr (0.193 %), Ti (0.02 %) and Mg (2.8 %) and its mechanical properties
as received are shear strength (330 MPa), Brinell Hardness (150), Fatigue strength
(160Mpa), Poisson’s Ratio (0.32), Shear Modulus (26 GPa) while Elastic Modulus,
Ultimate tensile strength (UTS) and Yield Strength are 70 GPa, 570 MPa,and 500 MPa
respectively.
2.2 Friction Stir Processing Procedure
Friction stir processing (FSP) was carried out on a two Ton linear numerical con-
trolled friction stir welding (FSW) machine produced by ETA Bangalore, India Ltd as
shown in Figure 2a, the machine is equipped with a load cell that is responsible to take
forces along the Z direction. The machine has several embedded sensors that are capa-
ble of recording velocities x-axis, z – position, x- position of the tool, and x – load etc.
The machine has a LabView software features capable of acquiring real-time data. The
recorded and stored vertical axis loads were then taken and used for the processing.
During FSP, aluminium 7075-T651 alloy plate is position in such a way that advancing
side (AS) will be positioned along the tool clockwise rotation, that is, the side at which
plasticized material is drawn by the tool shoulder while the retreating side (RS) will be
positioned in reverse side which consolidate the material. The location of advancing
and retreating sides depend upon the direction of the tool rotation and the tool traverse
direction. The tool rotates clock-wisely and also the placement of pressure plate on the
workpiece to enable rigid clamping and at the same time proper and rigorous stirring
for effective mixing of the materials through the tool pin penetration and the interaction
of the shoulder with the workpiece via the tool translational and rotational. A cylindrical
tapered tool made of AISI H13 tool steel of shoulder diameter 18 mm, pin diameter 5
mm and the pin length of 5 mm with 10° taper was used for stirring. In order to ensure
rigorous and extensive mixing of the matrix and the reinforcement particles, the tilt
angle of the tool is position towards trailing direction in such a way to avoid defects on
the fabricated samples and in doing so, the tool shoulder constrain the stirred matrix
composite by a cylindrical tapered pin and dragged the material carefully and effec-
tively from the back to the front of the pin. It is essential to note that, pin depth and tool
shoulder penetration are dictated by the pin length. It worth mentioning that the pro-
cessing parameters used in this study include 20 m/min and 1500 rpm for travel speed
and rotational speed respectively, and also 0.3 mm and 3 ° for tool plunge depth and
tool tilt angle respectively with 2 passes on each process parameters in the same direc-
tion with the tool rotational movement with 100 % inter-pass overlap. The distribution
of the double passes has 0.2 mm tool plunge depth for first pass and that of the second
pass has 0.1 mm tool plunge depth with 100 % inter-pass overlap. A better surface
integrity was achieved on each processed plate due to differentially selected processing
parameters

4
2.3 Electrochemical Test
The corrosion test samples are in the dimensions 24 mm x 10 mm x 6 mm. The
corrosion tests were carried out on the unprocessed base metal (UBM) and processed
base metal (PBM) to establish the efficacy of the FSP. The samples were prepared for
corrosion test in accordance with ASTM-G34 by grinding and polishing them in differ-
ent grades of emery papers varying from 280, 350, 500, and 800 to 1200 grades and
were well rinsed in sufficient distilled water. A corrosive medium containing 3.5 %
NaCl solution to serve as seawater for the test was used.
2.4. Electrochemical Measurement:
The electrochemical behaviours of the friction stir processed base metal AA7075-
T651-p and Unprocessed base metal AA7075-T65-u were examined by using a
computer-based open circuit potential (OCP) and potentiodynamic polarisation meas-
urements which were examined using Autolab PGSTAT 101 Metrohm potentiostat/gal-
vanostat in which NOVA software 2.1.2 version was incorporated and an electrochem-
ical cell which has 3-electrode connections was used and the test was performed at an
ambient temperature of 25°C containing 100 ml of 3.5 % NaCl solution as electrolyte.
The working electrodes (WE) in this study were AA7075-T651-u and AA7075-T651-
p and the counter electrode (CE) which is the auxiliary electrode in the study was graph-
ite and the reference electrode (RE) was potassium chloride electrode (PCE). The po-
tentiodynamic polarization plots were set at a cathodic potential of -1.5 V and anodic
potential of 1.5 V against open circuit potential with 0.005 m/s sweep rate, i.e. scan
rate. The working electrodes were individually immersed in the 3.50 % NaCl medium
of electrolytes while the OCP of each WE were estimated in a span of 10 minutes and
for a steady-state potential to be attained, at the same time potentiodynamic polarisation
values were recorded after the OCP values were taken. To ensure and confirm repro-
ducibility corrosion test was performed three times on each WE. The following data
were extracted from the Tafel curves and recorded, polarization potential (Ecorr), current
density (jcorr), while the percentage inhibition performance efficiency (IPE %) i.e. the
percentage mitigation tendency and the surface courage (Ꝋ) were estimated with equa-
tions 1 to 2 [9–12] on the FSP samples.
𝜃 = 1 − 𝑗𝑐𝑜𝑟𝑟
𝑗0𝑐𝑜𝑟𝑟
1
𝐼𝑃𝐸 % = 1 − 𝑗𝑐𝑜𝑟𝑟
𝑗0𝑐𝑜𝑟𝑟 𝑥 100 2
Where jocorr and jcorr are respectively uninhibited Corrosion current density and in-
hibited corrosion current densities.

5
2.5 Tensile Testing.
A rolled flat tensile test Sample was machined with waterjet cutter to the sub-stand-
ard size of 100 mm long, the thickness of 6 mm and 6mm width in line with ASTM
B557M-10 test standard. The macrographs of the tensile test specimens are depicted in
Figure 1a and also the fractural macrographs is as shown in Figure 1b. The Tensile tests
were carried out on the following on the processed base metal (PBM) and unprocessed
base metal (UBM). The tests were carried out on the Zwick/Roell Z250 (Xforce P-type
) tensile testing machine embedded with testXpert II software for data acquisition with
set-up displayed in Figure 1c having a normal force of 250 kN and characteristic of
2mV/v.
Fig. 1. (a) Tensile fractured samples (b) scheme of how tensile samples were cut (c) tensile test
schematic diagram (d) Set-up of Zwick/Roell Z250 Tensile Tester
The tensile tests were carried out on two different specimens; the friction stir pro-
cessed base metal AA7075-T651-p and unprocessed base metal AA7075-T65-u in trip-
licate for each sample and average score were calculated and recorded. The following
data were measured, and recorded, Young Modulus (ME), the stress at 0.5 % offset
strain (Rp0.5), the stress at 0.2 % offset strain (Rp0.2), as well as the stress at 0.1 % offset
strain (Rp0.1) and likewise, the maximum stress value (Rm) and also stress-strain curves.
b a
c
d

6
3.0. Results and Discussion
3.1 Corrosion Study
Figure 2 reveals the SEM Images of the corroded substrate (unprocessed base metal)
– AA7075-T651 and the corroded nugget zone of friction stir processed- FSPed
AA7075-T651. The processed zone reveals finer grains structure than the unprocessed
base metal which was as a result of plastic deformation of the friction stir processing
on the structure refinement. It was noticed that equiaxed and fine grain structures were
evident in the processed nugget zone and this was developed by combine effects of
frictional temperature and forging action of FSP technique.
Fig. 2. SEM Micrograph for (a) Corroded AA7075-T651 (b) Corroded FSPed AA7075-T651
3.2 Pitting Corrosion
Pit corrosion attack is the type of corrosion that occurs in the presence of aggressive,
vigorous and active chlorine ions [13]. Crack initiation during pitting attacks usually occurs at the weakest sites in the oxides as a result of the violet and effective chlorine attack. Equations 3 -6 presents the chemical equation for the illustration pit propagation
[14,15].
𝐴𝑙 → 𝐴𝑙3 + 3𝑒− 3
𝐴𝑙 + 3𝐻2𝑂 → 𝐴𝑙(𝑂𝐻)3 + 3𝐻+ 4
A B
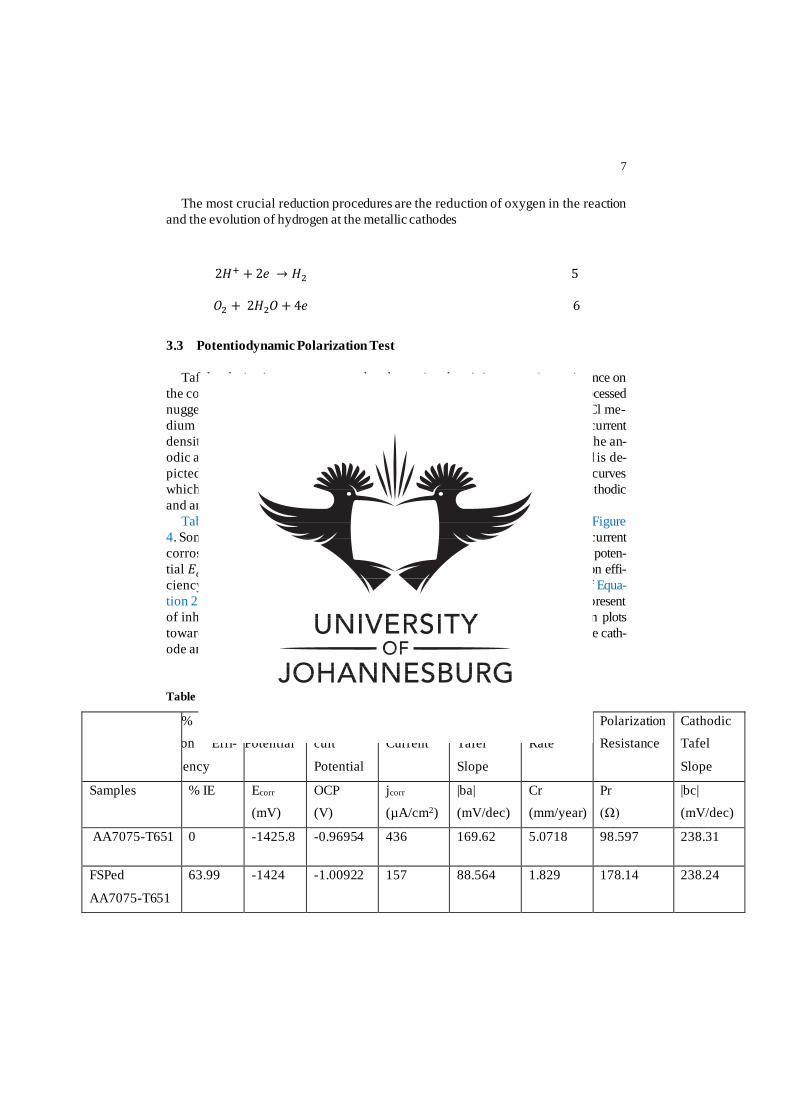
7
The most crucial reduction procedures are the reduction of oxygen in the reaction
and the evolution of hydrogen at the metallic cathodes
2𝐻+ + 2𝑒 → 𝐻2 5
𝑂2 + 2𝐻2𝑂 + 4𝑒 6
3.3 Potentiodynamic Polarization Test
Tafel polarization tests were used to determine the pitting corrosion resistance on
the corroded samples. In order to establish the anodic polarization plots, the processed
nugget zone and unprocessed base metal are exposed separately into 3.5 % NaCl me-
dium which serves as sea water. The 𝑖𝑐𝑜𝑟𝑟 and the 𝐸𝑐𝑜𝑟𝑟 which are corrosion current
density and corrosion potential respectively, and are derived by extrapolating the an-
odic and cathodic Tafel plots when no inhibitor was applied but was processed is de-
picted in Table 1. Similarly, their corresponding open circuit polarization (OCP) curves
which dictates that polarization had occured due to the combined effects of cathodic
and anodic separation as shown in Figure 3.
Table 1 represents corrosion results extrapolated from Tafel plots shown in Figure
4. Some of the data generated from the Tafel curves include corrosion rate (CR), current
corrosion density 𝑖𝑐𝑜𝑟𝑟, polarization resistance (PR), anodic slope 𝑏𝑎, corrosion poten-
tial 𝐸𝑐𝑜𝑟𝑟, and cathodic slope 𝑏𝑐 among others while the percentage inhibition effi-
ciency (PIE %) were computed to determine percentage mitigation by the use of Equa-
tion 2. It was observed that the reduction in corrosion rate was as a result of the present
of inhibitor which cause the movement of the anodic and cathodic polarization plots
towards the end of lower values of current densities by so doing evolution of the cath-
ode and dissolution of anode of aluminium alloy is hindered [11,16,17].
Table 1. Corrosion results before and after FSP for AA7075-T651
% Inhibi-
tion Effi-
ciency
Corrosion
Potential
Open Cir-
cuit
Potential
Corrosion
Current
Anodic
Tafel
Slope
Corrosion
Rate
Polarization
Resistance
Cathodic
Tafel
Slope
Samples % IE Ecorr
(mV)
OCP
(V)
jcorr
(µA/cm2)
|ba|
(mV/dec)
Cr
(mm/year)
Pr
(Ω)
|bc|
(mV/dec)
AA7075-T651 0 -1425.8 -0.96954 436 169.62 5.0718 98.597 238.31
FSPed
AA7075-T651
63.99 -1424 -1.00922 157 88.564 1.829 178.14 238.24

8
3.4 Open Circuit Potential (OCP) Measurement
The OCP graph versus exposure time is depicted in Figure 3 for the processed base
metal –AA7075-T651 and unprocessed base metal – AA7075-T651 in the solution of
3.5 % NaCl at a temperature of 25 °C. The potential in the working electrode (WE)
relative to the electrode in the reference is the OCP whereas there is no potential or
current existing in the cell. The changes in the OCP results in polarization curve was
due to the current flowing across the electrode/electrolyte interface [11,14,17,18]. It
can be deduced from Figure 3 that influence of processing on the base metal has
remarkable impact on the OCP as the curve tends to shift OCP potential towards more
negative direction from -0.96954 V to – 1.00922 V. The value of OCP potential for
processed AA7075-T651 within the first 5s were between -1.058 V and -1.06 V which
later moved the negative value to -1.00922 towards the end of 120s while unprocessed
base metal has OCP potential value within the first 5s were between -1.02 V and -1.028
V which also moved to the more negative value of – 0.96964 V toward the end of 120
s.
Fig. 3. Plots of OCP potential OCP against exposure time Fig. 4. Tafel Potentiodynamic Polarization curves
Equations 1 and 2 were employed to estimate the % IPE, the results from Table 5 show
that 63.99 % was found to be the percentage of inhibition performance efficiency for
processed base metal with reference to the unprocessed base metal. In the same vein,
corrosion resistance rate for processed base metal was measured to be 1.829 mm/year
while its unprocessed counterpart had corrosion resistance rate of 5.0718 mm/year
which in turn gives 178.14 Ω polarization resistance (PR) with respect to processed PR
of 98.597 Ω.

9
3.5 Tensile Test Results for Processed and Unprocessed AA7075-T651.
Table 2 shows the tensile behaviour for the processed and unprocessed aluminium
7075-T651 alloy. It worth mentioning that the tensile strength of the material will dic-
tate the potency and the appropriate engineering materials selection for the application.
In this study the following tensile behaviour parametric properties were measured and
recorded as depicted in Table 2.
Table 2. Tensile test data on the processed and Unprocessed AA7075-T651
Composites
Rm mE Rp0.5 Rp0.1 Fm Rp0.2 Rt0.5 At (corr.)
MPa GPa MPa MPa KN MPa MPa %
AA7075-T651 620.9030 9.38165 588.4694 559.0751 22.35251 572.9528 7.334991 9.732209
FSPed AA7075-T651 362.9048 5.35351 251.8613 213.24 13.06457 228.2679 7.607991 14.30768
From Table 2, the unprocessed base metal of AA7075-T651 has a higher ultimate
tensile strength which is the maximum strength (Rm) than processed base metal of
AA7075-T651 which are 620.9030 MPa and 362.9048 MPa respectively in agreement
with the works of many researchers such as Sharma et al. [19] and Imran et al.[20] as
well as Bayazid et al. [21] and this reduction in tensile behaviors of the processed sam-
ples may be as a result of tensile samples orientation as shown in Figure 1b, If the
tensile samples had been cut along the processed zone rather than across the processed
zone, the tensile properties would have been improved. It worth mentioning here that
the effects of tensile samples orientation will be studied extensively in another article
to establish this assertion. It can also be deduced from Figure 5 that unprocessed base
metal has almost the same elongation with the processed base metal of AA7075-
T651which was seen to be 15.90 % and 16.08 % respectively. The breaking force (Fm)
for unprocessed base metal was recorded to be 22.35 kN while that of processed base
metal was 13.06 kN. This also explained stress at offset strain at 0.1 %, 0.2 % and 0.5
% which are (Rp0.1), (Rp0.2), (Rp0.5) with the values of 213.34 MPa, 228.26 MPa and
251.86 MPa respectively for processed base metal while that of unprocessed base metal
has higher values for (Rp0.1), (Rp0.2), (Rp0.5) which are 559.07 MPa, 572.95 MPa
and 588.46 MPa respectively which were observed to have double the values of pro-
cessed base metal, this might be that plastic deformation that took place in the processed
base metal has induced some defects as well as brittleness which now led to the reduc-
tion in the values of stress at offset strain. It was also observed that modulus of elasticity
(mE) for processed base metal was lower than unprocessed base metal with these given
values 5.35 GPa and 9.38 GPa respectively. The fractograph for unprocessed base metal
and processed base metal are presented in Figure 6.
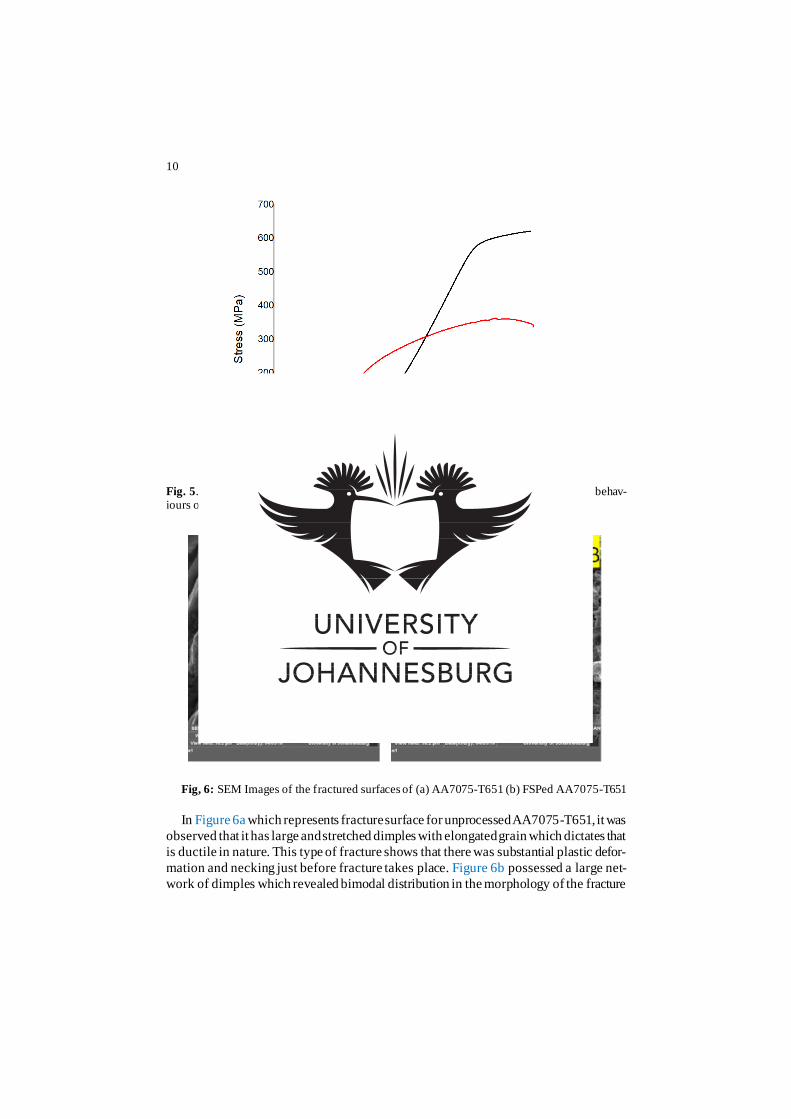
10
Fig. 5. The plot of Stress vs Elongation showing the performance assessment for tensile behav-iours on the AA7075-T651 and FSPed AA7075-T651
Fig, 6: SEM Images of the fractured surfaces of (a) AA7075-T651 (b) FSPed AA7075-T651
In Figure 6a which represents fracture surface for unprocessed AA7075-T651, it was
observed that it has large and stretched dimples with elongated grain which dictates that
is ductile in nature. This type of fracture shows that there was substantial plastic defor-
mation and necking just before fracture takes place. Figure 6b possessed a large net-
work of dimples which revealed bimodal distribution in the morphology of the fracture
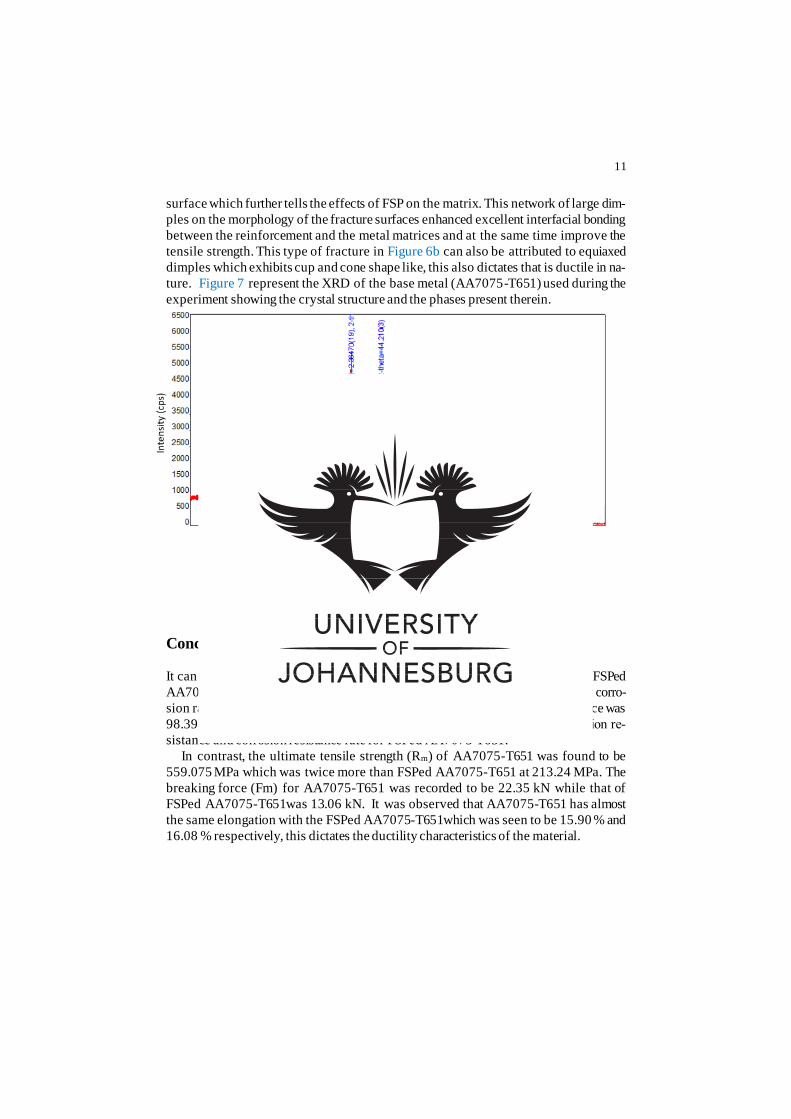
11
surface which further tells the effects of FSP on the matrix. This network of large dim-
ples on the morphology of the fracture surfaces enhanced excellent interfacial bonding
between the reinforcement and the metal matrices and at the same time improve the
tensile strength. This type of fracture in Figure 6b can also be attributed to equiaxed
dimples which exhibits cup and cone shape like, this also dictates that is ductile in na-
ture. Figure 7 represent the XRD of the base metal (AA7075-T651) used during the
experiment showing the crystal structure and the phases present therein.
Fig. 7. XRD of the Aluminium Alloy 7075-T651 used
Conclusion
It can be concluded from the experimental results that the corrosion resistance of FSPed
AA7075-T651 was 63.99 % higher than the AA7075-T651. It was revealed that corro-
sion rate of AA7075-T651 was 5.0718 mm/year when its polarization resistance was
98.397 Ω while 178.14 Ω and 1.829 mm/year are respectively for polarization re-
sistance and corrosion resistance rate for FSPed AA7075-T651.
In contrast, the ultimate tensile strength (Rm) of AA7075-T651 was found to be
559.075 MPa which was twice more than FSPed AA7075-T651 at 213.24 MPa. The
breaking force (Fm) for AA7075-T651 was recorded to be 22.35 kN while that of
FSPed AA7075-T651was 13.06 kN. It was observed that AA7075-T651 has almost
the same elongation with the FSPed AA7075-T651which was seen to be 15.90 % and
16.08 % respectively, this dictates the ductility characteristics of the material.
12
References
[1] Cadoni E, Dotta M, Forni D, Kaufmann H. Tensile Behaviour of Commercial
Aluminium Alloys Used in Armour Applications at High Strain Rate. Procedia Eng
2017;197:168–75. doi:10.1016/j.proeng.2017.08.093.
[2] Ikumapayi OM, Akinlabi ET. Experimental Data on Surface Roughness and Force
Feedback Analysis in Friction Stir Processed AA7075 – T651 Aluminium Metal
Composites. Data Br 2019:https://doi.org/10.1016/j.dib.2019.103710. This.
doi:10.1016/j.dib.2019.103710.
[3] Ikumapayi OM, Okokpujie IP, Afolalu SA, Ajayi OO, Akilabi ET, Bodunde OP. Effects
of Quenchants on Impact Strength of Single-Vee Butt Welded Joint of Mild Steel. IOP
Conf Ser Mater Sci Eng 2018;391:1–10. doi:10.1088/1757-899X/391/1/012007.
[4] Wang K, Liu FC, Xue P, Xiao BL, Ma ZY. Effects of heating rates on microstructure
and superplastic behavior of friction stir processed 7075 aluminum alloy. J Mater Sci
2014;50:1006–15. doi:10.1007/s10853-014-8660-y.
[5] Ikumapayi OM, Akinlabi ET, Majumdar JD. Review on thermal, thermo- mechanical
and thermal stress distribution during friction stir welding. Int J Mech Eng Technol
2018;9:534–48.
[6] Sudhakar I, Madhu V, Madhusudhan Reddy G, Srinivasa Rao K. Enhancement of wear
and ballistic resistance of armour grade AA7075 aluminium alloy using friction stir
processing. Def Technol 2015;11:10–7. doi:10.1016/j.dt.2014.08.003.
[7] Vijaya Kumar P, Madhusudhan Reddy G, Srinivasa Rao K. Microstructure and pitting
corrosion of armor grade AA7075 aluminum alloy friction stir weld nugget zone – Effect
of post weld heat treatment and addition of boron carbide. Def Technol 2015;11:166–
73. doi:10.1016/j.dt.2015.01.002.
[8] Navaneethakrishnan T, Ganesh P. Effect of welding parameters on friction stir welded
dissimilar aluminum alloys 7075 and 6082 with various tool pin profiles. J Chem Pharm
Sci 2015;2015-April:463–8.
[9] Akande IG, Oluwole OO, Fayomi OSI. Optimizing the defensive characteristics of mild
steel via the electrodeposition of Zn–Si3N4 reinforcing particles. Def Technol 2018:1–
7. doi:10.1016/j.dt.2018.11.001.
[10] Fayomi OSI, Akande IG. Corrosion Mitigation of Aluminium in 3 . 65 % NaCl Medium
Using Hexamine. J Bio- Tribo-Corrosion 2019;5:0. doi:10.1007/s40735-018-0214-4.
[11] Fayomi OSI, Popoola IGAAPI. Corrosion Protection Effect of Chitosan on the
Performance Characteristics of A6063 Alloy. J Bio- Tribo-Corrosion 2018;4:1–6.
doi:10.1007/s40735-018-0192-6.
[12] Gerengi H, Solomon MM, Bagci FE, Abai EJ. An evaluation of the anticorrosion e ff
ect of ethylene glycol for AA7075-T6 alloy in 3 . 5 % NaCl solution. Measurement
2018;116:264–72. doi:10.1016/j.measurement.2017.11.030.
[13] Mantha D, Fawaz SA. Standardized Test Method for Corrosion Pit-to-Fatigue Crack
Transition for AA7075-T651 Aluminum Alloy. Adv Mater Res 2014;891–892:205–10.
doi:10.4028/www.scientific.net/AMR.891-892.205.
[14] Raguraman D, Muruganandam D, Dhas LKK. Corrosion study in friction stir welded
plates of AA6061 and AA7075. Int J ChemTech Res 2014;6:2577–82.
[15] Ikumapayi OM, Akinlabi ET. A Comparative Assessment of Tensile Strength and

13
Corrosion Protection in Friction Stir Processed AA7075-T651 Matrix Composites
Using Fly Ashes Nanoparticles as Reinforcement Inhibitors in 3.5 % NaCl. Int J Mech
Prod Eng Res Develeopment 2019;9:839–54. doi:10.24247/ijmperdjun201992.
[16] Liu Y, Janssen JMCMGCAM. Combined Corrosion and Wear of Aluminium Alloy
7075-T6. J Bio- Tribo-Corrosion 2016;2:1–7. doi:10.1007/s40735-016-0042-3.
[17] El ODL, Hamed GO, El SJA. Anticorrosive Formulation Based of the Epoxy Resin –
Polyaminoamide Containing Zinc Phosphate Inhibitive Pigment Applied on Sulfo-
Tartaric Anodized AA 7075-T6 in NaCl Medium. J Bio- Tribo-Corrosion 2019;5:1–9.
doi:10.1007/s40735-019-0218-8.
[18] Zhang C, Huang G, Cao Y, Wu X, Huang X, Liu Q. Optimization of Tensile and
Corrosion Properties of Dissimilar Friction Stir Welded AA2024-7075 Joints. J Mater
Eng Perform 2019;28:183–99. doi:10.1007/s11665-018-3785-9.
[19] Sharma A, Sharma VM, Paul J. Fabrication of bulk aluminum-graphene nanocomposite
through friction stir alloying. J Compos Mater 2019:1–16.
doi:10.1177/0021998319859427.
[20] Imran M, Khan ARA, Megeri S, Sadik S. Study of hardness and tensile strength of
Aluminium-7075 percentage varying reinforced with graphite and bagasse-ash
composites. Resour Technol 2016;2:81–8. doi:10.1016/j.reffit.2016.06.007.
[21] Bayazid SM, Farhangi H, Asgharzadeh H, Radan L, Ghahramani A, Mirhaji A. Effect
of cyclic solution treatment on microstructure and mechanical properties of friction stir
welded 7075 Al alloy. Mater Sci Eng A 2016;649:293–300.
doi:http://dx.doi.org/10.1016/j.msea.2015.10.010.

49
2.15 ARTICLE XIV
The Preparation, Characterization, Image Segmentation and Particle Size
Analysis of Cow-Bone Nano-particles for composite applications
Accepted for publication in Lecture Notes in Mechanical Engineering – Trends in Manufacturing
and Engineering Management (SPRINGER/Scopus), 2019. ISSN – 2195-4364
https://doi.org/10.1007/978-981-15-4745-4_25
This paper dealt with the development of the nano-particles from a cow-bone skull, to be used as
reinforcement particles or powders during friction stir processing. In this paper, cow-bone nano-
particles were analysed by using the MATLAB (R2015a) software for Image processing,
segmentation and thresholding. The main reason for this was to separate the foreground from the
background via thresholding. The cow-bone powder was milled at different milling times of 20,
40 and 60 minutes, this milling times was selected based on the milling disc that were employed
rather than balling milling that takes hours in milling; and it was then subjected to thresholding
and processing. In this study, the scanning electron microscope (SEM) was employed to study the
morphology of the cow-bone powder. Energy Dispersive X-ray (EDX) was used to analyze the
elemental composition; and X-Ray Fluorescence (XRF) was used to acquire the chemical
compositions.
Statistical data were also employed to analyze the particle size. The SEM magnifications were
taken at 1.00 kx, 2.00 kx and 5.00 kx, resulting in 50 µm, 20 µm and 10 µm, respectively. A
mathematical model was formulated for the thresholding. This accepted journal article has been
able to address the objective of the study in item I.

UN
CO
RR
EC
TE
D P
RO
OF
Preparation, Characterization, ImageSegmentation and Particle Size Analysisof Cow Bone Powder for CompositeApplications
O. M. Ikumapayi, E. T. Akinlabi, P. A. Adedeji, and S. A. Akinlabi
Abstract Cow bone is a bio-waste material that has caused environmental unfriend-1
liness to the people living around the place of production and deposition. In recent AQ12
time, researchers have exploited various means of utilizing this bio-waste material3
and make it environmentally friendly and economically utilizable, especially in the4
area of applications, such as activated carbon, water purification, reinforcement in5
composites, filler and additives, and its efficacy has been traced to whether is in6
the form of macro-, micro- and nanoparticles. In this study, cow bone head (skull)7
was collected, washed and cleaned from meats, processed, sun-dried for six weeks,8
and it was then washed again with distilled water to remove impurities and con-9
taminants, then placed inside the oven set at 50 °C to dry for 5 h to remove any10
trace of moisture content and to ensure absolute dryness. It was then milled into11
nanoparticle powder using vibratory disk milling machine and the milling times12
were 0 min which was taken to be 150 µm size, 20, 40 and 60 min. The morpho-13
logical and physiological characterizations were carried out using scanning electron14
microscopy (SEM), energy dispersive X-ray (EDX) as well as X-ray fluorescence15
(XRF). MATLAB (R2015a) was employed for image processing into bimodal with16
foreground and background pixels using thresholding segmentation method. SEM17
images were taken at 1.00 ×, 2.00 × and 5.00 × which resulted to 50 µm, 20 µm18
and 10 µm, respectively. The image segmentation was employed to determine the AQ219
foreground from a background of cow bone powder (CBP) and to enhance high20
resolutions, visual perception as well as to achieve better quality of the final output.21
Keywords Cow bone powder · Image segmentation · Milling time22
O. M. Ikumapayi (B) · E. T. Akinlabi · P. A. AdedejiDepartment of Mechanical Engineering Science, University of Johannesburg, Auckland ParkKingsway Campus, Johannesburg 2006, South Africae-mail: [email protected]
S. A. AkinlabiDepartment of Mechanical and Industrial Engineering, University of Johannesburg, DoornfonteinCampus, Johannesburg 2006, South Africa
E. T. Akinlabi · S. A. AkinlabiDepartment of Mechanical Engineering, Covenant University, Ota, Nigeria
© Springer Nature Singapore Pte Ltd. 2020S. Vijayan et al. (eds.), Trends in Manufacturing and Engineering Management,Lecture Notes in Mechanical Engineering,https://doi.org/10.1007/978-981-15-4745-4_25
1
478564_1_En_25_Chapter TYPESET DISK LE CP Disp.:7/5/2020 Pages: 12 Layout: T1-Standard
Aut
hor
Proo
f
UN
CO
RR
EC
TE
D P
RO
OF
2 O. M. Ikumapayi et al.
1 Introduction23
Cow bone as organic bio-waste materials have been developed into different particles24
sizes from macro, micro as well as to nanoparticles. The development of micropar-25
ticles from cow bones was carried out by first carbonized the cow bones at 750 °C26
using heat treatable furnace in the absence of oxygen and sieved using different mesh27
sizes of 150, 300 and 600 µm and these were then applied to polymer as reinforce-28
ment to form polymatrix composites [1] and it has also been used as reinforcement29
nanoparticle during friction stir welding of metal composites [2], in this study, cow30
bone was milling for 1 h and then carbonized at a temperature of 500 °C inside31
muffle furnace for 2 h and allowed for thermal stability inside the furnace to room32
temperature. It is a known fact that cow bones are waste products and making the33
environment unconducive to live in with the unbearable pollutants. Notwithstand-34
ing, researchers are making every effort to convert this agro-wastes to more useful35
engineering applications, especially for reinforcement purposes. Cow bone being36
natural animal fiber is expected to have good surface compatibility in addition to the37
structural compatibility requirements as biomaterials [3, 4].38
It is essential to determine the particle size distribution as they affect the pow-39
ders dissolution, dispersion and the flow properties. In the recent times, there have40
been tremendous works on the techniques to improve and address the dichotomy41
between the image backgrounds and foreground, especially when the object in a case42
is brighter with much variance [5, 6]. The image segmentation technique requires43
knowledge about difference intensity and object size for successful thresholding. To44
complement other studies, this study uses a sequence of an algorithm written in MAT-45
LAB to estimate the particle size at varying milling time. This is seen as a means of46
automating the process, such that particle size can be determined in real time during47
milling by using optimal imagery of samples. Thresholding becomes a potent tool48
for image segmentation when the variance of the object differs significantly from49
that of the background. This is often the case in SEM images and change monitoring50
applications [7]. The ideal threshold for segmentation is the intersection point of the51
image and its background. This is such that the intersection is far from the class with52
large variance [8].53
2 Materials and Methods54
2.1 Material Collection and Preparation of Cow Bone55
Nanoparticle56
The skulls of the cow (cow head bone) were collected from the abattoir in the city of57
Johannesburg, South Africa as shown in Fig. 1a. It was then washed with de-ionized58
water, cleaned from meat and then sun-dried for about six weeks to allow for absolute59
dryness as shown in Fig. 1b. After 6 weeks in the sun, it was then washed again with60
478564_1_En_25_Chapter TYPESET DISK LE CP Disp.:7/5/2020 Pages: 12 Layout: T1-Standard
Aut
hor
Proo
f

UN
CO
RR
EC
TE
D P
RO
OF
Preparation, Characterization, Image Segmentation and Particle … 3
Fig. 1 a Fresh cow skull bone obtained, b dried cow bone and c cow bone powder (CBP) in a150 µm ASTM standard sieve
de-ionized water to remove any impurities and contaminations that may be present.61
In order to ensure total dryness before crushing, it was dried again inside the electric62
oven set 50 °C to dry for 5 h for 7 days to ensure absolute dryness of moisture63
contents, this was further cleaned with acetone before crushing and pulverizing and64
sieved into 150 µm size using ASTM meshes standard range by employed KingTest65
Sieve, after which it was further milled with digital vibratory disk milling machine66
(VDMM) for 60 min before utilization as shown in Fig. 1c. The flowchart of the67
study is presented in Fig. 1.68
2.2 Characterizations of Cow Bone Powder69
The following characterizations were carried out on the cow bone powder scanning70
electron micoscopic (SEM), eergy dispersive X-ray (EDX) and X-ray fluorescence71
(XRF) to determine the elemental and chemical compositions as well as morphology72
of the powder (Fig. 2).73
2.2.1 X-Ray Fluorescence (XRF) Spectroscopic Analysis of Cow Bone74
Powder75
X-Ray fluorescence (XRF) spectroscopic analysis of cow bone powder (CBP) was76
carried out using PHILIP PW1404 XRF wavelength disperse spectrometer and it77
was revealed that CBP contains the following chemical composition 45.06% (CaO),78
34.60% (P2O5), 0.065% (MgO), 0.25% (Fe2O3), 0.17% (Na2O), 0.16% (Al2O3),79
0.08% (Al2O3), 0.12% (K2O), 0.06% (TiO2), 0.02 (ZnO), 0.01% (MnO) and 16.28%80
(LOI).81
478564_1_En_25_Chapter TYPESET DISK LE CP Disp.:7/5/2020 Pages: 12 Layout: T1-Standard
Aut
hor
Proo
f

UN
CO
RR
EC
TE
D P
RO
OF
4 O. M. Ikumapayi et al.
Fig. 2 Process flowchart of the study
2.2.2 Scanning Electron Microscopic (SEM) Analysis of Cow Bone82
Powder83
Morphological and elemental characteristics of developed cow bone powder (CBP)84
were carried out using TESCAN model, type VEGA 3 LMH, scanning electron85
microscope (SEM) machine which was integrated with energy dispersive X-ray86
spectrometer (EDXS), this responsible for elemental composition analysis present in87
CBP. To ensure high conductivity and better resolution of the test samples (CBP), the88
sample was first sputter coated with a thin layer of carbon before the test and the test89
was conducted [9, 10] with the following parametric machine values, beam intensity90
of 12, accelerating voltage of 20 kV and a working distance of 15. SEM images91
were taken at 1.00 kx, 2.00 kx and 5.00 kx leading to 50 µm, 20 µm and 10 µm,92
respectively, for different milling times of 0 min, 20 min, 40 min and 60 min. The93
478564_1_En_25_Chapter TYPESET DISK LE CP Disp.:7/5/2020 Pages: 12 Layout: T1-Standard
Aut
hor
Proo
f

UN
CO
RR
EC
TE
D P
RO
OF
Preparation, Characterization, Image Segmentation and Particle … 5
SEM images at varying magnifications and milling time with respect to SEM image94
segmentation are shown in Fig. 3 while the elemental compositions are showed in95
Table 1.96
a : Micrographs at 50μm of 0 min milled
b : Micrographs at 50 μm of 20 mins milled
c: Micrographs at 50μm of 40 mins milled
d : Micrographs at 50μm of 60 mins milled
Original and Segmented SEM Images at 2000 MAG
Original and Segmented SEM Images at 1000 MAG
e: Micrographs at 20 μm of 0 min milled
f : Micrographs at 20 μm of 20 mins milled
g : Micrographs at 20 μm of 40 mins milled
h : Micrographs at 20 μm of 60 mins milled
Fig. 3 SEM images and their segmentations for cow bone powder at varying magnification of 1.00,2.00 and 5.00 kx at different milling time of 0, 20, 40 and 60 min
478564_1_En_25_Chapter TYPESET DISK LE CP Disp.:7/5/2020 Pages: 12 Layout: T1-Standard
Aut
hor
Proo
f
UN
CO
RR
EC
TE
D P
RO
OF
6 O. M. Ikumapayi et al.
Original and Segmented SEM Images at 5000 MAG
i: Micrographs at 10 µm of 0 min
j: Micrographs at 10 µm of 20
k: Micrographs at 10 µm of 40 mins
l: Micrographs at 10 µm of 60 mins
milled mins milled milled milled
Fig. 3 (continued)
Table 1 Elemental compositions of CBP at varying milling time as analyzed by EDXS
Powder Element Elemental composition at different milling times
0 min 20 min 40 min 60 min
CBP C 46.3 45.6 53.9 40.8
O 27.2 30.7 30.0 32.1
Ca 18.3 16.2 10.7 18.3
P 7.5 6.8 4.8 8.0
Mg 0.3 0.5 0.2 0.4
Note 0 min was taken at mesh size of 150 µm
3 Methodology97
3.1 Method of Calcination of Cow Bone Powder98
for Composites Application99
Calcination process is simply mean the method of heating a substance with a con-100
trolled temperature and controlled environment [11], i.e., thermal treatment process101
of material in the absence or limited supply of air in order to induce thermal stability,102
phase transition, thermal decomposition as well as removal of a volatile fraction from103
the material before using [12]. This is done to improve the strength, texture, thermal104
stability, etc. The milled cow powder cannot be applied directly as reinforcement to105
the workpiece that will be processed. If applied without any carbonization process,106
it will react with the metal and form slag within the processed metal as a result of a107
478564_1_En_25_Chapter TYPESET DISK LE CP Disp.:7/5/2020 Pages: 12 Layout: T1-Standard
Aut
hor
Proo
f

UN
CO
RR
EC
TE
D P
RO
OF
Preparation, Characterization, Image Segmentation and Particle … 7
thermal generation that could lead to combustion of the particles, thereby leading to108
internal and surface defects. On this note, the processed powder was first undergone109
calcination process to ensure thermal stability. The calcination of the powder was car-110
ried out by putting each of CBP in pure graphite crucible and then put them carefully111
inside the muffle furnace set at 500 °C for two (2) hours, after the 2 h, the furnace112
was put off and the carbonaceous powder was allowed to cool to room temperature113
inside the furnace before it was then brought out for use, and then further grinded was114
performed on cow bone powder to ensure smoothness of the carbonaceous powder115
before use.116
3.2 Image Segmentation and Thresholding117
Distinguishing foreground pixels from the background pixels has been used to118
enhance visual perception of images [13–15]. One of the common techniques used119
to identify morphological maps [16] and image color intensity and is the threshold120
segmentation. The technique offers a simplicity in calculation and speed in operation121
[17]. Threshold segmentation recognizes image patterns aiming toward enhancing122
final image quality and resolutions [18]. This method does not perform well in cases123
where there is overlap in the grayscale value of the image [19, 20]. In this study, the124
SEM images, which are grayscale, were converted into binary images thus reducing125
data complexity.126
Otsu’s method [21], a nonparametric and an unsupervised thresholding technique,127
was used for image thresholding. The technique selects optimum thresholds by max-128
imizing the intraclass variance of binary images. In this study, we assume that the129
SEM images are bimodal with foreground and background pixels.130
Selecting from a set of local thresholds t1, t2, t3, . . . tn , the thresholds subdivide131
the images into n + 1 classes of C1, C2, C3, . . . Cn . This is achieved by maximizing132
the objective function of a sum of all threshold variances [6];133
J1(t1, t2, t3, . . . tn) = σ 20 + σ 2
1 + σ 22 + σ 2
3 + · · · σ 2n (1)134135
where136
σ 20 = ω0(μ0 − μT )2, ω0 =
t1−1∑
i=0
pi , μ0 =t1−1∑
i=0
i pi
ω0. (2)137138
σ 21 = ω1(μ1 − μT )2, ω1 =
t2−1∑
i=t1
pi , μ1 =t2−1∑
i=t1
i pi
ω1. (3)139140
σ 22 = ω2(μ2 − μT )2, ω2 =
t3−1∑
i=t2
pi , μ2 =t3−1∑
i=t2
i pi
ω2(4)141142
478564_1_En_25_Chapter TYPESET DISK LE CP Disp.:7/5/2020 Pages: 12 Layout: T1-Standard
Aut
hor
Proo
f

UN
CO
RR
EC
TE
D P
RO
OF
8 O. M. Ikumapayi et al.
σ 23 = ω3(μ3 − μT )2, ω3 =
t4−1∑
i=t3
pi , μ3 =t4−1∑
i=t3
i pi
ω3(5)143144
σ 2n = ωn(μn − μT )2, ωn =
tn+1−1∑
i=tn
pi , μn =tn+1−1∑
i=tn
i pi
ωn(6)145146
and σ 20 , σ 2
1 , σ 22 , σ 2
3 , . . . σ 2n . are the class variances, ω0, ω1, ω2, ω3, . . . ωn represents147
the class probabilities, μ0, μ1, μ2, μ3, . . . μn represents the mean values of the148
segmented classes. The intensity of the whole image is149
μT ⊆ μT = ω0μ0 + ω1μ1 + ω2μ2 + ω3μ3 + . . . + ωmμmω0150
+ ω1 + ω2 + ω3 + ωn = 1.151152
The segmentation process was performed at different milling times and at different153
magnifications. A script for this was computed using MATLAB (R2015a) installed154
on a desktop computer workstation with configuration 64 bits, 32 GB RAM Intel (R)155
Core (TM) i7 5960X. The mean particle sizes were obtained at different milling time156
and different magnifications. A two-way analysis of variance was performed on the157
result to determine whether there is a statistically significant difference between the158
mean particle sizes across varying milling time and the across the magnifications.159
3.3 Results and Discussion160
Table 1 and Fig. 4 showed the variability in elemental compositions of cow bone161
powder as analyzed by EDXS. It was revealed that the following elements are present,162
calcium (Ca), carbon (c), phosphorous (P), oxygen (O) and little traces of magnesium163
(Mg). It can be observed that there is variation in composition of the elements as the164
milling progresses. The elemental composition varied along with the milling time165
from 0–60 min and this was also in agreement with the work carried out Omah et al.166
[1].167
The mean particle sizes at each milling time and each magnification are as pre-168
sented in Table 2. It is expedient to statistically establish whether the difference169
between the mean particle sizes at each milling time and magnification are sta-170
tistically significant. To establish this, an analysis of variance was performed and171
presented in Table 3.172
From Table 3, at a confidence interval of 0.05, the difference between the mean173
particle sizes obtained at different milling times is statistically significant. Similarly,174
the mean particle sizes obtained at different magnifications are statistically signif-175
icant. However, the degree of significance in milling time is not as obvious as that176
from varying magnifications.177
478564_1_En_25_Chapter TYPESET DISK LE CP Disp.:7/5/2020 Pages: 12 Layout: T1-Standard
Aut
hor
Proo
f
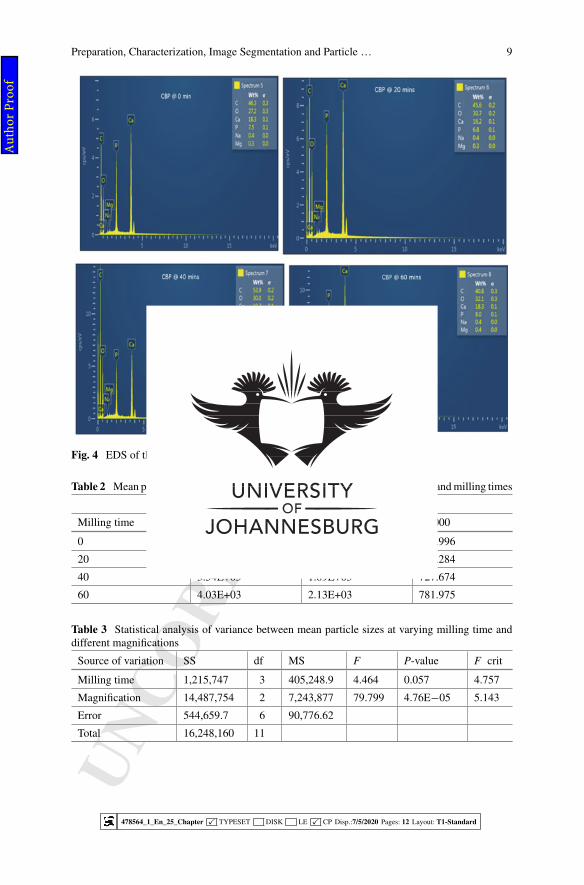
UN
CO
RR
EC
TE
D P
RO
OF
Preparation, Characterization, Image Segmentation and Particle … 9
Fig. 4 EDS of the cow bone powder at varying milling time
Table 2 Mean particle size of segmented SEM images at different magnifications and milling times
Magnification
Milling time ×1000 ×2000 ×5000
0 2.70E+03 1.06E+03 507.996
20 2.98E+03 1.87E+03 526.284
40 3.54E+03 1.89E+03 727.674
60 4.03E+03 2.13E+03 781.975
Table 3 Statistical analysis of variance between mean particle sizes at varying milling time anddifferent magnifications
Source of variation SS df MS F P-value F crit
Milling time 1,215,747 3 405,248.9 4.464 0.057 4.757
Magnification 14,487,754 2 7,243,877 79.799 4.76E−05 5.143
Error 544,659.7 6 90,776.62
Total 16,248,160 11
478564_1_En_25_Chapter TYPESET DISK LE CP Disp.:7/5/2020 Pages: 12 Layout: T1-Standard
Aut
hor
Proo
f

UN
CO
RR
EC
TE
D P
RO
OF
10 O. M. Ikumapayi et al.
It can be inferred that the increasing the milling time of cow bone depending on178
the use, significantly affect its particle size. Particle sizes at different magnification179
are bound to vary due to change in image resolution.180
4 Conclusion181
The method used in this work permitted the manipulations of micrographs in order182
to have a true representation of the powder distribution and at the same time dis-183
tinguishing foreground from background. Image processing analysis was investi-184
gated in this research through thresholding segmentation at varying milling times185
(t = 0, 20, 40, 60 min). It was revealed in the study that progressive milling leads186
to increase in particle size distributions and decrease in the area of particle size as187
noted in Table 2. It was revealed by EDX analysis that the main constituents of cow188
bone powder are calcium, oxygen, magnesium, carbon and phosphorous.189
References190
1. Omah AD, Okorie BA, Omah EC, Ezema IC, Aigbodion VS (2017) Measurement of dielectric191
properties of polymer matrix composites developed from cow bone powder. Int J Adv Manuf192
Technol 88:325–335. https://doi.org/10.1007/s00170-016-8759-1193
2. Ikumapayi OM, Akinlabi ET (2019) Experimental data on surface roughness and force feed-194
back analysis in friction stir processed AA7075-T651 aluminium metal composites. Data Br195
23:103710. https://doi.org/10.1016/j.dib.2019.103710196
3. Ahmad M, Lee SS, Lim JE, Lee SE, Cho JS, Moon DH et al (2014) Speciation and phy-197
toavailability of lead and antimony in a small arms range soil amended with mussel shell, cow198
bone and biochar: EXAFS spectroscopy and chemical extractions. Chemosphere 95:433–441.199
https://doi.org/10.1016/j.chemosphere.2013.09.077200
4. Aramide FO, Ibitoye SA, Oladele IO, Borode JO (2010) Pack carburization of mild steel,201
using pulverized bone as carburizer: Optimizing process parameters. Leonardo Electron J202
Pract Technol 9:1–12203
5. Elbayoumi Harb SM, Isa NAM, Salamah SA (2015) Improved image magnification algo-204
rithm based on Otsu thresholding. Comput Electr Eng 46:338–355. https://doi.org/10.1016/j.205
compeleceng.2015.03.025206
6. Khairuzzaman AKM, Chaudhury S (2017) Multilevel thresholding using grey wolf opti-207
mizer for image segmentation. Expert Syst Appl 86:64–76. https://doi.org/10.1016/j.eswa.208
2017.04.029209
7. Hu QM, Hou ZJ, Wieslaw LN (2006) Supervised range-constrained thresholding. IEEE Trans210
Image Process 15:228–240211
8. Xu X, Xu S, Jin L, Song E (2011) Characteristic analysis of Otsu threshold and its applications.212
Pattern Recognit Lett 32:956–961. https://doi.org/10.1016/j.patrec.2011.01.021213
9. Abdulrahman A, Latiff AAA, Daud Z, Ridzuan MB, Jagaba AH (2016) Preparation and char-214
acterization of activated cow bone powder for the adsorption of cadmium from palm oil mill215
effluent. IOP Conf Ser Mater Sci Eng 136:1–11. https://doi.org/10.1088/1757-899X/136/1/216
012045217
10. Adewole T (2015) Effect of cow bone ash particle size distribution on the mechanical properties218
of cow bone ash-reinforced polyester composites. Chem Mater Res 7:40–47219
478564_1_En_25_Chapter TYPESET DISK LE CP Disp.:7/5/2020 Pages: 12 Layout: T1-Standard
Aut
hor
Proo
f

UN
CO
RR
EC
TE
D P
RO
OF
Preparation, Characterization, Image Segmentation and Particle … 11
11. Mohammed A, Aboje AA, Auta M, Jibril M (2012) A comparative analysis and characterization220
of animal bones as adsorbent. Pelagia Res Libr Adv Appl Sci Res 3:3089–3096221
12. Ihom PA (2013) Case hardening of mild steel using cowbone as Energiser. Afr J Eng Res222
1:97–101223
13. Zhu S, Xia X, Zhang Q, Belloulata K (2007) An image segmentation algorithm in image224
processing based on threshold segmentation. Third Int IEEE Conf Signal-Image Technol225
Internet-Based Syst 2007:673–678. https://doi.org/10.1109/SITIS.2007.116226
14. Kuruvilla J, Sukumaran D, Sankar A, Joy SP (2016) A review on image processing and227
image segmentation. Int Conf Data Min Adv Comput 2016:198–203. https://doi.org/10.1109/228
SAPIENCE.2016.7684170229
15. Ikumapayi OM, Akinlabi ET (2019) Image processing and particle size analysis of coconut230
shell. Int J Civ Eng Technol 10:2475–2482231
16. Rohilla L, Garg V, Mallick SS, Setia G (2018) An experimental investigation on the effect of232
particle size into the flowability of fly ash. Powder Technol 330:164–173. https://doi.org/10.233
1016/j.powtec.2018.02.013234
17. Zaitoun NM, Aqel MJ (2015) Survey on image segmentation techniques. Procedia Comput Sci235
65:797–806. https://doi.org/10.1016/j.procs.2015.09.027236
18. Aly A, Deris S, Zaki N (2011) Research review for digital image Segmentation techniques. Int237
J Comput Sci 3:99–106. https://doi.org/10.5121/ijcsit.2011.3509238
19. Kaur D, Kaur Y (2014) Various image segmentation techniques: a review. Int J Comput Sci239
Mob Comput 3:809–814240
20. Kaur A (2012) A review paper on image segmentation and its various techniques in image241
processing. Int J Sci Res 3:2319–7064 ISSN (Online Impact Factor)242
21. Otsu N (1979) A threshold selection method from gray-level histograms. IEEE Trans Syst Man243
Cybern 9:62–66. https://doi.org/10.1109/TSMC.1979.4310076244
478564_1_En_25_Chapter TYPESET DISK LE CP Disp.:7/5/2020 Pages: 12 Layout: T1-Standard
Aut
hor
Proo
f

50
2.16 ARTICLE XV
Corrosion Study and Quantitative Measurement of Crystallite Size of High-
Strength Aluminium Hybrid Composites developed via Friction Stir Processing
Published in Material Science and Engineering Technology (Materialwissenschaft Und
Werkstofftechnik). Vol 51, issue 6, page 732-739. https://doi.org/10.1002/mawe.202000003,
ISSN: 1521-4052
In this article, the corrosion study and the crystallite size evaluation of friction stir processed
aluminium alloy 7075-T651/CSA/Ti-alloy hybrid composite was investigated. In this study,
calcined coconut-shell ash was put inside a graphite crucible; and it was heat-treated for two hours
at about 500 °C inside the muffle furnace; and it was then allowed to cool to room temperature
within the furnace. The resulting ash was reground for smoothness; and it was then added in the
ratio 50:50 to α+ꞵ titanium alloy powder.
The following processing parameters were used during the Friction stir processing operations; the
tilt angle and the plunge depth of 3° and 0.3mm, respectively were used; while 1500 rpm and 20
mm/min, respectively were used for the rotational and the travel speeds. The corrosion study was
conducted by using the Potentiodynamic Polarization technique in 3.5 % NaCl solution, while the
crystalline phases were examined through X-Ray Diffraction (XRD). It was revealed from the
results that hybridized AA7075-T651/CSA/Ti-alloy gave 84.81% inhibition performance
efficiency, as against 63.99 % for the FSPed AA7075-T651 without any reinforcement. The
corrosion rate for hybridized AA7075-T651/CSA/Ti-alloy was found to be 0.76938 mm/year, as
against 1.829 mm/year and 5.0718 mm/year for FSPed AA7075-T651, and the base metal –
AA7075-T651 respectively.

51
It was further observed that the hybridized AA7075-T651/CSA/Ti-alloy produced the best
structural integrity, generating 38.5 nm crystallite size, as against the FSPed AA7075-T651 with
41.2 nm, and the base metal with 48.7 nm crystallite size. This journal article in press has been
able to address some of the objectives of the study especially those in item I to IV.
1
2
3
4
5
6
7
8
9
10
11
12
13
14
15
16
17
18
19
20
21
22
23
24
25
26
27
28
29
30
31
32
33
34
35
36
37
38
39
40
41
42
43
44
45
46
47
48
49
50
Corrosion study and quantitative measurement ofcrystallite size of high strength aluminum hybridcomposite developed via friction stir processing
Korrosionsuntersuchung und quantitative Messung derKristallitgröße von rührreibgeschweißten, hochfestenAluminiumhybrid-Verbundwerkstoffen
O.M. Ikumapayi1, E.T. Akinlabi1, J.D. Majumdar2, O.S.I. Fayomi3, S.A. Akinlabi4
This present study is centered on the corrosion behaviors and structural integrityof high strength aluminum-alloy 7075-T651 hybridized with carbonaceous coconutshell ash (CSA) and α+β titanium alloy powder in ratio of 50 :50, fabricated duringfriction stir processing (FSP). The study examined the base metal – AA7075-T651as well as the friction stir processed AA7075-T651 as control experiments. TheProcessing parameters used were plunge depth of 0.3 mm, travel speed of20 mm/min, the tilt angle of 3° and rotational speed of 1500 min 1. The corrosioncharacteristics were examined with the Potentiodynamic Polarization method in3.5 % NaCl medium while crystalline phases were studied with x-ray diffraction(XRD). Results show that fabricated aluminum hybrid composite (AHC) AA7075-T651/coconut shell ash (CSA)/titanium-alloy has the highest percentage of in-hibition performance efficiency (IPE) of 84.81 % resulting to 0.76938 mm/year cor-rosion rate and 356.51 Ω polarization resistance, whereas inhibition performanceefficiency (IPE) for friction stir processed (FSPed) AA7075-T651 was 63.99 %while the base metal – AA7075-T651 was taken as the reference point. It was alsorevealed that the hybridized coconut shell ash (CSA)/titanium-alloy powder onAA7075-T651 enhanced the structural integrity, producing 38.5 nm crystallite sizeover friction stir processing (FSP) AA7075-T651 with 41.2 nm and the base metalwith 48.7 nm crystallite size.
Keywords: Aluminum-alloy / corrosion / crystalline phase / hybrid composite / frictionstir processing
Schlüsselwörter: Aluminiumlegierung / Korrosion / kristalline Phase / Hybrid-Verbundwerkstoff / Rührreibschweißen
1 Department of Mechanical Engineering Science,University of Johannesburg, Auckland Park Kings-way Campus, JOHANNESBURG, 2006, REPUBLICOF SOUTH AFRICA
2 Department of Metallurgical and Materials Enginee-ring, Indian Institute of Technology, KHARAGPUR,REPUBLIC OF INDIA
3 Department of Mechanical Engineering, CovenantUniversity, OTA, FEDERAL REPUBLIC OF NIGE-RIA
4 Department of Mechanical Engineering, Faculty ofEngineering and Technology, Butterworth Campus,Walter Sisulu University, MTHATHA, REPUBLIC OFSOUTH AFRICA
Corresponding author: O.M. Ikumapayi, Department ofMechanical Engineering Science, University of Jo-hannesburg, Auckland Park Kingsway Campus, JO-HANNESBURG, 2006, REPUBLIC OF SOUTHAFRICA,E-Mail: [email protected]
Materialwiss. Werkstofftech. 2020, 51, 732–739 DOI 10.1002/mawe.202000003732
© 2020 WILEY-VCH Verlag GmbH & CO. KGaA, Weinheim www.wiley-vch.de/home/muw
Wiley VCH Freitag, 05.06.2020
2006 / 166992 [S. 732/739] 1

1
2
3
4
5
6
7
8
9
10
11
12
13
14
15
16
17
18
19
20
21
22
23
24
25
26
27
28
29
30
31
32
33
34
35
36
37
38
39
40
41
42
43
44
45
46
47
48
49
50
1 Introduction
Aluminum matrix hybrid composites (AMHC) arekinds of metal composite materials that have beenused extensively in the area of defence, automobile,space and air vehicles, construction, transportation,marine, nuclear, aerospace, aviation, ballistic in-dustries, as well as essential materials in modernand advanced processing, manufacturing and en-gineering systems owing to its excellent and uniqueintegration of composite properties such as remark-able formability properties, good tribological (wearad corrosion) integrity, low coefficient of thermalexpansion, high thermal and electrical conductivity,high strength-to-weight ratio, high fatigue strength,high plastic flow strength, excellent damping ca-pacities, high specific stiffness and strength, and alot more which propel its wide utilization in theaforementioned industries[1–4].
Friction stir processing (FSP) has been knownas an excellent surface modifier that was carved outfrom friction stir welding (FSW) which entered intothe manufacturing world in 1991 and was patentedby the welding institute (TWI) of United Kingdom(UK) as a solid-state joining technique which hasreceived tremendous attentions to fabricate metalmatrix composites (MMCs) in recent years [5–7].In friction stir processing, a groove (microchannel)that will enclose the second phase (reinforcementparticles) may or may not be created on the sub-strate and a non-consumable processing tool with adefine shoulder tool profile mostly cylindrical andan exclusively designed pin or probe profile whichis rotated and plunged into base metal (BM) andtravelled on the substrate (workpiece) surface in theprocessing direction [8–9]. The processing tool hasbeen known for two fundamental functions: (a)heating and (b) deformation of workpiece material[10]. The processing tool was designed for stirringand mixing of matrix-based metal with the re-inforcement materials, which is the second phase toform a matrix composite. The friction stir process-ing is a thermomechanical process that involves theinteractions (rubbing action) of the tool shoulderand the substrate which produces high heat as a re-sult of friction between them leading to the soften-ing of the material under the shoulder due to severeplastic deformation during tool rotating action andstirring process leading to the production of metalmatrix composites [11–12]. It has been established
that friction stir processing produces short-route,homogeneity, and refined microstructures as wellas densification. Studies have shown that mechan-ical and metallurgical properties of the processedzone can be controlled via the optimization of toolgeometry such as shoulder diameter, probe length,probe profile, groove dimensions (width anddepth), and processing parameters such as rota-tional speed, travel speed, plunge rate, heat input,and cooling/heating methods [13–14].
2 Materials and methods
The base metal that was used in this study was alu-minum-alloy 7075-T651. The plate of the metal hy-brid material was supplied in a dimension of500 mm×600 mm×6 mm by bharat aerospace met-als, Mumbai, India, which was later sectioned to300 mm×125 mm×6 mm. This sectioned di-mension was then used for the friction stir process-ing having the following chemical compositionszinc (5.92 %), magnesium (2.8 %), silicon(0.05 %), copper (1.93 %), iron (0.15 %), chro-mium (0.193 %), titanium (0.02 %), manganese(0.01 %) and aluminum (88.93 %) while its me-chanical properties, in as received form are Pois-son’s ratio (0.32), Brinell hardness (150), shearstrength (330 MPa), and fatigue strength(160 MPa), and its elastic modulus, ultimate tensilestrength (UTS) and yield strength are 70 GPa,570 MPa, and 500 MPa respectively while shearmodulus is (26 GPa) [15]. The base material wasreinforced with two different metallic micro-par-ticles which are calcined coconut shell ash powderand α+β titanium alloy powder (Ti-6Al-2Sn-2Zr-2Mo-2Cr-0.25Si which will be called titanium-al-loy in this paper). The microchannel (grooves) of2 mm width, 280 mm length and 3.5 mm depthwere created using milling machine in order to ac-commodate the reinforcement phases (hybridizedcarbonaceous coconut shell ash and α+β titaniumalloy powder used during friction stir processing.The reinforcements (coconut shell ash titanium-al-loy) were compacted into the microchannel(groove) in ratio of 50 :50 measurement for hybridcomposites.
The friction stir processing was carried out onthe two-ton numerical controlled friction stir weld-ing machine manufactured by ETA Banglore, India
High strength aluminum hybrid composite developed via friction stir processingMaterialwiss. Werkstofftech. 2020, 51, 732–739 733
© 2020 WILEY-VCH Verlag GmbH & CO. KGaA, Weinheim www.wiley-vch.de/home/muw
Wiley VCH Freitag, 05.06.2020
2006 / 166992 [S. 733/739] 1

1
2
3
4
5
6
7
8
9
10
11
12
13
14
15
16
17
18
19
20
21
22
23
24
25
26
27
28
29
30
31
32
33
34
35
36
37
38
39
40
41
42
43
44
45
46
47
48
49
50
Ltd. There are two kinds of processing tools usedduring the fabrication of AA7075-T651/coconutshell ash Ti-alloy conducted by friction stir proc-essing, and hot-working steel tool made up of AISIH13 was employed. The first tool was made withprobeless with shoulder diameter of 18 mm, thistool was first employed to compact the particles ofthe hybridized coconut shell ash Ti-alloy into thegroove created, which was used on the rotationalspeed of 1000 min 1 and processing speed of100 mm/min. The second tool used was made up ofcylindrical tapered tool with a shoulder diameter of18 mm and a pin profile dimension of 5 mm pinlength and 5 mm pin diameter. This second proc-essing tool was used for stirring and mixing of ma-trix base metal with the reinforcement materialswhich is the second phase to form matrix compo-site. This was achieved at processing parameters of1500 min 1 and 20 mm/min respectively for rota-tional and processing speeds. The processing wascarried out with two passes and 100 % inter-passoverlap was observed. It is essential to mention that0.3 mm plunge depth and 30 mm/min plunge ratewere used on the processing plates and 3° tilt anglewas used on the machine.
3 Results and discussion
3.1 Characterizations of reinforcement powdersused
The morphological and elemental attributes of thetitanium alloy powder used which was purchased inof 45 μm–90 μm average sizes from TLS TechnikGmbH & Co was carried out using TESCANVEGA 3 LMH scanning electron microscopy thatis equipped with energy dispersive x-ray spec-trometer (EDXS) operated by Oxford softwarewhile the developed coconut shell ash was alsocharacterized after milling into near nano-particles[16]. The scanning electron microscopy imageswith an accelerating voltage of 20 kV, a beam in-tensity of 10 and a working distance of 15.01 mmto 16.22 mm between the specimen and the detectorwere used. The scanning electron microscopy im-ages and their corresponding energy dispersive x-ray spectrometer for both organic and inorganicpowders used were captured with the aid of scan-ning electron microscope, Figure 1.
3.2 Corrosion study
Corrosion studies were carried out using potentio-dynamic polarization measurements and open cir-cuit potential on the 24 mm×10 mm×6 mm sizesof base metal – AA7075-T651, friction stir proc-essed (FSPed) AA7075-T651 and hybridizedAA7075-T651/coconut shell ash titanium-alloy.The corrosion tests were conducted on the AutoLabPGSTAT 101 Metrohm potentiostat/galvanostatwith embedded 2.1.2 version of NOVA software.The corrosion samples were prepared according toASTM-G5-14 and the surface of each sample wascleaned with emery papers of different grades tosmoothen the surface and to remove any impuritiesthat may alter the final results which were thenrinsed with abundant distilled water. A corrosivetest medium was prepared with 35 g of NaCl andone liter of distilled water which resulted in a 3.5 %NaCl solution after complete dissolution was ach-ieved. Three electrode connections were made onthe electrochemical cell circuit, 1): the referenceelectrode (RE) which contains potassium chlorideelectrode (PCE), 2): the working electrodes (WE)which are the test materials, which in this case,they are friction stir processed AA7075-T651/coco-nut shell ash titanium-alloy, AA7075-T651, andfriction stir processed AA7075-T651 likewise, 3): acounter electrode which is graphite rod. The po-tentiodynamic polarization plots range from 1.5 Vto 1.5 V for cathodic and anodic potentials, re-spectively. The scan rate during the test period is0.005 V/s while the test samples were immersedinto the corrosive medium (NaCl) for 10 min be-fore the open circuit potential was recorded. This isto give room for steady-state potential and this wasalso in agreement with work [13, 17]. Each sampleof the experiment was carried out three times to as-certain reproducibility. Current density (jcorr) aswell as polarization potential (Ecorr), were extractedfrom the tafel plots and the percentage inhibitionperformance efficiency (IPE %) was computed us-ing Equations 1 and 2 and the surface courage (Θ)was also computed from the values achieved fromthe tafel plot using Equations 1 and 2 corrosion re-sults for the fabricated composite and the parentmetal has been extracted while the open circuit po-tential and the tafel polarization curve was plottedfrom the extracted data [14, 18–20], Table 1, Fig-ure 2.
O.M. Ikumapayi et al. Materialwiss. Werkstofftech. 2020, 51, 732–739734
© 2020 WILEY-VCH Verlag GmbH & CO. KGaA, Weinheim www.wiley-vch.de/home/muw
Wiley VCH Freitag, 05.06.2020
2006 / 166992 [S. 734/739] 1

1
2
3
4
5
6
7
8
9
10
11
12
13
14
15
16
17
18
19
20
21
22
23
24
25
26
27
28
29
30
31
32
33
34
35
36
37
38
39
40
41
42
43
44
45
46
47
48
49
50
Figure 1. (a) Scanning electron microscopy image of coconut shell powder (ai) energy dispersive x-ray of coconut shell ashpowder (b) scanning electron microscopy image α+β titanium-alloy powder (Ti-6Al-2Sn-2Zr-2Mo-2Cr-0.25Si) (bi) energy di-spersive x-ray of α+β titanium-alloy powder (Ti-6Al-2Sn-2Zr-2Mo-2Cr-0.25Si).
Table 1. Potentiodynamic polarization data for AA7075-T651, friction stir processed AA7075-T651 and AA7075-T651/coconut shell ash titanium-alloy aluminum hybrid composite in 3.5 % NaCl medium in an ambient temperature of25 °C.
Relativeinhibitionperformanceefficiency
Corrosioncurrent
Polarizationresistance
Corrosionrate
Anodictafelslope
Opencircuitpotential
Corrosionpotential
Cathodictafelslope
Samples % IPE jcorr(μA/cm2)
Pr(Ω)
Cr(mm/year)
jba j(mV/dec)
OCP(V)
Ecorr(mV)
jbc j(mV/dec)
AA7075-T651
0 436 98.597 5.0718 169.62 0.96954 1425.8 238.31
FSPed AA7075-T651
63.99 157 178.14 1.829 88.564 0.97839 1424 238.24
AA7075-T651/CSA/Ti
84.81 66.21 356.51 0.76938 71.313 0.87921 1306.6 228.55
High strength aluminum hybrid composite developed via friction stir processingMaterialwiss. Werkstofftech. 2020, 51, 732–739 735
© 2020 WILEY-VCH Verlag GmbH & CO. KGaA, Weinheim www.wiley-vch.de/home/muw
Wiley VCH Freitag, 05.06.2020
2006 / 166992 [S. 735/739] 1

1
2
3
4
5
6
7
8
9
10
11
12
13
14
15
16
17
18
19
20
21
22
23
24
25
26
27
28
29
30
31
32
33
34
35
36
37
38
39
40
41
42
43
44
45
46
47
48
49
50
q ¼ 1 jcorr
j0corr(1)
IPE % ¼ 1 jcorr
j0corr
100 (2)
Where jcorr is the inhibited corrosion current den-sities and jocorr is the uninhibited corrosion currentdensity. The scanning electron microscopy imagesof the corroded surfaces were then taken and stud-ied.
It was noted that hybridized AA7075-T651/co-conut shell ash Ti-6Al-2Sn-2Zr-2Mo-2Cr-0.5Siproduced the highest polarization resistance (Pr) of356.510 Ω as compared to friction stir processedAA7075-T651 with polarization resistance (Pr) of178.140 Ω while the base metal – AA7075-T651resisted the corrosion least with 98.597 Ω. It wasalso revealed that the corrosion rate (Cr) was0.76938 mm/year with the use of hybridized alumi-num composite as compared to the processed basemetal – friction stir processed AA7075-T651 with1.8290 mm/year corrosion rate while the base metalreceived the highest attack of corrosion with corro-sion rate of 5.0718, Table 1. In general, the per-centage inhibition performance efficiency was farhigher with the hybridized AA7075-T651/CSA/Ti-6Al-2Sn-2Zr-2Mo-2Cr-0.5Si, resulting in 84.81 %percentage protection as against 63.99 % with un-
reinforced but processed base metal – friction stirprocessed AA7075-T651.
3.3 Scanning electron microscopy (SEM) imagesfor the corroded samples
Morphological characteristics and surface top-ography for the corroded samples of both inhibitedwhich was hybridized AA7075-T651/coconut shellash titanium-alloy aluminum hybrid composite; anduninhibited samples which were base metalAA7075-T651 and friction stir processed AA7075-T651 were studied using TESCAN VEGA 3 LMHscanning electron microscopy and all the scanningelectron microscopy micrographs were taken at amagnification of 500x with accelerating voltage of20 kV and beam intensity of 10 having varyingworking distance ranges from 13.46 mm to14.72 mm. The morphologies of the corroded sam-ples that revealed the extend of corrosion attackswere captured by scanning electron microscopy,Figure 3. Pits corrosion attacks are really obviousin AA7075-T651 which indicates that is susceptibleto corrosion attack while friction stir processedAA7075-T651 indicates a considerable number ofpits attacks as well as micro cracks in its surfacetopography which occur as a result of intergranularcorrosion on the surface, Figure 3a–b. The morpho-logical behavior of the inhibited corrosion sample
Figure 2. (a) Plot of open circuit potential against exposure time (b) tafel potentiodynamic polarization curves for AA7075-T651, friction stir processed AA7075-T651 and AA7075-T651/coconut shell ash titanium-alloy aluminum hybrid composite in3.5 % NaCl solution at an ambient temperature of 25 °C.
O.M. Ikumapayi et al. Materialwiss. Werkstofftech. 2020, 51, 732–739736
© 2020 WILEY-VCH Verlag GmbH & CO. KGaA, Weinheim www.wiley-vch.de/home/muw
Wiley VCH Freitag, 05.06.2020
2006 / 166992 [S. 736/739] 1

1
2
3
4
5
6
7
8
9
10
11
12
13
14
15
16
17
18
19
20
21
22
23
24
25
26
27
28
29
30
31
32
33
34
35
36
37
38
39
40
41
42
43
44
45
46
47
48
49
50
under the influence of hybridized titanium alloypowder and coconut shell ash was characterizedwith intergranular corrosion attacks as well as avery small amount of pits attacks and formation offlakes that is, oxide layer was also observed on thesurface of AA7075-T651/coconut shell ash tita-nium-alloy aluminum hybrid composite and thissurface behavior shows how resistance to corrosionthe sample was, Figure 3 c.
3.4 X-ray diffraction (XRD) structural analysis
The recognition of crystal structure, phases, dif-fraction pattern, and crystalline phases evolved inthe base metal AA7075-T651, friction stir proc-essed AA7075-T651 and in the reinforced and fab-ricated aluminum hybrid composites – AA7075-T651/coconut shell ash titanium-alloy were studiedusing x-ray diffraction technique [21]. The x-raydiffraction patterns for AA7075-T651, friction stirprocessed AA7075-T651, and friction stir proc-essed AA7075-T651/coconut shell ash titanium-al-loy with (blue peaks) representing a fabricated hy-brid composite of friction stir processed AA7075-T651/coconut shell ash titanium-alloy while fric-tion stir processed AA7075-T651 (red peaks) andAA7075-T651 (black peaks) were plotted and thisrevealed different peaks at each samples, Figure 4.It was revealed that both the processed – frictionstir processed AA7075-T651 and unprocessed basemetal – AA7075-T651 have their peaks located atthe same positions with a slight difference in 2Θ
values. For unprocessed base metal AA7075-T651,the peaks were detected at the following positionsof 2Θ: 38.1, 44.3, 64.4, 77.4, and 81.5 while theprocessed base metal – friction stir processedAA7075-T651 has its peaks at the following posi-tions of 2Θ: 38.2, 44.4, 64.7, 77.7, and 81.9 inwhich, both correspond to (111), (200), (220),(311) and (222) which is in agreement with someworks found in literature [22–23]. When reinforcedwith carbonaceous coconut shell ash and titanium-alloy powder, the number of peaks were seen tohave increased in addition to the above number ofpeaks in the base metal. The influence of coconutshell ash titanium-alloy reinforcement in AA7075-
Figure 3. Scanning electron microscopy images for the corroded samples for (a) AA7075-T651 (b) friction stir processedAA7075-T651 (c) AA7075-T651/coconut shell ash titanium-alloy aluminum hybrid composite.
Figure 4. X-ray diffraction (XRD) for the fabricated alumi-num-alloy hybrid composite and the parent metal.
High strength aluminum hybrid composite developed via friction stir processingMaterialwiss. Werkstofftech. 2020, 51, 732–739 737
© 2020 WILEY-VCH Verlag GmbH & CO. KGaA, Weinheim www.wiley-vch.de/home/muw
Wiley VCH Freitag, 05.06.2020
2006 / 166992 [S. 737/739] 1
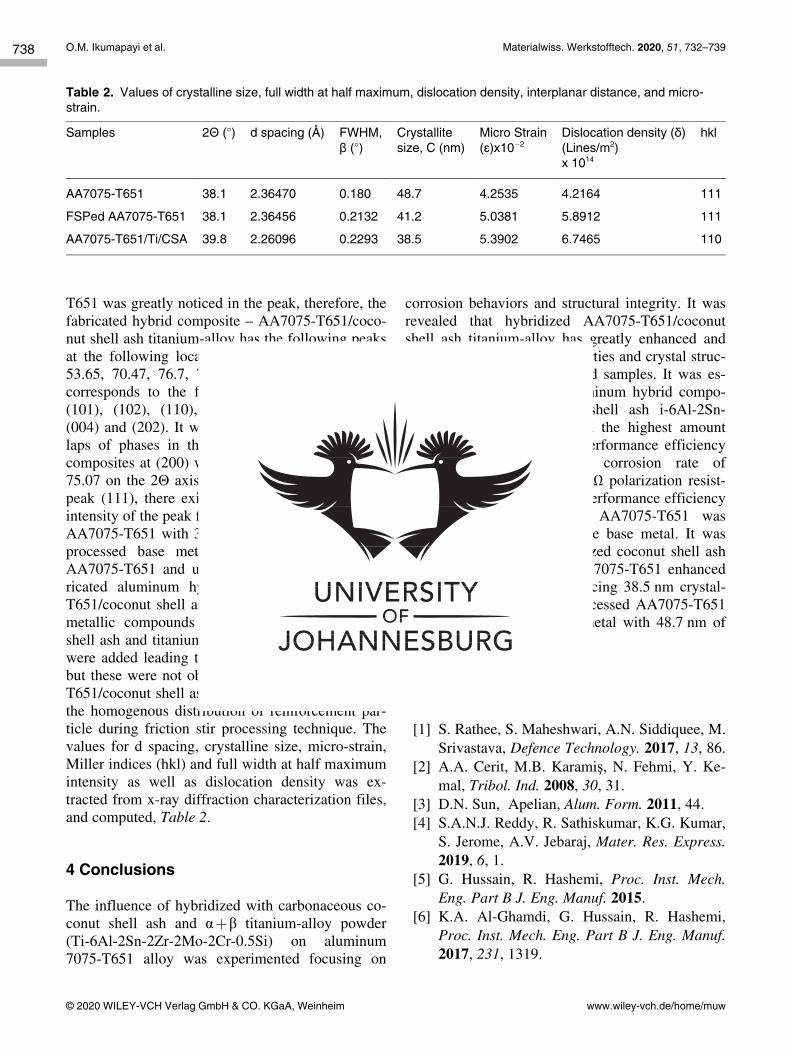
1
2
3
4
5
6
7
8
9
10
11
12
13
14
15
16
17
18
19
20
21
22
23
24
25
26
27
28
29
30
31
32
33
34
35
36
37
38
39
40
41
42
43
44
45
46
47
48
49
50
T651 was greatly noticed in the peak, therefore, thefabricated hybrid composite – AA7075-T651/coco-nut shell ash titanium-alloy has the following peaksat the following location of 2Θ: 35.4, 38.1, 40.4,53.65, 70.47, 76.7, 78.2, 81.58 and 87.46 whichcorresponds to the following peaks (100), (002),(101), (102), (110), (103), (200), (112), (201),(004) and (202). It was noticed that that was over-laps of phases in the fabricated aluminum metalcomposites at (200) which corresponds to 57.6 and75.07 on the 2Θ axis. It was also observed that, atpeak (111), there exits progressive increase in theintensity of the peak from unprocessed base metal –AA7075-T651 with 3300 counts to 5400 counts inprocessed base metal – friction stir processedAA7075-T651 and up to 5700 counts in the fab-ricated aluminum hybrid composite – AA7075-T651/coconut shell ash titanium-alloy. Some inter-metallic compounds were formed when coconutshell ash and titanium-alloy powder reinforcementswere added leading to the formation of new peaksbut these were not obvious in the plot of AA7075-T651/coconut shell ash titanium-alloy as a result ofthe homogenous distribution of reinforcement par-ticle during friction stir processing technique. Thevalues for d spacing, crystalline size, micro-strain,Miller indices (hkl) and full width at half maximumintensity as well as dislocation density was ex-tracted from x-ray diffraction characterization files,and computed, Table 2.
4 Conclusions
The influence of hybridized with carbonaceous co-conut shell ash and α+β titanium-alloy powder(Ti-6Al-2Sn-2Zr-2Mo-2Cr-0.5Si) on aluminum7075-T651 alloy was experimented focusing on
corrosion behaviors and structural integrity. It wasrevealed that hybridized AA7075-T651/coconutshell ash titanium-alloy has greatly enhanced andimproved the corrosion properties and crystal struc-ture integrity of the fabricated samples. It was es-tablished that fabricated aluminum hybrid compo-site AA7075-T651/coconut shell ash i-6Al-2Sn-2Zr-2Mo-2Cr-0.5Si generated the highest amountof percentage of inhibition performance efficiencyof 84.81 % amounting to corrosion rate of0.76938 mm/year and 356.51 Ω polarization resist-ance, whereas the inhibition performance efficiencyfor friction stir processed AA7075-T651 was63.99 % with reference to the base metal. It wasalso revealed that the hybridized coconut shell ashtitanium-alloy powder on AA7075-T651 enhancedthe structural integrity, producing 38.5 nm crystal-lite size over friction stir processed AA7075-T651with 41.2 nm and the base metal with 48.7 nm ofcrystallite sizes.
5 References
[1] S. Rathee, S. Maheshwari, A.N. Siddiquee, M.Srivastava, Defence Technology. 2017, 13, 86.
[2] A.A. Cerit, M.B. Karamiş, N. Fehmi, Y. Ke-mal, Tribol. Ind. 2008, 30, 31.
[3] D.N. Sun, Apelian, Alum. Form. 2011, 44.[4] S.A.N.J. Reddy, R. Sathiskumar, K.G. Kumar,
S. Jerome, A.V. Jebaraj, Mater. Res. Express.2019, 6, 1.
[5] G. Hussain, R. Hashemi, Proc. Inst. Mech.Eng. Part B J. Eng. Manuf. 2015.
[6] K.A. Al-Ghamdi, G. Hussain, R. Hashemi,Proc. Inst. Mech. Eng. Part B J. Eng. Manuf.2017, 231, 1319.
Table 2. Values of crystalline size, full width at half maximum, dislocation density, interplanar distance, and micro-strain.
Samples 2Θ (°) d spacing (Å) FWHM,β (°)
Crystallitesize, C (nm)
Micro Strain(ɛ)x10 2
Dislocation density (δ)(Lines/m2)x 1014
hkl
AA7075-T651 38.1 2.36470 0.180 48.7 4.2535 4.2164 111
FSPed AA7075-T651 38.1 2.36456 0.2132 41.2 5.0381 5.8912 111
AA7075-T651/Ti/CSA 39.8 2.26096 0.2293 38.5 5.3902 6.7465 110
O.M. Ikumapayi et al. Materialwiss. Werkstofftech. 2020, 51, 732–739738
© 2020 WILEY-VCH Verlag GmbH & CO. KGaA, Weinheim www.wiley-vch.de/home/muw
Wiley VCH Freitag, 05.06.2020
2006 / 166992 [S. 738/739] 1

1
2
3
4
5
6
7
8
9
10
11
12
13
14
15
16
17
18
19
20
21
22
23
24
25
26
27
28
29
30
31
32
33
34
35
36
37
38
39
40
41
42
43
44
45
46
47
48
49
50
[7] O.M. Ikumapayi, E.T. Akinlabi, Mater. Res.2019, 6, 1.
[8] M. Sudhakar, C.H. Srinivasa Rao, K. Meer-a Saheb, Mater. Today Proc. 2018, 5, 929.
[9] A. Bawdekar, S. Singh, Int. J. Mech. Prod.Eng. Res. Dev. 2017, 7, 343.
[10] V. Sharma, U. Prakash, B.V.M. Kumar, J.Mater. Process. Technol. 2015, 224, 117.
[11] I. Dinaharan, K. Kalaiselvan, E.T. Akinlabi, J.P. Davim, J. Alloys Compd. 2017, 718, 150.
[12] O.M. Ikumapayi, E.T. Akinlabi, Int. J. Mech.Prod. Eng. Res. Develeopment. 2019, 9, 839.
[13] R.U. Din, V.C. Gudla, M.S. Jellesen, R. Am-bat, Surf. Coat. Technol. 2016, 296, 1.
[14] O.S.I. Fayomi, I.G. Akande, J. Bio-Tribo-Corrosion. 2019, 5, 1.
[15] O.M. Ikumapayi, E.T. Akinlabi, Data Br.2019, 23, 1.
[16] O.M. Ikumapayi, E.T. Akinlabi, Data Br.2019, 22, 537.
[17] K. Bordo, V.C. Gudla, L. Peguet, A. Afseth,R. Ambat, Corros. Sci. 2018, 131, 28.
[18] I.G. Akande, O.O. Oluwole, O.S.I. Fayomi,Def. Technol. 2018, 15, 526.
[19] O.S.I. Fayomi, I.G.A. Akande, P.I. Popoola, J.Bio-Tribo-Corrosion. 2018, 4, 1.
[20] H. Gerengi, M.M. Solomon, F.E. Bagci, E.J.Abai, Measurement. 2018, 116, 264.
[21] V. Pandey, J.K. Singh, K. Chattopadhyay, N.C.S. Srinivas, V. Singh, J.A. Compd. 2017,723, 826.
[22] M.S. Prabhu, A.E. Perumal, S. Arulvel, R.F.Issac, Meas. J. Int. Meas. Confed. 2019, 142,10.
[23] R. Liu, C. Wu, J. Zhang, G. Luo, Q. Shen, L.Zhang, J. Alloys Compd. 2018, 748, 737.
[24] K. Kumar, P. Gulati, A. Gupta, D.K. Shukla,Int. J. Mech. Eng. Technol. 2017, 8, 1638.
[25] D.K. Koli, G. Agnihotri, R. Purohit, ProcediaMater. Sci. 2014, 6, 567.
[26] H. Das, M. Mondal, S.-T. Hong, D.-M. Chun,H.N. Han, Int. J. Precis. Eng. Manuf. Tech-nol. 2018, 5, 151.
[27] R.S. Mishra, Z.Y. Ma, Mater. Sci. Eng. R. Re-ports. 2005, 50, 1.
[28] O.M. Ikumapayi, E.T. Akinlabi, J.D. Ma-jumdar, Int. J. Mech. Eng. Technol. 2018, 9,534.
Received in final form: February 12th 2020
High strength aluminum hybrid composite developed via friction stir processingMaterialwiss. Werkstofftech. 2020, 51, 732–739 739
© 2020 WILEY-VCH Verlag GmbH & CO. KGaA, Weinheim www.wiley-vch.de/home/muw
Wiley VCH Freitag, 05.06.2020
2006 / 166992 [S. 739/739] 1

52
2.17 ARTICLE XVI
The Tribological, Structural and Mechanical Characteristics of friction stir
processed aluminium-based matrix composites reinforced with stainless steel
micro-particles
Published in Engineering Solid Mechanics, Vol 8, Issue 3,
https://doi.org/10.5267/j.esm.2019.12.001
ISSN: 2291-8752
This paper studied the potency of stainless-steel micro-particles on friction stir processed
aluminium-based matrix composite (AMC). The study centred on the tribological investigation,
the structural analysis, as well as the integrity of the mechanical properties thereof. The dry sliding
was carried out by using a tribometer with varying forces of 20 N and 50 N; and the following
wear parameters were measured and recorded: wear volume, wear resistance, wear depth, wear
rate, and the coefficient of friction, etc.; while the scanning electron microscope (SEM) was used
to capture the wear track. The structural integrity of the processed samples was examined by the
use of x-ray diffraction (XRD); and the peak values, the crystalline size, the dislocation density,
and the micro-strain were measured and recorded; and it was found that ABMC – AA7075-
T651/17-4PH produced the best structural properties, by having the value for crystallite size at the
lowest; while with the micro-strain, the dislocation density, as well as the full width at half
maximum (FWHM) at the highest values over the FSPed AA7075-T651; and the parent material,
which implies that the fabricated composite with the lowest average grain size should have the
strongest intermetallic bonding. The tensile strengths of the fabricated ABMC were also tested;

53
and the fracture surfaces were studied, using the SEM analysis and some reasonable conclusions
were drawn from the study.
The micro-structural changes, as a result of the FSP and the stainless-steel particle reinforcement
caused an improvement in the tensile strength. The examined fractured surface of the fabricated
composite was dominated by a fine, network and equiaxed dimples with cup-and-cone attributes,
thereby confirming the superb interfacial bonding and that the failure mode was ductile. This
published journal article has been able to address some of the objectives of the study especially
those in item II to V.

* Corresponding author. E-mail addresses: [email protected] (O. M. Ikumapayi) © 2020 Growing Science Ltd. All rights reserved. doi: 10.5267/j.esm.2019.12.001
Engineering Solid Mechanics 8 (2020) 253-270
Contents lists available at GrowingScience
Engineering Solid Mechanics
homepage: www.GrowingScience.com/esm
Tribological, structural and mechanical characteristics of friction stir processed aluminium-based matrix composites reinforced with stainless steel micro-particles
Omolayo M. Ikumapayia*, Esther T. Akinlabia, Abhishek Sharmab, Vyas Sharmab and Oluseyi P. Oladijoc aDepartment of Mechanical Engineering Science, University of Johannesburg, Auckland Park Kingsway Campus, Johannesburg, 2006, South Africa bDepartment of Mechanical Engineering, Indian Institute of Technology, Kharagpur, India cDepartment of Chemical, Materials & Metallurgical Engineering, Botswana International University of Science and Technology, Palapye, Botswana A R T I C L EI N F O A B S T R A C T
Article history: Received 15 October 2019 Accepted 19 December 2019 Available online 19 December 2019
The efficacy of stainless-steel micro-particles on friction stir processed aluminium-based matrix composite (ABMC) was studied using tribological, mechanical and structural analysis tools. The stainless-steel powder (17-4PH) of average size 45 – 90 µm was used as the reinforcement particle. The parametric values employed during the fabrication of ABMC- AA7075-T651/17-4PH were the rotational speed of 1500 rpm and travel speed of 20 mm/min while the plunge depth and tilt angles used were respectively 0.3 mm and 3 degrees. Tribological study was carried out under the influence of dry sliding condition with varying loads of 20 N and 50 N using tribometer while the scanning electron microscope (SEM) was used to capture the wear track. Structural analysis was examined with the aid of x-ray diffraction (XRD). The tensile strengths of the fabricated ABMC were also tested and the fracture surfaces were studied using SEM analysis. The results from the study revealed that at higher loading of 50 N, the wear performance was significantly improved for the fabricated aluminium composite- AA7075-T651/17-4PH when compare with lower loading of 20 N. The tensile properties for the ABMC were also improved under the influence of the stainless steel microparticles. There was structural improvement in ABMC wherein the value for crystallite size was lowest while micro-strain, dislocation density, as well as full width at half maximum (FWHM), had the highest values over the FSPed AA7075-T651 and the parent material. The examined fractured surface of the fabricated composite was dominated with fine, network and equiaxed dimples with cup and cone attributes confirming superb interfacial bonding and that the failure mode was ductile.
© 2020 Growing Science Ltd. All rights reserved.
Keywords: Aluminium-based matrix composite Crystallite Size Stainless steel powder Tensile Strength Wear
1. Introduction Aluminium-based matrix composites (ABMC) have been used in the manufacturing sectors for the fabrication of the following components such as brake drum, piston as well as cylindrical block whereby friction and wear play some cogent roles. Aluminium-based matrix composites (ABMCs) have been reported to have also found applications in most of marine, construction, automobile, nuclear, and aerospace sectors as one of the advanced and modern engineering and manufacturing materials used. ABMCs has several remarkable and excellent isotopic, structural, metallurgical, easy of fabrication, mechanical and electrochemical properties that made it suitable for the building of defence and military

254
equipment. These properties are not limited to low thermal expansion, high thermal conductivity, excellent wear-resistant, weldability, excellent formability, high fatigue strength, high creep resistant, promising damping capacities, high ductility as well as high stiffness (Huang et al., 2018; Ikumapayi et al., 2019a). It was reported that lower series of aluminium alloy has low thermal stability, poor corrosion-resistant, low hardness, as well as low tensile strength among others and such series, are pure aluminium (1xxx), copper-based (2xxx), manganese-based ( 3xxx), silicon-based (4xxx), magnesium-based (5xxx) so also series 6xxx (Ikumapayi & Akinlabi, 2019; Navaneethakrishnan & Ganesh, 2015; Vijaya Kumar, Madhusudhan Reddy, & Srinivasa Rao, 2015). These deficiencies have been overturned by high strength aluminium alloys which have improved structural, mechanical and chemical properties such series are zin-based (7xxx) as well as new series of 8xxx and 9xxx which are not so popular (Ikumapayi & Akinlabi, 2019; Rambabu et al., 2017). It has been established that lightweight materials such as magnesium, aluminium, and titanium offered dynamic and enterprising advantages over traditional steel metal as a result of their high specific strength and low density (Garcia et al., 2009; Vasco et al., 2018). It is, therefore, certain that in the future, steel might go into extinction wherein high strength and low-density materials such as aluminium, titanium, and magnesium might replace the steel. On this awareness and since titanium is very costly and magnesium is self-explosive, therefore aluminium might be the one that will likely replace steel in some of the prominent industries where steel functions today such as transportation, aerospace, automobiles, and defense sectors (Ikumapayi et al., 2019b; Sudhakar et al., 2016). The utilization of any of these engineering materials effectively and efficiently is very paramount for the manufacturing and designing of various structures, machines as well as vehicles, etc. It is essential to note that, engineering material must meet some fundamental integration of properties like toughness, strength, density, and stiffness. The combination of any of these properties may be absent from the conventional polymer, metal or ceramic. On this note, the fabrication of composites materials which will, therefore, have some amalgamated properties that conventional metal, ceramics or polymer were unable to meet. A structural material containing the combination of two or more constituents having a distinctive chemical or physical property which remains separate on macroscopic level within the final structure can be termed composite. A composite is a multiphase substance wherein the targeted properties can be produced by interfacial bonding between the reinforcement and the matrix substrate(Mistry & Gohil, 2017). It has been observed that aluminium and its alloy have been under-utilized industrial-wise due to some poor mechanical, structural and tribological properties embedded. On this awareness, report shows that surface modification of the base material is being altered via electron beam welding, thermal spraying as well as laser surfacing (Sudhakar et al., 2015). Nowadays, Friction stir processing has been adopted to cater for the complex methods of surface modification. Friction stir processing (FSP) was initially derived in 1999 from the work of (Gerlich, 2017; Mishra & Ma, 2005; Mishra et al., 2014) which took its root from a novel technique called friction stir welding (FSW) that was invented in 1991 and patented by the welding institute (TWI) of UK as a solid-state joining method. Afterwards, a large number of research papers have been published for investigating the mechanical properties, microstructure and quality of FSW and FSP components (Narasimharaju & Sankunny 2019; Kundu & Singh 2017; Jian et al. 2018; Aliha et al. 2016; Taheri-Behrooz et al. 2018; Torabi et al. 2018;2019 Akbari et al.2017; 2019, Shojaeefard et al. 2017; Behnagh et al. 2012; Shahraki et al. 2013; Asadi et al. 2012). Since the liberation of FSP in 1999, thousands of articles, hundreds of patents, thousands of textbooks as well as reviewed and peer-reviewed magazines had been in circulation which have been imparting life till date. It is worth knowing that lots of benefits emerge from FSP which include but are not limited to short-route of fabrication, densification, grain refinement, homogenization of precipitates of composites substance and aluminum alloys, Nugget zone homogeneity(Sanusi & Akinlabi, 2017), FSP has been well known for surface modification, significant and remarkable improvement in hardness, ductility, strength, increase fatigue life, as well as formability wherein the bulk properties are still intact (Fatchurrohman et al., 2018). Nonetheless, some difficulties are still being encountered in the course of modifying these surfaces using FSP, especially with reinforcement particles. It has been reported that backing plates usually stick to the workpiece when a thin or small diameter that is less than 1 mm is being processed, when proper optimum parameters are not being chosen, lots of flashes may be experienced during FSP techniques, lots of wear may be encountered during the fabrication of the

O. M. Ikumapayi et al. / Engineering Solid Mechanics 8 (2020)
255
composites due to abrasive influence of the particles used for reinforcement (Ikumapayi et al., 2019c). Therefore, to achieve defect-free in the fabricated composites samples with good surface finish, experimental parameters must be adequately controlled. The processing parameters must be optimized to give a fabricated composite free of defects with high surface integrity. It is, therefore, imperative to note that the following parameters must be adequately controlled to give the best results such parameters include proper tool design, i.e. shoulder diameter geometry as well as pin profile while groove dimension in terms of depth and width should be well designed; also, machine variables must be controlled such as tool plunge depth, tool tilt angle, tool rotational speed, and tool traverse speed. In the same vein, amount of heat input and the method of heating and cooling must be controlled significantly while material properties must be known before and after the processing such as mechanical, chemical, thermal as well as electrical properties (Das et al. 2018; Ikumapayi et al., 2018a,b; Koli et al., 2014; Kumar et al. , 2017; Mishra & Ma, 2005; Sharma et al., 2015). Several researchers have done tremendous works on behaviors of aluminium alloy 7075 at different tapered conditions using various reinforcement particles ranging from metallic powders to agrowastes powders which are carried out experimentally and theoretically (Johannes & Mishra, 2007; Kubit et al., 2018; Padhy et al., 2017; Rana et al., 2016). Patel et al. (2017) investigated the influence of polygonal pin geometry on the super-plasticity of aluminium alloy 7075 via friction stir processing. In this study, the following polygonal geometry was employed, hexagonal, square as well as pentagon pin profiles. The effects of pin profile on microhardness, grain refinement, as well as microstructures were examined. It was noted that the square pin profile produced fine grain with uniform microstructure without any defects in the stir zone while other pin profile has sticking of substrate on the pin profile ends resulting to non-uniform of microstructure. Selvakumar et al. (2017) fabricated aluminium matrix composite reinforced with stainless steel particulate. The percentages reinforcement was varied from 0, 6, 12 and 18 % by volume of stainless steel deposited in the groove with width (o.4, 0.8 and 1.2 mm) while maintaining a depth of 5.5 mm and length of 100 mm throughout the experiment. It was noted that 1600 rpm of rotational speed while 60 mm/min for a single pass. It was noted that produced aluminium composites showed equiaxed fine grains as a result of pining effects as well as dynamic recrystallization. It was further established that stainless steel particles employed yielded improved tensile strength while maintaining its ductility properties. The results have shown that UTS at 18 Vol% of stainless steel gave 293 MPa while at 0 vol% gave 222 MPa, this shows that stainless steel has influenced the mechanical properties. Similarly, the fracture surfaces of the AMC showed a network of dimples with superior interfacial bonding which can be attributed to the ductility properties of the fabricated composites. Feng et al. (2010) study the integrity of cyclic deformation in 6.35 mm thickness, 400 mm long and 80 mm wide, aluminium alloy 7075-T651 during friction stir welding. In this study, the microstructural analysis was carried out and significant grain refinement was achieved with dissolution of (Mg(Zn,Al,Cu)2) precipitates at the stir zone. It was observed that fatigue life and cyclic hardening were increased with increase in travel speed from 100 mm/min to 400 mm/min while little effects were noticed when rotational speed was increased from 800 rpm to 1200 rpm. It was noted that stress amplitude increased while plastic strain amplitude decreased during friction stir welding between 800 rpm and 1200 rpm rotational speed. Sert and Celik (2014) studied the wear properties of the aluminium alloy Al7075-T651 under the influence of Silicon Carbide (SiC) particles via friction stir processing. In this study, varying load of 2, 4 and 5 N were tested using ball-on-disk configuration with sliding speed of 2.5 cm/s while friction stir processing parameters that were employed are 710 rpm of constant rotational speed wherein the traverse speed used are varying with 20 mm/min, 40 mm/min and 56 mm/min. It was noted that at 2 N applied force and 40 mm/min, reinforced aluminium matrix composite produced the best wear properties when compared with unreinforced samples. Jain et al. (2018) studied wear behaviour alongside with the mechanical properties’ aluminium-based (5053) matrix composites reinforced with tri-particles containing B4C/SiC/TiC using friction stir processing. The results show that reinforcing with B4C produced the least grain size of 3.80 µm followed by SiC given 4.90 µm size while TiC produced 5.50 µm and the base metal has the highest grain size of 40.90 µm. The wear rate for AA5083- B4C was found

256
to be the least which was 18.00 x 10⁻⁵mm3/Nm with hardness of 132.56Hv whereas AA5083-TiC produced 24. 25 x 10-5mm3/Nm wear rate making the second-best particles that can resist wear with hardness of 118.25Hv and that of AA5058-TiC performed least among the tested samples with 22.28 × 10⁻⁵mm3/Nm wear rate and 114.55Hv hardness. Kishan et al. (2018) investigated the tribological behaviour of aluminium alloy 6061-T6 using nanoparticles of TiB2 during friction stir processing. In the study, the authors reinforced Al6061-T6 with different percentages by volume of 35 nm TiB2 which are 2 vol %, 4 vol %, 8 vol % of TiB2. It was noticed that at 4 % by volume of TiB2, wear resistance was said to be high with microhardness of 132HV as against the base metal of 104HV. More debris was noticed at 8 vol% as against other reinforcement. This present work focused on the study of tribological behaviours such as wear properties, mechanical behaviours such as tensile and fracture mechanism as well as structural behaviours such as crystal structure and grain size measurements under the influence of 17-4Ph stainless steel powder on the fabricated aluminium 7075-T651 alloy. 2. Materials and Methods
2.1 Materials Commercially available 6mm thickness rolled aluminium alloy 7075-T651 metal plates were used in this study with dimensions 300 × 125 × 6 mm3. The spark spectrometric analysis of as-received base metal was carried out and the result is documented in Table 1 and the mechanical properties in as received form are Shear Modulus (26 GPa), Brinell Hardness (150), Fatigue strength (160MPa), shear strength (330 MPa), Elastic Modulus (70 GPa), Poisson’s Ratio (0.32), Yield Strength (500 MPa) and Ultimate tensile strength (UTS) (570 MPa). The base material was reinforced metallic micro-particles containing 17-4 PH stainless steel powder. The powder was received in average size 45 – 90 µm. The morphology of the powder was studied using scanning electron microscope (SEM) and its elemental compositions were also captured by the Energy Dispersive X-ray Spectrometer (EDXS). The powder characterizations were carried out at a SEM magnification of 200x, with a beam intensity of 10 and accelerating voltage of 20kV in which the working distance was 16.25 mm. The SEM Image and it corresponding EDXS are presented in Fig. 1.
Fig. 1(a). SEM Images of 17-4 PH Stainless steel powder (b) its EDS
The friction stir processing was conducted on a two-tons numerically controlled friction stir welding machine (see Fig. 2a) manufactured by ETA Banglore, India Ltd. A microchannel (groove) was created on the plates with dimensions, 3.5 mm depth, 280 mm length and 2. 0 mm width, while AISI H13 hot-working tool steel was employed for stirring and mixing. The processing tool has 18 mm shoulder
a

O. M. Ikumapayi et al. / Engineering Solid Mechanics 8 (2020)
257
diameter, 5 mm pin diameter, and 5 mm pin length. Two passes were carried out on the optimum processing parameters with 100 % inter-pass overlap. The first pass was done on the processing parameters having 100 mm/min travel speed and 1000 rpm rotational speed with pinless processing tool of 18 mm shoulder diameter. The second pass was done with 20 mm/min travel speed and 1500 rpm rotational speed with plunge depth of 0.1 for first pas and 0.2 for second pass and tilt angle of 3°. The schematic three – dimensional model of the friction stir processing is depicted in Fig. 2b.
Table 1. Chemical composition AA7075-T651 aluminum alloy Elements Mg Fe Ti Si Mn Zn Cu Cr Al
Wt.% Composition 2.8 0.15 0.02 0.05 0.01 5.92 1.93 0.193 Balance
Fig. 2a. NC-controlled FSW machine Fig. 2b. Schematic 3D model of FSP
2.2 Tribological Study – Wear Behaviours A Cyclic and ball on flat disc wear test was conducted on the aluminium alloy with dimension 24 mm × 10 mm × 6 mm size. The test was carried out as dry and unlubricated using Rtec Universal tribometer MTF 5000 which has the capability of imaging through three-dimensional in-line profilometers. The system software was made of MF17 for data acquisition. The experiment was conducted in-line with the ASTM G133-05 standards (Erinosho et al., 2017) and this test was carried out on three test samples in triplicate to ensure reproducibility and this is to measure the consistency of the results. The tested samples are base metal - AA7075-T651, FSPed AA7075-T651, and FSPed AA7075-T651/17-4Ph AMC. Two different forces were used in this experiment and they are 20 N Load and 50 N Load. The following parameters were measured as acquired, coefficient of friction (COF), wear track, wear volume, friction force for all the tested samples while wear resistance and wear rate was computed. The test samples were carried under the influence of ambient temperature of 25 °C. The parameters engaged during the tribological experimental procedures were reported in Table 2. Table 2. Tribological Experimental Parameters
Item Parameter Lubrication Dry/unlubricated
Loads 20 N, 50 N Ball-type Alloy steel E52100
Sliding Distance 3 mm, 5 mm Loading type Constant Sliding Speed 3 mm/s
Wear Type Cyclic, ball-on-Flat test Ball Grade 25
Sliding time 5 mins Ball Size 6.35 mm
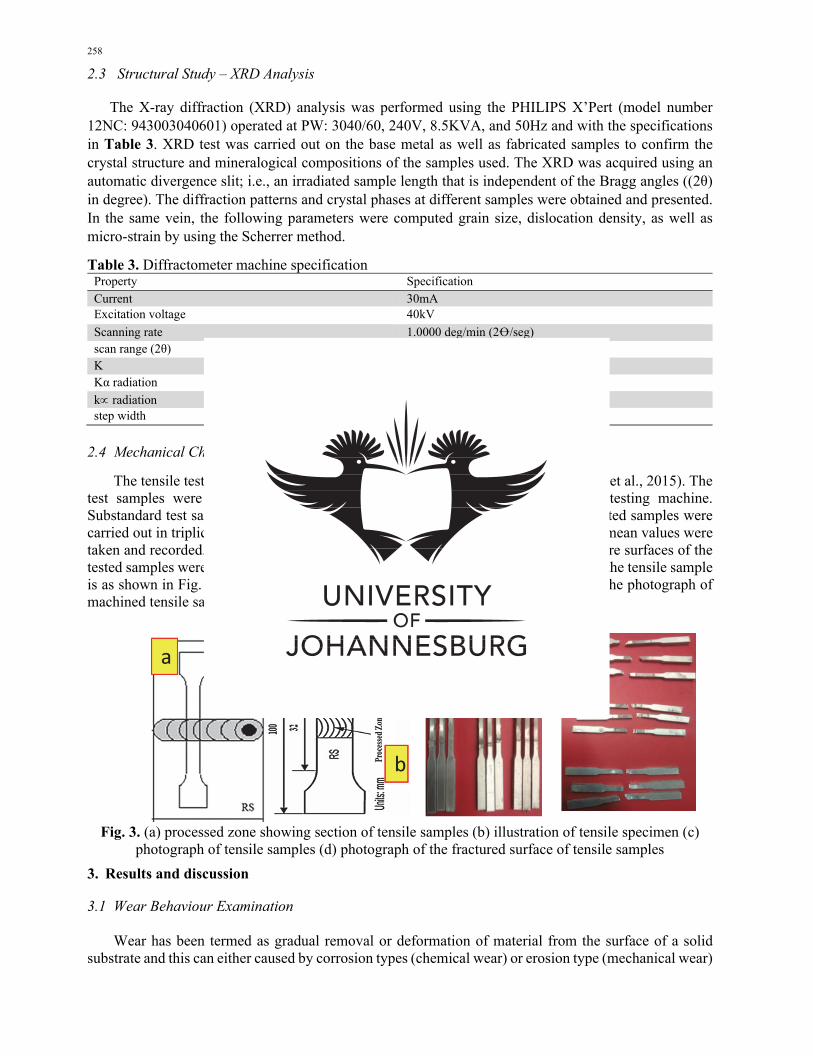
258
2.3 Structural Study – XRD Analysis
The X-ray diffraction (XRD) analysis was performed using the PHILIPS X’Pert (model number 12NC: 943003040601) operated at PW: 3040/60, 240V, 8.5KVA, and 50Hz and with the specifications in Table 3. XRD test was carried out on the base metal as well as fabricated samples to confirm the crystal structure and mineralogical compositions of the samples used. The XRD was acquired using an automatic divergence slit; i.e., an irradiated sample length that is independent of the Bragg angles ((2θ) in degree). The diffraction patterns and crystal phases at different samples were obtained and presented. In the same vein, the following parameters were computed grain size, dislocation density, as well as micro-strain by using the Scherrer method.
Table 3. Diffractometer machine specification Property Specification Current 30mA Excitation voltage 40kV Scanning rate 1.0000 deg/min (2Ꝋ/seg) scan range (2θ) Between 5° and 90° K 0.94 Kα radiation λ = 1.5406 Å k radiation λ = 1.39225 Å step width 0.0100 deg
2.4 Mechanical Characteristics – Tensile Test The tensile test was carried out following ASTM B557M-10 standard (Ikumapayi et al., 2015). The test samples were carried out on the Xforce P-type Zwick/Roell Z250 Tensile testing machine. Substandard test samples of 100 mm long with thickness of 6 mm were used. The tested samples were carried out in triplicate each to ascertain the level of accuracy and reproducibility and mean values were taken and recorded. The test was conducted at a temperature of 25 degrees. The fracture surfaces of the tested samples were examined using SEM. The processed zone showing the section of the tensile sample is as shown in Fig. 3a while the sectioned tensile sample is illustrated in Fig. 3b and the photograph of machined tensile samples is presented in Fig. 3c with its fractured surface in Fig. 3d.
Fig. 3. (a) processed zone showing section of tensile samples (b) illustration of tensile specimen (c) photograph of tensile samples (d) photograph of the fractured surface of tensile samples
3. Results and discussion
3.1 Wear Behaviour Examination Wear has been termed as gradual removal or deformation of material from the surface of a solid substrate and this can either caused by corrosion types (chemical wear) or erosion type (mechanical wear)
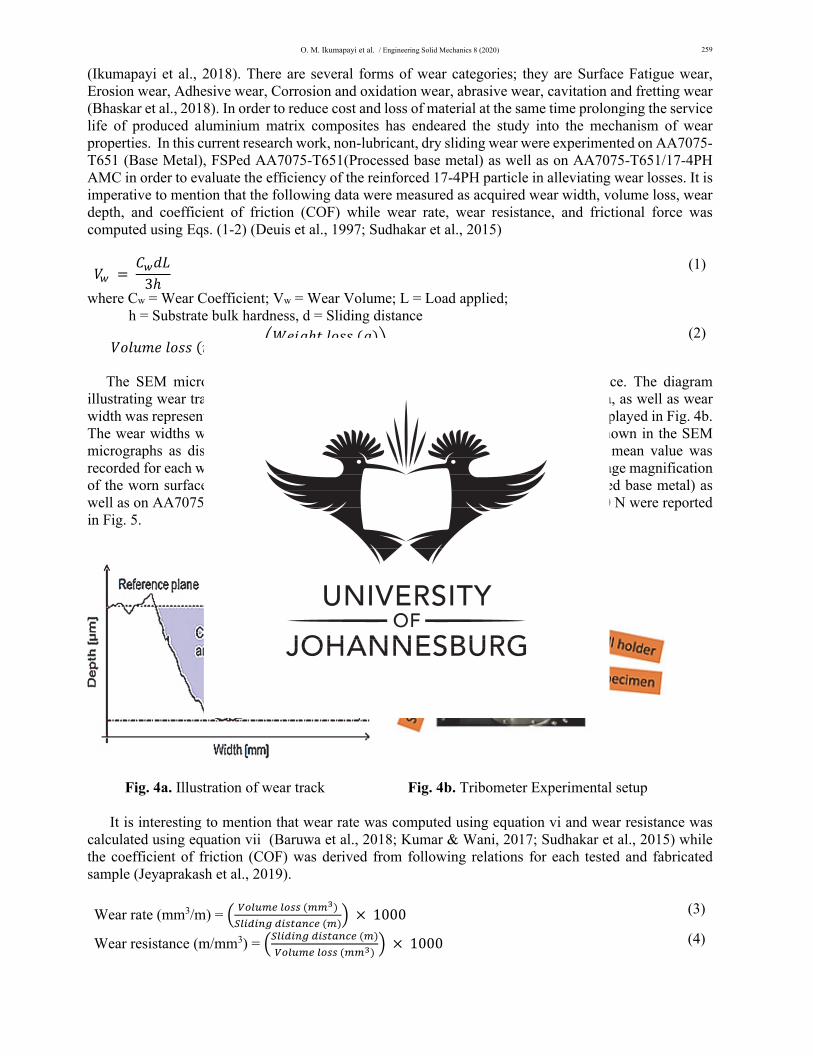
O. M. Ikumapayi et al. / Engineering Solid Mechanics 8 (2020)
259
(Ikumapayi et al., 2018). There are several forms of wear categories; they are Surface Fatigue wear, Erosion wear, Adhesive wear, Corrosion and oxidation wear, abrasive wear, cavitation and fretting wear (Bhaskar et al., 2018). In order to reduce cost and loss of material at the same time prolonging the service life of produced aluminium matrix composites has endeared the study into the mechanism of wear properties. In this current research work, non-lubricant, dry sliding wear were experimented on AA7075-T651 (Base Metal), FSPed AA7075-T651(Processed base metal) as well as on AA7075-T651/17-4PH AMC in order to evaluate the efficiency of the reinforced 17-4PH particle in alleviating wear losses. It is imperative to mention that the following data were measured as acquired wear width, volume loss, wear depth, and coefficient of friction (COF) while wear rate, wear resistance, and frictional force was computed using Eqs. (1-2) (Deuis et al., 1997; Sudhakar et al., 2015) 𝑉 𝐶 𝑑𝐿3ℎ (1)
where Cw = Wear Coefficient; Vw = Wear Volume; L = Load applied; h = Substrate bulk hardness, d = Sliding distance 𝑉𝑜𝑙𝑢𝑚𝑒 𝑙𝑜𝑠𝑠 𝑚𝑚 𝑊𝑒𝑖𝑔ℎ𝑡 𝑙𝑜𝑠𝑠 𝑔𝐷𝑒𝑛𝑠𝑖𝑡𝑦 1000
(2)
The SEM micrographs reported were showing the measured values of wear trace. The diagram illustrating wear track is depicted in Fig. 4a, the wear depth, wear cross-sectional area, as well as wear width was represented. Similarly, the schematic of tribometer experimental setup is displayed in Fig. 4b. The wear widths were recorded three times to ensure consistency of the results as shown in the SEM micrographs as displayed in Fig. 5 and this is to ascertain reproducibility and the mean value was recorded for each wear width of the tested sample. The morphologies at 100 x SEM image magnification of the worn surfaces for AA7075-T651 (Base Metal), FSPed AA7075-T651(Processed base metal) as well as on AA7075-T651/17-4PH AMC at different loading conditions of 20 N and 50 N were reported in Fig. 5.
Fig. 4a. Illustration of wear track Fig. 4b. Tribometer Experimental setup It is interesting to mention that wear rate was computed using equation vi and wear resistance was calculated using equation vii (Baruwa et al., 2018; Kumar & Wani, 2017; Sudhakar et al., 2015) while the coefficient of friction (COF) was derived from following relations for each tested and fabricated sample (Jeyaprakash et al., 2019). Wear rate (mm3/m) = 1000 (3)
Wear resistance (m/mm3) = 1000 (4)

260
Coefficient of friction (µ) = ( ) ( ) (5)
Fig. 5. SEM Micrographs (a-c) for 20 N illustrating wear track for (a) AA7075-T651 (b) FSPed AA7075-T651 (c) AA7075-T651/17-4PH; (ai-ci) for 50 N: (ai) AA7075-T651 (bi) FSPed AA7075-
T651 (ci) AA7075-T651/17-4PH 3.2 Influence of Applied Loads on Wear Characteristics Tables 4 and 5 show the values of data measured, computed and recorded for wear test at an applied load of 20 N and 50 N respectively. The parametric values used when 20 N applied load was applied were sliding distance, cyclic time and speed of 3 mm, 5 minutes and 3 mm/s respectively conducted at room temperature. Also, when 50 N applied load was applied, the following parametric factors were applied, sliding distance, speed and time which are 5 mm, 3 mm/s and 5 mins respectively. The SEM images of the tested samples representing the worn surfaces are depicted in Fig. 5. It was noticed that when 20 N force was applied, more debris was observed than when 50 N force was applied and this may due to the excessive heat generated during the sliding, and cyclic movement of the steel ball on the substrate being tested and this also leads to degeneration of plastic deformation on mechanical properties and softening the wear paths (Dinaharan et al., 20171), by so doing cleaning off the debris generated along the wear track and was in consensus with the work reported in (Boromei et al., 2006). It was observed that the mean values for wear width when 50 N applied force were larger than that of 20 N applied force as evidence on the SEM images in Fig. 5. Delamination was more conspicuous in the wear track when an applied force of 20 N was used. Figs. 6 and 7 respectively represent the 20 N applied force and 50 N applied force of wear tracks with their respective profiler at different tested samples.

O. M. Ikumapayi et al. / Engineering Solid Mechanics 8 (2020)
261
Table 4. Wear experimental data obtained at an applied load of 20 N
Parameters 20 N, 5 mins, 3 mm and 3 mm/s Sample Wear
Depth (mm)
Friction Force (N)
Wear Volume (mm3)
Wear width (µm)
Wear Resistance (m/mm3)
COF Wear Rate (mm3/m)
AA7075-T651 0.0213 9.360 0.049940 920.22 60072.09 0.4680 16.647 FSPed AA7075-T651 0.0201 9.136 0.042313 1099.76 70900.19 0.4568 14.104 AA7075-T651/17-4PH 0.0176 8.418 0.032578 1286.11 92086.68 0.4209 10.859
Table 5. Wear experimental data obtained at an applied load of 50 N Parameters 50 N, 5 mins, 5 mm and 3 mm/s Sample Wear
Rate (mm3/m)
Wear Depth (mm)
Wear Volume (mm3)
Wear width (µm)
Wear Resistance (m/mm3)
Friction Force (N)
COF
AA7075-T651 5.672 0.0288 0.028358 401.65 176317.09 9.845 0.1969 FSPed AA7075 2.878 0.1135 0.014390 355.27 347463.51 6.600 0.1320 AA7075-T651/17-4PH 2.275 0.0218 0.011374 725.83 439599.09 5.840 0.1168
Fig. 6. 2D and Profiler for Wear track at 20 N (a) AA7075-T651 (b) FSPed AA7075-T651 (c) AA7075-T651/17-4PH
Fig. 7. 2D, 3D and Profiler for wear track at of 50 N (a-aii) AA7075-T651 (b-bii) FSPed AA7075-T651 (c-cii) AA7075-T651/17-4PH

262
In order to establish the potency of the reinforcements used in this study on wear behaviours, a comparative analysis was carried out on both reinforcements particles with reference to applied load and wear parametric properties. At applied load 20 N in Table 4, the wear volume for unprocessed base metal – AA70075-T651was measured to be 0.049940 mm3 which was higher than when 50 N load is applied on the same substrate, in this case was 0.028358 mm3 as depicted in Table 5. By this the volume loss in materials was minimized at higher load. On the same substrate – AA7075-T651, it was noticed that wear rate was higher at 20 N applied load than when 50 N load is applied which amounted to 16.647 mm3/m and 5.672 mm3/m respectively and wear resistance was larger when 50 N applied load was used which gave 176317.09 m/mm3 and 60072.09 m/mm3 when 20 N was applied. When relating with wear depth, the larger force of 50 N gave higher depth on unprocessed base metal – AA7075-T651 which was 0.0288 mm as against 0.0213 mm when 20 N force is applied. The coefficient of friction (COF) was more at 20 N force applied than at 50 N force applied which were 0.4680 and 0.1969. Fig. 8 shows the plot of tribological parametric values with reference to applied load on the tested samples. On examining the friction stir processed of base metal – FSPed AA7075-T651, one could see that at 20 N force applied, the volume loss was recorded to be 0.042313 mm3 while that of 50 N applied load was 0.014390 mm3, which means that at higher load, minimum volume loss was noticed. At this point, the wear resistance was largely noticed at 50 N applied load which was 347463.51 m/mm3 while at 20 N applied force, it was 70900.19 m/mm3. The wear rate was far higher in FSPed AA7075-T651 when 20 N force was applied which gave 14.104 mm3/m and was so minimal at 50 N force applied with a value of 2.878 mm3/m. The COF at 20 N and 50 N was 0.4568 and 0.1320 respectively. This also tells that higher loading performed better than lower loading in all instances for FSPed AA7075-T651 as also evidenced in the work reported by Asuke et al. (2014).
Fig. 8. Plots of tribological parameters

O. M. Ikumapayi et al. / Engineering Solid Mechanics 8 (2020)
263
3.3 Structural Study – XRD Analysis Results Table 6 shows the results generated from XRD analysis, the crystallite size was extracted from the data acquired and confirmed using Scherrer and Wilson Equation as represented in Eq. (6), the line broadening which is FWHM- full width at half maximum was also acquired and recorded, the d spacing was extracted from the data acquired from the highest peak of the spectrum and was confirmed using Bragg’s formula presented in Eq. (7). The micro-strain (ɛ) was calculated using equation formulated by Williamson hall as depicted in equation (8) and lastly, the dislocation density (δ) was using the formula presented in Eq. (9) (Offor et al., 2015; Pandey et al., 2017). 𝐶 = ƛ (6)
d = ƛ (7) ɛ = 𝛽𝑐𝑜𝑠𝜃4 (8)
𝛿 = 1𝐶 (9)
where = Bragg’s angle; ƛ = wavelength, n=1 and 𝛽 = FWHM. Table 6: XRD data analysis Results
Samples FWHM, (°)
Crustal Plane
2 (°)
Micro Strain (ɛ)
× 10-2
d spacing
(Å)
Dislocation density (δ) (Lines/m2)
× 1014
Crystallite size, C (nm)
AA7075-T651/17-4PH
0.240 111 39.9 5.6399 2.260 7.1491 37.4
FSPed AA7075-T651
0.213 111 38.1 5.0381 2.364 5.8912 41.2
AA7075-T651 0.180 111 38.1 4.2535 2.364 4.2164 48.7
X-ray diffraction analysis was used in this study to detect phases, crystal structure, diffraction pattern as well as evolving crystalline phases (Pandey et al., 2017). Fig. 9 shows the various structural pattern with different crystal phases embedded. There are three different samples tested as depicted in Fig. 9, unfabricated parent material – AA7075-T651 having a peak colour of red, fabricated parent material – FSPed AA7075-T651 with a peak colour of blue and also fabricated aluminium-based matrix composite – AA7075-T651/17-4PH with a peak colour of orange located at the position of in 2 values. There are common peaks to all the tested samples as noticed in Fig. 9 which are (111), (200), (220), (311) and (222) wherein the fabricated composites had some additional peaks which are (100), (110), (210), and (300) which was the effect of the reinforcing microparticles. The fabricated AA7075-T651/17-4PH possessed the lowest value of crystallite size with 37.4 nm where the dislocation density, d spacing, microstrain as well as FWHM were seen with the highest values in the fabricated AA7075-T651/17-4PH which implies that stainless steel microparticles greatly improved the structural properties of the fabricated composite over the control experiments – FSPed AA7075-T651 and the parent material – AA7075-T651 this was also in line with the work of Hao et al. (2019) and Kurgan (2014)

264
Fig. 9: XRD Pattern for the fabricated Samples
3.4 Tensile results and Fracture Surface Mechanism Table 7 shows the tensile results of the tested samples. The following parameters were measured and recorded, tensile strength, fracture force, elongation as well as ultimate tensile strength. There was an improved in mechanical properties when stainless steel was used as reinforcement in aluminium alloy 7075. Table 6 shows that AA7075-T651/17-4PH AMC has the highest tensile strength of 613.58 MPa with ultimate tensile strength (UTS) of 622.22 MPa while the parent material has a very close value with that of fabricated AMC having 620.90 MPa UTS with 570.73 MPa tensile strength. The processed parent material exhibited the least value of mechanical properties with its values having close proximity to that of the parent material. The elongation is more in AA7075-T651/17-4PH AMC with 14.30 % indicating that is more ductile than the other tested samples followed by parent material with 9.73 % while FSPed AA7075-T651 having 7.22 %. The fracture force was also more in AA7075-T651/17-4PH with a value of 25 kN this may be as a result of its UTS and tensile value. The least values in friction stir processed AA7075-T651 (without reinforcement) may be as a result of inhomogeneous stirring and mixing which is evident in the result of its fractography. The fracture parts of the tensile specimens were taken for examination under the scanning electron microscopy (SEM). The fractographic were taken, studied and reasonable conclusions were drawn out. The tested samples were the parent material (PM) – AA7075-T651 which is unprocessed sample under tensile loading ( control experiment 1), the second specimen tested was processed parent material (PPM) without reinforcement – FSPed AA7075-T651 (control experiment 2) while the last specimen subjected to tensile loading was the aluminium-based matrix

O. M. Ikumapayi et al. / Engineering Solid Mechanics 8 (2020)
265
composite (ABMC) under the influence of 17-4PH stainless steel micro-particles – AA7075-T651/17-4PH. There some factors that affect the fabrication of ABMC such as the nature of the reinforcement particles, the sizes of the reinforcement particles such as nano, micro, and macro scales, substrate used in the fabrication, volume of the reinforcement applied, as well as matrix interfacial bonding (Hao et al., 2019).
Table 7. Mechanical properties of the Tested Samples Tested Samples Tensile Strength
(MPa) Fracture Force
kN Ultimate Tensile Strength (MPa)
Elongation (%)
AA7075-T651 570.73 22.35 620.90 9.73 FSPed AA7075-T651 559.07 20.04 603.83 7.22
AA7075-T651/17-4PH 613.58 25.40 622.22 14.30 Fig. 10a-c was characterized with dimple structure which indicates that they are ductile fractures. An elongated and large dimple was noticeable in Fig. 10a with appreciable lip region at the outer boundary of the final fracture, these noticeable fibrous features are indication that the crack propagation occurred slowly (Sharma et al., 2018) while there was bimodal distribution in Fig. 10b which is more of transition from brittle to ductile nature of the material, this type of failure can be caused by impact loading of the matrix which resulted in low ductility, hence formed “Rock Candy fracture” as noticed in Fig. 10b while Fig. 10c which was reinforced with micro-particle of stainless steel has large volume of dimples-induced grain. The cracking pattern exhibited what is termed equiaxed dimples with prominent cup and cone features, typical behaviour of ductile materials and this was in conformity with the study in (Dinaharan et al., 2017b). This plastic deformation was as a result of ample load resulting to ductility behaviour of the matrix composite and this can be termed relaxation cracking with fine dimples covered the grain boundaries and this was also in conformity with study in (Ikumapayi et al., 2018). It has been established that any structural and constructional part that is capable of withstanding a load only to certain value, can either break or deform. If the deformation is visible to naked eye, that is, extensive shear lips or necking – this can be referred to as ductile fracture or yielding as depicted in Fig. 10. The constructional and structural material such as aluminium alloy 7075-T651 must be strong enough and be ductile in order to withstand any sudden, impact or shocking overload.
Fig. 10: Fractography of the tensile tests fractured surfaces (a) AA7075-T651 (b) FSPed AA7075-T651 (c) AA7075-T651/17-4PH AMC 4. Conclusion In this report, experimental analysis of fabricated aluminium-based matrix composite (ABMC) – AA7075-T651/17-4PH was studied structurally, mechanically and tribologically with reference to the parent material (PM) and processed parent material (PPM). It was established from the tribological point of view involving two different loading conditions of 20 N and 50 N applied force. The wear properties
266
have been significantly improved when the higher load of 50 N was applied as against 20 N for ABMC. The COF was greatly reduced at 50 N with 0.1168 for ABMC as against 20 N applied load with 0.4209. The wear volume (volume loss) was found to be 0.032578 mm3 at 20 N for the fabricated AA7075-T651/17-4PH ABMC and 0.011374 mm3 at 50 N which implies that less volume loss was achieved at higher load. The wear rate for the fabricated ABMC at 20 N was 10.859 mm3/m and was recorded to be 2.275 mm3/m while the wear resistance for the fabricated ABMC at 20 N applied load was 92086.66 m/mm3 and was found to be 439599.09 m/mm3 at 50 N force applied. From all indications, there exists tremendous improvement in the tribological properties of the fabricated ABMC. This scenario was also manifested at higher load than lower load for the parent material – AA7075-T651 as well as processed parent material (PPM) – FSPed AA7075-T651. The structural analysis also established that fabricated AA7075-T651/17-4PH has the lowest crystallite size of 37.4 nm followed by FSPed AA7075-T651 with 41.2 nm and lastly 48.7 nm for the parent material AA7075-T651, this shows that micro-particles of stainless steel has greatly influenced the grain refinement of the material and that ABMC has better structural integrity when compared to the control experiments. Many crystal phases were noticed on the peaks of AA7075-T651/17-4PH than what was noticed on the parent material peaks and that of the processed parent material. The Mechanical property was also noticed to be significantly improved with 613.58 MPa tensile strength and 622.22 MPa (ultimate tensile strength , UTS) for the fabricated AA7075-T651/17-4PH as against 559.07 MPa (tensile strength) and 603.83 MPa (UTS) for the processed FSPed AA7075-T651 while the parent material has 570.73 MPa tensile strength and 620.90 (UTS) which is higher than FSPed AA7075-T651. The fracture mechanism for AA7075-T651/17-4PH indicated that the fabricated ABMC was ductile having large volume of dimples-induced grain, exhibiting equiaxed dimples with prominent cup and cone features while there was brittle-ductile transition in the processed parent material – AA7075-T651/17-4PH with low ductility and Rock Candy fracture-like was noticed on the fracture surface and the parent material show elongated and large dimples with fibrous features, indicating ductility at low impact loading.
References Akbari, M., Aliha, M. R. M., Keshavarz, S. M. E., & Bonyadi, A. (2019). Effect of tool parameters on
mechanical properties, temperature, and force generation during FSW. Proceedings of the Institution of Mechanical Engineers, Part L: Journal of Materials: Design and Applications, 233(6), 1033-1043.
Akbari, M., Shojaeefard, M. H., Asadi, P., & Khalkhali, A. (2017). Hybrid multi-objective optimization of microstructural and mechanical properties of B4C/A356 composites fabricated by FSP using TOPSIS and modified NSGA-II. Transactions of Nonferrous Metals Society of China, 27(11), 2317-2333.
Aliha, M. R. M., Shahheidari, M., Bisadi, M., Akbari, M., & Hossain, S. (2016). Mechanical and metallurgical properties of dissimilar AA6061-T6 and AA7277-T6 joint made by FSW technique. The International Journal of Advanced Manufacturing Technology, 86(9-12), 2551-2565.
Asadi, P., Givi, M. B., Rastgoo, A., Akbari, M., Zakeri, V., & Rasouli, S. (2012). Predicting the grain size and hardness of AZ91/SiC nanocomposite by artificial neural networks. The International Journal of Advanced Manufacturing Technology, 63(9-12), 1095-1107.
Asuke, F., Abdulwahab, M., Aigbodion, V. S., Fayomi, O. S. I., & Aponbiede, O. (2014). Effect of load on the wear behaviour of polypropylene/carbonized bone ash particulate composite. Egyptian Journal of Basic and Applied Sciences, 1(1), 67–70.
Baruwa, A. D., Oladijo, O. P., Maledi, N., & Akinlabi, E. T. (2018). Influence of surface treatment on dry sliding wear behavior of hydrophobic silane coating on AISI 304. IOP Conference Series: Materials Science and Engineering, 423, 012158.
Behnagh, R. A., Besharati Givi, M. K., & Akbari, M. (2012). Mechanical properties, corrosion resistance, and microstructural changes during friction stir processing of 5083 aluminum rolled plates. Materials and manufacturing processes, 27(6), 636-640.
Bhaskar, K. V., Sundarrajan, S., Rao, B. S., & Ravindra, K. (2018). Effect of reinforcement and wear parameters on dry sliding wear of Aluminum composites-A review. Materials Today: Proceedings,

O. M. Ikumapayi et al. / Engineering Solid Mechanics 8 (2020)
267
5(2), 5891–5900. Boromei, I., Ceschini, L., Morri, A., & Garagnani, G. L. (2006). Friction stir weldiong of Aluminium
based composites reinforced with Al2O3 particles: Effects on microstructure. Metallurgical Science and Technology, 24(1), 12–21.
Das, H., Mondal, M., Hong, S.-T., Chun, D.-M., & Han, H. N. (2018). Joining and fabrication of metal matrix composites by friction stir welding/processing. International Journal of Precision Engineering and Manufacturing-Green Technology, 5(1), 151–172.
Deuis, R. L., Subramanian, C., & Yellup, J. M. (1997). Sliding wear of aluminum composites-A review. Composites Science and Technology, 3538(96), 415–435.
Dinaharan, I, Kalaiselvan, K., Akinlabi, E. T., & Davim, J. P. (2017a). Microstructure and wear characterization of rice husk ash reinforced copper matrix composites prepared using friction stir processing. Journal of Alloys and Compounds, 718, 150–160.
Dinaharan, I., Kalaiselvan, K., & Murugan, N. (2017b). Influence of rice husk ash particles on microstructure and tensile behavior of AA6061 aluminum matrix composites produced using friction stir processing. Composites Communications, 3, 42-46.
Erinosho, M. F., Akinlabi, E. T., Pityana, S., Owolabi, G., Park, A., Campus, K., … Africa, S. (2017). Laser surface modification of Ti6Al4V-Cu for improved microhardness and wear resistance properties. Materials Research., 20(4), 1143–1152.
Fatchurrohman, N., Farhana, N., & Marini, C. D. (2018). Investigation on the effect of Friction Stir Processing Parameters on Micro-structure and Micro-hardness of Rice Husk Ash reinforced Al6061 Metal Matrix Composites. IOP Conference Series: Materials Science and Engineering, 319(1), 0–6.
Feng, A. H., Chen, D. L., & Ma, Z. Y. (2010). Microstructure and cyclic deformation behavior of a friction-stir-welded 7075 al alloy. Metallurgical and Materials Transactions A: Physical Metallurgy and Materials Science, 41(4), 957–971.
Garcia, C., Azpilgain, Z., Aginagalde, A., Esnaola, J. A., Galdos, L., & Torca, I. (2009). Tensile behaviour of 6082 Aluminium alloy sheet under different conditions of heat treatment, temperature and strain rate. Key Engineering Materials, 423(February), 105–112.
Gerlich, A. P. (2017). Critical Assessment 25 : Friction stir processing , potential and problems Critical Assessment. Materials Science and Technology, 33(10), 1139–1144.
Hao, Z., Fu, X., Men, X., & Zhou, B. (2019). Study on tensile and fracture properties of 7050-T7451 aluminum alloy based on material forming texture characteristics. Materials Research Express, 6(3).
Huang, G., Hou, W., & Shen, Y. (2018). Evaluation of the microstructure and mechanical properties of WC particle reinforced aluminum matrix composites fabricated by friction stir processing. Materials Characterization, 138(November 2017), 26–37.
Ikumapayi, O M, Ojolo, S. J., & Afolalu, S. A. (2015). Experimental and theoretical investigation of tensile stress distribution during Aluminium wire drawing. European Scientific Journal, 11(18), 1857–7881. h
Ikumapayi, O. M., Okokpujie, I. P., Afolalu, S. A., Ajayi, O. O., Akilabi, E. T., & Bodunde, O. P. (2018). Effects of quenchants on impact strength of single-vee butt welded joint of mild steel. IOP Conference Series: Materials Science and Engineering, 391, 1–10.
Ikumapayi, OM, Akinlabi, Esther T and Majumdar, J. D. (2019a). Influence of carbonaceous agrowastes nanoparticles on physical and mechanical properties of friction stir processed AA7075-T651 metal matrix composites. Surface Topography: Metrology and Properties, 7(3), 1–17.
Ikumapayi, OM; Akinlabi, ET; Majumdar, JD; Akinlabi, S. (2019b). Characterization of high strength Aluminium – based surface matrix composite reinforced with low-cost PKSA fabricated by friction stir processing. Materials Research Express, 6, 1–27.
Ikumapayi, Omolayo M, & Akinlabi, E. T. (2019). Experimental Data on Surface Roughness and Force Feedback Analysis in Friction Stir Processed AA7075 – T651 Aluminium Metal Composites. Data in Brief, https://doi.org/10.1016/j.dib.2019.103710.
Ikumapayi, Omolayo M, Akinlabi, E. T., & Majumdar, J. D. (2018a). Review on thermal, thermo- mechanical and thermal stress distribution during friction stir welding. International Journal of Mechanical Engineering and Technology, 9(8), 534–548.

268
Ikumapayi, Omolayo M, Akinlabi, E. T., Pal, S. K., & Majumdar, J. D. (2019c). A survey on reinforcements used during friction stir processing of Aluminium metal matrix hybrid composites. Procedia Manufacturing, 35, 935–940.
Ikumapayi, Omolayo M., & Akinlabi, E. T. (2019). Efficacy of α-β Grade titanium alloy powder (Ti-6Al-2Sn-2Zr-2Mo-2Cr-0.25Si) in surface modification and corrosion mitigation in 3.5% NaCl on friction stir processed armour grade 7075-T651 aluminum alloys - Insight in defence applications. Materials Research Express, 6(7), 3–8.
Ikumapayi, Omolayo M., Oyinbo, S. T., Bodunde, O. P., Afolalu, S. A., Okokpujie, I. P., & Akinlabi, E. T. (2018b). The effects of lubricants on temperaturedistribution of 6063 aluminium alloy duringbackward cup extrusion process. Journal of Materials Research and Technology, 8(1), 1175–1187.
Jain, S., Sharma, N., & Gupta, R. (2018). Dissimilar alloys (AA6082/AA5083) joining by FSW and parametric optimization using Taguchi, grey relational and weight method. Engineering Solid Mechanics, 6(1), 51-66.
Jain, V. K. S., Muhammed, P. M., Muthukumaran, S., & Babu, S. P. K. (2018). Microstructure, mechanical and sliding wear behavior of AA5083–B4C/SiC/TiC surface composites fabricated using friction stir processing. Transactions of the Indian Institute of Metals, 71(6), 1519–1529.
Jeyaprakash, N., Yang, C., Duraiselvam, M., & Prabu, G. (2019). Microstructure and tribological evolution during laser alloying WC-12 % Co and Cr 3 C 2 − 25 % NiCr powders on nodular iron surface. Results in Physics, 12(December 2018), 1610–1620.
Johannes, L. B., & Mishra, R. S. (2007). Multiple passes of friction stir processing for the creation of superplastic 7075 aluminum. Materials Science and Engineering A, 464(1–2), 255–260.
Kishan, V., Devaraju, A., & Prasanna Lakshmi, K. (2018). Tribological properties of nano TiB2particle reinforced 6061-T6 Aluminum alloy surface composites via friction stir processing. Materials Today: Proceedings, 5(1), 1615–1619.
Koli, D. K., Agnihotri, G., & Purohit, R. (2014). A Review on Properties, Behaviour and Processing Methods for Al- Nano Al2O3 Composites. Procedia Materials Science, 6(Icmpc), 567–589.
Kubit, A., Kluz, R., Trzepieciński, T., Wydrzyński, D., & Bochnowski, W. (2018). Analysis of the mechanical properties and of micrographs of refill friction stir spot welded 7075-T6 aluminium sheets. Archives of Civil and Mechanical Engineering, 18(1), 235–244.
Kumar, K., Gulati, P., Gupta, A., & Shukla, D. K. (2017). A review of friction stir processing of aluminium alloys using different types of reinforcements. Int. J. Mech. Eng. Technol, 8(7), 1638-1651.
Kumar, P., & Wani, M. F. (2017). Friction and wear behaviour of hypereutectic Al-Si alloy / steel tribopair under dry and lubricated conditions, 15(June), 21–49.
Kundu, J., & Singh, H. (2017). Friction stir welding process: An investigation of microstructure and mechanical properties of Al Alloy AlMg4. 5Mn joint. Engineering Solid Mechanics, 5(2), 145-154.
Kurgan, N. (2014). Investigation of the effect of diffusion bonding parameters on microstructure and mechanical properties of 7075 aluminium alloy. The International Journal of Advanced Manufacturing Technology, 71(9–12), 2115–2124.
Mishra, R. S., & Ma, Z. Y. (2005). Friction stir welding and processing. Materials Science and Engineering R: Reports, 50(1–2), 1–78.
Mishra, Rajiv Sharan, De, P. S., & Kumar, N. (2014). Friction Stir Welding and Processing. https://doi.org/10.1007/978-3-319-07043-8
Mistry, J. M., & Gohil, P. P. (2017). An overview of diversified reinforcement on aluminum metal matrix composites: Tribological aspects. Proceedings of the Institution of Mechanical Engineers, Part J: Journal of Engineering Tribology, 231(3), 399–421.
Narasimharaju, S., & Sankunny, S. (2019). Microstructure and fracture behavior of friction stir lap welding of dissimilar AA 6060-T5/Pure copper. Engineering Solid Mechanics, 7(3), 217-228.
Navaneethakrishnan, T., & Ganesh, P. (2015). Effect of welding parameters on friction stir welded dissimilar aluminum alloys 7075 and 6082 with various tool pin profiles. Journal of Chemical and Pharmaceutical Sciences, 2015-April(9), 463–468.

O. M. Ikumapayi et al. / Engineering Solid Mechanics 8 (2020)
269
Offor, P. O., Okorie, B. A., Ezema, F. I., Aigbodion, V. S., & Daniel-mkpume, C. C. (2015). Synthesis and characterization of nanocrystalline zinc sulphide thin fi lms by chemical spray pyrolysis. Journal of Alloys and Compounds, 650, 381–385.
Padhy, G. K., Wu, C. S., & Gao, S. (2017). Friction stir based welding and processing technologies - processes, parameters, microstructures and applications: A review. Journal of Materials Science and Technology, 34, 1–38.
Pandey, V., Singh, J. K., Chattopadhyay, K., Srinivas, N. C. S., & Singh, V. (2017). Influence of ultrasonic shot peening on corrosion behavior of 7075 aluminum alloy. Journal of Alloys and Compounds, 723, 826–840.
Patel, V. V., Badheka, V., & Kumar, A. (2017). Effect of polygonal pin profiles on friction stir processed superplasticity of AA7075 alloy. Journal of Materials Processing Technology, 240, 68–76.
Rambabu, P., Prasad, N. E., & Kutumbarao, V. V. (2017). Aerospace materials and material technologies. https://doi.org/10.1007/978-981-10-2143-5
Rana, H. G., Badheka, V. J., & Kumar, A. (2016). Fabrication of Al7075 / B4C Surface Composite by Novel Friction Stir Processing (FSP) and Investigation on Wear Properties. Procedia Technology, 23, 519–528.
Sanusi, K. O., & Akinlabi, E. T. (2017). Friction-stir processing of a composite aluminium alloy (AA 1050) reinforced with titanium carbide powder. Materiali in Tehnologije, 51(3), 427–435.
Selvakumar, S., Dinaharan, I., Palanivel, R., & Babu, B. G. (2017). Development of stainless steel particulate reinforced AA6082 aluminum matrix composites with enhanced ductility using friction stir processing. Materials Science and Engineering A, 685(January), 317–326.
Sert, A., & Celik, O. N. (2014). Wear behavior of SiC-reinforced surface composite Al7075-T651 aluminum alloy produced using friction stir processing. Indian Journal of Engineering & Materials Sciences, 21(February), 35–43.
Shahraki, S., Khorasani, S., Behnagh, R. A., Fotouhi, Y., & Bisadi, H. (2013). Producing of AA5083/ZrO 2 nanocomposite by friction stir processing (FSP). Metallurgical and Materials Transactions B, 44(6), 1546-1553.
Sharma, A., Sharma, V. M., Sahoo, B., Joseph, J., & Paul, J. (2018). Study of nano-mechanical, electrochemical and raman spectroscopic behavior of Al6061-SiC-Graphite hybrid surface composite fabricated through friction stir processing. Journal of Composites Science, 2(32), 1–17.
Sharma, V., Prakash, U., & Kumar, B. V. M. (2015). Surface composites by friction stir processing: A review. Journal of Materials Processing Technology, 224, 117–134.
Shojaeefard, M. H., Akbari, M., Asadi, P., & Khalkhali, A. (2017). The effect of reinforcement type on the microstructure, mechanical properties, and wear resistance of A356 matrix composites produced by FSP. The International Journal of Advanced Manufacturing Technology, 91(1-4), 1391-1407.
Sudhakar, D., Jeyasimman, D., & Duraiselvam, M. (2015). Dry sliding wear behavior of Cr 3 C 2 -NiCr coating on austenitic stainless steel. International Journal Of Core Engineering & Management, 1(12), 215–225.
Sudhakar, I., Madhu, V., Madhusudhan Reddy, G., & Srinivasa Rao, K. (2015). Enhancement of wear and ballistic resistance of armour grade AA7075 aluminium alloy using friction stir processing. Defence Technology, 11(1), 10–17.
Sudhakar, I., Madhusudhan Reddy, G., & Srinivasa Rao, K. (2016). Ballistic behavior of boron carbide reinforced AA7075 aluminium alloy using friction stir processing – An experimental study and analytical approach. Defence Technology, 12(1), 25–31.
Taheri-Behrooz, F., Aliha, M. R., Maroofi, M., & Hadizadeh, V. (2018). Residual stresses measurement in the butt joint welded metals using FSW and TIG methods. Steel and Composite Structures, 28(6), 759-766.
Torabi, A. R., Kalantari, M. H., & Aliha, M. R. M. (2018). Fracture analysis of dissimilar Al‐Al friction stir welded joints under tensile/shear loading. Fatigue & Fracture of Engineering Materials & Structures, 41(9), 2040-2053.

270
Torabi, A. R., Kalantari, M. H., Aliha, M. R. M., & Ghoreishi, S. M. N. (2019). Pure mode II fracture analysis of dissimilar Al-Al and Al-Cu friction stir welded joints using the generalized MTS criterion. Theoretical and Applied Fracture Mechanics, 104, 102369.
Vasco, M., Tserpes, K., & Pantelakis, S. (2018). Numerical simulation of tensile behavior of corroded Aluminum alloy 2024 T3 considering the hydrogen embrittlement. Metals, 8(1), 56.
Vijaya Kumar, P., Madhusudhan Reddy, G., & Srinivasa Rao, K. (2015). Microstructure and pitting corrosion of armor grade AA7075 aluminum alloy friction stir weld nugget zone – Effect of post weld heat treatment and addition of boron carbide. Defence Technology, 11(2), 166–173.
© 2020 by the authors; licensee Growing Science, Canada. This is an open access article distributed under the terms and conditions of the Creative Commons Attribution (CC-BY) license (http://creativecommons.org/licenses/by/4.0/).
54
3 CHAPTER 3: PEER-REVIEWED/SCOPUS-INDEXED CONFERENCES
3.1 INTRODUCTION
This chapter contains all the published, accepted and submitted peer-reviewed conferences that are
indexed in Scopus; this encompasses both international and local conferences, together with their
respective conference proceedings, which are attached herewith in this chapter. The conference
papers attached here were written, based on the conference guidelines to authors and conference
templates. A short summary of each article is presented at the beginning of each section – before
the insertion of each conference paper, as a means of introducing the work carried out. It is
pertinent to mention that the author of this thesis, under supervision, carried out all the
experiments; and he authorised the write-up of the manuscripts presented in this chapter, as
reflected in each of the conference proceedings.

55
3.2 ARTICLE I
A survey on the reinforcements used in the friction stir processing of
aluminium-metal matrix and the hybrid composites.
Presented at the 2nd International Conference on Sustainable Materials Processing and
Manufacturing (SMPM), March 2019 at Northwest, South Africa
Published in Procedia Manufacturing, 2019, Vol 35, Page 935 - 940
https://doi.org/10.1016/j.promfg.2019.06.039 ,
ISSN Online: 2351-9789
In this survey work, the process parameters used in the friction stir processing of aluminium- metal
matrix and hybrid composites (AMMHCs), which encompassed the reinforcements, were
summarised. The different reinforcements used, the types of dimensions in the microchannels that
accommodate the particles were defined. The tool design and tool geometry, as well as the plate
dimensions and their respective findings were documented. In this review, the different types of
aluminium matrix used with different reinforcements were captured. The optimum processing
parameters and the type of tool designed that gave the best results were summarized.
It was revealed that the paramount tools used in the aluminium matrix composites (AMC) were
found to be H-13 steel tool and HCHCr steel. Both the threaded and the unthreaded processing
tools were used by different authors, which gave rise to the enhanced properties at different
parameters. Two categories of reinforcement powders were studied in this review, both organic
which comprises agrowaste powders and inorganic powders (i.e. metallic powders). This review

56
has shown that less attention has been given to the usage of inorganic powders in the processing
of metals, especially during friction stir processing. In the past, the attention of the researchers was
on the use of metallic powders; but recent research findings have shown that agrowaste powders
could also be used as promising alternative reinforcements in FSP; because they are readily
available, are not hazardous or harmful to the user, environmentally friendly, and very cheap. In
this survey, many authors highlighted the main reasons for fabricating AMMHCs; and it was
established to possess remarkable mechanical and metallurgical characteristics in terms of surface
modification, improved hardness, wear and corrosion resistance, mechanical strength, damping,
and creep behaviour, and many more. This published conference article has been able to address
some of the objectives of the study especially those in item I to IV.
ScienceDirect
Available online at www.sciencedirect.com
Procedia Manufacturing 35 (2019) 935–940
2351-9789 © 2019 The Authors. Published by Elsevier B.V.Peer-review under responsibility of the organizing committee of SMPM 2019.10.1016/j.promfg.2019.06.039
10.1016/j.promfg.2019.06.039 2351-9789
© 2019 The Authors. Published by Elsevier B.V.Peer-review under responsibility of the organizing committee of SMPM 2019.
Available online at www.sciencedirect.com
ScienceDirect Procedia Manufacturing 00 (2019) 000–000
www.elsevier.com/locate/procedia
2351-9789 © 2019 The Authors. Published by Elsevier B.V. Peer-review under responsibility of the organizing committee of SMPM 2019.
* Corresponding author. Tel.: +27838098288; E-mail address: [email protected]
2nd International Conference on Sustainable Materials Processing and Manufacturing
(SMPM 2019)
A survey on reinforcements used in friction stir processing of aluminium metal matrix and hybrid composites
Omolayo M. Ikumapayia*, Esther T. Akinlabib,e, Surjya K. Palc, Jyotsna D. Majumdard a, b Department of Mechanical Engineering Science, University of Johannesburg, 2006, South Africa
c Department of Mechanical Engineering, Indian Institute of Technology, Kharagpur, INDIA d Department of Metallurgical and Materials Engineering, Indian Institute of Technology, Kharagpur, INDIA
e Department of Mechanical Engineering, Covenant University, Ota, Nigeria
Abstract
Aluminium metal matrix and hybrid composites (AMMHCs) are new materials used in recent time that have the capacity to meet the demand of advancement in processing applications. Several types of reinforcement have been used since the inception of friction stir processing (FSP). The most widely used reinforcing material is inorganic (metallic) powders such as silicon carbide, titanium alloy, graphene, iron , stainless steel, nitrides, oxides etc and fewer works have been reported on organic powders (i.e. bioprocessing using agro-wastes powders) such as fly ash, palm kernel shell ash, coconut shell ash, rice husk ash etc. Many researchers have established the roles of reinforcements in the modification of surface and texture of the reinforced metal matrix or hybrid composite material and how it enhanced the mechanical and metallurgical properties of the materials via intense, localized plastic deformation compare to the base material. FSP has advantages over other manufacturing processes in a way that it reduces defects and distortions in the material. FSP alters the physical properties of the base material without altering its physical state, this helps engineers develop attributes such as “high-state-rate superplasticity”. The grain refinement occurs on the parent material which improves the properties of the first material while mixing with the second material (reinforcement). Subsequently, allows a variety of properties to be altered and this, in turn, improves its surface modification. The survey is aimed at reviewing different combination and diversified reinforcement particulates employed in the processing of composites of aluminium metal matrix and hybrid and how it enhanced the chemical, mechanical and metallurgical efficacy of the materials. It is very much needed to have a consolidated information about the different reinforcement phases, preparation of the microchannel (groove) that accommodates the reinforcements, its dimensions and various tools geometry that have been used in the past demonstrating the optimum processing results. Keywords: Aluminium Metal Matrix, Hybrid Composites, Friction Stir Processing, Reinforcement Phases
1. Introduction
Aluminium metal matrix and hybrid composites (AMMHCs) are widely used composites in the areas like aerospace, ballistic, electrical, aviation, tribological, space and air vehicle, automotive, thermal, structure, defense

936 Omolayo M. Ikumapayi et al. / Procedia Manufacturing 35 (2019) 935–9402 Ikumapayi Omolayo et al. / Procedia Manufacturing 00 (2019) 000–000
industries, military, transportation, engineering and mineral processing applications because of their excellent and unbeatable combination of composites properties such as high strength-to-weight ratio, good corrosion, oxidation and wear resistance, high fatigue strength, low coefficient thermal expansion, high thermal and electrical conductivity, superior damping capacities, high specific stiffness and strength, creep resistance, and high plastic flow strength[1], [2].
Notwithstanding, aluminium alloys in isolation still suffer poor tribological properties and this can be overcome by the application of hard reinforcement phases in form of particles. Reinforcement particles provide AMMHCs materials a better strengthening at a lower cost, especially when using bioprocessing powder reinforcements. It has been established that favorable ductility in the metallic matrix materials would be maintained at the same time increased the modulus and the strength of the composites due to the reinforcement phase applied [3]. There two major categories of reinforcement; it can either be ex-situ or in situ. Ex situ is a way of synthesis route of adding reinforcement to the liquid or powdered metal, while the in situ method reinforcement compounds by reaction are formed during processing such as using reactive gases[4].
FSP is a novel processing technique derived from Friction Stir Welding (FSW) in which microchannel or groove that will accommodate the reinforcement phases may or may not be made on the matrix material[5]. FSP has become known across many industries for its potential to manufacture good AMMHCs in the solid state. It is facile, update and cost-effective to prepare AMMHCs using FSP [6]. Benefits of FSP include grain refinement, homogeneity of the processed zone, densification, and homogenization of precipitates of aluminum alloys and composites materials [7]. FSP has been established for improvement of the surface properties of the metal alloys, improvement in ductility, formability, hardness and strength as well as increase the fatigue life without altering the bulk metal properties[8]. In order to improve the surface quality by FSP, some challenges are encountered during the process of reinforcing the composite materials such as tool wear, sticking of the substrate to the backing plate especially when the job is in thickness between 1mm to 2mm, challenge on how to improve fatigue property and joining strength, many optimizations may be required to obtain optimum parameters and this may lead to the usage of many materials[9].
The fabrication and development of surface and bulk composites of aluminium substrate have been made possible by a novel technique via FSP. FSP as a solid-state processing method has significant advantages over conventional metalworking processing technique. It has proven to have a short-route, homogeneity and refined microstructures as well as densification. It is worth mentioned that mechanical and metallurgical properties of the processed zone can be controlled via the optimization of tool geometry such as shoulder diameter, probe length, probe profile, groove dimensions (width and depth) , and processing parameters such as rotational speed, travel speed, plunge rate, heat input, and cooling/heating methods[10]–[15]. The Schematic of a typical FSP shown in Figure 1 demonstrated how the microchannel (groove) is being packed with reinforcement phase in Figure 1a and the use of pinless tool in Figure 1c to compact the powder inside the groove thereafter a tool with pin as shown in Fig 1d is used to process the surface by the application of optimum process parameters. The schematic diagram of FSP showing advancing and retreating side is as depicted in Figure 2 and the compacting (pinless) and the stirring tool pin profiles are shown in Figure 3. The flowchart of the process parameters used in FSP is shown in Figure 4. Tables 1 and 2 show the use of reinforcements using powder metallurgy (PM) and agro-waste powder (AP) during FSP. The calculations of the proportion of the groove to the second phase materials are as shown in equation 1 to 3 [16].

Omolayo M. Ikumapayi et al. / Procedia Manufacturing 35 (2019) 935–940 937 Ikumapayi Omolayo et al. / Procedia Manufacturing 00 (2019) 000–000 3
Figure 1: Schematic of a typical FSP Figure 2: Schematic of FSP showing Advancing and Retreating Side
Figure 3: FSP Tool (a) For Compartment (b) For Stirring Figure 4: Flowchart of Process Variables used in FSP Table1: Powder Metallurgy reinforcements based FSP
Types of Al and Dimensions
Tool Geometry Reinforcement Particles
Groove Dimension
Process Parameters & Conclusions
Findings Ref.
AA6082/Ceramic AMC & AA6082/SS AMC (100mmx50mmx10mm)
Cutting tool of threaded pin profile made of High carbon high chromium steel , having 18mm Shoulder diameter and Pin diameter(5mm & 6mm) Pin length(5.5mm & 5.8mm)
Ceramic particles, of different grades like SiC, Al2O3, TiC, B4C and WC (18% vol) & Stainless Steel (316L) with (0, 6, 12 and 18 vol%) SS
Depth= 5mm and width=1.2mm
RS = 1600 rpm; TS=60mm/min Axial force=10 kN.
Superior hardness and wear resistance ; Fine grain and enhanced tensile strength
[6], [20]
AA1050/TiC (200mm×160mm×3mm)
H13 tool steel and hardened to 52 HRC
Titanium Carbide (TiC)
V-groove of about 5 mm width
RS =1200 min–1 ; 1600 min–1 TS= (100, 200 and 300) mm/min
Improved and Enhanced Hardness and Increased wear resistance
[7]
AA5083 (50 x 80 x 6mm3)
Taper threaded pin and Pinless was used with 18 mm Shoulder diameter and 6mm of Pin diameter and also 4mm Pin length
B4C/SiC/TiC
Depth= 2.5 mm and width=1 mm
Pinless (RS=800rpm, TS=40mm/min) Pin(RS=600rpm, TS=20mm/min)
Improved hardness, tensile and wear properties
[18]
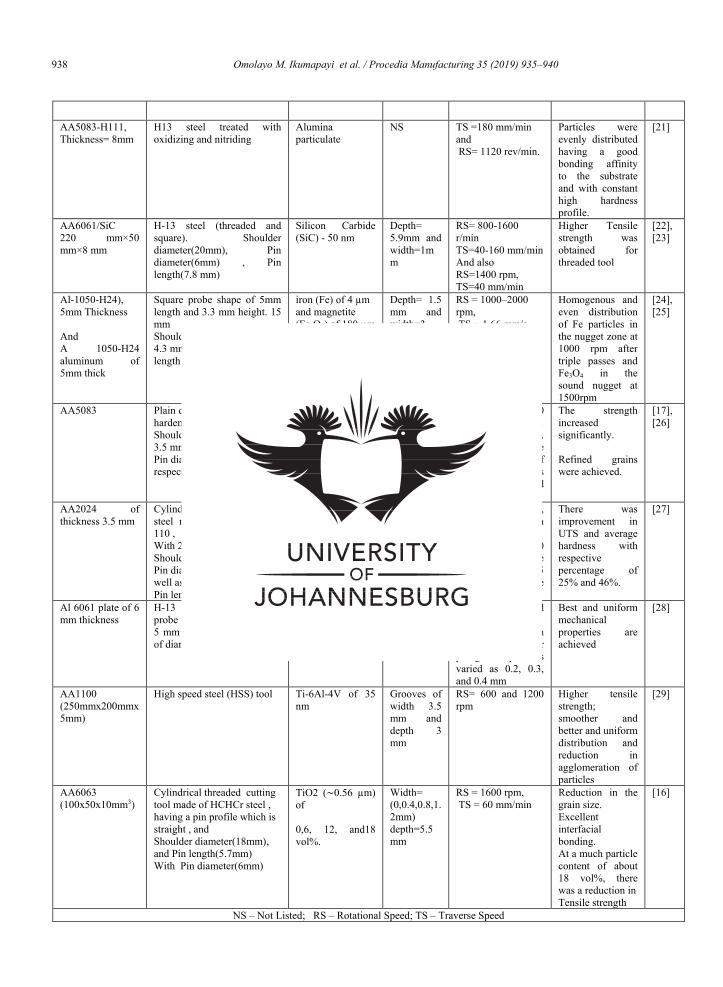
938 Omolayo M. Ikumapayi et al. / Procedia Manufacturing 35 (2019) 935–9404 Ikumapayi Omolayo et al. / Procedia Manufacturing 00 (2019) 000–000
AA5083-H111, Thickness= 8mm
H13 steel treated with oxidizing and nitriding
Alumina particulate
NS TS =180 mm/min and RS= 1120 rev/min.
Particles were evenly distributed having a good bonding affinity to the substrate and with constant high hardness profile.
[21]
AA6061/SiC 220 mm×50 mm×8 mm
H-13 steel (threaded and square). Shoulder diameter(20mm), Pin diameter(6mm) , Pin length(7.8 mm)
Silicon Carbide (SiC) - 50 nm
Depth= 5.9mm and width=1mm
RS= 800-1600 r/min TS=40-160 mm/min And also RS=1400 rpm, TS=40 mm/min
Higher Tensile strength was obtained for threaded tool
[22], [23]
Al-1050-H24), 5mm Thickness And A 1050-H24 aluminum of 5mm thick
Square probe shape of 5mm length and 3.3 mm height. 15 mm Shoulder diameter; 6mm and 4.3 mm Pin diameter and Pin length respectively
iron (Fe) of 4 µm and magnetite (Fe3O4) of 180 µm particles and SiC and Al2O3 particles 1.25 mm
Depth= 1.5 mm and width=3 mm
RS = 1000–2000 rpm, TS = 1.66 mm/s
Homogenous and even distribution of Fe particles in the nugget zone at 1000 rpm after triple passes and Fe3O4 in the sound nugget at 1500rpm
[24], [25]
AA5083 Plain cylindrical tool made of hardened steel. 15mm of Shoulder diameter; 5mm and 3.5 mm dimensions for Pin diameter and Pin length respectively
Ni particles of 20 μm. And Cu particles
Depth= 2 mm and width=1 mm; Length= 50mm
RS= 1000 – 1800 rpm while TS= 0.1 – 0.5 mm/s. Optimum were traverse speed of 0.4 mm/s as well as Rotation speed of1200 rpm
The strength increased significantly. Refined grains were achieved.
[17], [26]
AA2024 of thickness 3.5 mm
Cylindrical shape of tool steel made of Hardened K-110 , With 25 mm and 8 mm for Shoulder diameter and Pin diameter respectively as well as 2.5 mm Pin length
Al2O3 of 30 nm nanoparticles
Depth= 2 mm and width=3 mm
RS= 900, 1120, 1400, to 1800 rpm and TS = 10, 15, and 20 mm/min, dwell time of 2 s as well as 0.5 mm/s of plunge speed
There was improvement in UTS and average hardness with respective percentage of 25% and 46%.
[27]
Al 6061 plate of 6 mm thickness
H-13 Steel with a square probe tool of pin dimensions 5 mm X 5 mm and shoulder of diameter 25 mm
SiC and Graphite powder of ∼100 and ∼44 µm, respectively
Grooves of 2mm X 3 mm
RS=1800, 2200, and 2500 rpm, TS= 25 mm/ min and Shoulder plunge depth is varied as 0.2, 0.3, and 0.4 mm
Best and uniform mechanical properties are achieved
[28]
AA1100 (250mmx200mmx5mm)
High speed steel (HSS) tool Ti-6Al-4V of 35 nm
Grooves of width 3.5 mm and depth 3 mm
RS= 600 and 1200 rpm
Higher tensile strength; smoother and better and uniform distribution and reduction in agglomeration of particles
[29]
AA6063 (100x50x10mm3)
Cylindrical threaded cutting tool made of HCHCr steel , having a pin profile which is straight , and Shoulder diameter(18mm), and Pin length(5.7mm) With Pin diameter(6mm)
TiO2 (∼0.56 µm) of 0,6, 12, and18 vol%.
Width= (0,0.4,0.8,1.2mm) depth=5.5 mm
RS = 1600 rpm, TS = 60 mm/min
Reduction in the grain size. Excellent interfacial bonding. At a much particle content of about 18 vol%, there was a reduction in Tensile strength
[16]
NS – Not Listed; RS – Rotational Speed; TS – Traverse Speed
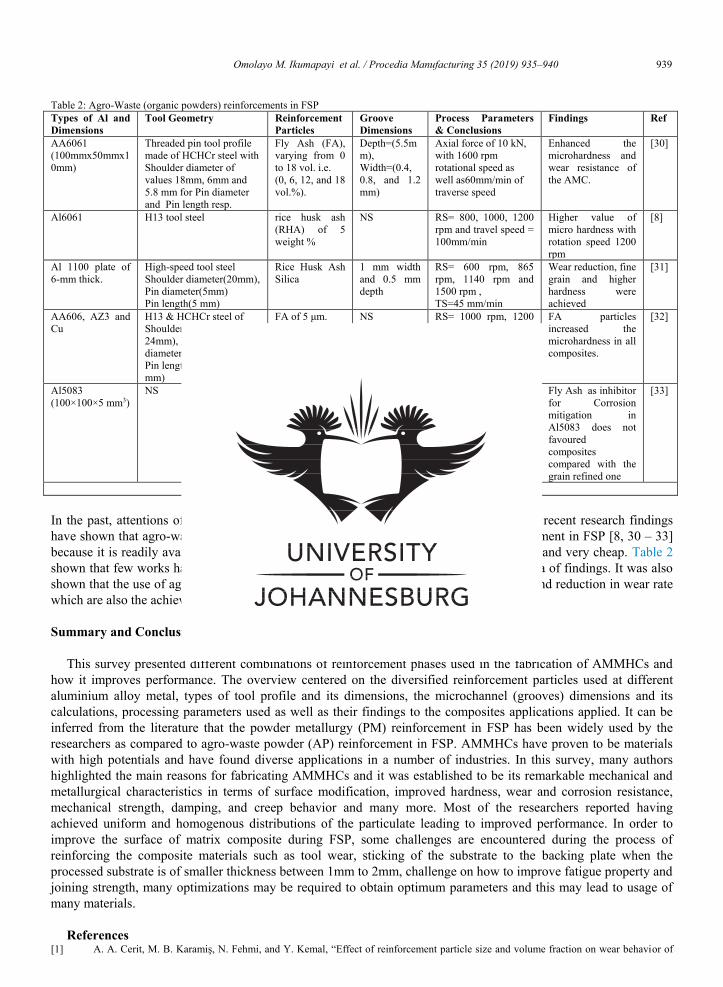
Omolayo M. Ikumapayi et al. / Procedia Manufacturing 35 (2019) 935–940 9394 Ikumapayi Omolayo et al. / Procedia Manufacturing 00 (2019) 000–000
AA5083-H111, Thickness= 8mm
H13 steel treated with oxidizing and nitriding
Alumina particulate
NS TS =180 mm/min and RS= 1120 rev/min.
Particles were evenly distributed having a good bonding affinity to the substrate and with constant high hardness profile.
[21]
AA6061/SiC 220 mm×50 mm×8 mm
H-13 steel (threaded and square). Shoulder diameter(20mm), Pin diameter(6mm) , Pin length(7.8 mm)
Silicon Carbide (SiC) - 50 nm
Depth= 5.9mm and width=1mm
RS= 800-1600 r/min TS=40-160 mm/min And also RS=1400 rpm, TS=40 mm/min
Higher Tensile strength was obtained for threaded tool
[22], [23]
Al-1050-H24), 5mm Thickness And A 1050-H24 aluminum of 5mm thick
Square probe shape of 5mm length and 3.3 mm height. 15 mm Shoulder diameter; 6mm and 4.3 mm Pin diameter and Pin length respectively
iron (Fe) of 4 µm and magnetite (Fe3O4) of 180 µm particles and SiC and Al2O3 particles 1.25 mm
Depth= 1.5 mm and width=3 mm
RS = 1000–2000 rpm, TS = 1.66 mm/s
Homogenous and even distribution of Fe particles in the nugget zone at 1000 rpm after triple passes and Fe3O4 in the sound nugget at 1500rpm
[24], [25]
AA5083 Plain cylindrical tool made of hardened steel. 15mm of Shoulder diameter; 5mm and 3.5 mm dimensions for Pin diameter and Pin length respectively
Ni particles of 20 μm. And Cu particles
Depth= 2 mm and width=1 mm; Length= 50mm
RS= 1000 – 1800 rpm while TS= 0.1 – 0.5 mm/s. Optimum were traverse speed of 0.4 mm/s as well as Rotation speed of1200 rpm
The strength increased significantly. Refined grains were achieved.
[17], [26]
AA2024 of thickness 3.5 mm
Cylindrical shape of tool steel made of Hardened K-110 , With 25 mm and 8 mm for Shoulder diameter and Pin diameter respectively as well as 2.5 mm Pin length
Al2O3 of 30 nm nanoparticles
Depth= 2 mm and width=3 mm
RS= 900, 1120, 1400, to 1800 rpm and TS = 10, 15, and 20 mm/min, dwell time of 2 s as well as 0.5 mm/s of plunge speed
There was improvement in UTS and average hardness with respective percentage of 25% and 46%.
[27]
Al 6061 plate of 6 mm thickness
H-13 Steel with a square probe tool of pin dimensions 5 mm X 5 mm and shoulder of diameter 25 mm
SiC and Graphite powder of ∼100 and ∼44 µm, respectively
Grooves of 2mm X 3 mm
RS=1800, 2200, and 2500 rpm, TS= 25 mm/ min and Shoulder plunge depth is varied as 0.2, 0.3, and 0.4 mm
Best and uniform mechanical properties are achieved
[28]
AA1100 (250mmx200mmx5mm)
High speed steel (HSS) tool Ti-6Al-4V of 35 nm
Grooves of width 3.5 mm and depth 3 mm
RS= 600 and 1200 rpm
Higher tensile strength; smoother and better and uniform distribution and reduction in agglomeration of particles
[29]
AA6063 (100x50x10mm3)
Cylindrical threaded cutting tool made of HCHCr steel , having a pin profile which is straight , and Shoulder diameter(18mm), and Pin length(5.7mm) With Pin diameter(6mm)
TiO2 (∼0.56 µm) of 0,6, 12, and18 vol%.
Width= (0,0.4,0.8,1.2mm) depth=5.5 mm
RS = 1600 rpm, TS = 60 mm/min
Reduction in the grain size. Excellent interfacial bonding. At a much particle content of about 18 vol%, there was a reduction in Tensile strength
[16]
NS – Not Listed; RS – Rotational Speed; TS – Traverse Speed
Ikumapayi Omolayo et al. / Procedia Manufacturing 00 (2019) 000–000 5
Table 2: Agro-Waste (organic powders) reinforcements in FSP Types of Al and Dimensions
Tool Geometry Reinforcement Particles
Groove Dimensions
Process Parameters & Conclusions
Findings Ref
AA6061 (100mmx50mmx10mm)
Threaded pin tool profile made of HCHCr steel with Shoulder diameter of values 18mm, 6mm and 5.8 mm for Pin diameter and Pin length resp.
Fly Ash (FA), varying from 0 to 18 vol. i.e. (0, 6, 12, and 18 vol.%).
Depth=(5.5mm), Width=(0.4, 0.8, and 1.2 mm)
Axial force of 10 kN, with 1600 rpm rotational speed as well as60mm/min of traverse speed
Enhanced the microhardness and wear resistance of the AMC.
[30]
Al6061 H13 tool steel rice husk ash (RHA) of 5 weight %
NS RS= 800, 1000, 1200 rpm and travel speed = 100mm/min
Higher value of micro hardness with rotation speed 1200 rpm
[8]
Al 1100 plate of 6-mm thick.
High-speed tool steel Shoulder diameter(20mm), Pin diameter(5mm) Pin length(5 mm)
Rice Husk Ash Silica
1 mm width and 0.5 mm depth
RS= 600 rpm, 865 rpm, 1140 rpm and 1500 rpm , TS=45 mm/min
Wear reduction, fine grain and higher hardness were achieved
[31]
AA606, AZ3 and Cu
H13 & HCHCr steel of Shoulder diameter(18 & 24mm), Pin diameter(6mm) Pin length(4.5, 5 & 5.8 mm)
FA of 5 μm. NS RS= 1000 rpm, 1200 rpm, 1600 rpm and TS=40 , 60 mm/min
FA particles increased the microhardness in all composites.
[32]
Al5083 (100×100×5 mm3)
NS fly ash powder Grooves dimensions of width 1 mm and depth of 2 mm
RS= 1100 rpm, 1400 rpm, 1800 rpm and TS=20 , 25 mm/min Optimum at RS=1400rpm and TS=25mm/min
Fly Ash as inhibitor for Corrosion mitigation in Al5083 does not favoured composites compared with the grain refined one
[33]
NS – Not Listed; RS – Rotational Speed; TS – Traverse Speed
In the past, attentions of the researchers have been on the use of metallic powders but of recent research findings have shown that agro-waste powders could also be used as promising alternative reinforcement in FSP [8, 30 – 33] because it is readily available, not hazardous or harmful to user, environmentally friendly, and very cheap. Table 2 shown that few works have been done in the use of agro-waste powders since is a new area of findings. It was also shown that the use of agro-wastes such as fly ash and rice husk, enhanced microhardness and reduction in wear rate which are also the achievements of metallic powders.
Summary and Conclusions:
This survey presented different combinations of reinforcement phases used in the fabrication of AMMHCs and how it improves performance. The overview centered on the diversified reinforcement particles used at different aluminium alloy metal, types of tool profile and its dimensions, the microchannel (grooves) dimensions and its calculations, processing parameters used as well as their findings to the composites applications applied. It can be inferred from the literature that the powder metallurgy (PM) reinforcement in FSP has been widely used by the researchers as compared to agro-waste powder (AP) reinforcement in FSP. AMMHCs have proven to be materials with high potentials and have found diverse applications in a number of industries. In this survey, many authors highlighted the main reasons for fabricating AMMHCs and it was established to be its remarkable mechanical and metallurgical characteristics in terms of surface modification, improved hardness, wear and corrosion resistance, mechanical strength, damping, and creep behavior and many more. Most of the researchers reported having achieved uniform and homogenous distributions of the particulate leading to improved performance. In order to improve the surface of matrix composite during FSP, some challenges are encountered during the process of reinforcing the composite materials such as tool wear, sticking of the substrate to the backing plate when the processed substrate is of smaller thickness between 1mm to 2mm, challenge on how to improve fatigue property and joining strength, many optimizations may be required to obtain optimum parameters and this may lead to usage of many materials.
References
[1] A. A. Cerit, M. B. Karamiş, N. Fehmi, and Y. Kemal, “Effect of reinforcement particle size and volume fraction on wear behavior of
940 Omolayo M. Ikumapayi et al. / Procedia Manufacturing 35 (2019) 935–9406 Ikumapayi Omolayo et al. / Procedia Manufacturing 00 (2019) 000–000
metal matrix composites,” Tribol. Ind., vol. 30, no. 3–4, pp. 31–36, 2008. [2] D. N.Sun and Apelian, “Friction Stir Processing of Aluminum Cast Alloys for High-Performance Applications,” Alum. Form., pp. 44–
50, 2011. [3] R. M. Miranda, T. G. Santos, J. Gandra, N. Lopes, and R. J. C. Silva, “Reinforcement strategies for producing functionally graded
materials by friction stir processing in aluminium alloys,” J. Mater. Process. Technol., vol. 213, no. 9, pp. 1609–1615, 2013. [4] R. Casati and M. Vedani, “Metal Matrix Composites Reinforced by Nano-Particles—A Review,” Metals (Basel)., vol. 4, no. 1, pp. 65–
83, 2014. [5] Sudhakar.M; Srinivasa Rao.CH; Meera Saheb.K, “Production of Surface Composites by Friction Stir Processing,” Mater. Today Proc.,
vol. 5, no. 1, pp. 929–935, 2018. [6] I. Dinaharan, “Influence of ceramic particulate type on microstructure and tensile strength of aluminum matrix composites produced
using friction stir processing,” J. Asian Ceram. Soc., vol. 4, no. 2, pp. 209–218, 2016. [7] K. O. Sanusi and E. T. Akinlabi, “Friction-stir processing of a composite aluminium alloy (AA 1050) reinforced with titanium carbide
powder,” Mater. Tehnol., vol. 51, no. 3, pp. 427–435, 2017. [8] N. Fatchurrohman, N. Farhana, and C. D. Marini, “Investigation on the effect of Friction Stir Processing Parameters on Micro-structure
and Micro-hardness of Rice Husk Ash reinforced Al6061 Metal Matrix Composites,” IOP Conf. Ser. Mater. Sci. Eng., vol. 319, no. 1, pp. 0–6, 2018.
[9] Y. X. Gan, D. Solomon, and M. Reinbolt, “Friction stir processing of particle reinforced composite materials,” Materials (Basel)., vol. 3, no. 1, pp. 329–350, 2010.
[10] K. Kumar, P. Gulati, A. Gupta, and D. K. Shukla, “A review of friction stir processing of aluminium alloys using different types of reinforcements,” Int. J. Mech. Eng. Technol., vol. 8, no. 7, pp. 1638–1651, 2017.
[11] D. K. Koli, G. Agnihotri, and R. Purohit, “A Review on Properties, Behaviour and Processing Methods for Al- Nano Al2O3 Composites,” Procedia Mater. Sci., vol. 6, no. Icmpc, pp. 567–589, 2014.
[12] V. Sharma, U. Prakash, and B. V. M. Kumar, “Surface composites by friction stir processing: A review,” J. Mater. Process. Technol., vol. 224, pp. 117–134, 2015.
[13] H. Das, M. Mondal, S.-T. Hong, D.-M. Chun, and H. N. Han, “Joining and fabrication of metal matrix composites by friction stir welding/processing,” Int. J. Precis. Eng. Manuf. Technol., vol. 5, no. 1, pp. 151–172, 2018.
[14] R. S. Mishra and Z. Y. Ma, “Friction stir welding and processing,” Mater. Sci. Eng. R Reports, vol. 50, no. 1–2, pp. 1–78, 2005. [15] O. M. Ikumapayi, E. T. Akinlabi, and J. D. Majumdar, “Review On Thermal , Thermo- Mechanical And Thermal Stress Distribution
During Friction Stir Welding,” Int. J. Mech. Eng. Technol., vol. 9, no. 8, pp. 534–548, 2018. [16] S. Joyson, A. Isaac, D. Jebaraj, D. Raja, S. Esther, and T. Akinlabi, “Microstructural Characterization and Tensile Behavior of Rutile (
TiO2 ) - Microstructural Characterization and Tensile Behavior of Rutile ( TiO 2 ) - Reinforced AA6063 Aluminum Matrix Composites Prepared by Friction Stir Processing,” Acta Metall. Sin. (English Lett., no. August, pp. 1–12, 2018.
[17] M. Zohoor, M. K. Besharati Givi, and P. Salami, “Effect of processing parameters on fabrication of Al-Mg/Cu composites via friction stir processing,” Mater. Des., vol. 39, pp. 358–365, 2012.
[18] V. K. S. Jain, P. M. Muhammed, S. Muthukumaran, and S. P. K. Babu, “Microstructure, Mechanical and Sliding Wear Behavior of AA5083–B4C/SiC/TiC Surface Composites Fabricated Using Friction Stir Processing,” Trans. Indian Inst. Met., vol. 71, no. 6, pp. 1519–1529, 2018.
[19] M. R. R. P. Pramod Ramakrishnan, “Influences Of Various Process Parameters On Friction Stir Processing Zone In Aluminium Alloys,” Int. J. Des. Manuf. Technol., vol. 5, no. 3, pp. 167–177, 2014.
[20] S. Selvakumar, I. Dinaharan, R. Palanivel, and B. G. Babu, “Development of stainless steel particulate reinforced AA6082 aluminum matrix composites with enhanced ductility using friction stir processing,” Mater. Sci. Eng. A, vol. 685, no. January, pp. 317–326, 2017.
[21] V. Sharma, U. Prakash, and B. V. M. Kumar, “Surface reinforcement of AA5083-H111 by friction stir processing assisted by electrical current,” J. Mater. Process. Tech., vol. 224, pp. 117–134, 2015.
[22] M. Salehi, M. Saadatmand, and J. Aghazadeh Mohandesi, “Optimization of process parameters for producing AA6061/SiC nanocomposites by friction stir processing,” Trans. Nonferrous Met. Soc. China (English Ed., vol. 22, no. 5, pp. 1055–1063, 2012.
[23] S. Rathee, S. Maheshwari, A. N. Siddiquee, and M. Srivastava, “Effect of tool plunge depth on reinforcement particles distribution in surface composite fabrication via friction stir processing,” Def. Technol., vol. 13, no. 2, pp. 86–91, 2017.
[24] E. R. I. Mahmoud and M. M. Tash, “Characterization of aluminum-based-surface matrix composites with iron and iron oxide fabricated by friction stir processing,” Materials (Basel)., vol. 9, no. 7, 2016.
[25] S. G. N. V. Sairam and S. Madhu, “A review on friction stir processing on aluminum based materilas,” Int. J. Appl. Eng. Res., vol. 10, no. 33, pp. 25462–25467, 2015.
[26] R. Bauri, G. D. Janaki Ram, D. Yadav, and C. N. Shyam Kumar, “Effect of Process Parameters and Tool Geometry on Fabrication of Ni Particles Reinforced 5083 Al Composite by Friction Stir Processing,” Mater. Today Proc., vol. 2, no. 4–5, pp. 3203–3211, 2015.
[27] E. Moustafa, “Effect of Multi-Pass Friction Stir Processing on Mechanical Properties for AA2024/Al2O3 Nanocomposites,” Materials (Basel)., vol. 10, no. 9, p. 1053, 2017.
[28] A. Sharma, V. M. Sharma, S. Mewar, S. K. Pal, and J. Paul, “Friction stir processing of Al6061-SiC-graphite hybrid surface composites,” Mater. Manuf. Process., vol. 33, no. 7, pp. 795–804, 2018.
[29] Adedotun Adetunda and Esther Akinlabi, “Mechanical characterization of Al/Ti-6Al-4V surface composite fabricated via FSP: A comparison of tool geometry and number of passes,” Mater. Res. Express, pp. 1–21, 2018.
[30] I. Dinaharan, R. Nelson, S. J. Vijay, and E. T. Akinlabi, “Microstructure and wear characterization of aluminum matrix composites reinforced with industrial waste fly ash particulates synthesized by friction stir processing,” Mater. Charact., vol. 118, pp. 149–158, 2016.
[31] H. Zuhailawati, M. N. Halmy, I. P. Almanar, A. A. Seman, and B. K. Dhindaw, “International Journal of Mechanical Properties of Friction Stir Processed 1100 Aluminum Reinforced with Rice Husk Ash Silica at Different Rotational Speeds,” Int. J. Metall. Mater. Eng., vol. 2, no. 120, pp. 1–6, 2016.
[32] I. Dinaharan and E. T. Akinlabi, “Low cost metal matrix composites based on aluminum, magnesium and copper reinforced with fly ash prepared using friction stir processing,” Compos. Commun., vol. 9, no. April, pp. 22–26, 2018.
[33] G. V. N. B. Prabhakar, N. R. Kumar, and B. R. Sunil, “Surface metal matrix composites of Al5083 - fly ash produced by friction stir processing,” Mater. Today Proc., vol. 5, no. 2, pp. 8391–8397, 2018.

57
3.3 ARTICLE II
Recent advances in Keyhole Defect Repairs via Refilling Friction Stir Spot
Welding
Presented at the 9th International Conference on Materials Processing and Characterization
(ICMPC) March 2019 at Griet, Hyderabad, India
Published in Materials Today: Proceedings 18 (2019) 2201–2208
https://doi.org/1016/j.matpr.2019.06.663
ISSN: 2214-7853
A review on keyhole defects repaired in friction stir spot welding (FSSW), friction stir welding
(FSW) and friction stir processing (FSP) were studied. The effects of the refilling of the keyhole
were examined on aluminium, magnesium and steel etc. This keyhole has been regarded as the
way to study the defects in FSSW, FSP and FSW. In order to ensure a defect-free zone, there is a
need to repair this defect. Several methods were reviewed to refill and eliminate these keyhole
defects. The following techniques, or methods, were used in the past by various researchers to fill
and refill the keyhole defects, such as Refill friction stir spot welding (RFSSW), the Pinless FSSW,
the Swing FSSW, the use of non-consumable and semi-consumable tools; the use of friction-plug
welding; the use of the Auto-adjustable pin method: (a) Friction-tapper plug welding; FTPW; (b)
Friction-hydro pillar processing; FHPP; (c) Self-refilling friction stir welding (SRFSW), (d)
Intermediate layer friction stir spot welding (IL-FSSW). It was established that all these techniques
gave good and improved mechanical properties, such as improved strength, smooth appearance,

58
high fatigue strength and reduction in material loss, after the refilling parts were cut and tested.
From the totality of the review and the discussions, it may be concluded that RFSSW is the superior
method to use in the repair of keyhole defects in FSSW, FSW and FSP.
The RFSSW has been found to have better mechanical properties, better hardness values and the
highest tensile strength, as compared with others. Consequently, the authors would recommend
the use of RFSSW, rather than the other options.

Available online at www.sciencedirect.com
ScienceDirect Materials Today: Proceedings 18 (2019) 2201–2208
www.materialstoday.com/proceedings
ICMPC-2019
Recent Advances In Keyhole Defects Repairs Via Refilling Friction Stir Spot Welding
2214-7853 © 2019 Elsevier Ltd. All rights reserved. Selection and peer-review under responsibility of the 9th International Conference of Materials Processing and Characterization, ICMPC-2019
Omolayo M. Ikumapayia* and Esther T. Akinlabib
a, b Department of Mechanical Engineering Science, University of Johannesburg, 2006, South Africa
Abstract
The goal of any welding processing is to produce a defect-free sample that will serve the intended purposes. The major setback in friction stir spot welding (FSSW) is the keyhole that always left at the centre of the spot after welding process and also the keyhole that left at the end of friction stir welding and processing (FSW/P). This keyhole has been classified as a defect in FSSW as well as FSW/P. In recent years, very few researchers have developed, characterised and validated some potential methods through research to eliminate this defect and make especially FSSW void free for use and hence reduce material loss during characterisation as a result of cut-off. In this review, the methods adopted in removing this keyhole defects through filling and refilling varying from convectional FSSW, friction forming process (FFP), swing FSSW, pinless shoulder methods, to using autoadjustable pin as well as friction plug welding have been summarised. It is expected that the literatures reviewed here will make meaningful contributions to the present and future researchers, manufacturers, scientists, engineers and the pilots of industries in the area of FSSW, FSW, FSP in order to have keyhole defects free during processing. In this review, refilling FSSW has proven to have better mechanical properties, better hardness and highest tensile strength as compare to others processes. On this note, the authors will recommend the use of refilling FSSW over the others even though, all reviewed processes has been established to have better mechanical properties. © 2019 Elsevier Ltd. All rights reserved. Selection and peer-review under responsibility of the 9th International Conference of Materials Processing and Characterization, ICMPC-2019
Keywords: Defect, Friction Stir Spot Welding, Repair, Refilling, Keyhole
1. Introduction
Friction stir spot stir welding (FSSW) is a new technology of joining in solid-state which was developed from friction stir welding (FSW). FSSW can be classified into three major divisions, the conventional FSSW which was invented by Mazda, the swing FSSW which was invented by Hitachi and the refill FSSW (otherwise called friction spot welding) invented by GKSS (GmbH) in Germany in 2002 [1], [2].
* Corresponding author. Tel.: +27838098288;
E-mail address: [email protected] ; [email protected]
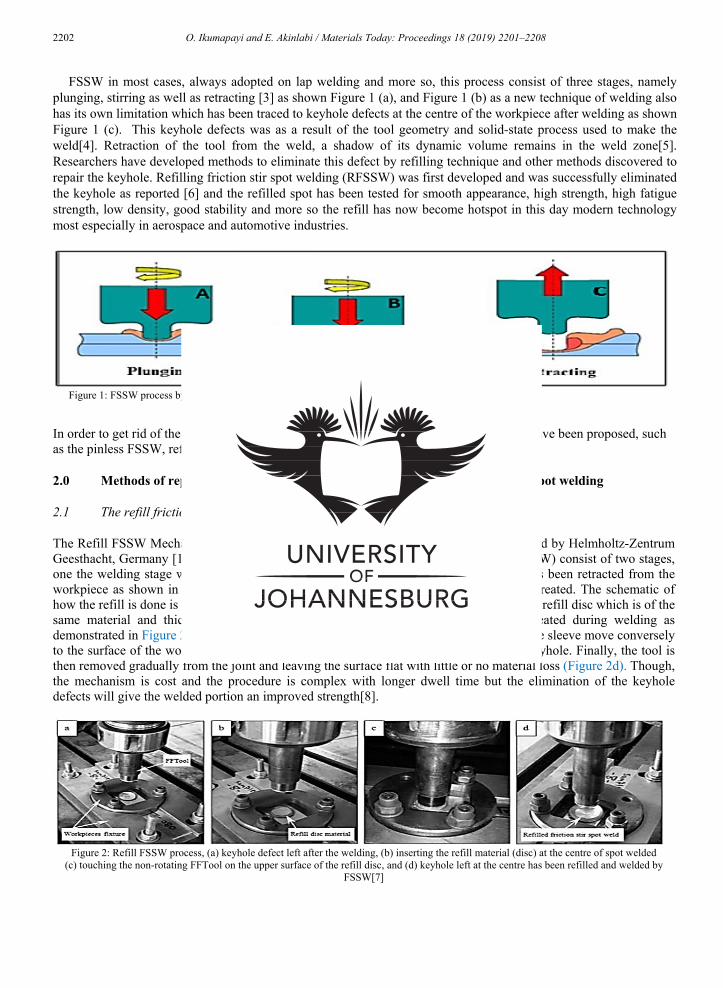
2202 O. Ikumapayi and E. Akinlabi / Materials Today: Proceedings 18 (2019) 2201–2208
FSSW in most cases, always adopted on lap welding and more so, this process consist of three stages, namely plunging, stirring as well as retracting [3] as shown Figure 1 (a), and Figure 1 (b) as a new technique of welding also has its own limitation which has been traced to keyhole defects at the centre of the workpiece after welding as shown Figure 1 (c). This keyhole defects was as a result of the tool geometry and solid-state process used to make the weld[4]. Retraction of the tool from the weld, a shadow of its dynamic volume remains in the weld zone[5]. Researchers have developed methods to eliminate this defect by refilling technique and other methods discovered to repair the keyhole. Refilling friction stir spot welding (RFSSW) was first developed and was successfully eliminated the keyhole as reported [6] and the refilled spot has been tested for smooth appearance, high strength, high fatigue strength, low density, good stability and more so the refill has now become hotspot in this day modern technology most especially in aerospace and automotive industries.
Figure 1: FSSW process by conventional method[8],
In order to get rid of the keyhole defects or improve the strength of joints, a few methods have been proposed, such as the pinless FSSW, refill FSSW, and swing FSSW[8], [9].
2.0 Methods of repairing keyhole defects in friction stir welding/processing and spot welding 2.1 The refill friction stir spot welding
The Refill FSSW Mechanism. The refill FSSW has been traced to be invented and patented by Helmholtz-Zentrum Geesthacht, Germany [10]. The mechanism of Refilling Friction Stir Spot Welding (RFSSW) consist of two stages, one the welding stage which leaves a keyhole at the centre of the welds after the tool has been retracted from the workpiece as shown in Figure 2a and the second stage is refilling stage of the keyhole created. The schematic of how the refill is done is demonstrated in Figure (2b – 2d). In the second stage of RFSSW, a refill disc which is of the same material and thickness as that of base material is inserted into the keyhole created during welding as demonstrated in Figure 2b [7]. After reaching the determine plunge depth, the probe and the sleeve move conversely to the surface of the workpiece hence forcing the displaced material to totally refill the keyhole. Finally, the tool is then removed gradually from the joint and leaving the surface flat with little or no material loss (Figure 2d). Though, the mechanism is cost and the procedure is complex with longer dwell time but the elimination of the keyhole defects will give the welded portion an improved strength[8].
Figure 2: Refill FSSW process, (a) keyhole defect left after the welding, (b) inserting the refill material (disc) at the centre of spot welded
(c) touching the non-rotating FFTool on the upper surface of the refill disc, and (d) keyhole left at the centre has been refilled and welded by FSSW[7]
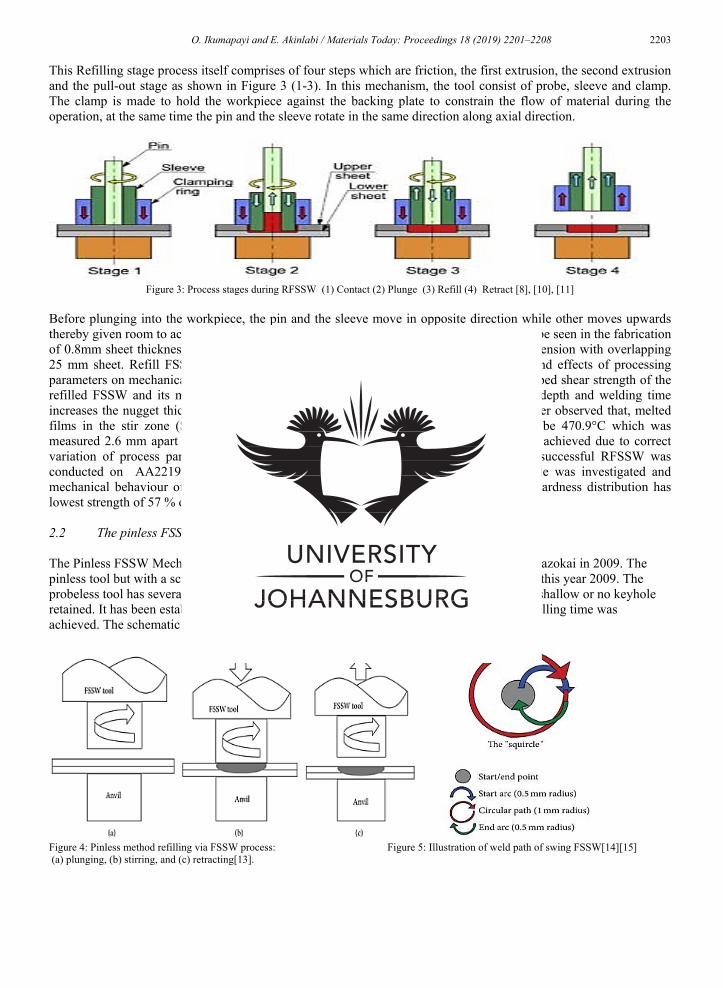
O. Ikumapayi and E. Akinlabi / Materials Today: Proceedings 18 (2019) 2201–2208 2203
This Refilling stage process itself comprises of four steps which are friction, the first extrusion, the second extrusion and the pull-out stage as shown in Figure 3 (1-3). In this mechanism, the tool consist of probe, sleeve and clamp. The clamp is made to hold the workpiece against the backing plate to constrain the flow of material during the operation, at the same time the pin and the sleeve rotate in the same direction along axial direction.
Figure 3: Process stages during RFSSW (1) Contact (2) Plunge (3) Refill (4) Retract [8], [10], [11]
Before plunging into the workpiece, the pin and the sleeve move in opposite direction while other moves upwards thereby given room to accommodate material for plasticity[9]. Another RFSSW repair can be seen in the fabrication of 0.8mm sheet thickness of Alclad 7075-T6 aluminium alloy of 25 mm x 100 mm in dimension with overlapping 25 mm sheet. Refill FSSW lap experiment was conducted using sleeve plunge variant and effects of processing parameters on mechanical performance in terms of hardness, nugget thickness and overlapped shear strength of the refilled FSSW and its microstructures were investigated. It was revealed that as plunge depth and welding time increases the nugget thickness and shear strength also increase independently. It was further observed that, melted films in the stir zone (SZ) was consistent with the maximum temperature recorded to be 470.9°C which was measured 2.6 mm apart from the SZ. It was concluded in this work that defects free was achieved due to correct variation of process parameters especially plunge depth and welding time[5]. Another successful RFSSW was conducted on AA2219-T851in which the microstructural analysis of the refilled sample was investigated and mechanical behaviour of the refilled sample was carried out [12]. It was observed that hardness distribution has lowest strength of 57 % of the base material. 2.2 The pinless FSSW The Pinless FSSW Mechanism. This mechanism has been traced to have been invented by Tazokai in 2009. The pinless tool but with a scroll microchannel (groove) on its shoulder surface was proposed in this year 2009. The probeless tool has several advantages, a better appearance as well as simpler process with a shallow or no keyhole retained. It has been established in the literatures that high-strength welds within a short dwelling time was achieved. The schematic of this pinless FSSW is shown in Figure 4(a-c) [13].
Figure 4: Pinless method refilling via FSSW process: Figure 5: Illustration of weld path of swing FSSW[14][15] (a) plunging, (b) stirring, and (c) retracting[13].
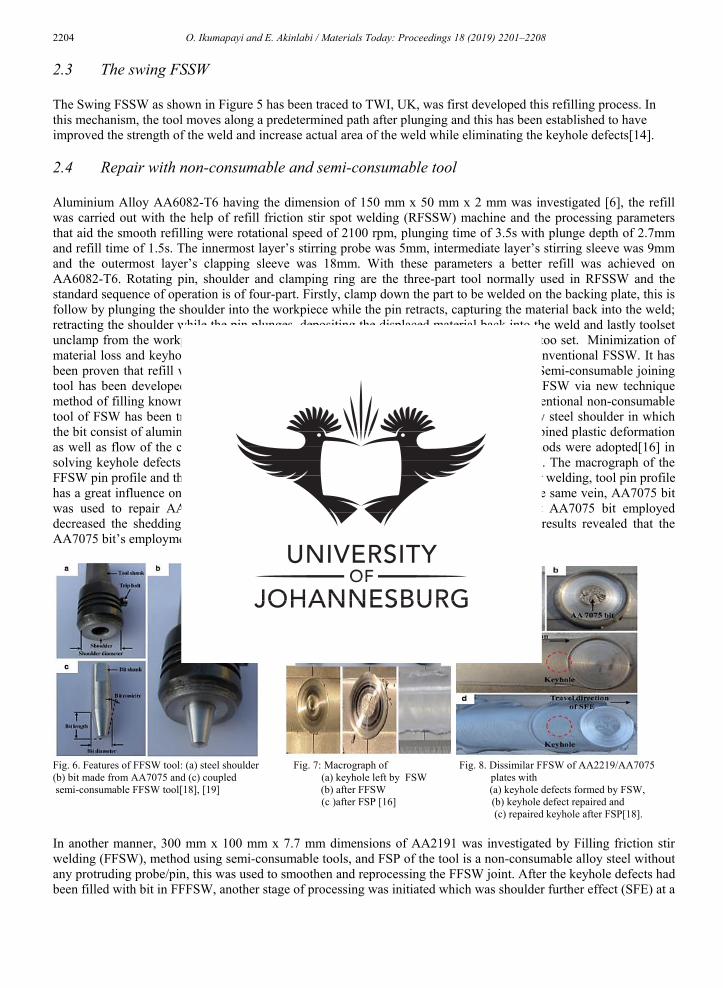
2204 O. Ikumapayi and E. Akinlabi / Materials Today: Proceedings 18 (2019) 2201–2208
2.3 The swing FSSW The Swing FSSW as shown in Figure 5 has been traced to TWI, UK, was first developed this refilling process. In this mechanism, the tool moves along a predetermined path after plunging and this has been established to have improved the strength of the weld and increase actual area of the weld while eliminating the keyhole defects[14]. 2.4 Repair with non-consumable and semi-consumable tool Aluminium Alloy AA6082-T6 having the dimension of 150 mm x 50 mm x 2 mm was investigated [6], the refill was carried out with the help of refill friction stir spot welding (RFSSW) machine and the processing parameters that aid the smooth refilling were rotational speed of 2100 rpm, plunging time of 3.5s with plunge depth of 2.7mm and refill time of 1.5s. The innermost layer’s stirring probe was 5mm, intermediate layer’s stirring sleeve was 9mm and the outermost layer’s clapping sleeve was 18mm. With these parameters a better refill was achieved on AA6082-T6. Rotating pin, shoulder and clamping ring are the three-part tool normally used in RFSSW and the standard sequence of operation is of four-part. Firstly, clamp down the part to be welded on the backing plate, this is follow by plunging the shoulder into the workpiece while the pin retracts, capturing the material back into the weld; retracting the shoulder while the pin plunges, depositing the displaced material back into the weld and lastly toolset unclamp from the workpiece. Figure 6 (a-c) depicts the standard plunge sequence for the too set. Minimization of material loss and keyhole eliminations are the merits of RFSSW over the traditional or conventional FSSW. It has been proven that refill welds have better tensile strength than traditional FSSW variant. Semi-consumable joining tool has been developed to repair the keyhole at the centre of FSSW and at the end of FSW via new technique method of filling known as filling friction stir welding (FFSW).Pin In this method, a conventional non-consumable tool of FSW has been transformed and as such a semi-consumable joining tool with alloy steel shoulder in which the bit consist of aluminium alloy has been designed to create a solid-state joint using combined plastic deformation as well as flow of the consumable joining bit and the wall of the keyhole. Different methods were adopted[16] in solving keyhole defects in FSW, FSP as well as FSSW by refilling methods in this study. The macrograph of the FFSW pin profile and the keyhole during FSW are depicted in Figure 7 (a-c). In friction stir welding, tool pin profile has a great influence on weld quality as a result of the key-role in material flow[17]. In the same vein, AA7075 bit was used to repair AA2219 through semi-consumable technique. It was revealed that AA7075 bit employed decreased the shedding bit material appropriately as shown in Figure 8(a-c) [18]. The results revealed that the AA7075 bit’s employment was able to decrease the shedding bit material effectively.
Fig. 6. Features of FFSW tool: (a) steel shoulder Fig. 7: Macrograph of Fig. 8. Dissimilar FFSW of AA2219/AA7075 (b) bit made from AA7075 and (c) coupled (a) keyhole left by FSW plates with semi-consumable FFSW tool[18], [19] (b) after FFSW (a) keyhole defects formed by FSW, (c )after FSP [16] (b) keyhole defect repaired and
(c) repaired keyhole after FSP[18].
In another manner, 300 mm x 100 mm x 7.7 mm dimensions of AA2191 was investigated by Filling friction stir welding (FFSW), method using semi-consumable tools, and FSP of the tool is a non-consumable alloy steel without any protruding probe/pin, this was used to smoothen and reprocessing the FFSW joint. After the keyhole defects had been filled with bit in FFFSW, another stage of processing was initiated which was shoulder further effect (SFE) at a

O. Ikumapayi and E. Akinlabi / Materials Today: Proceedings 18 (2019) 2201–2208 2205
traverse movement of 22 mm (shoulder diameter). The shoulder effect was seen to have played vital roles in achieving keyholes defects free by enhancing the mechanical properties of the stirred zone. It was recorded that average ultimate tensile strength was 172 MPA and elongation was 11.2 % which equal to 90 and 82 % of the parent weld leaving no defects on the welds[19]. In this study, optimized welding parameters were gotten to be 800 rpm for FSW, FFSW, SFE and FSP at 500mm/min travel speed for all techniques with different plunged speed between 0.3 to 3 mm/min and constant tilt angle of 2.5° was maintained all through the processes. 2.5 The friction plug welding Friction plug Welding (FPW) has been developed by TWI has a solid-state joining process. This has been experimented on the space shuttle external tank in Lockheed Martin Corp for production quality and efficiency. FPW has been used for refilling in FSSW and this was done by using a plug to perform successful weld by pulling out a load after the spinning stop. Under the influence of great stir and friction between the keyhole and plug, sufficient plastic material is formed. FPW has been used to repair defects in keyhole and other void. Consumable bit is used in this technique with the tapered plug without shoulder. With this consumable joining bit such as 4140 alloy steel or D2 steel, a solid state weld is produced under the cut and friction process[19]. The schematic diagram is as shown in Figure 9.
Figure. 9. illustration of the keyhole closure using FSpW [19], [20] Figure 10 : Schematic illustration for SRFSW process[21]
2.6 Autoadjustable pin to repair keyhole The defect created at the centre of workpiece after FSW can be eliminated by runoff plate, it has been proven that this method is limited to structural components alone while the repairing method by fusion welding technology has also reduce the performance significantly[22]. In order to resolve this problem of keyhole defect in the welds of FSW, FSSW and FSP; apparatus and methods have been developed by researchers especially Engineers at National Aeronautics and Space Administration though autoadjustable pin tool apparatus as shown in Figures 10 and 11, this can be used for different material thickness and the pin is so design that it could be withdrawn incrementally from the workpieces at the end of the weld or process and by so doing keyhole defect is eliminated[21]. Retractable or double acting refilling tool that consist of distinct outer shoulder and inner pin has been reported to have solved the defect of keyhole in FSW, this can be achieved by controlling simultaneously the movement of shoulder and pin at the final stage of the welding. Another method as reviewed by the same author is the Friction tapper plug welding (FTPW) or friction hydro pillar processing (FHPP) which is also a technology in a solid –state welding developed by The Welding Institute (TWI) in the early 1990s , which involve drilling a tapered via hole into a plate[21]. Self-refilling friction stir welding (SRFSW) that makes use of non-consumable with changes in probe size geometry was employed in sealing defects created by keyhole during FSW. The stages followed to achieve this was reported in this study[21].

2206 O. Ikumapayi and E. Akinlabi / Materials Today: Proceedings 18 (2019) 2201–2208
Fig. 11. illustration of the FSpW-tools [20] Fig. 12. Illustrations of the IL-FSSW method: a) welding fixture; b) part clamping; c) tool plunge; d) tool retraction[23].
A new approach of closing keyholes defects though FSSW of aluminium alloy 6061 – T6 of thickness 7.5mm was investigated. The refilling mechanisms were carried out using different approaches to ensure defect free welding; artificial aged (with and without), welding mode (with plug and with bead on plate), gas shielding (with and without). It was established by mechanical testing of closed keyhole has improved microhardness, yield strength, tensile strength [20]. It has been reported that to repair a circular hole or an in-process exit hole in a weld usually keyhole which is a defect after the completion of the weld, one of the methods include fabricating filler material of the same chemical composition[24], [25] or compatible with the base material into the plug form to be fitted into the void, position the plug in the void and friction stir welding over and through the plug[26]. Dissimilar friction stir welding of AA6082 of 2mm thickness and galvanized steel DP600 of 1mm thickness were welded with keyhole defects free. In this study, corrosion behaviour of FSSW of the keyhole free defect of dissimilar welds were investigated and the defect-free was achieved by the controlled process parameters used[27]. In the same vein, overlapping friction stir welded joints of similar aluminium alloys AA7075-T6 of different thicknesses (1.6 mm and 0.8 mm) were investigated. The failure mode of the refill FSSW with single –lap joints was examined using tensile/pure shear loading tests. The study showed that, incorrect selection of parameters resulted to the defects such as voids (keyhole), onion rings, hooks and bonding ligament observed in the study. Defects have been categorized into two depending on the size, either as microscopic or macroscopic defects. The authors also highlighted some merits that will make researchers and industries preferred FSSW for light metal joining over other means of spot joining such as riveting and adhesive bonding[28]. The highlighted merits are enumerated thus:
Possibility of leakage is eliminated in FSSW and repair of welded parts is possible The Load capacity is higher in FSSW than other conventional bonding such as riveting It established that, corrosion resistance capacity is high in FSSW as a result of absent of additional element
and other electrochemical potential that can inhibit the growth. There is a uniform alignment in the part to be welded and the welded piece. No protrusion occur in FSSW. Drilling and riveting are not required to fasten the welded joint.
A novel approach has been developed in fabricating of 6061-T6 and 2024-T6 Aluminium Alloys using intermediate layer friction stir spot welding (IL-FSSW) in order to eliminate the occurrence of keyhole during FSSW and this method also eliminated post-treatment of welds. It was revealed that the study yielded decent joint with good appearance and improved mechanical properties leading to lap shear force of 4.5 kN. As indicated in the Figure 12(a-d), the absence of keyhole gives room for the avoidance of post-weld treatment as claimed by the author. A fat weld zone is achieved after the welds[23]. It was established that weld performance improved tremendously in terms of joint strength when compared with conventional FSSW welds. It was established that, keyholes contributed to the fatigue life in friction stir linear welding (FSLW) of aluminium alloy 6022 – T4 and AM60B Magnesium dissimilar weld. In this study, lap shear coupons with keyholes were tested at varying load levels for fatigue behavious and it was observed that there was significant reduction in the fatigue life when compared with FSLW lap-shear coupons without the keyhole. It was revealed that the reduction in linear
O. Ikumapayi and E. Akinlabi / Materials Today: Proceedings 18 (2019) 2201–2208 2207
weld length was as a result of the keyhole defects in the lap-shear test coupons integrated with the existence of the brittle intermetallic compounds in the weld nugget resulted to reduction in the fatigue life when compared to lap-shear welds produced without the keyhole[29]. Refill friction stir spot welding (RFSSW) was performed on 6 mm thickness of high strength aluminium alloy 7075-T651 to repair keyhole defect. Mechanical performance of the closed keyhole welds was studied in this research based on the temperature exposure and the changes in microstructure caused by the welding process. Investigation revealed that there is partial recrystallization in the stirred zone. Post weld natural aging was also carried out on the closure keyhole, a significant improved mechanical properties was achieved, and the strength has proved to increase from 58% to 70% of the base material hardness. Also there is crease in yield strength of the HAZ from 46% to 55% of the BM[30]. In this study, mechanical connection was used to achieve keyhole defect free in lap welding of 3 mm thickness of magnesium alloy AZ31B sheet and 1 mm steel sheet DP600 during FSSW. Welding parameters were optimized and defect free was achieved in the welds[31].
Conclusion: This short review looks into various processes that can be used to eliminate keyhole defects in either friction stir spot welding, friction stir welding or friction stir processing and the following techniques were adopted by the researchers in the study: Refill friction stir spot welding (RFSSW), the Pinless FSSW, the Swing FSSW, the use of non-consumable and semi-consumable tool, the use of friction plug welding, the use of Autoadjustable pin method (a) Friction tapper plug welding , FTPW (b) Friction hydro pillar processing, FHPP, (c) Self-refilling friction stir welding (SRFSW), (d) Intermediate layer friction stir spot welding (IL-FSSW). In all, keyhole defect has been eliminated and the closed material has been reported to have a better mechanical properties such as improved strength, smooth appearance, high fatigue strength and reduction in material loss. From the totality of the review and the discussions, it can be concluded that RFSSW is the most superior method to use in the repair of keyhole defects in FSSW, FSW and FSP. The RFSSW has proven to have better mechanical properties, better hardness and highest tensile strength as compare to others. On this note, the authors will recommend the use of RFSSW over the others.
References [1] K. D. Ramkumar et al., “Metallurgical and mechanical characterization of electron beam welded super-
duplex stainless steel UNS 32750,” J. Manuf. Process., vol. 16, no. 4, pp. 527–534, 2015. [2] Z. Y. Ma, “Friction Stir Processing Technology: A Review,” Metall. Mater. Trans. A, vol. 39, no. 3, pp.
642–658, 2008. [3] A. M. Nasiri, Z. Shen, J. S. C. Hou, and A. P. Gerlich, “Failure analysis of tool used in refill friction stir spot
welding of Al 2099 alloy,” Eng. Fail. Anal., vol. 84, no. September 2017, pp. 25–33, 2018. [4] K. Colligan, “Material Flow Behavior during Friction Stir Welding of Aluminum,” Weld. J., vol. 78, no.
July, pp. 229–237, 1999. [5] Z. Shen, Y. Chen, J. S. C. Hou, X. Yang, and A. P. Gerlich, “Influence of processing parameters on
microstructure and mechanical performance of refill friction stir spot welded 7075-T6 aluminium alloy,” Sci. Technol. Weld. Join., vol. 20, no. 1, pp. 48–57, 2015.
[6] X. Wang, X. Wang, Z. Zhang, L. Wang, Q. Zhao, and X. Deng, “Fatigue Behavior of Friction Spot Stir Welding with No-keyhole of Aluminum Alloy,” Adv. Mater. Res., vol. 1052, no. 1, pp. 509–513, 2014.
[7] H. K. and M. A. S. M. Ibrahim, “Effects of Rotational Speeds and Tool Pin Geometry on Microstructure and Mechanical Properties of Refilled Friction Stir Spot Welds of Similar AA2024-T3 Aluminum Alloy Sheets,” Int. J. Eng. Res. Technol., vol. 6, no. 04, pp. 937–952, 2017.
[8] X. W. Yang, T. Fu, and W. Y. Li, “Friction Stir Spot Welding: A Review on Joint Macro-and Microstructure, Property, and Process Modelling,” Adv. Mater. Sci. Eng., vol. 2014, 2014.
[9] S. A. Behmand, S. E. Mirsalehi, H. Omidvar, and M. A. Safarkhanian, “Filling exit holes of friction stir welding lap joints using consumable pin tools,” Sci. Technol. Weld. Join., vol. 20, no. 4, pp. 330–336, 2015.
[10] A. Kubit, R. Kluz, T. Trzepieciński, D. Wydrzyński, and W. Bochnowski, “Analysis of the mechanical properties and of micrographs of refill friction stir spot welded 7075-T6 aluminium sheets,” Arch. Civ. Mech. Eng., vol. 18, no. 1, pp. 235–244, 2018.
[11] J. Seaman, K. Namola, and J. Gould, “Refill Friction Stir Spot Welding Development,” pp. 1–15.

2208 O. Ikumapayi and E. Akinlabi / Materials Today: Proceedings 18 (2019) 2201–2208
[12] M. Reimann, J. Goebel, and J. F. Santos, “Microstructure Evolution and Mechanical Properties of Keyhole Repair Welds in AA 2219-T851 Using Refill Friction Stir Spot Welding,” J. Mater. Eng. Perform., vol. 27, no. 10, pp. 5220–5226, 2018.
[13] G. F. Zhang, W. M. Jiao, and J. X. Zhang, “Filling friction stir weld keyhole using pin free tool and T shaped filler bit,” Sci. Technol. Weld. Join., vol. 19, no. 2, pp. 98–104, 2014.
[14] X. W. Yang, T. Fu, and W. Y. Li, “Friction stir spot welding: A review on joint macro- and microstructure, property, and process modelling,” Adv. Mater. Sci. Eng., vol. 2014, no. December 2015, pp. 1–13, 2014.
[15] P. B. Prangnell and D. Bakavos, “Novel Approaches to Friction Spot Welding Thin Aluminium Automotive Sheet,” Mater. Sci. Forum, 2010.
[16] Y. X. Huang et al., “New technique of filling friction stir welding,” Sci. Technol. Weld. Join., vol. 16, no. 6, pp. 497–501, 2011.
[17] A. Zafar, M. Awang, S. R. Khan, and S. Emamian, “Role of pin profile on material flow during friction stir welding of nylon-6,” ARPN J. Eng. Appl. Sci., vol. 11, no. 22, pp. 13309–13312, 2016.
[18] B. Han, Y. Huang, S. Lv, L. Wan, J. Feng, and G. Fu, “AA7075 bit for repairing AA2219 keyhole by filling friction stir welding,” Mater. Des., vol. 51, pp. 25–33, 2013.
[19] Y. X. Huang et al., “Interface behaviours and mechanical properties of filling friction stir weld joining AA 2219,” Sci. Technol. Weld. Join., vol. 17, no. 3, pp. 225–230, 2012.
[20] M. Reimann, T. Gartner, U. Suhuddin, J. Göbel, and J. F. Dos Santos, “Keyhole closure using friction spot welding in aluminum alloy 6061-T6,” J. Mater. Process. Technol., vol. 237, pp. 12–18, 2016.
[21] L. Zhou et al., “New technique of self-refilling friction stir welding to repair keyhole,” Sci. Technol. Weld. Join., vol. 17, no. 8, pp. 649–655, 2012.
[22] X. Liu, X. Wang, B. Wang, L. Zhang, C. Yang, and T. Chai, “The Role of Mechanical Connection during Friction Stir Keyholeless Spot Welding Joints of Dissimilar Materials,” Metals (Basel)., vol. 7, no. 6, p. 217, 2017.
[23] I. Jabbar and G. Guven, “Application of a novel friction stir spot welding process on dissimilar aluminum joints,” J. Manuf. Process., vol. 35, no. August, pp. 282–288, 2018.
[24] O. M. Ikumapayi, E. T. Akinlabi, and J. D. Majumdar, “review on thermal , thermo- mechanical and thermal stress distribution during friction stir welding,” Int. J. Mech. Eng. Technol., vol. 9, no. 8, pp. 534–548, 2018.
[25] O. M. Ikumapayi, I. P. Okokpujie, S. A. Afolalu, O. O. Ajayi, E. T. Akilabi, and O. P. Bodunde, “Effects of Quenchants on Impact Strength of Single-Vee Butt Welded Joint of Mild Steel,” IOP Conf. Ser. Mater. Sci. Eng., vol. 391, p. 012007, 2018.
[26] P. E. M. Blix, “Friction stir welding process to repair voilds in aluminum alloys,” Gov. rights Invent., no. 19, pp. 1–6, 1999.
[27] Z.-K. Zhang, Y. Yu, J.-F. Zhang, and X.-J. Wang, “Corrosion Behavior of Keyhole-Free Friction Stir Spot Welded Joints of Dissimilar 6082 Aluminum Alloy and DP600 Galvanized Steel in 3.5% NaCl Solution,” Metals (Basel)., vol. 7, no. 9, p. 338, 2017.
[28] A. Kubit, & & M. B. & D. W. & T. T., and M. Pytel, “Failure mechanisms of refill friction stir spot welded 7075-T6 aluminium alloy single-lap joints,” Int J Adv ManufTechnol, vol. 44, pp. 4479–4491, 2017.
[29] H. M. Rao, J. B. Jordon, S. K. Boorgu, H. Kang, W. Yuan, and X. Su, “Influence of the key-hole on fatigue life in friction stir linear welded aluminum to magnesium,” Int. J. Fatigue, vol. 105, pp. 16–26, 2017.
[30] M. Reimann, J. Goebel, and J. F. dos Santos, “Microstructure and mechanical properties of keyhole repair welds in AA 7075-T651 using refill friction stir spot welding,” Mater. Des., vol. 132, pp. 283–294, 2017.
[31] X. J. Wang, W. H. Li, and G. Zhao, “Connection mechanism research on friction stir spot welding without keyhole between magnesium and steel dissimilar alloys,” Mater. Res. Innov., vol. 18, no. sup2, pp. S2-1063-S2-1066, 2014.
59
3.4 ARTICLE III
Comparative study of the Variability in the compositions and the effect of
milling time on coal-fly ash and wood-fly ash nanoparticles
Presented at the 9th International Conference on Material Processing and Characterization
(ICMPC) March 2019 at Griet, Hyderabad, India
Published in Materials Today: Proceedings 18 (2019) 5556–5564
https://doi.org/10.1016/j.matpr.2019.07.005
ISSN: 2214-7853
A comparative study was conducted on the compositional analysis and the influence of milling
time on industrial and domestic fly ashes, which comprise coal-fly ash (CFA) and wood-fly ash
(WFA), respectively. The two fly ashes (FAs) were washed, dried and sieved to 75 µm particle
size, using the ASTM standard sieve; and this was taken as being zero (0) when milled. Then the
milling was done for 20, 40 and 60 minutes on both CFA and WFA. In this study, scanning electron
microscopy (SEM) was used to study the morphologies of the FAs; and Energy Dispersive X-ray
(EDX) was employed for the elemental analysis; X-Ray Diffraction (XRD) for the phases and the
crystallite size measurements; and X-Ray Fluorescence (XRF) for the chemical analyses and the
compositions analyses.
The crystal phases detected by the XRD in WFA are rhombohedral, hexagonal, cubic and
tetragonal; while that of the CFA are hexagonal, orthorhombic, rhombohedral and anorthic. XRD
analysis shows that the most dominant crystalline substances in wood-fly ash are calcite (CaC03),
quartz (SiO2), Sylvite (KCl), Lime (CaO), maghemite-Q (Ɣ-Fe2O3), nitratetine (Na(NO3)) and

60
magnetite (Fe3O4) phases; while in coal-fly ash, these were Quartz (SiO2), Mullite
(Al2.32Si0.68O4.84), Sillimanite (Al2(SiO4)O, Calcite high (CaCO3), Hematite (Fe2O3), and
Microcline (KAlSi3O8). The particle sizes increased from 75µm to an average diameter of 200nm.
It was also established by SEM micrographs that the fly ash particles were mainly smooth
spherical, or cenospherical in shape. The results of the EDX, XRF and others were presented in
the paper. This published conference article has been able to address the objective of the study in
item I.
Available online at www.sciencedirect.com
ScienceDirect Materials Today: Proceedings 18 (2019) 5556–5564
www.materialstoday.com/proceedings
2214-7853 © 2019 Elsevier Ltd. All rights reserved. Selection and peer-review under responsibility of the 9th International Conference of Materials Processing and Characterization, ICMPC-2019
ICMPC-2019
Comparative Study Of The Variability In The Compositions And The Effect Of Milling Time On Coal Fly Ash And Wood Fly Ash Nanoparticles
Omolayo M. Ikumapayia* and Esther T. Akinlabib
a, b Department of Mechanical Engineering Science, University of Johannesburg, 2006, South Africa
Abstract
Industrial and domestic fly ashes (FA) also known as coal fly ash (CFA) and wood fly ash (WFA) respectively has been causing environmental menaces but in recent times they are gaining potential applications in various industries varying from Construction, processing, activated carbon, filler and reinforcement, agriculture to water purifications, to mention but a few due to its availability and low cost. There is every need to place these two fly ashes and weigh their compositions. In this study, the chemical and elemental compositions of both coal fly ash and wood fly ash are compared. The physiochemical and Morphological Characteristics of the milled and unmilled nano fly ashes were determined using Scanning Electron Microscopy (SEM), Energy Dispersive X-ray (EDX), X-Ray Diffraction (XRD), and X-Ray Fluorescence (XRF) analyses. The milling times were taken at 0, 20, 40 and 60 mins and 0 min taken when sieved with 75µm size ASTM standard before milling. The crystal phases detected by the XRD in WFA are rhombohedral, hexagonal, cubic and tetragonal while that of CFA are hexagonal, orthorhombic, rhombohedral and anorthic. XRD analysis shown that the most dominant crystalline in wood fly ash were calcite (CaC03), quartz (SiO2), Sylvite (KCl), Lime (CaO), maghemite-Q (Ɣ-Fe2O3), nitratetine (Na(NO3)) and magnetite (Fe3O4) phases; while in coal fly ash were Quartz (SiO2), Mullite (Al2.32Si0.68O4.84), Sillimanite (Al2(SiO4)O, Calcite high (CaCO3), Hematite (Fe2O3), Microcline (KAlSi3O8). The particles size got increased from 75µm to average diameter of 200nm. Morphological characteristics revealed that the surface of nano obtained shows that wood fly ash nanoparticles (WFA-NPs) has more irregular shape, rough and uneven compared to coal fly ash nanoparticles (CFA-NPs). As revealed by EDX the elemental composition that are present in Wood fly ash nanoparticles are Ca, K, Mg, Si, Al and Fe while that of coal fly ash nanoparticles are Si, Al, Ca, Fe, Ti and Mg. The overall effects of the grinding process showed that there are tremendous reductions in both the particle and crystallite size of CFA-NPs and WFA-NPs as well as great improvement in the metallurgical and mechanical properties of the two samples with respect to milling time when compared to unmilled samples. © 2019 Elsevier Ltd. All rights reserved. Selection and peer-review under responsibility of the 9th International Conference of Materials Processing and Characterization, ICMPC-2019
Keywords: Coal fly ash, wood fly ash, nanoparticles, milling time, SEM-EDX
1. Introduction Generally, Fly Ashes either from municipal solid waste or thermal plant solid waste has been regarded as hazardous waste due to toxic contaminations like chloride salts, heavy metals, dioxins as well as some organic compounds present within[1]. Fly ash consists basically of minerals as well as a large percentage of silica and aluminium compounds, and also small amount of rare earths. Fly ash (FA) is a fine particulate by-product released in the form of gas to the atmosphere as a result of combustion processes. There are two major components of FA, the inorganic ash spheres (IASs) which was produced from non-combustible fractions of the fuel (e.g., mineral veins within a coal seam). In this category, original mineral inclusion is defined by chemical composition. The second component is Spheroidal carbonaceous particles (SCPs) which was produced as a result of incomplete combustions of oil droplet or pulverized coal particles and its main elemental composition is carbon[2]. * Corresponding author. Tel.: +27838098288; E-mail address: [email protected]; [email protected]

O.M. Ikumapayi and E.T. Akinlabi / Materials Today: Proceedings 18 (2019) 5556–5564 5557
Coal fly ash (CFA) has been established to be silico-aluminate as a result of high content of “pozzolanic” powdery material which are produced during the combustion of the pulverized CFA. Variability in the elemental and chemical compositions as well as morphological characteristics were studied using SEM-EDX and XRF. The resultant effects of milling of Class - F fly ash were experimented on bulk and surface characterizations and applied as activated FA in cement[3].There are two major types of fly ash (FA) either from coal or wood. They are grouped as Class F and Class C, these are pozzolan and according to ASTM, it has a siliceous or siliceous and aluminous value. This classification is based on particle size. Class F has been established to be in abundance in nature and contained below 15 % content of lime and a greater amount of silica, iron and alumina altogether above 70 % than other Class C fly ash. Class C usually common among coal extraction with greater amount of lime content above 15 % often as high as 30 %. At elevation, CaO in Class C gives self-hardening characteristics[4], [5]. Fly ash can be described as fine and spherical glassy particles which contains fundamentally of Al2O3, SiO2 as well as CaO as the main constituent [6]. It was
established by several researchers that Cola Fly Ash belongs to type F fly ash in the aggregate of Al2O3 + Fe2O3 + SiO2 mass exceeds about 70% sum total of fly ash mass.Wood fly ash is the residue powder left after the complete combustion of wood, this can be through burning of wood at home or in an industrial power plant. The chemical and elemental compositions as well as quantity of wood ash produced is largely depend on the tree species, the age of the tree, the type of the soil that produced the tree burnt to produce the wood fuel, the operating conditions as well as technology of the biomass facility. Wood ash is produced from burning several fuel sources. These sources can be forest management residues (slash) and lumber mill waste (bark, sawdust and wood chips) provide “clean” sources of woody biomass for combustion. [7]. It was revealed that hardwood ash contains less Si and Ca and more P and K than softwood. The variability in elemental compositions depends on the type of plant tissue included in the wood fuel. It was revealed that wood ash produced from root and branch of the tree is richer in several elements than the one produced by stemwood, at the same time, the wood ash produced from foliage and bark have proven to contain high concentrations between 5 to 10 % times greater than the one formed from stemwood. It was further revealed that high amount of Si and Ca are present in bark ash while Al, Si and Mn are concentrated in the mixed stemwood. The analyses by some researchers showed that bark produces more ashes than stemwood which is 6 percent as compare to 0.25 percent of ash produced from stemwood. It is worth of note that ash produced from birch, pine as well as beech species is lower than those produced from aspen or spruce species[8], [9]. Application Of Fly Ash The performance of Fly Ash (FA) either wood or coal in any application depends wholly on whether is in form of nano-, micro-, and macro- particles. It has been established by various authors that tend to investigate the effect of milling on Fly Ash that reductions in particle size improves mechanical properties, morphology, and also absorption rate is increase when in finest form. Despite the hazardous and environmental unfriendliness of fly ash, so much benefits can be derived in it. Some of the uses and emerging uses of Fly Ash as established by [10], [11] among others are:
1. Fly Ash has potential applications in cement, brickmaking and concrete, this is the most famous application of Fly Ash which has been thriving for decades. It was established that cement constitute up to 40- 45% Fly ash by weight [10], [11]
2. It has been established that FA has potential applications in geopolymers concrete. Though, the market for this application is developing slowly[10].
3. FA finds application in the area of Zeolites. These are crystalline solid structures that comprises of Oxygen, Aluminium and Silicon. These Zeolites can be used water purification, petrochemical cracking and water softening.
4. Fly Ash can be used to remove Acid Mine drainage also known as AMD which is the contaminant in mine water as well as mine backfilling.
5. FA also very useful in Agriculture to reduce poor quality of agricultural land as well as to rehabilitate mine land. FA efficacy can be utilized to modify soil health and the performance of crop yielding.
6. FA can also be used as road surface and filler applications. FA finds new interest in asphalt filler and also as embankments layer for tar roads.
7. FA can be used as stiffeners and fillers in plastics and rubber products. It was established[10] that fly ash increases the strength as well as elasticity of the product which eventually helps in curing and molding. In facts, FA used in composite insulators of silicone rubber improves tensile strength, dielectric strength and resistivity while maintaining its hydrophobic characteristics.
2.0 Materials and Methods
2.1 Materials
The coal fly ash (CFA) used in this research was collected from the ash dump of Majuba Power Station operated by EKSOM; a coal-fired power station located at Mpumalanga Province of South Africa. In the plant, as the pulverized coal undergo burning in the boiler, part of the ashes falls to the bottom of the system (bottom ash), however, others escaped with the flue gas but are trapped using filter bags. The two categories of ashes are channeled to the ash dump.

5558 O.M. Ikumapayi and E.T. Akinlabi / Materials Today: Proceedings 18 (2019) 5556–5564
The wood fly ash (WFA) used in this research was collected after a bunch of firewood was subjected into complete combustion process until wood fly ash was produced. Both CFA and WFA were then collected, sieved, washed with distilled water to remove any impurities and foreign contaminants as well as unwanted particles, which were then discharged and drained in their respectively washing bowl and then dried at ambient temperature for 72 hours, further drying was carried out in an electric oven set at temperature of 800C for 48 hours to ensure totally dryness before characterization. 2.2 Experimental Methodology
The resulting ashes (CFA and WFA) were then sieved using an ASTM meshes standard range by employed KingTest Sieve of 75µm size on KingTest Sieve Shaker (VB 200/300) having operating voltage 220V/50Hz and 5A. The fly ashes proportion that passed through the mesh size of 75µm was then collected individually and taken for milling. The flowchart for the preparations and characterizations of fly ashes is shown in Figure 1.
Figure 1: Flowchart for the preparation and characterizations of CFA & WFA
2.2.1 Chemical compositions of Fly Ashes In this research, the chemical composition of both CFA-NPs and WFA-NPs in as-received state (raw state) after washed from dirt and contaminants and then dried were analysed with the aid of X-Ray Fluorescence (XRF) spectroscopy (model PHILIP PW1404 XRF) Wavelength Disperse Spectrometer and the outcome of the analysis is as depicted in the Table 1:
Table 1: The chemical composition analysis of CFA-NPs and WFA-NPs using XRF Chemical Formula CFA (wt%) WFA (wt%)
Al2O3 30.93 10.7 SiO2 51.43 46.31 MgO 1.95 0.36 TiO2 1.74 0.933 Fe2O3 2.29 17.28 CaO 6.75 3.002 MnO 0.02 - MnO2 - 0.0471 Na2O 0.54 2.48 P2O3 1.08 - P2O5 - 0.113 Cr2O3 0.77 - K2O 0.77 2.53 N2O 0.01 - SO3 0.54 3.423 LOI 1.21 8
Σ= 99.28 Σ= 87.17
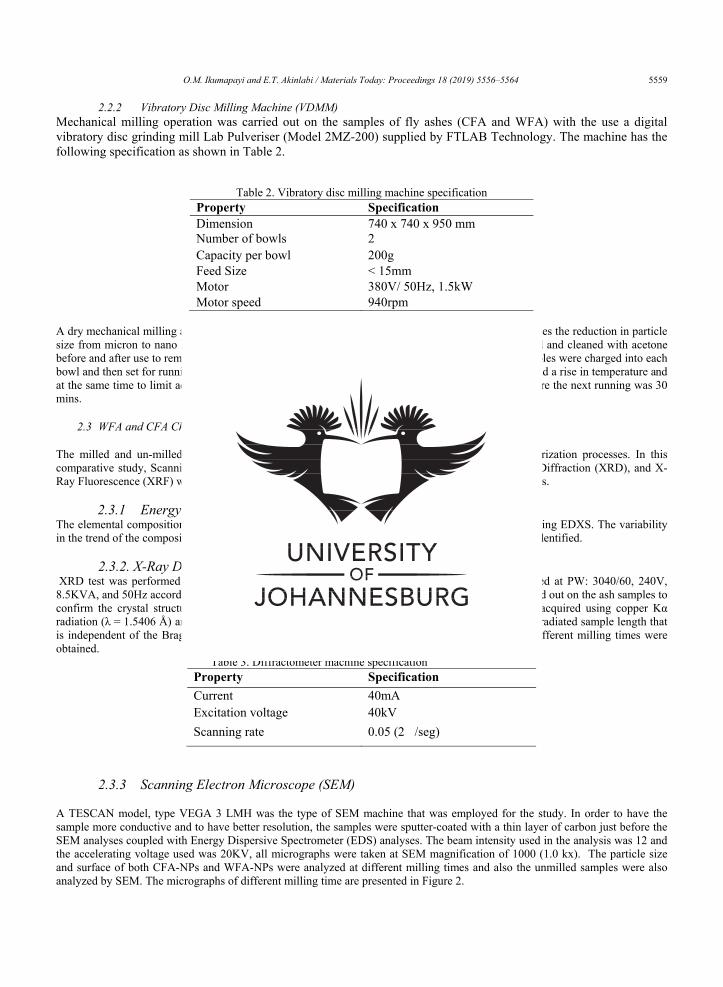
O.M. Ikumapayi and E.T. Akinlabi / Materials Today: Proceedings 18 (2019) 5556–5564 5559
2.2.2 Vibratory Disc Milling Machine (VDMM) Mechanical milling operation was carried out on the samples of fly ashes (CFA and WFA) with the use a digital vibratory disc grinding mill Lab Pulveriser (Model 2MZ-200) supplied by FTLAB Technology. The machine has the following specification as shown in Table 2.
Table 2. Vibratory disc milling machine specification Property Specification Dimension 740 x 740 x 950 mm Number of bowls 2 Capacity per bowl 200g Feed Size < 15mm Motor 380V/ 50Hz, 1.5kW Motor speed 940rpm
A dry mechanical milling at varying milling and processing time of 20, 40 and 60 minutes which enables the reduction in particle size from micron to nano levels for both CFA and WFA. The machine was thoroughly washed, dried and cleaned with acetone before and after use to remove any contaminants that may be present. 40g of each WFA and CFA samples were charged into each bowl and then set for running. The machine was interrupted every 10 mins of operation in order to avoid a rise in temperature and at the same time to limit adherence of the powder within the container walls, the cooling interval before the next running was 30 mins.
2.3 WFA and CFA Characterizations
The milled and un-milled CFA and WFA were analyzed through various microstructural characterization processes. In this comparative study, Scanning Electron Microscopy (SEM), Energy Dispersive X-ray (EDX), X-Ray Diffraction (XRD), and X-Ray Fluorescence (XRF) were adopted. The techniques involved in the analysis are discussed as follows.
2.3.1 Energy Dispersive X-Ray Spectroscopy (EDXS) The elemental composition of milled and un-milled samples for both CFA and WFA was analyzed using EDXS. The variability in the trend of the composition of each element present across the milled and un-milled samples were identified.
2.3.2. X-Ray Diffraction (XRD) XRD test was performed using the PHILIPS X’Pert (model number 12NC: 943003040601) operated at PW: 3040/60, 240V, 8.5KVA, and 50Hz according to diffractometer machine specifications in Table 3. XRD test was carried out on the ash samples to confirm the crystal structure and mineralogical compositions of the samples used. The XRD was acquired using copper Kα radiation (λ = 1.5406 Å) and k radiation (λ = 1.39225 Å) and an automatic divergence slit; i.e., an irradiated sample length that is independent of the Bragg angles ((2θ) in degree). The diffraction patterns and crystal phases at different milling times were obtained.
Table 3. Diffractometer machine specification Property Specification Current 40mA Excitation voltage 40kV
Scanning rate 0.05 (2/seg)
2.3.3 Scanning Electron Microscope (SEM)
A TESCAN model, type VEGA 3 LMH was the type of SEM machine that was employed for the study. In order to have the sample more conductive and to have better resolution, the samples were sputter-coated with a thin layer of carbon just before the SEM analyses coupled with Energy Dispersive Spectrometer (EDS) analyses. The beam intensity used in the analysis was 12 and the accelerating voltage used was 20KV, all micrographs were taken at SEM magnification of 1000 (1.0 kx). The particle size and surface of both CFA-NPs and WFA-NPs were analyzed at different milling times and also the unmilled samples were also analyzed by SEM. The micrographs of different milling time are presented in Figure 2.
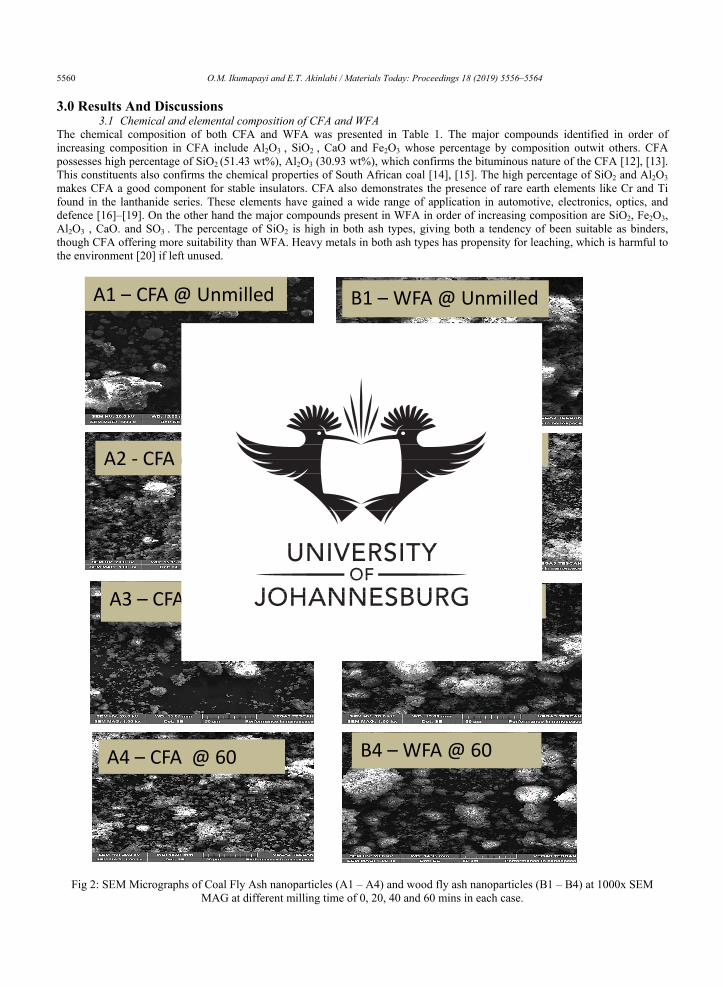
5560 O.M. Ikumapayi and E.T. Akinlabi / Materials Today: Proceedings 18 (2019) 5556–5564
3.0 Results And Discussions 3.1 Chemical and elemental composition of CFA and WFA
The chemical composition of both CFA and WFA was presented in Table 1. The major compounds identified in order of increasing composition in CFA include Al2O3 , SiO2 , CaO and Fe2O3 whose percentage by composition outwit others. CFA possesses high percentage of SiO2 (51.43 wt%), Al2O3 (30.93 wt%), which confirms the bituminous nature of the CFA [12], [13]. This constituents also confirms the chemical properties of South African coal [14], [15]. The high percentage of SiO2 and Al2O3 makes CFA a good component for stable insulators. CFA also demonstrates the presence of rare earth elements like Cr and Ti found in the lanthanide series. These elements have gained a wide range of application in automotive, electronics, optics, and defence [16]–[19]. On the other hand the major compounds present in WFA in order of increasing composition are SiO2, Fe2O3, Al2O3 , CaO. and SO3 . The percentage of SiO2 is high in both ash types, giving both a tendency of been suitable as binders, though CFA offering more suitability than WFA. Heavy metals in both ash types has propensity for leaching, which is harmful to the environment [20] if left unused.
Fig 2: SEM Micrographs of Coal Fly Ash nanoparticles (A1 – A4) and wood fly ash nanoparticles (B1 – B4) at 1000x SEM
MAG at different milling time of 0, 20, 40 and 60 mins in each case.
A1 – CFA @ Unmilled B1 – WFA @ Unmilled
A2 - CFA @ 20 B2 – WFA @ 20 mins
A3 – CFA @ 40 B3 – WFA @ 40 mins
A4 – CFA @ 60 B4 – WFA @ 60

O.M. Ikumapayi and E.T. Akinlabi / Materials Today: Proceedings 18 (2019) 5556–5564 5561
It can be seen that both CFA and WFA contains large particle size before milling as depicted in Figure 2 (A1 and B1) at 50µm. In Figure 2 (A2 and B2), it was observed that particle size becomes smaller in size at 50µm. Figure 2 (A3 & B3) show that particle aggregation, the smaller particles sticking to larger ones as evidence in the work of [21]. It was also established from the micrographs that further milling affect the sizes of the particle and there still agglomeration of the particles.
3.2 Energy Dispersive X-Ray Spectroscopy (EDXS) Result
The elemental composition of both milled and raw samples were analyzed by the use of EDXS. The variation in the trend of the composition of each element present was monitored at different milling time as shown in Figures 3 and 4. This variation has also been represented in Table 4.
Figure 3: WFA Elemental Compositions at different Milling time as analyzed by EDXS
Figure 4: CFA Elemental Compositions at different Milling time as analyzed by EDXS
Table 4: Variability summary in Elemental Composition as analyzed by EDXS at different milling time
ELEMENT Elemental Composition At Different Milling Times 0 Min
(Unmilled) 20 Mins 40 Mins 60 Mins
CFA-NPs Si 50.7 55.5 52.3 48.9 Al 29.2 27.0 26.2 26.9 Ca 9.9 8.9 9.8 9.7 Fe 4.6 4.9 7.3 8.4 Ti 2.6 2.2 2.8 2.1
Mg 2.9 1.5 1.6 1.5 WFA-NPs Ca 76.6 85.0 85.4 84.9
K 10.3 3.6 3.6 3.8 Mg 5.4 3.7 3.4 3.0 Si 4.7 4.6 4.5 5.0 Al 1.5 1.5 1.3 1.5 Fe 1.5 1.6 1.9 1.8

5562 O.M. Ikumapayi and E.T. Akinlabi / Materials Today: Proceedings 18 (2019) 5556–5564
3.2 X-Ray Diffraction (XRD) Result In Figure 5, the intensity decreased with milling time for the WFA, which remained almost constant for CFA. Also, comparing the peak intensity of CFA with WFA, a higher value of count was observed at every stage of milling CFA. At almost 30° (2) CFA and 30° (2) WFA, the peaks were observed to higher. When considering, CFA, it was higher in 0 minute and at 20, 40 and 60 minutes, the peak maintained almost same peak, which dictates that there is stability of quality in CFA while in WFA, 0 minute proved to have the highest peak and the was gradual reduction as the milling time increases. This reduction could be as a result of contaminations in WFA from the source of preparation or the nature of the timber or wood-fired to generate ash. Hence, the integrity of the CFA remained evenly and subjective of the fact that it is a suitable material (powder reinforcement) and with relative to its elemental composition; show in high percentage proportion of Al2O3 and less of Iron Oxides. The opposite is the case of WFA. The crystal phases detected by the XRD in WFA are rhombohedral, hexagonal, cubic and tetragonal while that of CFA are hexagonal, orthorhombic, rhombohedral and anorthic. XRD analysis shown in Figures 5 revealed that the most dominant minerals in wood fly ash are calcite (CaC03), quartz (SiO2), Sylvite (KCl), Lime (CaO), maghemite-Q (Ɣ-Fe2O3), nitratetine (Na(NO3)) and magnetite (Fe3O4) while that of coal fly ash are Quartz (SiO2), Mullite (Al2.32Si0.68O4.84), Sillimanite (Al2(SiO4)O, Calcite high (CaCO3), Hematite (Fe2O3), Microcline (KAlSi3O8).
Figure 5: XRD diffractograms of Coal Fly Ash and Wood Fly Ash Nano-Particles (CFA-NPs & WFA-NPs) at different Milling
time The correlation between coal fly ash and wood fly ash is such that the integrity of the power (intensity) decline with milling time for the WFA, whereas it remained constant for CFA. Figure 5 ( The CFA-unmilled at ‘0’ milling time, and the peak value with 1500,compared to CFA-20 Mins, 40 Mins and 60 Mins where the peak values exceeds 1500 with increasing intensity (colour) as the milling time progresses. Hence, the integrity of the CFA remained evenly and subjective of the fact that it is a suitable material (powder reinforcement) and with relative to its elemental composition; show in high percentage proportion of Al2O3 and less of Iron Oxides. The opposite is the case of WFA. 3.4 Variability Compositional assessment Various researchers that have conducted analysis on chemical and elemental compositions of either CFA or WFA, have established some facts in their analyses. In some results, calcium carbonate (CaCO3) constitutes highest percentage while in other analysis, it was calcium oxide (CaO) [22], [23] . In this study, the major constituent was Silicon oxide (SiO2) for both CFA and WFA at percentage of 51.43 and 46.31 respectively. Some show about twelve percent of iron oxide while others show no trace of

O.M. Ikumapayi and E.T. Akinlabi / Materials Today: Proceedings 18 (2019) 5556–5564 5563
iron oxide [24], [25] . Although, presence of iron oxide has been traced to the contamination of the soil. This trace of iron oxide was detected in large percentage in WFA (17.28 %) and very little in CFA (2.29 %). Some researchers that have worked on WFA in the past established that elemental and chemical composition of Wood ash can be affected by the age of the tree, type of the tree, the nature of the soil in which the tree grows, all combined together affect the nature of the composition that will be produced in WFA. Conclusion And Contributions From the experimental results and their discussions, it can be concluded as follows:
i. That XRD revealed the following crystal phases in WFA-NPs, rhombohedral, hexagonal, cubic and tetragonal and these in CFA-NPs, hexagonal, orthorhombic, rhombohedral and anorthic
ii. Through XRD examinations, the following are the dominant minerals in WFA-NPs, calcite (CaC03), quartz (SiO2), Sylvite (KCl), Lime (CaO), maghemite-Q (Ɣ-Fe2O3), nitratetine (Na(NO3)) and magnetite (Fe3O4) . Likewise in CFA-NPs they are, Quartz (SiO2), Mullite (Al2.32Si0.68O4.84), Sillimanite (Al2(SiO4)O, Calcite high (CaCO3), Hematite (Fe2O3), Microcline (KAlSi3O8).
iii. As revealed by EDX the elemental composition that are present in Wood fly ash nanoparticles are Ca, K, Mg, Si, Al and Fe while that of coal fly ash nanoparticles are Si, Al, Ca, Fe, Ti as well as Mg
iv. The particles size got increased from 75µm to average diameter of 200nm v. It was also established by SEM micrographs that fly ash particles contain mainly smooth spherical, and cenospheres in
shape vi. The nanoparticles from WFA and CFA can be useful in reinforcement, filler, activated carbon, water purification, it can
also be utilized in construction industries as alternative or replacement to cement as well as aggregate in metal, polymer and ceramics matrices.
vii. It was established that the particle size of both WFA and CFA has reduced from micrometer to nanometer through the help of vibratory disc milling machine (VDMM). The particle sizes reduced from 75 µm to an average size of 200 nm after 60 mins milling with VDMM. It was observed that there is a reduction in crystallite size and the powder becomes amorphous. The crystalline structure, surface texture of the WFA and CFA have changed over the period of milling time as revealed by XRD and SEM.
References [1] U. K. Tiwari, M, k; Bajpai , S and Dewangan, “Fly Ash Utilization A Brief Review in Indian Context,” Int. Res. J. Eng.
Technol., vol. 03, no. Ju04, pp. 949–956, 2016. [2] N. L. Rose, “Spheroidal Carbonaceous Fly Ash Particles in the Anthropocene,” Encycl. Anthr., vol. 2020, pp. 189–195,
2018. [3] D. K. Rajak, A. Raj, C. Guria, and A. K. Pathak, “Grinding of Class-F fly ash using planetary ball mill : A simulation
study to determine the breakage kinetics by direct- and back-calculation method,” south african J. Chem. Eng., vol. 24, pp. 135–147, 2017.
[4] www.flyash.com, “Fly Ash Types & Benefits,” Tecnical Bulletin, Headwaters Resources. . [5] J. Xie and O. Kayali, “Effect of superplasticiser on workability enhancement of Class F and Class C fly ash-based
geopolymers,” Constr. Build. Mater., vol. 122, pp. 36–42, 2016. [6] P. W. Du Plessis, T. V Ojumu, and L. F. Petrik, “Waste Minimization Protocols for the Process of Synthesizing Zeolites
from South African Coal Fly Ash,” Materials (Basel)., vol. 6, pp. 1688–1703, 2013. [7] B. Bob, “Management of Wood Ash Generated from Biomass Combustion Facilities,” Fact Sheet. 2015. [8] R. M. Pitman, “Wood ash use in forestry – a review of the environmental impacts,” Foretry, no. June, pp. 563–588, 2018. [9] S. Roberto, J. José, and D. O. Andrade, “Investigation of mechanical properties and carbonation of concretes with
construction and demolition waste and fly ash,” Constr. Build. Mater. J., vol. 153, pp. 704–715, 2017. [10] M. Rycroft, “Exploring the many uses of fly ash,” Energize, vol. November 2, 2017. [11] J. R. . V.-A. F. C.-L. A. V.-C. O. V.-R. F. and S.-A. . Zaldivar-Cadena, AA; Diaz-Pena I; Gonzalez-Lopez, “Effect of
Milling Time on Mechanical Properties of Fly Ash Incorporated Cement Mortars,” Adv. Mater. Res., vol. 787, pp. 286–290, 2013.
[12] C. Belviso, “State-of-the-art applications of fly ash from coal and biomass: A focus on zeolite synthesis processes and issues,” Prog. Energy Combust. Sci., vol. 65, pp. 109–135, 2018.
[13] D. Vamvuka and E. Kakaras, “Ash properties and environmental impact of various biomass and coal fuels and their blends,” Fuel Process. Technol., vol. 92, no. 3, pp. 570–581, 2011.
[14] S. S. Makgato and E. M. N. Chirwa, “Waterberg coal characteristics and SO2minimum emissions standards in South African power plants,” J. Environ. Manage., vol. 201, no. 2, pp. 294–302, 2017.

5564 O.M. Ikumapayi and E.T. Akinlabi / Materials Today: Proceedings 18 (2019) 5556–5564
[15] N. M. Musyoka, L. F. Petrik, O. O. Fatoba, and E. Hums, “Synthesis of zeolites from coal fly ash using mine waters,” Miner. Eng., vol. 53, pp. 9–15, Nov. 2013.
[16] R. K. Taggart, J. C. Hower, and H. Hsu-Kim, “Effects of roasting additives and leaching parameters on the extraction of rare earth elements from coal fly ash,” Int. J. Coal Geol., vol. 196, no. May, pp. 106–114, 2018.
[17] K. R. Long, B. S. Van Gosen, N. K. Foley, and D. Cordier, “The principal rare earth elements deposits of the United States - a summary of domestic deposits and a global perspective,” 2010.
[18] D. B. Mayfield and A. S. Lewis, “Environmental review of coal ash as a resource for rare earth and strategic elements.,” in Proceedings of the 2013 World of Coal Ash (WOCA) Conference, Lexington, KY, USA, 2013, pp. 22–25.
[19] V. V. Seredin, “Rare earth element-bearing coals from the Russian far east deposits,” Int. J. Coal. Geol., vol. 30, pp. 101–129, 1996.
[20] N. Gupta, V. V. Gedam, C. Moghe, and P. Labhasetwar, “Investigation of characteristics and leaching behavior of coal fly ash, coal fly ash bricks and clay bricks,” Environ. Technol. Innov., vol. 7, pp. 152–159, 2017.
[21] I. Mubeen, A. Buekens, Z. Chen, S. Lu, and J. Yan, “De novo formation of dioxins from milled model fly ash,” Env. Sci Pollut Res, vol. 24, pp. 19031–19043, 2017.
[22] S. Masuka, W. Gwenzi, and T. Rukuni, “Development , engineering properties and potential applications of un fi red earth bricks reinforced by coal fl y ash , lime and wood aggregates,” J. Build. Eng., vol. 18, no. March, pp. 312–320, 2018.
[23] G. Xu and X. Shi, “Resources , Conservation & Recycling Characteristics and applications of fl y ash as a sustainable construction material : A state-of-the-art review,” Resour. Conserv. Recycl., vol. 136, no. April, pp. 95–109, 2018.
[24] T. Sundum, K. Mészáros, and K. Kaewtatip, “Preparation and characterization of thermoplastic starch composites with fl y ash modi fi ed by planetary ball milling,” Carbohydr. Polym., vol. 191, no. February, pp. 198–204, 2018.
[25] S. Kumar, S. Kumar, and S. C. Mishra, “Processing and Characterization of Fly-ash Compacts,” Mater. Today Proc., vol. 5, no. 2, pp. 3396–3402, 2018.

61
3.5 ARTICLE IV
Characterizations of the evolving properties during the milling time of Wood
Fly-Ash Nanoparticles (WFA-NPs)
Presented at the 1st African International Conference on Industrial Engineering and Operations
Management, Pretoria / Johannesburg, South Africa, October 29 – November 1, 2018
Published in the Proceedings of the International Conference on Industrial Engineering and
Operations Management, Pretoria / Johannesburg, South Africa, October 29 – November 1, 2018,
pp. 2040 – 2049.
ISSN: 2169-8767
The evolving properties during the milling of wood-fly ash nano-particles (WFA-NPs) were
characterized by using the scanning electron microscopy (SEM) for the morphological analysis;
Energy Dispersive X-rays (EDX) for the elemental analysis; X-Ray Diffraction (XRD) for the
phases; and crystallite sizes for the measurement; while X-Ray Fluorescence (XRF) was used for
the chemical analysis. The WFA was washed, dried and sieved to 75 µm particle size by using the
ASTM standard sieve; and this was taken as zero (0), when milled. The milling was done for 20,
40 and 60 minutes for WFA, by using a digital vibratory disc-milling machine.
The performance of WFA l in any application depends wholly on whether it is in the form of nano-
, micro-, or macro-particles. It has been established by various authors that sought to investigate
the effect of milling on the Fly Ash, that reduction in the particle size improves the mechanical
properties, the morphology; and also, the absorption rate was increased, when it was in its finest

62
form. Despite the hazardous and environmental unfriendliness of fly ash, so many benefits can be
derived from it.
In this study, the values of WFA and the applications of WFA were documented. The XRD
analysis revealed that the most dominant minerals in wood fly ash are calcite: (CaC03), quartz
(SiO2), Sylvite (KCl), Lime (CaO), maghemite-Q (Ɣ-Fe2O3), nitratetine (Na(NO3) and magnetite
(Fe3O4) phases. The crystal phases detected by the XRD are rhombohedral, hexagonal, cubic and
tetragonal. The particles size was reduced from 75 µm to an average diameter of 200 nm. It was
established in the study that the duration of the milling affects the volume, the surface area, the
particle size, the pore size distributions, the microstructure and some of the other mechanical
properties, as well as the morphology of the powder. This published conference article has been
able to address the objective of the study in item I.

© IEOM Society International
Proceedings of the International Conference on Industrial Engineering and Operations Management Pretoria / Johannesburg, South Africa, October 29 – November 1, 2018
Characterizations of the evolving properties during the milling time of Wood Fly Ash Nanoparticles (WFA-NPs)
Omolayo M. Ikumapayi*1, 2
1, 2 Department of Mechanical Engineering Science, University of Johannesburg, Auckland Park Kingsway Campus, Johannesburg, 2006, South Africa
1, 2 Modern and Advanced Manufacturing Systems (MAMS) Research Group, University of Johannesburg [email protected] ; [email protected]
Esther T. Akinlabi1, 2
1, 2 Department of Mechanical Engineering Science, University of Johannesburg, Auckland Park Kingsway Campus, Johannesburg, 2006, South Africa
1, 2 Modern and Advanced Manufacturing Systems (MAMS) Research Group, University of Johannesburg [email protected]
Abstract
Wood Fly Ash (WFA) as a waste product from the combustion of wood has been regarded as environmental pollution since the generation of wood fly ash is much across the continent predominantly in the villages and most cities of the world. In recent time, effective and reliable utilization of WFA has been developed in areas like filler, additive, aggregate, reinforcement, water purification, activated carbon and most especially construction industries. Its efficiency and performance have been traced to whether is in the form of nano-, micro-, and macro- particles. Effects of milling time on WFA has been studied, its characterizations using Scanning Electron Microscopy (SEM), Energy Dispersive X-ray (EDX) analysis, X-Ray Fluorescence (XRF), and X-Ray Diffraction (XRD) has been studied. The SEM magnification was set to 1000x at 50 µm and the milling time was carried out at 0, 20, 40 and 60 mins. Digital Vibratory Disc Milling Machine (VDMM) rated 380V/50 Hz at 940 rpm was used for the milling. WFA was received at micro-sized particles, it was washed with distilled water to remove impurities and dry in an oven set at 80° C for 48 hours then sieved according to ASTM standard using 75 µm size. The particles size got reduced from 75 µm to average diameter of 200 nm. It was established in the study that the duration of the milling affects volume, surface area, particle size, pore size distributions, microstructure and some other mechanical properties as well as the morphology of the powder.
Keywords: SEM-EDX, Milling Time, Nano Particle, Vibratory Disc Milling, Wood Fly Ash
1.0 Introduction Fly ash has been described as the fine particulate by-product that was released into the atmosphere together with gases as a result of combustion processes (Gianoncelli et al., 2013; Rose, 2018; Rudolf Hela, 2013). Fly Ashes either from municipal solid waste or thermal plant solid waste has been regarded as hazardous waste due to toxic contaminations like chloride salts, heavy metals, dioxins as well as some organic compounds present within (Mubeen, Buekens, Chen, Lu, & Yan, 2017). Fly ash can be described as fine and spherical glassy particles which contain fundamentally of Al2O3, SiO2 as well as CaO as the main constituent (Feng & Clark, 2011). It was established by several researchers that Wood Fly Ash belongs to type F fly ash in the aggregate of Al2O3 + Fe2O3 + SiO2 mass exceeds about 70% sum total of fly ash mass (Liu et al., 2018). High levels of macronutrients are produced from wood ash made from hardwood than conifers, and it has been reported that silica content is usually low (Pitman, 2018; Xu & Shi, 2018). Soil type and application rate are primary effects of wood ash. It has been reported by (Hamidi, Man, Azizli, Ismail, & Nuruddin, 2014) that Fly ash has great potentials to be used in many applications as a result of its abundance and low cost. Notwithstanding, its larger particle size has resulted
2040

© IEOM Society International
Proceedings of the International Conference on Industrial Engineering and Operations Management Pretoria / Johannesburg, South Africa, October 29 – November 1, 2018
in low properties of the resultant product and low reactivity (Ramu, 2016), these reasons propel this current research. High energy milling (HEM) has been used by many researchers to carry out milling of powders (Z. Chen et al., 2016; Dvorak & Hájková, 2016; Li, Chen, Cao, Liu, & Li, 2016; Paul, Manna, & Nando, 2007) and one of the HEM types is high-speed grinding (HSG). The like of (Kumar, Kumar, & Mishra, 2018; Rajak, Raj, Guria, & Pathak, 2017) carried out mechanical activation process by the use of high energy planetary ball mill and validate the experimental result with a milling simulation called back-calculation method for accuracy and acceptability.
Fly Ash has been used by various researchers such as (R. Chen, Li, Xiang, & Li, 2016; Cross, Stephens, & Vollmer, 2005; Dinaharan, Nelson, Vijay, & Akinlabi, 2016; Hemalatha & Ramaswamy, 2017; Kayali, 2005; Ma et al., 2018; Roberto, José, & Andrade, 2017) for activation carbon, water purification, additive/replacement used in Portland cement, as reinforcement for bricks, composite matrix in metal, polymers and ceramics as well as filler in many applications.
Nanotechnology is a control, understanding and restricting of matter in the form of nanometers (i.e. <100 nm) to create materials with basically new properties and functions. Nanotechnology can have applications in engineering especially structural composites, construction, nano-sensors, material coatings, concrete etc(Mehrinejad, Mohseni, Ali, & Sarker, 2015). The effect of milling into nano form was to make the utilization of WFA in any application easier and faster since the particle size greatly affects the mechanical properties and its utilization in another form.
1.1 Application of Fly Ash The performance of Fly Ash (FA) either wood or coal in any application depends wholly on whether is in form of nano-, micro-, and macro- particles. It has been established by various authors that tend to investigate the effect of milling on Fly Ash that reductions in particle size improve mechanical properties, morphology, and also absorption rate is increased when in finest form. Despite the hazardous and environmental unfriendliness of fly ash, so many benefits can be derived in it. Some of the uses and emerging uses of Fly Ash as established by (Chatterjee, 2010) among others are:
1. Fly Ash has potential applications in cement, brickmaking, and concrete, this is the most famousapplication of Fly Ash which has been thriving for decades. It was established that cement constitute up to40- 45 % Fly ash by weight (Rycroft, 2017; Tiwari, 2016)
2. It has been established that FA has potential applications in geopolymers concrete. Though, the market forthis application is developing slowly.
3. FA finds application in the area of Zeolites. These are crystalline solid structures that comprise Oxygen,Aluminium, and Silicon. These Zeolites can be used for water purification, petrochemical cracking andwater softening.
4. Fly Ash can be used to remove Acid Mine drainage also known as AMD which is the contaminant in minewater as well as mine backfilling.
5. FA also very useful in Agriculture to reduce the poor quality of agricultural land as well as to rehabilitatemine land. FA efficacy can be utilized to modify soil health and the performance of crop yielding. Organicfertilizer can be made through it and it can as well serve as bio-leaching.
6. FA can also be used as road surface and filler applications. FA finds new interest in asphalt filler and alsoas embankments layer for tar roads.
7. FA can be used as stiffeners and fillers in plastics and rubber products. It was established that fly ashincreases the strength as well as elasticity of the product which eventually helps in curing and molding. Infacts, FA used in composite insulators of silicone rubber improves tensile strength, dielectric strength, andresistivity while maintaining its hydrophobic characteristics.
8. It can also be used in the mining of coal ash for rare earth and metals.9. It can be used as ceramic glazes. It acts as flux thereby reducing the melting point of the glaze.10. It can serve as compost for landfilling, forestry and agricultural applications.11. It can be used for making soap. Potassium hydroxide (Caustic Potash) is made through it which is one of
the ingredients for making soap.
2041

Proceedings of the International Conference on Industrial Engineering and Operations Management Pretoria / Johannesburg, South Africa, October 29 – November 1, 2018
© IEOM Society International
Value of the data • The data is very valuable in a manner that the users will be able to know the variation in elemental
compositions at different milling time as well as unmilled wood fly ash nanoparticle (WFA-NPs) asrevealed by EDX.
• The data is of value to the users because the users will be able to know likely crystalline structures andminerals that are likely present in WFA as revealed by XRD
• The data obtained can be used in investigating surface processing and modifications as well as aggregate,filler and reinforcement in ceramics, polymer and metal matrix composite at different milling time.
• The data is of value because the users will be able to know the type of chemical composition present inwood fly ash as revealed by XRF.
• The data revealed the micrographs of the milled and unmilled wood fly ash at different milling time, theusers will be able to observe the trend and patterns of the milled wood fly ash which can also predict theabsorption rate of WFA-NPs at any applications.
2.0 Material:
The Wood Fly Ash (WFA) used in this study was collected after a bunch of firewood was burned into charcoal and further undergo combustion process which turned it into ash. The ash was then collected, sieved, washed with distilled water to remove any foreign and unwanted particles, which was then discharged and drained. An electric oven set at 80° C was used to dry it to dryness for 48 hours. The Chemical Composition was analyzed by X-Ray Fluorescence (XRF) as shown in Table 1.
2.1 Experimental Methodology After the Fly Ashes Samples collected were washed with distilled water to remove impurities and they were dry in the oven at 80° C for 48 hours in order to remove the water content, after drying it was then sieved using ASTM meshes standard range by employed KingTest Sieve of 75 µm size on KingTest Sieve Shaker (VB 200/300) having operating voltage 220V/50 Hz and 5 A. The Fly Ashes proportion that passed through the Mesh size of 75 µm was then taken for milling. The flowchart procedure of the powder preparation and characterizations is showed in Figure 1.
2.2 Chemical Compositions of Raw Fly Ashes In this research, the chemical composition of WFA in the as-received state (raw state) was analyzed with the aid of X-Ray Fluorescence (XRF) and the outcome of the analysis is as depicted in Table 1:
Table1: The Chemical Composition Analysis of WFA using XRF CHEMICAL FORMULA WFA (%) Al2O3 10.7 SiO2 46.31 MgO 0.36 TiO2 0.933 Fe2O3 17.28 CaO 3.002 MnO2 0.0471 Na2O 2.48 P2O5 0.113 K2O 2.53 SO3 3.423 LOI 8
Σ= 87.17
2042

Proceedings of the International Conference on Industrial Engineering and Operations Management Pretoria / Johannesburg, South Africa, October 29 – November 1, 2018
© IEOM Society International
Figure 1: Flowchart for the preparation and characterizations of WFA
2.3 Vibratory Disc Milling Machine (VDMM) A Digital Vibratory Disc Grinding Mill Lab Pulveriser (740 x 740 x 950 mm) with Machine Model 2MZ-200 supplied by FTLAB Technology has 2 pieces of bowl with capacity of 200 g per bowl, feed size of less than 15mm, pulverize time of 3 -5 minutes or more depends on the nature of the materials, while the operating voltage of 380V/50 Hz, motor capacity of 1.5 kW with rotational speed of 940rpm was employed to carry out dry mechanical milling (DMM) at varying processing time of 20, 40 and 60 mins which enables the reduction in particle size from micron to nano levels for wood fly ash powder. The machine was thoroughly washed, dried and cleaned with acetone before and after use to remove any contaminants that may be present. 40 g of WFA samples was charged into each bowl and then set for running. The machine was interrupted every 5 mins of operation in order to avoid a rise in temperature and at the same time to limit adherence of the powder within the container walls, the cooling interval before the next running was 20 mins.
2.4 Data Acquisition and Characterizations Mechanical dry milling (MDM) was carried out with different process milling time of 20, 40 and 60 mins. Wood Fly Ash Nanoparticles (WFA-NPs) obtained was then characterized by the use of Scanning Electron Microscopy (SEM), Energy Dispersive X-ray (EDX) analysis, X-Ray Fluorescence (XRF), and X-Ray Diffraction (XRD). These tools were employed to determine the morphology and elemental and chemical compositions at different milling time of 0, 20, 40, 60 mins.
2043
© IEOM Society International
Proceedings of the International Conference on Industrial Engineering and Operations Management Pretoria / Johannesburg, South Africa, October 29 – November 1, 2018
2.5 Scanning Electron Microscope TESCAN model, type VEGA 3 LMH and model no VG9731276ZA (Figure 2) with the following details 50/60 Hz, 230 V and 1300 VA was the type of SEM machine that was employed for the studies. In order to have the sample more conductive and to have better resolution, the samples were sputter coated with a thin layer of carbon just before the scanning electron microscope analyses coupled with Energy Dispersive X-ray spectrometer (EDXS) analyses. The beam intensity used in the analysis was 12 and the accelerating voltage used was 20 kV, all micrographs were taken at SEM magnification of 1.00 kx which is 50 µm for different milling times of 20, 40 and 60 mins. The elemental compositions of WFA-NPs were also analyzed at different milling times by the use of EDS. The SEM micrographs of different milling time were presented in Figure 3 and the EDXS data were presented in Figure 4 and the summary has been presented in Table 2. Sizes of WFA-NPs were determined using SEM/software.
Figure 2: Photograph of the SEM-EDX Analysis Machine used
B1, B2, and B3 presented in figure 5 represent the micrographs of unmilled at 0 min, and that of milled at 20, 40 and 60 mins respectively at 50 µm for an SEM Magnification of 1000x. The micrographs revealed that unmilled has the largest particle sizes when compared to other milled powder. The duration of milling greatly affects the distribution of the particles and how the crystallites are arranged.
Table 2: Variable in Elemental Compositions of WFA-NPs as analyzed by EDXS POWDER ELEMENT ELEMENTAL COMPOSITION AT DIFFERENT MILLING TIMES
0 Min (Unmilled) 20 mins 40 mins 60 mins WFA-NPs Ca 76.6 85.0 85.4 84.9
K 10.3 3.6 3.6 3.8 Mg 5.4 3.7 3.4 3.0 Si 4.7 4.6 4.5 5.0 Al 1.5 1.5 1.3 1.5 Fe 1.5 1.6 1.9 1.8
2044
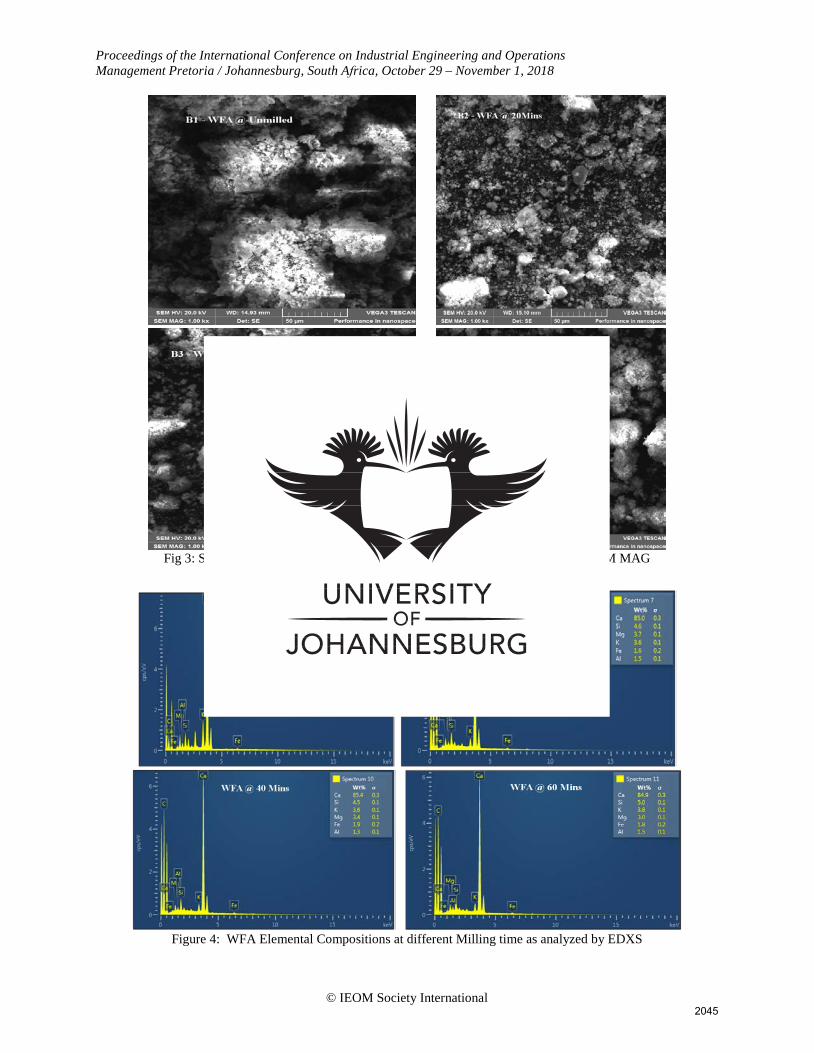
Proceedings of the International Conference on Industrial Engineering and Operations Management Pretoria / Johannesburg, South Africa, October 29 – November 1, 2018
© IEOM Society International
Fig 3: SEM Micrographs of Wood Fly Ash nanoparticles (WFA-NPs) at 1000x SEM MAG at different milling time of 0, 20, 40 and 60 mins.
Figure 4: WFA Elemental Compositions at different Milling time as analyzed by EDXS
2045
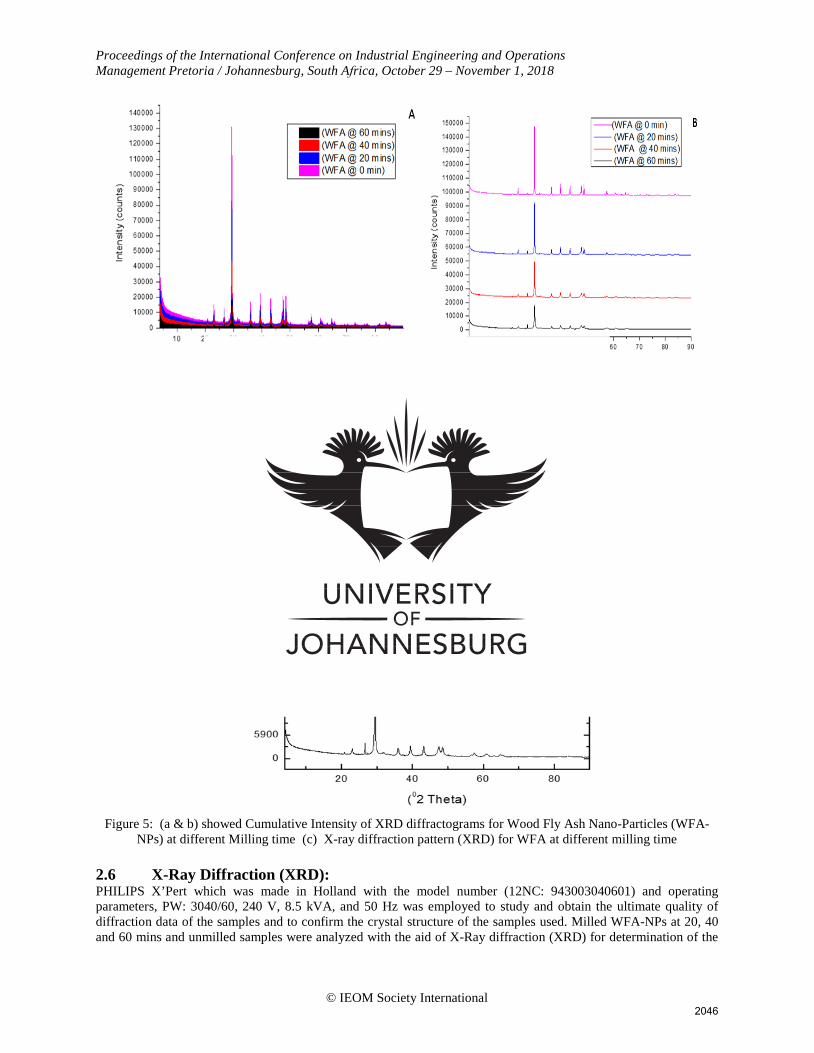
Proceedings of the International Conference on Industrial Engineering and Operations Management Pretoria / Johannesburg, South Africa, October 29 – November 1, 2018
© IEOM Society International
Figure 5: (a & b) showed Cumulative Intensity of XRD diffractograms for Wood Fly Ash Nano-Particles (WFA-NPs) at different Milling time (c) X-ray diffraction pattern (XRD) for WFA at different milling time
2.6 X-Ray Diffraction (XRD):PHILIPS X’Pert which was made in Holland with the model number (12NC: 943003040601) and operating parameters, PW: 3040/60, 240 V, 8.5 kVA, and 50 Hz was employed to study and obtain the ultimate quality of diffraction data of the samples and to confirm the crystal structure of the samples used. Milled WFA-NPs at 20, 40 and 60 mins and unmilled samples were analyzed with the aid of X-Ray diffraction (XRD) for determination of the
2046

© IEOM Society International
Proceedings of the International Conference on Industrial Engineering and Operations Management Pretoria / Johannesburg, South Africa, October 29 – November 1, 2018
existence of crystalline phases before and after disc milling and mineralogical composition was obtained. The crystal phases detected by the XRD are rhombohedral, hexagonal, cubic and tetragonal. After the completion of the milling process, the samples of WFA were analyzed by X-ray diffractometer with the following processing parameters: Current 40 mA, excitation voltage of 40 kV, scanning rate 0.05 (2Ꝋ/seg), angle 2Ꝋ between 10° and 80°, respectively. The diffraction pattern at different milling times is as depicted in figure 5. The XRD was acquired using copper Kα radiation (λ = 1.5406 Å) and kꞵ radiation (λ = 1.39225 Å) and an automatic divergence slit; i.e., an irradiated sample length that is independent of the Bragg angles ((2θ) in degree). XRD analysis showed that the most dominant Minerals in wood fly ash are calcite (CaC03), quartz (SiO2), Sylvite (KCl), Lime (CaO), maghemite-Q (Ɣ-Fe2O3), nitratetine (Na(NO3)) and magnetite (Fe3O4) phases.
An XRD has widely been used in the characterizations of the nanoparticle to study the crystal structure, peak, and crystallite size. Both milled and unmilled WFA powders are characterized by x-ray diffractometer, X-pert software is employed to analyze the phase transformation and structural changes micro to nano particles. XRD sample preparation is done by following the standard particle. Figure 5 (a, b & c) showed that XRD of the WFA powder before and after VDMM was used. Figure 5c shows the x-ray diffraction pattern of wood fly ash at different milling time, it was revealed that at 0 min (unmilled) WFA has the highest peak at 30° (2Ꝋ), this is where the highest intensity was attained, followed by 20 mins milled and the least peak was observed at 60 mins milled. Figure 5 (a and b) also show a similar pattern of x-ray diffraction but in a cumulative pattern. It is clearly shown in Figure 5b that unmilled WFA has the highest peak while 60 mins milled has the least peak. Figure 5a shows the area pattern of different milling time with respect to WFA. It was observed that unmilled has the highest peak and 60 mins milled has the least peak. It was observed in Figure 5c that at 0 min (unmilled), the intensity is at 51,000 counts, 36,000 counts at 20 mins, 25,800 counts at 40 mins and 17,700 counts at 60 mins. Origin 8.5 software is used to plot XRD graphs from the data acquired from the XRD analysis.
3.0 Conclusion In conclusion, from the experiments carried out and the analysis, we, therefore, establish that the particle size of WFA has been reduced from micrometer to nanometer through the help of vibratory disc milling machine (VDMM). The particle size reduced from 75 µm to an average size of 200 nm after 60 mins milling with VDMM. It was observed that there is a reduction in crystallite size and the powder becomes amorphous. The crystalline structure, surface texture of the WFA has changed over the period of milling time as revealed by XRD and SEM. The nanoparticles of WFA can be useful in reinforcement, filler, activated carbon, water purification, it can also be utilized in construction industries as alternative or replacement to cement as well as aggregate in metal, polymer and ceramics matrices. SEM analysis revealed the morphology of WFA particles which was observed to be spherical in shape and the particle sizes reduce as the milling time increases, and the volume and the of the particles increases with increase in milling time. EDX revealed most elemental compositions that are dominant in WFA as presented in Table 2 and the chemical composition has revealed by XRF contained in Table 1. XRD analysis showed that the most dominant Minerals in wood fly ash are calcite (CaC03), quartz (SiO2), Sylvite (KCl), Lime (CaO), maghemite-Q (Ɣ-Fe2O3), nitratetine (Na(NO3) and magnetite (Fe3O4) phases. The crystal phases detected by the XRD are rhombohedral, hexagonal, cubic and tetragonal.
Acknowledgments The authors wish to acknowledge the financial support offered by the University of Johannesburg, South Africa in form of Supervisor-Linked and Merit Bursaries in actualization of this research work for publication.
References
Chatterjee, A. K. (n.d.). Indian Fly Ashes, Their Characteristics, and Potential for Mechano-Chemical Activation for Enhanced Usability. In Second International Conference on Sustainable Construction Materials and Technologies (pp. 1–11).
Chen, R., Li, Y., Xiang, R., & Li, S. (2016). Effect of particle size of fly ash on the properties of lightweight insulation materials. Construction and Building Materials, 123, 120–126. https://doi.org/10.1016/j.conbuildmat.2016.06.140
Chen, Z., Lu, S., Mao, Q., Buekens, A., Chang, W., & Wang, X. (2016). Suppressing Heavy Metal Leaching through Ball Milling of Fly Ash. Energies, 1–13. https://doi.org/10.3390/en9070524
2047

© IEOM Society International
Proceedings of the International Conference on Industrial Engineering and Operations Management Pretoria / Johannesburg, South Africa, October 29 – November 1, 2018
Cross, D., Stephens, J., & Vollmer, J. (2005). Structural Applications of 100 Percent Fly Ash Concrete. In World Journal of Engineering and Technology (pp. 1–19).
Dinaharan, I., Nelson, R., Vijay, S. J., & Akinlabi, E. T. (2016). Microstructure and wear characterization of aluminum matrix composites reinforced with industrial waste fly ash particulates synthesized by friction stir processing. Materials Characterization, 118, 149–158. https://doi.org/10.1016/j.matchar.2016.05.017
Dvorak, K., & Hájková, I. (2016). THE EFFECT OF HIGH-SPEED GRINDING TECHNOLOGY ON THE PROPERTIES OF FLY ASH. MTAEC9, 50(5), 683–687. https://doi.org/10.17222/mit.2015.127
Feng, X., & Clark, B. (2011). Evaluation of the Physical and Chemical Properties of Fly Ash Products for Use in Portland Cement Concrete. In World of Coal Ash (WOCA) Conference (pp. 1–8).
Gianoncelli, A., Zacco, A., Struis, R. P. W. J., Borgese, L., Depero, L. E., & Bontempi, E. (2013). Fly Ash Pollutants, Treatment and Recycling List of Abbreviations. https://doi.org/10.1007/978-3-319-02387-8
Hamidi, R. M., Man, Z., Azizli, A., Ismail, L., & Nuruddin, M. F. (2014). Mechanical activation of fly ash by high energy planetary ball mill and the effects on physical and morphology properties. Applied Mechanics and Materials, 625, 38–41. https://doi.org/10.4028/www.scientific.net/AMM.625.38
Hemalatha, T., & Ramaswamy, A. (2017). A review on fly ash characteristics e Towards promoting high volume utilization in developing sustainable concrete. Journal of Cleaner Production, 147, 546–559. https://doi.org/10.1016/j.jclepro.2017.01.114
Kayali, O. (2005). High-Performance Bricks from Fly Ash. In World of Coal Ash (WOCA) Conference (pp. 1–13). Kumar, S., Kumar, S., & Mishra, S. C. (2018). Processing and Characterization of Fly-ash Compacts. Materials
Today: Proceedings, 5(2), 3396–3402. https://doi.org/10.1016/j.matpr.2017.11.584 Li, H., Chen, Y., Cao, Y., Liu, G., & Li, B. (2016). Comparative study on the characteristics of ball-milled coal fly
ash. Journal of Thermal Analysis and Calorimetry, 124(2), 839–846. https://doi.org/10.1007/s10973-015-5160-5
Liu, C., Zheng, S., Ma, S., Luo, Y., Ding, J., Wang, X., & Zhang, Y. (2018). A novel process to enrich alumina and prepare silica nanoparticles from high-alumina fly ash. Fuel Processing Technology, 173(December 2017), 40–47.
Ma, B., Liu, X., Tan, H., Zhang, T., Mei, J., Qi, H., … Zou, F. (2018). Utilization of pretreated fly ash to enhance the chloride binding capacity of the cement-based material. Construction and Building Materials, 175, 726–734. https://doi.org/10.1016/j.conbuildmat.2018.04.178
Mehrinejad, M., Mohseni, E., Ali, M., & Sarker, P. (2015). Effect of nano-CuO and fly ash on the properties of self-compacting mortar. Construction and Building Materials, 94, 758–766. https://doi.org/10.1016/j.conbuildmat.2015.07.063
Mubeen, I., Buekens, A., Chen, Z., Lu, S., & Yan, J. (2017). De novo formation of dioxins from milled model fly ash. Environ Sci Pollut Res, 24, 19031–19043. https://doi.org/10.1007/s11356-017-9528-x
Paul, K. T., Manna, Æ. S. K. S. Æ. I., & Nando, K. K. C. Æ. G. B. (2007). Preparation and Characterization of Nano structured Materials from Fly Ash : A Waste from Thermal Power Stations, by High Energy Ball Milling. Nanoscale Res Lett (2007), 2, 397–404. https://doi.org/10.1007/s11671-007-9074-4
Pitman, R. M. (2018). Wood ash use in forestry – a review of the environmental impacts. Forestry, (June), 563–588. https://doi.org/10.1093/forestry/cpl041
Rajak, D. K., Raj, A., Guria, C., & Pathak, A. K. (2017). Grinding of Class-F fly ash using planetary ball mill : A simulation study to determine the breakage kinetics by direct- and back-calculation method. South African Journal of Chemical Engineering, 24, 135–147.
Ramu, I. (2016). Evaluation of mechanical behavior of nanometer and micrometer fly ash particle-filled woven bidirectional jute/glass hybrid nanocomposites. Journal of Industrial Textiles, 45(6), 1268–1287. https://doi.org/10.1177/1528083714557058
Roberto, S., José, J., & Andrade, D. O. (2017). Investigation of mechanical properties and carbonation of concretes with construction and demolition waste and fly ash. Construction and Building Materials Journal, 153, 704–715. https://doi.org/10.1016/j.conbuildmat.2017.07.143
Rose, N. L. (2018). Spheroidal Carbonaceous Fly Ash Particles in the Anthropocene. Encyclopedia of the Anthropocene, 2020, 189–195. https://doi.org/https://doi.org/10.1016/B978-0-12-809665-9.10005-9
Rudolf Hela, D. O. (2013). The Mechanical Activation of Fly Ash. In Procedia Engineering (Vol. 65, pp. 87–93). https://doi.org/10.1016/j.proeng.2013.09.016
Rycroft, M. (2017). Exploring the many uses of fly ash. Energize. Tiwari, M. K. (2016). Fly Ash Utilization A Brief Review in Indian Context Fly Ash Utilization : A Brief Review in
Indian Context. International Research Journal of Engineering and Technology, 03(Ju04), 949–956. Xu, G., & Shi, X. (2018). Resources, Conservation & Recycling Characteristics and applications of fly ash as a
2048
Proceedings of the International Conference on Industrial Engineering and Operations Management Pretoria / Johannesburg, South Africa, October 29 – November 1, 2018
© IEOM Society International
sustainable construction material : A state-of-the-art review. Resources, Conservation & Recycling, 136(April), 95–109. https://doi.org/10.1016/j.resconrec.2018.04.010
Biographies
Omolayo M. Ikumapayi is a Ph.D. candidate at the Department of Mechanical Engineering Science, University of Johannesburg South Africa. He obtained MSc in Mechanical Engineering (option in Design and Production) from the University of Lagos, Nigeria and his BEng in Mechanical Engineering from the Federal University of Agriculture Makurdi, Nigeria. He is currently a contract staff (Lecturer) at the University of Johannesburg, South Africa. He was a one-time Lecturer at Afe Babalola University, Ado Ekiti and Covenant University Ota, Nigeria. He was also a one-time teaching assistant at the University of Lagos, Nigeria. He is a registered Engineer with COREN, Member of Nigerian Society of Engineer (MNSE), Member of Nigerian Institution of Mechanical Engineer (MNIMechE), Member of Chartered Institute of purchasing and supply management of Nigeria (MCIPSM), Member of Academy for Entrepreneurial Studies (M.AES) and Associate Member of the Certified Institute of Shipping, Nigeria (ACIS) among others. His research interests include manufacturing, simulation, processing using agro-wastes powders, surface modifications, characterizations, tribocorrossion, Friction stir processing/welding, electron beam processing/welding and nanotechnology.
Esther T. Akinlabi is currently a Full Professor in the Department of Mechanical Engineering Science and Vice Dean, Teaching and Learning, Faculty of Engineering and Built Environment (FEBE), University of Johannesburg South Africa. She has authored several peer-reviewed scholarly Journals, Books, and Book Chapters. Her area of interests is in Energy, Friction Stir Welding/Processing, additive manufacturing, laser manufacturing, AutoCAD, Research Design.
2049
63
3.6 ARTICLE V
A study on the effects of the milling time on the Physicochemical and
Morphological Characteristics of Cow-Bone Powder (CBP)
Presented at the 1st Africa International Conference on Industrial Engineering and Operations
Management, Pretoria / Johannesburg, South Africa, October 29 – November 1, 2018
Published in the Proceedings of the International Conference on Industrial Engineering and
Operations Management, Pretoria / Johannesburg, South Africa, October 29 – November 1, 2018,
pp. 2040 – 2049.
ISSN: 2169-8767
The morphological and physicochemical characteristics of cow-bone powder (CBP) were studied
with the aid of the Scanning Electron Microscope (SEM), which was set to 1.00kx at 50 µm, 2.00x
at 20 µm and 5.00kx at 10 µm for the morphological analysis; while the Energy Dispersive X-ray
(EDX) for elemental analysis, X-Ray Diffraction (XRD) for phases and the crystallite-size
measurements; and X-Ray Fluorescence (XRF) was used for the chemical composition analysis.
The study was conducted at varying milling times from 0 – 60 minutes at a span of 20 minutes,
using the digitalized vibratory disc-milling machine. The bone of the cow head (Skull) was
collected from the abattoir, washed and cleaned from meat, sun-dried for 6 weeks and washed
again with de-ionized water, to remove any impurities and contaminants.
It was then transferred to the oven set at 50 °C to dry for 5 hours before crushing; It was then
crushed and pulverised. The pulverized powder was then dried in an electric oven set at 50° C for
a week to ensure total dryness; and it was sieved, according to the ASTM standard, using a 150

64
µm sieve size. It was revealed that the particle size increased from 150 µm to an average diameter
of 300 nm after 60 minutes of mechanical milling.
The values of the data acquired, the results of XRF, the EDX and the SEM were presented in the
manuscript. The duration of milling affects the pore-size distribution, the microstructures, the
particle sizes, as well as the mechanical properties of the powder. This published conference
article has been able to address the objective of the study in item I.
© IEOM Society International
Proceedings of the International Conference on Industrial Engineering and Operations Management Pretoria / Johannesburg, South Africa, October 29 – November 1, 2018
A Study into the effects of the milling time on the Physiochemical and Morphological Characteristics of Cow
Bone Powder (CBP) Omolayo M. Ikumapayi*1, 2
1, 2 Department of Mechanical Engineering Science, University of Johannesburg, Auckland Park Kingsway Campus, Johannesburg, 2006, South Africa
1, 2 Modern and Advanced Manufacturing Systems (MAMS) Research Group, University of Johannesburg [email protected] ; [email protected]
Esther T. Akinlabi1, 2 1, 2 Department of Mechanical Engineering Science, University of Johannesburg, Auckland Park Kingsway Campus, Johannesburg, 2006, South Africa 1, 2 Modern and Advanced Manufacturing Systems (MAMS) Research Group, University of Johannesburg
Abstract
Cow bone has been regarded as bio-waste and environmental pollutant, nevertheless, many researchers have developed ways to utilize this biomaterial and make it environmental friendly especially in the areas of reinforcement, activated carbon, filler, additive as well as water purification. It has also been established in the recent time that performance, efficiency and effective utilization of CBP depend solely on whether is in the form of nano-, micro-, and macro- particles(Oladele, I, 2016). The bone of the cow head (Skull) was collected from the abattoir, washed and cleaned from meat, sun-dried for 6 weeks and washed again with de-ionized water to remove impurities and contaminants, it was then transferred to the oven set at 50 °C to dry for 5 hours before crushing, it was then crushed and pulverised. The pulverized powder then dried in an electric oven set at 50° C for a week to ensure total dryness and sieved according to ASTM standard using 150 µm size. In this study, Scanning Electron Microscopy (SEM), Energy Dispersive X-ray (EDX), X-Ray Fluorescence (XRF) have been employed to characterize the powder at different milling time varying from 0, 20, 40 and 60 Mins. Digital Vibratory Disc Milling Machine (VDMM) rated 380V/50Hz at 940 rpm was used for the milling. The SEM Images was set to 1.00kx at 50 µm, 2.00x at 20 µm and 5.00kx at 10 µm. The particles size got reduced from 150 µm to average diameter of 300 nm. It was established in the study that the duration of the milling affects volume, surface area, particle size, pore size distributions, microstructure and some other mechanical properties as well as the morphology of the powder.
Keywords: Cow Bone Powder, Milling time, SEM-EDX, XRD, XRF
1.0 Introduction
Cow bones are readily available at the abattoirs in South Africa as a result of a large number of cows being slaughtered daily in order to meet the demand of the people. Research showed that these bones are apparently become waste and pollute the environments making it unfit to live in. The study investigates how what regarded as environmental pollutants can be converted to useful application in engineering and other fields. Cow bone being natural animal fibre is expected to have good surface compatibility in addition to the structural compatibility requirements as biomaterials (Ahmad et al., 2014; Aramide, Ibitoye, Oladele, & Borode, 2010; Oladele & Adewole, 2013).
2050

© IEOM Society International
Proceedings of the International Conference on Industrial Engineering and Operations Management Pretoria / Johannesburg, South Africa, October 29 – November 1, 2018
The performance of cow bone powder in any application has been traced to whether CBP is in form of nano-, micro-, and macro- particles. CBP has been established to have improved strength and wear properties when used as reinforcement and fillers(Adewole, 2015; Agunsoye, Talabi, Awe, & Kelechi, 2013). Some researchers have confirmed that CBP has absorption capacities to remove heavy metals such as Cadmium from the body of palm oil mill, also for energizers in case hardening of mild steel and other metals(Ahmad et al., 2012; Ihom, 2013). CBP has been applied in many applications such as removal of fluoride from the body of water, removal of lead in aqueous solution, and as the same time for the treatment of high strength industrial waste water (Abdulrahman, Latiff, Daud, Ridzuan, & Jagaba, 2016; Deydier, Guilet, Sarda, & Sharrock, 2005).
Researchers have done great works to investigate into natural fiber composite (i.e. biocomposites) as it applied in reinforcement either in natural or synthetics. Investigations have spanned into the distributions of CBP particles size in order to study its influence on mechanical and metallurgical properties(Asuke et al., 2012; Oladele & Adewole, 2013). It was revealed that fine cow bone particles improve strength while coarse particles will give improved toughness. It was revealed from the study that CBP either fine or coarse is structurally compatible and it is expected that this will also aid compatibility with the surface conditions as biomaterials since this is derived from animal fibers based particles. Cow bone particles have been proven to in a composite material of polymer to have increased tensile strength and hardness values (Daramola & Adewole, 2014) while rigidity and impact strength decreased. The study showed that the addition of CBP has a significant impact on wear behavior of the composite but there is no effect between the interaction of load and time (Oladele, I, 2016). It was established by (Abdulrahman et al., 2016; Mohammed, Aboje, Auta, & Jibril, 2012) that activated carbon derived from cow bones are more effective and efficient in lowering the acidity content of palm oil when compare with dog bones, chicken bones, and goat bones.
Value of the data • The data revealed the microstructures of the cow bone (Skull) powder at different milling time, this will be
useful to the users as to know the likely trends and patterns of the CBP micrographs which will enable themto predict the absorption rate when using CBP in any application.
• The data revealed the chemical compositions of CBP through the use of XRF, this will also be of greatvalue to the user
• The elemental compositions of the CBP were also revealed via the use of EDX, this will guide the users onthe likely elements that are present in CBP
• The data obtained can be used in investigating surface modification, surface texture, and processing whichwill be applicable in the reinforcement of metals, polymer, and ceramics composites, it will be used asfiller, aggregate, activated carbon etc.
• The data obtained can be used as the basis for determining other animal bones chemical compositionsunder the same experimental conditions
2.0 Material:
The bone of the cow heads (Skulls), de-ionized water, acetone was used in this study. The bones were collected from the abattoir as shown in Figure 1a, washed and cleaned from meat, sun-dried for 6 weeks as shown in Figure 1b and washed again then dried, crushed and pulverized.
2.1 Experimental Methodology After the Cow Bone (Skulls) Samples collected from the abattoir, washed and cleaned from meat, sun-dried for 6 weeks and washed again with de-ionized water to remove impurities and contaminants, it was then transferred to the oven set at 50 °C to dry for 5 hours and also cleaned with acetone before crushing, it was then crushed and pulverised. After which it was dried in the oven at 50° C for seven days in order to remove the water content, after drying it was then sieved using ASTM meshes standard range by employed KingTest Sieve (see Figure 1c) of 150 µm size on KingTest Sieve Shaker (VB 200/300) having operating voltage 220V/50 Hz and 5 A. The CBP proportion that passed through the Mesh size of 150 µm was then taken for milling. The flowchart procedure of the powder preparation and characterizations is showed in Figure 2.
2051

Proceedings of the International Conference on Industrial Engineering and Operations Management Pretoria / Johannesburg, South Africa, October 29 – November 1, 2018
© IEOM Society International
Figure 1: (a) Fresh Cow Skull Bone Obtained (b) Dried Cow Bone (c) Cow Bone Powder (CBP) in a 150 µm ASTM standard Sieve
2.2 CHEMICAL COMPOSITIONS OF COW BONE POWDER In this research, the chemical composition of Cow Bone Powder (CBP) was analyzed at 150 µm with the aid of X-Ray Fluorescence (XRF) spectroscopy with model PHILIP PW1404 XRF Wavelength Disperse Spectrometer and the outcome of the analysis is as depicted in Table 1:
Table1: The Chemical Composition Analysis of CBP using XRF
CHEMICAL FORMULA WFA (%) CaO 45.06 SiO2 0.08 MgO 0.65 TiO2 0.06 Fe2O3 0.25 Al2O3 0.16 MnO 0.01 Na2O 0.17 P2O5 34.60 K2O 0.12
ZnO 0.02 LOI 16.28
Σ= 97.46
2.3 Vibratory Disc Milling Machine (VDMM) A Digital Vibratory Disc Grinding Mill Lab Pulveriser (740 x 740 x 950 mm) as depicted in figure 3 with Machine Model 2MZ-200 supplied by FTLAB Technology has 2 pieces of bowl with capacity of 200 g per bowl, feed size of less than 15mm, pulverize time of 3 -5 minutes or more depends on the nature of the materials, while the operating voltage of 380V/50 Hz, motor capacity of 1.5 kW with rotational speed of 940rpm was employed to carry out dry mechanical milling (DMM) at varying processing time of 20, 40 and 60 mins which enables the reduction in particle size from micron to nano levels for pulverized cow bone powder (CBP). The machine was thoroughly washed, dried and cleaned with acetone before and after use to remove any contaminants that may be present. 100 g of CBP samples was charged into each bowl and then set for running. The machine was interrupted every 5 mins of operation in order to avoid a rise in temperature and at the same time to limit adherence of the powder within the container walls, the cooling interval before the next running was 20 mins and more depending on the rise in the temperature of the containing disc.
2052
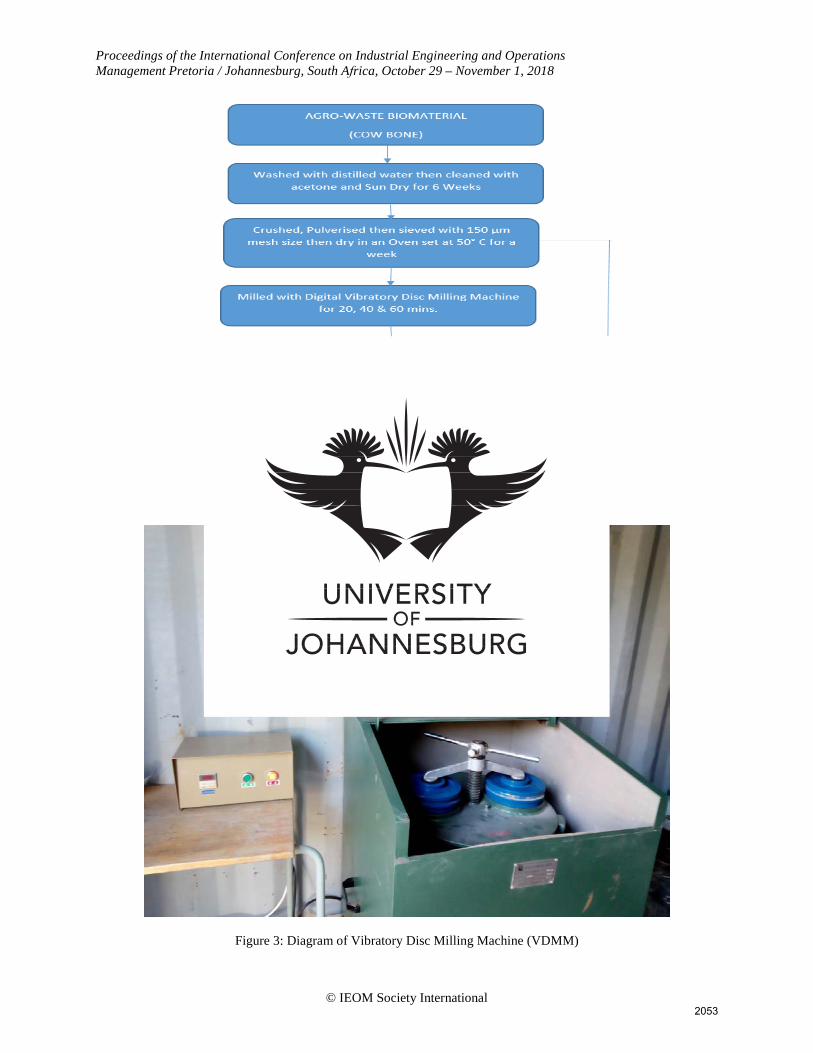
Proceedings of the International Conference on Industrial Engineering and Operations Management Pretoria / Johannesburg, South Africa, October 29 – November 1, 2018
© IEOM Society International
Figure 2: Flowchart for the preparation and characterizations of CBP
Figure 3: Diagram of Vibratory Disc Milling Machine (VDMM)
2053

© IEOM Society International
Proceedings of the International Conference on Industrial Engineering and Operations Management Pretoria / Johannesburg, South Africa, October 29 – November 1, 2018
2.4 Microstructural Analysis Cow Bone Powder (CBP) obtained was then characterized by the use of scanning electron microscopy (SEM) and Energy dispersive X-ray spectroscopy (EDXS). These tools were employed to determine the morphology and elemental composition at different milling time of 20, 40, 60 Mins and unmilled samples.
2.5 Data Acquisition and Characterizations Mechanical dry milling (MDM) was carried out with different process milling time of 20, 40 and 60 mins. Cow Bone Powder (CBP) obtained was then characterized by the use of Scanning Electron Microscopy (SEM), Energy Dispersive X-ray (EDX) analysis, X-Ray Fluorescence (XRF). These tools were employed to determine the morphology and elemental and chemical compositions at different milling time of 0, 20, 40, 60 mins.
2.6 Scanning Electron Microscope (SEM) TESCAN model, type VEGA 3 LMH and model no VG9731276ZA (Figure 4) with the following details 50/60 Hz, 230 V and 1300 VA was the type of SEM machine that was employed for the studies. In order to have the sample more conductive and to have better resolution, the samples were sputter coated with a thin layer of carbon just before the scanning electron microscope analyses coupled with Energy Dispersive X-ray spectrometer (EDXS) analyses. The beam intensity used in the analysis was 12 and the accelerating voltage used was 20KV, all micrographs were taken at SEM magnification of 1.00kx, 2.00kx and 5.00kx for different milling times of 20, 40 and 60 mins. The elemental compositions of CBP were also analyzed at different milling times by the use of EDS. The SEM micrographs of different milling time were presented in Figure 5 and the EDXS data were presented in Figure 6 and the summary has been presented in Table 2. Sizes of CBPs were determined using SEM/software.
Figure 4: Photograph of the SEM-EDX Analysis Machine used
2054
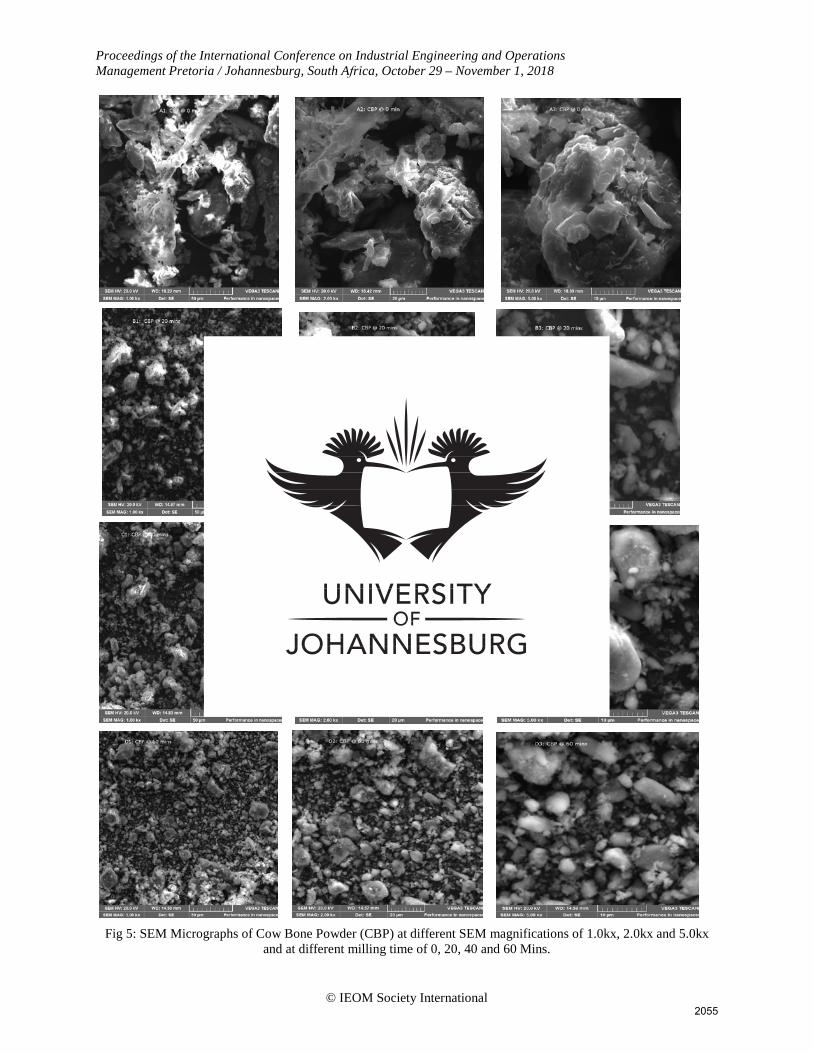
Proceedings of the International Conference on Industrial Engineering and Operations Management Pretoria / Johannesburg, South Africa, October 29 – November 1, 2018
© IEOM Society International
Fig 5: SEM Micrographs of Cow Bone Powder (CBP) at different SEM magnifications of 1.0kx, 2.0kx and 5.0kx and at different milling time of 0, 20, 40 and 60 Mins.
2055

© IEOM Society International
Proceedings of the International Conference on Industrial Engineering and Operations Management Pretoria / Johannesburg, South Africa, October 29 – November 1, 2018
Figure 5 above, label A1, A2, A3 on the micrographs represent the Unmilled (0 min) Cow Bone Powder at different magnifications of 1.0kx, 2.0kx and 5.0kx resulting to 50 µm, 20 µm, and 10 µm respectively, this show coarse particle size since it was 150 µm sieved (Unmilled). B1, B2, and B3 show the micrographs of 20 Minutes milling at SEM magnifications of 1.0kx, 2.0kx and 5.0kx resulting to 50 µm, 20 µm, and 10 µm respectively. C1, C2, and C3 presented the micrographs of 40 minutes of milling at 1.0kx, 2.0kx and 5.0kx resulting to 50 µm, 20 µm and 10 µm respectively while D1, D2, and D3 represent the micrographs of 60 minutes of milling at 1.0kx, 2.0kx and 5.0kx resulting to 50 µm, 20 µm, and 10 µm respectively. The micrographs revealed that unmilled has the largest particle sizes when compared to other milled powder. The duration of milling greatly affects the distribution of the particles and how the crystalline is arranged. D1 revealed smallest grain size structures when compared with C1, B1, and A1 of the same 1.0kx SEM MAG. Likewise, D2 and D3 were smaller in particle size structures when compared with other members of the same SEM MAG.
Figure 6: Elemental Compositions of CBP at different Milling time as analyzed by EDXS
Table 2: Variable in Elemental Compositions of CBP as analyzed by EDXS POWDER ELEMENT ELEMENTAL COMPOSITION AT DIFFERENT MILLING TIMES
0 Min (Unmilled) 20 Mins 40 Mins 60 Mins CBP C 46.3 45.6 53.9 40.8
O 27.2 30.7 30.0 32.1 Ca 18.3 16.2 10.7 18.3 P 7.5 6.8 4.8 8.0
Na 0.4 0.4 0.4 0.4 Mg 0.3 0.5 0.2 0.4
2056

Proceedings of the International Conference on Industrial Engineering and Operations Management Pretoria / Johannesburg, South Arica, October 29 – November 1, 2018
© IEOM Society International
Figure 6 and Table 2 showed the variations in elemental compositions of Cow Bone Powder. It was observed from table 2 that Carbon (c), Oxygen (O) and Calcium (Ca) have a relatively high percentage of compositions. The percentage composition of Phosphorous (P) is higher than of Sodium (Na) and Magnesium (Mg). Mg and Na have the least composition in Cow Bone as analyzed by EDX. The elemental composition varied along with the milling time from 0 – 60 mins.
3.0 Conclusion
From the results obtained and their discussions, the following conclusions were drawn from the research carried out: The particle size reduced from 150 µm to an average size of 300 nm after milling for 60 mins using digital vibratory disc milling machine shown in (Figure 2). EDX revealed different elemental compositions that were contained in CBP which are Calcium, Phosphorous, Sodium, Magnesium, Carbon and Oxygen in which any user of CBP in near future can easily use as the basis of their research work. XRF also established different chemical compositions contained in milled CBP. It can be concluded that CBP can be used in different science and engineering applications varying from reinforcement in metal, polymer and ceramics composites, fillers, activated carbon, water purifier, heavy metals absorber, etc.
ReferenceS
Abdulrahman, A., Latiff, A. A. A., Daud, Z., Ridzuan, M. B., & Jagaba, A. H. (2016). Preparation and Characterization of Activated Cow Bone Powder for the Adsorption of Cadmium from Palm Oil Mill Effluent. IOP Conference Series: Materials Science and Engineering, 136(1), 1–7. https://doi.org/10.1088/1757-899X/136/1/012045.
Adewole, T. (2015). Effect of Cow Bone Ash Particle Size Distribution on the Mechanical Properties of Cow Bone Ash-Reinforced Polyester Composites. Chemistry and Materials Research, 7(3), 40–47.
Agunsoye, J. O., Talabi, S. I., Awe, O., & Kelechi, H. (2013). Mechanical Properties and Tribological Behaviour of Recycled Polyethylene/Cow Bone Particulate Composite. Journal of Materials Science Research, 2(2), 1–39. https://doi.org/10.5539/jmsr.v2n2p41.
Ahmad, M., Lee, S. S., Lim, J. E., Lee, S. E., Cho, J. S., Moon, D. H., … Ok, Y. S. (2014). Speciation and phytoavailability of lead and antimony in small arms range soil amended with mussel shell, cow bone, and biochar: EXAFS spectroscopy and chemical extractions. Chemosphere, 95(1), 433–441. https://doi.org/10.1016/j.chemosphere.2013.09.077.
Ahmad, M., Soo Lee, S., Yang, J. E., Ro, H. M., Han Lee, Y., & Sik Ok, Y. (2012). Effects of soil dilution and amendments (mussel shell, cow bone, and biochar) on Pb availability and phytotoxicity in military shooting range soil. Ecotoxicology and Environmental Safety, 79, 225–231. https://doi.org/10.1016/j.ecoenv.2012.01.003.
Aramide, F. O., Ibitoye, S. A., Oladele, I. O., & Borode, J. O. (2010). Pack carburization of mild steel, using a pulverized bone as carburized: Optimizing process parameters. Leonardo Electronic Journal of Practices and Technologies, 9(16), 1–12.
Asuke, F., Aigbodion, V. S., Abdulwahab, M., Fayomi, O. S. I., Popoola, A. P. I., Nwoyi, C. I., & Garba, B. (2012). Effects of a bone particle on the properties and microstructure of polypropylene/bone ash particulate composites. Results in Physics, 2, 135–141. https://doi.org/10.1016/j.rinp.2012.09.001.
Daramola, O. O., & Adewole, A. T. (2014). Comparative Study of the Reinforcement Efficiency of Cow Matrix Composites for Biomedical. ACTA TEHNICA CORVINIENSIS – Bulletin of Engineering, 4, 1–29.
Deydier, E., Guilet, R., Sarda, S., & Sharrock, P. (2005). Physical and chemical characterization of crude meat and bone meal combustion residue: “Waste or raw material?” Journal of Hazardous Materials, 121(1–3), 141–148. https://doi.org/10.1016/j.jhazmat.2005.02.003.
Ihom, P. A. (2013). Case hardening of mild steel using cow bone as Energiser. African Journal of Engineering Research, 1(October), 97–101.
Mohammed, A., Aboje, A. A., Auta, M., & Jibril, M. (2012). A Comparative Analysis and Characterization of Animal Bones as Adsorbent. Pelagia Research Library Advances in Applied Science Research, 3(5), 3089–3096. Retrieved from www.pelagiaresearchlibrary.com.
Oladele, I, O. (2016). Development of Bone Particulate Reinforced Epoxy Composite For Biomedical Application. Journal of Applied Biotechnology & Bioengineering, 1(1), 1–6. https://doi.org/10.15406/jabb.2016.01.00006.
Oladele, I. O., & Adewole, T. A. (2013). Influence of Cow Bone Particle Size Distribution on the Mechanical
2057

Proceedings of the International Conference on Industrial Engineering and Operations Management Pretoria / Johannesburg, South Africa, October 29 – November 1, 2018
© IEOM Society International
Properties of Cow Bone-Reinforced Polyester Composites. Biotechnology Research International, 5, 1–6. https://doi.org/10.1155/2013/725396.
Biographies
Omolayo M. Ikumapayi is a Ph.D. candidate at the Department of Mechanical Engineering Science, University of Johannesburg South Africa. He obtained MSc in Mechanical Engineering (option in Design and Production) from the University of Lagos, Nigeria and his BEng in Mechanical Engineering from the Federal University of Agriculture Makurdi, Nigeria. He is currently a contract staff (Lecturer) at the University of Johannesburg, South Africa. He was a one-time Lecturer at Afe Babalola University, Ado Ekiti and Covenant University Ota, Nigeria. He was also a one-time teaching assistant at the University of Lagos, Nigeria. He is a registered Engineer with COREN, Member of Nigerian Society of Engineer (MNSE), Member of Nigerian Institution of Mechanical Engineer (MNIMechE), Member of Chartered Institute of purchasing and supply management of Nigeria (MCIPSM), Member of Academy for Entrepreneurial Studies (M.AES) and Associate Member of the Certified Institute of Shipping, Nigeria (ACIS) among others. His research interests include manufacturing, simulation, processing using agro-wastes powders, surface modifications, characterizations, tribocorrossion, Friction stir processing/welding, electron beam processing/welding and nanotechnology.
Esther T. Akinlabi is currently a Full Professor in the Department of Mechanical Engineering Science and Vice Dean, Teaching and Learning, Faculty of Engineering and Built Environment (FEBE), University of Johannesburg South Africa. She has authored several peer-reviewed scholarly Journals, Books, and Book Chapters. Her areas of interests are in Energy, Friction Stir Welding/Processing, additive manufacturing, laser manufacturing, AutoCAD, Research Design etc.
2058

65
3.7 ARTICLE VI
Electrochemical investigation of calcined agrowastes powders on friction stir
processing of aluminium-based matrix composites.
Submitted to the 10th International Conference on Material Processing and Characterization
(ICMPC), February 21st – 23rd 2020 at GLA University, Mathura, U. P., India
Published in Materials Today: Proceedings 26 (2020) 3238–3245,
https://doi.org/10.1016/j.matpr.2020.02.906
ISSN: 2214-7853
In this current paper, the corrosion behaviours of calcined agrowaste powders were studied. The
calcined agrowaste powders were developed from their respective agrowastes. The powders were
coconut-shell ash (CSA), palm-kernel shell ash (PKSA) and cow-bone ash (CBA). These three
powders were used as reinforcement in aluminium alloy 7075-T651 metal matrix composites
(AMMC); and after their reinforcement on the base metal and the friction stir processing. A
corrosion study was carried out on each of the fabricated AMMCs.
In this study, the calcined coconut-shell ash (CSA), the palm-kernel shell ash (PKSA) and the cow-
bone ash (CBA) were put inside a graphite crucible; and they were then heat-treated for two hours,
at about 500 °C inside the muffle furnace individually; and they were then allowed to cool to room
temperature within the furnace.
The friction stir processing was carried out by using the following parametric values: a travel speed
of 20 mm/min, a plunge depth of 0.3, and a rotational speed of 1500 rpm, with a tilt angle of 0.3
mm; the corrosion study was employed via Potentiodynamic Polarization technique in 3.5 % NaCl

66
solution. The results show that AA7075-T651/PKSA had the highest percentage of inhibition
efficiency (%IE) of 91.40 %; while AA7075-T651/CSA and AA7075-T651/CBA had 82.45 %
and 71.79 %, respectively. The corrosion rate was lowest in AA7075-T651/PKSA, having 0.43574
mm/year; while AA7075-T651/CSA and AA7075-T651/CBA were 0.8891 mm/year and 1.42284
mm/year, respectively. It was also noted that AA7075-T651/PKSA had the highest polarization
resistance of 1075.6 Ω and AA7075-T651/CSA was 564.4 Ω; while AA7075-T651/CBA was
found to be 276.42 Ω. This published conference article has been able to address some of the
objectives of the study especially those in item I, III to V.

Materials Today: Proceedings 26 (2020) 3238–3245
Contents lists available at ScienceDirect
Materials Today: Proceedings
journal homepage: www.elsevier .com/locate /matpr
Electrochemical investigation of calcined agrowastes powders on frictionstir processing of aluminium-based matrix composites
https://doi.org/10.1016/j.matpr.2020.02.9062214-7853/ 2019 Elsevier Ltd. All rights reserved.Selection and peer-review under responsibility of the scientific committee of the 10th International Conference of Materials Processing and Characterization.
⇑ Corresponding author.E-mail address: [email protected] (O.M. Ikumapayi).
O.M. Ikumapayi a,⇑, E.T. Akinlabi a, O.O. Abegunde a, O.S.I. Fayomi b
aDepartment of Mechanical Engineering Science, University of Johannesburg, Auckland Park Kingsway Campus, Johannesburg 2006, South AfricabDepartment of Mechanical Engineering, Covenant University, Ota, P.M.B 1023, Nigeria
a r t i c l e i n f o
Article history:Received 6 November 2019Accepted 14 February 2020Available online 30 March 2020
Keywords:Agrowastes inhibitorsAluminium alloyCorrosion resistanceCarbonaceous powdersFriction stir processing
a b s t r a c t
The ultimate goal of this report was to use eco-friendly calcined agro-waste powders such as coconutshell ash (CSA), cow bone ash (CBA) as well as palm kernel shell ash (PKSA) and to analyze the percentageinhibition performance efficiency (percent IPE) on friction stir processed (FSP) of super strengthaluminum alloy 7075-T651. The motive behind this study was to establish whether agro-waste powderscould serve as a successful alterative to metallic powders for enhancing as well as corrosion resistance inaluminum alloy 7075-T651. The study reported three different carbonaceous agro-waste powders such asPKSA, CBA and CSA in 3.5 percent NaCl as reinforcements and corrosion prevention and confirmed thatPKSA as corrosion susceptible performed better than CBA and CSA under the same environmental factorsand can be an acceptable substitute for metallic powders as a corrosion protection. The resultsestablished that PKSA has the least corrosion rate of 0.4357 mm/year and this was followed by the rein-forcement from CSA with 0.8291 mm/yr and lastly 1.42284 mm/yr for CBA. In the same vein, reinforcingwith PKSA yielded the highest polarization resistance with 1075.6X and this was followed by thereinforcement of CSA with 564.4X and CBA of 276.42X. 2019 Elsevier Ltd. All rights reserved.Selection and peer-review under responsibility of the scientific committee of the 10th InternationalConference of Materials Processing and Characterization.
1. Introduction
Powders reinforcements have played significant roles in themodification and enhancing the integrity of the properties of theparent materials in metal matrix composites (MMC), ceramicmatrix composites (CMC) or polymer matrix composite (PMC).There are two main types of reinforcements that can be appliedto enhance the properties of the base materials structurally,mechanically, metallurgically and electrochemically, and this caneither come as inorganic (metallic) reinforcement powders ororganic (basically agrowastes or industrial wastes) reinforcementpowders. Several studies have shown that metallic reinforcementpowders such as stainless-steel alloy, titanium alloy, oxides, siliconcarbide, graphene, carbon nanotube, nitrides, iron, Aluminate,Boron, graphite, etc., have been used for several decades till dateand these powders are not affordable and not easily available forresearches. In the quest to go greener, young researchers have ven-tured into using materials that are environmentally friendly with
low cost and readily available such as agriculture wastes, e.g. palmkernel shell ash, fly ash, rice husk ash, coconut shell ash and manyothers that will stand as remarkable preference to metal powdersand at the same time offer promising properties that bestowedby the metallic reinforcement powders such as high strength, goodcorrosion and wear properties, improved hardness, etc.
It has been established in the literature that very few workshave been carried out using agrowastes powders as reinforcementeither in friction stir processing, stir casting, and the like toimprove properties. Dinahara et al. [1] used rice husk ask (RHA)and study its effects on surface enhancement and properties integ-rity. It was noted, reinforcing with RHA has significantly enhancedinterfacial bonding and tensile properties in aluminium matrixcomposites (AMC) fabricated by friction stir processing (FSP).Kumar et al. [2] investigated the influence of fly ash on the copperalloy matrix through FSP. In this study, structural, tribological,mechanical and electrochemical properties were investigated. Itwas established that corrosion and wear behaviours were greatlyimproved with addition of fly ash. In the same vein, hardnessand tensile properties were said to have improved tremendously.Several other researchers have employed fly ash as reinforcement

O.M. Ikumapayi et al. /Materials Today: Proceedings 26 (2020) 3238–3245 3239
in metal matrix composites during FSP and they have recordedexcellent, unbeatable and improved wear, hardness, corrosion,and tensile strength properties [3]–[8]. Adetunla and Akinlabi [9]applied fly ash (FA), palm kernel shell ash (PKSA), stainless-steelpowder (304 SS) as well as titanium alloy powder (Ti-6Al-4 V) asreinforcement during friction stir processing of magnesium alloyAZ31 matrix composites for medical applications. It was noted thatstainless steel 304 produced the best tensile properties while PKSAhas the least ductility properties followed by fly ash and then tita-nium alloy powder. The corrosion results of these findings showedthat the corrosion rate for FA was 0.2421 mm/year while that ofPKSA was 0.2696 mm/year which is far lower than the one rein-forced with titanium alloy powder (Ti-6Al-4 V) of 0.4771 mm/year.The tensile strength integrity also showed a close value for Ti-6Al-4 V and PKSA with 70.47% and 70.34% respectively but their tensilestrengths are far apart with 305.54 MPa and 281.71 MPa respec-tively. In another study by the same authors, where pure alu-minium AA100 was used as substrate with the abovereinforcement powders. The addition of these reinforcementsimproved the hardness above the parent materials such that theone reinforced with stainless steel 304 produced the maximumhardness of 95.23 HV and the one reinforced with titanium alloyproduced 77.56 HV but fly ash has the least hardness value of62.14HV and PKSA has 75.3 HV [10].
Raju and Rao [11] studied the influence of coconut shell ash(CSA) on wear properties during aluminium matrix composites(AMC). It was established in the study that the addition of CSA sig-nificantly reduced the wear rate from 4.887 mm3/Nm parent metalto 1.830 mm3/Nm fabricated composites. A similar study by Agun-loye et al. [12] also revealed that CSA in polymer matrix improvedthe mechanical properties such as hardness, tensile, modulus ofelasticity as well as absorption rate. Both the impact, hardnessand tensile properties of the fabricated polymer were improvedstructurally. In the same vein, Salleh et al. [13], used CSA as rein-forcement in epoxy resin and found that the tensile and impactproperties were increased as compared to the control experiment.The microparticles from CSA have been used in several applications
Fig. 1. (A) Palm kernel fruits (B) Palm
Fig. 2. A. Fresh Cow Skull Bone Obtained (b) Dried Cow Bone (c)
and improved strength, hardness, and better structural andmechanical properties have been documented [14,15].
In this current study, the electrochemical performance assess-ment of the fabricated aluminum-based matrix composites(AA7075-T651/PKSA-CSA-CBA) will be documented on AA7075-T651.
2. Experimental Design, material and methods
In this study, three different agricultural wastes materials werecollected, processed and utilized for reinforcement, which arecoconut shell (CS), palm kernel shell (PKS) and cow bone (CB).The methods of collections, preparation and utilization areexplained in the subsequent sections.
2.1. Material collection and processing of PKSA
As seen in Fig. 1(a–c), palm kernel fruits were harvested andprocessed; the leftover after processing into palm kernel nutswas palm kernel shell (PKS) which was regarded as waste productand this is used as raw material for this study. The PKS was thencarefully prepared by washing with soap and rinsed with abun-dance water, sun-dried for about 48 h and also dry inside ovenset at 50 C for 24 h and this was then milled into powder throughpulverization method using digital vibratory disc milling machine(VDMM) as shown in Fig. 4. It was milled for 1 h. This VDMM wasalways watched with distilled water before and after use and thencleaned with acetone to remove any traces of impurities before itcan be used for another milling of different agro-waste material[1].
2.2. Material collection and processing of CBA
The skulls of the cow (cow head bone) were collected from theabattoir in the city of Johannesburg, South Africa as shown inFig. 2A. It was then washed with de-ionized water, cleaned frommeat and then sun-dried for about six weeks to allow for absolute
Kernel Shell (C) Pulverised PKS.
Cow Bone Powder (CBP) in a 150 mm ASTM standard Sieve.

Fig. 3c. Broken CS.
Fig. 3d. Grinded Coconut shell Powder (CS-P) [16]
3240 O.M. Ikumapayi et al. /Materials Today: Proceedings 26 (2020) 3238–3245
dryness as shown in Fig. 2B. After 6 weeks in the sun, it was thenwashed again with de-ionized water to remove any impuritiesand contaminations that may be present. In order to ensure totaldryness before crushing, it was dried again inside the electric ovenset 50 C to dry for 5 h for 7 days to ensure absolute dryness ofmoisture contents, this was further cleaned with acetone beforecrushing and pulverizing and sieved into 150 mm size using ASTMmeshes standard range by employed KingTest Sieve, after which itwas further milled with digital vibratory disc milling machine(VDMM) for 60 min before utilization as shown in Fig. 2C.
2.3. Material collection and processing of CSA
Some matured and edible coconut fruits as shown in Fig. 3awere purchased from a commercial market located in the Johan-nesburg area of South Africa. The Cutlass was used to remove theouter part of the edible coconut fruits which is known as exocarp,and the water within was then drained off and the edible partwhich is also known as mesocarp was then removed, followed bythe removal of the woody part which is endocarp, this is alsoknown as coconut shell (CS) [2]–[4], these were then pieces intoirregular chunks shapes of varying sizes between 2 and 10 mmas depicted in Fig. 3b. It was further broken into smaller piecesas shown in Fig. 3c, these were then washed, cleaned with deion-ized water followed by acetone solution to remove any contami-nants and impurities that may be present within. Electric ovenset at 50 C for 5 days was employed to dry it and to remove anytrace of moisture contents before finally crushed and pulverizedand sieved into 75 mm size using ASTM meshes standard. Thiswas then further milled to powder as shown in Fig. 3d byemployed VDMM as shown in Fig. 4.
2.4. Characterizations of agrowastes powders developed
The developed powders were characterized at the end of 60 minmilled before applying them on the workpiece as reinforcement,this was done to determine the chemical and elemental and mor-phology behaviours of the developed powders. The characteriza-
Fig. 3a. Coconut fruits.
Fig. 3b. Coconut Shell (CS).
tions were carried using the following, X-Ray Fluorescence (XRF),Scanning Electron Microscopy (SEM) integrated with Energy Dis-persive X-ray Spectrometer (EDXS). The SEM images producedwere represented in Fig. 5, the chemical compositions for CSA,PKSA, and CBA are shown in Table 1–3 respectively while the ele-mental compositions as analyzed by EDXS are presented in Fig. 6for CSA, CBA and PKSA respectively.
2.5. X-Ray Fluorescence (XRF) analysis
XRF analysis was employed to characterize coconut shell Ash(CSA) after it was sieved with 75 mm ASTM standard sieve, CowBone Ash (CBA) after it was sieved 150 mm sieve, Palm kernel shellAsh (PKSA) after it was sieved with 300 mm, and their chemicalcompositions are shown in Tables 1–3 respectively.
2.6. Method of calcination of agrowastes powders
Calcination method is literally the technique of heating a con-tent to regulated heat and controlled setting, i.e. thermal substraterehabilitation mechanism in the complete lack or decent air supplyto trigger heat stabilization, phase transformation, anaerobicdecomposition along with the elimination of an unpredictable por-tion from the content before it can be used. It would not be possi-ble to apply the milled agro-waste powders directly to reinforcingthe workpiece to be handled. If applied without any carbonizationprocess, it will react with the metal and form slag within the pro-cessed metal as a result of a thermal generation that could lead tocombustion of the particles, thereby leading to internal and surfacedefects. Over this basis, to maintain environmental consistency,the treated powders are first exposed to the calcination procedure.The calcination for each powder was conducted through depositingeach one of the CS-NP, CBA and PKSA in a distinct pure graphitecrucible and afterwards thoroughly putting them inside the mufflefurnace held at 500 C for two (2) hrs, after 2 hrs the furnace was

Table 1Chemical Composition of Coconut Shell Ash.
Chemical Formula Ca0 Na2O ZnO Al2O3 MnO MgO Fe2O3 K2O SiO2
CSA (%) 0.78 0.41 0.39 16.76 0.17 19.4 8.98 0.42 45.6
Table 2Chemical Composition of CBA.
Chemical formula CBA (%)
CaO 45.06SiO2 0.08MgO 0.65TiO2 0.06Fe2O3 0.25Al2O3 0.16MnO 0.01Na2O 0.17P2O5 34.60K2O 0.12ZnO 0.02LOI 16.28
R = 97.46
Table 3Chemical Composition of PKSA.
Chemical Formula PKSA (%)
MgO 0.667Al2O3 4.921SiO2 46.23K2O 4.254SO3 2.257CaO 4.786Fe2O3 31.013P2O5 2.448TiO2 0.218Cr2O3 0.267MnO2 0.088Na2O 1.32
Fig. 4. Diagram of Vibratory Disc Milling.
O.M. Ikumapayi et al. /Materials Today: Proceedings 26 (2020) 3238–3245 3241
then swift-off and calcined powder within the furnace was allowedto soak overnight and cooled to room temperature for handling.
2.7.Experimental technique and methods for the friction stir processing
Fig. 7 represents the friction stir welding machine used in thisexperiment and Fig. 8 illustrates a three-dimensional model ofthe technique. The aluminium plate employed was series 7000(7075-T651) with specifications 300 125 6 mm3. A groovewas made on each plate with specification 280 3.5 2.0 mm3
which is length, depth and width respectively while the processingparameters were rotational speed, travel speed, inclination angleas well as plunge depth of 1500 rpm, 20 mm/min, 3as well as0.3 mm respectively. The tool was made of AISI H13 tool with adiameter of the shoulder designed to be 18 mm, and diameter ofthe probe designed to be 5 mm while the length of the probewas also designed to be 5 mm. Due to carefully chosen processingvariables, an outstanding surface finish was obtained [6]. Table 4shows the chemical composition of the aluminium alloy 7075 –T651 used in this study.
Table 4Chemical composition of the parent metal used (AA7475 – T651).
Elements Zn Si Mg Fe
Wt.% Composition 5.92 0.05 2.8 0.15
2.8. Electrochemical analysis – Preparation of specimens for corrosiontesting
The specimen size used for this corrosion study was24 mm 10 mm 6 mm. Each sample under investigation waspolished with emery papers and washed and rinsed with adequatede-ionized waster. The corrosion medium was prepared in such away, that 35 g of Sodium Chloride was measured and diluted inone litre of distilled water and this gives 3.5% of NaCl solution usedin this study. The experiment was conducted at steady room tem-perature throughout.
2.9. Electrochemical evaluation
The electrochemical qualities of AA7075 — T651 aluminiumalloy matrix composites reinforced with carbonaceous agro-waste powders, base metal — AA7075 — T651 (unprocessed andprocessed) was examined with open circuit (OCP) and potentiody-namic polarization (PD) analyses which use AutoLab PGSTAT 101Metrohm potentiostat / galvanostat with implanted NOVA soft-ware version 2.1.2 and an integrated model of NOVA programand an electrochemical cell of three-electrode links and operatedat 25 C atmospheric pressure. The working electrodes (WE) areindeed the processed aluminum alloy AA7075-T651 (reinforcedand unreinforced). A graphite rod was perhaps the counter elec-trode (CE) while reference electrode (RE) was potassium chlorideelectrode (PCE). The array for potentiodynamic polarization curveswas fixed at a scanning rate (sweep rate) of 0.005 m / s to-1.5 V(cathodic potential) to 1.5 (anodic potential) against open circuitpotential.
The working electrode AA7075-T651 aluminum alloy, respec-tively processed and unprocessed (base metal), was inserted dis-
Cr Ti Mn Cu Al
0.193 0.02 0.01 1.93 Bal

Fig. 5. SEM images for (a) CSA (b) CBA (c) PKSA at 60 min milling time.
Fig. 6. Elemental Compositions as analyzed by EDXS for (a) CS-NP (B) CBA (C) PKSA.
Fig. 7. NC-controlled FSW machine used.
3242 O.M. Ikumapayi et al. /Materials Today: Proceedings 26 (2020) 3238–3245
tinctively into an electrolyte medium containing 3.5% NaCl and theOCP parameters were read after 10 min of immersion to maintain aconstant state potential. It should be noted that potentiodynamicpolarization values were assessed and documented instantly dur-ing the OCP valuation. Each corrosion sample was performed at
three different times to determine reproducibility. Measured databeing current density (jcorr) and potential for polarization (Ecorr)were obtained from the Tafel plots while percentage performanceinhibition efficiency (PIE percent) was extracted %) i.e. the percent-age protection capacity and surface courage () were computedusing equations (1) to (2) [7]–[10].
h ¼ 1 jcorrj0corr
ð1Þ
IPE% ¼ 1 jcorrj0corr
x100 ð2Þ
where jcorr = inhibited corrosion current density; jocorr = uninhibitedcorrosion current density.
3. Results and discussion
3.1. Corrosion activity – Pitting corrosion
Pitting, in the presence of aggravated and volatile chlorine ions,is a localized type of corrosion activity. In the face of intense chlo-rine invasion, pit activation develops at the weak oxide sites. Inline with the reactions presented in equations 3–6, the propagationof pits can be illustrated [17]
Al ! Al3 þ 3e ð3Þ
Alþ 3H2O ! AlðOHÞ3 þ 3Hþ ð4Þ

Fig. 8. Illustration of FSP in 3D. Fig. 9. A Plot of open circuit potential (OCP) vs. exposure time.
O.M. Ikumapayi et al. /Materials Today: Proceedings 26 (2020) 3238–3245 3243
The development of hydrogen and the reduction of oxygen inmetallic cathodes are the essential reduction
Procedures
2Hþ þ 2e ! H2 ð5Þ
O2 þ 2H2Oþ 4e ð6Þ
Fig. 10. Tafel Potentiodynamic Polarization curves.
3.2. Potentiodynamic polarization measurements
Pitting corrosion attack has been defined as a localized form ofcorrosion operation in the form of aggravated and reactive chlorineions. Tafel polarization tests defined the resistance to pitting corro-sion. To determine anodic polarization curves, the unprocessed andprocessed nugget area was exposed to 3.5 percent NaCl solution.The current corrosion density Icorr data were extracted by extrap-olating the anodic and cathodic Tafel lines at Ecorr in the absenceand presence of inhibitors as shown in Table 5 and their corre-sponding open circuit potential (OCP) graph is shown in Fig. 9,while the polarization curves are shown in Fig. 10, which predictsthat polarization occurred as a result of the presence of the combi-nation of cathodic and anodic divisions.
Table 5 showed the assessment of Icorr–current corrosion den-sity, Ecorr–the potential for corrosion, ba-anodic slope, bc–ca-thodic slope, as well as OCP values extrapolated from the Tafelgraph. The polarization resistance (PR), as well as the data for cor-rosion rate (CR) were obtained from the Tafel plot, whereas the val-ues of %IPE were obtained in accordance with equation (2). Table 5shows that the presence of the corrosion barrier influences the cor-rosion rate by lowering its values and by so doing, shifting the plotsof anodic and cathodic polarization to the lower values of current
Table 5Corrosion Results.
Corrosion Rate CorrosionPotential
CathodicTafel Slope
% InhEffici
Samples Cr (mm/year) Ecorr (mV) |bc| (mV/dec) % IEControl 1 (UBM) 5.0718 1425.8 238.31 –Control 2 (PBM) 1.829 1424 238.24 63.99AA7075-T651/CBA 1.42284 1325.1 77.253 71.79AA7075-T651/CSA 0.8891 1282.3 25.837 82.45AA7075-T651/PKSA 0.43574 1217.7 11.898 91.40
densities. This impedes the aluminum alloy’s cathodic develop-ment and anodic metal dissolution reactions [9].
3.3. Evaluation of open circuit potential (OCP)
Fig. 9 displays OCP plot against exposure time for AA7075-T651,processed AA7075-T651, and composites fabricated which areAA7075-T651/CSA, AA7075-T651/CBA, and AA7075-T651/PKSAAMC in 3.5% NaCl medium at 25 C atmospheric pressure. TheOCP is the potential in the working electrode (WE) compared to
ibitionency
Anodic TafelSlope
CorrosionCurrent
Open CircuitPotential
PolarizationResistance
|ba| (mV/dec) jcorr (mA/cm2) OCP (V) Pr (X)169.62 436 0.96954 98.59788.564 157 0.97839 178.1450.914 123 0.98389 276.4243.973 76.5 0.97567 564.433.397 37.5 1.00922 1075.6
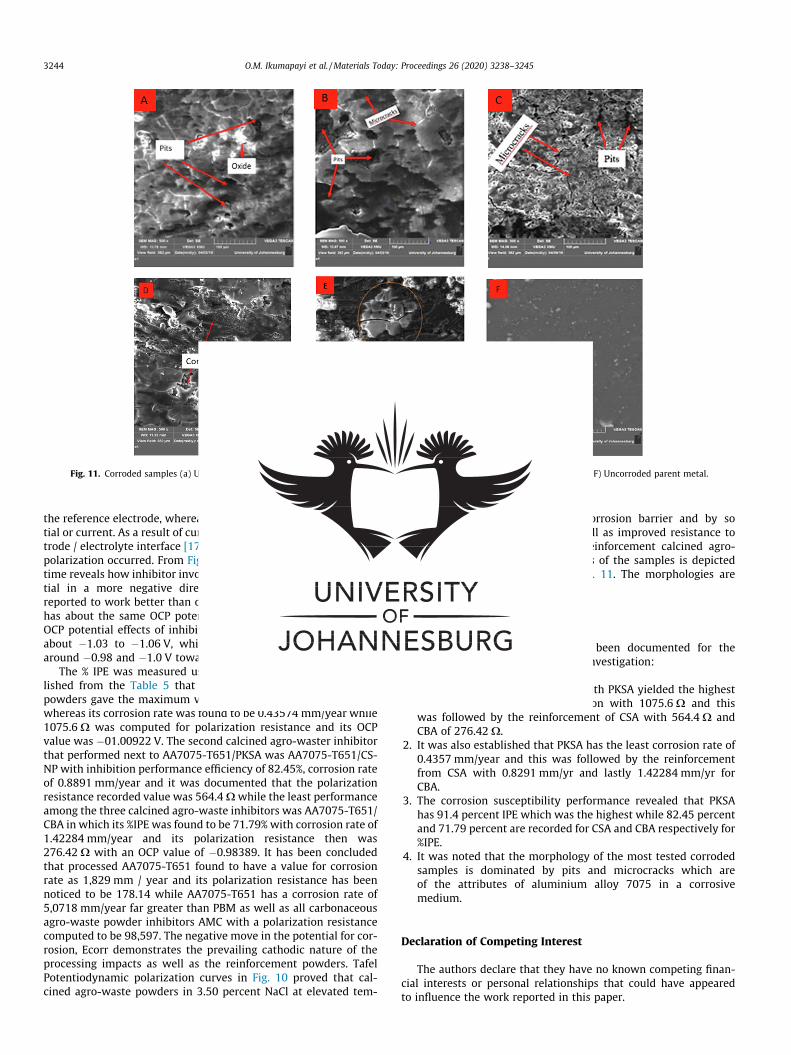
Fig. 11. Corroded samples (a) Unprocessed parent metal (b) Processed parent Metal; Reinforced with (C) PKSA (D) CBA (E) CSA (F) Uncorroded parent metal.
3244 O.M. Ikumapayi et al. /Materials Today: Proceedings 26 (2020) 3238–3245
the reference electrode, whereas the cell does not have any poten-tial or current. As a result of current circulating all around the elec-trode / electrolyte interface [17]–[20], the change in OCP results inpolarization occurred. From Fig. 9, it can be assumed that OCP vs.time reveals how inhibitor involvement tends to adjust OCP poten-tial in a more negative direction. PKSA inhibitors have beenreported to work better than others. The processed AA7075-T651has about the same OCP potential with the CS-NP inhibitor. TheOCP potential effects of inhibited specimens were in the first 5 sabout 1.03 to 1.06 V, which later shifts the negative valuearound 0.98 and 1.0 V towards the end of 120 s.
The % IPE was measured using Eqs. (1) and (2). It was estab-lished from the Table 5 that reinforcing with PKSA agrowastespowders gave the maximum value for %IPE amounting to 91.40%whereas its corrosion rate was found to be 0.43574 mm/year while1075.6X was computed for polarization resistance and its OCPvalue was 01.00922 V. The second calcined agro-waster inhibitorthat performed next to AA7075-T651/PKSA was AA7075-T651/CS-NP with inhibition performance efficiency of 82.45%, corrosion rateof 0.8891 mm/year and it was documented that the polarizationresistance recorded value was 564.4Xwhile the least performanceamong the three calcined agro-waste inhibitors was AA7075-T651/CBA in which its %IPE was found to be 71.79% with corrosion rate of1.42284 mm/year and its polarization resistance then was276.42X with an OCP value of 0.98389. It has been concludedthat processed AA7075-T651 found to have a value for corrosionrate as 1,829 mm / year and its polarization resistance has beennoticed to be 178.14 while AA7075-T651 has a corrosion rate of5,0718 mm/year far greater than PBM as well as all carbonaceousagro-waste powder inhibitors AMC with a polarization resistancecomputed to be 98,597. The negative move in the potential for cor-rosion, Ecorr demonstrates the prevailing cathodic nature of theprocessing impacts as well as the reinforcement powders. TafelPotentiodynamic polarization curves in Fig. 10 proved that cal-cined agro-waste powders in 3.50 percent NaCl at elevated tem-
peratures acted as a mixed-type corrosion barrier and by sodoing enhanced corrosion rate as well as improved resistance topolarization. The influence of the reinforcement calcined agro-wastes powders on the morphologies of the samples is depictedin the SEM images presented in Fig. 11. The morphologies arefound with pits and cracks.
4. Conclusions
The resistance to corrosion has been documented for theselected agrowastes powders under investigation:
1. It was revealed that reinforcing with PKSA yielded the highestpolarization resistance to corrosion with 1075.6X and thiswas followed by the reinforcement of CSA with 564.4X andCBA of 276.42X.
2. It was also established that PKSA has the least corrosion rate of0.4357 mm/year and this was followed by the reinforcementfrom CSA with 0.8291 mm/yr and lastly 1.42284 mm/yr forCBA.
3. The corrosion susceptibility performance revealed that PKSAhas 91.4 percent IPE which was the highest while 82.45 percentand 71.79 percent are recorded for CSA and CBA respectively for%IPE.
4. It was noted that the morphology of the most tested corrodedsamples is dominated by pits and microcracks which areof the attributes of aluminium alloy 7075 in a corrosivemedium.
Declaration of Competing Interest
The authors declare that they have no known competing finan-cial interests or personal relationships that could have appearedto influence the work reported in this paper.

O.M. Ikumapayi et al. /Materials Today: Proceedings 26 (2020) 3238–3245 3245
References
[1] I. Dinaharan, K. Kalaiselvan, N. Murugan, Influence of rice husk ash particles onmicrostructure and tensile behavior of AA6061 aluminum matrix compositesproduced using friction stir processing, Compos. Commun. 3 (2017) 42–46.
[2] H. Kumar, R. Prasad, A. Srivastava, M. Vashista, M.Z. Khan, Utilisation ofindustrial waste (Fly ash) in synthesis of copper based surface compositethrough friction stir processing route for wear applications, J. Clean. Prod. 196(2018) 460–468.
[3] I. Dinaharan, E.T. Akinlabi, Low cost metal matrix composites based onaluminum, magnesium and copper reinforced with fly ash prepared usingfriction stir processing, Compos. Commun. 9 (2018) 22–26.
[4] I. Dinaharan, R. Nelson, S.J. Vijay, E.T. Akinlabi, Microstructure and wearcharacterization of aluminum matrix composites reinforced with industrialwaste fly ash particulates synthesized by friction stir processing, Mater.Charact. 118 (2016) 149–158.
[5] O.M. Ikumapayi, E.T. Akinlabi, A comparative assessment of tensile strengthand corrosion protection in friction stir processed AA7075-T651 matrixcomposites using fly ashes nanoparticles as reinforcement inhibitors in 3.5 %NaCl, Int. J. Mech. Prod. Eng. Res. Dev. 9 (3) (2019) 839–854.
[6] R. Elangovan, M.M. Ravikumar, Performance of al-fly ash metal matrixcomposites, ARPN J. Eng. Appl. Sci. 10 (4) (2015) 1691–1696.
[7] A.K. Senapati, A. Bhatta, S. Mohanty, P.C. Mishra, B.C. Routra, An Extensiveliterature review on the usage of fly ash as a reinforcing agent for differentmatrices, Int. J. Innov. Sci. Mod. Eng. 3 (2014) 4–9.
[8] S. Rathee, S. Maheshwari, A.N. Siddiquee, M. Srivastava, A review of recentprogress in solid state fabrication of composites and functionally gradedsystems via friction stir processing, Crit. Rev. Solid State Mater. Sci. 43 (4)(2018) 334–366.
[9] Adedotun Adetunla Esther Akinlabi Influence of reinforcements in friction stirprocessed magnesium alloys: insight in medical applications Mater. Res.Express 6 2 025406 10.1088/2053-1591/aaeea8 http://stacks.iop.org/2053-1591/6/i=2/a=025406?key=crossref.eef5cc98ee87a7100d802dbd00664fbe.
[10] A. Adetunla and E. Akinlabi, ‘‘Significantly Improved Mechanical Properties of1100 Aluminium Alloy via Particle Reinforcement,” in 5th International
Conference on Innovation in Science and Technology, Barcelona - Spain,2018, no. December, pp. 79–87.
[11] S.S. Raju, G.S. Rao, Assessments of Desirability Wear Behaviour on Al- CoconutShell Ash - Metal Matrix Composite using Grey - Fuzzy Reasoning Grade,Indian J. Sci. Technol. 10 (15) (2017) 1–11.
[12] S.O. Agunsosoye, J.O. Isaac, T.S. Samuel, Study of mechanical behaviour ofcoconut shell reinforced polymer matrix composite, J. Miner. Mater. Charact.Eng. 2012 (11) (2012) 774–779.
[13] Z. Salleh, M.M. Islam, M.Y.M. Yusop, M.A. Mun’aim M. Idrus, Mechanicalproperties of activated carbon (AC) coconut shell reinforced polypropylenecomposites encapsulated with epoxy resin, APCBEE Procedia 9 (2014) 92–96,https://doi.org/10.1016/j.apcbee.2014.01.017.
[14] J.O. Agunsoye, S.I. Talabi, S.A. Bello, I.O. Awe, The effects of Cocos nucifera(coconut shell) on the mechanical and tribological properties of recycled wastealuminium can composites, Tribol. Ind. 36 (2) (2014) 155–162.
[15] L. Lancaster, M.H. Lung, D. Sujan, A.C.S. Ash, Utilization of Agro-IndustrialWaste in Metal Matrix Composites : Towards Sustainability, Environ. Ecol. Eng.- World Acad. Sci. Eng. Technol. 7 (1) (2013) 35–43.
[16] O.M. Ikumapayi, E.T. Akinlabi, Data showing the effects of vibratory discmilling time on the microstructural characteristics of Coconut ShellNanoparticles (CS-NPs), Data Br. 22 (2019) 537–545.
[17] D. Raguraman, D. Muruganandam, L.K.K. Dhas, Corrosion study in friction stirwelded plates of AA6061 and AA7075, Int. J. ChemTech Res. 6 (4) (2014) 2577–2582.
[18] O.S.I. Fayomi, I.G. Akande, A.P.I. Popoola, Corrosion Protection Effect ofChitosan on the Performance Characteristics of A6063 Alloy, J. Bio- Tribo-Corrosion 4 (73) (2018) 1–6.
[19] C. Zhang, G. Huang, Y. Cao, X. Wu, X. Huang, Q. Liu, Optimization of Tensile andCorrosion Properties of Dissimilar Friction Stir Welded AA2024-7075 Joints, J.Mater. Eng. Perform. 28 (1) (2019) 183–199.
[20] O.D.L. El, G.O. Hamed, S.J.A. El, Anticorrosive formulation based of the epoxyresin – Polyaminoamide containing zinc phosphate inhibitive pigment appliedon sulfo- tartaric anodized AA 7075–T6 in NaCl medium, J. Bio- Tribo-Corrosion 5 (25) (2019) 1–9.

67
3.8 ARTICLE VII
The effect of milling time on the particle sizes of coal-fly ash and wood-fly ash,
when using the Otsu Method for thresholding
Presented at the 3rd International Conference on Engineering for a Sustainable World
ICESW, July 3rd – 8th, 2019.
Published in Journal of Physics: Conference Series, 1378 (2019) 042075,
https://doi.org/10.1088/1742-6596/1378/4/042075, page 1 – 19.
ISSN: 1742-6588.
In this present study, MATLAB (R2015a) software was employed to process and segment wood-
fly ash (WFA) and coal-fly ash (CFA) by using the Otsu Method for the thresholding. The main
reason for this was to separate the foreground from the background via thresholding. Both the CFA
and the WFA powders were milled separately, at different milling times of 20, 40 and 60 minutes;
and they were then subjected to thresholding and processing.
In this study, SEM was employed to study the morphology of the CFA and the WFA powder. EDX
was used to analyze the elemental composition; while XRF was used to acquire the chemical
composition; and XRD was used for the phases and the crystallite size measurements. Statistical
data were also employed to analyze the particle size. Both CFA and WFA received at micro-sized
particles were washed with distilled water, to remove any impurities; and they were then dried in
the oven at 80 °C for 48 hours, and then sieved using 75µm size (taken as the reference point of 0
min).

68
A mathematical model was formulated for the thresholding. It was established that at a 95%
confidence interval, there exists a significant difference between those results, which were
obtained at different milling times. Also, a significant difference exists between the mean particle
diameters of the two ash sources. CFA contains a higher composition of Al2O3 (30.93%) and SiO2
(51.43%) when compared with WFA, which has 10.70% and 46.31%, respectively. However,
WFA contains more of Fe2O3 (17.28%) than does CFA (2.29%). This published conference article
has been able to address the objective of the study in item I.
Journal of Physics: Conference Series
PAPER • OPEN ACCESS
Comparative analysis of milling time on the particle sizes of coal fly ashand wood fly ash using Otsu Method for thresholdingTo cite this article: O. M. Ikumapayi et al 2019 J. Phys.: Conf. Ser. 1378 042075
View the article online for updates and enhancements.
This content was downloaded from IP address 197.210.53.78 on 20/12/2019 at 07:56

Content from this work may be used under the terms of the Creative Commons Attribution 3.0 licence. Any further distributionof this work must maintain attribution to the author(s) and the title of the work, journal citation and DOI.
Published under licence by IOP Publishing Ltd
International Conference on Engineering for Sustainable World
Journal of Physics: Conference Series 1378 (2019) 042075
IOP Publishing
doi:10.1088/1742-6596/1378/4/042075
1
Comparative analysis of milling time on the particle sizes of coal fly ash and wood fly ash using Otsu Method for thresholding
O. M. Ikumapayi*1, E. T. Akinlabi1,2, P. A. Adedeji1, S. A. Akinlabi2,3
1Department of Mechanical Engineering Science, University of Johannesburg, Johannesburg, 2006, South Africa 2Department of Mechanical Engineering, Covenant University, Nigeria 3Department of Mechanical and Industrial Engineering, University of Johannesburg, Johannesburg, 2006, South Africa Corresponding Author: [email protected]
Abstract-
South Africa remains one of the countries with an abundance of coal fly ash (CFA) emerging from her abundant coal deposit. Despite the hazardous and environmental unfriendliness of fly ash, so many benefits can be derived therein. With new policies of waste-to-wealth, the country seeks ways by which this resource could be of value addition. However, CFA in its raw form often requires further milling operation to enhance suitability for the intended use. This study investigated the effect of milling time on the particle size of CFA and wood fly ash (WFA) using image segmentation. Both CFA and WFA received at micro-sized particles were washed with distilled water to remove impurities and dried in the oven at 800C for 48 hours then sieved using 75µm size. Microstructural images of both CFA and WFA milled at varying times (𝑡𝑡 = 0, 20, 40, 60 𝑚𝑚𝑚𝑚𝑚𝑚𝑚𝑚𝑡𝑡𝑚𝑚𝑚𝑚) were morphologically and physiochemically analysed using scanning electron microscope (SEM), X-ray diffraction (XRD), Energy Dispersive X-ray (EDX), and X-Ray Fluorescence (XRF). SEM images of CFA and WFA were segmented using Otsu thresholding technique and average particle sizes were estimated. CFA contains a higher composition of Al2O3 (30.93%) and SiO2 (51.43%) compared to WFA, which has 10.70% and 46.31% respectively. However, WFA contains more of Fe2O3 (17.28%) than CFA (2.29%). The number of particle size increased with increases in milling time while the particle area decreased with an increase in milling time. At a 95% confidence interval, there exists a significant difference between results obtained at different milling time. Also, a significant difference exists between the mean particle diameters of the two ash sources.
Keywords: Coal fly ash; image segmentation; particle size distribution; Otsu thresholding; wood fly ash
1. Introduction
Material reinforcements from green technology have widely gained acceptance over the years. Fly ash (FA), which is obtained from coal-fired plants [1] is an example less explored. About 184.14 million tons of FA was generated between 2014 to 2015 with only 44.31% unutilized [1]. Within the same period, South Africa produced about 34.4 million tons of ash (fly ash, bottom ash, fresh and weathered ash) with only 7% sold from 6 of its 13 coal-fired power stations [2]. Its abundance in coal-fired plants has raised global interest in exploring more of its economic use. Recent studies have shown that FA is good fillers in polymers and rubbers for
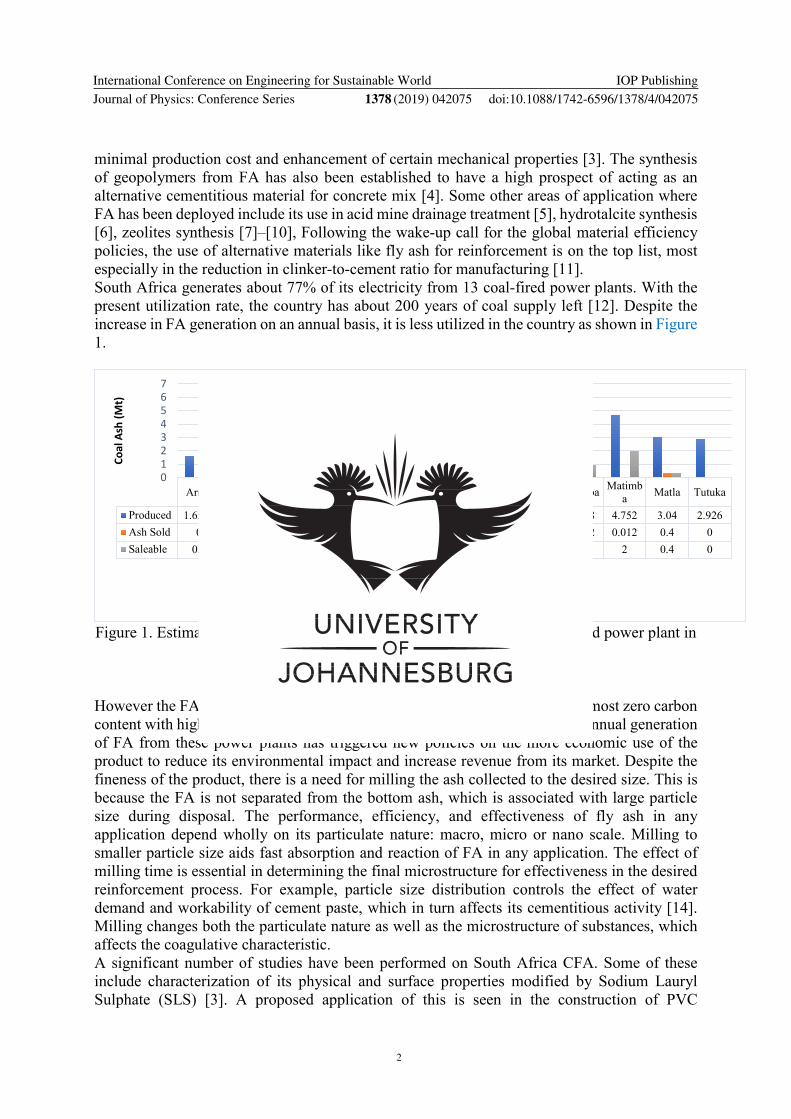
International Conference on Engineering for Sustainable World
Journal of Physics: Conference Series 1378 (2019) 042075
IOP Publishing
doi:10.1088/1742-6596/1378/4/042075
2
minimal production cost and enhancement of certain mechanical properties [3]. The synthesis of geopolymers from FA has also been established to have a high prospect of acting as an alternative cementitious material for concrete mix [4]. Some other areas of application where FA has been deployed include its use in acid mine drainage treatment [5], hydrotalcite synthesis [6], zeolites synthesis [7]–[10], Following the wake-up call for the global material efficiency policies, the use of alternative materials like fly ash for reinforcement is on the top list, most especially in the reduction in clinker-to-cement ratio for manufacturing [11]. South Africa generates about 77% of its electricity from 13 coal-fired power plants. With the present utilization rate, the country has about 200 years of coal supply left [12]. Despite the increase in FA generation on an annual basis, it is less utilized in the country as shown in Figure 1.
Figure 1. Estimate in 2016 of annual FA production in Megatons per coal-fired power plant in
South Africa [2]
However the FA produced is known for its fine spherical particulate nature, almost zero carbon content with high pozzolanic activity and unusual high consistency [13]. The annual generation of FA from these power plants has triggered new policies on the more economic use of the product to reduce its environmental impact and increase revenue from its market. Despite the fineness of the product, there is a need for milling the ash collected to the desired size. This is because the FA is not separated from the bottom ash, which is associated with large particle size during disposal. The performance, efficiency, and effectiveness of fly ash in any application depend wholly on its particulate nature: macro, micro or nano scale. Milling to smaller particle size aids fast absorption and reaction of FA in any application. The effect of milling time is essential in determining the final microstructure for effectiveness in the desired reinforcement process. For example, particle size distribution controls the effect of water demand and workability of cement paste, which in turn affects its cementitious activity [14]. Milling changes both the particulate nature as well as the microstructure of substances, which affects the coagulative characteristic. A significant number of studies have been performed on South Africa CFA. Some of these include characterization of its physical and surface properties modified by Sodium Lauryl Sulphate (SLS) [3]. A proposed application of this is seen in the construction of PVC
Arnot Camden Duvha Grootvlei
Hendrina Kendai Komati Kriel Lethabo Majuba Matimb
a Matla Tutuka
Produced 1.6503 1.068 2.506 0.996 1.824 4.906 0.324 2.302 6.48 3.428 4.752 3.04 2.926Ash Sold 0 0 0 0 0 0.542 0 0.312 1.227 0.042 0.012 0.4 0Saleable 0.4 0 0.2 0 0.2 3 0 1 1.3 1 2 0.4 0
01234567
Coal
Ash
(Mt)
Power Station
Produced Ash Sold Saleable

International Conference on Engineering for Sustainable World
Journal of Physics: Conference Series 1378 (2019) 042075
IOP Publishing
doi:10.1088/1742-6596/1378/4/042075
3
composites. In the study, a surface modification at multiple conditions was performed at different conditions using the surfactant, SLS. The study concludes on the feasibility of CFA as an alternative to CaCO3 in PVC filling under low filler loadings. Similar to this study is the investigate the transformation of the CFA into useful compounds to be used in other fields for the economic purpose [8], [9], [15]. Of keen interest to of study is the investigation of the effect of grinding time on gasification ash, and Portland Cement clinker [14]. The gasification ash possesses similar which has a similar chemical composition as the South African coal fly ash. Separate grinding on the two samples was performed as well an interground of both samples at the microscale. Optical granulometry has advanced in several forms over the years. In the past, visual inspection has been in material science for image inference across varying parameters. However, visual inspection is limited to macro-level judgment and physical properties of size and intensity. Several techniques have been developed in recent times to study microstructural images. One of the notable empirical functions, which estimates the particle size distribution is the Rosin-Rammler (RR) distribution function [14], [16]. The function describes the particle size distribution of powders with various sizes and types. It has been tested to be effective in representing powders made by crushing, grinding, and milling operations [17]. The RR model is generally represented by:
𝐹𝐹(𝑑𝑑) = 1 − 𝑚𝑚𝑒𝑒𝑒𝑒 −𝑑𝑑𝑇𝑇𝑚𝑚
(1)
where: 𝐹𝐹(𝑑𝑑) = distribution function 𝑑𝑑 = particle size l = mean particle size m = measure of spread of particle sizes the parameters l and m are adjustable parameters peculiar to the distribution. Equation (1) can then be re-written as:
ln− 𝑙𝑙𝑚𝑚[1 − 𝐹𝐹(𝑑𝑑)] = 𝑚𝑚 × ln(𝑑𝑑) −𝑚𝑚 × ln(𝑙𝑙) (2) such that a plot of ln− 𝑙𝑙𝑚𝑚[1 − 𝐹𝐹(𝑑𝑑)] against natural ln (d) results in a straight line with slope m, if the material behaviour fits the RR model. RR model was applied to determine the particle distribution of gasification ash and Portland cement clinker at varying grinding time by [14]. The study established a significant difference between the particle size distribution of gasification ash and Portland cement clinker at same the time interval. The study demonstrates that cement clinker is harder than the gasification ash. On the contrary, in our study, the milling process was investigated on CFA and WFA rather than the grinding operation. Image segmentation involves breaking-up a digital image into diverse sets of pixels [18]. This helps to better analyse intricate features digitally represented in the image. Image thresholding forms an integral and important process in image segmentation [19]. Image thresholding essentially separates the foreground of an image from its background [20], [21]. This tool becomes effective when significant gray levels exist between background images and objects from which separation is to occur [22]. With the emergence of several classical image segmentation algorithms like histogram shape-based techniques, clustering-based techniques, mutual information techniques, local adaptive techniques, Otsu technique has gained more popularity[19]. In the past decades, there have been improvements on the technique to address

International Conference on Engineering for Sustainable World
Journal of Physics: Conference Series 1378 (2019) 042075
IOP Publishing
doi:10.1088/1742-6596/1378/4/042075
4
bias between the image background and the object in a case when the object is brighter and the variance is larger [23], [24]. The application of Otsu’s technique requires knowledge about the intensity difference and the object size for successful thresholding. To complement other studies, this study uses a sequence of an algorithm written in MATLAB to estimate the particle size at varying milling time. This is seen as a means of automating the process, such that particle size can be determined in real time during milling by using optimal imagery of samples. Thresholding becomes a potent tool for image segmentation when the variance of the object differs significantly from that of the background. This is often the case in SEM images and change monitoring applications [25]. The ideal threshold for segmentation is the intersection point of the image and its background. This is such that the intersection is far from the class with large variance [19]. Despite the presence of heavy metals in fly ash, which have raised environmental concerns and classified it at a hazardous material, a regulation has been handed to the Department of Environmental Affairs (DEA) in South Africa for an exclusion from the hazardous list. This will foster its use in cement and brick making, soil amelioration, mine backfilling, and road construction in the country [2]. This study is therefore aimed at (i) to investigate the morphological characteristics of CFA and WFA (ii) to determine the effect of varying milling time on the average particle size of CFA and compares it with that obtained from WFA source using image segmentation approach. (iii) to compare the image statistics of both ash sources at different milling time for statistical significance. The novelty of this study is in the determination of the particle size of CFA and WFA using image segmentation approach. The rest of the paper is structured as follows: the materials and methodology used for milling, image acquisition and segmentation of coal and wood fly ash are presented in Section 2. Section 3 presents the results of microstructural and statistical analysis of both images at different milling time. The discussion of findings is presented in section 4 of the work while section 5 concludes the paper. 2. Materials and Methods 2.1 Material collection and processing The CFA used in this study was collected from the ash dump of Majuba Power Station; a coal-fired power station located in Mpumalanga Province of South Africa. In the plant, as the pulverized coal undergoes burning in the boiler, part of the ashes falls to the bottom of the system (bottom ash), however, others escape with the flue gas but are trapped using filter bags. The two categories of ashes are channeled to the ash dump. WFA used in this study was obtained after a bunch of firewood was subjected to complete combustion until ash was formed. WFA formed were washed with distilled water to remove unwanted particles. After discharging and draining, the WFA was dried inside an electric oven at a temperature of 800C for 48 hours. The resulting ash was sieved using a sieve size of 75µm on a KingTest Sieve Shaker (VB 200/300) operated at 220V/50Hz and 5A. The proportions that passed through the mesh size was then taken for milling. Similar processing was performed on CFA collected in its raw state from the coal power station. 2.1.1 Vibratory Disc Milling Machine (VDMM) Milling operation was performed using a digital vibratory disc grinding mill Lab Pulveriser (Model 2MZ-200). The machine has specification as presented in Table 1.

International Conference on Engineering for Sustainable World
Journal of Physics: Conference Series 1378 (2019) 042075
IOP Publishing
doi:10.1088/1742-6596/1378/4/042075
5
Table 1. Vibratory disc milling machine specification Property Specification Dimension 740 x 740 x 950 mm Number of bowls 2 Capacity per bowl 200g Feed Size < 15mm Motor 380V/ 50Hz, 1.5KW Motor speed 940rpm
Dry mechanical milling at varying milling time of 20, 40 and 60 minutes was performed on the two ash samples. The machine was thoroughly washed, dried and cleaned with acetone before and after use to remove any contaminants that may be present. For WFA and CFA, 40g of each were charged into each bowl of the VDMM simultaneously and then set for milling. The machine was interrupted every 10 minutes of operation in order to avoid a rise in temperature and to limit adherence of the powder within the container walls. A cooling interval of 30 minutes was ensured before the next running. Samples of CFA and WFA were milled at 20 minutes interval up to 60 minutes. 2.2 Microstructural characterization The milled and un-milled CFA and WFA were analyzed through various microstructural characterization processes. For this study, the Scanning Electron Microscopy (SEM), Energy Dispersive X-ray (EDX), X-Ray Diffraction (XRD), and X-Ray Fluorescence (XRF) were used. The processes involved are discussed as follows. 2.2.1 Energy Dispersive X-Ray Spectroscopy (EDXS) The elemental composition of un-milled samples of CFA and WFA was analysed using EDXS. The variation in the trend of the composition of each element present across the un-milled samples was identified. 2.2.2. X-Ray Fluorescence (XRF) and X-Ray Diffraction (XRD) In this study, the chemical composition of both CFA and WFA were analyzed at 75 µm using X-Ray Fluorescence (XRF) spectroscopy (model PHILIP PW1404 XRF) Wavelength Disperse Spectrometer. Principal chemical compositions of both CFA and WFA obtained were compared with selected similar studies. Similarly, the XRD test was performed using the PHILIPS X’Pert (model number 12NC: 943003040601) operated at PW: 3040/60, 240V, 8.5KVA, and 50Hz and with the specifications in Table 2. XRD test was carried out on the ash samples to confirm the crystal structure and mineralogical compositions of the samples used. The XRD was acquired using copper Kα radiation (λ = 1.5406 Å) and kꞵ radiation (λ = 1.39225 Å) and an automatic divergence slit; i.e., an irradiated sample length that is independent of the Bragg angles ((2θ) in degree). The diffraction patterns and crystal phases at different milling times were obtained.
Table 2. Diffractometer machine specification Property Specification

International Conference on Engineering for Sustainable World
Journal of Physics: Conference Series 1378 (2019) 042075
IOP Publishing
doi:10.1088/1742-6596/1378/4/042075
6
Current 40mA Excitation voltage 40kV Scanning rate 0.05 (2Ꝋ/seg)
2.2.3 Scanning Electron Microscope (SEM) A TESCAN model, type VEGA 3 LMH was the type of SEM machine that was employed for the study. In order to have the sample more conductive and to have better resolution, the samples were sputter-coated with a thin layer of carbon just before the SEM analyses coupled with Energy Dispersive Spectrometer (EDS) analyses. The beam intensity used in the analysis was 12 and the accelerating voltage used was 20KV, all micrographs were taken at SEM magnification of 1000 (1.0 kx). The particle size and surface of both CFA-NPs and WFA-NPs were analysed at different milling times 20, 40 and 60 mins and also the un-milled (0 min) were also analysed by SEM.
2.3 Image thresholding and segmentation Otsu’s method [26] was used for image thresholding. The technique is a nonparametric as well as unsupervised thresholding technique, which selects optimum thresholds from a maximization of the intraclass variance of binary images. A significant assumption in the algorithm is the bimodal class of the image.: the foreground and background pixels which the SEM images in this study satisfy. The method is apparently a 1-dimensional. The global optimal threshold value was obtained for the SEM images. Given the local thresholds 𝑡𝑡1, 𝑡𝑡2, 𝑡𝑡3, … 𝑡𝑡𝑛𝑛 to be selected from, the thresholds subdivide the images into n+1 classes of 𝐶𝐶1,𝐶𝐶2,𝐶𝐶3, … 𝐶𝐶𝑛𝑛 by maximizing the objective function given by the sum of all threshold variances [24];
𝐽𝐽1(𝑡𝑡1, 𝑡𝑡2, 𝑡𝑡3, … 𝑡𝑡𝑛𝑛) = 𝜎𝜎02 + 𝜎𝜎12 + 𝜎𝜎22 + 𝜎𝜎32 + ⋯ 𝜎𝜎𝑛𝑛2 (1) where
𝜎𝜎02 = 𝜔𝜔0(𝜇𝜇0 − 𝜇𝜇𝑇𝑇)2,𝜔𝜔0 = 𝑒𝑒𝑖𝑖
𝑡𝑡1−1
𝑖𝑖=0
, 𝜇𝜇0 = 𝑚𝑚𝑒𝑒𝑖𝑖𝜔𝜔0
𝑡𝑡1−1
𝑖𝑖=0
𝜎𝜎12 = 𝜔𝜔1(𝜇𝜇1 − 𝜇𝜇𝑇𝑇)2,𝜔𝜔1 = 𝑒𝑒𝑖𝑖
𝑡𝑡2−1
𝑖𝑖=𝑡𝑡1
, 𝜇𝜇1 = 𝑚𝑚𝑒𝑒𝑖𝑖𝜔𝜔1
𝑡𝑡2−1
𝑖𝑖=𝑡𝑡1
𝜎𝜎22 = 𝜔𝜔2(𝜇𝜇2 − 𝜇𝜇𝑇𝑇)2,𝜔𝜔2 = 𝑒𝑒𝑖𝑖
𝑡𝑡3−1
𝑖𝑖=𝑡𝑡2
, 𝜇𝜇2 = 𝑚𝑚𝑒𝑒𝑖𝑖𝜔𝜔2
𝑡𝑡3−1
𝑖𝑖=𝑡𝑡2
𝜎𝜎32 = 𝜔𝜔3(𝜇𝜇3 − 𝜇𝜇𝑇𝑇)2,𝜔𝜔3 = 𝑒𝑒𝑖𝑖
𝑡𝑡4−1
𝑖𝑖=𝑡𝑡3
, 𝜇𝜇3 = 𝑚𝑚𝑒𝑒𝑖𝑖𝜔𝜔3
𝑡𝑡4−1
𝑖𝑖=𝑡𝑡3
𝜎𝜎𝑛𝑛2 = 𝜔𝜔𝑛𝑛(𝜇𝜇𝑛𝑛 − 𝜇𝜇𝑇𝑇)2,𝜔𝜔𝑛𝑛 = 𝑒𝑒𝑖𝑖
𝑡𝑡𝑛𝑛+1−1
𝑖𝑖=𝑡𝑡𝑛𝑛
, 𝜇𝜇𝑛𝑛 = 𝑚𝑚𝑒𝑒𝑖𝑖𝜔𝜔𝑛𝑛
𝑡𝑡𝑛𝑛+1−1
𝑖𝑖=𝑡𝑡𝑛𝑛
and 𝜎𝜎02,𝜎𝜎12,𝜎𝜎22,𝜎𝜎32, … 𝜎𝜎𝑛𝑛2 are the class variances, 𝜔𝜔0,𝜔𝜔1,𝜔𝜔2,𝜔𝜔3, … 𝜔𝜔𝑛𝑛 represents the class probabilities, 𝜇𝜇0, 𝜇𝜇1, 𝜇𝜇2, 𝜇𝜇3, … 𝜇𝜇𝑛𝑛 represents the mean values of the segmented classes. The intensity of the whole image is 𝜇𝜇𝑇𝑇 ⊆ 𝜇𝜇𝑇𝑇 = 𝜔𝜔0𝜇𝜇0 + 𝜔𝜔1𝜇𝜇1 + 𝜔𝜔2𝜇𝜇2 + 𝜔𝜔3𝜇𝜇3 + ⋯+ 𝜔𝜔𝑚𝑚𝜇𝜇𝑚𝑚 and 𝜔𝜔0 + 𝜔𝜔1 + 𝜔𝜔2 + 𝜔𝜔3 + 𝜔𝜔𝑛𝑛 = 1.
International Conference on Engineering for Sustainable World
Journal of Physics: Conference Series 1378 (2019) 042075
IOP Publishing
doi:10.1088/1742-6596/1378/4/042075
7
Segmentation of the SEM images was performed at different milling time using a MATLAB script implemented in MATLAB R2015a installed on a desktop computer workstation with configuration 64 bits, 32GB RAM Intel (R) Core (TM) i7 5960X. Shown in Figure 2 is the graphical flow chart of the process. Threshold Segmentation is one of the easiest methods of Image processing to detect morphological maps[27] and image colour intensity and one of the commonest parallel techniques of segmentation. The method uses a segmentation algorithm which sectionalised image grayscale processed information based on the targets of various gray value[28]. Grayscale Images are converted into binary Images in this method and the binary images consist of the whole important data in respect of the shapes and the location of the objects. This conversion into a binary image is of importance since it reduces data complexity. One of the merits of threshold segmentation method has been that the speed of operation is fast and the calculation is simple[29]. Image segmentation is an essential ingredient to distinguish foreground pixel from background pixel as well as enhances better visual perception of the Image[30]. It helps in recognising the patterns of the Images by so doing gives high quality and resolutions of the final result of the analysis[31]. One must not shy away from demerits of threshold segmentation which was the inability to get accurate results where there is no adequate variation in grayscale or enough overlap of the grayscale values in the Image[32], [33]. It is worth to mention that it is sensitive to noise and uneven grayscale as a result of the whole consideration of gray information without spatial information of the image.

International Conference on Engineering for Sustainable World
Journal of Physics: Conference Series 1378 (2019) 042075
IOP Publishing
doi:10.1088/1742-6596/1378/4/042075
8
Figure 2. Image segmentation flow chart
3.0 Results and Discussions 3.1 Chemical composition Presented in Table 3 is the chemical composition of both CFA and WFA and its elemental composition is presented in Figure 3. The major compounds identified in order of increasing composition in CFA include Al2O3 , SiO2 , CaO and Fe2O3 whose percentage by composition outwit others. CFA possesses a high percentage of SiO2 (51.43 wt%), Al2O3 (30.93 wt%), which confirms the bituminous nature of the CFA [34], [35]. This constituents also confirms the chemical properties of South African coal [9], [36]. The high percentage of SiO2 and Al2O3 makes CFA a good component for stable insulators. CFA also demonstrates the presence of rare earth elements like Cr and Ti found in the lanthanide series. These elements have gained a wide range of application in automotive, electronics, optics, and defence [37]–[40]. Table 3: The chemical composition analysis of CFA and WFA using XRF
Chemical Formula CFA (wt%) WFA (wt%) Al2O3 30.93 10.7 SiO2 51.43 46.31 MgO 1.95 0.36

International Conference on Engineering for Sustainable World
Journal of Physics: Conference Series 1378 (2019) 042075
IOP Publishing
doi:10.1088/1742-6596/1378/4/042075
9
TiO2 1.74 0.933 Fe2O3 2.29 17.28 CaO 6.75 3.002 MnO 0.02 - MnO2 - 0.0471 Na2O 0.54 2.48 P2O3 1.08 - P2O5 - 0.113 Cr2O3 0.77 - K2O 0.77 2.53 N2O 0.01 - SO3 0.54 3.423 LOI 1.21 8
Σ= 99.28 Σ= 87.17 On the other hand, the major compounds present in WFA in order of increasing composition are SiO2, Fe2O3, Al2O3 , CaO. and SO3 . The percentage of SiO2 is high in both ash types, giving both a tendency of been suitable as binders, though CFA offering more suitability than WFA. Heavy metals in both ash types have a propensity for leaching, which is harmful to the environment [41] if left unused. Comparing the chemical compositions of major compounds obtained from CFA and WFA in this study with other materials in the literature, we have the results presented in Table 4. Table 4: The chemical composition analysis of CFA and WFA from XRF
Chemical Formula CFA
(wt%) (this study)
WFA (wt%) (this study)
CFA-Badarpur [41]
Rice Husk Ash (wt%) [42]
Type II Portland Cement (wt%) [43], [44]
Al2O3 30.93 10.70 27.69 0.01 6.67 SiO2 51.43 46.31 59.52 90.0 21.56 MgO 1.95 0.36 0.50 0.12 4.51 Fe2O3 2.29 17.28 4.85 0.03 6.17 CaO 6.75 3.002 0.68 0.60 49.88 K2O 0.77 2.53 1.61 2.30 0.76
Comparing the major chemical composition of CFA and WFA in this study with those obtained in selected literature as presented in Table 4, CFAs possess a high concentration of Al2O3 and SiO2 than fly ashes obtained from biomass. Table 4 also presents the Portland cement Type II principal composition following the ASTM C150 standard. The two ash categories contain calcium oxide (CaO) about 86% lower Type II Portland Cement, however, they both have the concentration of SiO2 higher than that of the Type II Portland Cement. CFA-Badarpur analysed by [41] contains nearly similar compositions of Al2O3 and SiO2 but differs significantly in other chemical compounds.

International Conference on Engineering for Sustainable World
Journal of Physics: Conference Series 1378 (2019) 042075
IOP Publishing
doi:10.1088/1742-6596/1378/4/042075
10
(a) (b)
Figure 3: CFA (a) and WFA (b) elemental compositions at un-milled state as analysed by EDX Figure 4 shows the XRD diffractograms of CFA and WFA micro-particles at un-milled state. The crystal phases detected by the XRD in WFA are rhombohedral, hexagonal, cubic and tetragonal while that of CFA are hexagonal, orthorhombic, rhombohedral and anorthic. From XRD analysis, the dominant crystalline structures in WFA were calcite (CaC03), quartz (SiO2), Sylvite (KCl), Lime (CaO), maghemite-Q (Ɣ-Fe2O3), nitratetine (Na(NO3)) and magnetite (Fe3O4) phases. However, in CFA, the dominant structures were Quartz (SiO2), Mullite (Al2.32Si0.68O4.84), Sillimanite (Al2(SiO4)O, Calcite high (CaCO3), Hematite (Fe2O3), Microcline (KAlSi3O8).
(a) (b)
Figure 4: XRD diffractograms of CFA (a) and WFA (b) micro-particles at different milling times
From Figure 4, the intensity decreased with milling time for the WFA, which remained almost constant for CFA. Also, comparing the peak intensity of CFA with WFA, a higher value of count was observed at every stage of milling CFA. At almost 30° (2Ꝋ) CFA and 30° (2Ꝋ) WFA, the peaks were observed to higher. When considering, CFA, it was higher in 0 minutes and at 20, 40 and 60 minutes, the peak maintained almost same peak, which dictates that there is the stability of quality in CFA while in WFA, 0 minutes proved to have the highest peak and

International Conference on Engineering for Sustainable World
Journal of Physics: Conference Series 1378 (2019) 042075
IOP Publishing
doi:10.1088/1742-6596/1378/4/042075
11
the was gradual reduction as the milling time increases. This reduction could be as a result of contaminations in WFA from the source of preparation or the nature of the timber or wood-fired to generate ash. Hence, the integrity of the CFA remained evenly and subjective of the fact that it is a suitable material (powder reinforcement) and with relative to its elemental composition; show in high percentage proportion of Al2O3 and less of Iron Oxides. The opposite is the case of WFA. 3.2 Image segmentation The SEM images of both types (CFA and FWA) were originally obtained in 768 by 828 pixels dimension. The images were cropped into 750 by 745 pixels. SEM images obtained were binary images with the ash being of white intensity and the sputtering giving black shades. Hence, an image complementing process is essential. The resulting cropped image was complemented, such that black and white are revered in the binary images. This makes the ash the regions of interest other than the black spots signifying the sputtering. The micrographs of different milling time are shown in figures part (a) of Figures 5-12 for CFA and WFA. It is observed that both CFA and WFA contains large particle size before milling. From SEM images before segmentation, particle aggregation occurs, with the smaller particles sticking to larger. It was also established from the micrographs that further milling affect the size of the particles and there still agglomeration of the particles. Shown in Figures 5 – 12 are the SEM images before and after segmentation of both ashes. White spots represent the ash content and the black spots the sputtering effect. By physical inspection, a comparison between the segmented images of un-milled CFA (Figure 5b) and WFA (Figure 9b) samples, and the milled samples show smaller diameters of particles identified in the milled samples. The algorithm developed identifies prospective ash spots within the domain of the image size and magnification. Theoretically, it is established that the object position in an image does not influence the thresholding efficiency unless the position of the current object possesses varying levels of intensity [45]. In this case, the object differs distinctively from the background in terms of intensity. From the original images of prior to segmentation, the intensity difference= 100% (i.e. a white object with a black background). During segmentation, object elements are morphologically structured such that structuring element members consists of pixels with centres not greater than the minimum pixel of each object from the origin of the identified object.
Original and Segmented SEM Images of Coal FA

International Conference on Engineering for Sustainable World
Journal of Physics: Conference Series 1378 (2019) 042075
IOP Publishing
doi:10.1088/1742-6596/1378/4/042075
12
(5a) (5b) Figure 5a-b. Original SEM and segmented image of un-milled coal FA.
(6a) (6b)
Figure 6a-b. Original SEM and segmented image of coal FA at 20 minutes milling time.
(7a) (7b)
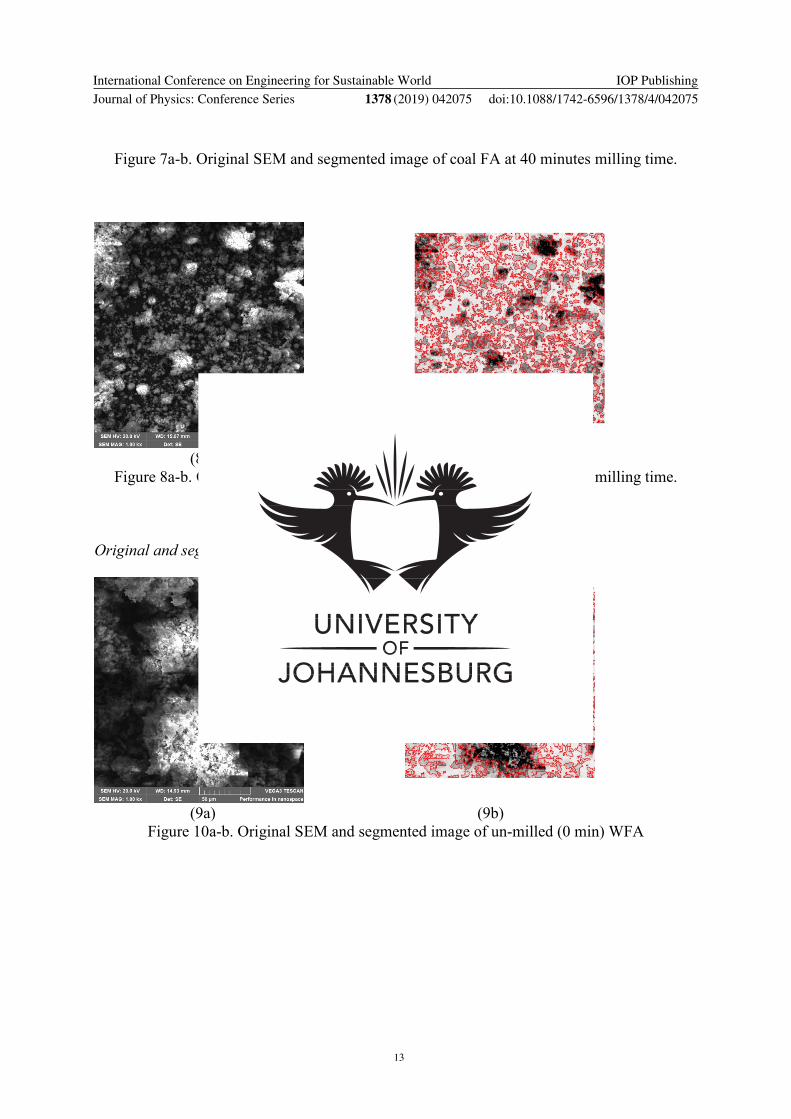
International Conference on Engineering for Sustainable World
Journal of Physics: Conference Series 1378 (2019) 042075
IOP Publishing
doi:10.1088/1742-6596/1378/4/042075
13
Figure 7a-b. Original SEM and segmented image of coal FA at 40 minutes milling time.
(8a) (8b)
Figure 8a-b. Original SEM and segmented image of coal FA at 60 minutes milling time.
Original and segmented SEM images of wood FA
(9a) (9b)
Figure 10a-b. Original SEM and segmented image of un-milled (0 min) WFA

International Conference on Engineering for Sustainable World
Journal of Physics: Conference Series 1378 (2019) 042075
IOP Publishing
doi:10.1088/1742-6596/1378/4/042075
14
(10a) (10b)
Figure 11a-b. Original SEM and segmented image of wood FA at 20 minutes milling time.
(11a) (11b)
Figure 11a-b. Original SEM and segmented image of wood FA at 40 minutes milling time.

International Conference on Engineering for Sustainable World
Journal of Physics: Conference Series 1378 (2019) 042075
IOP Publishing
doi:10.1088/1742-6596/1378/4/042075
15
(12a) (12b) Figure 12a-b. Original SEM and segmented image of wood FA at 60 minutes milling time.
For each milling case, the mean particle size within each image was calculated (Table 5). The microstructure decreases across the milling times compared to the initial diameter of 75 µm obtained from the sieve. The milling process is expected to decrease particle size with time. However, the particle size decreases until a stationary point is reached (Figure 13), where further milling does not result in a decrease in particle size. A similar scenario was recorded by [14, 46 - 47] where results obtained at grinding time of 1.5hrs and 2hrs were simila. The final particle size of sfly ash depends on the area of application. However, consideration should be given to the milling time to preserve the microstructure as well as the particle size of the ash.
Table 5. Mean particle size of CFA and WFA at varying milling time Milling Time
(mins) Mean (µm)- CFA Mean (µm)-
WFA 0 3.66 3.69 20 3.64 3.43 40 2.74 3.22 60 2.44 3.20
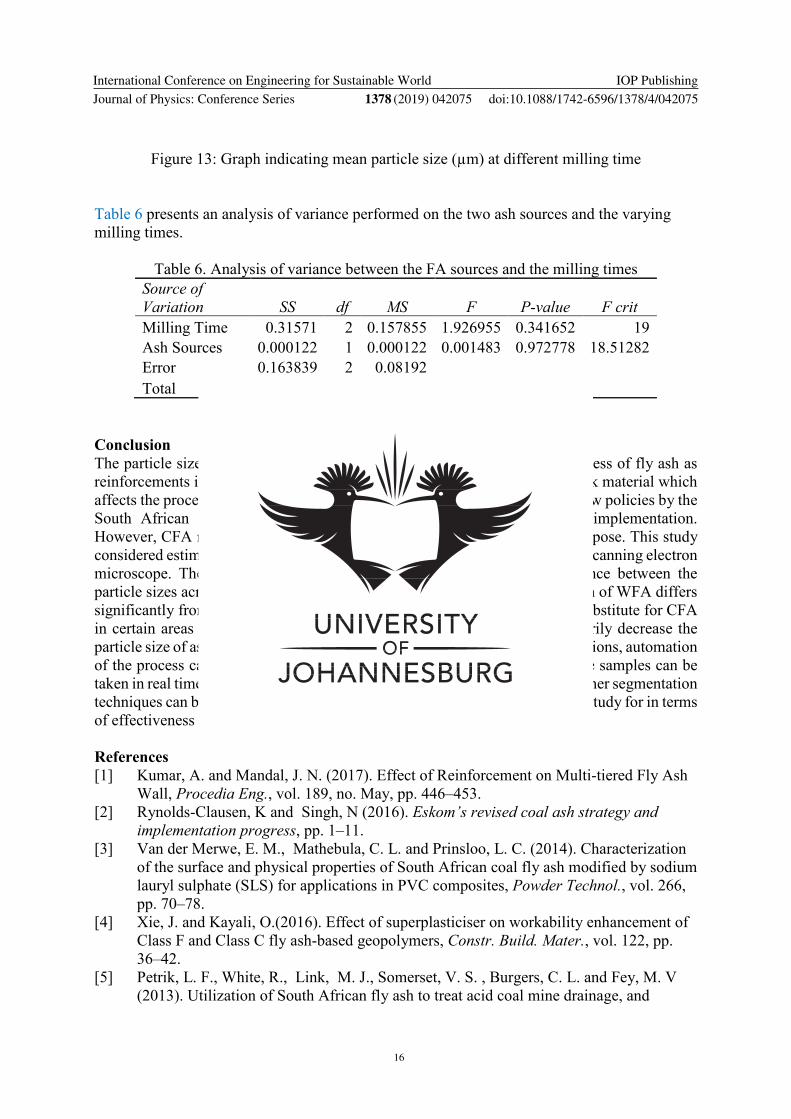
International Conference on Engineering for Sustainable World
Journal of Physics: Conference Series 1378 (2019) 042075
IOP Publishing
doi:10.1088/1742-6596/1378/4/042075
16
Figure 13: Graph indicating mean particle size (µm) at different milling time
Table 6 presents an analysis of variance performed on the two ash sources and the varying milling times.
Table 6. Analysis of variance between the FA sources and the milling times Source of Variation SS df MS F P-value F crit Milling Time 0.31571 2 0.157855 1.926955 0.341652 19 Ash Sources 0.000122 1 0.000122 0.001483 0.972778 18.51282 Error 0.163839 2 0.08192 Total 0.479671 5
Conclusion The particle size distribution is highly essential in determining the effectiveness of fly ash as reinforcements in material composites. The distribution is associated with bulk material which affects the processability and functionality as excipients in reinforcements. New policies by the South African government on making economic use of CFA is under implementation. However, CFA needs further milling for easy absorption for the intended purpose. This study considered estimating the particle size of CFA from images obtained from the scanning electron microscope. The result compared with WFA shows no significant difference between the particle sizes across varying milling time. However, the chemical composition of WFA differs significantly from CFA. This, unfortunately, does not make WFA a perfect substitute for CFA in certain areas of application. Increasing the milling time does not necessarily decrease the particle size of ash samples, which validates the literature. In industrial applications, automation of the process can be established such that the microstructural analysis of the samples can be taken in real time while the milling process is on-going. For further research, other segmentation techniques can be explored and the results compared with that obtained in this study for in terms of effectiveness and efficiency. References [1] Kumar, A. and Mandal, J. N. (2017). Effect of Reinforcement on Multi-tiered Fly Ash
Wall, Procedia Eng., vol. 189, no. May, pp. 446–453. [2] Rynolds-Clausen, K and Singh, N (2016). Eskom’s revised coal ash strategy and
implementation progress, pp. 1–11. [3] Van der Merwe, E. M., Mathebula, C. L. and Prinsloo, L. C. (2014). Characterization
of the surface and physical properties of South African coal fly ash modified by sodium lauryl sulphate (SLS) for applications in PVC composites, Powder Technol., vol. 266, pp. 70–78.
[4] Xie, J. and Kayali, O.(2016). Effect of superplasticiser on workability enhancement of Class F and Class C fly ash-based geopolymers, Constr. Build. Mater., vol. 122, pp. 36–42.
[5] Petrik, L. F., White, R., Link, M. J., Somerset, V. S. , Burgers, C. L. and Fey, M. V (2013). Utilization of South African fly ash to treat acid coal mine drainage, and

International Conference on Engineering for Sustainable World
Journal of Physics: Conference Series 1378 (2019) 042075
IOP Publishing
doi:10.1088/1742-6596/1378/4/042075
17
production of high quality zeolites from the residual solids,” 2003 Int. Fly Ash Symp., vol. 2, pp 1-8.
[6] Muriithi, G. N., Petrik, L. F., Gitari, W. M. and. Doucet, F. J (2017). Synthesis and characterization of hydrotalcite from South African Coal fly ash, Powder Technol., vol. 312, pp. 299–309.
[7] Koshy, N. and Singh, D. N. (2016). Fly ash zeolites for water treatment applications,” J. Environ. Chem. Eng., vol. 4, no. 2, pp. 1460–1472.
[8] Missengue, R. N. M. et al., (2017). Transformation of South African coal fly ash into ZSM-5 zeolite and its application as an MTO catalyst,” Comptes Rendus Chim., vol. 20, no. 1, pp. 78–86.
[9] Musyoka, N. M., Petrik, L. F. Fatoba, O. O. and Hums, E. (2013). Synthesis of zeolites from coal fly ash using mine waters,” Miner. Eng., vol. 53, pp. 9–15.
[10] Chareonpanich, M., Namto, T., Kongkachuichay, P. and Limtrakul, J. (2004). Synthesis of ZSM-5 zeolite from lignite fly ash and rice husk ash, Fuel Process. Technol., vol. 85, no. 15, pp. 1623–1634.
[11] IEA, (2015). World Energy Outlook. [12] Eskom, (2016). Coal Power, [13] Eskom, (2017) “Ash management in eskom,” [14] Du Plessis, H., Kearsley, E. P. and Matjie, H. (2007). Effect of grinding time on the
particle size distribution of gasification ash and Portland cement clinker,” J. South African Inst. Civ. Eng., vol. 49, no. 4, pp. 28–34.
[15] Matjie, R. H. Bunt, J. R. and van Heerden, J. H. P (2005). Extraction of alumina from coal fly ash generated from a selected low rank bituminous south African coal, Miner. Eng., vol. 18, pp. 299–310.
[16] Rosin, P. and Rammler, E. (1933). The laws governing the fineness of powdered coal,” Jounal Inst. Fuel, vol. 7, pp. 29–33.
[17] Vítěz, T. and Travníček, P. (2011). Particle Size Distribution of a Waste Sand From a Waste Water Treatment Plant With Use of Rosin–Rammler and Gates–Gaudin, Acta Univ. Agric. …, vol. 59, no. 3, pp. 197–202.
[18] Patricia, F. and Joao Manuel, R. (2012). Computational Vision and Medical Image Processing. Taylor & Francis Group, London.
[19] Xu, X., Xu, S., Jin, L. and Song, E. (2011). Characteristic analysis of Otsu threshold and its applications, Pattern Recognit. Lett., vol. 32, no. 7, pp. 956–961.
[20] Abutaleb, A. S. (1989). Automatic thresholding of gray-level pictures using two dimensional entropy, Comput. Vis. Graph. Image Process., vol. 47, pp. 22–32.
[21] Liang, K. H. and Mao, J. J. W. (1995). Image thresholding by minimizing the measures of fuzziness, Pattern Recognit., vol. 28, no. 1, pp. 41–51.
[22] Sezgin, M. and Sankur, B. (2004). Survey over image thresholding techniques and quantitative performance evaluation,” J. Electron. Imaging, vol. 13, pp. 146–168.
[23] Elbayoumi Harb, , S. M.N. Isa, A. M. and Salamah, S. A. (2015). Improved image magnification algorithm based on Otsu thresholding, Comput. Electr. Eng., vol. 46, pp. 338–355.
[24] Khairuzzaman, A. K. M. and Chaudhury, S. (2017). Multilevel thresholding using grey wolf optimizer for image segmentation,” Expert Syst. Appl., vol. 86, pp. 64–76.
[25] Hu, Q. M., Hou, Z. J. and Wieslaw, L. N. (2006). Supervised range-constrained thresholding, IEEE Trans. Image Process, vol. 15, pp. 228–240.
[26] Otsu, N. (1979). A Threshold Selection Method from Gray-Level Histograms, IEEE

International Conference on Engineering for Sustainable World
Journal of Physics: Conference Series 1378 (2019) 042075
IOP Publishing
doi:10.1088/1742-6596/1378/4/042075
18
Trans. Syst. Man. Cybern., vol. 9, no. 1, pp. 62–66. [27] Rohilla, L., Garg, V. , Mallick, S. S. and Setia, G. (2018). An experimental
investigation on the effect of particle size into the flowability of fly ash,” Powder Technol., vol. 330, pp. 164–173.
[28] Kuruvilla, J., Sukumaran, D., Sankar, A. and Joy, S. P. (2016). A review on image processing and image segmentation, 2016 Int. Conf. Data Min. Adv. Comput., pp. 198–203.
[29] Zaitoun, N. M. and Aqel, M. J. (2015). Survey on Image Segmentation Techniques,” Procedia Comput. Sci., vol. 65, no. Iccmit, pp. 797–806.
[30] Zhu, S., Xia, X., Zhang, Q. and Belloulata, K. (2007). An Image Segmentation Algorithm in Image Processing Based on Threshold Segmentation,” 2007 Third Int. IEEE Conf. Signal-Image Technol. Internet-Based Syst., pp. 673–678.
[31] Aly, A., Deris, S., and Zaki, N. (2011). Research review for digital image Segmentation techniques, Int. J. Comput. Sci. …, vol. 3, no. 5, pp. 99–106, 2011.
[32] Kaur, D. and Kaur, Y. (2014). International Journal of Computer Science and Mobile Computing Various Image Segmentation Techniques: A Review,” Int. J. Comput. Sci. Mob. Comput., vol. 3, no. 5, pp. 809–814.
[33] Kaur, A. (2012). A Review Paper on Image Segmentation and its Various Techniques in Image Processing, Int. J. Sci. Res. ISSN (Online Impact Factor, vol. 3, no. 12, pp. 2319–7064.
[34] Belviso, C. (2018). State-of-the-art applications of fly ash from coal and biomass: A focus on zeolite synthesis processes and issues, Prog. Energy Combust. Sci., vol. 65, pp. 109–135.
[35] Vamvuka, D. and Kakaras, E. (2011). Ash properties and environmental impact of various biomass and coal fuels and their blends, Fuel Process. Technol., vol. 92, no. 3, pp. 570–581.
[36] Makgato, S. S. and Chirwa, E. M. N. (2017). Waterberg coal characteristics and SO2minimum emissions standards in South African power plants, J. Environ. Manage., vol. 201, no. 2, pp. 294–302.
[37] Taggart, R. K., Hower, J. C. and Hsu-Kim, H. (2018). Effects of roasting additives and leaching parameters on the extraction of rare earth elements from coal fly ash,” Int. J. Coal Geol., vol. 196, no. May, pp. 106–114.
[38] Long, K. R., Van Gosen, B. S., Foley, N. K. and Cordier, D. (2010). The principal rare earth elements deposits of the United States - a summary of domestic deposits and a global perspective.
[39] Mayfield, D. B. and Lewis, A. S. (2013). Environmental review of coal ash as a resource for rare earth and strategic elements.,” in Proceedings of the 2013 World of Coal Ash (WOCA) Conference, Lexington, KY, USA, 2013, pp. 22–25.
[40] Seredin, V. V. ( 1996). Rare earth element-bearing coals from the Russian far east deposits, Int. J. Coal. Geol., vol. 30, pp. 101–129.
[41] Gupta, N., Gedam, V. V., Moghe, C. and Labhasetwar, P. (2017). Investigation of characteristics and leaching behavior of coal fly ash, coal fly ash bricks and clay bricks, Environ. Technol. Innov., vol. 7, pp. 152–159.
[42] Darsanasiri, A. G. N. D., Matalkah, F., Ramli, S., Al-Jalode, K., Balachandra, A. and Soroushian, P. (2018). Ternary alkali aluminosilicate cement based on rice husk ash, slag and coal fly ash, J. Build. Eng., vol. 19, no. November 2017, pp. 36–41.
[43] Mohseni, E., Hosseiny, S. S., Ranjbar, M. M., Roshandel, E. and Yazdi, M. A.
International Conference on Engineering for Sustainable World
Journal of Physics: Conference Series 1378 (2019) 042075
IOP Publishing
doi:10.1088/1742-6596/1378/4/042075
19
(2015). The effects of silicon dioxide , iron (III) oxide and copper oxide nanomaterials on the properties of self-compacting mortar containing fly ash,” Mag. Concr. Res., vol. 67, no. 20, pp. 1112–1124.
[44] ASTM, ASTM C150: Standard specification for Portland cement. Philadelphia, PA, USA. 11: Annual Book of ASTM Standards., 2011.
[45] Goh, T. Y., Basah, S. N., Yazid, H., Aziz Safar, M. J.and Ahmad Saad, F. S. (2018). Performance analysis of image thresholding: Otsu technique, Meas. J. Int. Meas. Confed., vol. 114, pp. 298–307.
[46] Ikumapayi, O. M. and Akinlabi, E. T. (2018). Characterizations of the evolving properties during the milling time of wood fly ash Nanoparticles (WFA-NPs). Proceedings of the International conference on Industrial Engineering and Operational Management, Pretoria/Johannesburg, South Africa, October 29 - November1, pp 2040 – 2049. [47] Ikumapayi, O. M. and Akinlabi, E. T. (2019). Effects of Vibratory Disc Milling Time on the Physiochemical and Morphological Properties of Coal Fly Ash Nanoparticle, Key Engineering Materials., vol. 796, pp. 38–45 doi: 10.4028/www.scientific.net/KEM.796.38

69
3.9 ARTICLE VIII
The influence of Wood-Fly Ash Reinforcement on the Wear Behaviour of
Friction Stir Processed Aluminium-Based Surface Matrix Composite
Published in the Proceedings of the International Conference on Industrial Engineering and
Operations Management, Toronto, Canada, October 23-25, 2019, page 966 – 977.
ISSN: 2169-8767
In this article, the potency of wood-fly ash (WFA) on the wear integrity in friction stir processed
aluminium-based surface matrix composite was investigated. The RTec Universal tribometer MTF
5000 was the machine tool used for the wear test; while the following parameters were applied on
the 4 mm x 10 mm x 6 mm specimen sample used. A Cyclic, ball on the flat-disc wear test mode
was used, with the E52100 alloy steel ball of grade 25; and the ball diameter of 6.35 mm and the
tests were conducted in accordance with the ASTM G133-05 standards.
Two different types of loads were applied on the surface of each sample, which were 20 N and 50
N, with sliding distances of 3 mm and 5 mm, respectively, while both had a sliding speed of 3
mm/s. The coefficient of friction (COF), the wear volume, the friction force for all the tested
samples. The other parameters were acquired from the MTF17 software, while the wear resistance
and the wear rate were computed.
These experiments were conducted at an ambient temperature of 25 ° C. The results showed that
at 50 N, the wear rate, the volume loss and the average COF were reduced; while the wear
resistance was higher than when a 20 N applied load was used. It was further observed that
AA7075-T651/WFA AMC performed far better than FSPed AA7075-T651 and AA7075-T651,
which were referenced for the controlled experiments. Abrasive wear was conspicuous at a lower

70
load of 20 N than at higher loads; and, as such, more debris was noted at the lower load levels.
This published conference article has been able to address some of the objectives of the study
especially those in item I, III to V.

Proceedings of the International Conference on Industrial Engineering and Operations Management
Toronto, Canada, October 23-25, 2019
Influence of Wood Fly Ash Reinforcement on the Wear
Behaviour of Friction Stir Processed Aluminium-
Based Surface Matrix Composite
Omolayo M. Ikumapayia, Esther T. Akinlabib
Department of Mechanical Engineering Science, University of Johannesburg, Auckland Park
Kingsway Campus, Johannesburg, 2006, South Africa
[email protected] ; [email protected]
Jyotsna D. Majumdar
Department of Metallurgical and Materials Engineering, Indian Institute of Technology,
Kharagpur, INDIA
Oluseyi P. Oladijo1,2
1Department of Chemical, Materials & Metallurgical Engineering, Botswana International University of Science and Technology, Palapye, Botswana
2Department of Mechanical Engineering Science, University of Johannesburg, Auckland Park Kingsway Campus, Johannesburg, 2006, South Africa
Stephen. A. Akinlabi1,2
1Department of Mechanical and Industrial Engineering, University of Johannesburg, Doornfontein Campus, Johannesburg, 2006, South Africa
2Department of Mechanical Engineering, Covenant University, Ota, Nigeria [email protected]
Abstract
In order to achieve low cost and cleaner production of metal matrix composites (MMC) has propelled younger
researchers into using various forms of agrowastes powders as promising and potential alternative to metallic powder
for reinforcement during the development and production of MMC. In recent past, industrial coal fly ash has been
used extensively for reinforcement both in stir casting and friction stir processing and this material are basically
found in big cities of some countries and as such not easily accessible to everyone. In this study, domestic wood fly
ash has been developed, characterized and utilized as reinforcement during friction stir processing of aluminium
alloy 7075-T651 due to its accessibility and availability to everyone, even people in the villages. The friction and wear
behaviours such as wear resistance, wear rate, wear volume, and coefficient of friction of the processed samples
were studied. Ball on flat disk tests were performed using Rtec Universal tribometer MTF 5000 with varying loads of
20 and 50 N under influence of dry friction. It was noted that at higher load of 50 N addition of wood fly ash greatly
reduced wear rate, volume loss and coefficient of friction and also increased wear resistance. It was also obvious that
abrasive wear was conspicuous at lower load of 20 N than at higher load and as such more debris were noted at lower
load.
Keywords: aluminium matrix composite, friction stir processing, wear, wood fly ash.
© IEOM Society International 966

Proceedings of the International Conference on Industrial Engineering and Operations Management
Toronto, Canada, October 23-25, 2019
© IEOM Society International
1. Introduction
High strength, aluminium-based surface matrix composite (ABSMC) especially AA7075 series has found huge
demand in aerospace, ballistic, electrical, aviation, tribological, space and air vehicle, automotive, thermal, structure,
defense industries, military, transportation, engineering, agrochemical, manufacturing, mineral processing and allied
industries because of their remarkable and unbeatable combination of surface matrix composites mechanical, physical
and electrochemical properties like high strength-to-weight ratio, superior damping capacities, oxidation and wear
resistance, creep and good corrosion resistance, high thermal and electrical conductivity, high fatigue and plastic flow
strength, high specific stiffness and strength and low coefficient thermal expansion (Cerit, Karamiş, Fehmi, & Kemal,
2008; N.Sun and Apelian, 2011).
In recent past, several metallic reinforcements particles have been deployed to develop metal matrix composites
(AMC) such powders as graphite(Baradeswaran & Perumal, 2014), stainless steel powder of various types, copper
powder(Sarmadi, Kokabi, & Reihani, 2013), titanium alloy powders of different kind, graphene, silicon carbide,
nitrides and oxides, to mention but a few. Nowadays, researchers have developed interest in utilizing agrowastes
powders as reinforcements in both frictions stir processing as well as stir casting techniques of developing AMC that
can serve as potential and promising replacement to metallic powders due to its availability and accessibility with low
cost of production. In recent time, some great works had been carried out using rice husk ash (Dinaharan, Kalaiselvan,
Akinlabi, & Davim, 2017; Zuhailawati, Halmy, Almanar, Seman, & Dhindaw, 2016) , palm kernel shell ash
(Ikumapayi & Akinlabi, 2018), bamboo powder, coconut shell ash, fly ash especially coal fly ash and wood fly ash
(An, Zhu, Li, Lu, & Liu, 2019; Dinaharan, Nelson, Vijay, & Akinlabi, 2016; Ikumapayi & Akinlabi, 2019a; Sharma,
Singh, & Chaudhary, 2017).
Wear behaviours of AA7075 at different tapered conditions have been studied extensively in the past under the
influence of different reinforcement particles. Wear behaviour of aluminium matrix surface composite (AMSC) of
AA7075 using multiwall carbon nanotubes (MWCNT) as reinforcement and ANOVA software was employed in
validating wear experimental results received from friction stir processing. In this study the rotational speed was
varying between 900 – 1200 rpm while traverse speed was between 42 – 50 mm/min. It was observed that at a
rotational speed of 1120 rpm and travel speed of 40 mm/min, there exist the minimum wear rate of 7.0 mm 3/m at
deployment of three passes (Pasha, P, & P, 2017). Wear parametric behaviour on the armour grade AA7075 under the
influence of solid lubricant MoS2 fabricated by friction stir processing was investigated. Different sizes of B4C was
used while at 30 µm with addition of solid lubricant MoS2 gave the lowest COF, highest hardness with the best
ballistic properties(I. Sudhakar, Madhu, Madhusudhan Reddy, & Srinivasa Rao, 2015). Similar wear behaviour of
AA7075 with the use of 2 wt%ZrB2 nanocomposites (NC) as reinforcement particle. There was an improvement in
the hardness properties of the processed zone and there exists reduction in the abrasion as the number of passes
increases as a result increases the delamination(Prasad, Tewari, & Singh, 2019).
2. Materials and Methods
2.1 Materials: Commercially rolled alumionium alloy 7075-T651 metal plates which was procured from Bharat Aerospace Metals,
Mumbai, India and supply in a dimension 500 x 600 x 6 mm3 and later sectioned to a usable dimension of 300 x 125
x 6 mm3 were used as base metal during friction stir processing experiment. The spark spectrometric analysis of as
received base metal was carried out and the result is presented in Table 1 and the mechanical properties in as received
form are Shear Modulus (26 GPa), Brinell Hardness (150), Fatigue strength (160Mpa), shear strength (330 MPa),
Elastic Modulus (70 GPa), Poisson’s Ratio (0.32), Yield Strength (500 MPa) and Ultimate tensile strength (UTS)
(570 MPa) (Ikumapayi & Akinlabi, 2019c). The base material was reinforced with nanoparticle of wood fly ash
(WFA-NPs).
Table 1: Chemical composition AA7075-T651 aluminium alloy
967
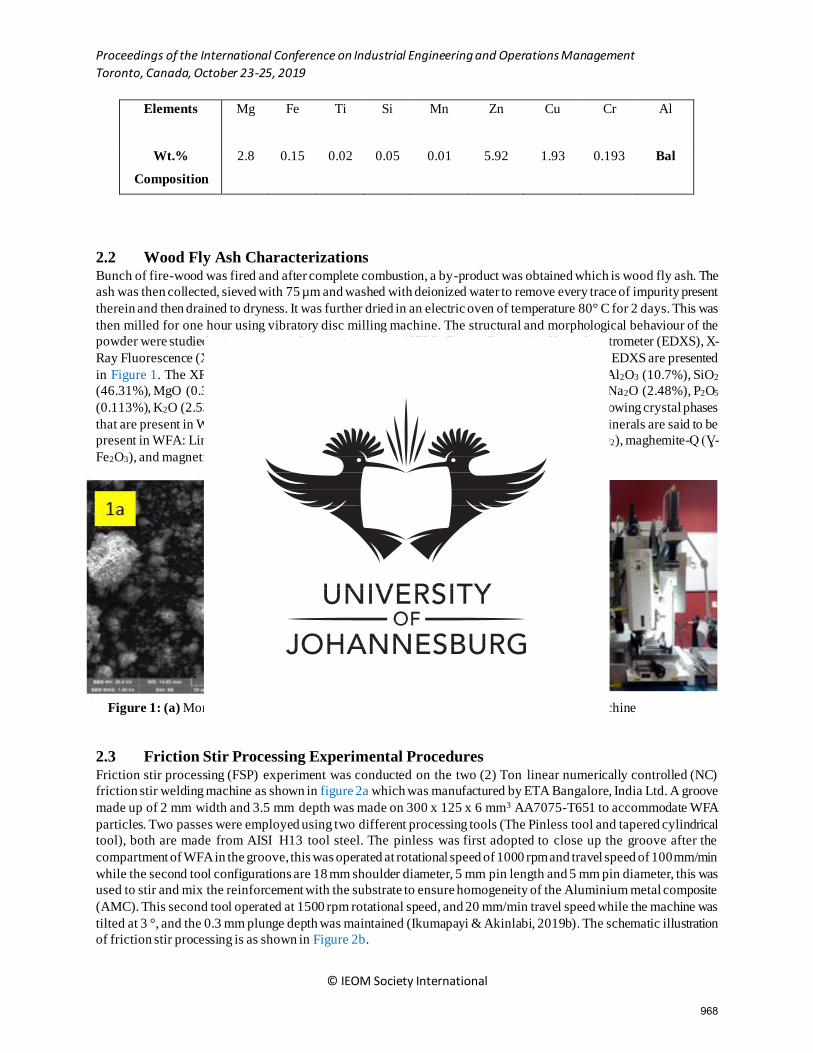
Proceedings of the International Conference on Industrial Engineering and Operations Management
Toronto, Canada, October 23-25, 2019
© IEOM Society International
Elements Mg Fe Ti Si Mn Zn Cu Cr Al
Wt.%
Composition
2.8 0.15 0.02 0.05 0.01 5.92 1.93 0.193 Bal
2.2 Wood Fly Ash Characterizations Bunch of fire-wood was fired and after complete combustion, a by-product was obtained which is wood fly ash. The
ash was then collected, sieved with 75 µm and washed with deionized water to remove every trace of impurity present
therein and then drained to dryness. It was further dried in an electric oven of temperature 80° C for 2 days. This was
then milled for one hour using vibratory disc milling machine. The structural and morphological behaviour of the
powder were studied using scanning electron microscope (SEM), Energy Dispersive X-ray Spectrometer (EDXS), X-
Ray Fluorescence (XRF) as well as X-ray Diffraction. The SEM Images and their corresponding EDXS are presented
in Figure 1. The XRF analysis revealed the chemical compositions contained in the WFA as Al2O3 (10.7%), SiO2
(46.31%), MgO (0.36%), TiO2 (0.933%), Fe2O3 (17.28%), CaO (3.002%), MnO2 (0.0471 %), Na2O (2.48%), P2O5
(0.113%), K2O (2.53%), SO3 (3.423 %) and LOI (8.00%). The XRD analysis revealed the following crystal phases
that are present in WFA as hexagonal, tetragonal, cubic and rhombohedral and the following minerals are said to be
present in WFA: Lime (CaO), calcite (CaC03), Sylvite (KCl), nitratetine (Na(NO3)), quartz (SiO2), maghemite-Q (Ɣ-
Fe2O3), and magnetite (Fe3O4).
Figure 1: (a) Morphology of WFA (b) WFA EDS Fig. 2a NC-controlled FSW machine
2.3 Friction Stir Processing Experimental Procedures Friction stir processing (FSP) experiment was conducted on the two (2) Ton linear numerically controlled (NC)
friction stir welding machine as shown in figure 2a which was manufactured by ETA Bangalore, India Ltd. A groove
made up of 2 mm width and 3.5 mm depth was made on 300 x 125 x 6 mm3 AA7075-T651 to accommodate WFA
particles. Two passes were employed using two different processing tools (The Pinless tool and tapered cylindrical
tool), both are made from AISI H13 tool steel. The pinless was first adopted to close up the groove after the
compartment of WFA in the groove, this was operated at rotational speed of 1000 rpm and travel speed of 100 mm/min
while the second tool configurations are 18 mm shoulder diameter, 5 mm pin length and 5 mm pin diameter, this was
used to stir and mix the reinforcement with the substrate to ensure homogeneity of the Aluminium metal composite
(AMC). This second tool operated at 1500 rpm rotational speed, and 20 mm/min travel speed while the machine was
tilted at 3 °, and the 0.3 mm plunge depth was maintained (Ikumapayi & Akinlabi, 2019b). The schematic illustration
of friction stir processing is as shown in Figure 2b.
968

Proceedings of the International Conference on Industrial Engineering and Operations Management
Toronto, Canada, October 23-25, 2019
© IEOM Society International
Fig. 2b. Schematic of Friction Stir Processing Fig. 3a. Tribometer experimental set-up
Fig. 3b. Illustration of Tribometer set-up
2.4 Wear Mechanism
Wear behaviours of the fabricated aluminium metal matrix composite (AMMC) using wood fly ash as reinforcement
was experiemnted alongside with the friction stir processed base metal – FSPed AA7075-T651 and unprocessed base
metal – AA7075-T651 to serve as control experiments. Dry sliding wear test was carried out on the dimensions 24
mm x 10 mm x 6 mm using Rtec Universal tribometer MTF 5000 which has integrated 3D in-line profilometer for
Imaging and is capable of performing the test on nano, micro, and macro load. It has a force sensor, temperature, and
humidity controller, environmental isolation panel to reduce acoustic interference as well as data acquisition and
motion controller. In this study, a Cyclic, ball on flat disc wear test mode was used with E52100 alloy steel ball of
grade 25 and the ball diameter of 6.35 mm and the tests were conducted in accordance with ASTM G133-05 standards
(Erinosho et al., 2017). Two different types of loads were applied on the surface of each sample which is 20 N and 50
N with sliding distance 3 mm and 5 mm respectively while both have a sliding speed of 3 mm/s. The wear tracks were
captured with an attached microscope on the tribometer. The data were acquired from MFT17 software installed on
the computer that was linked to Rtec Universal tribometer for analysis. The coefficient of friction (COF), wear volume,
friction force for all the tested samples and other parameters were acquired from MTF17 software. The experiments
were conducted at an ambient temperature of 25 ° C.
3. RESULTS AND DISCUSSION
3.1 Friction and Wear Results for Aluminium –Based Surface Matrix Composite
The efficacy of wood fly ash (WFA) on the wear behaviour under the influence of varying loads during friction stir
processing were experimented in this study. In order to evaluate the influence of WFA on wear characteristics some
parameters were considered, measured, computed and recorded in the course of the experiments and after the
completion of the experiments. Such parameters are, wear resistance, coefficient of friction, wear volu me (volume
loss), wear rate, wear depth as well as friction force(Ikumapayi, OM, Akinlabi, Esther T and Majumdar, 2019).
Volume loss from each tested sample was extracted from the profiler generated by the machine after the experiment
and recorded, and this can be computed using the following mathematical equations in Equations (i) and ii (Deuis,
Subramanian, & Yellup, 1997) (D. Sudhakar, Jeyasimman, & Duraiselvam, 2015).
𝑉𝑤 = 𝐶𝑤 𝑑𝐿
3ℎ(i)
Where Vw = Wear Volume, Cw = Wear Coefficient, d = Sliding distance, L = Load applied and h = Substrate bulk
hardness
969

Proceedings of the International Conference on Industrial Engineering and Operations Management
Toronto, Canada, October 23-25, 2019
© IEOM Society International
𝑉𝑜𝑙𝑢𝑚𝑒 𝑙𝑜𝑠𝑠 (𝑚𝑚3) = (𝑊𝑒𝑖𝑔ℎ𝑡 𝑙𝑜𝑠𝑠 (𝑔)
𝐷𝑒𝑛𝑠𝑖𝑡𝑦 (𝑔
𝑚𝑚3)) 𝑥 1000 (ii)
Wear rate was computed using equation (iii) and wear resistance at different loading was also estimated using equation
(iv) (Baruwa, Oladijo, Maledi, & Akinlabi, 2018; Kumar & Wani, 2017; D. Sudhakar et al., 2015) while the average
coefficient of friction was obtained from the data extracted from the machine and this can be calculated theoretically
using equation (v) (Jeyaprakash, Yang, Duraiselvam, & Prabu, 2019).
Wear rate (mm3/m) = (𝑉𝑜𝑙𝑢𝑚𝑒 𝑙𝑜𝑠𝑠 (𝑚𝑚3)
𝑆𝑙𝑖𝑑𝑖𝑛𝑔 𝑑𝑖𝑠𝑡𝑎𝑛𝑐𝑒 (𝑚)) 𝑥 1000 (iii)
Wear resistance (m/mm3) = (𝑆𝑙𝑖𝑑𝑖𝑛𝑔 𝑑𝑖𝑠𝑡𝑎𝑛𝑐𝑒 (𝑚)
𝑉𝑜𝑙𝑢𝑚𝑒 𝑙𝑜𝑠𝑠 (𝑚𝑚3)) 𝑥 1000 (iv)
Coefficient of friction (µ) = 𝐹𝑟𝑖𝑐𝑡𝑖𝑜𝑛 𝐹𝑜𝑟𝑐𝑒 (𝐹𝑓 )
𝐴𝑝𝑝𝑙𝑖𝑒𝑑 𝐿𝑜𝑎𝑑 (𝐿) (v)
Figure 4 (a-c) represents the SEM micrographs when 20 N load was applied on the unprocessed base metal -AA7075-
T651, processed base metal – FSPed AA7075-T761 and the fabricated aluminium metal matrix composite reinfoced
with wood fly ash - AA7075-T651/WFA. The abrasive and delamination are the predominant when 20 N load was
applied. In Fig. 4a, there are clear and continuous (longitudinal) abrasive marks along the direction of the steel ball,
with the deepest marks/scratches at the mid of the wear track. At the end of the wear track large wear debris can be
observed; with obvious free bright (small) particles (debris) fully delaminated from the tested sample (unprocessed
base metal – AA7075-T651). These small particles are dominant at the edges of the wear grooves. In Fig. 4(b), the
scratch marks along the direction of the reciprocating steel ball are discontinuous, with large (partially bright) particles
randomly distributed throughout the wear track. The discontinuous scratches are indicators of some form of wear
resistance by the large particles distributed on the wear tracks (Baradeswaran & Perumal, 2014). In Fig. 4(c), the wear
debris are also distributed randomly but appear dense and fully broken, particles of WFA were seen, there was
delamination of the AA7075-T651/WFA. In these samples, the free broken particles get attached or pushed by the
steel ball onto the substrate, thereby enhancing grooving and contribute to 3 body wear mechanism as also reported
in the of Prasad et al. (Prasad et al., 2019).
Fig. 4(ai) - (ci): In these samples, the wear is predominated by delamination and adhesion. Due to higher loads (50N),
there is generation of heat, which degrades the mechanical properties of the samples and therefore enhancing softening
and plastic deformation of material along the wear paths. Softening and plastic deformation of the material along the
wear path ensures that the material being removed gets ‘smeared’ onto the walls of the wear track or onto the steel
ball and as such, it is not obvious to see the wear debris as it was conspicuous in the case when 20 N was applied.
970

Proceedings of the International Conference on Industrial Engineering and Operations Management
Toronto, Canada, October 23-25, 2019
© IEOM Society International
Fig. 4. SEM Images for Wear track showing wear width of 20 N Load (a) AA7075-T651 (b) FSPed AA7075-T651
(c) AA7075-T651/WFA; SEM Images for Wear track showing wear width of 50 N Load (ai) AA7075-T651 (bi)
FSPed AA7075-T651 (ci) AA7075-T651/WFA
3.2 Effects of Varying Load on the Wear Properties
The parametric behaviours when 20 N applied load, sliding distance and speed of 3 mm each, and cyclic time of 5
min conducted at an ambient temperature of 25 ° C is shown in Table 2 while the data obtained when 50 N applied
load, at sliding distance and sliding time of 5 mm each with sliding speed of 3 mm is equally displayed in Table 3.
It was evidentially clear that lots of debris were seen on the morphological examination when 20 N applied load was
engaged while very few of debris were seen on the morphological surface when 50 N applied load was used and this
may be as a result of intense heat generated during the reciprocating sliding movement of the steel ball on the
workpiece and as such leads to degeneration of mechanical properties by causing plastic deformation and softening
the wear paths (Baradeswaran & Perumal, 2014), thereby removing the deposited wear debris along the wear track. It
was also seen from the morphology examination that average wear widths taken on the SEM Image in Figure 4 were
noticed to have been larger at an applied load of 20 N and lower at an applied load of 50 N. Delamination was also
noticed in each wear tracks when 20 N load wear applied at different tested samples than when 50 N load was applied.
Figures 5 and 6 show the wear tracks when 20 N force and 50 N force was respectively applied on the unprocessed
base metal – AA7075-T651, processed base metal – FSPed AA7075-T651 and the reinforced metal matrix composite
- AA7075-T651/WFA. The wear profiling at different testing stages, i.e. AA7075-T651, FSPed AA7075-T651, and
FSPed AA7075-T651/WFA AMC were also presented and 3D geometry of 50 N load for AA7075-T651, FSPed
AA7075-T651 and FSPed AA7075-T651/WFA AMC were also presented.
971

Proceedings of the International Conference on Industrial Engineering and Operations Management
Toronto, Canada, October 23-25, 2019
© IEOM Society International
Fig. 5. Wear track for Load of 20 N (a) AA7075-T651 (b) FSPed AA7075-T651 (c) AA7075-T651/WFA; and
Profiler (ai) AA7075-T651 (bi) FSPed AA7075-T651 (ci) AA7075-T651/WFA
Fig. 6. 2D View of Wear track for Load of 50 N (a) AA7075-T651 (b) FSPed AA7075-T651 (c) AA7075-T651/WFA;
3D View (ai) AA7075-T651 (bi) FSPed AA7075-T651 (ci) AA7075-T651/WFA; Profiler (aii) AA7075-T651 (bii)
FSPed AA7075-T651 (cii) AA7075-T651/WFA
Figure 7 presents different plots that explicitly explain the effects of varying load on the wear parametric properties
such as wear volume, wear rate, wear resistance and coefficient of friction while other parameters are presented in
Tables 2 and 3 for the base metal – AA7075-T651, FSPed AA7075-T651 and AA7075-T651/WFA AMC.
Table 2. Wear Results conducted at ambient temperature for Load of 20 N
Parameters 20 N, 5 mins, 3 mm and 3 mm/s
Sample Wear Depth
(mm)
COF Wear Volume
(mm3)
Wear Rate (mm3/m)
Wear Resistance
(m/mm3)
Wear width (µm)
Friction Force
(N)
AA7075-T651 0.0213 0.4680 0.049940 16.647 60072.09 920.22 9.360 FSPed AA7075-T651
0.0201 0.4568 0.042313
14.104 70900.19 1099.76 9.136
AA7075-T651/WFA
0.1543 0.4181 0.038761 12.920 77397.38 1163.85 8.362
At 20 N applied load in Table 2, the wear volume for unprocessed base metal – AA7075-T651 was 0.049940 mm3
which was higher than when 50 N load is applied in Table 3 which gave wear volume of 0.028358 mm3 for the same
unprocessed base metal. By implication, for unprocessed base metal - AA7075-T651, the wear rate is lower when 50
N load is applied than when 20 N load is applied which gave 5.672 mm3/m in 50 N load and 16.647 mm3/m in 20 N
load. This also dictates that there was greater wear resistance in 50 N applied load for unprocessed base metal –
AA7075-T651 than 20 N which was found to be 176317.09 m/mm3 as against 60072.09 m/mm3 in 20 applied loads.
The COF was noticed to be lower in 50 N applied Load for unprocessed base metal which is 0.1969 than in 2 0 N for
the same AA7075-T651 which gave 0.4680 as also evidence in Figure 7, and the same trend was noticed in friction
972

Proceedings of the International Conference on Industrial Engineering and Operations Management
Toronto, Canada, October 23-25, 2019
© IEOM Society International
force results for AA7075-T651 but it was noticed that the wear depth for unprocessed base metal – AA7075-T651
when 20 N load was applied is lower than when 50 N is applied which was 0.0213 mm as against 0.0288 mm.
On examining FSPed AA7075-T651 at different varying load it was observed that the wear volume was more in 20 N
load than in 50 N load which resulted to 0.042313 mm3 as against 0.014390 mm3 in 50 N. The results in Tables 2 and
3 further show that FSPed AA7075-T651 has lower wear rate when 50 N load is applied than when 20 N load is
applied, i.e. the wear rate for 50 N load was 2.878 mm3/m which that of 20 N was 14.04 mm3/m while the wear
resistance is higher in 50 N than in 20 N applied load. The wear resistance was 347463.51 m/mm3 in 50 N load and
70900.19 m/mm3 in 20 N for processed base metal – AA7075-T651p. Wear depth was 0.1135 mm in 50 N which was
higher than in 20 N of 0.0714 mm for FSPed AA7075-T651. The average COF was lower in 50 N which was 0.1320
than in 20 N load which was 0.4568 for AA7075-T651.
Aluminium matrix composite reinforced with WFA also followed the same trend as above. It was noticed that 50 N,
its wear volume was 0.010087 mm3 while that of 20 N load was 0.038761 mm3, this performs better than either FSPed AA7075-T651 and AA7075-T651. The wear rate was 2.0174 mm3/m in 50 N load while it was 12.920 mm3/m in 20 N load; the wear resistance was 495687.51 m/mm3 in 50 N load and that of 20 N load was 77397.38 m/mm3. The average COF was lower in 50 N which was 0.1119 and that of 20 N was 0.4181. Overall, it was observed that AA7075-T651/WFA AMC performed better than FSPed AA7075-T651 and AA7075-T651 in terms of wear rate as well as wear resistance, the results corroborated with the work of Irfan et al. (El-Aziz, Saber, & Sallam, 2015).
Table 3. Wear Results conducted at ambient temperature for Load of 50 N
Parameters 50 N, 5 mins, 5 mm and 3 mm/s
Sample Wear
Depth
(mm)
COF Wear
Volume
(mm3)
Wear Rate
(mm3/m)
Wear
Resistance
(m/mm3)
Wear
width
(µm)
Friction
Force
(N)
AA7075-T651 0.0288 0.1969 0.028358 5.672 176317.09 401.65 9.845
FSPed AA7075 0.1135 0.1320 0.014390 2.878 347463.51 355.27 6.600
AA7075-
T651/WFA
0.0165 0.1119 0.010087 2.0174 495687.51 749.41 5.595
973

Proceedings of the International Conference on Industrial Engineering and Operations Management
Toronto, Canada, October 23-25, 2019
© IEOM Society International
Fig. 7 (a) Wear Rate (b) Wear Resistance (c) Wear Volume (d) Average COF for AA7075-T651, FSPed AA7075-
T651 and FSPed AA7075-T651/WFA AMC at load 20N and 50 N
Figure 7 (a-d) represent the plots of wear volume, wear resistance, wear rate and COF for the unprocessed base metal – AA7075-T651, unreinforced but processed base metal – FSPed AA7075-T651 as well as fabricated aluminium matrix composite – AA7075-T651/WFA at different loading conditions of 20 N and 50 N. In Figure 7a, wear rate was lower when 50 N applied load was engaged, at different tested samples, wear rate at higher load is
lower. Wear resistance is higher at higher load as seen in Figure 7b. The higher the load, the higher the wear resistance but the lower the wear rate, wear volume and the coefficient of friction as seen in Figure 7. It is essential to mention that Wear rate and wear volume are directly proportional and they inversely proportional to wear resistance as noticed in Figure 7 (a-d). Increase in wear volume, increases the wear rate and decreases the wear resistance, while the lower the COF the better as shown in Fig. 7d (Irfan, Haq, & Anand, 2018; D. Sudhakar et al., 2015).
Conclusion
The influence of wood fly ash (WFA) on wear properties at varying loads has been experimentally studied. Characterizations of WFA such as elemental and chemical compositions, minerals and phases present were presented. Morphology of worn surfaces, and wear tracks were also presented. It was noted that addition of WFA greatly enhanced the wear integrities on friction stir processed AA7075-T651. From the results and the discussions, it can be
concluded that higher load improved wear properties. It was noted that at 50 N, the wear rate, volume loss and average COF were reduced while wear resistance was higher at all instances. It was further observed that AA7075-T651/WFA AMC performed far better than FSPed AA7075-T651.
Acknowledgments
The authors wish to acknowledge the financial support offered by the University of Johannesburg, South Africa in
form of Supervisor-Linked and Merit Bursaries in actualization of this research work for publication.
References
An, Y., Zhu, L., Li, W., Lu, J., & Liu, X. (2019). Study of fl y ash-based fl ux e ff ects on
microstructure and wear of TIG- cladded Ni-based composite coating. Results in
974

Proceedings of the International Conference on Industrial Engineering and Operations Management
Toronto, Canada, October 23-25, 2019
© IEOM Society International
Engineering, 12(December 2018), 970–974. https://doi.org/10.1016/j.rinp.2018.12.004
Baradeswaran, A., & Perumal, A. E. (2014). Wear and mechanical characteristics of Al 7075 /
graphite composites. Composites Part B, 56, 472–476.
https://doi.org/10.1016/j.compositesb.2013.08.073
Baruwa, A. D., Oladijo, O. P., Maledi, N., & Akinlabi, E. T. (2018). Influence of Surface
Treatment on Dry Sliding Wear Behavior of Hydrophobic Silane Coating on AISI 304. IOP
Conference Series: Materials Science and Engineering, 423, 012158.
https://doi.org/10.1088/1757-899X/423/1/012158
Cerit, A. A., Karamiş, M. B., Fehmi, N., & Kemal, Y. (2008). Effect of reinforcement particle
size and volume fraction on wear behaviour of metal matrix composites. Tribology in
Industry, 30(3–4), 31–36.
Deuis, R. L., Subramanian, C., & Yellup, J. M. (1997). SLIDING WEAR OF ALUMINIUM
COMPOSITES-A REVIEW. Composites Science and Technology, 3538(96), 415–435.
Dinaharan, I., Kalaiselvan, K., Akinlabi, E. T., & Davim, J. P. (2017). Microstructure and wear
characterization of rice husk ash reinforced copper matrix composites prepared using
friction stir processing. Journal of Alloys and Compounds, 718, 150–160.
https://doi.org/10.1016/j.jallcom.2017.05.117
Dinaharan, I., Nelson, R., Vijay, S. J., & Akinlabi, E. T. (2016). Microstructure and wear
characterization of aluminum matrix composites reinforced with industrial waste fly ash
particulates synthesized by friction stir processing. Materials Characterization, 118, 149–
158. https://doi.org/10.1016/j.matchar.2016.05.017
El-Aziz, K. A., Saber, D., & Sallam, H. E. D. M. (2015). Wear and Corrosion Behavior of Al–Si
Matrix Composite Reinforced with Alumina. Journal of Bio- and Tribo-Corrosion, 1(1), 1–
10. https://doi.org/10.1007/s40735-014-0005-5
Erinosho, M. F., Akinlabi, E. T., Pityana, S., Owolabi, G., Park, A., Campus, K., … Africa, S.
(2017). Laser Surface Modification of Ti6Al4V-Cu for Improved Microhardness and Wear
Resistance Properties. Materials Research., 20(4), 1143–1152.
https://doi.org/10.1590/1980-5373-MR-2017-0175
Ikumapayi, OM, Akinlabi, Esther T and Majumdar, J. D. (2019). Influence of Carbonaceous
Agrowastes Nanoparticles on Physical and Mechanical Properties of Friction Stir Processed
AA7075-T651 Metal Matrix Composites. Surface Topography: Metrology and Properties,
7(3), 1–17. https://doi.org/10.1088/2051-672X/ab3aae
Ikumapayi, O. M., & Akinlabi, E. T. (2018). Composition , Characteristics and Socioeconomic
Benefits of Palm Kernel Shell Exploitation-An Overview. Journal of Environmental
Science and Technology, 11(6), 1–13. https://doi.org/10.3923/jest.2018.Review
Ikumapayi, O. M., & Akinlabi, E. T. (2019a). A Comparative Assessment of Tensile Strength
and Corrosion Protection in Friction Stir Processed AA7075-T651 Matrix Composites
Using Fly Ashes Nanoparticles as Reinforcement Inhibitors in 3.5 % NaCl. International
Journal of Mechanical and Production Engineering Research and Develeopment , 9(3),
839–854. https://doi.org/10.24247/ijmperdjun201992
Ikumapayi, O. M., & Akinlabi, E. T. (2019b). Efficacy of α - ꞵ grade titanium alloy powder ( T i-
6Al-2Sn-2Zr-2Mo-2Cr- 0 . 25Si ) in surface modification and corrosion mitigation in 3 . 5
% NaCl on friction stir processed armour grade 7075-T651 aluminium alloys – Insight in
Defence Applications. Materials Research Express, 6, 1–16.
https://doi.org/https://doi.org/10.1088/2053-1591/ab1566
Ikumapayi, O. M., & Akinlabi, E. T. (2019c). Experimental data on surface roughness and force
975

Proceedings of the International Conference on Industrial Engineering and Operations Management
Toronto, Canada, October 23-25, 2019
© IEOM Society International
feedback analysis in friction stir processed AA7075-T651 aluminium metal composites.
Data in Brief, 23, 103710. https://doi.org/10.1016/j.dib.2019.103710
Irfan, M., Haq, U., & Anand, A. (2018). Dry Sliding Friction and Wear Behavior of AA7075-Si
3 N 4 Composite. Silicon, 10, 1819–1829. https://doi.org/10.1007/s12633-017-9675-1
Jeyaprakash, N., Yang, C., Duraiselvam, M., & Prabu, G. (2019). Microstructure and tribological
evolution during laser alloying WC-12 % Co and Cr 3 C 2 − 25 % NiCr powders on nodular
iron surface. Results in Physics, 12(December 2018), 1610–1620.
https://doi.org/10.1016/j.rinp.2019.01.069
Kumar, P., & Wani, M. F. (2017). Friction and wear behaviour of hypereutectic Al-Si alloy /
steel tribopair under dry and lubricated conditions, 15(June), 21–49.
N.Sun and Apelian, D. (2011). Friction Stir Processing of Aluminum Cast Alloys for High
Performance Applications. Aluminium:Shaping and Forming, 44–50.
Pasha, S. A., P, R. R., & P, L. N. (2017). Wear behavior and Microstructural Characterization of
AA7075 / MWCNT Surface Composites fabricated through Friction Stir Processing. IOSR
Journal of Mechanical and Civil Engineering, 14(3), 140–146.
https://doi.org/10.9790/1684-140305140146
Prasad, R., Tewari, S. P., & Singh, J. K. (2019). Microstructural and wear characterization of
friction stir processed ZrB 2 /AA7075 in-situ composites . Materials Research Express,
6(8), 086514. https://doi.org/10.1088/2053-1591/ab1a1a
Sarmadi, H., Kokabi, A. H., & Reihani, S. M. S. (2013). Friction and wear performance of
copper – graphite surface composites fabricated by friction stir processing ( FSP ). Wear,
304(1–2), 1–12. https://doi.org/10.1016/j.wear.2013.04.023
Sharma, V. K., Singh, R. C., & Chaudhary, R. (2017). Effect of flyash particles with aluminium
melt on the wear of aluminium metal matrix composites. Engineering Science and
Technology, an International Journal, 20(4), 1318–1323.
https://doi.org/10.1016/j.jestch.2017.08.004
Sudhakar, D., Jeyasimman, D., & Duraiselvam, M. (2015). Dry Sliding Wear Behavior of Cr 3 C
2 -NiCr Coating on Austenitic Stainless Steel. International Journal Of Core Engineering
& Management, 1(12), 215–225.
Sudhakar, I., Madhu, V., Madhusudhan Reddy, G., & Srinivasa Rao, K. (2015). Enhancement of
wear and ballistic resistance of armour grade AA7075 aluminium alloy using friction stir
processing. Defence Technology, 11(1), 10–17. https://doi.org/10.1016/j.dt.2014.08.003
Zuhailawati, H., Halmy, M. N., Almanar, I. P., Seman, A. A., & Dhindaw, B. K. (2016).
Mechanical Properties of Friction Stir Processed 1100 Aluminum Reinforced with Rice
Husk Ash Silica at Different Rotational Speeds. International Journal of Metallurgical &
Materials Engineering, 2(120), 1–6.
Biographies
Omolayo M. Ikumapayi is a Ph.D. research scholar at the Department of Mechanical Engineering Science, University of Johannesburg South Africa. He obtained MSc in Mechanical Engineering (option in Design and Production) from the University of Lagos, Nigeria and his BEng in Mechanical Engineering from the Federal University of Agriculture Makurdi, Nigeria. He is currently a contract staff (Lecturer) at the University of Johannesburg, South Africa. He was a one-time Lecturer at Afe Babalola University, Ado Ekiti and Covenant University Ota, Nigeria. He was also a one-time teaching assistant at the University of Lagos, Nigeria. He is a registered Engineer with COREN, Member of
Nigerian Society of Engineer (MNSE), Member of Nigerian Institution of Mechanical Engineer (MNIMechE), Member of Chartered Institute of purchasing and supply management of Nigeria (MCIPSM), Member of Academy
976

Proceedings of the International Conference on Industrial Engineering and Operations Management
Toronto, Canada, October 23-25, 2019
© IEOM Society International
for Entrepreneurial Studies (M.AES) and Associate Member of the Certified Institute of Shipping, Nigeria (ACIS) among others. His research interests include manufacturing, simulation, processing using agro-wastes powders,
surface modifications, characterizations, tribocorrossion, Friction stir processing/welding, electron beam processing/welding and nanotechnology.
Esther T. Akinlabi is a full Professor at the Department of Mechanical Engineering Science, Faculty of Engineering
and the Built Environment, University of Johannesburg. Her research interest is in the field of modern and advanced
manufacturing processes –Friction Stir Welding/Processing, AutoCAD, Research Design. Her research in the field of
laser based additive manufacturing include laser material processing and surface engineering. She also conducts
research in the field of renewable energy, and biogas production from waste. She is a rated National Research
Foundation (NRF) researcher and has demonstrated excellence in all fields of endeavors. Her mentorship and research
experience are enviable as she guides her team of postgraduate students through the research journey. She is a recipient
of several research grants and has received many awards of recognition to her credit. She is a member of the prestigious
South African Young Academy of Science and registered with the Engineering Council of South Africa. Prof Akinlabi
has filed two patents, edited one book, published four books and authored/co-authored over 400 peer reviewed
publications.
Jyotsna Dutta Majumdar is currently a Full Professor in the Department of Metallurgical and Material Engineering,
Indian Institute of Technology, Kharagpur, West Bengal, India. She is Life Member to the following professional
bodies and Organization: Indian Institute of Metals (IIM), Indian Science Congress Association (ISCA), Indian Laser
Association (ILA), Materials Research Society of India (MRSI), Indian Institute of Foundrymen (IIF) and National
Association of Corrosion Engineers amongst others. She has authored several peer-reviewed scholarly Journals,
Books, Book Chapters and Several Patents to her credentials. Her research interests Surface Engineering, corrosion
and surface degradation, physical metallurgy, Development of functionally graded components, Laser Coating,
thermal spraying, electron beam welding,
Oluseyi P. Oladijo, PhD is a senior Lecturer with the Department of Chemical, Material and Metallurgical
Engineering at Botswana International University of Science and Technology (BIUST), Palapye, Botswana. Prior to
that, he completed his postdoctoral fellowship in School of Chemical and Metallurgical Engineering at University of
the Witwatersrand, South Africa. He received his PhD degree in Material Science and Engineering field from the
University of the Witwatersrand, South Africa in 2013. Until now, he has published several peer -reviewed publication
and research project. His research interest focused on hard materials, coatings, residual stress analyses using
diffraction techniques, tribology, corrosion, self-healing of materials and material characterization.
Stephen A. Akinlabi, PhD is currently a Senior Research Associate at Department of Mechanical and Industrial
Engineering Department, University of Johannesburg, Johannesburg, South Africa. His area of research includes
Welding- Friction stir welding and processing, Hybrid welding, MIG and TIG Welding, laser based additive
manufacturing include laser material processing and surface engineering, renewable energy, and biogas production
from waste. He has published several peer-reviewed journals and conferences and research project.
977

71
4 CHAPTER 4: PEER-REVIEWED/SCOPUS INDEXED BOOK
CHAPTER
4.1 INTRODUCTION
In this chapter, a book chapter developed in this work has been appended. This chapter was
submitted in peer-reviewed and Scopus-indexed book publisher. The experiments, analyses, and
content presented in this chapter were undertaken by the author of this thesis. The chapter is
appended, according to the publisher’s formatting requirements.

72
4.2 ARTICLE I
Applications of coconut shell ash/particles in modern manufacturing: a case
study of friction stir processing.
Modern Manufacturing Processes. Pp 69 – 95.
https://doi.org/10.1016/B978-0-12-819496-6.00004-X.
ISBN 978-0-12-819496-6
In this book chapter, an in-depth research was carried out on the applications of coconut shell
ash/particles in manufacturing processes and a case study of friction stir processing was
established. The global market of coconut shell as it is denominated in the following countries,
Brazil, Nigeria, Indonesia, Sri Lanka, Thailand, Philippines, Malaysia as well as India was
established. The use of coconut shell ash/particles in reinforcement, activated carbon, filler,
aggregate, charcoal, purification of water, and removal of heavy metals as well as its applications
in matrix composites such as in ceramic, polymer as well as metal are extensive researched on.
Different elemental and chemical compositions; physical and mechanical properties of coconut
shell particles as documented by different researchers were revealed. A case study of the use of
carbonized coconut shell ash/particle in friction stir processing was revealed. In this study,
Structural integrity was analyzed by X-Ray Diffraction (XRD) and surface roughness analysis was
examined using surface roughness tester on the fabricated samples. Xforce P-type Zwick/Roell
Z250 Tensile tester, scanning electron microscopic (SEM) and X-Ray Fluorescence (XRF) were
respectively used to analyze tensile properties, morphological examination as well as elemental
and chemical compositions. It was revealed that sample that was reinforced with coconut shell ash
performed better than those that were not reinforced with any particles. fabricated AMC –
Al7075/CCSA was 6000 cps intensity while that of FSPed Al7075 was 3500 cps and Al7075 was
73
2500 cps. Similarly, average surface roughness (Ra) recorded for the FSPed Al7075/CCSA was
2.98 µm while Ra obtained for FSPed Al7075 was 11.61 µm. The crystallite size of the fabricated
aluminium matrix composite (AMC) - FSPed Al7075/CCSA was 38.6 nm while that of FSPed
Al7075 was 41.2 nm and Al7075 was 48.7 nm. This published article has been able to address
some of the objectives of the study especially those in item I, III to V.
CHAPTER FOUR
Applications of coconut shellash/particles in modernmanufacturing: a case study offriction stir processingOmolayo M. Ikumapayi1, Esther T. Akinlabi1, Jyotsna D. Majumdar2
and Stephen A. Akinlabi31Department of Mechanical Engineering Science, University of Johannesburg, Auckland Park KingswayCampus, Johannesburg, South Africa2Department of Metallurgical and Materials Engineering, Indian Institute of Technology, Kharagpur, India3Department of Mechanical Engineering, Faculty of Engineering and Technology, Butterworth Campus,Walter Sisulu University, South Africa
4.1 Introduction
Coconut shell (CS) is an agricultural solid-waste material that hasbeen causing environmental unfriendliness to people living around the pro-duction site. The poor management, utilization, and proper disposal of agri-cultural wastes caused environmental menace which affects the health statusof the dwellers. Notwithstanding, a lot of benefits had been exploited byseveral researchers varying from particulate for structural or constructionadditives, powder reinforcement in polymer and metal matrix composites,water purification, and energy generation. Coconut shell ash (CSA) hasbeen reported to have produced the highest activated carbon among theagrowaste materials [1]. Coconut plant has lots of useful waste materialssuch as fronds, husk as well as shell. In this study, the applications of thestrongest part of the coconut, which is CS in science and technology areextensively exploited. The CS is located between the coconut flesh andcoconut husk, and this is typically used to protect and enclose the innerpart of coconut. The applications of CS have proven in the following areas,namely reinforcement and coarse aggregate, activation carbon, filler, andenergy source due to its high toughness, excellent adsorption capability,durability properties, efficient abstractive resistance, and most suitable for
69Modern Manufacturing Processes.DOI: https://doi.org/10.1016/B978-0-12-819496-6.00004-X
© 2020 Elsevier Ltd.All rights reserved.
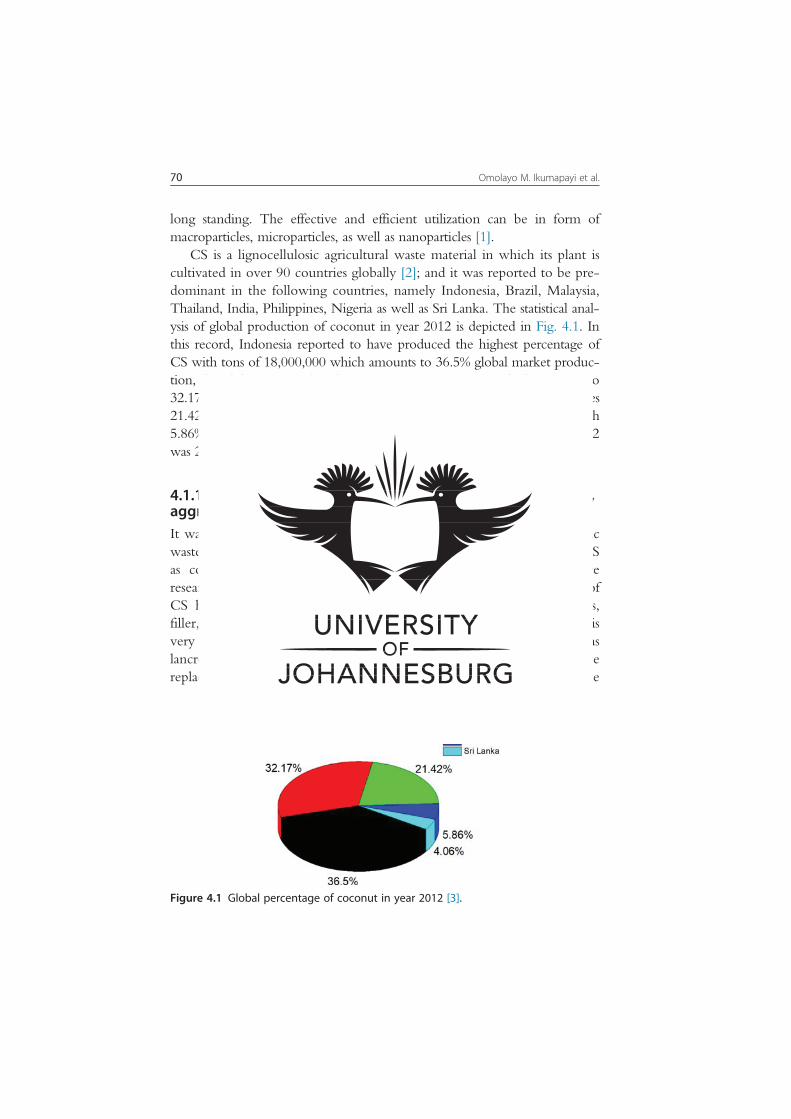
long standing. The effective and efficient utilization can be in form ofmacroparticles, microparticles, as well as nanoparticles [1].CS is a lignocellulosic agricultural waste material in which its plant is
cultivated in over 90 countries globally [2]; and it was reported to be pre-dominant in the following countries, namely Indonesia, Brazil, Malaysia,Thailand, India, Philippines, Nigeria as well as Sri Lanka. The statistical anal-ysis of global production of coconut in year 2012 is depicted in Fig. 4.1. Inthis record, Indonesia reported to have produced the highest percentage ofCS with tons of 18,000,000 which amounts to 36.5% global market produc-tion, the Philippines produced 15,862,386 tons as at 2012 which amounts to32.17% global production, India produced 10,560,000 tons which gives21.42% global production of CS while Brazil produced 2,883,532 tons with5.86% global percentage, and Sri Lanka production of CS as at year 2012was 2,000,000 tons with a global percentage of 4.06% [3].
4.1.1 Application of coconut shell as concrete reinforcement,aggregate, and as fillerIt was established that CS as solid wastes contributed to 60% of domesticwastes and its disposal has been problematic and this led to the use of CSas composite materials in the production of concrete after extensiveresearch on its suitability [2]. The most sustainable area of application ofCS has been in coarse aggregate for concrete production as additives,filler, and reinforcement. It has been proven that cement natural binder isvery expensive to produce sandcrete blocks, concrete, mortar as well aslancrete bricks and this has led to searching for a promising alternativereplacement binder. The fundamental raw materials used for the
Figure 4.1 Global percentage of coconut in year 2012 [3].
70 Omolayo M. Ikumapayi et al.

production of concrete are (1) water, (2) cement, (3) coarse aggregate(gravel or granite chippings), and (4) sand (fine aggregate); the summationcost for the production of concrete depends entirely on the availability ofthe aforementioned materials [4]. On this note, researchers and engineersare greatly concerned with the growing rate at which resources aredepleting and this has propelled them to seek and develop a promisingreplacement which is entirely new materials from biomaterials as binders.It is well noted that utilization of concrete material in building and con-struction industries are growing geometrically due to high demand ofconcrete. To meet this demand with low cost and still maintain its prop-erties, has endeared the researchers for using agricultural waste materialsthat will still serve the intended purposes and retains its integrities.Many researchers have worked on this area and there are some attri-
butes that CS possess that makes it excellently suitable for reinforcing con-crete. The attributes are [3]:1. CS are biodegradable and eco-friendly2. High modulus and promising strength characteristics3. It contains excellent lignin contents which makes the fabricate compo-sites to be resistant to weather conditions
4. The surface texture when CS was used for the formation of concretebecomes nearly smooth on concave face and becomes nearly rough onconvex face
5. CS can be used in any form on concrete either in macro or micro; (6)the sugar content in CS has no effect on the strength and formation ofconcrete
6. It contains lower cellulose content, and this made it absorb lessermoisture when compared with other agrowastes
7. They are renewable resources8. Absence of health hazards9. Low densityLeman et al. [2] investigated the physical and chemical attributes of CS
powder to be considered as filler in concrete production. These propertieswere established via scanning electron microscopic (SEM), of X-ray fluo-rescence (XRF), specific gravity, particle size distribution as well as densitydetermination. It was revealed from the XRF result that CS largely potas-sium oxide (K2O) with 1.21%, carbon with 10.00%, and silicon dioxide(SiO2) with 0.98% which played important roles in mixing of the con-crete. Others chemical composition revealed are chlorine (Cl) with0.79%, iron (III) oxide (Fe2O3) with 0.35%, magnesium oxide (MgO)
71Applications of coconut shell ash/particles in modern manufacturing
with 0.31%, sodium oxide (Na2O) with 0.29%, calcium oxide with0.23%, and molybdenum (VI) oxide (MoO3) with 0.17%.Kanojia and Jain [3] studied the efficacy of CS as coarse aggregate in
concrete. The study aimed at providing an alternative aggregate for con-crete over conventional coarse aggregates. Both density and compressivestrength were tested and it was found that there was 62% reduction incompressive strength was achieved with 40% replacement of conventionalcoarse aggregates within a test time of 7 days whereas 21.5% reduction incompressive strength was achieved for the same 40% replacement for28 days. It was concluded that the cost of additional cement was inevitable,but the overall performance was great with the use of alternative aggregatesas against the natural one. CS has proven to be effective and efficient as par-tial replacement as coarse aggregates for the depletion of natural source.The study carried out will help researchers to arrive ultimate decisionregarding the amount of CS to be applied as additive for nature coarseaggregates during the mixing and production of concretes [3].The study into the durability characteristics of CS on aggregate con-
crete was investigated by Nadir and Sujatha [5]. In this study, admixtureof CS particulates, ground granulated furnace slag with fly ash was used asreinforcements at different mixing ratios. The following tests were con-ducted to establish the durability of the produced concretes, sorptivity,water absorption, rapid chloride penetration, volume of pore voids as wellas bulk diffusion. The research revealed that by the addition of admixtureson the coarse aggregates, the durability properties of the produced con-crete is said to be improved [5].Effect of milling time was investigated on the CS using top-down
approach to produce uncarbonized CS nanoparticles. Mechanical millingof CS was done for 70 h by the application of ceramic balls of varyingsizes. SEM coupled with energy-dispersive X-ray spectroscopy (EDS) aswell as transmission electron microscope (TEM) were employed for mor-phological examination. Nanoparticle derived from the milling of CSpowder of 37 μm, was estimated to be 18.23 nm [6].
4.2 Application of coconut shell ash as activatedcarbon or as charcoal
One of the commercial products of CS that possessed desirable andesteemed characteristics because of its worth is coconut charcoal. Coconut
72 Omolayo M. Ikumapayi et al.
charcoal as a valuable commercial product is used to produce activecarbon and some other global market products which shall be discussed.CS has been confirmed to have produced the highest activated carbonamong the agrowaste materials globally. Some of the uses of coconutcharcoal are listed below:1. Coconut shell charcoal (CSC) is used as fuel in most of the foodindustries as a promising replacement to normal coal because of itshigh heating content and nice fragrance produced during burning.Most of the food industries are now using coconut charcoal for thepreparation of barbecues and other cultural aliments.
2. CSC possessed is an excellent and promising purifier and moisturizer,and these attributes made it suitable to produce soaps. Coconut char-coal soaps was revealed to be sensitive and suitable for most skins andthey are available in most of the groceries and some of the supermar-ket close to us.
3. Coconut charcoal has been confirmed for its efficacy as a natural teethwhitener. It has been experimented for the cleaning of yellowish anddark teeth with an amazing result which gave instant white teeth.
4. In recent times, researchers confirmed that coconut charcoal has beenused as feed for animals especially pigs, cattle as well as poultry. It wasrevealed that, milk production rates has increased tremendously as aresult of feeding the cattle with coconut charcoal and the expectantlife of pigs has increased with reduction in diseases that affected themand the pigs have gained weights at the same time.
5. It was revealed that excellent quality of grasses is produced when CSCis used alongside with sand and other biomass materials to plantgrasses. Golf courses developers are now using this new and amazingtechnology to their advantage to get quality playfield.Salleh et al. [7] studied the potency of activated carbon derived from
CS in reinforcing polymer matrix composites and this was later encapsu-lated with epoxy resin. Different percentage by volume of CS activatedcarbon were used ranging from 2 to 6 wt.% while the percentage by vol-ume of polymer (polypropylene, PP) that was used ranging from 4 to8 wt.% in step of 2 wt.% in each case. The polymer matrix composite wasprepared by silicon rubber molds having the following shapes, namelyrectangular as well as dumbbell in accordance with the standard of ASTMD256 and ASTM D2099, respectively. It was noted that tensile strengthof the fabricated polymer matrix composite increases with the increase inCS activated carbon from 4 to 8 wt.% and the tensile strength was
73Applications of coconut shell ash/particles in modern manufacturing

achieved at PP 4 wt.% 1 AC 6 wt.% composite whereas the impactstrength of the study was obtained at PP 6 wt.%1 AC 4 wt.%.CSA and CSC were compared experimentally. In this experiment to
reinforce the open mold process was used to cast polyester matrix compo-sites using CSC as the reinforcement and absorption; mechanical as wellas abrasion tests were conducted on the fabricated composite. It was notedthat flexural and tensile properties are said to have improved with increasein the volume of coconut shell particles from 1 to 5 wt.%. It was alsoestablished that the abrasion resistance properties of the fabricated polymermatrix composite reinforced with CSA decreases with increase in the per-centage by volume of CSA while the value of CSC was slightly higherthan CSA. The same trend was noted in water absorption ability [8].
4.3 Application of coconut shell particle as waterpurification and heavy metals removal
It is evidentially clear that heavy metals and some elements found inthe body of water has caused unbearable threats to the environment, peo-ple living around the place, and the public health due to the food chainand toxicity. Such heavy metals, ions, or elements include uranium, fluo-ride, cesium, chlorine, strontium, and lead II ion in which most of theheavy metals or ions may come from the industries producing the follow-ing items glass, battery, ceramic, printing, metal painting as well as leadadditives for gasoline and these can cause partial or permanent damage tothe following organs kidneys, liver, neuronal system, brain as well asreproduction system. Due to some activities in the production of somereactive materials some wastes have been generated and this needs instanttreatment. The separation, removal, and concentration of these wastes canbe achieved via any of the following means, namely precipitation, adsorp-tion, evaporation, and ion exchange. In this research work coconut shellactivated carbon was used for the adsorption of cesium, strontium, anduranium ions from the aqueous medium. The study used Freundlich iso-therm as well as Langmuir isotherm fitted models for the analysis [9].Carbonic materials are becoming more popular and widely used inmanufacturing process for filler, reinforcement, purification of water aswell as fuel production. Son et al. [10] developed carbon material viacoconut shell especially carbon dioxide for the adsorption technique.
74 Omolayo M. Ikumapayi et al.

Catalytic centers were developed in this study for doping of metals suchas cobalt, nickel, magnesium, copper, and calcium on coconut char bydipping it in aqueous medium. The evaluation of the produced sampleswas carried out using adsorption capacity, surface area, and morphologicalstudy via SEM.It is essential to note that, coconut shell carbon that was produced
via potassium hydroxide (KOH) activation was employed to absorblead (II) from aqueous medium. Agitation time, adsorbent concentra-tion as well as initial concentration were studied with the use ofnitrogen adsorption process as well as SEM analysis. It was revealedthat porous structure was eminent because of high concentration ofKOH. The model used for the validation of the adsorption wereLangmuir, DubininRadushkevich, Temkin, Halsey, Freundlich, andHarkinsJura isotherms [11].In the same vein, coconut shell activated carbon was used for water
treatment as a means of defluoridation. This was used to absorb excessfluorine in the body of water. The WHO has setup a standard for fluoridecontent for the drinking water between 1.5 and 4.0 mg-F/L. It must beaware that fluoride can be consumed from various means either throughvegetables consumption with fluoride contents between 0.1 and 0.4 mg/kg or food stuffs varying from 2 to 5 mg/kg in barley, rice consumptionwith 2 mg/kg while canned fish can contain as much as 370 mg-F/kg. Itmust further be noted that dry tea leaves contained about 400 mg/kg. Itwas revealed that fluoride contaminated water has been major source ofhuman exposure to chloride and this accounts for about 90% intake offluoride ion on a daily basis. The evaluation of batch experiment was con-ducted to determine the degree of removal of fluoride ions in the body ofwater. It was established that coconut shell activated carbon wassuitable for the treatment of fluoride ions in water. It was further estab-lished that particle sizes contributed to the adsorption rate of the fluorideions. The smaller the particle size the better was the absorption rate. Theabsorption rate was validated using Langmuir and Freundlich isothermmodels. This study suggested that coconut shell activated carbon issuitable for filter of portable water at home so that it can be free of fluo-ride ions [12].Coconut shell activated carbon was used to remove 2,4-dichlorophe-
nol (2,4-DCP). The coconut shell was carbonized in about 500C for 2 hand was activated chemically using zinc chloride (ZnCl2). The removal ofchlorinated phenols from the body of aqueous medium was achieved
75Applications of coconut shell ash/particles in modern manufacturing

through the following models—Freundlich, Langmuir, as well as Temkinisotherm. It was revealed that the best model that fitted the absorption ofwas 2,4-DCP was Freundlich isotherm [13].
4.4 Application of coconut shell in metal, polymer,and ceramic matrix composites
Aluminum matrix composite (AMC) was fabricated via compocast-ing technique by reinforcing it with CSA with varying percentage byvolumes of CSA from 5%, 10% to 15% and in this study, efficacy of wearproperties were conducted using pin-on-disc experimental set-up, 2000 mwas employed as sliding distance during tribological experiment, 10 N ofapplied load, and the sliding velocity that was used rated 2 m/s. The fol-lowing statistical methods were also adopted grey relational grade (GRG),fuzzy interface system (FIS), as well as Tagushi desirability functional anal-ysis (DFA). It was observed that addition of CSA increases the tensilestrength and hardness properties of the fabricated composite and this alsodecreases the elongation and the density of the fabricated composite.Analysis of variance (ANOVA) was used to predict the optimum para-meters. It was noted that grey-fuzzy reasoning grade (GFRG) producedthe least error of approximately 0.015 than other statistical methods [14].Aluminum alloy was reinforced with coconut shell particles via double
stir-casting technique with varying percentage by volume from 3 to15 wt.%. The mechanical and metallographic properties were evaluated;and density, microstructure as well as hardness properties were carriedout. SEM-energy-dispersive X-ray (EDX) and XRF analyses were used inthis study. Results revealed that increase in the percentage by volume ofcoconut shell particles decreases the density of the cast aluminum metalmatrix composite but the hardness of the reinforced and cast aluminummetal matrix composites was said to have increased. The analysis in thisstudy revealed through XRF that CSA contains 15.6% Al2O3, 0.57%CaO, 16.2% MgO, 12.4% Fe2O3, 0.22% MnO, 0.52% K2O, 0.3% ZnO,45.05% SiO2, and 0.45% Na2O [15].Hybridization of aluminum with CSA admixture with graphite was
investigated during stir-casting experiment. Tribological integrity of thecast samples were evaluated using different parametric measures. It wasrevealed that mechanical properties such as hardness as well as tensile
76 Omolayo M. Ikumapayi et al.

strength were improved when coconut shell was added alone whereaswhen graphite was added the following were improved—tribologicalbehavior, toughness, and specific strength [16].The study established the efficient utilization of carbonized coconut
shell powder as polymer reinforcement during synthesis of aluminum(1XXX) nanoparticle using ball-milling which serves as solid interface andlubricant. In this study, Fourier-transform infrared spectroscopy (FTIR),TEM, X-ray diffraction (XRD), and SEM were employed in the analysis.It was noted that aluminum nanoparticle was greatly reduced withincrease in the milling time [17].In this study, coconut shell powder was used as a filler in natural rub-
ber composites production. The potency of the produced nature rubbercomposites was tested using different techniques varying from tear andtensile strength analysis, swelling evaluation was conducted to reveal cross-link density as well as hardness of the vulcanizates was measured. Thefractography of the tensile samples was taken by SEM. It was revealedthat reinforcing the natural rubber with coconut shell powder greatlyenhanced the hardness, tensile strength, and thermal properties. The studyfurther revealed that, coconut shell powder contains 29.4% lignin, 27.7%pentosans, 26.6% cellulose, 8% moisture, 0.6% ash, 4.2% solvent extrac-tives, and 3.5% uronic anhydrides [18].Mechanical properties and morphological characteristics of rein-
forced polymer (polyethylene) matrix composites with low densitycoconut shell powder with an average particle size of 100 μm, wasinvestigated. The percentage by volume of coconut shell particulateswere varied between 0% and 25% with a step of 5% and its effect wasstudied on the fabricated polymer matrix composites. It was establishedthat only hardness of the reinforced composite increased with anincrease in coconut shell particles while impact and tensile strengths,ductility as well as modulus of elasticity were all reduced with increasein the percentage of coconut shell powder. This study established thepossibility of using agricultural solid waste such as coconut shell powderas a replacement to metallic powder for reinforcing polymer matrixcomposites [19].Oliveira and Marques [20] made a vivid chemical treatment compari-
son in using green coconut husk as well as curaua fiber for compatibilitywith PP matrix. The two samples were evaluated before and after thechemical treatments to ascertain its influence of morphology and thermalstability. An increase in crystallinity index was observed when using
77Applications of coconut shell ash/particles in modern manufacturing

coconut shell fiber from 53% when in untreated natural fiber to 67%when treated with coconut shell fiber. Similar observation was noted incuraua fiber which increase from 61% when in untreated natural fiber to81% when treated with curaua fiber [20].Coconut shell powder was used as a filler on different silane coupling
agents in blended thermoplastic polyurethane and natural rubber(ISNR-5). The mechanical and metallographic characteristics of themodified interfacial adhesion were studied. The properties investigatedwere abrasion resistance, tensile strength, hardness as well as tear strengthwhile FTIR and SEM of the modified samples were also carried out.SEM and thermogravimetric analysis revealed that mechanical propertiesespecially thermal stability increased with addition in coconut shellpowder [21].Sarki et al. [22] researched on the potential utilization of coconut shell
particulates as fillers in eco-composite materials. In this study, mechanicalattributes and morphology of the fabricated epoxy polymer matrix com-posite was investigated. An excellent interfacial interaction between thereinforcement particles (coconut shell powder) and the substrate (epoxypolymer) was achieved. It was established in this study that addition ofcoconut shell particle greatly improved tensile strength, hardness, andmodulus of elasticity while the impact strength was lower with increase inthe filler particle.The complete coconut contains husk of 50%, meat of 25%, shell of
15%, as well as water of 10%. It was established that coconut shell is madeup of cellulose of 34%, pentosans of 29%, lignin of 36% as well as ash of1%. This 15% shell of the whole coconut was later analyzed for chemicalcompositions and chemical contents. The variability in chemical composi-tions and chemical contents of coconut shell are, respectively, presentedin Tables 4.1 and 4.2. The variability in elemental compositions of coco-nut shell is presented in Table 4.3 while the ranges of chemical, mechani-cal, and physical properties of coconut shell as reported by Gunasekaranet al. [25] is presented in Table 4.4.In this present study, carbonized coconut shell ash (CCSA) was used
on the high strength armor grade aluminum alloy, Al7075-T651, thereinforcement of CCSA into Al7075 was integrated using friction stir pro-cessing (FSP). The fabricated Al7075-T651/CCSA was characterizedusing tribological, structural as well as mechanical properties. The resultsare then analyzed and presented.
78 Omolayo M. Ikumapayi et al.
Table 4.2 Variability in chemical content of coconut shell particles.Chemical name Sareena et al.
[18]Balan et al.[21]
Arena et al.[23]
Endut et al.[24]
Cellulose 26.6% 34% 30.58% Moisture 8% 8.86% 6.726 0.18Ash 0.6% 0.56% 1.036 0.09Hemicellulose 21% 26.70% Uronicanhydrides
3.5 5
Lignin 29.4% 27% 33.30% Starch 0 Pentosan 27.7% Protein 2% Fat 5% Solventextractives
4.2%
Volatile matter 64.246 1.44
Table 4.3 Variability in elemental composition of coconut shell particles.Element Ikumapayi and Akinlabi [1] and
this StudyLemanet al. [2]
Arena et al.[23]
Endut et al.[24]
C 66.2% 10.00% 45.03% 28.016 1.64H 6.94% O 25.40% 47.47% Ca 0.6% K 3.9% Fe 0.7% Cl 1.5% 0.79% Mg 0.2% Si 0.4%
Table 4.1 Variability in chemical composition of coconut shell particles.Chemicalformula
Ikumapayi and Akinlabi[1] and this study
Lemanet al. [2]
Oluwole andOluwaseun [8]
Akuet al.[15]
Sivaet al.[16]
SiO2 45.6% 0.98% 46% 45.05% 48.2%Al2O3 16.76% 16% 15.6% 16.68%CaO 0.78% 0.23% 0.57% 0.67%MgO 19.4% 0.31% 18% 16.2% 18.2%Fe2O3 8.98% 0.35% 14% 12.4% 9.42%MnO 0.17% 0.5% 0.22% 0.25%K2O 0.42% 1.21% 1.2% 0.52% 0.59%ZnO 0.39% 0.6% 0.3% 0.32%Na2O 0.41% 0.29% 0.9% 0.45% 0.47%MoO3 0.17%

4.5 Materials and methods
The section itemized the materials used in this study, means of col-lection, preparation, and processing. The section further explained themethods of production of CCSA, and method of fabrication of AMCunder investigation.
4.5.1 Materials collection and preparationIn this experiment matured coconut fruits (see Fig. 4.4A) were obtainedat Hilbrow market in Johannesburg axis of South Africa. The coconutfruits were then broken with the help of cutlass into several pieces(uneven chunks) and the edible parts were then extracted while the coco-nut water inside was drained away. The coconut shells were then sepa-rated (see Fig. 4.2B), and the fibers lining were removed from the back ofthe broken coconut shell and washed thoroughly with water and acetonewas used to remove any unwanted materials that can hinder the outcomeof the experiment and were further broken into smaller pieces(see Fig. 4.2C). The chunks of the coconut shell were then placed inside
Table 4.4 Ranges of chemical, mechanical, and physical properties of coconut shell[25].Mechanical and physicalproperties
Measuredvalues
Chemicalproperties
Measuredvalues
Flakiness index 100% pH 6.006.40Apparent specific gravity 1.40%1.50% Total phenols 05.15%Impact value 7.00%8.50% Glucose 01.85%Moisture content 4.00%4.50% Reducing sugar 07.40%Crushing value 2.00%3.00% Ash 0.500.60Shell thickness 28 mm Fructose 02.90Water absorption 20.00%25.00% Cellulose 32.00%Bulk density (tamped) 640650 kg/m3 Sucrose 14.75%Specific gravity 1.05%1.25%% of voids 45.0050.00Bulk density (loose) 525550 kg/m3Abrasion value 1.50%1.65%Fineness modulus(sieve analysis)
6.00%6.30%
% of voids (tamped) 30.0040.00
80 Omolayo M. Ikumapayi et al.
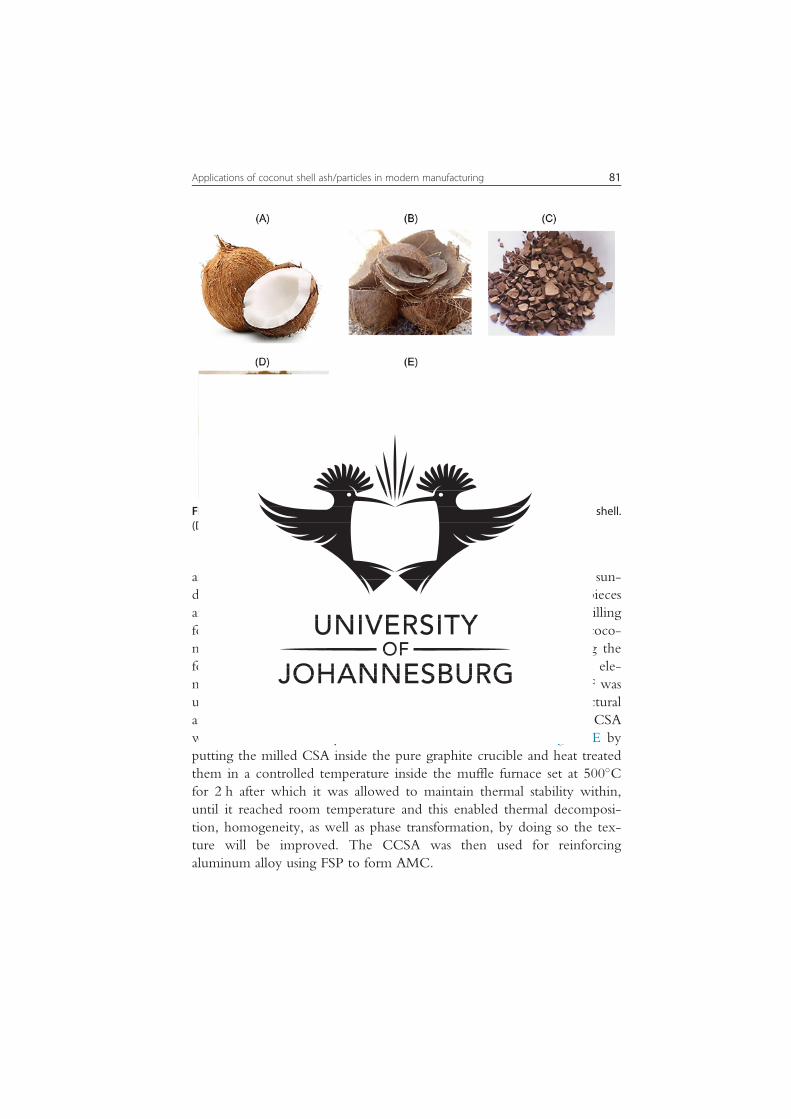
an oven pre-set at 50C for 120 h for total dryness after which it was sun-dried for 7 days. The dried coconut shells were later crushed into piecesand pulverized into powder (see Fig. 4.2D) using mechanical disc-millingfor 60 min and sieved with 75 μm ASTM meshes standard and this coco-nut shell powder, the pulverized CSA was then characterized using thefollowing SEM incorporated with the EDX for morphological and ele-mental analysis and their results are depicted in Fig. 4.3, while XRF wasused for chemical composition analysis, and XRD was used for structuraland crystalline phases present in CSA. The pulverized and milled CSAwas later heat treated by carbonization method as seen in Fig. 4.2E byputting the milled CSA inside the pure graphite crucible and heat treatedthem in a controlled temperature inside the muffle furnace set at 500Cfor 2 h after which it was allowed to maintain thermal stability within,until it reached room temperature and this enabled thermal decomposi-tion, homogeneity, as well as phase transformation, by doing so the tex-ture will be improved. The CCSA was then used for reinforcingaluminum alloy using FSP to form AMC.
Figure 4.2 (A) Coconut fruits. (B) Coconut shell. (C) Smaller piece of coconut shell.(D) Pulverized CS. (E) Carbonized CSA.
81Applications of coconut shell ash/particles in modern manufacturing

4.5.2 Methodology of friction stir processingIn this present research, 6 mm thickness of base metal—aluminum alloy,Al7075-T651 rolled plates were purchased for the research with dimen-sions 3003 1253 6 mm3. The following mechanical properties forAl7075-T651 were received via spark spectrometric analysis, 0.32 ofPoison’s ratio, 150 HV if Brinell hardness, 570 MPa for ultimate tensilestrength, 330 MPa for shear strength, 500 MPa for yield strength, 26 GPafor shear modulus, as well as 160 MPa for fatigue strength. FSP was thencarried out on Al7075 using 2 tons NC friction stir machine produced byETA Bangalore, India Ltd. (see Fig. 4.4A). A groove was made on theplate of Al7075 in order to put the CCSA inside it. This groove wasmade in a dimension 280 mm length by 3.5 mm depth by 2.0 mm width.Design of the tool was then carried out to process, stir, and mix the rein-forcement with the substrate. AISI H13 steel tool was designed in such away that the shoulder diameter was 18 mm, the pin length was 5 mm,and the pin diameter was 5 mm. In this study, double passes were carriedwith 100% inter-pass overlap and the processing parameters that wereapplied are 0.3 mm plunge depth, 1500 revolution per minutes, 20 mm/min, and the tilt angle was of degree three. The experimental set-up dur-ing the FSP is shown in Fig. 4.4B.
Figure 4.3 (A) SEM image of CSA. (B) Elemental composition of CSA.
82 Omolayo M. Ikumapayi et al.

4.6 Characterization of the friction stir processedAl7075/CCSA
The fabricated Al7075/CCSA, FSPed Al7075 as well as Al7075(parent metal) was characterized using mechanical testing, surface rough-ness analysis as well as structural evaluation. The proceeding sections high-light how the tests were carried out.
4.6.1 Structural integrity of Al7075/CCSAPHILIPS X’Pert machine was used to carry out structural analysis usingXRD, the machine was operated at PW: 3040/60, 50 Hz, 240 V as well as8.5 KVA. The test was conducted on the parent material as well as fabri-cated samples to examine mineralogical contents as well as crystalline struc-ture of the samples. The computed values are dislocation density,microstrain, grain size, etc., and this was achieved using Scherrer techniques.The machine specification used in this study is depicted in Table 4.5.
4.6.2 Mechanical properties: tensile analysisXforce P-type Zwick/Roell Z250 Tensile tester was used to carry outtensile analysis in accordance with ASTM B557M-10 standard [26]. Thesample used for this study was 100 mm in length and 6 mm in thickness.The test was conducted on each sample three times to maintain consis-tency, reproducibility, and accuracy. The fractured surface from each sam-ple was examined using fractography technique under SEM. The tensile
Figure 4.4 (A) NC-controlled FSW machine used. (B) Processing set-up.
83Applications of coconut shell ash/particles in modern manufacturing
test was carried out at room temperature. The illustration on the section-ing of the samples is represented in Fig. 4.5.
4.6.3 Surface integrity evaluationSurface integrity of the fabricated samples were tested using surface roughnessanalysis tester (Mitutoyo surf test SJ-210). The test was conducted on FSPedAl7075/CCSA, as well as FSPed Al7075. In order to ascertain the surface fin-ish of the produced samples and textural characteristics is maintained, this testwas measured out at three points on a fabricated sample and this was done toensure surface area coverage while the mean value was taken and recorded.Photograph of the Mitutoyo surf test SJ-210 and the reading on the fabri-cated sample are represented in Fig. 4.6A and B, respectively.
Figure 4.5 (A) Illustration of tensile sample sectioning from processed zone. (B) Cuttensile sample.
Table 4.5 XRD experimental specification.Property Specification
Scan range (2θ) Between 5 and 90 degreesExcitation voltage 40 kVK 0.94Current 30 mAk~ radiation λ5 1.39225 ÅExcitation voltage 40 kVKα radiation λ5 1.5406 ÅScanning rate 1.0/min (2θ/seg)
84 Omolayo M. Ikumapayi et al.
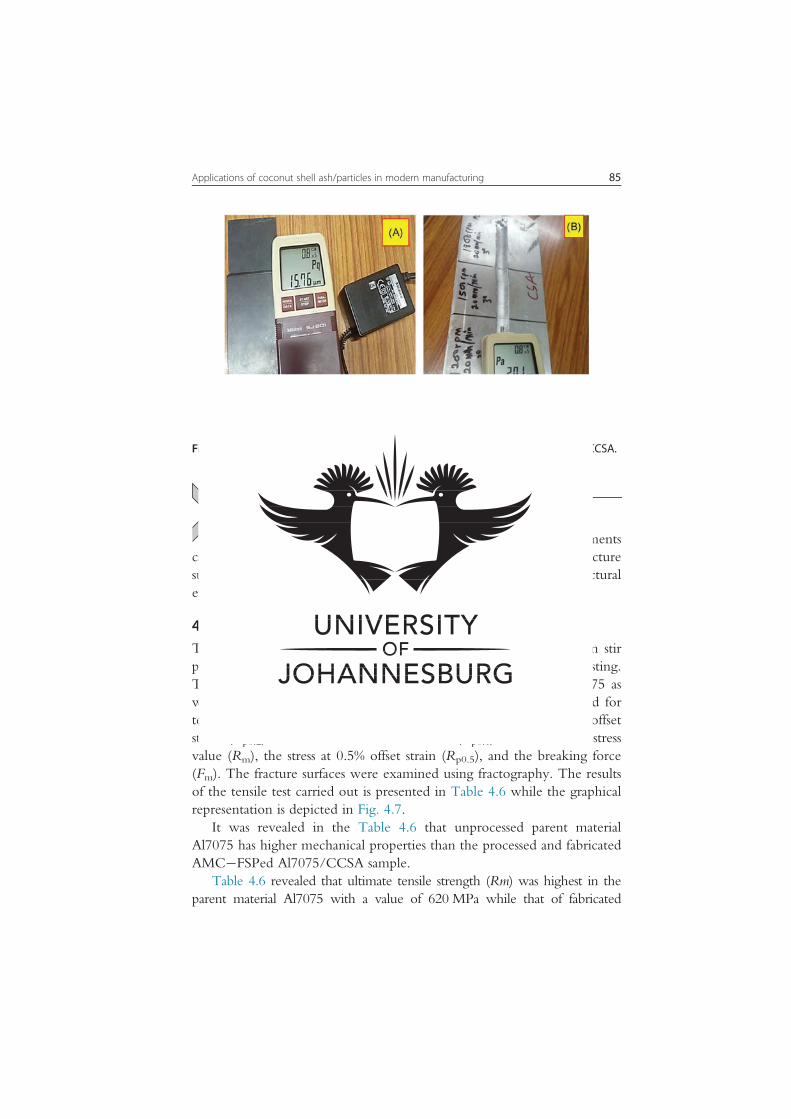
4.7 Results and discussion
This section explains the results and discusions of the experimentscarried out, which are tensile properties result, morphology of the fracturesurfaces, surface integrity of the produced composites as well as structuralevaluation of the fabricated samples.
4.7.1 Mechanical properties: tensile behaviorThe performance evaluation of the CCSA on the fabricated friction stirprocessed high strength aluminum alloy Al7075 by using tensile testing.The parent material Al7075, processed parent material FSPed Al7075 aswell as fabricated matrix composite FSPed Al7075/CCSA was tested fortensile strength. The following properties studied the stress at 0.2% offsetstrain (Rp0.2), the stress at 0.1% offset strain (Rp0.1), the maximum stressvalue (Rm), the stress at 0.5% offset strain (Rp0.5), and the breaking force(Fm). The fracture surfaces were examined using fractography. The resultsof the tensile test carried out is presented in Table 4.6 while the graphicalrepresentation is depicted in Fig. 4.7.It was revealed in the Table 4.6 that unprocessed parent material
Al7075 has higher mechanical properties than the processed and fabricatedAMCFSPed Al7075/CCSA sample.Table 4.6 revealed that ultimate tensile strength (Rm) was highest in the
parent material Al7075 with a value of 620 MPa while that of fabricated
Figure 4.6 (A) Surface roughness tester; (B) reading on the frabricated Al7075/CCSA.
85Applications of coconut shell ash/particles in modern manufacturing

Table4.6
Tensile
test
results
ofthesamples.
Com
posites
R mR p
0.1
F mR p
0.2
R t0.5
At(corr.)
R p0.5
MPa
MPa
KN
MPa
MPa
%MPa
Al7075
620.9030
559.0751
22.35251
572.9528
7.334991
9.732209
588.4694
FSPedAl7075/CCSA
379.6816
241.3738
13.66854
254.1496
8.963831
11.80671
277.5694
FSPedAl7075
362.9048
213.24
13.06457
228.2679
7.607991
14.30768
251.8613

matrix composite was 379 MPa and the unreinforced but processed parentmaterial was 362 MPa. The breaking force (Fm) for the parent materialAl7075 was 22.35 kN while FSPed Al7075/CCSA was 13.66 kN and that ofFSPed Al7075 was 13.06 kN. The tensile strength at 0.1% offset strain (Rp0.1)for the parent material Al7075 was 559 MPa, the Rp0.1 for the fabricatedAMCFSPed Al7075/CCSA was noted to be 241 MPa while the unrein-forced but processed parent material FSPed was recorded as 213 MPa.Fig. 4.7 revealed the comparison of the stresses for all the samples underinvestigation. The fracture surface of the tensile sample is shown in Fig. 4.8.It was established that the fractography of the AMC are impressed by
the size of the reinforcement particles if it is in nano, micro, or macrotypes; the types of reinforcement whether metallic powder, ceramic, oragrowastes powders, the substrate material whether metallic, ceramic, orpolymer material, how large the reinforcement in the matrix compositesand also interfacial bonding strength, surface roughness, porosity content,and precipitation effect [27]. Failure in AMC can be attributed to eitherinterfacial decohesion, matrix failure, or reinforcement failure [28].Fig. 4.8A represents the fractography of the parent material Al7075
which revealed stretched grain and elongated dimples and this dictates duc-tility in Al7075. Fig. 4.8B represents friction stir processed of the parentmaterial, FSPed Al7075, and this revealed large dimples with bimodal distri-bution. At the same time Fig. 4.8C also revealed equiaxed dimples which
Figure 4.7 The stress bar chart representing stress at 0.1%, 0.2%, and 0.5% offsetstrain.
87Applications of coconut shell ash/particles in modern manufacturing

Figure4.8
SEM
fractograp
hyof
(A)Al707
5,(B)FSPe
dAl707
5,an
d(C)FSPe
dAl707
5/CCSA
.

dictates cup and cone shape. This type of fracture can be attributed to sud-den loading of the AMC with low ductility, hence rock candy failure.
4.7.2 Evaluation of surface integrity for the processedsamplesThe integrity of the fabricated surface is very important in FSP or othermanufacturing industries where surface finish is a primary concern.Surface roughness measurement is very vital in the final product of thefabricated samples and this will dictate the accuracy and high quality ofthe product, by doing so, it will boost the marketability at the same timeis cost-effective [29,30]. Table 4.7 shows the results of surface roughnessin which the reading was obtained at three points on the processed sam-ples. The average values of the measurement were then computed andrecorded. It was revealed that when the CCSA was added to the alumi-num alloy during the FSP, it was noted that the surface integrity wasgreatly improved as shown in Table 4.7. The ranges of average surfaceroughness value, Ra was 2.933.01 μm with a mean value of 2.98 μmand this is far lower than when no particle was used as reinforcementwhich gave a range between 11.24 and 12.05 μm with a mean value of11.61 μm. From this analysis, the addition of CCSA improved the surfaceof the fabricated FSPed Al7075/CCSA excellently.
4.7.3 Structural evaluation analysis: X-ray diffraction resultsTable 4.8 revealed the results of XRD measurement for crystallite size whichwas obtained from the acquired data via Wilson and Scherrer equations asdepicted in Eq. (4.1). The d spacing was obtained from the machine data atthe highest peak and was supported by Bragg’s equation in Eq. (4.2), the fullwidth at half maximum (FWHM) was computed, the microstrain (ε) was
Table 4.7 Surface roughness analysis measurement.Rotationalspeed (rpm)
Processingspeed (mm/min)
Samples Surface roughness,Ra (μm)
MeanRa(μm)
Er6 5(%)
Ra1 Ra2 Ra3 Ra Ra
1500 20 FSPedAl7075
12.05 11.24 11.53 11.61 0.5805
FSPedAl7075/CCSA
3.00 3.01 2.93 2.98 0.149
89Applications of coconut shell ash/particles in modern manufacturing

Table4.8
XRDmeasuremen
tda
ta.
Samples
Microstrain(ε)3
1022
FWHM,~
()
Crystallitesize,C
(nm)
Crustal
plane
dspacing
(Å)
2θ ()
Dislocation
density(δ)(Lines/
m2)3
1014
FSPedAl7075
5.0381
0.213
41.2
111
2.364
38.15.8912
FSPedAl7075/
CCSA
4.1142
0.174
38.6
111,211
2.369
37.96.7115
Al7075
4.2535
0.180
48.7
111
2.364
38.14.2164

computed based on Williamson hall formula using Eq. (4.3), and also disloca-tion density (δ) which was computed with Eq. (4.4) [31,32].
C5kƛ
βcosθ(4.1)
d5nƛ2sinθ
(4.2)
ε5βcosθ4
(4.3)
δ51C2
(4.4)
where, θ is the Bragg’s angle; ƛ is the wavelength, n is the 1, andβis the FWHM:Diffraction pattern, phases, and crystal structure were being analyzed
by XRD in this study. Fig. 4.9 represents XRD structural pattern withvarying crystal phases embedded. Three samples were tested which areparent material Al7075 with peaks of color pink, processed parent materialFSPed Al7075 with peak of color red, and the fabricated AMC underinvestigation FSPed Al7075/CCSA with peaks of color blue, the highestpeak (111) located at the position of in 2θ values. It was established fromthe results of XRD analysis that all the tested samples have common peakswhich are (111), (200), (220), (311), and (222) and in addition to thesepeaks, the fabricated Al7075/CCSA have the following peaks to its own(100), (110), and (212). Meanwhile the intensity of the parent materialAL7075 was 2500 cps, the processed parent material intensity wasrecorded to be 3500 cps while the fabricated AMC has its intensity at6000 cps making it have the highest intensity which dictates the influenceof CCSA on the aluminum metal matrix composites. It was revealed fromTable 4.8 that the CCSA has excellent influence on the structural compo-nent of fabricated aluminum alloy matrix composite in a way that thecrystalline size was recorded smallest 38.6 nm as against the processed par-ent material FSPed Al7075 with 41.2 nm while the unprocessed parentmaterial Al7075 had 48.7 nm. The dislocation density (δ) for the fabri-cated AMCFSPed Al7075 had the highest value with 6.71153 1014(Lines/m2) while the processed but unreinforced parent material has5.89123 1014 (Lines/m2) whereas the parent material had the least valueof 4.21643 1014 (Lines/m2) indicating that the reinforcement played akey role in the density of the material.
91Applications of coconut shell ash/particles in modern manufacturing

Figure 4.9 XRD structural pattern for the tested samples.
92 Omolayo M. Ikumapayi et al.

4.8 Conclusion
From the above literatures reviewed, experimental study, resultsobtained, and the discusions, it has been established that coconut shell par-ticles finds applications in the metal, polymer, and ceramic matrix compo-sites; in the concrete reinforcement, aggregate, and as filler; in theactivated carbon or as charcoal; in the energy and fuel generation; in thewater purification and heavy metals removal. Variability in the elementaland chemical compositions, chemical contents of coconut shell particleswere documented, as well as mechanical and physical properties of coco-nut shell.It was further established from the experimental analysis carried out
that CCSA is suitable for the fabrication of AMC via FSP. In this study, itwas revealed that the ranges of average surface roughness value, Ra was 2.933.01 μm with a mean value of 2.98 μm and this is far lower thanwhen no particle was used as reinforcement which gave a range between11.24 and 12.05 μm with a mean value of 11.61 μm. From this analysis,the addition of CCSA improved the surface of the fabricated FSPedAl7075/CCSA excellently. It was noted that parent material Al7075 has2500 cps intensity, the fabricated FSPed Al7075 has 3500 cps intensitywhile the fabricated aluminum metal matrix compositeAl7075/CCSAhad 6000 cps intensity. It was further noted that CCSA perform excellentstructurally when crystallite size for FSPed Al7075/CCSA had 38.6 nmand the processed parent materialFSPed Al7075 with 41.2 nm while theunprocessed parent material Al7075 had 48.7 nm.
Conflict of interest
The authors declared that there is no known conflict of interests.
References[1] Ikumapayi OM, Akinlabi ET. Data showing the effects of vibratory disc milling time
on the microstructural characteristics of coconut shell nanoparticles (CS-NPs). Data Br2019;22:53745. Available from: https://doi.org/10.1016/j.dib.2018.12.067.
[2] Leman AS, Shahidan S, Senin MS, Hannan NIRR. A preliminary study on chemicaland physical properties of coconut shell powder as a filler in concrete. IOP Conf Ser
93Applications of coconut shell ash/particles in modern manufacturing

Mater Sci Eng 2016;160:012059. Available from: https://doi.org/10.1088/1757-899X/160/1/012059.
[3] Kanojia A, Jain SK. Performance of coconut shell as coarse aggregate in concrete.Constr Build Mater 2017;140:1506. Available from: https://doi.org/10.1016/j.conbuildmat.2017.02.066.
[4] Oyedepo OJ, Olanitori LM, Akande S. Performance of coconut shell ash and palmkernel shell ash as partial replacement for cement in concrete. J Build Eng2015;2:1824.
[5] Nadir Y, Sujatha A. Durability properties of coconut shell aggregate concrete. KSCEJ Civ Eng 2018;22:19206. Available from: https://doi.org/10.1007/s12205-017-0063-6.
[6] Bello SA, Hassan SB, Agunsoye JO, Kana MGZ, Raheem IA. Tribology in industrysynthesis of uncarbonised coconut shell nanoparticles: characterisation and particlesize determination. Tribol Ind 2015;37:25763.
[7] Salleh Z, Islam MM, Yusop MYM, Idrus MAMM. Mechanical properties of acti-vated carbon (AC) coconut shell reinforced polypropylene composites encapsulatedwith epoxy resin. APCBEE Procedia 2014;9:926. Available from: https://doi.org/10.1016/j.apcbee.2014.01.017.
[8] Oluwole OI, Oluwaseun KL. Mechanical, abrasion and water absorption characteris-tics of coconut shell ash and charcoal based polyester composites. West Indian J Eng2016;16:5167.
[9] Caccin M, Giacobbo F, Da Ros M, Besozzi L, Mariani M. Adsorption of uranium,cesium and strontium onto coconut shell activated carbon. J Radioanal Nucl Chem2013;297:918. Available from: https://doi.org/10.1007/s10967-012-2305-x.
[10] Son S-J, Choi J-S, Choo K-Y, Song S-D, Vijayalakshmi S, Kim T-H. Developmentof carbon dioxide adsorbents using carbon materials prepared from coconut shell.Korean J Chem Eng 2005;22:2917. Available from: https://doi.org/10.1007/BF02701500.
[11] Song C, Wu S, Cheng M, Tao P, Shao M, Gao G. Adsorption studies of coconutshell carbons prepared by KOH activation for removal of lead(ii) from aqueous solu-tions. Sustain 2014;6:8698. Available from: https://doi.org/10.3390/su6010086.
[12] Said M, Machunda RL. Defluoridation of water supplies using coconut shells acti-vated carbon: batch studies. Int J Sci Res 2014;3:232731.
[13] Joseph CG, Anisuzzaman SM, Abang S, Musta B, Quek KS, Wong XL. Adsorptionperformance and evaluation of activated carbon from coconut shell for the removalof chlorinated phenols in aqueous medium. Medziagotyra 2017;23:38998.Available from: https://doi.org/10.5755/j01.ms.23.4.16221.
[14] Raju SS, Rao GS. Assessments of desirability wear behaviour on al- coconut shell ash- metal matrix composite using grey - fuzzy reasoning grade. Indian J Sci Technol2017;10:111. Available from: https://doi.org/10.17485/ijst/2017/v10i15/113826.
[15] Aku SY, Yawas DS, Apasi A. Evaluation of cast Al-Si-Fe alloy/coconut shell ash par-ticulate composites. Gazi Univ J Sci 2013;26:44957.
[16] Siva Sankara Raju R, Panigrahi MK, Ganguly RI, Srinivasa Rao G. Investigation oftribological behavior of a novel hybrid composite prepared with Al-coconut shell ashmixed with graphite. Metall Mater Trans A Phys Metall Mater Sci2017;48:3892903. Available from: https://doi.org/10.1007/s11661-017-4139-1.
[17] Bello SA, Agunsoye JO, Adebisi JA, Anyanwu JE, Bamigbaiye AA, Hassan SB.Potential of carbonised coconut shell as a ball-milling interface for synthesis of alu-minium (1xxx) nanoparticles. Ann Fac Eng 2017;15:14957.
[18] Sareena C, Ramesan MT, Purushothaman E. Utilization of coconut shell powder asa novel filler in natural rubber. J Reinf Plast Compos 2012;31:53347. Availablefrom: https://doi.org/10.1177/0731684412439116.
94 Omolayo M. Ikumapayi et al.

[19] Agunsosoye JO, Isaac TS, Samuel SO. Study of mechanical behaviour of coconutshell reinforced polymer matrix composite. J Min Mater Charact Eng2012;2012:7749. Available from: https://doi.org/10.4236/jmmce.2012.118066.
[20] De Oliveira PF, Marques MDF V. Comparison between coconut and curaua fiberschemically treated for compatibility with PP matrixes. J Reinf Plast Compos2014;33:4309. Available from: https://doi.org/10.1177/0731684413516392.
[21] Balan AK, Mottakkunnu Parambil S, Vakyath S, Thulissery Velayudhan J,Naduparambath S, Etathil P. Coconut shell powder reinforced thermoplastic poly-urethane/natural rubber blend-composites: effect of silane coupling agents on themechanical and thermal properties of the composites. J Mater Sci 2017;52:671225.Available from: https://doi.org/10.1007/s10853-017-0907-y.
[22] Sarki J, Hassan SB, Aigbodion VS, Oghenevweta JE. Potential of using coconut shellparticle fillers in eco-composite materials. J Alloy Compd 2011;509:23815.Available from: https://doi.org/10.1016/j.jallcom.2010.11.025.
[23] Arena N, Lee J, Clift R. Life cycle assessment of activated carbon production fromcoconut shells. J Clean Prod 2016;125:6877. Available from: https://doi.org/10.1016/j.jclepro.2016.03.073.
[24] Endut A, Abdullah SHYS, Hanapi NHM, Hamid SHA, Lananan F, KamarudinMKA, et al. Optimization of biodiesel production by solid acid catalyst derived fromcoconut shell via response surface methodology. Int Biodeterior Biodegrad2017;124:2507. Available from: https://doi.org/10.1016/j.ibiod.2017.06.008.
[25] Gunasekaran K, Annadurai R, Kumar PS. A study on some durability properties ofcoconut shell aggregate concrete. Mater Struct Constr 2015;48:125364. Availablefrom: https://doi.org/10.1617/s11527-013-0230-2.
[26] Ikumapayi OM, Akinlabi Esther T, Majumdar JD. Influence of carbonaceous agro-wastes nanoparticles on physical and mechanical properties of friction stir processedAA7075-T651 metal matrix composites. Surf Topogr Metrol Prop 2019;7:117.Available from: https://doi.org/10.1088/2051-672X/ab3aae.
[27] Li H, Chen P, Wang Z, Zhu F, Song R, Zheng Z. A tensile properties, microstruc-tures and fracture behaviors of an Al-Zn-Mg-Cu alloy during ageing after solutiontreating and cold-rolling. Mater Sci Eng A 2019;742:798812. Available from:https://doi.org/10.1016/j.msea.2018.03.098.
[28] Hao Z, Fu X, Men X, Zhou B. Study on tensile and fracture properties of 7050-T7451 aluminum alloy based on material forming texture characteristics. Mater ResExpress 2019;6. Available from: https://doi.org/10.1088/2053-1591/aaf304.
[29] Hartmann M, Böhm S, Schüddekopf S. Influence of surface roughness of tools onthe friction stir welding process. J Weld Join 2014;32(6):12. Available from: https://doi.org/10.5781/JWJ.2014.32.6.22.
[30] Ikumapayi OM, Akinlabi ET. Efficacy of α-grade Titanium alloy powder (Ti-6Al-2Sn-2Zr-2Mo-2Cr-0. 25Si) in surface modification and corrosion mitigation in 3.5%NaCl on friction stir processed armour grade 7075-T651 Aluminum alloysinsightin defence applications. Mater Res 2019;120. Available from: https://doi.org/10.1088/2053-1591/ab1566.
[31] Pandey V, Singh JK, Chattopadhyay K, Srinivas NCS, Singh V. Influence of ultra-sonic shot peening on corrosion behavior of 7075 aluminum alloy. J Alloy Compd2017;723:82640. Available from: https://doi.org/10.1016/j.jallcom.2017.06.310.
[32] Offor PO, Okorie BA, Ezema FI, Aigbodion VS, Daniel-mkpume CC. Synthesisand characterization of nanocrystalline zinc sulphide thin films by chemical spraypyrolysis. J Alloy Compd 2015;650:3815. Available from: https://doi.org/10.1016/j.jallcom.2015.07.169.
95Applications of coconut shell ash/particles in modern manufacturing

74
5 CHAPTER 5: CONCLUSIONS AND RECOMMENDATIONS
5.1 CONCLUSIONS
The research work reported in this thesis focused on the surface modification and the enhancement
of the physical, mechanical, structural, tribological and electrochemical properties of aluminium
alloy 7075-T651 via the friction stir processing method, together with the integration of the second
phase (reinforcement particles). Two different categories of reinforcement powders are used in
this study: the micro-metallic powders and the nano-particles developed from agrowaste powders
in a matrix, and also in a hybrid-composite form. The metallic powders are two inorganic powders
(Titanium Powder (Ti-6Al-2Sn-2Zr-2Mo-2Cr-0.25Si) and Stainless Steel (17-4Ph); and five
organic carbonaceous powders, which are Palm Kernel Shell Ash (PKSA), Coconut Shell Ash
(CSA), Cow Bone Ash (CBA), Wood Fly Ash (WFA) and Coal Fly Ash (CFA).
The following conclusions may be drawn from the experimental reports, results and discussions
documented in the form of publications in the Journals and Conferences developed from the
research work:
1. That reinforcement agrowaste powders were developed from biomaterials into powders
(micro-particles and nano-particles), such as coconut-shell ash (CSA), palm-kernel shell
ash (PKSA), cow-bone ash (CBA), wood-fly ash (WFA) and coal-fly ash (CFA). They
were characterized before being used on FSP to ascertain their chemical compositions
through XRF, elemental compositions through EDX, grain sizes and crystal phases present
via XRD, as well as the morphology of each powder, through SEM, were studied. Each
powder is exhibited some unique properties that make them suitable for reinforcement. The
evolving properties from each agrowaste powder were presented in the published articles
attached.

75
2. The agrowaste powders developed were then calcined/carbonized at about 500 °C for two
(2) hours. After the 2 hours, the furnace was switched off; and the carbonaceous powder
was allowed to cool to room temperature inside the muffle furnace. The process was carried
out in a controlled temperature and in a controlled environment, i.e. the thermal-treatment
process of material in the absence of, or in a limited supply of air, in order to induce thermal
stability, phase transition, thermal decomposition, as well as the removal of the volatile
fraction from the material before using. This was done to improve the strength, the texture,
the thermal stability etc. Further grinding was performed on each powder to ensure the
smoothness of the carbonaceous powder before use.
3. A surface-roughness analysis was conducted on each of the fabricated samples; and the
following parameters were measured, and computed: mean roughness depth (Rz),
arithmetical mean roughness value (Ra), root mean square roughness (Rq), and the
maximum height (Ry). The performance evaluation for the arithmetical mean roughness
value (Ra) was established, which is one of the most valuable parameters. The processed
parent metal (PPM) without any reinforcement, has an Ra value that falls within 11.05 to
11.61 µm; and this has a close range with the values, when reinforced with stainless steel
(11-67 – 12.81 µm). These are the roughest surfaces of the fabricated composites. It was
noted that Ra for WFA fall within 1.60 – 2.40 µm and this proved to be the smoothest
fabricated surface, as measured by SRT. The CFA has Ra values that lie within 2.00 – 2.81
µm; CSA has Ra values within 2.47 – 2.98 µm; and the PKSA has Ra values within 4.43
– 5.32 µm; and this also proved to be the roughness among agrowaste powders. That of
titanium powder reinforcement has close values with some of the agrowastes powders; and
this lies within the range of 2.67 – 3.05 µm.
76
4. The tensile-strength properties were studied; and the following parameters were measured,
recorded and computed: The Young Modulus (ME), the tensile strength; the stress at 0.2 %
offset strain (Rp0.2); the fracture or breaking force; the stress at 0.1 % offset strain (Rp0.1),
the percentage elongation, the stress-strain curve, the ultimate tensile strength, and the
stress at 0.2 % offset strain (Rp0.2). It was noted that unprocessed parent material has a very
close value to those reinforced with metallic powder. The UTS for the unprocessed parent
metal was found to be 620 MPa; while that reinforced with Titanium powder was 624 MPa;
and that of stainless-steel powder was found to be 622 MPa; while the tensile strength was
found to be 588, 585 and 613 MPa, respectively. These values are far higher than those
that were found when the agrowaste powders were used. It was established that the UTS
for processed parent metal was 362 MPa; while that of PKSA was 327 MPa, CSA was 379
MPa, CBA was 390 MPa and that of WFA and CFA had the same values of 367 MPa; and
their corresponding tensile values were 251 MPa for the processed parent metal, 266 MPa
for PKSA, 277 MPa for CSA, 257 MPa for CBA, 260 MPa for WFA and 277 MPa for
CFA.
5. In general, reinforcing with metallic powders (Titanium and stainless-steel powders)
significantly improved the tensile strength; while the agrowaste powders made no
significant improvement to the metal matrix composites.
6. It was also noted that most of the fractography from the fractured surfaces of the aluminium
metal matrix and the hybrid composites fabricated were dominated by a large dimple-
induced transgranular structure, due to the different agrowaste reinforcements applied,
which dictated the interfacial bonding within the molecules of the fabricated compounds.
The appearance of these enormous dimples surfacing on the morphology of the fractured

77
surfaces of aluminium matrix composites (AMC) reinforced with agrowaste enhanced the
remarkable interfacial bonding within the matrix and the second phase, thereby improving
the tensile strength, the hardness and the crystallite sizes of the fabricated AMC. Whereas
those reinforced with metallic powders (titanium-alloy powder and stainless-steel
powders) were dominated by a fine network; and the equiaxed dimples, with cup and cone
attributes, confirmed the superb interfacial bonding; and also, that the failure mode was
ductile.
7. It was established that the corrosion properties, such as the inhibition percentage, the
performance efficiency, the corrosion rate, the polarization resistance, the open-circuit
potential and other parameters were significantly improved with the use of metallic-powder
reinforcement, especially with the alpha-beta titanium alloy powder (Ti-6Al-2Sn-2Zr-
2Mo-2Cr-0.25Si) rather than stainless-steel powder (17-4PH). Also, the agrowaste
reinforcements on the metal matrix composites (MMC) made a remarkable impact too on
the corrosion susceptibility. With the use of both metallic and agrowaste powder
reinforcements, the corrosion-parametric values were greatly influenced and improved.
8. It was revealed that the tribological properties, when using both metallic and agro
waste reinforcement particles were tremendously enhanced as regards the processed and
the unprocessed parent metal. The following wear parameters were evaluated: wear rate,
wear resistance, wear volume (volume loss), wear depth, frictional force, and the
coefficient of friction (COF). The wear quality was done under the influence of dry sliding,
with varying loads of 20 N and 50 N. It was revealed that the reinforcement particles
significantly reduced the wear rate COF, as well as the wear volume, while the wear
resistance was said to be high. The results showed that the higher load of 50 N was found

78
to perform better under the same experimental conditions, when compared with the 20 N
of the applied load. Less wear debris was noticed, when the 50 N applied force was used
Furthermore, the wear parameters, such as the wear rate, the volume loss and the COF were
tremendously reduced with the applied load of 50 N, compared with the 20 N under the
same fabricated conditions.

79
5.2 RECOMMENDATIONS AND FUTURE WORK
It is important to emphasise that this research work focused on the enhancement of the mechanical,
electrochemical, metallographic, tribological, as well as the structural properties of the fabricated
aluminium-metal matrix and the hybrid composites of the aerospace-grade. However, some
properties were not captured in this present research, because they are outside the scope of this
work. These properties are, therefore, recommended for further research studies. Some
recommendations for future work and for further research studies are highlighted below:
1. Further studies on the effects of processing tools pin profile and the shoulder profile, as
well as the micro-channel (grooves) profile for reinforcement, should be investigated.
2. The influence of cooling/heating (in-situ and ex-situ) during the stirring processes should
be investigated by using a thermocouple, an infrared thermometer, and other advanced
measuring instruments.
3. The effects of a multi-pass should be also be incorporated and studied extensively.
4. Modelling of the heat generated during the friction stir processing should be investigated,
using both mathematical and numerical simulation, in order to understand the influence of
temperature distributions and heat flow on the particles, as well as the internal stresses
distributed and the deformation processes.
5. Some of the mechanical properties, could also be studied, such as creep behaviour, impact,
as well as the superplastic behaviour of the fabricated matrix composites.
6. Some of the metallographic characterizations not captured in this study could be further
studied, for example, by using the Fourier Transformed Infrared Spectroscopy (FTIR),

80
RAMAN Spectroscopy, the Atomic-Force Microscope (AFM), Transmission-electron
microscopy (TEM), and Electron-Backscatter Diffraction Analysis (EBSD).
7. The optimization of the process-parameters by using a design of the experiment (DOE) for
residual stresses; and the static-mechanical behaviour should be incorporated in further
studies, in order to verify and validate the experimental results.
8. Post heat treatment can be conducted on the processed samples and can be compared to
untreated samples to test for the integrity of performance efficiency.

81
REFERENCES
[1] Huang G, Hou W, Shen Y. Evaluation of the microstructure and mechanical properties of
WC particle reinforced aluminum matrix composites fabricated by friction stir processing.
Mater Charact 2018;138:26–37. doi:10.1016/j.matchar.2018.01.053.
[2] Ikumapayi, OM; Akinlabi, ET; Majumdar, JD; Akinlabi S. Characterization of High
Strength Aluminium – Based Surface Matrix Composite reinforced with Low-cost PKSA
Fabricated by Friction Stir Processing. Mater Res Express 2019;6:1–27.
doi:https://doi.org/10.1088/2053-1591/ab395b.
[3] Vijaya Kumar P, Madhusudhan Reddy G, Srinivasa Rao K. Microstructure and pitting
corrosion of armor grade AA7075 aluminum alloy friction stir weld nugget zone – Effect
of post weld heat treatment and addition of boron carbide. Def Technol 2015;11:166–73.
doi:10.1016/j.dt.2015.01.002.
[4] Navaneethakrishnan T, Ganesh P. Effect of welding parameters on friction stir welded
dissimilar aluminum alloys 7075 and 6082 with various tool pin profiles. J Chem Pharm Sci
2015;2015-April:463–8.
[5] Ikumapayi OM, Akinlabi ET. Efficacy of α-β Grade titanium alloy powder (Ti-6Al-2Sn-
2Zr-2Mo-2Cr-0.25Si) in surface modification and corrosion mitigation in 3.5% NaCl on
friction stir processed armour grade 7075-T651 aluminum alloys - Insight in defence
applications. Mater Res Express 2019;6:3–8. doi:10.1088/2053-1591/ab1566.
[6] Rambabu P, Prasad NE, Kutumbarao V V. Aerospace Materials and Material Technologies
2017. doi:10.1007/978-981-10-2143-5.

82
[7] Ikumapayi OM, Akinlabi ET. Experimental Data on Surface Roughness and Force
Feedback Analysis in Friction Stir Processed AA7075 – T651 Aluminium Metal
Composites. Data Br 2019:https://doi.org/10.1016/j.dib.2019.103710. This.
doi:10.1016/j.dib.2019.103710.
[8] Garcia C, Azpilgain Z, Aginagalde A, Esnaola JA, Galdos L, Torca I. Tensile Behaviour of
6082 Aluminium Alloy Sheet under Different Conditions of Heat Treatment, Temperature
and Strain Rate. Key Eng Mater 2009;423:105–12.
doi:10.4028/www.scientific.net/kem.423.105.
[9] Vasco M, Tserpes K, Pantelakis S. Numerical Simulation of Tensile Behavior of Corroded
Aluminum Alloy 2024 T3 Considering the Hydrogen Embrittlement. Metals (Basel)
2018;8:56. doi:10.3390/met8010056.
[10] Sudhakar I, Madhusudhan Reddy G, Srinivasa Rao K. Ballistic behavior of boron carbide
reinforced AA7075 aluminium alloy using friction stir processing – An experimental study
and analytical approach. Def Technol 2016;12:25–31. doi:10.1016/j.dt.2015.04.005.
[11] Ikumapayi, OM, Akinlabi, Esther T and Majumdar JD. Influence of Carbonaceous
Agrowastes Nanoparticles on Physical and Mechanical Properties of Friction Stir Processed
AA7075-T651 Metal Matrix Composites. Surf Topogr Metrol Prop 2019;7:1–17.
doi:10.1088/2051-672X/ab3aae.
[12] Limited WP. Fibre–polymer composites for aerospace structures and engines. 2012.
doi:10.1533/9780857095152.338.
[13] Mistry JM, Gohil PP. An overview of diversified reinforcement on aluminum metal matrix
composites: Tribological aspects. Proc Inst Mech Eng Part J J Eng Tribol 2017;231:399–

83
421. doi:10.1177/1350650116658572.
[14] Sudhakar I, Madhu V, Madhusudhan Reddy G, Srinivasa Rao K. Enhancement of wear and
ballistic resistance of armour grade AA7075 aluminium alloy using friction stir processing.
Def Technol 2015;11:10–7. doi:10.1016/j.dt.2014.08.003.
[15] Mishra RS, Ma ZY. Friction stir welding and processing. Mater Sci Eng R Reports
2005;50:1–78. doi:10.1016/j.mser.2005.07.001.
[16] Mishra RS, De PS, Kumar N. Friction Stir Welding and Processing. 2014. doi:10.1007/978-
3-319-07043-8.
[17] Gerlich AP. Critical Assessment 25 : Friction stir processing , potential and problems
Critical Assessment. Mater Sci Technol 2017;33:1139–44.
doi:10.1080/02670836.2017.1300420.
[18] Sanusi KO, Akinlabi ET. Friction stir processing of a composite aluminium alloy (AA 1050)
reinforced with titanium carbide powder. Mater Tehnol 2017;51:427–35.
doi:10.17222/mit.2016.021.
[19] Fatchurrohman N, Farhana N, Marini CD. Investigation on the effect of Friction Stir
Processing Parameters on Micro structure and Micro hardness of Rice Husk Ash reinforced
Al6061 Metal Matrix Composites. IOP Conf Ser Mater Sci Eng 2018;319:0–6.
doi:10.1088/1757-899X/319/1/012032.
[20] Ikumapayi OM, Akinlabi ET, Pal SK, Majumdar JD. A Survey on Reinforcements used
during Friction Stir Processing of Aluminium Metal Matrix Hybrid Composites. Procedia
Manuf 2019;35:935–40. doi:10.1016/j.promfg.2019.06.039.

84
[21] Kumar K, Gulati P, Gupta A, Shukla DK. A review of friction stir processing of aluminium
alloys using different types of reinforcements. Int J Mech Eng Technol 2017;8:1638–51.
[22] Koli DK, Agnihotri G, Purohit R. A Review on Properties, Behaviour and Processing
Methods for Al- Nano Al2O3 Composites. Procedia Mater Sci 2014;6:567–89.
doi:10.1016/j.mspro.2014.07.072.
[23] Sharma V, Prakash U, Kumar BVM. Surface composites by friction stir processing: A
review. J Mater Process Technol 2015;224:117–34. doi:10.1016/j.jmatprotec.2015.04.019.
[24] Das H, Mondal M, Hong S-T, Chun D-M, Han HN. Joining and fabrication of metal matrix
composites by friction stir welding/processing. Int J Precis Eng Manuf Technol
2018;5:151–72. doi:10.1007/s40684-018-0016-7.
[25] Ikumapayi OM, Akinlabi ET, Majumdar JD. Review on thermal, thermo- mechanical and
thermal stress distribution during friction stir welding. Int J Mech Eng Technol 2018;9:534–
48.
[26] Kubit A, Kluz R, Trzepieciński T, Wydrzyński D, Bochnowski W. Analysis of the
mechanical properties and of micrographs of refill friction stir spot welded 7075-T6
aluminium sheets. Arch Civ Mech Eng 2018;18:235–44. doi:10.1016/j.acme.2017.07.005.
[27] Johannes LB, Mishra RS. Multiple passes of friction stir processing for the creation of
superplastic 7075 aluminum. Mater Sci Eng A 2007;464:255–60.
doi:10.1016/j.msea.2007.01.141.
[28] Rana HG, Badheka VJ, Kumar A. Fabrication of Al7075 / B4C Surface Composite by Novel
Friction Stir Processing (FSP) and Investigation on Wear Properties. Procedia Technol
85
2016;23:519–28. doi:10.1016/j.protcy.2016.03.058.
[29] Padhy GK, Wu CS, Gao S. Friction stir based welding and processing technologies -
processes, parameters, microstructures and applications: A review. J Mater Sci Technol
2017;34:1–38. doi:10.1016/j.jmst.2017.11.029.
[30] Ikumapayi OM, Akinlabi ET. Characterizations of the evolving properties during the
milling time of Wood Fly Ash Nanoparticles ( WFA-NPs ). Proc Int Conf Ind Eng Oper
Manag Pretoria / Johannesburg, South Africa, Oct 29 – Novemb 1, 2018 2018:2040–9.
[31] Ikumapayi OM, Akinlabi ET. A Study into the effects of the milling time on the
Physiochemical and Morphological Characteristics of Cow Bone Powder ( CBP ). Proc. Int.
Conf. Ind. Eng. Oper. Manag. Oct. 29 – Novemb. 1, 2018, 2018, p. 2050–8.
[32] Ikumapayi OM, Akinlabi ET. Data showing the effects of vibratory disc milling time on the
microstructural characteristics of Coconut Shell Nanoparticles ( CS-NPs ). Data Br
2019;22:537–45. doi:10.1016/j.dib.2018.12.067.
[33] Ikumapayi OM, Akinlabi ET. Composition , Characteristics and Socioeconomic Benefits
of Palm Kernel Shell Exploitation-An Overview. J Environ Sci Technol 2018;11:1–13.
doi:10.3923/jest.2018.Review.

86
APPENDIXES
Figure A1: Two Ton linear NC controlled Friction Stir Welding Machine manufactured by ETA
Bangalore, India Ltd. Located at the Indian Institute of Technology, IIT, Kharagpur, Kolkata, West
Bengal in India

87
Figure A2: Multipurpose tribometer (Rtec-instruments, San Jose, CA, USA). Located at
Botswana International University of Science & Technology (BIUST), Palapye in Botswana.

88
Figure A3: Scanning Electron Microscopy (SEM) incorporated with Energy dispersive X-ray
spectroscopy (EDXS) - TESCAN model, type VEGA 3 LMH. Located at the University of
Johannesburg, South Africa.

89
Figure A4: Optical microscope located at the University of Johannesburg, South Africa.

90
Figure A5: TH713 Vickers microhardness tester located at the University of Johannesburg

91
Figure A6: Struers (a) hot mounting machine (b) polishing machine

92
Figure A7: Multifunctional X-ray Diffractometer (XRD)- (Rigaku Ultima IV). Located at the
University of Johannesburg, South Africa.

93
Figure A8: X-ray Diffraction (XRD) Measuring Instrument- (Philips XPert). Located at the
University of Johannesburg, South Africa.
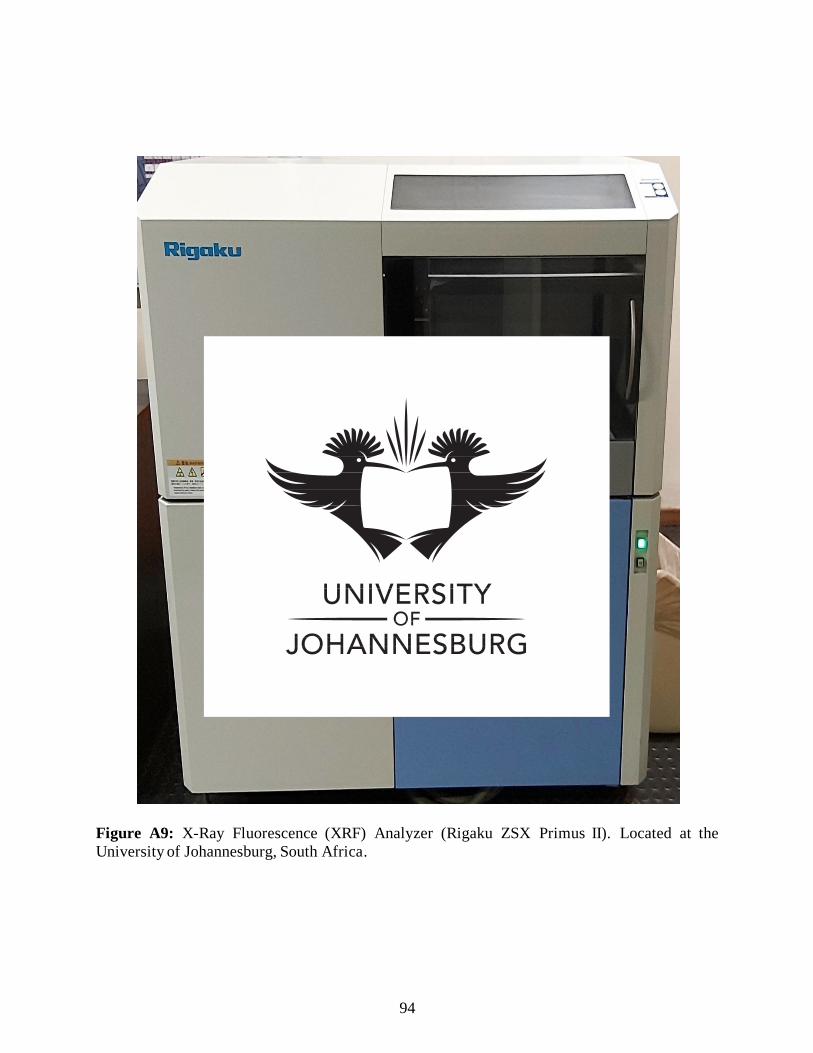
94
Figure A9: X-Ray Fluorescence (XRF) Analyzer (Rigaku ZSX Primus II). Located at the
University of Johannesburg, South Africa.

95
Figure A10: Universal Testing Machine (Zwick/Roell Z250) used for Tensile Testing. Located at
the University of Johannesburg, South Africa.

96
Figure A11: AutoLab PGSTAT 101 Metrohm potentiostat/galvanostat Equipment with embedded
2.1.2 version of NOVA software for Corrosion Characterizations. Located at the Surface
Engineering Research Centre, Covenant University, Ota, Nigeria

97
Figure A12: Digitalized vibratory disc milling machine (Model 2MZ-200) for mechanical dry
milling of agrowastes. Located at the University of Johannesburg, South Africa.

98
Figure A13: Powder Sieve Shaker (KING TEST VB 200/300) for sieving of agrowastes using
ASTM Standard Sieve. Located at the University of Johannesburg, South Africa.
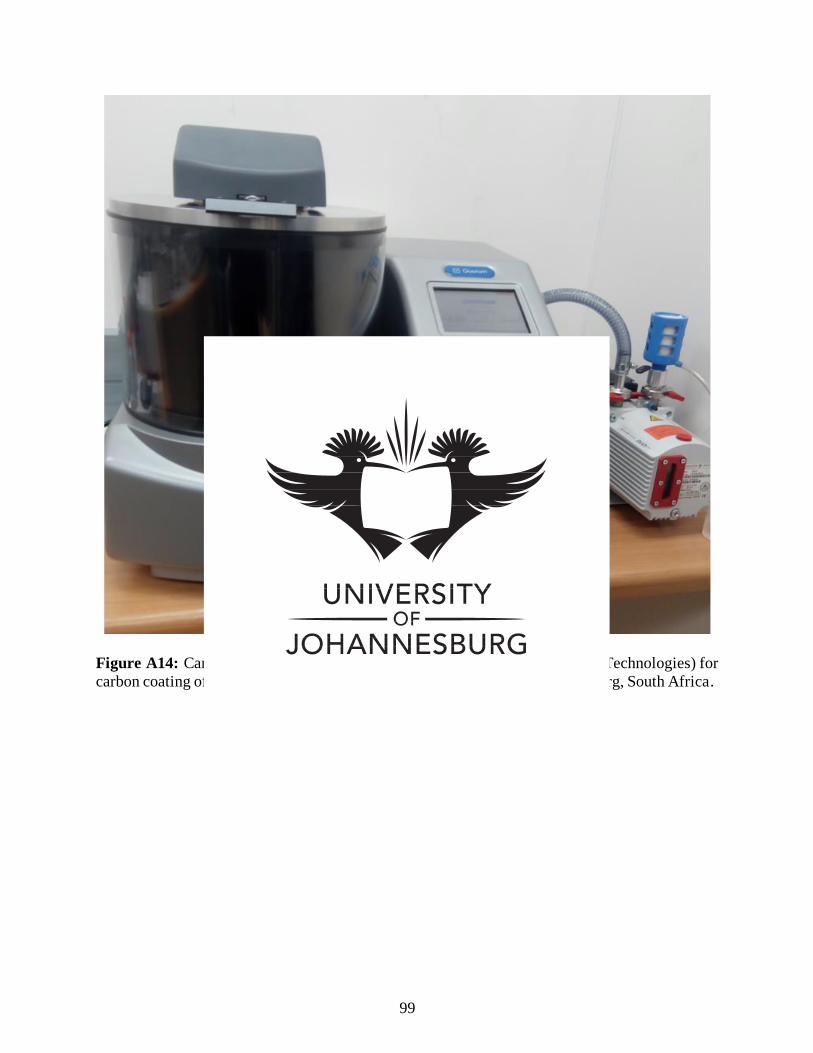
99
Figure A14: Carbon coater, sputter coater and turbo coater (Q300T- Quorum Technologies) for
carbon coating of agrowastes powders. Located at the University of Johannesburg, South Africa.
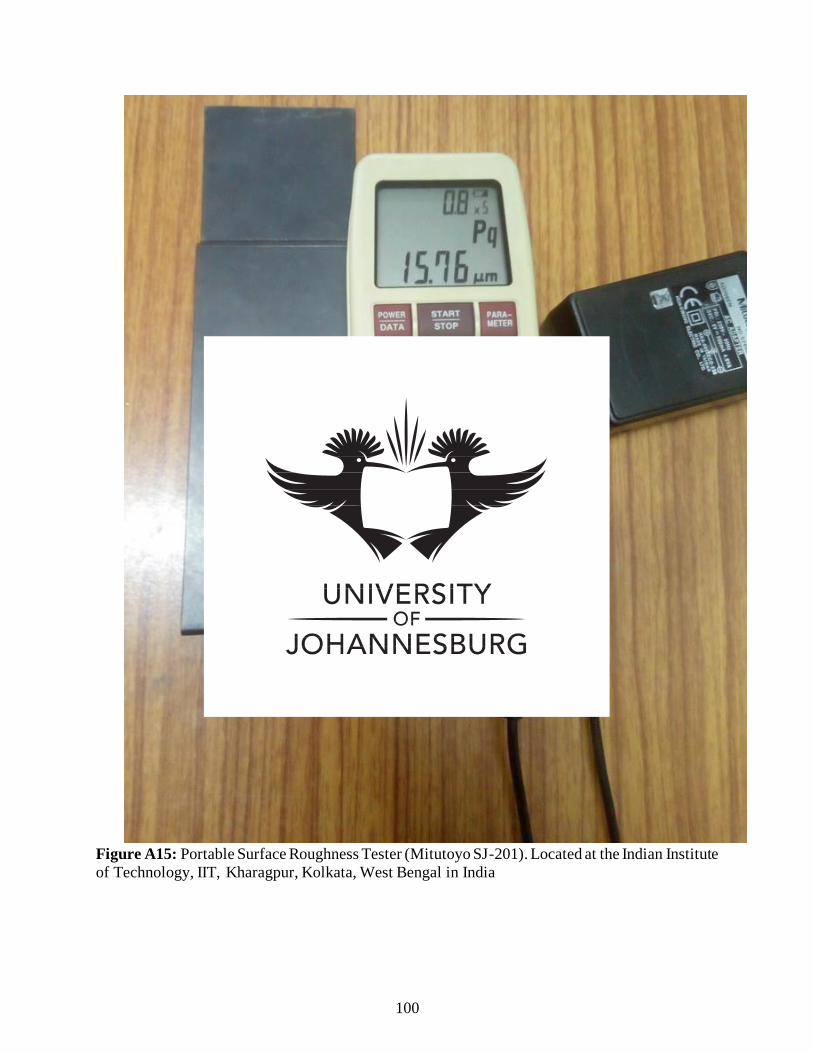
100
Figure A15: Portable Surface Roughness Tester (Mitutoyo SJ-201). Located at the Indian Institute
of Technology, IIT, Kharagpur, Kolkata, West Bengal in India
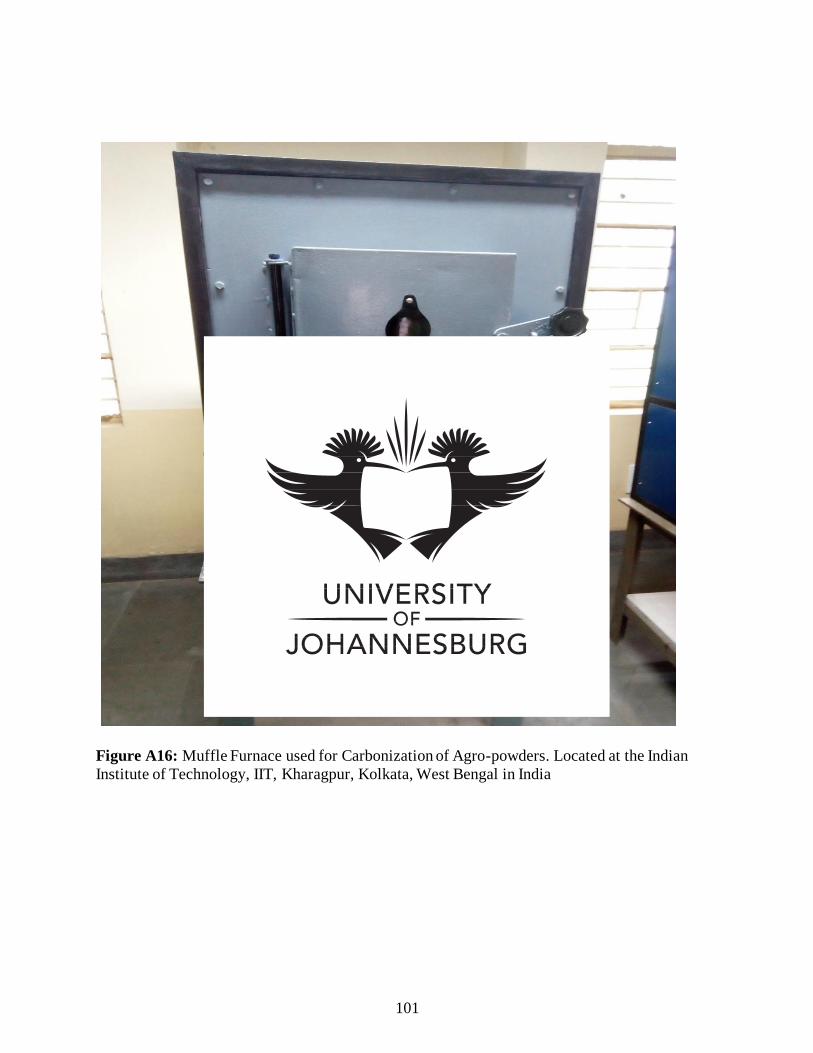
101
Figure A16: Muffle Furnace used for Carbonization of Agro-powders. Located at the Indian
Institute of Technology, IIT, Kharagpur, Kolkata, West Bengal in India

102
Figure A17: Friction stir processed Aluminium Matrix and Hybrid Composites. Fabrication was
done at the Indian Institute of Technology, IIT, Kharagpur, Kolkata, West Bengal in India

103
Figure A18: Fabricated Processing Tool for Stirring and Mixing during Friction Stir Processing.
Fabrication was done at the Indian Institute of Technology, IIT, Kharagpur, Kolkata, West
Bengal in India
104
Figure A19: Pure Graphite Crucible used for Carbonization of Agro-powders. Located at
the Indian Institute of Technology, IIT, Kharagpur, Kolkata, West Bengal in India

105
Figure A20: Bosch professional GDC 120 with tungsten carbide circular saw blade. Located at
the Indian Institute of Technology, IIT, Kharagpur, Kolkata, West Bengal in India

106
Figure A21: Vickers Microhardness Plots for the fabricated Aluminium 7075-T651 Matrix
Composites at different reinforcements particles and at 1500 rpm and 20 mm/min.

107
Table 1A: VICKERS MICROHARDNESS VALUES AT 1500 RPM AND 20MM/MIN
Distance
(mm)
Zones FSPed
AA7075
Ti SS WFA CFA PKSA CBA
RS Hardness (Hv)
1 BASE 175 176 176.90 175 176.7 176 176
2 175.5 178.5 175.34 176.8 175.30 175.8 175.9
3 176.35 176.25 176.49 176.35 176.80 176.95 176.85
4 HAZ 177.65 178.8 178 176.65 177.89 178.60 177.36
5 178 179.9 178.90 179.6 178.42 178 178.59
6 179.80 180.92 180 180.35 179.80 179.50 179.88
7 178 180.1 180.5 179 180 178 179.51
8 179.95 180.90 180.90 179.70 180.70 180 179
9 178.0 181.24 179 179.0 180.33 180.80 180.40
10 179 182.59 181 180 181 180.94 180
11 TMAZ 179.70 183.9 182.3 180.70 180 178.75 179.82
12 179.65 185.5 183 179.65 179 178.20 179
13 180 186.7 184 180 181 180.56 181
14 180.2 187.80 184 181.2 182.5 181.59 181.4
15 180.1 190 185.90 181.1 181.9 181.39 181.50
16 NZ 181.60 194.5 186.0 182.60 183.85 181 182.60
17 181 195 188.3 182 184 182.55 183
18 180.45 196.5 187.9 182.45 183.89 181.45 182.30
19 180.85 195.92 187 182.85 184.5 180.85 182.85
20 181 196.25 188.48 183 185.9 182 183.80
21 181.73 196.7 187.47 182.73 184.56 182.46 182.59
22 AS NZ 181.5 195.3 188.83 184.5 185.5 182.19 183.55
23 181 196.25 188.25 183 184 182 182
24 180.87 196.3 189.84 183.87 184.50 182.77 183.45
25 180.5 195.95 188.62 182.5 183.24 181.89 182.67
26 181 195.8 187 183 183.89 182.65 182.90
27 179.80 196.45 188 183.80 184 181.34 182.30
28 TMAZ 179.8 189.62 184 182.8 183.2 180 181.45
29 179 188.1 185.7 182 182.7 180.89 181.39
30 179.1 187.42 183.84 181.1 182.90 180.23 181
31 178.45 187.18 182 182.45 181.5 181.56 180
32 178.20 187.21 184 181.20 181.60 179.26 180.89
33 HAZ 178.80 186.2 183.82 182.80 182. 179.46 180
34 177.55 185.9 181 180.55 181.45 179.79 179.89
35 177.67 185 181.75 180.67 181.56 178.23 179.87
36 177.50 185.87 181 179.90 180.90 179.57 180.90
37 177.8 184 180 179.8 179.45 178.88 178.7
38 176.20 180.8 179.80 178.20 179.60 177.66 178.20

108
39 176.80 178 178 178.80 178.15 177.99 177.80
40 BASE 176 177.4 176.75 177 178.60 177.56 177
41 175.16 177.7 176.4 176.16 177.23 176.56 177.65
42 175.68 176 176 175.5 176.67 175 176.75
AVERAGE 178.86 186.58 182.76 180.48 181.21 179.78 180.28