•interface for decision appropriate technology •prediction
TRANSCRIPT

y ,
•Interface for Decision Appropriate Technology •Prediction
and Selection Methodologies
•State of the Art Reid* Coffey Editors
APPROPRIATE METHODS OF TREATING WATER
AND WASTEWATER IN DEVELOPING COUNTRIES
THE UNIVERSITY OF OKLAHOMA BUREAU OF WATER AND ENVIRONMENTAL RES0URCF0 " ' " ' " "« « ? " '
Sponsored by: U.S. AGENCY FOR INTERNATIONAL D\250 - l X n P " S l 7 > WASH
';:-

^}1
CONTRIBUTORS
L. W. CANTER KUNG-CHEH GEORGE LI
KAY COFFEY J. F. MALINA
RICHARD DISCENZA MICHAEL I.MUIGA
WILLEM VAN GORKUM GEORGE W. REID
L. HUISMAN SOETIMAN
KEES KEMPENAAR THAILAND MINISTRY OF PUBLIC HEALTH
SUE LIN LEWIS GAYLE TOWN LEY

USUI i/sY
A ? p R o p R M T
METHODS
G O U J V T R I £ E d l ' ted by G, ---'vJi S»4, Jo' - - ^ A D Toe MPr
^ g e -Reid /**i i ^ i i ""• '*!/243
ay Coffey w ^ _ > « A P - . . \ y

)

Foreword
V

v i

v i i

Y- i i i

Abstract
For many years developing countries have been working, with exter
nal assistance, to promote development of water treatment and waste
disposal systems in their cities and towns. Adequate quantities of
safe water and adequate sanitation measures are considered to be a
necessary but not a sufficient condition for social and economic devel
opment; however, up to this time programs simply have not succeeded
in keeping pace with the problem of water and sanitation in LDC's.
A breakdown has occurred where there have been direct technology trans
fers which resulted in the selection of treatment processes too sophis
ticated or costly for in-country construction, maintenance, or opera
tion.
A basic problem, then, relates to site-specific selection of appro
priate technology in LDC's. This volume, in part the result of an
in-depth study sponsored by the United States Agency for International
Development and in part the result of additional and related efforts,
is concerned with this problem. Chapters I and II outline the diffi
culties encountered in donor/client relationships and technology trans
fer. Chapter III explains a methodology for selecting the most appro-
ix

piriate techriblbgy for water arid wastewater treatment for a particular
LDC site arid at a particular time, according to the material arid man
power resource capabilities' available: Chapter IV presents a mathe
matical model for LDC's in Africa, Asia J arid Latiri America; to predict
water arid wastewater demand, as weli as coristriictiori arid operation
ah'A mairiteriarice cost estimates for slow sarid filters; rapid sarid fil
ters; stabilization lagoons J aerated lagoons; activated sludge systems,
arid trickling filters. The basic technique used in developing this
model was step-wise multiple regression working from LDC iri-cbuhtry
cost data. Chapter V preserits a methodology for setting priorities
among LDC water siippiy programs. Chapters VI, VII, VIII; IX, arid X
constitute state of the art chapters (for application particularly
to LDC'sX ori past, present, arid future technologies for water and
wastewater; including bh-site disposal and treatment concepts.
The purpose of this volume is to support dbribr/client efforts to
reduce health problems through proper selectibh' of processes and pro
jects, realizing that much of the solution is educatiorial in nature.
x

Acknowledgments
This volume evolved from a University of Oklahoma/United States
Agency for International Development (OU/USAID) study on "Lower Cost
Methods of Water and Wastewater Treatment in Less Developed Countries,"
under the direction of Regents Professor George W. Reid. Much is owed
to a number of people who have helped to develop and implement the pro
ject and to prepare this book.
Initially, the OU/AID project was conceived by Dr. Albert Talboys,
Dr. Lee M. Howard, and A. Dale Swisher of USAID, Office of Health, Wash
ington, D.C. Without their vigorous and continuous support, the work
simply would not have been undertaken. Weyburn D. Davies of USAID was
also very helpful. Upon the retirement of Dr. Talboys and Dale Swisher,
James F. Thomson and Victor Wehman took over these roles and were par
ticularly helpful in the later stage of the project and in the prepara
tion of this volume. Dr. Silas Shau-Yee Law, formerly Assistant Director,
University of Oklahoma Bureau of Water and Environmental Resources Research,
and Ralph Martin, Director of Program Development, OU, provided invaluable
assistance to the project, helping to facilitate and promote its goals
in every possible way.

Dale Swisher,. Dr. Talboys, and Ralph1 Martin assisted in many of the
field visits necessary to the project. Individual field studies on the
use' of particular technologies were directed by Dr. Reynaldo M. Lesaca,
Commissioner, National Pollution Control Commission, Manilla, the Philip
pines; Dr. Erasto Muga,. the University of Nairobi,. Kenya; Odyer A.
Sperandio, Director of the Centre Panamericano de Ingenieria Sanitaria
y Cieneias del Ambiente (CEPIS), Lima1, Peru; Mei-Chan Lo, Director,
Taiwan Institute of Environmental Sanitation;. Charu Chandr Praphorn,
Thailand Ministry of Public Health; and Dr. S. Erol Ulug, Chairman,
Environmental Engineering Department, Middle East Technical University,
Ankara, Turkey.
A review of the OU/AID1 project, and in particular the forecasting
model for selection of suitable water and wastewater processes, was accom
plished through a global conference held in Voorburg, the Netherlands.
The conference was- jointly sponsored by the University of Oklahoma and
the World Health Organization International Reference Centre (WHO/IRC)
for Community Water Supply. Numerous world experts were brought to the
conference for the review, among them, Professor S. J. Arceivala, WHO
Regional Office, Ankara, Turkey;. Dr. J. M. de Azevedo Netto of the
University of Sao' Paulo. Bra'zil: Dr. B. H. Dieterich. Director. Division
of Environmental Health, World Health Organization, Geneva; David Donaldson,
Pan American Health Organization, Washington, D.C.; Professor L. Huisman,
Delft University of Technology, the Netherlands; Dr. Michael G. McGarry,
International Development Research Centre, Ottawa, Canada; Dr. Wilfredo
L. Reyes, WHO Regional Office for Southeast Asia, New Delhi, India;
and T. K. Tjiook, WHO/IRC for Community Water Supply. Others ob
serving the conference included Willem van Gorkum and Kees Kempenaar,
Delft University of Technology, the Netherlands. In addition,
xii

Dr. J. M. G. van Damme, Manager of the WHO/IRC for Community Water
Supply, collaborated in the review conference and assumed responsibility
for preparation of the original project publications on water supply which
were completed at the Delft University of Technology, the Netherlands, as
well as a mailing to identify unpublished material on drinking water sup
ply and waste disposal for developing countries.
Numerous individuals helped in the project research which led up to
this book, and they deserve special thanks. Dr. Graham G. Don, London
School of Hygiene and Tropical Medicine, the University of London, and
H. Weber and H. R. Wasmer of the World Health Organization International
Reference Centre for Wastes Management, Dubendorf, Switzerland, sup
plied useful background material on historical methods of water and
sewage treatment. Dr. George M. Ayoub, Professor of Civil Engineering,
American University of Beirut, Lebanon, provided valuable assistance.
Work on some of the initial process matrices was carried out by Dr. Ivon
H. Lowsley Jr., University of Missouri --Rolla, and Dr. Kenneth Govaerts,
the University of Nebraska at Omaha, and formerly Associate Director,
Technical Programs, -U.S. Peace Corps, Kenya.
Others who helped in the project research include Dr. Richard
Discenza, Northern Arizona University, and Dr. Michael Ikua Muiga,
Federal University of Paraiba, Brazil. Chan Hung Khuong, currently
research assistant with the University of Oklahoma Bureau of Water and
Environmental Resources Research, assisted in compiling a catalog of water
supply and waste disposal methods for individual units. Juan H. Diaz,
currently Environmental Officer for the U.S. Army in the Canal Zone,
Panama, contributed much of the material on stabilization ponds found
in the chapter on wastewater disposal and treatment. Franz C. Lauffer,
xiii

a graduate research assistant with the University of Oklahoma
Bureau of Water and Environmental Resources Research, contributed many
helpful ideas to the chapter dealing with on-site treatment. Andy Law
and Weigun Yang, doctoral students with the University of Oklahoma
School of Civil Engineering and Environmental Science, helped develop
the test kits and manuals to be used for the examination of water and
wastewater in the field. Kay Coffey, research assistant with the OU
Bureau of Water and Environmental Resources Research, contributed to the
project research, and also served as coeditor of this volume.
Chou Gene-Pai, a doctoral student with the University of Oklahoma
School of Civil Engineering, assisted in preparing illustrations and in
providing technical advice for this volume. Brenda Skaggs typed the
entire manuscript.
The following persons were asked to review the preliminary draft,
and much is owed for the patience and constructive critiques. They are:
Dr. R. C. Ballance, Division of Environmental Health, World Health Organization, Geneva;
Dr. Martin G. Beyer, Drinking Water Programmes, UNICEF, New York;
Dr. Graham G. Don, London School of Hygiene and Tropical Medicine, the University of London;
John M. Kalbermatten, Water and Wastes Advisor, International Bank for Reconstruction and Development, Washington, D.C.;
William J. Mills, Water Resources Branch, United Nations, New York;
F. W. Montanari, Parsons Brinckerhoff Quade & Douglas, Vienna, Virginia;
Dr. Wil'fredo L. Reyes, WHO Regional Office for Southeast Asia, New Delhi, India;
Dr. Abel Wolman, Johns Hopkins University, Baltimore, Maryland;
Dr. F. Yanez, Centro Panamericano de Ingenieria Sanitaria y Ciencias del Ambiente (CEPIS) , Lima, 'Peru;
xiv

Dr. Shafiq Yunis, Economic Commission for Western Asia, United Nations, Beirut, Lebanon.
To the contributors of the material which is included in this volume
goes credit for much of what is good about this book. However, the editors
must take responsibility for the organization and the form in which the
material is presented here.
George W. Reid
xv

xvi

Contents
FOREWORD, v ABSTRACT i x ACKNOWLEDGMENTS xi
CHAPTER I. INTRODUCTION: INTERFACE FOR DECISION, George W. Reid . 1
CHAPTER II. TECHNOLOGY TRANSFER, ADAPTATION AND UTILIZATION, George W. Reid 23
CHAPTER III. PREDICTION METHODOLOGY FOR SELECTION OF SUITABLE WATER AND WASTEWATER PROCESSES 39
111.1. Prediction Methodology for Suitable Water and Wastewater Processes George W. Reid and Richard Discenza 41
111.2. Prediction Methodology for Suitable Water and Wastewater Processes: Data Requirements 73
111.3. Prediction Methodology for Suitable Water and Wastewater Processes: Manual Computation Method George W. Reid and Richard Discenza 82
CHAPTER IV. METHODOLOGY FOR PREDICTION OF WATER AND WASTEWATER VOLUMES AND TREATMENT COSTS 95
A Mathematical Model for Predicting Water Demand, Wastewater Disposal and Cost of Water and Wastewater Treatment Systems in Developing Countries Michael I. Muiga and George W. Reid 97
CHAPTER V. METHODOLOGY FOR ESTABLISHING PRIORITIES AMONG WATER SUPPLY PROGRAMS: A CASE STUDY 167
A Priority Setting for the Rural Water Supply Program in Indonesia Soetiman 169
xvii

CHAPTER VI. IMPLICATION OF PAST DEVELOPMENTS IN WATER AND WASTEWATER TECHNOLOGY 231
Historic Implication for Developing Countries of Developed Countries' Water and Wastewater Technology Kay Coffey and George W. Reid 233
CHAPTER VII. WATER SUPPLY AND TREATMENT 323
yVI'I.l.^Part One. Water Supplies in Rural Areas of Developing Countries (Part One) L. Huisman 326
VII.1.) Part Two. Water Supplies in Rural Areas of Developing Countries (Part Two)
^— Willem van Gorkum and Kees Kempenaar . . . . 359 VII.2. Study of an Existing Water Treatment Plant of Simple v^- Design and Operating System for Supplying Drinking
Water to Rural Communities in the Lower Mekong Basin Countries: Study of a Slow Sand Filter Thailand Ministry of Public Health, Department of Health, Rural Water Supply Division
VII.3. Small Wells, Slow Sand Filtration, and Rapid Sand Filtration for Water Supplies in Developing Areas Kung-cheh George Li
CHAPTER VIII. , WASTEWATER DISPOSAL AND TREATMENT
VII. 1. Sewage Treatment in Developing Countries L. W. Canter and J. F. Malina
VII.2. Aerated Lagoons —•- Kung-cheh George Li
VII.3. Land Application of Wastewater " ~ Sue Lin Lewis
CHAPTER IX. ON-SITE DISPOSAL AND TREATMENT
Cost-Effectiveness of the Socio-Cultural and Health Benefits of Sewerless Alternatives for Domestic Waste Disposal in Developing Countries Gayle Townley 521
CHAPTER X. -EXPEDIENT TECHNOLOGIES, George W. Reid 621
""APPENDIXES 631
SELECTED BIBLIOGRAPHY ' . . " . " . ' . ' . ' ' : . 727
381
406
437
439
483
491
519
xviii

CHAPTER 1
Introduction: Interface for Decision
George W. Reid
A 1971-72 survey by the World Health Organization of community
water supply and excreta disposal conditions in developing countries
revealed that nearly one-third of the world's population (over one
billion people) have no adequate water supply, and only 0.8 percent
of the total population of developing countries is served by sewage
treatment facilities (53). As a result of this survey the United
Nations Second Development Decade goals included the supplying of all
urban populations with water, either by house connections or by public
standpipes, and the provision of reasonable access to safe water for
one quarter of the population in rural areas by 1980. Based on achieve
ments by 1975, percentage goals were increased to thirty-six percent
of the rural population, and excreta disposal targets were established
for the first time. However, despite great efforts, populations have
increased more rapidly than new facilities can be installed.
1

2
In 1975, the Global Workshop on Appropriate Water and Wastewater
Treatment Technology for Developing Countries was held. This was a
collaborative effort between the University of Oklahoma and the WHO
International Reference Centre for Community Water Supply. The objec
tives of this workshop were:
-to assess the state of the art and to identify the role that
appropriate technology can play in the development of water
supply and sanitation in developing countries;
-to formulate technical and organizational recommendations and
to agree upon priorities for studies, projects or other activi
ties; and
-to discuss the development of internationally coordinated pro
grams and the operation mechanisms for implementing the activi
ties planned as a result of the meeting.
In addition to confirming the WHO survey, the Global Workshop
focused on many of the types of failures in the planning and provision
of water supply and sanitation in developing countries which result
from imported technology, and the Workshop indicated the need for appro
priate technologies consonant with local socio-economic conditions.
Some of the factors which severely handicap programs to provide safe
drinking water and efficient sewage disposal are:
-shortage of resources (including trained personnel and finances),
-lack of governmental support within the developing countries,
-inadequate institutional structures (insufficient organization
and administration),
-lack of local interest and acceptance of the project.

3
It was the consensus of the group that water supply and sanitation
must be considered an integral part of the development process, and
national, overall plans should be formulated. Each country should
be urged to establish its own water resources agency to collect per
tinent data and to plan with a regional approach rather than a case-
by-case approach. Strong ties should be established between water
agencies and universities. Efforts should be made to motivate govern
ments to implement water supply and sewage schemes. Frequently, proper
sewage treatment and excreta disposal have been given such a low pri
ority that pollution control has been postponed until the problem was
too great for solution with available community resources. Hope
fully, a national plan and greater governmental involvement would
help to alleviate this problem.
The Workshop concluded, however, that it would be necessary to
assist developing countries to improve their strategies for increasing
the rate of rural water and sanitation coverage, if they were to be
able to provide even the most basic water and sanitation services to
all those who need them within any reasonable time frame. More inter
national funds should be devoted to the rural sector and to low-income
groups which are most in need of assistance. Although dispersed popula
tions are among that group which is in great need, actions to alleviate
the situation could be made more effective if they were concentrated
on groups such as nucleated units or villages.
The Workshop suggested that when equipment or technology is sup
plied, it should be only after a means of supply for repair parts and
maintenance equipment is known to be available. Many existing facili
ties are in bad condition due to poor selection of technology, inapprq-

4
priate design, insufficient maintenance including preventive mainte
nance, a lack of spare parts, and a lack of trained personnel. Locally
obtainable materials should be utilized whenever possible, and mainte
nance of equipment should be manageable by local people.
Experiences in Latin America, India, and elsewhere have shown
that besides lower levels of technology, a high level of technology
may also be useful in a developing area, where an advanced technology
often may be applied and adapted using local materials.
Frequently, it has been the case that local professionals prefer
to rely on a foreign consultant rather than risk a possible failure
or introduce techniques based on their experience but without estab
lished records of performance. To encourage the use of lower levels
of technology an effective approach seems to be the training of local
engineers who in turn would train other local people. A "barefoot
engineer" scheme analogous to the "barefoot doctor" concept was sug
gested.
Involvement of the people concerned from the beginning of a water
supply or treatment project is important. Sometimes much persuasion
and education are necessary to get people to use safe water. Local
decision makers need to understand the basic principles of the various
processes and support the ideas introduced. Some suggestions to help
bring this about were handbooks in simple language for laymen, pilot
demonstration plants, short courses, and experimental plants connected
with plants in operation.
It was emphasized that groundwater should be given greater atten
tion as a source of water supply because it usually does not require
extensive treatment. Slow sand filtration has proven to be an effective

5
treatment method in developing areas. Solution feeders are preferable
to dry feeders in these locations because they are less expensive, more
reliable and efficient and do not have to be imported. For floccula-
tion and sedimentation all mechanical devices should be discouraged.
It was emphasized that in summary, an appropriate technology is one
which is accepted by the users and can be maintained by the community.
The importance of the quality and quantity of a water supply to
human and economic health has been clearly demonstrated and has been
the target of international development efforts in less developed
countries (LDC's). Experience has shown that international investments
have not been efficiently or effectively used where selection and use
has been made of inappropriate technology. The genesis of this text
was the recognition of these failures. Chapter II deals specifically
with technology transfer, adaptation, and utilization.
Developed countries (DC's) have generally supplied DC engineering
which represented what was conceived to be the latest technology, and
often LDC decision makers have wanted to be identified with the latest
technology. Unfortunately, this has not always been the most appro
priate choice for a particular situation. Engineers working on water
supplies for low-income countries, have had "safe" water in mind as one
objective. However, for the great majority of the world's population who
live in rural communities or densely populated and unorganized urban
areas with grossly inadequate access to safe water, there is little
possibility that available financial and human resources would be able
to give them the same high standards of water provision as that enjoyed
by most people living in more developed areas. Because resources
are very limited, it is necessary to examine closely the goals of

6
water supply in order that what resources are available may be allocated
in the most rational and effective manner. If a very high standard
of water provision is unattainable, that does not mean there is nothing
worth attempting. There are usually many improvements possible which,
though falling short of the ideal, may have a very considerable impact
on health or on other problems of the local community.
The approach presented in this text to aid in the resolution of
this problem is (1) to assist the consultant in using a systems ap
proach and in identifying the major alternatives.; (2) to devise ways to
present the alternatives to LDC decision makers, thus facilitating
diffusion; and (3) to assist LDC's in developing self-sufficiency in
the selection or producing of appropriate technology. In 1973, the
University of Oklahoma undertook a study which resulted in a methodology
to select appropriate low cost treatment methods for specific LDC
sites. The methodology has been tested for user and consumer acceptance
through exposure to engineering consultants, a global conference of
LDC decision makers, international agencies, and financial institutions.
During the study, it was necessary to acquire information on transfer
failures, on the state of the art of LDC processes and LDC process
costs, from literature and from on-site sources. Also undertaken were
detailed studies of selected global sites as well as a historic study
of the use of processes in DC's. It was found useful to develop a
system of analytical tests that would be adequate for quality control
and would be supportable in-country. These efforts resulted in several
publications under the sponsorship of the United States Agency for Inter
national Development (US LD) and by the World Health Organization Inter
national Reference Centre for Community Water Supply in the Netherlands
(IRC/NL). (See Bibliography p. 727.)

7
In studying the problem of technology transfer, the engineer/
client relationship was seen to be of critical importance:
In the design of water supplies the choice of components, materials and dimensions is often governed by codes of practice or by professional conventions which engineers trained in the West too readily take for granted. And not only do these conventions tend to limit the adaptation of design to local needs, but like the WHO standards for water quality, they are suited to the needs or urban water supply in Europe rather than to village water supply in the tropics. Thus codes of practice may lead to the choice of unnecessarily expensive materials or equipment, or may discourage an engineer from improvising when the "correct" components are not available. Every village deserves the best possible engineering design for meeting all the immediate objectives, but given the kind of objectives which seem right for rural water supply, the "best possible" may not always look a good solution when measured against Western codes of practice.
Some engineers are conscious of this dilemma, but feel that if they chose an unorthodox solution to a specific problem and the equipment failed and led to an outbreak of disease, they would carry an undue burden of responsibility; but if they had followed the "correct" design conventions, they would not be blamed (21).
The engineer working to bring technology to an LDC works in an
alien, and in many ways, a very complicated environment. Pictorially,
one can identify at least eight separable, frequently conflicting
elements which he must take into consideration or deal with in his
work. (See Figure 1.1.) In his role of selecting appropriate tech
nology, the engineer operates to meet national health standards and
perhaps international standards. The plan must fit into larger water
schemes; usually it must be designed without any sort of long-term
physical data or national or local funding, and donors must be located.
The environment must be able to support operation and maintenance,
and local political and business interests exercise special require
ments in many instances.


8
Fig. 1.1. Conflicting elements which affect the engineer working in an LDC situation.

9
A study made by Reid for the Avco firm and the American Society
of Civil Engineers included research on the types of technology most
often preferred by decision makers. The results showed that eighty
percent of the decision makers wanted what everyone else was currently
using; fifteen percent wanted older, cheaper solutions; and only five
percent would consider newer, innovative solutions. The decision maker
was concerned about the present, and the problems of the future and
problems associated with operation and maintenance were considered to
be problems for future decision makers. The engineer's interest, too,
Was shown to be limited to the immediate task of getting the plant
built. This meant that neither the decision maker nor the engineer
appeared to be interested in the ability of the site to keep the pro
cess going. In response to this common problem, there have been
attempts to require the engineer to provide operational follow-ons
for completed projects, such as including in the contract certain re
quirements for supervision and training for an initial period.
Quite often plants have been over-designed technologically. Finan
cing has been based on capital costs only (ignoring operation and
maintenance costs). Proper operation has been lacking and replacement
parts and materials non-existent. If a piece of equipment failed,
it was replaced rather than repaired. If enough parts failed so that
the plant stopped functioning, a new plant was planned and built.
One remedy sought by international agencies for this situation has
been the provision of short-term training for operators and a more
formal education for in-country engineers.
It has often been the case that the in-country engineer has pre
ferred to transfer design responsibility to an out-of-country expert,
someone who would come in, execute the job, and leave. This has

1Q
increased the difficulty of arriving at an appropriate selection of
technology. In general, the international engineer would be unfamil
iar with the local situation, involved in keeping people happy and in
getting the job done, and little concerned about what happened after
he left. The local engineer quite often would identify with out-of-
country technology for reasons of prestige, and the client was in an
insecure position, being approached by various equipment salesmen
vying for contracts.
The following paragraphs present nine specific problems associated
with the use of expatriate advisers in developing countries.
The Promoters—These are people who present themselves as seasoned investors who sell grandiose projects to the government through contacts at high official levels. These schemes usually result in low returns or outright losses which are often borne entirely by the government. The solution offered is to "know your investors," admittedly a difficult task.
The Biased—Misallocation of resources may result because of biases in the experts' appraisal of investments. This problem can be solved by insuring that a careful economic feasibility study be carried out.
The Vacationers—This problem refers to foreign specialists whose professional interest is dominated by their desire to see the world. The nationals are often very sensitive to the degree of sincerity of the advisor and their attitudes and cooperation are influenced accordingly. Careful screening of candidates for foreign assignment is required to circumvent this problem.
The Impossible—This problem occurs when the advisor has been charged with a task that is too difficult to accomplish effectively, given the constraints under which he must perform. Recognition that the advisor does not possess all knowledge, especially as concerns intimate details of the country, and cooperation of resident specialists can alleviate this problem.
The Irrelevant—Donor countries may offer financial and technical assistance for a particular project that would be a mis-allocation of effort for the developing country. Development, in most cases, should be confined to a country's more obvious and immediate needs.
The Confusion—Too many advisors on the same project can cause confusion and result in inappropriate actions. The solution offered is for the developing country to be more selective and able in the use of foreign specialists.

11
The Out-of-Place—Technology of an advanced nation cannot be imposed upon the developing country unless it has been appropriately adapted to local conditions.
The Sophisticates—This problem arises when highly refined techniques of analysis or application are used when simpler procedures are in order. This is a special case of the previous problem category. A clear understanding of local issues and conditions will greatly aid the selection of appropriate techniques and procedures.
The Old Timers—After long tours of duty, some advisors may become out of date, complacent, and non-progressive, and, therefore, ineffective in accomplishing the objectives. These characteristics do not apply to all "old timers" of course. (33)
The engineer/client relationship is important in technology
transfer. There is also a need for an improvement in communication
linkages between the LDC areas of need and sources of technology in
DCs and LDC's. To develop in-country competence and self-sufficiency,
it will be helpful to establish local and regional centers of tech
nology. The extent to which LDC's use research and technology developed
abroad is directly related to the "absorptive capacity" of these coun
tries, that is, the readiness and capability of specialists and institu
tions to adapt, apply, and disseminate the technology. This capacity
is important whether the technology is being transferred in the form
of equipment, as technical information, or through exchanges of people.
It embodies a capability to recognize the alternative technical approaches
that are or could be available; to choose the technology that makes
the most sense technically, economically, and socially; if necessary,
to be able to adapt the technology to local conditions; to understand
the direct impact and the more subtle long-term impacts of the tech
nology; and to operate and maintain the technology.
Institutional orientation is often the decisive aspect of a
developing country's capability to absorb technology. For example,
there are a large number of LDC students at most DC universities. But

12
are their courses of study truly of relevance to interests back home,
or will they give further impetus to the brain-drain? While it is
difficult for a United States university on an institutional basis to
make sudden changes in the orientation of the content of its academic
curriculum, individual professors and instructors can introduce ele
ments into their courses which will enrich the experiences of developing
country specialists and allow them to return home better prepared to
face the realities of development. Many of our university professors
maintain collaborative linkages with a large number of researchers
abroad. The substantive aspects of those linkages, exchange of tech
nical reports and joint research efforts, can do much to influence
the orientation of research activities in developing countries.
It is difficult for a country that does not itself possess a rea
sonable number of trained scientific and technical personnel to know
what usable technology exists elsewhere, to understand it, to adapt
it to the country's special needs or peculiar conditions, to repair
and maintain the necessary equipment, or indeed to operate it. If
a country builds up its own scientific and technical capacity, it is
in a much better position to utilize what exists elsewhere. Lack of
appropriately trained persons is often an obstacle to the wider appli
cation of technology that is already known and to some extent used in
a country. In addition, each country is better able to hold its place
in international competition if it has the capacity itself to introduce
innovations (new products or less costly methods of production) based
on existing technology.
In the chapters which follow an attempt is made to describe an
ordered method of selecting for a particular site and at a particular

13
time, the most appropriate technology from those available in the
LDC's as well as in the DC's. To develop such a scheme it was nec
essary to select pertain limits. In this instance, the concern is
drinking water and wastewater for organized communities (villages,
tqwns, or citt.es, extending from the smallest nucleated settlement
to perhaps all but the very large LDC cities which usually can af-
fprd water and wastewater treatment and have available a variety of
high level expertise). This is not to say that rural areas without
community systems are not important in LDC's, but certain limitations
must be made, and as dispersed rural areas become nupleated, non
structural systems of water supply and waste disposal or treatment
are of special interest. It is for this reason that a management
system of on-site processes is examined.
There is a need to differentiate between that which is nucleated
and that which is not, as concepts of community differ, particularly
among professions (such as engineers, ecologists, sociologists, health
workers, or economists). It is proposed here that a nucleated settle
ment begins at or above that population concentration level where there
exists a physical water system and an associated managerial system.
In general, the management system in a nucleated settlement will no
longer be a volunteer operation, and this breakpoint occurs at a pop
ulation of about 300 or more. At a higher population level of about
3.000 persons, piped water becomes cheaper than unpiped water (21).
Piped water requires a distribution system and a higher level of tech
nology than does a system of unpiped water. Population density is a sig
nificant factor in determining the cost of a piped system. For a piped
system to be preferred on a cost basis, the population density should be

14
about 1.7-2.0 people/acre or more. (See Figure 1.2.)
In LDC settlements with a population of less than about 300,
the technology of concern will be related to protection of the supply,
provision of pumps, storage, and treatment, all of which will probably
be manageable on a local, volunteer manpower basis. There is no room
for sophistication. There is usually no liquid sewage and no water
oriented industry. On the other hand, in a nucleated settlement with
a system of piped water, unit use will be greatly escalated and bene
fits expanded.
In a non-nucleated situation, health is usually protected through
supply protection, not through treatment. With nucleated settlements,
the settlements which are of primary concern in this text, larger
volumes of water are usually involved, and treatment and distribution
will be factors of importance. Also, there will be the potential of
a considerable health risk because of the volumes of wastewater produced
and the possibility of pollution of raw supplies by the effluents.
Water treatment and sewage treatment begin to be of real concern at
a population level of from about 2000 to 3000 people. Consideration
is also given in this text to a special case of the low density settle
ment, where on-site sewage disposal or treatment is used or water distri
bution is accomplished through a vending system, and a managerial system
is required.
In this text, the primary concern is with a safe domestic supply
of water and disposal of wastewater in LDC cities and towns. The entire
process could involve technologies ranging from a dam and intakes, pipes
and pipelines, to treatment and distribution followed by sewerage systems,


15
NUMBER OF PEOPLE/ACRE INCREASES
FLOW (MGD) INCREASES
Fig. 1.2. The effect of population density and economy of scale on the unit cost of piped water. As the flow required increases, the unit cost decreases. Increased population density also decreases the unit cost.

16
treatment, and discharge. However, the main emphasis here is limited
to treatment with the other components being left for examination by
other interests.
The selection methodology is described in Chapter III. It
involves the systems approach and aggregate modelling. The systems
approach permits the analyst to look at various interrelationships
and decision options at one time. Aggregation models use attributes
expressed as averages, such as the level of education, the age, or
the state of health of an average but non-existent representative of
a population. For example, the average United States male might be
described as a person who is five feet eleven inches in height, weighs
170 pounds, earns $14,000 per year, and uses two liters of water and
2,500 calories per day. The attributes for LDC modelling must be
representative and must be based on available data on the LDC site
either obtained directly or through the aid of a surrogate. Judgment
in application is absolutely necessary.
Formally, the selection methodology includes the following com
ponents:
1. model: a symbolic representation of the problem;
2. metrics: specific goals such as parts per million (ppm),
biochemical oxygen demand (BOD), and Most Probable Number (MPN);
3. alternative solutions: different processes or combinations
of processes;
4. validation and diffusion.
In developing the methodology, it was necessary to describe
sites and processes, identifying their efficiencies, costs, and
manpower requirements. Resources had to be identified and goals and
quality standards articulated. A system of socio-economic site

17
classification had to be devised based on aggregate attributes of the
site. In the use of the selection process the methodology proceeds as
in Figure 1.3.
Details are given in Chapter IV on the assembling of cost and
demand figures for water and wastewater treatment systems. Chapter V
presents a methodology for setting priorities for water supply programs.
Chapter VI is a historical study of DC water and wastewater technologies
and their impact upon the societies that made use of them. This material
can assist in the application of historically used methods where they
are found to be compatible to LDC sites. It can also help LDC sites
to avoid the problems which occurred in the process of DC development.
in the field of water supply and sanitation. Chapters VII, VIII and
IX comprise the state of the art of technologies for LDC's for water
supply and treatment, wastewater treatment and disposal, and on-site
disposal and treatment devices, respectively. Performance data are
also assessed in these chapters. Chapter X presents expedient techno
logies which either were not included in the more formal classifica
tions of Chapters VII, VIII, or IX, or which it seemed beneficial to
introduce from the point of view of application in village or indivi
dual dwelling situations, where maintenance is often accomplished on
an individual or purely voluntary basis.
Table 1.1 presents a suggested classification of levels of econo
mic growth in terms of gross national product per capita. This is
related to the socio-economic system of site classification used in
the methodology described above. There are several world agencies
concerned with development that are attempting to provide people with
opportunities for a better life. Although economic growth is an

18
w L •-} C/3 < rt w ?; < W H H U M H Q g P B i O W Pn U
CO Z o M H
1
I k
A 1 , i
z o M H < Z M
^ pd w H W Q
H PM en O O U Z
W O H h l H M M H W M < 3 H Z o <! M J U § Cu O O Q U O
H Z
TME
< g H
en w en en U e_> O K PH
I 3 • J P-
Q W PC: M
O
£ h-l J <1 O
en
O (J
H Z w a O 1 H
3 O- H W OS z
w 3 PS H
en w
W H O !=> PH PQ 13 H O Pi en H
S3
w H M en
P* O
u
a O f*< Z en O o ed e_> H W H 13 CNI 1 « M
O H en H 04 O H Q
en <I <J
W H h-i en
.o •H 4-1 a) ex E= o a
co
H-J o
c o
• H 4-1 a 0)
i—!
0) CO
0) .c 4-1
c • H
-a QJ >
i - l O > c • H
00 C
• H
c 0) OJ u o w
4-1 O
to OJ D. S^
H
. en cu co CO
cu o 0 (-4
a
4J
c OJ H 4-1 CO OJ 1-4 4-1
<4-4
0
c o
•r- l
4J CO c •H XI e o CJ
4-1 CO o o
4-1 CO OJ IS 0
t—1
00 •r-l

19
TABLE 1. 1
THE STAGES OF ECONOMIC GROWTH BY GROSS NATIONAL PRODUCT (GNP) PER CAPITA IN SELECTED COUNTRIES
Country GNP Per Capi ta
(1971-1972 $U.S.) Level
H a i t i 93 (underdeveloped)
2. Bolivia
3. Ecuador
4. Honduras
5. Paraguay
6. El Salvador
7. Colombia
8. Guatemala
9. Guyana
10. Dominican Republic
11. Brazil
12. Nicaragua
13. Peru
14. Costa Rica
15. British Honduras
16. Uruguay
17. Mexico
18. Honduras
19. Surinam
20. Chile
21. Panama
22. Tr in idad and Tobago
2 3. Venezuela
2 4. Argentina
25. United S t a t e s
2 34
260
268
273
304
32 8
365
365
404
452
474
493
579
___580
686
717
729
750
796
804
933
1,010
1,138
5,073
I I ( p a r t i a l l y developed)
I I I (semi-advanced)
IV (developed)
SOURCE: U.S., Agency for International Development, Economic Data Book (Washington, D.C.: U.S. Department of State, Statistics and Reports Division, 1973).

20
ultimate objective in development, the essence of the development
process is human development. Modern concepts of development closely
interrelate economic and social activities; they are inseparable and
of equal importance. Social development deais with education, health,
welfare, and public utilities.
Because of the desire to shorten the time needed for development,
as compared to the time taken by countries such as the United States,
Canada, and Australiaj a great deal of attention is being paid to the
selection of the most effective development investments among the many
choices which are possible. The basic criterionj in most cases, is
the economic return to the country concerned, and expenditures for
services such as public health, malaria control, hospitals, and water
resources must compete for priority with numerous other investment
opportunities in fields such as transportation, agriculture, industry,
and education.
In the past, health services have been promoted on the basis of
their social rather than their economic benefits. Recognizing the
current emphasis placed on economic developmentj the World Health
Organization and the Woirid Bank have accepted the impracticability
of financing public health projects on a wide scale based on social
benefits alone. Howeverj there is a serious lack of reliable informa
tion on the relationship between health and economic development.
In accordance with modern theories of economic development, capital
investment in public waste treatment and water supply, like the invest
ments in malaria eradication or public health in general, should be
considered as part of the social-overhead capital needed to develop
and maintain a society.

21
The environment in which one attempts to make a selection of
appropriate technology for water or sewage treatment has been described,
and a methodology based on the systems approach and an aggregate model
suggested. Here, as elsewhere in the material contained in this text,
a need for the diffusion of information and ideas in the LDC's as well
as in-country self-reliance, is suggested and emphasized.

22

CHAPTER 1 1
Technology Transfer, Adaptation, and Utilization
George W. Reid
The technological development process, which was in effect a
revolution, enabled more people to be supported at a higher standard
of l iving. Unfortunately, th i s process did not develop uniformly
throughout the world. Therefore, there came to be tremendous gaps
between different areas. The transfer of technology from developed
countries to less developed countries has shortened the time required
for LDC's to reach more advanced levels of technological development.
However, the d i rec t transplanting of water and wastewater treatment
technology has not led to sa t i s fac tory u t i l i z a t i o n of e i ther foreign or
domestic resources. The approach needed i s an innovative use of known
technology as well as the devising of new technology in order to arr ive
at the simplest and cheapest treatment methods possible while taking
advantage of local manpower, mater ia l s , and socio-economic goals.
23

24
The purpose of this text was to present a method for selecting the
technology suitable for maintaining simple, lower cost water and waste
treatment facilities for small as well as larger communities in devel
oping countries. This involves selection and assembly of the most
useful and pertinent contributions from the world's technical litera
ture on low cost approaches; the obtaining of design criteria, opera
tion requirements, and actual test data; and the assembling of cost
figures on past and current technology for water and waste treatment.
The ultimate objective is to harmonize this material with the human
resources, skills, technology acceptance, as well as the culture,
economics, and other conditions prevailing in representative areas
in Asia, Africa, Latin America, and the Near East.
The key elements of this approach are: (1) systematic evaluation
of the importance and interrelationships of all relevant aspects of
the problem, such as technical, economic, social, political, and
cultural factors; (2) assessment of alternative courses of action;
and (3) analysis of benefits and costs or cost effectiveness on the
basis of which policies can be determined and decisions made. Empha
sis, then, is on obtaining a grasp of the total picture, putting the
pieces together in a practical and usable way, so that international
health organizations, lending agencies, and regional, national, and
local institutions will have a viable planning tool.
For some time now, water has been recognized as a high level
priority for LDC's, and the principal reasons given for past failures
in this area, have involved problems associated with inappropriate
technology. Concentrating on the mechanics of technology transfer

25
(including problems of implementation) should improve the situation
for donor investments in LDC water systems. In order for proper
overall development of a country to take place it is necessary for
that country to have the ability to feed its own people and provide
for social services such as health and education. Pure water is then
a necessary but not a sufficient condition for development. If this
ability to provide for these basic elements is not realized, techno
logical transfer can lead to a type of colonialism.
Technological transfers can be conceived of as going both ways.
For example, DC's are learning more about the use of aqua culture from
experiences in LDC's; however, the major exchange is in the opposite
direction as is shown in Table II.1.
The simple transplant and utilization of developed countries'
technology at developing world sites is seldom the answer, whereas
viable solutions can be provided by the unique application of DC
science to LDC problems, or by an intermediate position, where DC
technology is modified or adapted to LDC countries. The following
diagram (Figure II.1) indicates the way in which these problems and
their solutions can be interrelated with science and technology.
Whereas scientific research is concerned with the increase of
knowledge and understanding and usually results in publication, tech
nology is directed toward application to a new use or user. It may
be a direct application, or there may be a need for adapting or tai
loring. Innovation is initiated not just through the generation of
an idea or invention, but it can also be stimulated by recognition of
a need or technical opportunity. Most successful innovations derive
from need recognition rather than from idea generation or inventions;

26
w • J
o
en u 4J O P. 3 •rl <U 4-1 CJ O CU
OS Q) • 60
CO 4J C 01 o M CU P .
6-S <N
6 ^ r>S s~s m CN
6-S ro .—1
B~S vO
S-5 0 0
6-« 6-S CN *£>
6>S r>« CX) s*« s-s
X )
PS
C/> ^
CU
o
CO cu
CU O 4-> CJ) en <U e
n 0)
X ! 4J
CU CX o u 3
3 O Pn O W
P. CO
T3 0) P. O
•-I <U > CO CU CU
Q -H SH
In 4-1
J* § o
00 Ci CO
• H CU P . - H O U
rH 4J <u e > 5 cu o O U Q O
X I • CU
6C c
• H P-o
1-1 CU
> cu o
o 4.)
>> 6C
o r-4 O C
X ! O
<u H
4 H
O
1-1 <U
<4H CO
Z co • cfl
:=> m
<u X! 4J .
• ^
M r~~ O \ D
4H <J\ t—i
• i
X -CU O CO <-\ CO 3 M
CO CU X i
4-1 B o cu
> >. o 4-> Z ••-1 ^ CO M M IU
> • •H P. C P.
CO CO >-i CU - - - .
H £ CO 4-1 CN
•t *--^ / ~ v
8 O H * CJ 4-1
^ J 4J « C 0
n -H c -a S C O
H D ' H ^ en C
• X I CO <U
w o cu B 1-1 CO P -
X I CO O
C cu x) <—i co co c J>
cu o > . p j U OJ
c cu a CO >, CO _ _ g o xi cu -H •> C 0) i-H 4J CO u ° c -Pn P i CU C
B o • CU P . - H ,
o a o J-1
C -H * « cu cu *-'
S -H > <U co o cu P-x; co Q o i 3 q H J ) T 3 U O X! C ,
4-1 CO O • H
• O X ) O Q CO C
• >. >-< ° O X3 H 4 3 W •u c ,
• • CO O 4H
w ° U « CU Pi w f 3 (U O - H CO 1-1
4J
c 3 O u
o cu c y cu "ri U 4H CU 4-1
u-i O
c _ O CJ o o
oo c
• H p. o
<-i 0)
> cu X I
X I
3 CO
cu • r l r l 4-1
c 3 o CJ
CU CO
o X 4-1
a CU CU
3 4-1
cu X
X I
a « CO CU
• r l M 4J
c 3 o CJ
4-1 CO
• H r H CO
• r l CJ
o Cfl
60 c o fi CO
CO
c o
•H 4-1 CJ CO CO
s 1-1 4J
6 0
a • r l X I 3
r H CJ X w CO
• 4-1
a cu CJ >-i CU P.
t - i
c CO
X 4J
CO CO CU
r H
0) Cfl
cO CJ
>, a CO
c • r l
X I
C CO
CU <-t X •H 60
• H • H 6 0
cu c CU r l CU
s Cfl
cu • r l M 4->
c 3 O
o 6 0 C
• H P . O
r H CU
> 0) X )
4H O
CO 4J
P. •H
. CU Cfl CJ Q) <U
• H P i M X 4-1
a 3 O
o

27
TECHNOLOGY INNOVATION
SCIENCE
RESEARCH, INVENTION OTHER TECHNOLOGY
ENVIRONMENT
PROBLEMS, SOLUTIONS
Fig. II. 1. Interrelationships among science, technology, and problems and solutions in the environment.

that is, innovations come about as a result of demand rather than
simply from the results of scientific research. Thus, environmental
factors can be seen to determine to a large degree the chances for
a success or failure of a particular innovation, and the chances for
successful innovation are greatly enhanced if environmental conditions
conducive to innovation are established.
In addition, there is usually a lag between science or invention,
and subsequent application. As illustration, there is the example
of pasteurization, which was discovered in the 1880's by Pasteur.
It was later applied to prevent the spoilage of wine (France), permit
the export of cheese (Holland) and beer (Germany), and many years later
to prevent bovine tuberculosis (United States). The process of tech
nology development historically has followed a series of "S" curves,
responding to increasing urbanization and resource use. See Figure II.
When applied to the development of water and sewage treatment, the
patterns (greatly abbreviated) would appear as in Figure II.3. Where
new technologies were required, they were developed. Since water is
a reuse commodity, water treatment and wastewater treatment are closely
related. Frequently over the years water treatment has been given
priority over sewage treatment. That is, the filtration and chlorina--
tion of water supplies was thought to be a more certain way to pro
tect public health and also a cheaper way than sewage treatment. With
the enormously increasing water requirements of DC's, methods for
direct reuse have come in for serious consideration.
One other concept should be examined, namely, that of economy
of scale. With economy of scale, the unit cost of a process decreases
with increased size of operation up to the point of diminishing returns

29
L INVENTION 1 INNOVATION J ACCEPTANCE
1 / j DIS
1 1 h.
Time
THIRD APPLICATION
Time
Fig. II.2. Process of technology development.

30
WATER TREATMENT TECHNOLOGY
o
w x) c
0) tn 3
c •u
w
MULTIMEDIA FILTER, SETTLING TUBES, POLYELEC-
TROLYTES
RAPID SAND FILTER (Al, Fe)
SLOW SAND FILTER
Time (Urbanization and Increased Resource Use)
WASTEWATER TREATMENT TECHNOLOGY
0)
CO
0) M a <
o
3 O
CO
c
w
ADVANCED WASTE TREATMENT, REUSE
ACTIVATED SLUDGE, CONTACT STABILIZATION
ROCK FILTERS
INTERMITTENT SAND FILTERS,
LAND APPLICATION,
CESSPOOLS, STRAINERS
Time (Urbanization and Increased Resource Use)
Fig. II.3. Development of water/sewage treatment technology.

31
or marginal r e t u r n , at which time a new p rocess becomes more a p p r o p r i a t e .
An example of the opera t ion of t h i s concept in the area of water t r e a t
ment may be seen in Figure I I . 4 . In achieving economies of s c a l e in
DC's, i nc r ea s ing amounts of r e s o u r c e s , energy , and popula t ion have been
brought toge the r .
Increased u rban iza t ion and i n d u s t r i a l i z a t i o n , whether in LDC's
or DC's, can be expected to e l i c i t new and responsive t e c h n o l o g i e s ,
even though they cannot be s p e c i f i c a l l y p r e d i c t e d in a l l i n s t a n c e s .
As a s o c i e t y develops and passes through the p rog res s ive s t ages
of hunt ing and f i s h i n g , s u b s i s t e n c e a g r i c u l t u r e , manufactur ing,
mass p roduc t ion , and post-mass p r o d u c t i o n , a l t e r a t i o n s occur in i t s
r e l i g i o u s , governmental , and o the r human o r g a n i z a t i o n s , as we l l as in
i t s u t i l i z a t i o n of energy , food, w a t e r , and technology. Evidence i n d i
ca tes t h a t a technology which i s a p p r o p r i a t e for c e r t a i n l e v e l s of
development of a p a r t i c u l a r s o c i e t y , may a l s o be found app rop r i a t e
for o ther s o c i e t i e s a t comparable l e v e l s of development.
The i n d u s t r i a l t echnolog ies in use in developed coun t r i e s have
been designed to s u i t t h e i r c o n d i t i o n s , t h a t i s , h igh -cos t s k i l l e d
l abor , adequate supp l i e s of c a p i t a l and of t e c h n i c a l and manager ia l
s k i l l s , r e l a t i v e l y l a rge high-income marke t s , and v i r t u a l f u l l employ
ment. Large markets in the DC's o f fe r o p p o r t u n i t i e s to take advantage
of economies of s c a l e , and t h e r e i s s t rong p r e s s u r e to economize on
labor as a means to inc reased p r o d u c t i v i t y . In LDC's the s i t u a t i o n
i s very d i f f e r e n t . Cap i t a l and s k i l l e d labor are in l im i t ed supply.
Often the re i s an abundance of u n s k i l l e d labor and a high l e v e l of
unemployment and under-employment. Domestic markets in LDC's tend
to be smal l with low purchas ing power. Without we l l developed i n t e r n a l

32
SLOW SAND FILTER
RAPID SAND FILTER
MULTIMEDIA/ MULTIDECK UNITS
Size of Operation
Fig. II.4. The effect of economy of scale in water treatment.

33
or external markets, these countries cannot normally take full advantage
of economies of scale. The best use of resources in LDC's requires
the development of both efficient capital-saving and efficient labor-
intensive techniques. This is essential if capital is to be used more
effectively and if the labor force is to be given useful employment.
In changing from their traditional methods, developing countries
often have to use the immediately available technologies, even when they
are unsuited to their economic and social conditions. This occurs
because they might otherwise forego important development opportunities
when they lack the capability (skills or infrastructure) for devising
an indigenous technology or for appropriately adapting one from foreign
sources. In response to such situations direct technology transfers
have been suggested which include training programs. An example would
be the installation of a high technology plant accompanied by the
training of local manpower in its operation. In such a case, the prob
lem of retention of trained operators arises. For example, a person
trained as a water chemist might not remain with the water plant because
of an in-country shortage of chemists and the possibility of a larger
salary elsewhere. When technically trained people are in short supply,
industry, not government, gets first choice. Thus, this system has a
"leak." This problem can be resolved as the educational level pro
gresses to a point where skilled personnel such as the water chemist
become more generally available. It is possible, also, that a process
requiring technicians or engineers will require that both wages and
training be augmented. In Figure II. 5, the availability of in-country
technicians is shown to rise from a position of deficit to a position
of surplus, with the passage of time.

34
TIME NEEDED TO ACQUIRE • * • ^
OPERATION SUPPORT
SURPLUS
DEFICIT
:(-) t(0)
Time
:(+)
Fig. I I . 5 i Change in ava i l ab i l i t y of in-country technicians with time.

35
If a process i s only s l i g h t l y advanced beyond the LDC's cu r r en t
c a p a b i l i t y for maintenance and o p e r a t i o n , these funct ions could be
e x t e r n a l l y supported for a pe r iod of t ime. Unfor tuna te ly , the problem
i s more e x t e n s i v e , i nc lud ing the e n t i r e web of support m a t e r i a l s and
p a r t s . Most f a i l u r e s in t r a n s f e r are a c c r e d i t e d to shor t ages in opera
t ion and maintenance and the u n a v a i l a b i l i t y of reasonably p r i c ed spare
p a r t s . LDC's f requen t ly seek a s s i s t a n c e in the form of pe r sonne l and
p a r t s for maintenance and o p e r a t i o n ; however, t h i s does no t lead to
s e l f s u f f i c i e n c y .
In e a r l y s t ages of development t he re i s a need to r e l y almost
e n t i r e l y on imported t e c h n o l o g i e s , with l o c a l e f f o r t s concent ra ted
on adap ta t ion to s u i t l o c a l c o n d i t i o n s , r e s o u r c e s , labor s k i l l s , and
s o c i a l i n s t i t u t i o n s . Manufacturers w i l l g e n e r a l l y expect a p r o f i t
from t h e i r technology i f i t i s s u c c e s s f u l l y adapted, and the re are
r e a l problems of r i g h t s and p a t e n t s to be reso lved as t r a n s f e r s a re
accomplished. The donor does s tand to r i s k the loss of marke ts . As
development p roceeds , l o c a l r e sources can be. i n c r e a s i n g l y a l l o c a t e d
to resea rch and development (R and D) and l o c a l manufacture, and depen
dence on imported technology can be reduced. DC's expend cons iderab ly
more money on research than LDC's, 100 to 1000 times as much, bu t a t
any s tage i t would be was te fu l to apply seve re ly l imi t ed re sources to
r e inven t ing technolog ies a l r eady in e x i s t e n c e and a v a i l a b l e through
copying or l i c e n s i n g . Imported technology and l o c a l R and D are no t
a l t e r n a t i v e p o l i c i e s ; they must complement each o the r .
The words hard and s o f t are used to d i s t i n g u i s h d i f f e r e n t types
of technology. Hard technology r e f e r s to forms which a re expens ive ,

36
c a p i t a l - i n t e n s i v e , complex, not r e a d i l y adap tab le to m a t e r i a l s o the r
than h igh ly p r e c i s e s t andard ized ones . In c o n t r a s t , a technology i s
c a l l e d s o f t when i t i s r e l a t i v e l y inexpensive and l a b o r - i n t e n s i v e ,
f l e x i b l e and adaptable to l o c a l m a t e r i a l s of non-s tandard q u a l i t y .
I t can be i n s t a l l e d , r e p a i r e d , and mainta ined by people of modest
t e c h n i c a l t r a i n i n g . The concepts of low, h i g h , or i n t e rmed ia t e t e ch
nology are a l so used. In any system of concep t s , the problem i s in
the s e l e c t i o n of a compatible or a p p r o p r i a t e technology. In an LDC
t h i s could mean a technology on any l e v e l , i n c l u d i n g a t times a hard
or high technology. On the o the r hand, so f t as w e l l as i n t e rmed ia t e
or low techno log ies are f requent ly the most a p p r o p r i a t e . Considering
choices of technology, Schumacher has s a i d t h a t " f o r developing coun
t r i e s t he re i s , on the one hand, a very low l e v e l of technology which
does no t keep people going except in r e l a t i v e mise ry , and, on the
o t h e r , the r i c h man's h i g h - l e v e l technology which i s ou t s ide t h e i r
r e a c h . " (36) This s ta tement re-emphasizes the importance of f inding
a l t e r n a t i v e , compatible and app rop r i a t e t echno log ie s for these s i t u a
t i o n s , and i n t e rmed ia t e technology i s often the answer.
The main o b s t a c l e s to a p p l i c a t i o n of a new technology are econo
mic and s o c i a l , inc lud ing educa t i on , communications, a c c e p t a b i l i t y of
new i d e a s , a d m i n i s t r a t i v e e f f e c t i v e n e s s , bus ines s e n t e r p r i s e , and
p o l i t i c a l l e a d e r s h i p . The c l i e n t / e n g i n e e r / b a n k i n t e r f a c e i s an impor
t a n t problem in implementat ion. Soc ia l and c u l t u r a l t r a d i t i o n s are
of ten p o s i t i v e b a r r i e r s to change. In g e n e r a l , t e c h n o l o g i c a l t r a n s f e r
and d i f fu s ion i s a c u l t u r a l , s o c i a l , and p o l i t i c a l p r o c e s s , and not
j u s t the i m i t a t i o n of manufactures. Given the i nhe ren t d i f f i c u l t i e s ,

37
transfer and diffusion cannot be expected as a spontaneous process,
but require institutionalized channels of action.
Technical change affects the way men make a living, their social
habits, their entire way of life, and it is inevitably disruptive of
established attitudes and practices. All societies have some built-in
resistance to change and a strong inclination to maintain the status
quo. The capacity of a society to assimilate new technology depends
on both its capacity to adapt the technology to its own conditions
and its capacity to adapt itself to the needs of technology. Some
technologies are readily accepted, but others may require a massive
education program. It has been observed by sanitary engineers for
several decades, that water plant designs based on current DC practice
which do not take into account local conditions are doomed to failure.
The formulation of water resources strategies requires a full
knowledge and close personal contact with the basic facts, traditions,
and goals of the overall social and economic development of the region.
It is also an endless iterative process in which continuity may be
maintained only through a reasonable stability in the top leadership.
All this suggests that the most important criteria for policy for
mulation should stem from experts native to the region, whose personal
judgement and knowledge can benefit from the experiences of regions
more chronologically advanced (through studies, visits and personal
contacts prior to and during their term of service). Decisions on
basic questions of water resources policy should be based on a well
balanced consideration of many elements covering almost all sectors
of the region's economic structure. Inputs should be made from the
advances in many different fields of science and technology. When

38
i t i s d i f f i cu l t to include spec i a l i s t s in the decision process,
consultation should be carried out u t i l i z i n g input from experts having
broad or ienta t ions in water resource problems.
There i s an advantage for LDC's in using technology which has
been developed and used in DC's for a suff icient period of time so
that soc ie ta l impacts wi l l have matured and been observed, and this
type of technology use has a retrospect ive aspect. As the process
continues, ba r r i e r s which may have contributed to fa i lures wi l l be
reduced by the development of centers of applied research, informa
tion systems, and in-depth local exper t i se .
The rapidly changing pat terns of water use, and more par t icu lar ly
i t s increased use for waste disposal , indicate that man i s currently
in a t r ans i t ion phase from the days of assumed water plenty to the
time in the immediate future when the use of water wi l l be governed by
much greater care and efficiency. Although subsidies from local ,
regional , or nat ional budgets for certain water uses wi l l certainly
remain s igni f icant features of water resources p o l i c i e s , there should
be an increasing awareness and adaptation to the fact that the e f f i
cient use and ra t ional conservation of water resources may be achieved
only through an economically oriented approach.
A clear d i f ferent ia t ion between t o t a l annual cost and revenue
should frequently lead to changed ra te pat terns , and to an increased J
role for economic incentives. The expert ise of economists with overal l
experience in na tura l resources management may great ly f a c i l i t a t e
the assessment of the actual and po ten t i a l role of economic incentives
in water resources development and management.

CHAPTER 1 1 1
Prediction Methodology for Selection of Suitable Water
and Wastewater Processes
The three sections Included in this chapter are shortened and
revised versions of the original publications which they represent.
In them is presented an ordered method of selecting the most appro
priate technology for water and wastewater treatment for a particular
site and at a particular time, according to the material and manpower
resource capabilities available. The primary concern is drinking water
and wastewater for organized communities, including those for which
management systems for on-site processes would be appropriate.
In the first section explanation is made of the selection metho
dology which involves the systems approach and aggregate modelling.
The systems approach permits the analyst to look at various interrela
tionships and decision options at one time while aggregate modelling
uses average values for attributes of the real-life situation under
study. The attributes for LDC modelling must be representative and
39

40
must be based on available data on the LDC site either obtained directly
of through the aid of a surrogate.
The output of the model displays compatible water supply and
sewerage treatment alternatives for a specified community in the base
year and at the end of each of four increments of five years. For
the alternatives provided, information is given on capital and mainte
nance costsj manpower requirements, the population to be served, and
the plant scale which would be required.
In the second section of this chapter, data forms are included
which were designed to use in collecting the basic information needed
for the use of the predictive model, while the third section pro
vides a manual computation application of the model together with an
example problem which has been worked out step by step. This manual
method will suffice in most instances, although a computerized version
has been developed.

41
III.l.
PREDICTION METHODOLOGY FOR SUITABLE WATER AND WASTEWATER PROCESSES
George W. Reid and Richard Discenza
The University of Oklahoma developed a predictive model to help
planners select suitable water and wastewater treatment processes appro
priate to the material and manpower resource capabilities of particular
countries at particular times. This technique will eliminate the problem
of overlooking good processes for water and wastewater treatment. Pre
sently the model is limited to evaluating the plausible treatment methods
for a single community. However, it can be easily modified to provide
cost information on a regional basis. Through the use of this computer
ized model, a large amount of data/information can be processed quickly,
and the resultant output will display the consequences of all the various
actions including all relevant costs. Such a display will, in most cases,
enhance the design engineer's professional judgement. For those planners
who do not have access to a computer capable of executing the model, a
manual approach was developed.
The initial form of the model was validated in-house and in the
field. The in-house validation included:
1. comparison of model outputs with data from existing treatment
facilities in developing countries; /
—_— ,
Norman: The University of Oklahoma Bureau of Water and Environmental Resources Research, October 1975. (80 pp.)

42
2. identification of user application problems (users such as
consultants, planners, and bankers);
3. inclusion of new interpretive/adaptive technology and state-
of-the-art information to broaden the available treatment pro
cesses and levels of applicability.
The field validation work consisted of model runs by selected users to
ascertain that the appropriate data could be obtained to run the model.
The primary objective of this phase of the validation process was to
ensure that input data requirements could be met in various developing
country situations where substantial national and/or local environmental,
economic, or social data are not generally available.
This model was originally presented in a United States Agency for
International Development publication and a World Health Organization
publication (2,3), and a sample computer printout was included. In
addition, a listing of the computer program was presented in a supple
mentary USAID publication (4). Experience has shown that documentation
beyond the logic diagram is not useful due to the variety of computer
equipment that is available to prospective users. Therefore, this pub
lication includes the logic diagram together with the step-by-step pro
cedure presented in manual form. An understanding of these items will
enable any programmer to proceed to tailor a program suited to particu
lar equipment needs. Actually, the support tables and calculations are
quite simple, and the manual procedure should suffice for most purposes.
METHODOLOGY '
Figure III.I.I is an overall view of the proposed planning model
data flow for the' selection of a combination of processes. This metho-

SlSl
III
43
li!
ri^:
3:?! 3 : z
s s-s
2h?l'-!
Bl
! ,
J^iiLyHiih^tnf
s iSPlPSS^PifJpiSPsf SIS J 3 5 !
O E- 3: U 3
•I. l is!
Hiiiiii
" T O c « '
IIP
iii! o v. Si!
— c. •<
c o •H u « c
•H a o a
<u 1-1
cu co o •u I-I a>
-a o e <u
XI • u
>-i o
H-l
s o H M-l
c O •H 4-> 0)
e o
14-1
c •H
OJ 4-1 OJ
.-1
it o o
• CO cu CO CO cu a o ^ Q.
4J
(3 CU S 4-1 CO cu (-1 4-1
u cu 4-1 TO
> cu 4-1 CO CO
3 T )
s CO
M cu 4J CO U
14-1
O
00 •rl

44
dology uses eighteen inputs that describe socio-economic conditions,
thirty-one inputs in five main categories that describe the indigenous
resources, two inputs that describe the demographic profile, and three
inputs that describe the raw water quality. This constitutes the raw
data. The method used to assure the appropriate process selection takes
two categories of raw data (socio-economic and indigenous resources)
and reduces them through a weighting process to four socio-technological
levels and five resource capability categories which are used with a
matrix of process constraints (in terms of manpower and material require
ments) in order to screen for acceptable alternative processes for future
consideration. The model identifies basic individual treatment processes.
In practice, however, basic treatment processes are frequently utilized
in varying combinations, depending on the conditions of the raw water
to be treated or on the condition of the received waste streams.
The individual processes determined acceptable by the model are thus used
to set up combinations of processes.
The limitation on combinations, in the case of water, relates to
initial raw water quality, and the screened combinations are designed
to provide acceptable groups or sequences of treatments which will bring
a raw water to a potable level. For wastewater, the limitation on the
combinations relates to effluent dilution available, which is expressed
either as a ratio of receiving water volume to waste volume, or alterna
tively as a ratio of CFS/1000PE (i.e., cubic feet per second of receiving
water flow/waste load equivalent to that produced by 1000 people in one
day). The constraints are subject to alterations; that is, various coun-

45
t r i e s may e lec t various levels of qual i ty . The levels used for th is
study were based on current in te rna t iona l l eve ls . As an LDC develops,
tnore a t t r ibu tes wi l l be monitored, and the allowable values of each
a t t r ibu te wi l l decrease. See Figure I I I . 1 . 2 .
Next, the processes involved in the sui table combinations are
located in terms of size of population group to be served or sca le , and
in terms of socio-technological l eve l s , and a matrix of cap i ta l cos ts ,
operation and maintenance cos ts , and manpower requirements i s applied.
This matrix i s developed by empirical analysis of data from more devel
oped regions, regression analysis of regional or nat ional data from
developing countr ies , or rea l en t r ies of local data. The f ina l step in
the model wi l l provide the least cost process combination, in terms of
t o t a l cost or in terms of maintenance cos t s , as desired. A stepwise,
block-by-block characterization of the model process follows.
Block one—social-technological factors (STF). These inputs are
defined as the sum of socio-cul tura l and socio-economic factors relevant
to the model that are essen t ia l pa r t s of any community or group of people.
The variables were selected on the basis of the ava i l ab i l i t y of related
data at the local level and thei r a b i l i t y to ref lec t the level of devel
opment at the community level . The charac te r i s t i c s of the eighteen v a r i
ables used are br ief ly described below:
1. Five broad levels of education are specif ied: none, primary,
high school, technical i n s t i t u t e , and college. The economically
more developed communities generally provide opportunities for
higher levels of educational attainment.

46
Constituents to be Removed in Water Treatment
> o e QS
V4-I
o en to <u
C O)
•H > to o n) -H <u u u u o w C QJ
Constituents to be Removed in Wastewater Treatment
CARCINOGENICS
VIRUSES
ORGANICS
'CHEMICALS, TOXICANTS
'SOLIDS (TOTAL DISSOLVED SOLIDS)
HARDNESS, TASTE, AND ODOR
BACTERIA
Increase in Socio-Economic Level
BIODEGRADABLE MATERIAL (BOD)
Increase in Socio-Economic Level
Fig. III.1.2. Conceptual representation of socio-economic development bringing additional treatment parameters and more restrictive levels of control.

47
2. Distribution of the labor force is expressed in terms of the
percentage of professional, skilled, and unskilled workers who
are in some way connected with the market economy. In a sub
sistence economy, only a very small portion of the total popula
tion is engaged in market activities. At the advanced level
of development, a large percentage of the total population is
active in the market, and these workers have expertise levels
equivalent to the professional and skilled categories.
3. Income characteristics generally reflect the level of develop
ment. A larger per-capita income generally denotes higher
levels of development.
4. The percentage of non-indigenous workers in government and in
industry is also used as an indicator of development. Low
levels of development generally require that the majority of
skilled and professional jobs be held by non-indigenous workers.
5-9. These variables relate to the investment that a community has
in the education of its youth. When schools are operated by
voluntary agencies or missionary organizations, the level of
development of the community tends to be at a low level.
Increases in the standard of living tend to bring compulsory
education to at least the primary level. The general accessi
bility of schools to a community is an indicator of the level
of development, and generally, the higher the grade offered,
the higher the level of development.
10. In-service training programs are generally not available in

less developed areas. These programs often become more avail
able as the need for higher skills and more expertise in tech
nical areas is required in the community. These in-service
programs may be offered through agricultural extension and
community development programs.
The availability of a college chemistry department gives some
indication of the technical expertise available in the community.
It also provides a potential place for the testing of water
quality characteristics. The availability of a college or
university education indicates a high level of development.
The community fiscal level relates to the ability of a community
to meet the needs of improved water and sewage treatment by pro
viding for some, if not all, of the funds required for these
improvements. The response to this question is not used in
computing the STL. If response (2) is indicated then a lowest
maintenance cost alternative will be sought by the model. (See
"Data Requirements," III.2, below.)
Rampant unemployment is characteristic of communities at a
low level of development, and the bulk of those unemployed
will be unskilled workers. Generally, the unemployment prob
lem decreases as the level of development increases.
Agricultural extension services tend to improve as the level
of development increases. The main hurdle at lower levels
of development is that the appropriate organizational and
institutional structures lack the means to implement and admin
ister extension services.

49
16. If most or all of Che college students receive their higher
(third level) education in neighboring communities or abroad,
this indicates that the community is at a lower level of develop
ment.
17. The level of technology available is a generalized data variable
that calls on the experience of the planner. It simply asks
what level of development is available as signified by four
general categories of technology: hand tools, mechanical
tools (e.g., gasoline-powered equipment), chemical products
(e.g., use of fertilizers and/or chlorine), and electronic
technology.
18. The government's role in the labor market also gives an indi
cation of the level of development. At low levels of develop
ment, the local government tends to be the major employer.
As development increases, employment in private or non-govern
mental-related activities tends to increase.
19. Public employment services are generally only available at
high levels of development.
Block two—indigenous resources (IR). The second group of raw
data inputs is concerned with the indigenous resources (IR) available
within the community. Data about the local resources and the present
technology available for a community is based on the variables shown
below. The list is made up of supplies and materials needed for the
operation of a wide variety of water and wastewater treatment systems.
The availability of these items is matched, within the model, against

50
the requirements of the various processes. Those processes which require
materials or resources not locally available are eliminated from the
plausible treatment alternatives suggested by the model. The data input
variables related to these local resources and materials include:
1. operation equipment
a. water meters
b. soldering equipment
c. acetylene torches
d. recording devices (e.g., thermostats)
e. laboratory equipment (e.g., test tubes)
f. portable power plants (e.g., portable gasoline-powered
electric generators)
g. motors (e.g., one to three horsepower electric motors)
h. water pumps
2. process materials
a. pipe (clay, steel, cement, plastic, copper, etc.)
b. pipe fittings
c. paint
d. valves
e. tanks
f. vacuum gauges
g. heat exchangers
3. maintenance supplies
a. silica sand
b. graded gravel

51
c. clean water
d. gasoline
4. chemical supplies
a. AI2(80^)3 (aluminum sulphate)
b. FeCl3 (ferric chloride)
c. char (activated charcoal)
d. CaO (lime)
e. Na?C03 (sodium carbonate)
f. Cl2 (chlorine)
g. O3 (ozone)
h. laboratory chemicals (e.g., litmus paper)
5. water source
a. river or stream
b. lake or impoundment
c. wells (is groundwater available?)
d. sea or brackish source.
Block three—demographic data (DP). These two types of inputs to
the model were designed to include that demographic information which
was most readily available. They include figures on the present popu
lation and the average growth rate. Two different population parameters
can be specified in the input data, one for water and a second for
wastewater.
Block four—raw water quality. The fourth and final group of
inputs consists of the results of tests performed on the raw water:

52
1. The presence of the coliform group of bacteria in terms of
most probable number per 100 milliliters (MPN/100 ml).
2. The measurements of turbidity, hardness, iron and manganese,
and total dissolved solids (TDS).
3. The receiving water dilutions available as specified, if possi
ble, by the biochemical oxygen demand (B0D--5 day, 20 C) con
tent of the wastewater.
Hopefully, these data would be currently available for the site; if
not, then national, regional, or similar data could substituted.
Block five—relative social-economic weighting factors (Wgl-) .
The data inputs identified in Block One are weighted (see Table III.l.).
For example, educational attainment is a good indicator of development
and has been given greater weight than the distance to the nearest
high school, since the distance may not be important if the community
has a good transportation system. The weighting process is flexible
and can be modified to satisfy the requirements of local conditions.
Block six—relative indigenous resource weighting factors (W-jr.
Block Six depicts the grouping process designed to determine if a group
of related indigenous resources is available (see Block Two). The
basic assumption underlying this grouping is that the items listed in
the data sheet are only representive. If the majority of these items
were designated as available, then the group (e.g., chemicals) would
be considered generally available in the community under consideration.
(Majority here means seventy percent, and this judgment value can be
altered as needed.)

53
TABLE III.1.1
WEIGHTING FACTORS FOR SOCIAL-TECHNOLOGICAL LEVEL DETERMINATION FOR COMMUNITIES
IN LESS DEVELOPED COUNTRIES
Description of Variable
Data Form Part III, Questions No. 1-19
Possible Choices
1 2 3 4
1 2 3 4
1 2 3 4 5
1 2 3 4 5 •
1 2
0 1 - 6 7-10 11 - 12 12+
1 2 3 4
1 2
Weighting Factor
0 5 10 15
0 5 10 15
0 4 8 12 15
4 3 2 1 0
0 5
0 2 4 7 10
3 2 1 0
5 0
Level of Education
Distribution of Labor Force
Income Characteristics
Percent Non-Indigenous Workers in Government and Industry
School Operators
Highest Grade Offered by Local School
Distance to Nearest High School
Availability of Technical and Vocational Training

54
TABLE III. 1.1—Continued
Description of Variable
Data Form Part III, Questions, No. 1-19
Possible Choices
Weighting Factor
Compulsory Primary Education 10 0
Availability of In-service Training Programs
Local College or University
10
11
1 2
1 2
5 0
10 0
Chemistry in Local College 12 3 0
Unemployment Level 14' 0 5
Availability of Extension Services 15 3 0
Schools of Local College Students 16 0 3
Level of Technology Available 17 1 2 3 4
0 5 10 15
Government as a Labor User 18 0 5
Availability of Public Employment Services
19
SQuestion no. 13 is not used in computing the STL.

55
Block seven—social-technological level (STL). The values of the
weighting factors from Block One are totaled, and a socio-technological
level is assigned according to the following weight schedule:
Socio-Technological Level (STL) Range for Total of Weighting Factors.
1 1-23 2 24-51 3 51-93
4 93-133.
Block Seven determines the manpower availability in three skill
categories, based on the socio-technological level established for the
community. The occupations required on water and sewage treatment pro
grams in the post-construction stage fall into the following categories:
A. professional
B. skilled and craftsmen
C. unskilled and semiskilled.
The main emphasis of the scheme is on operating personnel, as opposed
to construction personnel, since investigation to this point has indi
cated that failure of a project due to lack of personnel almost always
occurs during operation and maintenance rather than during construction.
The decision rules developed for the model, provide the following man
power constraints for each of the four social-technological levels:
1. In Level I communities only unskilled or semiskilled manpower
is available (Category C only).
2. In Level II communities and in Level III communities with
populations under 50,000 only unskilled and some skilled labor
is available (Categories C and B only).
3. In Level III communities with populations over 50,000 and in

56
Level IV communities, all categories of manpower are avail
able (Categories A, B, and C).
The model will ensure that the treatment method selected can be
maintained with workers from the local manpower supply. This is as
opposed to instruction or special training of personnel which of course
is an alternative. The purpose of this is to avoid the manpower prob
lems which arise from the installation of processes without regard to
the availability of local manpower to repair and maintain the treatment
operation.
Block eight—resource capability (RC). Any number or all five of
the resource groups can be available to a community.
Block nine—population forecasting (POP). The first portion of the
population submodel makes forecasts for the total population of the
community under study for each five-year planning interval. The routine
is in a loop so that it is used repeatedly. The model that determines
the population is very simple; the inputs used are the present popula
tion and the annual population growth rate. Although this simple model
does not take into account other factors that have an effect on the
population of a community, it should give a close approximation of the
population if the change is at a fairly constant rate. Population
changes are highly contingent on the rates of change in the industrial
and commercial institutions of a community. If the average growth rate
is not expected to vary appreciably during the time period being forecasted
the method should give a good approximation of the so-called "norm"
of the community. This "norm" will be what the area would look like
if "nobody tinkered with the works."

57
Blocks ten and eleven—process constraints; available processes.
The next step carried out by the model is the selection or screening
of feasible processes, based on the STL and the RC of the community, as
well as individual process constraints. (See Table III.1.2.) Processes
that are too sophisticated or those requiring resources not available
within the community are eliminated from further consideration. There
may be cases where all the processes will be eliminated, and there will
be no feasible combinations reported by the model.
Block twelve—schedule of acceptable combinations to bring the raw
water to the desired quality. Table III.1.3 and Figure III.1.3 show
the various combinations of basic processes that are frequently used
depending on the conditions of the raw water to be treated or on the
degree of dilution available to waste flows. On-site sewerless pro
cesses are competitive for all four population classification levels,
as shown in Table IX.1.33.
Block thirteen—suitable combinations. This block represents a
critical decision point in the model. At this point, the array of pro
cess combinations presented in Block Twelve are matched or screened
against the individual processes that have been selected as feasible
according to the socio-technical level and the indigenous resource capa
bility of the community under study. The results of this decision
analysis give a list of one or more combinations of processes that can
be considered plausible for the community. The screened combinations
provide a sequence of treatments for raw water that bring it to a potable
level. For wastewater, the screened combinations are based on the
effluent dilution available, which is expressed as a ratio.

TABLE III.1.2
PROCESS CONSTRAINTS-WATER AND SEWAGE TREATMENT PROCESSES WITH
ESSENTIAL MANPOWER AND RESOURCES REQUIRED FOR OPERATION
N. Process >. Requirements
Treatment ^v Methods ^v
No Treatment
Pre-Treatment
Slow Sand Filtration
Rapid Sand Filter—Conven-<}> tional
01
g Rapid Sand Filter—Advanced
t. Softening
4->
jg Disinfection
Taste, Odor—Fe, Mn
Desalting—Salt
Desalting—Brackish
Containment Filter
Primary—Convent ional
0)
™ Primary—Stabilization Pond y
g Sludge—Conventional
2 Sludge-Advanced in
5 3 Sludge-Combined (Imhoff)
Process
Number
PW1
PW2
PW3
PW4
PW5
PW6
PW7
PW8
PW9
PW10
PWlla
PS1
PS2
PS3
PS4
PS5
Manpower
Unskilled
Skilled
Professional
X
X
X
X X
X X
X X
X
X.
X X
X X
X
X
X
X X
X X
X
Resources Required
Operation
Equipment
Process Materials
Maintenance
Supplies
Chemical Supplies
Water Source
(Groundwater
Availability)
X X
X
X
X X X X
X X X X
X X X X
X X X X
X X X X
X X X X
X X X X
X
X X X
X X X X
X X

39
TABLE III. 1.2—Continued
CO
:esse
Proc
Waste
s. P rocess ^ v Requirements
Treatment \ ^ Methods ^ v
Secondary—Standard F i l t e r
Secondary—High Rate F i l t e r
Secondary—Act iva ted Sludge
Secondary—Extended A e r a t i o n
D i s i n f e c t i o n
Aqua C u l t u r e
D i l u t i o n
I n d i v i d u a l
I n d i v i d u a l (Advanced)
Ul Ul U 0) 01
o xs o £ >-i 3 ex, z
PS6
PS7
PS8
PS9
PS10
P S l l a
PS12 a
PS13 a
PS14a
Manpower
•a 01
i-H tH •H J4 1/1
c 3
X
X
X
X
X
X
X
•o CI
f-l rH •H X C/3
X
X
X
X
X
X
CO
c o •H CO
co cu U-l
o u cu
X
X
Re
C 4J
o c •H CU 4-> 6
co a V< - H 01 3
c cr o w
X
X
X
X
X
X
sources Req
aterials
X a en 0)
u 0
u a.
X
X
X
(11 a c CO Ul
c ai HI *H 4J r-4
c a •H a. Z co
X
X
X
X
X
ui red
Supplies
. - i CO
o •H E: 01
a u
X
11 t - >s O 01 4J IJ 4-1 vH 3 CO I - I
Q 3 -H
ui -a J C CO
u 3 •-) •U O -i-i <-i >i to CO CJ >
3 -^ <:
X
X
aPWll and PS11, .12, 13, and 14 are listed for completeness here and elsewhere in this publication. These processes could easily be incorporated in the model, although they were not so included for this study.

6Q
w .-3 pq < H
H Q
41 -H
O 6
en
o to
•O J3
XI 1
a eg B o u o
*M 0) O
•a
CO c o o 09 -H Q) iJ U eg o c
(X £> B
ll §3
3 ^
41
o c eg o 4i a w en c <a Q
•C3 41 E-< E-« u tu <D o O x en o o
_ ° ° O I en cs o en - * A A
o o o o o o o o o —' — O O O O O O O
—< 00 00 *-* O •* O
C N O O O O O O O O o o o o o o o o
I « - . e n e n o O O O
— • » eN en eN en
« 00
? * OH P M
+ + CO CO 3 3
3 a. 3 — - • P. 3 3
+ *w y-i
3 a. en 3
r <r e^ u"t 3 3 3 3 P H 0-i D M PM
+ + + + *H—»cncN—i-4-cNimc- l 3 3 3 3 3 3 3 3 3 r i « 4 t P 4 B 4 c i , a 1 0 4 C H a <
01 4) c c o o
>% >> c c
3 3 a, a. + + 3 3
rtNe*l^T^vOf,*00O>-^'HM-H 3 3 3 3 3 3 3 3 3 3 3 3 3
1N3WXV3HX a a i v n
X I
u p» o o o w
*_ w \u u
-» i
en u 0
o e\!
O
es
CN
1
i n
-« u o
o
CM
• • 4
1
e j \
O
Vi o
*o
o • o
1
m
-» o u o
en
CM
• "-1
C7>
o u o
vO
• H
1
U 1 f^.
d 14
o
m
0 0
• o 1
•o
o u o
-»
<r •
o
i
en
o I * 0
< N
41 - H £t eg CN u
O . t / 1 O . • CO r H
* J U 0 0
o
>o • *~*
0 0 1
1 C M
>£> —
1 - U 0 O
O CO
^r
CO CO vO W vO N 0 0 Cu a . to cu co co co
a» DM CU P-+ +
+ + + + +
w w c n H W f g n c > j
Q .-v —. tu en oo a . eo
/—* eo en
u O 41 u u
eo - • *
>M 3 O 0
x: 4) u C -H O 3 >* — C M
CO Crt C/3 1/3 c/3 \JI u} i/j « UJ CN r j r-j 13 in VJ i/j c u C M P M C / 3 C u c n c n c / i x ^ 0 M ( i ) P - t
O ^ CM en ^ r j r i s t i n v o ^ c o c A - H ^ F - - . W C O C / l O T C / J C A t n c n c / l C / j C n c O C / }
IN3WIV3SI H0VM3S
I eg
r-4 3 a. o a
CD " 0
•* -e 0 a
T3 4t
> • H O <a a
• H
•o
4 i j
o
a d « ^
0 1 Q H a
4) i - t
a) > T\
3 tr 41 •
: • . C co 0 "O
•r t ~ ~ w O eg O
^H pa 3 O . • o u Q . X 1
.-( o o >~-o <-t
— o 41 4J CO
eg eo u
C 9 4) O J «
W CO U-l "
M X 4) * H »J - H eg eg
f 1 oa o 3 C
• H
> -• H ^ 41 eg
o -a 41 hi hi
41 * M O* O
c •a o e u U 41 4) a. at
4) u c 41 0 a.
0 4 J U 4) 4) 4J
<W C 41
O r H T4 CO J3 > 3 - H O 3
cr CO 41 CO
41 T J *-» 41 U) C CO
• H 3 I M 4) CO •a
to CO - H
• H i J
« c • H CU
S - 1
3 co > 01 <H JS 3 H cr
j 3 41
B 0

61
WATER TREATMENT
•NONE
•BASIC•
-AUXILIARY-
-SEDIMENTATION
_SLOW SAND "FILTRATION
_RAPID SAND FILTER, DISINFECTION
i—SOFTENING
TASTE, ODOR, COLOR
•DESALTING
Raw Water Coliform Level (MPN/100 ml)a
1 - 2
100
2000
WASTEWATER TREATMENT
•ON-SITE-
•IN-TRANSITb
•OFF-SITE'
LAND APPLICATION
— GROUND INJECTION
SEWERLESS UNITS
1—AQUA CULTURE
DILUTION
N POND
•—DILUTION
1 STABILIZATION
AND DILUTION*
I— PRIMARY
- CHEMICAL
PRIMARY AND 'SECONDARY
DISINFECTION
-TERTIARY
Receiving Water Volume (7-Day Low Flow Level)/ Waste Volume3
40/1
8/1
20/1 - 10/1
10/1
6/1
2/1
(for reuse)
aTraditional standards of coliform concentrations and available dilution ratios.
"Can be applied in-stream or in-sewer.
Fig. III. 1.3. Water and sewage treatment
classification/decision tree.

62
Block, fourteen—schedule of cost. Since U.S. data are readily
available, empirical methods used in calculating costs of treatment
facilities in developing countries are based on U.S. costs. This was
accomplished for each particular process, by breaking down operation
and maintenance costs and construction costs into basic components,
i.e., labor and material. Coefficients for a cost transfer equation
are produced from socio-economic data collected for developing areas.
Manpower requirements are obtained from U.S. data according to
social-technological level and population scale level. Regression
analysis and local data are also used to create the cost matrix. (See
Chapter IV below).
Block fifteen—cost. Construction and operation and maintenance
costs as well as manpower requirements are estimated for the selected
combinations of processes based on the social-technological level and
the size of community.
Block sixteen—most compatible process combinations. The output
of the model provides compatible water supply and sewerage treatment
alternatives for a specified community in the base year and at the end
of each of four increments of five years. There, are thus five pages
of output for each community. The details provided include:
1. total cost, over an ensuing twenty-year period as well as the
capital or construction cost and the yearly maintenance cost;
2. manpower needed for the effective maintenance and operation of
the plant or plants, by three categories, unskilled, skilled,
and professional;
3. the output of both treated water and/or the amount of sewage
influent that the lowest cost combinations of processes will

63
handle; and
4. the population to be served under the proposed lowest cost
system.
One further subcharacterization of the combinations of processes
as specified by the model can be made. The basic classifications of
PW. and PS. may still require significant variations within the cate
gories or conbinations selected by the model. In short, once the final
combination of processes has been selected, a final sort is possible
manually on the subcategory of PW.'s and PS.'s. For example, with slow
sand filtration (PW3), the following variations are possible: conven
tional, manually cleaned; upflow; crossflow (dynamic); and dual media.
These subprocesses, along with their individual contraints with regard
to STL, are shown in Table III.1.4., and are assumed compatible within
their categories and community level constraints.
Finally, there has been a basic assumption that all the processes
(PW. and PS.) require some sort of public or private infrastructure
to oversee the construction and operation of the individual treatment
installations. However, there is not necessarily a physical system
serving multiple dwelling units associated with every treatment operation.
For example, individual PS13's can be built, supplied, and maintained
by an organization, but they are physically limited to a single family
unit. A further assumption is that the individual systems (family units)
are reasonably competitive with the other processes or combinations which
are subject to the constraints specified in Table III.1.4.

64
TABLE III.1.4
WATER AND WASTEWATER TREATMENT PROCESS SUBCHARACTERIZATIONa
Processes Socio-Technological
Constraints
WATER
PW1 no-treatment a. groundwater
catchment control Usually limited by size to less than Level IV.
PW2 pre-treatment a. turbidity/sand—plain sedimentation b. algal control—thermocline controlb
c. copper sulfate (CuSO^)"3
d. microscreenL
Level I Level IV Level III Level IV
PW3 slow sand filtration a. conventional, manually cleaned b. c. d.
upflowb crossflow (dynamic) dual mediab
Usually limited by size to less than Level IV.
PW4 rapid sand filter—conventional0
a. conventional b. surface agitation (air, water, mechanical) c. dual media (sand and artificial) d. upflow
PW5 rapid sand filter—advanced0
a. multi-media (sand, garnet, coal) b. plate or tube settling as part of system c. polyelectrolytes (cationic and anionic) d. biflowb
e. dynamic f. valvelessb
Level III Level III Level III Level IV
Level IV Level III Level IV Level IV Level IV Level IV
PW6 softening a. lime soda b. zeolite
Level III Level IV
PW7 disinfection a. chlorine b. iodine c. ozone d. ultraviolet e. lime, CuSOu f. energy13 (pasteurization)
Level III Level IV Level IV Level IV Level I Level II

TABLE III. 1.4—Continued
65
Processes Socio-Technological
Constraints
PW8 taste, odor—Fe, Mn a. aeration b. zeolite c. chlorine d. adsorbent—charcoal
Level II Level IV Level III Level III
PW9 desalting—salt a. multiple effect (multiple distillation) b. freezing out c. pressure
Level IV
PW10 desalting—brackish a. electrodialysis (ED) b. reverse osmosis (RO) c. chemical
Level IV
PWll containment filters a. Dunbar b. coconut fiber/charred rice husks^ c. asbestos/charred pine needle^
Level II
WASTEWATER
PS1 primary—conventional (separate from sludge treatment)
PS2 primary stabilization pond a. single cell b. multiple cell
PS3 sludge-conventional a. conventional b. heated c. thickened d. staged, including mixing
PS4 sludge—advanced a. Zimpro-Pyrolysis b. incineration c. fertilizer
Level I
Level I Level II
Level III Level III Level IV Level IV
Level IV
PS5 sludge combined—Imhoff
PS6 secondary—standard filter
Level I
Level II

66
TABLE III.1.4—Continued
Processes Socio-Technological
Constraints
PS7 secondary—high rate filter a. Bio-filter b. Accelo-filter c. Aero-filter d. contact stabilization filter
Level III
PS8 secondary—activated sludge a. minimum solids b. conventional
PS9 secondary—extended aeration (oxidation pond) a. oxidation pond b. Dutch ditch (oxidation ditch) c. d. aerated lagoon
INKA aeration unit used with oxidation ditch
PS 10 disinfection—chlorine
PS 11 aqua culture a. fish culture—milkfish, tilapia, bass b. vascular plants—hyacinth, kang kung c. ecological d. irrigation
PS12 dilution a. coarse screens b. fine screens c. chemical precipitation, Guggenheim
PS13 individual and on-s i t e uni ts a. septic tank b. sanitary pit privy
PS 14 individual (advanced) units a. chemical b. thermal c. Clivus Multrum
Level IV Level III
Level III
Level II
Level I
Level III
Level I
Level III
aUnderlining indicates that a process is of particular importance in Less Developed Countries (LDC's).
"Requires more field evaluation; not enough is known at present concerning these processes.
cIncludes Fe, CaO, and/or Al for coagulation; mixing; and settling.

67
SCOPE AND LIMITATIONS OF THE MODEL
Since the perspective of the model is global, a large array of
treatment processes are considered potential candidates for the treat
ment of water and wastewater. The array of processes is open to expan
sion as new ideas are tested through the global network working on adap
tive and innovative technological transfer. However, in certain areas
some processes lend themselves to greater probabilities for success
than others. To account for local variations, the model can be adapted
by the addition and elimination of processes as needed.
The model initially was limited to organized communities or nucleated
villages that range in population from 500 to 100,000 inhabitants. At
the lower level the limit was intended to include individual family sys
tems, if they are collectively managed. At the upper limit, high popu
lation concentration areas were excluded because they can afford pro
fessional expertise and have generally been able to develop adequate
systems without the need for a planning model (1).
The model's data requirements are reasonable. The model is so
structured that information for up to thirty percent of the social-
technological items may be lacking, and still reasonable community iden
tification can be achieved. In fact, one alternative would be to arrive
at the community level by simply consulting the scenarios in the section
on "Description of the STL Categories" below, thus bypassing the related
data requirements entirely.
Another limitation of the model is that it deals only with water
treatment. Procurement and distribution methods and transportation of
wastewater away from households are not presently considered, although
they could affect treatment costs to some degree. However, this effect

68
should not be too evident because water quality and system scale are
both included in the model.
DESCRIPTION OF THE SOCIAL-TECHNOLOGICAL LEVELS (STL)
The approach in this study was to set up four levels of development
so that any community would be classified rather easily into one of these
levels. The level for a particular community could be determined through
use of the data collected on particular socio-cultural and socio-economic
factors (See Figure III.1.1, Block 1). The general characteristics of i
each social-technological level are described below.
Level I communities. Level I communities are those whose economic
and social progress is dependent upon continued employment of outside
high-level manpower in a wide variety of core positions in the main
public and private institutions. At this stage the indigenous human
resources are insufficient, and almost without exception external aid
is required. Normally, the Level I community is essentially an agricul
tural society; with the majority of the population of the area being
rural or nomadic and engaged in subsistence activities contributing
marginally to a market economy.
There is a critical shortage of all categories of high-level man
power: professional and subprofessional, administrative and clerical,
teachers, supervisors, and senior craftsmen. In many of these communities,
the total number of native persons in the population who have a secondary
education or the equivalent is certainly less than one percent, and in
some cases, it may be closer to one-tenth of one percent.
In many Level I communities, the population is no longer stable,
but is beginning to increase as progress is made in the control of
diseases with the expansion of health services. In some areas,

69
overcrowding on the land, the initial thrust of education into these
areas, and the building of roads has encouraged the movement of people
to large towns and cities.
The education in Level I communities reaches only a small fraction
of the population; its quality is low; and it is incapable of meeting
even the minimum needs for local high-level manpower. Many of the schools
are operated by "voluntary agencies" or missionary organizations, and
the variations in curricula are wide. In most of these communities, the
bulk of the primary school teachers are "unqualified" which generally
means that they have had little more than six or seven years of primary
schooling themselves. The characteristic pattern of most Level I commu
nities is that many pupils start in the first grade, then drop out, and
then come back again as repeaters and drop out again.
Level II communities. These communities for the most part are
dependent upon the more advanced communities or central cities for criti
cally needed scientific and engineering manpower. But they are able to
produce the greater part of their own non-technical high-level manpower,
such as teachers, managers, and supervisors with some assistance from
advanced countries or other areas within the country. They are unable
to develop enough strategic high-level manpower (particularly engineers,
scientists, and highly qualified teachers). In many areas, a large
portion, approximately half of the population, is engaged in subsistence
activities outside the market economy. Most of the agricultural popula
tion produces at least some commodities which are sold for cash. In
some areas there is a nucleus of modern industry, and in some communi
ties the industrial sector is sizable. Some communities have textile
factories and light metal manufacturing plants while others have large

70
mining or petroleum companies, most of which are partly owned and
operated by foreign concerns. Banking and commercial establishments
are much more developed than they are in Level I communities, as are
the systems of transportation and communication. Thus, the modern
sector of the community is larger and a great deal more complex than
that in the Level I community, and government employment no longer domi
nates the labor market.
In nearly all Level II communities, there is widespread conscious
ness of the need for rapid economic and social development, yet in most
cases there is no clear-cut strategy for achieving it. But in compari
son with Level I communities, there is more widespread participation
of the people in the political life of the community and, consequently,
greater pressure for expansion of education and general improvement in
the standards of living.
Level III communities. The secondary school enrollment ratio is
three times higher than in Level II communities, and the primary enroll
ment is fifty percent higher. There is available practically all of the
high-level manpower needed except for those occupations requiring scien
tific and technical personnel. Although shortages of scientists and
engineers persist, they are not great enough to prevent the community
from successfully importing and adapting modern technology without
substantial external help.
The quantity and quality of high-level manpower in the Level III
communities if far less than those in Level IV communities. The Level III
community is a follower rather than an originator of scientific, engineer
ing, and organizational innovations. A community in this level has a
broad base of primary education with generally well-developed secondary

71
schools and maybe an institution of higher education. It has not been
able to develop the research manpower and research institutes which are
characteristics of Level IV communities. In the area of manpower, though
capable of supplying initial minimum needs, institutions are often improp
erly oriented to meet the challenges posed by rapid modernization. In
some cases, too many people are being trained in fields for which there
is insufficient prospective demand. Industrialization is well advanced
in Level III communities. Most of them are no longer predominantly
agriculturally oriented. Transport, power, and communication are, on
the whole, well-developed. There are, however, bottlenecks in such
areas as electric production, railroad service, and irrigation, partly
because of a shortage of the skilled and technical manpower to build
and operate them.
Like many of the Level I or II communities, some of the Level III
communities have surpluses of unskilled human resources. Generally, the
salaries paid to high-talent manpower in science, engineering, and mana
gerial positions in most of the Level III communities are sufficient
to attract young people to train for these fields. Government admini
strative posts also carry high prestige and high salaries. There are
public employment services, although these tend to service blue-collar
workers rather than professionals. Some attempts have also been made
to establish registers of scientific and technical personnel, but gener
ally the employment opportunities for these people are sufficient without
the assistance of formal placement procedures.
Level IV communities. The typical community in the fourth level
of human resource development has an advanced industrial economy. It
is capable of making major scientific, technological, and organizational

72
discoveries and innovations. This is because it has a relatively large
stock of high-level manpower, particularly scientists, engineers, and
managerial and administrative personnel. The community has made a
heavy commitment to education, especially to higher education, and to
human resource development in general. Since rapid changes in technology
affect skills and occupations at all levels in the advanced industrial
community, education and training tend to be geared to flexibility
rather than to specialization.
Measures of educational development show narrow differentials,
but they are still substantial. For example, Level IV communities have
more than three times the number of students enrolled in first-level
(primary) education than do Level I communities, and about one-fifth
more than Level III communities. The percentages of those enrolled
in scientific and technical facilities are higher, and of those enrolled
in humanities, fine arts, and law, lower in Level IV communities than
in the other communities. Finally, Level IV communities spend more
of their income on public education than do Level III communities.
COST AND MANPOWER PARAMETERS (FOR SELECTED WATER AND WASTEWATER TREATMENT PROCESSES BY SOCIAL-TECHNOLOGICAL LEVEL AND SCALE)
To obtain cost figures three methods may be used: an empirical
analysis of U.S. data, regional or national multiple regression data
(cost-demand model included in Chapter IV), and in-country or local
data. The first method was used to construct the cost-manpower matrix.
The results are given in Tables III.1.5-24 which are in the appendix
on Chapter III. These data cover processes PW1 through PW10, and
PS1 through PS10. PW11 and PS11, 12, 13, and 14 require additional
information.

73
III.2.
PREDICTION METHODOLOGY FOR SUITABLE WATER AND WASTEWATER PROCESSES: DATA REQUIREMENTS
Data forms were designed to use in collecting the basic information
needed for the predictive model, using a format chosen for the purpose
of easy reduction by a computer. It is important that the data forms
be completed by an individual or team that is quite familiar with the
community involved, and every possible effort should be made to complete
all of the questions included in the data forms. When reliable data
are not available, estimates should be used which reflect variations
attributable to local circumstances and conditions. In short, careful
attention should be given to completing and supplying the information
requested on the data forms, since successful use of the model depends
on this information. The data forms to be used with the model are
included in the pages which follow.
Norman: The University of Oklahoma Bureau of Water and Environmental Resources Research, October 1975. (33 pp.)

General Information
1. Location of Community
City Name
State or Province
Country
2. Planning Group or Agency
Demographic - The model requires some basic population data for the purposes of capacity planning. Two inputs are required. If local or site data is not available please use a national estimate and also indicate whether it is national or local source.
Answer either A or B.
A. 1. Present Population - The figure or estimate of the present population should reflect the number of inhabitants that the proposed water or wastewater treatment facility is going to serve.
Actual population or estimate the following:
(1) Between 500 and 2,500 people
(2) 2,500 - 15,000
(3) 15,000 - 50,000
(4) 50,000 - 100,000
(5) Source
2. Annual population growth rate or estimate in the following:
(1)
(2)
(3)
(4)
(5)
(6)
(7)
L e s s
1% -
1.5%
2.0%
2.5%
3.0%
3.5%
t h a n i:
1.5%
- 2.0%
- 2.5%
- 3.0%
- 3.5%
- 4.0%

75
(8) Greater than 4%
(9) Source
B. Population estimate at last census
Date of Census Source of Census
Annual Growth rate at time of last census or present annual growth rate
III. Socio-Technological Data - The purpose of this section is to gather enough information about the community so that it can be classified into one of the four levels of development. The approach has been to request information that is genera-ly available and can be obtained on a local level. Please include any other information you feel is relevant.
CHECK THE MOST APPROPRIATE CATEGORY FOR THE FOLLOWING QUESTIONS
1. Average level of education obtained by inhibitants living in the community.
High Technical Level None Primary School Institute College
(1)
(2)
(3)
(4)
(5)
95%
70%
55%
9%
Other
4%
19%
22%
34%
1%
7%
14%
42%
0%
3%
6%
8%
0%
1%
3%
7%
2. Average distribution of labor force in the community.
Level Unskilled Semi-Skilled Professional
(1)
(2)
(3)
(4)
97%
80%
61%
45%
2%
16%
27%
30%
1%
4%
12%
25%
3. Annual average income per family in your country's currency.
amount unit

If available, also check the approximate U.S. dollars equivalency of this amount shown in the following.
(1) Less than $100
(2) $100 - $500
(3) $500 - $1,000
(4) $1,000 - $3,000
(5) Greater than $3,000
4. Among the highly skilled and technical workers (for example, engineer, chemist, etc.) what percentage of these is nonlocal or non-native people?
(1) Less than 10%
(2) 10% - 25%
(3) 25% - 50%
(4) 50% - 75%
(5) 75% - 100%
5. Are there any primary and secondary schools operated by voluntary or missionary organizations rather than the government itself?
(1) Yes (?"> Nn
6. What is the highest grade offered by local schools on a regular basis? (Circle one)
1 2 3 4 5 6 7 8 9 10 11 12 12+
7. If the number selected in #6 above is less than 12, how far away is the nearest high school offering the 12th grade?
(1) Less than 10 miles (or less than 16 kilometers)
(2) 10 - 30 miles (or 16 - 48 kilometers)
(3) 30 - 50 miles (or 48 - 80 kilometers)
(4) Greater than 50 miles. (Greater than 80 kilometers.)
(5) Other (specify)

77
Are there any technical or vocational schools in the community?
(1) Yes (2) No
Has the community achieved compulsory primary education of at least six years?
(1) Yes (2) No
10. Are there any formal in-service training programs by either the government or local industry for their employees?
(1) Yes (2) No
11. Is there a college or university in the local community?
(1) Yes (2) No
12. Does the university have a chemistry department or laboratory?
(1) Yes (2) No
13. How do you rate the ability of the community to finance a water and sewage treatment project?
(1) Unable to repay; the project is a gift because the beneficiaries are poor.
(2) Limited ability to repay; however, the benefits exceed the costs.
(3) Repayment prospects are good; the beneficiaries have
relatively high incomes.
14. Is unemployment widespread?
(1) Yes (2) No 15. Are advisory services widely available to farmers for community
development or for other programs designed to upgrade the skills and enlist the participation of the inhibitants?
(1) Yes (2) No
16. Do most college or university students of the community receive their education in neighboring communities, neighboring countries, or other foreign countries?
(1) Yes (2) No
17. The level of technology available can generally be classified as
(1) Hand tools only

(2) Mechanical tools (i.e., gasoline powered equipment)
(3) Chemical products (fertilizers, chlorine)
(4) Electronic technology
18. Does the government dominate the labor market?
(1) Yes (2) No
19. Are public employment services readily available?
(1) Yes (2) No
Indigenous Resources Data.
Questions 20-23 relate to the availability of materials and equipment. Check those items that are not generally available in the community. 20. Operation equipment. Which of the following are not generally
available in the local community?
(1) Water meters
(2) Soldering equipment
(3) Acetylene torches
(4) Recording devices, such as thermostats
(5) Laboratory equipment such as test tubes
(6) Portable power plants such as gasoline powered electric generators
(7) Motors such as 1-3 horsepower electric motors
(8) Water pumps
21. Process materials. Which of the following are not generally available in the local community?
(1) Pipe (clay, steel, cement, plastic, copper, etc.)
(2) Pipe fittings
(3) Paint
(4) Valves
(5) Tanks

79
(6) Vacuum gauges
(7) Heat exchangers
22. Operation and Maintenance supplies: Which cf the following are not generally available in the local community?
(1) Silica sand
(2) Graded gravel
(3) Clean water
(4) Gasoline
2 3. Chemical supplies: Which of the following are not generally available in the local community?
(1) AI2(80^)3 (aluminum sulfate)
(2) FeCl3 (ferric chloride)
(3) Activated charcoal
(4) CaO (lime)
(5) NaC03 (Soda ash)
(6) Cl2 (Chlorine)
(7) 03 (Ozone)
(8) Laboratory chemicals
24. Major Water Source (check, appropriate category)
(1) River or stream
(2) Lake or impoundment
(3) Wells
(4) Sea or brackish water
25. Approximate per capita water demand (daily)
(1) Current demands in (units)
(2) 10 year projection:
26. Is groundwater available?
(1) Yes (2) No

80
27. Are wells already drilled? Current Capacity?
(1) Yes (2) No
_mgd
28. Is a central wastewater collection system in existence?
(1) Yes (2) No
29. Is the following wastewater data available? Please fill in the percentage of people in the community that are:
(1) Currently connected to the system %
(2) To be connected within 5 years of the start of the project %
(3) To be connected within 10 years %
IV. Raw Water Quality (drinking water). The purpose of this section is to provide as input to the model the results of tests that have been carried out on the input or raw water. Only starred tests are required for the predictive model.
(1) *Number of coliform bacteria
(2) *Turbidity
(3) *Hardness
(4) *Total dissolved solids
(5) *Fe and Mn
(6) BOD
(7) PH
(8) Dissolved oxygen
(9) Temperature _____
(10) Chlorine _________
(MPN/100 ml)
(Jackson turbidity units, JTU)
_(mg/l)
..(mg/1)
_(mg/l)
_(mg/l)
_(0 -14)
_(mg/l)
_(°C)
_(mg/l)

81
B. Wastewater Quality
(1) *Dilution
or *Dilution
(2) *BOD
(prior to treatment).
(CFS receiving water flow/1000 PE)
(Receiving water volume/waste volume)
(mg/1) (May be needed to ascertain figure for PE in dilution ratio.)

h

82
III.3.
PREDICTION METHODOLOGY FOR SUITABLE WATER AND WASTEWATER PROCESSES: MANUAL COMPUTATION METHOD
George W. Reid and Richard Discenza
The selection of the most appropriate water and wastewater
treatment method for developing countries by using the predictive
model is not limited to situations where an electronic computer is
available. A manual computation method has also been devised. The
twelve steps to manually determine the most plausible treatment method
are as follows:
1. Assign weights to the responses to the data sheet questions
necessary for determining the STL level for the community
under consideration. Weighting factors are shown in Table
III.l.1.
2. Total the assigned weights.
3. Compare the total of assigned weights to the figures given
in Table III.3.1 to determine the socio-technical level of
the community and the per-capita water consumption.
4. Determine the operation equipment availability.
5. Determine the process materials availability.
6. Determine the operation and maintenance supplies availability.
7. Determine the chemical supplies availability and groundwater
availability.
Norman: The University of Oklahoma Bureau of Water and Environmental Resources Research, October 1975. (23 pp.)

83
TABLE III.3.1
SOCIO-TECHNOLOGICAL LEVEL AND WATER CONSUMPTION
Socio-Technological Range for Total of Average Consumption Level (STL) Weighting Factors of Water (Gal/Cap/Day)
I 1-23 25
II 24 - 51 50
III 51 - 93 75
IV 93+ 100
TABLE 111.3.^
POPULATION RANGES AND SCALE VALUES
Estimated Population Population Scale
500 - 2,499 1
2,500 - 14,999 2
15,000 - 49,999 3
50,000 - 100,000 4

84
8. Compare the basic processes and their requirements (Table
III.1.2) against the available physical resource groups
(these are determined by Steps 4-7) and manpower availability
as determined by the size of population served and the STL.
9. Compare the various possible combinations of the treatment
processes found to be feasible (Table III.1.3) to the water
and wastewater quality of the community obtained from the
data sheet.
10. Compute the population scale as given in the data sheet
(II. A or B) according to the guidelines given in Table III.3
11. Determine the total cost of construction and operation over
twenty years for the feasible combinations (determined by
Step 9) using the appropriate scale (from Step 10) and the
appropriate STL level (from Step 3). Also, determine the
manpower required.
12. Select the lowest total cost or the lowest maintenance cost
combination of processes determined by Step 11.
A MANUAL COMPUTATION EXAMPLE
1. Data Form, Part III, ., . , . . „ ' . . , ,„ Weighting Factor
Questions Numbered 1-19 6 &
1 10
2 5
3 8_
4 2
5 5__
6 10
7 -_
8 5

85
Data Form, Part III, VI . . ... „ ' , , ,'.. Wexghting Factor
Questions Numbered 1-19
9 0
10 5
11 0
12 0
14 0
15 0
16 0
17 5
18 5
19 5
Number thirteen is omitted; it is used for a purpose other than
STL computation.
2. Total the weighting factors from Step 1.
Total = 65 .
3. Compare the total of the weighting factors to Table III.3.1.
STL for this community = 3
Estimated consumption = 75 gcd .
These figures on consumption are used for the final output, to establish
a figure for the plant capacity at the present population or at pro
jected population levels.
4. Examine question No. 111-20 on the data sheet. If three or
fewer of the eight items are checked, then this group of operation
equipment is considered available.
Operation Equipment Available Yes
Not Available
5. Examine question No. 111-21 on the data sheet. If three
or fewer of the seven items are checked, then this group of process

86
materials are considered available.
Process Materials Available Yes
Not Available
6. Examine question No. 111-22 on the data sheet. If two or
fewer of the maintenance items are checked, then this group of operation
and maintenance supplies are considered available.
Operation and Maintenance Available Yes Supplies
Not Available
7. Examine question No. I11-23 on the data sheet. If three or
fewer of the maintenance items are checked, then this group of operation
and maintenance supplies are considered available.
Chemical Supplies Available
Not Available X
Examine question Nos. 111-2 4 and 26 on the data sheet.
Groundwater Available Yes
Not Available
Summary of Physical Resource Availability:
Physical Resource Availability (Yes or No)
Operation Equipment Yes
Process Materials Yes
Operation and Maintenance Yes
Supplies
Chemical Supplies No
Groundwater Yes
8. This step involves a comparison of several factors to deter
mine if any or all of the basic processes must be eliminated because
the community does not have the resources available. The primary tool
for this comparison is Table III.1.2. Two general categories of require
ments are considered, manpower and resources. In the category of

87
manpower the following guidelines should be used.
a. In Level I communities basically only unskilled manpower
is available.
b. Level II communities have unskilled, and some skilled labor
available.
c. Level III communities with populations under 50,000 have
unskilled and some skilled labor available. In Level III
communities with a population of more than 50,000 and in
Level IV communities, all three categories of manpower are
available, unskilled, skilled, and professional.
The data sheet for the hypothetical community of this example shows
that the population to be served is above 50,000. Therefore, none of
the processes are eliminated because of manpower constraints.
For the resources required, it is necessary to carefully compare
each of the processes and its requirements against the summary of
resources available listed above. If a process requires a resource
that is not locally available then the process should be eliminated
from the number of feasible processes. (In this example processes
requiring chemical supplies are eliminated.)
List the feasible processes:
Water Wastewater
PW1 PS1
PW2 PS2
PW3 PS5
PS6
PS8
PS9
PS10

88
9. At this point the process combinations obtained from Table
III. 1.3 can only be made up of the above basic processes, and they are
examined to see if they can be used to process the water, given that
the water or wastewater quality is as specified on Part IV of the model
data sheet.
In short, the feasible processes are compared to Table III.1.3.
The combinations selected as feasible are those that are capable of
treating the raw water concentration as specified on the data sheet
and within the constraints given in Table III.1.3 and contain only
those feasible basic processes as listed in Step 8 above.
List the feasible combinations:
Water 1. Wl = PW1 (not feasible because raw water quality too low)
Wastewater
2.
3.
4.
5.
W3
W4
1.
2.
3.
4.
5.
6.
7.
8.
= PW3
= PW2 + PW3
SI = PSl
S3 = PS2
S4 = PSl
S5 = PSl
S9 = PSl
S9 = PS2
S9 = PSl
S9 = PSl
+ PS5
+ PS5 + PS6
+ PS9
+ PS5 + PS10
+ PS10
+ PS5 + PS6 + PS 10
+ PS9 + PS 10
(not feasible
because dilu
tion factor
too small)
9.

89
10. The population factor for the community under study is
determined by taking the population given in Part II of the data
sheet and comparing it to the estimated population groups in Table
III.3.2.
Actual population = 60181 .
Population scale factor = 4 .
11. At this point the cost and manpower determinations for the
feasible combinations can be made. The objective of this step is to
determine the manpower requirements, construction, and operation and
maintenance costs for a twenty-year period for all of the feasible
combinations that have been selected. To determine these costs, costs
associated with each of the basic processes are calculated and then
combined together to arrive at the estimated costs of the feasible
combinations of processes. The source data for the various treat
ment costs is contained in Tables III.1.5-24 which are in the appendix
for Chapter III. There is one table for each of the processes in Step 9
above. From previous steps the following information is available:
population scale = 4; STL = 3; estimated consumption = 75 gal/cap/day;
and actual population = 60181. See Tables III.3.3 and 4 for the re
sults of the calculations.
12. The final step in the process selection method involves
the selection of the lowest total cost of the lowest maintenance cost
combination from those listed in Table III.3.4.
In this example the lowest total cost water treatment combination
is W3 which includes the process PW3 (slow sand filter). The lowest
total cost wastewater treatment combination is the S9 which includes
PS2 (primary—stabilization ponds) and PS10 (disinfection). In this

90
m.
en
W • J PQ <C H
M 10 CD C 3 O o to a. n C 0) ID PM
s MM
TJ O a u u
•H CD 3 43 CT E CD 3
0) 3 O </>
O <_<
.H CO n) M 4J CO O <U
H ! *
O C M
01 u c 03 ^"» C • 0) t/i 4J • C 3
T-l </>
> N in o
u co CD
O 3 3 </>-
in u c in o o
a co
o
a co u
Q. n3
O
u CD
a ,
in in u o) CD o . n O E M 3
a. z
ON oo
ON
0 > O
o
O N
o i n
i - H
0 0
r^ NO
r-* i n
r^
N O
ao O
—, U ~ |
en
<r
O m oo r^ r*. CM
CM
O O oo
m •—< v O
t-4.
i n ~3"
o t—i
«3" ON
I N
o ON m
o en
m oo
NO CM
NO CM
00 •3-
i n NO
—i CM
—I CM 0O r*. O ON
ON
NO
CM -3-
NO O N
— oo
—i <r en <r o o
NO
o
NO o
o
o
oo CM
o
ON -3-
NO - J — m C M m CM —<
O
N D O - H O en oo
.—< r^ e n
en O
o m — oo
—c en —i
o
ON
a LU H
< a
CM
3 C M
en 3 C M
UJ a: E- u.: 10 c -
<: < 3 3
~ M
1/5 C M
CM
to C M
m oo C M
N O
0 0 C M
ON
oo C M
O V—*
0 0 D M
10 V4 CO o 5 N
, *~\ >N 4J • H
c a E o o
U M
o
c o
• H J J
CD r - f
3 a 0 a
w
/ - s 4 J
in o u
a j
u • H D . CO O
14
0J C u
N M ^
a
-v u 0 )
o u
>> u • H
C 3
§ O
u
IM CO
a) > N
u <v C M
0) U 10
0 u
<u u
s c 0) 4-1
c 1-1 CO
s TJ
§ c o
• H 4 J CO U
a) a 0
\** + /~\ 4-1
to O U
c o
• H 4 J
O 3 1M 4-1 10
c 0 o
*m*
II
/ - N
4-1
CO
O u
i H CO
4 J
o H

91
C/3 Z
Pi o W M 3 H O <! PH Z Z W 3 n s. . o O U <| w
• J H PQ en M O c/l
°3 p4 PM
o r H
Z O O H CO H H < Z Z W M S 2 eeJ W M H G W O* O W
^-\
PH jH <r t s w H4 <J
S 3 ^ N—•
Pi
power
rsons)
equired Man
umber of Pe
BtS 35
Professional
Skilled
Unskilled
Total Cost,
20 Years
($U.S.)
Yearly
Maintenance
Cost ($U.S.)
Construction
Cost ($U.S.)
Processes
Combinations
o o
o o
oo co
843,135
843,140
23,479
23,479
313,543
313,540 .
(PW3) slow sand fil
ter
en 3
rH O rH
-3- O - f
m oo en —i
495,289
843,135
1,338,400
18,656
23,479
42,135
122,167
313,543
435,710
(PW2) pre-treatment
(PW3) slow sand fil
ter
~3-
3
O O H H
CM rH —l -3>
• J >» NO <T r~4
1,599,009
4,351,086
2,941,045
8,891,100
40,321
123,972
89,669
253,960
792,583
1,871,629
1,147,651
3,811,900
(PSl) primary—conven
tional
(PS5) sludge—combined
(Imhoff)
(PS10) disinfection
CT>
O rH —1
O ^-t *-<
vD vO CM
757,678
2,941,045
3,698,700
27,081
89,669
116,750
216,049
1,147,651
1,363,700
....
(PS2) primary—stabi
lization pond
(PS10) disinfection
CJ\ en
o o
CM —
<t <t
1,599,009
4,351,086
40,321
123,972
792,583
1,871,629
(PSl) primary—conven
tional
(PS5) sludge—combined
(Imhoff)

92
T3 0)
3
a o i i
M M
W • J
ca
Manpower
Persons)
Required
(Number of
Professional
Skilled
Unskilled
Total Cost
- 20 Years
($U.S.)
Yearly
Maintenance
Cost ($U.S.)
Construction
Cost ($U.S.)
Processes
Combinations
H r t N
CM —< SO
so sO O CM
2,277,850
2,941,045
11,169,000
42,126
89,669
296,090
1,435,316
1,147,651
5,247,200
(PS6) secondary—stan
dard filter
(PS10) disinfection
OS
to
O ~ * "•• CM
CM CM H m
• ^ sO sO SO
1,599,009
1,615,800
2,941,045
6,155,800
40,321
16,850
89,669
146,840
792,583
1,278,800
1,147,651
3,219,000
(PS1) primary—con
ventional
(PS9) secondary—ex
tended aera
tion
(PS10) disinfection
OS
c?
cd 00
O o o to t - l m -a-
a. o a.
© SO
It) 00
n 01
. - I a) o
to JJ
8

93
example the lowest total cost combination also happens to be the lowest
maintenance cost combination. This may not always be the case, however.
The computerized version has an additional feature that the manual
method does not have. That is, the steps one through twelve are simu
lated at five year intervals for a period of twenty years. Inherent
in these simulations are population increases and thus also a modest
growth in the technological level of the community.

94


CHAPTER 1 V
Methodology for Prediction of Water and Wastewater
Volumes and Treatment Costs
To obtain LDC cost or volume figures for selected water and waste
water treatment processes, three methods may be used. In order of
increasing accuracy, they are the following: an empirical analysis of
U.S. data, regional or national multiple regression data, and in-country
or local data. In this chapter a cost-demand model is presented in
which modelling techniques have been used to develop equations for
Africa, Asia, and Latin America to predict water demand quantities and
wastewater amounts, as well as construction and operation and mainte
nance costs for slow sand filters, rapid sand filters, stabilization
lagoons, aerated lagoons, activated sludge systems, and trickling
filters. The basic technique used in this study was step-wise multiple
regression using available cost data from Africa, Asia, and Latin
America gathered through the use of questionnaires and a review of the
literature.
95

96
The material contained in this chapter is a shortened and revised
version of the original publication. Numerous tables have been included
which present the results for mean water demand, waste disposal, and
costs of water and wastewater treatment systems for selected socio
economic and technological conditions of LDC's. Two sample problems
illustrate the use of this predictive mathematical model.

97
IV.
A MATHEMATICAL MODEL FOR PREDICTING WATER DEMAND, WASTEWATER DISPOSAL AND COST OF WATER AND WASTEWATER TREATMENT SYSTEMS IN DEVELOPING COUNTRIES
Michael I. Muiga and George W. Reid
This study uses mathematical modelling techniques to develop
predictive equations, utilizing socio-economic, environmental, and
technological indicators. Predictive equations are developed for
three regions (Africa, Asia and Latin America) for water demand,
waste water amounts, as well as construction and operation and mainte
nance costs for slow sand filters, rapid sand filters, stabilization
lagoons, aerated lagoons, activated sludge systems, and trickling
filters.
Data analysis indicated that water demand is a function of
population, income, and a technological indicator (percentage of
households connected to water supply), while waste water disposal
was found to be a function of water demand and two technological
indicators (percentage of homes connected to public sewerage systems
and percentage of household systems). The predictive equations for
water treatment costs were found to be a function of a technological
indicator (percentage cost of imported water supply materials),
population, and the design capacity. The variables which gave the
best correlation for waste water treatment costs were population,
Norman: The University of Oklahoma Bureau of Water and Environmental Resources Research, January 1976, (147 pp.)

98
design capacity, and the percentage of imported wastewater disposal
materials.
INTRODUCTION
General. It is highly desirable that proper water supplies and
sewage disposal should be of the highest priority in order to obtain
the maximum environmental, economic, and social improvement for the
people in developing countries. An improvement in the public health
and thus in the general well-being and increased productivity of the
people is probably the most significant effect of improved water
supplies and sewage disposal.
To prove statistically the beneficial effect of proper water
supplies and sewage disposal on the health and social conditions of
the people of developing countries would require medical examinations
and laboratory tests for a particular community for many years.
Fortunately, with the World Health Organization such a case history
has been documented and is included below.
A simple water supply system was installed in the Zaina area in the Central Province of Kenya, with the help of UNICEF and WHO, in 1961. This system is fed by gravity from a high level surface source of good physical quality and provides chlorinated piped water to 588 farms and four villages which had a total population of 3850 in 1961. By 1965, the system had been extended to supply water to 5800 persons. Prior to 1961, the source of water for domestic use and the considerable farm animal population was the Zaina River which flows in a gorge about 100 metres below the inhabited areas. Carrying water up the steep incline consumed a major portion of the time of the women.
When the new system was installed in 1961, a complete survey of the health and social aspects of the area was made under the supervision of the Provincial Medical Officer. The survey collected detailed information on the incidence of illnesses and infections, housing conditions and general living standards. A similar study was made of a control area located eight kilometers from Zaina and comparable to it in practically all characteristics

99
except that it lacked an adequate community water supply. In 1965, after four years of operation of the Zaina water system, a resurvey was made of both areas.
It was found that the Zaina community was in better health than four years earlier in terms of both total number of illnesses and duration of each illness. Using the same basis of comparison, the people of the control area were found to be in poorer health. A dramatic difference was found in the stool examination of children for ascariasis, the most common helminth infection in the area. The 1965 survey showed a decline of the disease in Zaina and an increase in the control area giving the latter a prevalence of six times that found in Zaina. The studies also showed that Zaina had made a greater economic advance than the control area. The easy availability of piped water and the release of women's energies for better housekeeping, care of children and vegetable gardening, has been the principal factor in the improvement of both health and well-being in Zaina. (48)
Since the socio-economic, labor, cultural, and resource conditions
in developing countries are different from those in highly industrialized
countries, it was felt, from the experience available, that the criteria
used in developed countries for design of water supply would not
be of use in developing countries. (See Table VIII.1.9 for an
example of the drastic difference which can be observed when waste
water treatment costs in a developing country are compared to those
in a highly industrialized country.) Therefore, this study was
aimed at developing methods to estimate demand and costs for construc
tion and maintenance of water and wastewater system in developing
countries. However, very little information was available on these
factors of demand and cost in developing countries.
Problem. Conditions characteristic of many developing countries
include:
1. limited financial resources (particularly foreign currency);
2. limited manufacturing capacity;
3. limited skilled labor but ample unskilled labor;

100
4. scarce engineering personnel for construction and maintenance of water and wastewater systems.
In addition, most of the mathematical models which have been developed
do not account for future technological and cultural changes as well
as other factors, and they may not produce optimum cost alternatives
for the following reasons.
1. Relative prices of inputs may have changed requiring a different mix of inputs in order to produce a particular level of clean effluent at least cost.
2. Technological breakthroughs that can substantially reduce cost may have been introduced.
3. Existing plants are likely to be an inefficient combination of technologies resulting from a series of additions.
4. Existing plants are not likely to be cost minimizers when they are not operated for profit.
5. Construction and operation costs change with time as a result of change in human values and environmental factors, both physical and economical.
Very few models were found which considered the influence of environ
mental parameters to total costs. An intensive search of the litera
ture failed to find a single citation which considered all the signi
ficant factors and variables needed to develop a mathematical model(s)
for predicting water supply and waste water disposal amounts and
costs in developing countries.
Objective. The purpose of this study was:
1. to provide to administrators, engineers, and public officials who are in developing countries, concerned with particular future water and wastewater systems the- ability to assess the general level of water supply and wastewater disposal amounts and costs prior to a detailed engineering determination;
2. to provide financial guidance in making preliminary decisions concerning future water and wastewater systems in developing countries ;
3. to assist in establishing cost, process and resources interrelationships .

101
Four sub-models were developed as follows:
1. Water Demand Model for Developing Countries;
2. Wastewater Disposal Amounts Model for Developing Countries;
3. Cost of Water Treatment in Developing Countries;
4. Cost of Wastewater Treatment in Developing Countries.
Eventually these will be grouped together as shown in Figure IV.1.
The basic technique used in this study was stepwise multiple
regression. Use was made of available cost data from Africa, Asia,
and Latin America on slow sand filters, rapid sand filters, stabiliza
tion ponds, aerated lagoons, activated sludge systems, and trickling
filters.
The equations for estimating water demand, wastewater discharge,
and water and wastewater costs by processes, are in the following
form:
Y = B0 + B1X1 + B2X2 + B3X3 . . . + B.X. for i = 1,2,3 . . . 22
where Y = dependent variable to be estimated, e.g., water demand;
X. = independent variables used in making estimates (Figure IV.1);
B. = regression coefficients.
Need for the Study and Justification. The United Nations has
estimated that the developing countries have an annual population
increase of more than two percent. This increase in population will
involve a rising demand for water, not only for domestic and industrial
use but also for agricultural use to grow more food. Consequent to
the inevitable rise in water demand will come greater amounts of
wastewater to be disposed of in a manner which will not present a
health hazard. If waste water is not treated before discharge
into water bodies or if water supplies are not treated before use,

102
s • CO 03
01
o 6
X )
c cO E CD
-o M
cu V I
CO
* CD
4 J
tn to 3 1
. M CI) 4 J
co 3 C 01 01
5 4-1
0) X I
o. • H
x: tn C o
• H 4-1 CO
. H 0)
4 J
•s o u 0 0
c • H
a o
r H 0)
> CU
•a
^ o >4H
CO 1-1
01 T 3 O
a 4-1
CO
o u M 0) 4-1
(fl •» 01 4J
en to
? M 0) 4J to
PS »
•H
>> £ •
c .o ** 3 tl)
IS. O tfl u ~<
• °„ n
o a> C/3 / -v
C 'W
«H £ O *-< o
. - i a " 3 >
P. V ) ^ -
' •
.JO
°- -C CJ
(A •O =»* Oi CO 4-*
u at CJ OO
c a r: >-O 0> u 3 ?< C/)
i
-, o
X
• ^
J2 *
•§ £•
i-* w u <
"
u;
o w 1-.
a.
U) (0
< -= ( t 3 C 0
4-» |_
7U X
lf
^ - v
r-J
X
>• "J a e-n u
a s w
V l-l
<r, =f ^
a; o
u r. (w
ffi
" ;: X
c
D = f (D , WW W
* X9, X10 , X l l , X12)
Q H i o n , C i;, < J Z O Q t c - J
C rt C Or 12 • -
i * - c tn o s *-«
t o to * J «•-< tn »- i -O V 4*
o *-» *-< *4 15 X
D - f ( X l , X 2 , X 3 , X 4 , X 5 , X 6 , X7 , X8) w
3 < H W B : O U 3C < SE Q S O O U J —
•J > ,- X
—' *-» tf.
Tre
ated
W
ater
(S
/10
00
ga
llo
n P
rice
of
Con
sum
er
t >. >< E , ,H
Su
pp
ly
Po
pu
lati
on
of
t S
erv
ed
by
Wat
er
JOC
O's
, . ^
u A3 L .
01
6
4-1
CD
O
• - . > ^-s <y X s-'
tn 0>
c
a.
u
Xt 3
0
t u-l X
*-*'
ec
ted
to
sten
s
•—t
t *o X
"~ ^ - t
1
(Loc
a n
19
75
c o c; -n B 4-» O n u /-^
5i c n 41 - ^
<u rt Q l - 3 ( J oi c •*•-> C f >
< < w
. . -
X
Z) a E CJ (—i
(0
C C < 01
d u.
o> r» c < -<
-- . = ec - X
' J
i
1 1.
00
•z '•> 'J-Z D B
o - —
X
= *~ ^ 3 E O **- C
o c —
Des
ign
1'op
uLa-
tio
n
for
Was
te
wa
ter
(in
lO
no
's)
(X16
)

the public health in developing countries may deteriorate. Furthermore,
the cost of treating water associated with domestic use is likely
to go higher. There is, therefore, a definite need for development
of a technique that can be used for estimating water demand, per capita
wastewater disposal amounts, and the costs of treating water and
wastewater in developing countries.
LITERATURE REVIEW
Water Demand Models. A number of studies have been directed
toward describing the demand for water. These involved the manipula
tion of water use information and related economic data to provide
some projection of future demand.
Reid (30) has used economic, population, arid life style sub
models in the form of the following predictive equation:
WD = (Pop ) uu ' p p t t '
p p t
X ' Inct
Inc
y r POP A
Pop (4-1)
where: WD = water demand at time t,
uu = unit use,
Pop = population at time t,
ppt = Precipitation at time t,
Inc = income at time t.
In another study, Wolman (44) describes methods for making
estimates of water demand for the United States as an economic model
rather than as a set of formal projections. He does this because
several important factors are necessarily excluded either because
the basic data are still lacking or because some inter-relationships
are not well enough understood to be handled with any confidence.

104
In 1975, Reid and Muiga (32) presented an approach to develop
an aggregate mathematical model for water demands in developing
countries using socio-economic growth patterns. The authors used
socio-economic inputs to identify four socio-technological levels.
Levels representative of socio-economic development are in turn used
to identify municipal, agricultural and industrial water requirements.
The most advanced statistical methods used have been correlation
analysis and the development of estimating equations from the regression
line. For example, Sasaki and Sasaki (33) developed a model for Tokyo,
Japan, using this method. They used four factors to give the following
predictive equation:
I = 0.5674 Xx + 0.1606 X2 + 0.1149 X3 + 0.1571 Xk (4-2)
where: I = water demand in gallons per capita per day,
Xi = population,
X2 = personal income,
X3 = industrial production,
X^ = sales of goods.
Further, they expressed maximum consumption of water per day in Tokyo
as the linear function below.
Y = 361.521 + 32.057 I (4-3)
where: Y = maximum water consumption per day for Tokyo.
The formula coefficient correlation shows a value of 0.986 and the
standard deviation a value of 0.012. This method expresses statis
tically better results than if each factor were used separately. Sasaki
and Sasaki concluded that water consumption per capita appears to show
a larger value in large cities.

105
An interesting and detailed field examination of domestic water
use in East Africa (Kenya, Tanzania and Uganda) was carried out by
White, Bradley, and White (43). Although no predictive equations
were given, the study attempted to relate per capita use to income,
educational level, family size, source of available water, cost,
culture and natural environment. Daily per capita use was found to
range from a minimum of 1.4 litres in a farming household to a maxi
mum of 660 litres in an upper income suburb of Moshi, Tanzania. The
mean per capita use for piped supplies showed a low of 30 litres per
capita daily and a high of 254 litres, while for unpiped supplies the
mean per capita use showed a high of 21 litres and a low of 4 litres.
In general, this study found that per capita use, where water is not
piped into the household, is in large measure a function of the
income level, the urban versus the rural situation, and the number
of children within the household. Where water is piped into the
household a major consumption in water occurs; the amount above that
minimum is a function in considerable measure of cost, income level,
family size and education. Finally, the study found that even where
domestic water demand in the urban areas is relatively price inelastic,
price is of measurable significance.
The influence of the type of housing on water demand in developing
countries can be found in the Accra-Tema Study (36). The average
daily domestic supply to Accra increased by about 11 percent from
1961 to 1963. In this period the population increase was about 9
percent whereas the increase in per capita use of water was about
2.5 percent. In Tema during the same period the average daily
domestic supply increased by about 122 percent. The population

106
increased by about 35 percent, whereas the increase in per capita
consumption was about 60 percent. This difference between the two
cities was due mainly to the construction in Tema of high and medium
grade housing with modern sanitary facilities. In Tema almost all
the houses were connected to the distribution system and had an
average daily domestic per capita consumption of 150 litres in 1963.
In Accra half of the population lived in substandard housing and was
served by street standpipes and the daily per capita consumption was
only 48 litres.
In 1969, Lee (23) selected thirteen sites in Calcutta and New
Delhi in an attempt to measure and define the relationship between
economic development and the provision or need for public water supply
systems through the examination of domestic water consumption. He
concluded without giving any predictive equations, that the demand
for domestic water supply is a function of accessibility to water,
housing conditions, levels of income and water using habits.
Ranke (15) pointed out that although there is little empirical
evidence concerning the nature of price elasticity for water, he
had observed that there was a thirty-six percent decline in domestic
use of water in Boulder, Colorado, after meter installation. He
pointed out that within a metered system relatively small price
changes may not lead to substantial changes in water demand. Howe
and Linaweaver (17), while studying residential water demands using
logarithmic demand models, incorporated several independent variables
for both average domestic demand and sprinkling demand in the United
States, suggesting that sprinkling demand might be relatively elastic
and that domestic demand might be relatively inelastic. Price

elasticity of demand is defined as the relative change in quantity
demanded as response to a relative change in price if one assumes
that the quantity demanded q is a function of price p. Price elasti
city of demand is theoretically given by Howe and Linaweaver as
follows:
E = d.q.p = d(log q) d dp.q d(log p) (4-4)
where: E. = demand function, d
Equation (4-4) can be described by the regression line:
Log Ed = a + b log p (4-5)
where: b = elasticity coefficient.
Fourt (13) performed multiple linear regressions to find relation
ships between water usage and price, number of days in summer, rainfall,
average number of persons per meter and the total population served.
In another study, Wong (47) worked with a set of twenty variables
which he reduced to seven principal components. The most significant
of these factors were community size, per capita demand, price, standard
of living and industrial depletion.
In 1937, Capen (4) developed the following equation for a well-
mete red water demand:
G = 54p0'125 (4_6)
where: G = gallons per capita per day,
P = population in thousands.
Although Capen's equation (4-6) is a good representation of the data
from the fifty-two cities he surveyed, to suggest that population is
the only variable relevant to domestic water demand is invalid.

108
In 1969, Meyer and Mangan (27) developed a model which is known
as MAIN I for calculating water requirements by correlation with
economic, social and climatic variables. Forecasts were completed
for 1A1 Standard Metropolitan Statistical Areas (SMSA) and the final
equation is given as follows:
E75i " (W60i X X'19 X Y ? 5^ " Y 6 0 ± + W60i) ' P75i (4"7)
60i
where: E = total water use
W = per capita use
Y = per capita income
P = estimated population
i = SMSA number
60, 75 = 1960, 1975.
Wastewater Models. The general relationship between per capita
wastewater disposal and socio-economic indicators has not been devel
oped either in developing countries or in developed countries. One
study in India (25) recommended thirty gallons per capita per day for
designing wastewater treatment plants. However, this may not be
valid for high income communities in India or in other developing
countries. In addition, as the life style and economic conditions of
developing countries, change, water demand will likely change as well
as the amount of wastewater to be disposed of daily. In the United
States and other industrial nations, it has been simply a matter
of taking a percentage of per capita water demand for the purposes of
wastewater systems designing.

Water Treatment Cost Models. A water treatment plant, like
many capital facilities, is usually constructed with a capacity that
will satisfy the requirements over many years to come, instead of
just immediate requirements. One main reason for this lies in
economies of scale, available only with a large plant, and which can
be achieved in terms of investment or operating cost. To reflect
possible scale effects, the investment cost of an industrial
facility is often represented by a power function of capacity, of
the following form, first proposed by Chenery (5 ):
C = aK3 (4-8)
where: C = investment cost in thousand dollars
K = design capacity in MGD
a and 8 = coefficients.
In equation (4-8) if we let K equal 1 MGD, C equals a. That means
parameter a is equal to the investment cost of a plant with a capacity
of 1 MGD. On the other hand, g determines the manner in which invest
ment cost changes with capacity. Since 3 is a constant exponent
of K, the investment cost increases with capacity at an increasing
or decreasing rate depending on whether $ is bigger or smaller than 1.
Koenig (21) reported the collection of data on some thirty
surface-water treatment plants in unspecified locations. Using data
on twenty-one of these plants he obtained the following investment
cost function based on the 1964 price level:
C = 307Q °-68 (4-9)
where: C = investment cost in thousand dollars,
Q = design capacity in MGD.
Ackerman ( 1 ) reported an investment cost function for surface-
water treatment plants, using data on forty-two plants reported on

110
by Keonig in 1968. Using the 1964 price level and the Handy-Whitman
Utilities Index for adjusting location differences, he reported the
following function:
C = 267.0Q °-65 (4-10)
s
In the same study, Ackermann produced an investment cost function
for groundwater treatment plants based on data related to fifty-eight
Illinois plants. He adjusted the original data to 1964 price levels
and included the indirect costs of engineering, legal, administrative, and other overhead items including interest during construction, and
obtained the following function:
C = 115Q °*63 (4-11) s
In 1961 comprehensive per capita construction cost data were
compiled (33) for six nations (Brazil, Ceylon, Costa Rica, India,
Jamaica, and Nigeria), representing all three major geographical regions
where developing countries are located. A summary of these construc
tion costs are presented in Table IV.1.
Black and Veatch (2 ) undertook a study to develop a manual
to estimate the cost of conventional water supplies in the United
States. The costs were developed as a function of design flow only.
The costs included all structures, basin, filters, wastewater facili
ties, plant equipment, tanks, piping, fencing, and other materials
necessary for a complete treatment plant. Table IV.2 gives some
results of these findings.
Wastewater Treatment Cost Models. A number of studies (3, 7, 24,
34, 35) have been directed toward describing the cost of municipal
waste treatment. The cost is usually expressed as a function of

TABLE IV.1
PER CAPITA CONSTRUCTION COST OF WATER TREATMENT IN DEVELOPING COUNTRIES
Africa
Asia
Latin America
———~—-—
Country
Ghana
Nigeria
Ceylon
India
Brazil
Costa Rica
Jamaica
ii - :
Per Capita Construction Cost in United States Dollars
Reported
12.74
8.65
42.00
9.05
16.40
23.60
30 - 50
Adopted
13
10
42
12
25
30
40
SOURCE: J. M. Henderson, Report on Global Urban Water Supply Program Costs in Developing Nations 1961-19 75 (Washington, D.C.: International Cooperation Administration, 1961.)

112
TABLE IV.2
COST OF WATER SUPPLIES IN THE UNITED STATES
Design Capacity in MGD
0.1
0.2
0.5
1.0
2.0
5.0
10.0
20.0
30.0
40.0
50.0
60.0
70-0
80.0
90.0
100.0
Well Supplies
20,000
21,000
26,000
34,000
50,000
125,000
250,000
500,000
750,000
1,000,000
1,250,000
1,500,000
1,750,000
2,000,000
2,250,000
2,500,000
Construction Cost
Treatment Plants and Storage
60,000
90,000
140,000
220,000
380,000
700,000
1,150,000
2,000,000
2,700,000
3,400,000
4,000,000
4,600,000
5,100,000
5,600,000
6,100,000
6,550,000
(U.S.$)
Intake & Pumping Stations
40,000
40,000
40,000
40,000
55,000
130,000
240,000
465,000
630,000
800,000
980,000
1,150,000
1,300,000
1,480,000
1,660,000
1,820,000
Operation and Maintenance
($/l,000 gallons)
0.120
0.102
0.078
0.062
0.048
0.034
0.028
0.024
0.024
0.022
0.021
0.020
0.019
0.018
0.017
0.017
,
SOURCE: Black and Veatch, Consulting Engineering Firm, Kansas City, Missouri, Manual for Calculation of Conventional Water Treatment Costs, Office of Saline Water Research and Development Report 917 (U.S. Department of Interior, March 1972)

113
the design flow through the plant or the design population, and the
expected level of waste removal efficiency.
Velz (42) made a study of the costs of waste water treatment
plants. He obtained his data from the literature and from question
naires. To estimate the total cost of a plant, Velz assumed that the
bid price on the construction cost was about eighty to eighty-five
percent of the total cost, excluding the costs of land, engineering,
and legal fees.
Wollman (46) used a multiple regression model to estimate the
operation and maintenance costs of a waste water plant. The model
was as follows:
Y = b0 + bxXi + b2X2 + b3X3 (4-12)
where: Y = the annual operation and maintenance cost per
daily population equivalent (P.E.)
Xi = treatment level in percent of BOD removal
X2 = percent of total waste that is industrial
X3 = population served by the sewage system
bo»bj,b2,b3 = regression coefficients.
Park (28) approached the problem of estimating the construction
cost of a plant by considering both the hydraulic and biological
loadings of the plant. He assumed that the primary treatment plant
costs can be represented by the capacity of the plant in terms of
its hydraulic loading, since the hydraulic loading is an important
parameter for a primary treatment plant design. However, the secondary
treatment plant costs can best be represented by the capacity of the
plant in terms of its organic loading. The author assumed 0.2 lb
of 5 day BOD per person per day and 100 gallons per capita per day of
waste flow.

114
i
Thoman and Jenkins (37) recognized regional differences in
construction costs. To take into account these differences, the
authors partitioned the U.S. into twenty regions on a county line
basis. Each of the regions corresponded to one of the twenty cities
used in obtaining the Engineering News Record-Cost Index (ENR-CI).
They referred the costs to the year 1913 as the base year. Three
models were developed for estimating the construction costs of
primary treatment plants, secondary treatment plants, and stabilization
ponds. The main variable in the models was the design population. The
authors developed the following model:
Y = aXb (4-13)
where: Y = cost of a plant per MGD of flow
X = size of the plant in terms of MGD of flow
a, b = constants.
In 1970 Shah and Reid made a study (34) to develop models for
estimating the construction costs of waste treatment plants. Four
variables were studied to predict the costs of a plant. They were
the following:
1. population equivalent (PE);
2. flow in million gallons per day;
3. BOD of the influent, mg/l; and
4. efficiency of BOD removal.
The cost was evaluated in terms of
1. 1957-59 dollars per design PE; and
2. 1957-59 dollars per MGD of design flow.
Five types of waste treatment plants were modeled:

115
1. primary treatment plants;
2. waste stabilization ponds;
3. standard rate trickling filters;
4. high rate trickling filters; and
5. activated sludge plants.
To adjust the cost data of treatment plants obtained from various parts
of the country to a common base, the WPC-STP (Water Pollution Control-
Standard Treatment Process) Index was used because it is based on
information peculiar to wastewater treatment plant construction.
The general form of the model which was tested was:
Y = B0 + BiXj + B2X2 + B3X3 + B Xi* + e (4-14)
where: Y = construction cost of a plant in 1957-59
dollars per design MGD or per design PE
X! = design PE
X2 = design flow in MGD
X3 = design BOD influent in mg/1
X4 = BOD removal efficiency.
Bo,Bi»B2>B3,Bit = coefficients of regression
e = residual.
It was felt that in some situations, the linear model might not be
able to represent the cost of a waste treatment plant. Therefore,
along with the linear form, the following non-linear forms of the
model were tested as follows:
Y = B + z B X. (4-15) i=l
lnY = B + E B. In X. (4-16) 0 . . 1 1
x=l

116
4 -prr = B + E B. In X. (4-17) lnY o ._. l l
1 4
- = B o + E B X (4-18) J 1=1
The variables, X3 and X^, the influent BOD and the BOD removal
efficiency, were found to be "not significant" statistically, in
the estimation of the construction costs of the waste treatment
plants studied.
The following models were developed.
1. Primary treatment plants:
In Y" = 12.42 + 0.3852 X2 (4-19)
where: Y" = construction cost per design MGD, in 1957-59 dollars.
2. Waste stabilization ponds:
—-—- = 0.1291 - 0.0044 In Xi + 0.0073 In X2 (4-20) In 1
,. = 0.0511 + 0.0001 Xx - 0.0640 X2 (4-21)
where: Y' = construction cost per design PE in 195 7-1959 dollars.
3. Standard rate trickling filter:
lnY" = 7.90 + 0.4007 In Xi - 0.9568 In X2. (4-22)
4. High rate trickling filter:
In Y" = 9.39 + 0.3357 In Xx - 0.6443 In X2 (4-23)
In Y' = 9.39 - 0.6443 In Xj + 0.3557 In X2. (4-24)

117
5. Activated sludge treatment plants:
In Y" = 8.53 + 0.4610 In X1 - 0.7375 In X2 (4-25)
In Y' = 8.53 - 0.5389 In XL + 0.2634 In X2. (4-26)
Studies have been made by Butts and Evans on municipal sewage
treatment construction costs for 291 projects built in Illinois
between 195 7 and 1968 ( 3 ) . Least squares regression analysis was
used to relate design population equivalent to construction costs.
Also regression equations for estimating plant operating costs,
lagoon land costs, and other land costs were developed in the general
geometric form:
C = KPn (4-2 7)
where: C = either construction, operating or land costs
K = regression constant
P = sewage treatment capacity or average annual load treated
n = slope of the least squares regression line.
A new equation was also developed to account for future expansion
of the plant. It took the following form:
C = KPnSm (4-28)
where: C = cost of new addition to old
K = a regression constant
P = capacity of new addition
S = capacity of existing plant
n, m = slope constants.

118
DEVELOPMENT OF THE MATHEMATICAL MODEL
The major aim of this study was to develop prediction equations
to estimate water demand, per capita waste water disposal amounts,
and cost of water and wastewater treatment in developing countries.
The development of a multiple correlation from the analysis of a series
of regression equations is discussed in this chapter. The objective
of the multiple correlation is to provide a function that can be used
to estimate dependent variables that can yield more accurate results
than using the sample mean.
Sample data were analyzed both to determine an arithmetic mean
value for the dependent variable and to determine to what degree this
value varies from the mean by calculating the standard deviation.
The independent variables were individually analyzed by calculating
linear correlation coefficients to determine which variables correlated
best. The result of these analyses determined the order in which
they were added to the regression equation. Regression equations
were then developed starting with a linear equation which utilized
only the most significant independent variable; then additional
independent variables were added to this equation until all the
variables had been utilized. The resultant regression equations
were analyzed after each addition, to determine how much more accurate
the added new variables made them. Variables not significantly improving
the correlation were deleted. Finally, the F-test (defined by
equation 3-15) of the significance was made to determine whether
the degree of improvement in the accuracy of estimated values could
reasonably be arrived at by chance or was statistically significant.

Correlation Coefficients. A good indication of the linear
relationship between independent variables, and the linear relationship
between individual independent variables and the dependent variable,
is the value of the linear correlation coefficient (r) between the
pair of variables.
The correlation coefficient between two random variables, x
and y, with a joint distribution is defined as:
r = Z (xy - xy) -.1 ^
(l(x - x) 2 E(y - y)2)
where: r = linear correlation coefficient of y vs. x
y «= independent or dependent variable
x = independent or dependent variable
y = arithmetic mean y value
x = arithmetic mean x value
xy = product of x and y
xy = arithmetic mean value of xy.
The range of values of the correlation coefficients is from
-1 to +1. A non-zero simple correlation coefficient implies that
there is a linear relationship between the observed values of the
two variables A correlation coefficient of zero can exist between
variables that are independent of one another or between variables
that are dependent of one another in a non-linear way.
Correlation coefficients were used as one of the screening
mechanisms to select those variables which appeared to explain the
magnitudes of the dependent variables of water demand, wastewater
disposal, cost of water treatment and cost of wastewater treatment.
(4-29)

120
Correlation coefficients were also used to determine which
independent variables had a high association between their respective
values; this would mean that the use of either variable in the
regression equation would yield a similar regression equation in
terms of parameters. On the other hand, correlation coefficients
at each stage provide some knowledge in determining which variables
may only appear to explain the changes in dependent variables,
because of a high correlation with a variable that actually explains
the relationship but which appears not to be an important factor
in influencing dependent variables.
Dealing with more than two variables at a time allows the
partial correlation coefficients to be used to measure the linearity
between observation of two variables with all other coefficients
held constant. A partial correlation coefficient is useful because
it removes the influence of the other variables, where two variables
may appear to be correlated because of a common relationship with
another variable and not a relationship between each other.
The partial correlation coefficient of xj and x2 with x 3 held
constant is defined as follows:
T — r r 1 ? 1 ^ ? "\
r,n ,x„ = r„ „x„ = — ^ ^ - ZK xi (4-30) (2,1)3 (1,2)3 f 2 2)h
VJ- r ^ 3 ; u r 2 ^ ^
Multiple Regression. The problem of best-fitting a hyperplane
to a set. of joint observations on a dependent variable which is a
linear function of several independent variables can be accomplished
by the least squares principle. For any linear model, least squares

minimizes the residual sum of squares and provides an unbiased,
linear estimate with minimum variance of the parameters.
The use of matrices is convenient since the computations
increase tremendously as the number of variables and observations
increase. The use of a digital computer is essential if investiga
tion of many possible predictive equations is desirable.
The k equations can be set out in matrix form where Y is a k
by 1 vector of observations of a dependent variable, X is a k by
(i + 1) matrix of independent variables which explains the dependent
variable's value, B is an (i + 1) by 1 vector of unknown parameters
to be estimated and E is a k by 1 vector of residuals. The intercept
term, Bg, dictates that each of the elements of the first column
of the matrix X (X^Q* ^20- • • xko) be equal to one. Matrices
representing a sample of k sets of observations on y and (i values
of x) are:
y i
y2
y3
yk
x =
x01 xll
x02 x12
xi2
xi2
x0k xlk
x0k xlk
Hk
ik
B =
'0
E =
el
e2
, ;k,
Matrix formulation of the observation is:
Y = BX + E (4-31)
The residuals are described by the following matrix equation,
E = Y - XB: (4-32)

122
el
*2
y i
ek j i yk t
x u x21 *il
xik *2k • • • xik bi
b2
" \ \ l *
The sum of squared residuals, can be written as:
k <f> = I e±
2 = Hy± ~ bi X u - b2 X2l - .... i=l
* = y'y - 2b'x'y + b'x'xb.
Differentiating $ with respect to each component of B and setting
the resulting equations equal to zero provides a set of normal
equations:
(4-33)
6b i = 2(-Exuyi + bi£X1:L
2 + b2E x1;L x2i +
+ bkE x1± xki) = 0
-£*- = 2(-Z x2iyi + b-iZ x2iXli+ b2E x2i2 +
+ bkEx2ixki) = 0
-£- = 2( - E x k i y i + bilx^j-xii + b2E x k i x 2 i +
+ b k I xk±2) - 0
The set of normal equations is written in matrix form as:
6$ = -2X'Y + 2 X'Xb = 0 6b
(4-34)

which is equivalent to:
X'Xb = X'Y (4-35)
Stepwise Multiple Regression. Stepwise regression is a variation
of multiple regression which provides a means of choosing independent
variables which will provide the best prediction possible with fewest
independent variables. This computation method was used in this
study to provide the information necessary to select the independent
variables to be brought into the equation.
Typical stepwise regression uses a simple correlation matrix
for the selection of the first independent variable, choosing the
independent variable with the largest absolute value correlation
coefficient with the dependent variable. The selection of subsequent
variables in the typical stepwise regression is made by selecting
from the independent variables the variable having the highest
partial correlation coefficient with the response. The decision of
acceptance or rejection of each newly added variable is based on the
results of an overall and partial F-test. Then stepwise regression
examines the contribution the previously added variables would
have made if the newly added variable had been entered first. A
variable once accepted into the regression equation may later be
rejected by this method.
The only modification made to the typical stepwise regression
procedure was that the variable's order of entry was determined in
part by the results of screening procedures and studies by others
and not by use of a correlation matrix alone.

124
Examination of Residuals. The residual refers to the difference
between the observed and regression equation value of the dependent
variable. The basic assumptions made about the residuals when using
least-squares regression analysis indicate that they are independent,
have a constant variance and zero mean, follow a normal distribution
if an F-test is used. The examination of residuals therefore should
be directed to verifying the assumptions.
If the number of observations is several, one method of identifying
independence of the residuals from one another is examination of the
pattern of the signs (plus or minus) of the residuals to determine
if the observed arrangement is statistically unusual, shown by Draper
and Smith (10). This can include a graphical representation of those
values and examining the sign of the residuals. The observed number
of runs is considered as the number of sign changes plus one. The
probability of the observed number of runs may be obtained from
tables (10) • If the probability of occurrence is less than five
percent, the arrangement is assumed to be non-random.
If the number of observations is greater than twenty positives
and' twenty negative values, another test for independence of residuals
may be made. A normal approximation to the actual distribution of
the number of runs was used as suggested by Draper and Smith (10)
where:
2 nj n2
y = 7 + 1 (4-36) ^ r\\ + n2
2 TL± n2 (2 nj n2 - n1 -- n2)
(rvj + n 2 )2 (n: + n2 - 1)
o2 = : : , and (4-37)

Z = <U - y + *> (4-38)
with ni representing either the number of positive or negative
residuals and n2 being the number of residuals with a sign opposite
of those chosen fornj. y and a2 are the mean and variance of the
discrete distribution of u, the number of runs. The probability of
Z can be determined and if this probability value is low, then an
unusually low number of runs will have occurred, and it will be assumed
that the residuals are non-random and dependent.
The residual mean square value of the model,
, n
^T Z (Yi " Y i ) 2 ' i=l
has the expected value of the error variance, o2, only if the model
is correct. If it is incorrect the residuals contain errors of
two components, the variance error, which is random, and bias error,
which is systematic. If repeat measurements of the dependent
variables are made with all independent variables retaining their
same value for two or more observations, the dependent values can
be used to determine an estimate of the variance error because in
this case only random variation can influence the results. The
procedure used to determine the variance error estimate of a2,
Se2 is outlined by Draper and Smith (10). Suppose
Yll> ^i2> • • •» Yln are n^ repeat observations at Xj.
kl» Yk2» • • •» krur a r e nk repeat observations at X^.
The contribution to the pure error sum of squares from the Xj readings
is then:

126
nl _ nl _ E (Ylu " Yi)2 = E Y i u
2 - rij YX2 (4-39)
u=1 u= 1
where Yj is the mean value of the Y n , Y^* • • • Yln observations.
Similar quantities are evaluated for the other sets of Y's. The
total variance error sum of squares is:
E E1 (Yiu - Y T )2 (4-40)
i=l m=l
and the total degrees of freedom equals
k E (n± - k). i=l
Then the mean square for the variance error is
k ni _ Z E (Yiu - Y ± )
2
S2^ = 1-1 "=1 (4_41)
k E i=l E n± - k
and is an estimate of a2.
Selection, of Best Equation. The square of the multiple correla
tion coefficient or the coefficient of multiple determination (R ),
the ratio of the sum of squares, is one possible criterion for selec
tion of the best equation. However, the importance of an R close
to unity, its maximum value, may be misleading. This is particularly
the case when only a small number of observations are used, because
the increase in the number of variables may have more of an influence
on the accompanying increase in R2 than the related explanation

contributed by the variables. The addition of another variable
to a regression equation will never decrease R2. Draper and Smith (10)
point out that if a set of observations on a dependent variable
has only four different values a four-parameter model will provide
a perfect fit. One method which takes into consideration a number
of observations and the number of parameters is the corrected coeffi
cient of determination (R2) defined by Goldberger (14).
R2 = R2 - (3TT^~1)(1 " R2) (4_A2)
where: R2 = coefficient of determination
K = number of variables
N = number of observations
N - K - 1 = degrees of freedom.
The corrected coefficient of determination does not always increase
with the addition of a new variable to the regression equation. One
of the techniques used to evaluate alternative equations was the
corrected coefficient of determination.
The standard error of estimate, defined as the square root of
the residual mean square, has incorporated into it consideration of
the degrees of freedom of the residual and, therefore, is also a
usable index for evaluating alternative regression equations.
The simple F - test, a ratio of the regression mean square to
the residual mean square, is a measure of the equation's usefulness
as a predictor. A significant F-value means only that the regression
coefficients explain more of the variation in the data than would
be expected by chance, under similar conditions, a specified percent
age of the time. It should be further noted that use of the F-test

128
requires that the residuals be normally distributed. Normal distribution
of water supply and wastewater disposal data cannot be arbitrarily
assumed to exist. However, normal distribution is not required for
regression analysis.
The sequential F-test was used to determine if the addition of
a new variable into the regression equation explained more of the
variation than would be expected by chance. A 5 percent level of
significance was used. The sequential or partial F-test as it is
sometimes called is the ratio of the regression sum of squares
explained by the addition of the new variable divided by the residual
mean square (26) . This calculated value is termed F and is compared
with published values of the F-test to determine the probability that
the explained deviation is significant when compared with the
unexplained deviation.
* c = (De/fe)/(Du/£u) (4-43)
where: F = calculated F value c
D = explained deviation e
D = unexplained deviation u
f = degrees of freedom of D = NV e e
f = degrees of freedom of D = N - NV - 1 u u
NV = number of independent variables
N = number of samples.
A plot of the residuals versus their associated fitted value
of the dependent variable also yields information on any variation
in variance as the magnitude of the fitted value increases.

129
Preparation of the residuals into unit normal deviate form and
comparison of the resulting residuals distribution allows another
examination of the residuals. Using this technique approximately
95 percent of the unit normal deviations would be expected to be within
-1.96 to +1.96. If the residuals are assumed to have a normal distri
bution, their unit normal deviate form should satisfy the above
criterion.
METHODS OF DATA COLLECTION AND PROCESSING
To gather the proper data the developing countries were divided
into three major regions, Africa, Asia, and Latin America, and a ques
tionnaire was prepared, a copy of which is in the appendix for Chapter
IV. Figures for population equivalent (PE) and percent biochemical
oxygen demand (BOD) removal were obtained through the use of formulas.
The following formula was used to calculate PE:
PE = 8.33 QL (4-44)
b
where: Q = average flow in wastewater treatment plant (MGD)
L = average 5-day BOD of the waste (mg/1)
b = 0.17 lbs BOD per capita per day (commonly assumed value),
BOD removal efficiency was calculated using the following formula:
(BOD. - B0De)100 x>9 = BO5I
(4"45)
where: Xig = percentage removal
BOD. = X17 = 5-day BOD influent
BOD = X18 = 5-day BOD effluent.

130
Questionnaires were sent to Africa in March 1974, the Far East,
Middle East and Latin America in May 1974. Due to problems in the
handling of overseas mail and the problems which may arise in data
collection, it was decided to send one questionnaire to local govern
ment offices (capital city or provincial city) and one to those
national government agencies dealing with water supply and waste
water disposal. The questionnaires were sent to ministries of health,
city governments, and water development boards, as well as the following
agencies:
(1) Regional Office for the Mediterranean, World Health Organi
zation, Alexandria, Egypt;
(2) Regional Office for Africa, World Health Organization,
Brazzaville, Congo;
(3) Regional Office for the Pacific, World Health Organization,
Manila, Philippines;
(4) Regional Office for the Far East, World Health Organization,
New Delhi, India;
(5) Pan-American Center for Engineering and Environmental
Sciences, Lima, Peru;
(6) American University of Beirut, Beirut, Lebanon;
(7) University of Nairobi, Nairobi, Kenya;
(8) Asian Institute of Technology, Bangkok, Thailand;
(9) Middle East Technical University, Ankara, Turkey.
Included with the questionnaire was a letter and over-all summary
of the research project on Low Cost Methods of Water and Wastewater
Treatment in Less Developed Countries directed by Professor George W.
Reid.

131
In sampling there always exists the risk, in making an estimate
from data, that a particular sample is not truly representative
of the universal population under study. The risk can be minimized
by the application of probability sampling methods and appropriate
estimation techniques, and also by taking a larger sample than
originally called for (51).
Stratified random sampling, as used in this study requires that
the sampler have prior knowledge about the population with respect
to various categories or strata.
The sampling process involved a number of assumptions about
variables in the universe, as follows:
1. The dependent variable is a random series with a probability distribution.
2. The independent variables are random series with probability distributions.
3. The dependent and independent variables are random series, each with a normal distribution; hence, there is a joint multivariable normal distribution.
4. Further assumptions are required for the random variables for testing and estimation.
Multicollinearity is defined as the intercorrelation among
independent variables. When independent variables are intercorrelated,
it is difficult to disentangle them in order to get precise and
separate estimates of their relative effects upon the dependent
variable, and estimates move further away from their association
parameters. Two of the very few things which can be done to minimize
multicollinearity are:
1. specify variables in the model which are known to be related;
2. check for variables in the model which have the same meaning and eliminate them.

132
To estimate the sample size of this study the Neyman allocation
method (51) was used. The sample size n is defined by the following:
N S • n n = T ^ ~ (4-46) s I N S
s s
where: n = Sample size required for the Sth stratum, s
S = Sample estimate of the standard deviation, Sth stratum, s
n = Number of observations required,
N = The size of the Sth stratum, s
An estimated variance within each stratum was necessary to compute
the sample size required for each stratum (n ). In this study a
random size between 25 and 35 was used to estimate the variance
for each stratum. Finally, n is computed by the following (51):
(IN S ) 2
n = — - (4-47) IN S 2 + N2V2
s s
where: N = total population size
V = desired variance.
V2 is defined by the following:
V2 = p (4-48)
where: d = half width of the required confidence interval
t = level of reliability.
Table IV.3 shows the number of questionnaires sent to and received
from the three principal geographic regions. Also shown is the number
in the samples for which data was used which was found in the litera
ture survey. Using this sample data the partial regression coefficients

133
TABLE IV.3
DISTRIBUTION OF THE COUNTRIES SURVEYED AND SAMPLE DISTRIBUTION
\
\ . Region
^ \
Zaire
Kenya
Zambia
Malawi
Nigeria
Ghana
Uganda
Sudan
Ivory Coast
Central Africa
Libya
Egypt
Morocco
Tunisia
Algeria
Cameroon
Ethiopia
Somali
Malagasy
Liberia
Sierra Leone
Gabon
Mozambique
Rwanda
Mali
Singapore
South Korea
AFRICA
East and Central
X
X
X
X
X
X
X
X
X
X
X
X
X
X
West
X
X
X
X
X
X
North
X
X
X
X
X
ASIA
Far East
X
X
Middle East
LATIN AMERICA
Central and West Indies
South

134
TABLE IV. 3—Continued
>v Region
Burma
Taiwan
Pakistan
Philippines
Afghanistan
Viet Nam
Laos
Cyprus
Iran
Saudi Arabia
Syria
India
Indonesia
Thailand
Lebanon
Jordan
Turkey
; Barbados
Panama
Jamaica
Venezuela
Guyana
Paraguay
Uruguay
Argentina
Mexico
Costa Rica
Trinidad-Tobago
Puerto Rico
AFRICA
East and Central
West North
ASIA
Far East
X
X
X
X
X
X
X
X
X
X
Middle East
X
X
X
X
X
X
X
LATIN AMERICA
Central and West Indies
X
X
X
X
X
X
X
S o u t h
X
X
X
X
X
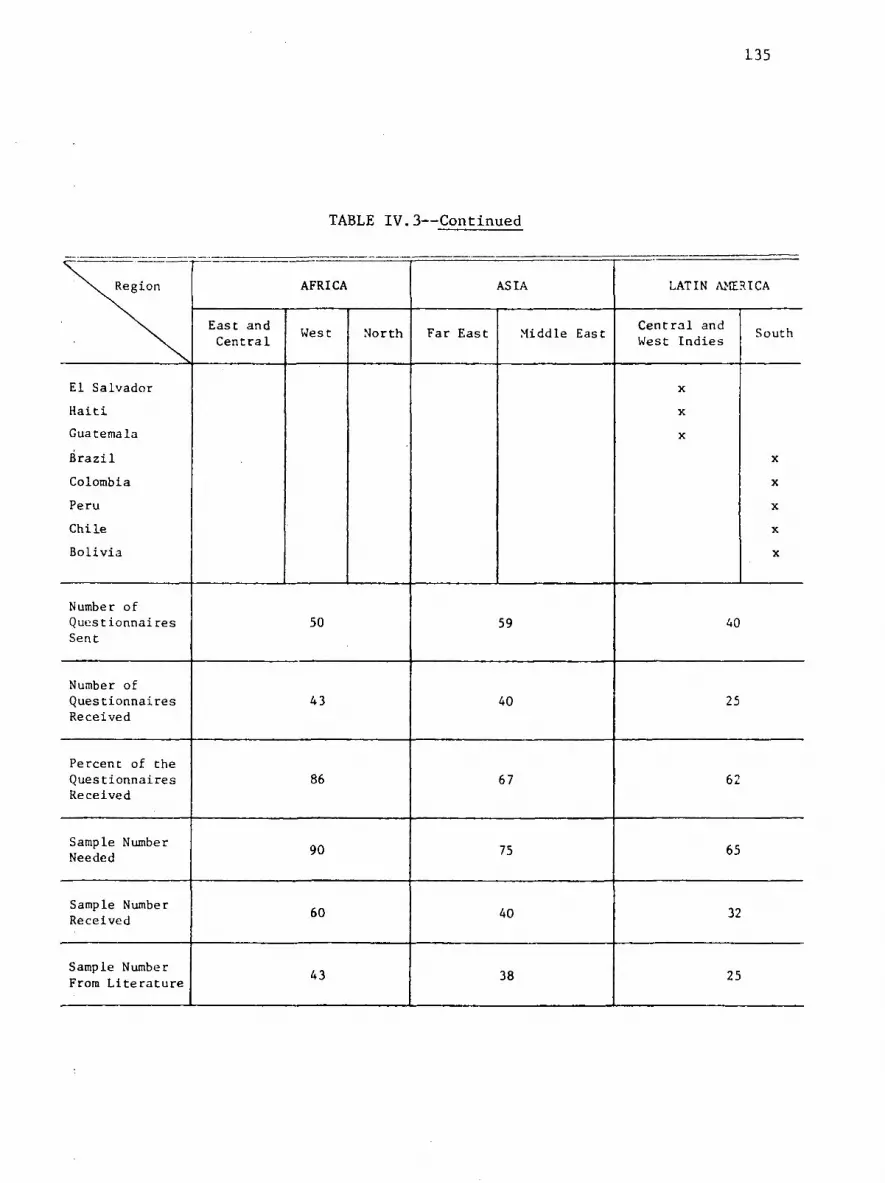
135
TABLE IV. 3—Cont inued
\. Region
\
El Salvador
Haiti
Guatemala
Brazil
Colombia
Peru
Chile
Bolivia
Number of Questionnaires Sent
Number of Questionnaires Received
Percent of the Questionnaires Received
Sample Number Needed
Sample Number Received
Sample Number From Literature
AFRICA
East and Central
West North
50
43
86
90
60
43
ASIA
Far East Middle East
59
40
67
75
40
38
LATIN AMERICA
Central and West Indies
X
X
X
South
X
X
X
X
X
40
25
62
65
32
25

136
for the following forms of linear equations were computed for each
submodel. The form which- gave the best fit was used as the predictive
equation.
The following forms of equations were tested to establish the
best predictive equation:
Y = B + I b, X, (4-49) 0 ! 1 i=l
In Y = b + E bi In X.- (4-50) 0 1-1
1 k
T v = b + I b. In X. (4-51) In Y o . , l i
In Y = b + z b. X. (4-52) o . , i l
i=l
1 k
4 = b + £ b. X. (4-53) Y o . , i i
i=l
where: Y = dependent variable, Dw, Dww, Cw, or Cww in this study
X. = independent variable, X\, X2, . . . X22
b ,b^ = partial regression coefficients.
RESULT OF DATA ANALYSIS
Many of the questionnaires received did not include BOD information.
Some questionnaires reported that waste water disposal was not yet
developed; thus, related data could not be supplied.
Water Demand Model. In developed countries where data are
abundant arid where water demand information is readily available, the

137
problem associated with evaluating design capacity is usually not
too serious. Since a large proportion of water supply design is of
the nature of expansion rather than new supply, it is usually possible
to analyze meter records to obtain indications of per capita water
demand.
Such is not the case, however, in developing countries. These
systems are generally new; hence, historical demand records do not
exist. In this situation use is often made of per capita demand in
developed countries. These figures are often inappropriate for
specific design situations in a developing country, since socio
economic conditions of a community in a developed country are often
significantly different from those of a community in a developing
country. Furthermore, water systems in developed countries meet
additional large commercial and town irrigation demands.
The primary concern of this part of the model was to develop
water demand predictive equations utilizing socio-economic, environ
mental and technological variables from developing countries. Data
from developing countries were analyzed using eight independent
variables as shown in Figure IV.1. The sequential F-test indicated
the non-significance of variable X±. Furthermore, there was no
improvement of the regression equations with temperature (X7) and
precipitation (Xg)• There was a good correlation between water
usage and variables X2, X5, and X5. In the United States, the Reid
study (31) showed precipitation, income, population and lifestyle,
as indicators of water usage.
Equations for predicting water demand for three regions (Africa,
Asia, and Latin America) are presented below. Each satisfies the

138
sequential F-test criteria and the corrected coefficient of determination.
D , = 22.0341 + 0.0973 X2 w.af
D , = 12.7200 + 0.0683 X2
w.af z-+ 0.0142 X6
D = 7.1476 + 0.0827 X2 w.as
D = 6.6317 + 0.04597 X2 w.as
+ 0.2204 X5 + 0.0263 X6
D . = 15.3981 + 0.0663 X2 w.la z
D . = 13.7401 + 0.0645 X2 w. la z
+ 0.0682 X5 + 0.0330 X6
R2 = 0.953
R2 = 0.968
>2 =
R 2 _
0.902
0.953
R2 =0.968
R2 = 0.810
R2 = 0.897
(4-54)
(4-55)
(4-56)
(4-57)
(4-58)
(4-59)
whe re: D , = water demand in Africa in gallons per capita per day (gpcd) w. at
D = water demand in Asia (gpcd) w.as
D , = water demand in Latin America (gpcd) w.la 6r
Xo = population of the community served by water supply in thousands, where X2 < 1000
X5 = percentage of homes connected to water supply systems
Xg = average national per capita annual income in U.S. dollars.
Wastewater Disposal Model. To obtain optimum design of wastewater
treatment plants, the amount of sewage provided must be estimated,
developed countries use seventy-five percent of water demand as the
criterion for designing wastewater plants, but this may be not applicable
to developing countries. The primary purpose of this part of the
model was to develop equations for predicting the amount of sewage
produced per capita per day.
Sample sizes of 49, 55, and 46 were used in this model. Variables
Xg and X\2 were non-significant. Good correlation between per capita

wastewater disposal and variables D , XJQ and XJJ were obtained.
The equations for predicting per capita wastewater discharge daily
are presented below. Each satisfies the sequential F-test criteria
and the corrected coefficient of determination.
D = 0.2840 + 0.6670 D R = 0.890 (4-60) ww.a f w
I) . = 0.6442 + 0.4614 D ww.a r w
+ 0.0079 X - 0.0341 X R = 0.960 (4-61)
D = 0.7266 + 0.7399 D R2 = 0.908 (4-62) vw.as w v '
D = 0.993 + 0.4614 D ww.as v
+ 0.004 7 X R2 = 0.952 (4-63)
D . = 0.16.52 + 0.7508 D R2 = 0.990 (4-64) ww. 1 a w D . = 0.1835 + 0.6164 D ww.la w
- 0.0368 X R 2 = 0.999 (4-65)
where: D . = wastewater disposal in Africa (gpcd) ww.af
D = wastewater disposal in Asia (gpcd) ww. as
D , = wastewater disposal in Latin America (gpcd) ww. la
D = water demand (gpcd) w
X = percentage connected to public sewerage systems
X = percentage of household systems.
Water Treatment Cost Model. Cost data on water construction,
operation, and maintenance were analyzed after all the costs had
been projected to U.S. dollars using International Financial Statis
tics (20) and then projected to 1975 U.S. dollars assuming 6h per-
cent annual inflation. An examination of the correlation matrix
indicated a high correlation between D and X15 and therefore only
one of those two variables was used in any one of the regression

140
equations. For slow and rapid sand filter processes, equations
predicting construction cost for both per capita (C' ) and per MGD w
(C" ) design were evaluated. Also, operation and maintenance cost w
per capita per year (C1'' ) and per MGD per year (C"" ) were evaluated. w w
A sequential F-test justified the acceptance of each variable
into the regression equations. In all regions good correlations
were obtained using water demand (D ), technological indicator (Xi3),
population (X^) , and design capacity (X15). The logarithmic
transformation of variables gave the best fit. Each equation
satisfied the corrected coefficient of determination.
The best fit equations for predicting construction, operation
and maintenance costs for slow sand filters are as follows:
t C = 2.6436 + 0.0988 I D n w.af n w
- 0.20651 I X.. n 14
I C n w.af - 3.4537 + 0.0089 ln D w
-0.1321 I X.. n 14
I c" , «= 0.4346 + 0.0160 I D n w.af n w
- 0.3628 I X.. n 14
R = 0.810 (4-66)
R2 = 0.806 (4-67)
R2 « 0.756 (4-68)
I C .. = 1.6217 - 0.6203 I X, . n w.af n 15
R^ = 0.865 (4-69)
I C = 2.7436 + 0.0088 I D n w. a s n w
- 0.1065 I Xn/ n 14
ln c" w a s = 3.6044 + 0.0100 *n x ^
- 0.1065 I X., n 15
R = 0.887 (4-70)
R = 0.876 (4-71)
I C = 0.5017 - 0.0751 I X,, a w.as n 14
R2 = 0.770 (4-72)

141
I C -- 2.1243 - 0.1018 I X, , n w.iis n 14
- 0.4891 I X1C n 15 R = 0.902 (4-73
I C* - 2.5461 + 0.0096 I X , , n w.la n 13
- 0.3628 I X., n 14 R = 0.640 (4-74)
i C 3.7997 - 0.0799 £ X, , n w.la n 14 R = 0.592 (4-75)
£ C" . - 0.3559 - 0.1511 I X, . n w.la n 14 R2 = 0.804 (4-76)
I C"" . = 1.6751 > 0.0016 £ X,, n w.la n 13
- 0.6315 I X1C n 15 R2 = 0.579 ( -77)
where: C' - = per capita construction cost, Africa ($U.S.) w. ar
C" c = per MGD construction cost, Africa ($1000 U.S.) w.af
w.af = per capita per year operation and maintenance cost, Africa ($U.S.)
w.af = per MGD per year operation and maintenance cost, Africa ($1000 U.S.)
C' = per capita construction cost, Asia ($U.S.) w. as
C" = per MGD construction cost, Asia ($1000 U.S.) w.as
C"' = per capita per year operation and maintenance cost, W'aS Asia ($U.S.)
w. as
C1 w.la
= per MGD per year operation and maintenance cost, Asia ($1000 U.S.)
= per capita construction cost, Latin America ($U.S.)
C" , = per MGD construction cost, Latin America ($1000 U.S.) w. la
C"' = per capita per year operation and maintenance cost, Latin America ($U.S.)
C"" = per MGD per year operation and maintenance cost 3 Latin America ($1000 U.S.)

142
D = water demand (gpcd) w '
X _ 5= percen tage cost of imported water supply m a t e r i a l s
X , = design popula t ion for water supply (1000's)
X = design capac i ty for water supply in mi l l i on ga l lons per day (MGD).
Equations for p r e d i c t i n g c o n s t r u c t i o n and maintenance and opera t ion
cos t s of r ap id sand f i l t e r s are as fo l lows:
I C = 3.1325 + 0.0024 t D n w.af IT w
- 0 . 8 8 5 I X, , n 14
I C" = 5.8975 -f 0.0097 I X. , n w.af n 13
- 0.012 7 I X,. n 14
R" --= 0.902 (4-78)
R" =•• 0.859 (4-79)
I C" r = 1.9229 + 0.0396 f D n w. a i: n w
- 0.2596 I X,, R* - 0.953 (4-80)
I C"" . = 4.7581 + 0.023 £ X, „ n w.af n 13
- 0.0370 i X,r n 15 R* = 0.865 (4-81)
£ C* =•- 3.3160 + 0.0017 I X, 0 n v;.a.s n 13
- 0.0901 I X.. n 15 R'" - 0.870 (4-82)
I C* , I "n " w.as = 6.3884 + 0.00G5 "" X, _ n 13
- 0.0380 £ X,r n 15 R* = 0.877 (4-83)
I C " = 2.7466 + 0.0088 P U n w.as n w
- 0.2065 I X,. n 14 R^ - 0.940 (4-84)
t C"" = 5.0991 + 0.024G I X. , n w.as n i3
0.0553 I X.r n 15 R* = 0.902 (4-85)

143
R2 = 0.876 (4-86)
R?' = 0.960 (4-87)
R2 = 0.897 (4-88)
R2 = 0.968 (4-89)
Wastewater Treatment Cost Model. The last set of predictive
equations were developed for construction, and operation and main
tenance costs of wastewater treatment for the three regions using
seven independent variables as shown previously in Figure IV.1.
Variables X17, X18, Xig, and X22 were non-significant since most of
the wastewater plants did not provide influent and effluent BOD
values. The variables Xjg and X2o gave the best correlation for
all wastewater treatment processes (stabilization lagoon, aerated
lagoon, activated sludge and trickling filter). The technological
indicator (X2i) appeared in the regression equations of the three
more advanced wastewater treatment processes (aerated lagoon, acti
vated sludge, and trickling filter), especially in the operation
and the maintenance equations. The conclusion is that in the developing
countries machines such as aerators, motors, and chemicals have to be
imported for these processes. Therefore, in developing countries
where land is cheap the stabilization lagoon or other land-type
processes are the appropriate technology.
I C , = 3.4597 + 0.0021 I X, „ n w.la n 13
- 0.0901 I X,c n 15
I C" , = 6.1320 + 0.0027 I X,. n w.la n 14
- 0.0236 I X,c n 15
I C" ., = 2.012 7 + 0.0238 I X, , n w.la n 13
- 0.3007 I X,c n 15
I C"'" , - 4.7829 + 0.0448 I X, „ n w.la n 13
- 0.0530 I X,c n 15

144
Each equation developed satisfied the sequential F-test and
corrected coefficient of determination except for equations
4-110 and 4-117. The best fit equations for predicting construction,
operation and maintenance costs of stabilization lagoons are:
I C1 , = 1.3955 - 0.1845 I X., n ww.af n 16 R « 0.9S0 (4-90)
I C" . = 4.0770 - 0.0440 I X, , n ww.af n 16
R^ = 0.826 (4-91)
I C,M e = - 0.2532 - 0.2837 I X,, n ww.at n 16 R?" = 0.917 (4-92)
I £'•" , = 2.0967 - 0.2683 I X,, n ww.af n 16
- 0.0345 I X0„ n 20 R = 0.864 (4-93)
^n C w,as'= 1.5304 - 0.2152 I X, , n 16
R" = 0.806 (4-94)
£ C" = 4.9849 - 0.2594 I Xn, n vw.as n 16 R' = 0.5B0 (4-95)
I C" = -0.3274 - 0.1.846 I X, , n ww. as n 16 II = 0.788 (4-96)
I C"" = 2.2242 - 0.0035 I X,, n wv.'.as n 16 R - 0.784 (4-9 7)
I C' . = 1.7880 - 0.0979 I X,, n ww.la n 16 R" = 0.810 (4-98)
I C" . = 4.6571 - 0.0079 I X, , n ww.la n 16
- 0.0043 I X_-n 20
R = 0.960 (4-99)
•I C" . « 0.2597 - 0.0879 I X16 n ww.la n R --= 0.806 (4-100)
I C"" , - 2.5720 - 0.2160 £ X,, n ww.la n 16
- 0.0024 I Xon n 20 R = 0.848 (4-101)

145
Equations for predicting construction, operation and maintenance costs
of aerated lagoons are as follows:
I C = 1.4763 - 0.1132 I X., n ww.af n 16
R = 0.990 (4-102)
I C" , = 4.8764 - 0.0025 £ X., n ww.af n lb
- 0.1214 I Xon n 20 R - 0.861 (4-103)
£ C" . = 0.1136 - 0.1435 £ X_, n ww.af n lb
R = 0.865 (4-104)
£ C"" c = 3.7754 - 0.2854 £ X.n n ww.af n 20 R = 0.853 (4-105)
£ C = 1.6395 - 0.1565 £ Xnz: n ww.as n 16 R = 0.898 (4-106)
£ C" = 5.0595 - 0.0475 £ X,, n ww.as n lb
- 0.2105 I X„. n 20
R = 0.988 (4-107)
£ C" = 0.3561 - 0.0955 £ X,, n ww.as n 16
R » 0.958 (4-108)
£ C"'" = 3.9509 - 0.2170 I Xon n ww.as n 20
+ 0.0032 £ X-. n 21 R = 0.853 (4-109)
I C . = 1.7581 - 0.1461 £ X,, n ww.la n 16
£ C" . = 5.4210 - 0.1645 £ X^n n ww.la n 20
(4-110)
R2 = 0.956 (4-111)
£ C " 1 = 0.21.149 - 0.1600 £ X w n wv/.la n 16 R = 0.921 (4-112)
' n C'ww.]a " 4 - ° 2 3 - °'3659 ln X20 R = °'9/,S (4"113>
Equations for predicting construction, operation and maintenance cost
of activated sludge treatment, are as follows:

146
I C' = 3.0051 - 0.3090 I X. , n wv/.af n 16
R = 0.984 (4-114)
I C" = 6.5907 - 0.3020 £ Xon n ww.af n 20
+ 0.0021 I X01 n 21 R = 0.917 (4-115)
I C,M . = 1.5225 - 0.3307 I X,. n ww.af n 16
+ 0.0032 I X01 n 21
I C"M . = 5.1250 - 0.3355 I X.n n ww.af n 20
0.960 (4-116)
(4-117)
I C' = 2.8597 - 0.2890 I Xn, n ww.as n 16
+ 0.0201 I X01 n 21 R = 0.937 (4-118)
I C" - 5.7594 - 0.2645 I X,, n ww.as n 16
+ 0.2644 I X.. n 21 R2 - 0.902 (4-119)
I C"' * 1.7534 - 0.4269 I X,, n ww.as n 16
+ 0.0021 £ X0. n 21 R = 0.948 (4-120)
I C"" = 4.9224 - 0.2754 -f X , n ww.as n 16
+ 0.0021 J? X„, n 21
*• C . = 2.8967 - 0.2709 I X,, n ww.la n 16 R =
0.948 (4-121)
0.940 (4-122)
£n C".n, ia = 7.2754 - 0.0035 I X., n ww.la n 16
- 0.3575 I X__ n 20
£n C " ™ To = 1-7526 - 0.4002 I X,, n ww.la n 16
R" - 0.968 (4-123)
R2 = 0.887 (4-124)
4, C"'L ia = 5.6075 - 0.0073 I X., n ww.la n 16
- 0.3902 £ X„. n 20 R = 0.865 (4-125)

147
Equations for predicting construction, operation and maintenance cost
of trickling filter treatment are as follows:
I C = 3.1058 - 0.25A6 l X. , n ww.al n 16 R = 0.938 (4-126)
I C" - 7.2400 - 0.5503 >- X,,_ n ww.al . n 20 R" = 0.966 (4-127)
I C" ,. -- 1.5591 - 0.3105 ^ X,, n ww.ar. n 16 R = 0.910 (4-128)
f C"" r = 5.1240 •- 0.3355 * X.,_ n v.v.iif n 20
+ 0.0024 ^ X..n n 21 R" = 0.958 (4-129)
c C = 3.0021 - 0.3410 " X,, n ww.as n lo
+ 0.0124 ^ X2 R" = 0.966 (4-130)
1 C" = 7 .0453 - 0 .5709 l Xort
n ww.as n 20 R = 0 . 9 4 0 (4 -131)
I C*" = 1.864.1 - 0 . 3 5 0 7 £ X , , n ww.as n 16
R = 0 . 9 1 3 ( 4 - 1 3 2 )
£ C"" « 5 .2594 - 0 . 2 6 5 9 £ X w
n ww.as n 16 + 0 . 0 2 1 1 I X_,
n 21 R2 - 0 . 8 9 6 (4 -133)
I C ., - 3 .3345 - 0 . 2 4 9 1 I X , , n ww.la n 16 R = 0.929 (4-134)
I C" , - 6.9852 - 0.3294 I X„-n ww.J a n 20 R = 0.958 (4-135)
I C"' , n ww.la 1.7543 - 0.2009 I X 6 R = 0.937 (4-136)
£ C,m . n ww.la 5.975 - 0.2956 I X2Q R = 0.900 (4-137)

148
C' „ = per capita construction cost, Africa ($11.S.) ww.af
C" ,. = per MGD construction cost, Africa ($1000 U.S.) ww.af
C"' = per capita per year operation and maintenance cost, w , a f Africa ($U.S.)
C"" = per MGD per year operation and maintenance cost, w , a f ($1000 U.S.)
C' = per capita construction cost, Asia ($U.S.) ww.as
C" = per MGD construction cost, Asia ($1000 U.S.) ww. as
C"' = per capita per year operation and maintenance cost, ww'as Asia (U.S.)
C"" = per MGD per year operation and maintenance cost, W W - a S Asia ($1000 U.S.)
C' , = per capita construction cost, Latin America ($U.S.) ww. la
C" , = per MGD construction cost, Latin America ($1000 U.S.) ww. la
C"' , = per capita per year operation and maintenance cost, Latin America ($U.S.)
C"" 1 = per MGD per year operation and maintenance cost, "" Latin America ($1000 U.S.)
X.., = design population for wastewater (1000's) lb
X„n = design flow of wastewater plant (MGD)
X. . = percent of cost of imported wastewater disposal materials.
Comments Regarding Models. The non-logarithmic linear form
resulted in better predictive equations for the water demand and
wastewater disposal models, producing higher R values and satisfying
the sequential F-test criteria. The log-log linear form gave better
predictive equations in water and wastewater treatment cost models.
In almost all cases, the rapid sand filter construction, operation
and maintenance costs were correlated with variable X13, percentage
of cost of imported water supply materials, while activated sludge
and trickling filter were correlated with variable X21, percentage of

149
cost of imported wastewater disposal materials. This shows that an
abundance of materials have to be imported for constructing, as well
as operating and maintaining these high technology processes.
In Tables IV.4,5,6,7 correlation matrices, degrees of
freedom, deviations, residual mean squares (RESMS) are given for
estimating standard errors of estimated expected values with a
ninety-five percent confidence interval. Table IV.8 shows typical
construction, operation and maintenance costs of slow sand and rapid
sand filters for selected socio-economic and technological conditions
using the predictive equations. Table IV.9 gives comparison costs
of wastewater treatment processes for the Cpheri-Nagpur study done
in India (25) and the predictive equations developed here. Tables IV.10-
17 in the appendix for Chapter IV give results obtained with the equations.
ADDITIONAL RESEARCH
Additional research is needed to evaluate and strengthen the
models developed in this study.
(1) It is possible that these models could be refined by
inclusion of additional socio-cultural data. This would
require fieldwork in one or two countries as case studies.
(2) Case studies of water demand are needed from two areas.
These would include more detailed data than could be obtained
by mail survey.
(a) One country should be selected among the arid areas of the Middle East, for example, Saudi Arabia.
(b) Another country should be selected in a tropical region, for example, Zaire.
(3) More mathematical models should be developed which are
based on conditions of developing countries and

150
ION
S D
EV
I AT
x
cc f—
< z o
< • — 1 •
cc o < J
z
E 10 4)
CC
s O X
i n X
r>j X
NO m
u
so Csl
I A C M
o
NO s O
m i n
(->
CM CM
o
oo
M l CM CM
o
o o i n l
l NO
X
1
( A X
o m o w
CM N *
CM
O o o
1
o o o o o
v O
o o o
. o o o
d i n
o o o o"
C M
o o o o
»*-IB
i
o
o o CM
d
o m en
m so
sO
d
m m
i •
i i s O s O
X X
GO
1
m X
I A r-N. CO
CM
C M Q
o O
O
o O
o o o
. o o o o 1
o o o o o I A
_— o o d o o o o
d
«s
i a
o -a-i
i m
X
m CM
1 CM
x
r .
o o o o
1
,_ o o o o
,_ o o o o
1
o o o o o CM CM o o
d o o o o o
_ IS
3 o
1300W QNVH30 cJ3J.Vrt
to V
z> IB
> •a 01 *J
o CI a X a i
T > V *-i IB
E 4*» tA 01
1 * .
o
o w.
rd
er
10 • o c 2 U l
, sO 0 0
n i
CM 1
o> GO
U
U M
T J
-*» ' *
N O X
CM X
NO CM
u CM
+ v O C M
X NO NO
<_> + CM CM
X CM CM
O
.-Tz a B a «! m
w-" O
I A CTl
4-1 + 1
0
*»-15
S O S O
•
-•• / s
, _ t
S O X
m X
v O i n
C_) CM +
s O X
CS1 X
s O «sl
o CS1
+ i n X
CM X
m CM O CM +
s O CM
X
so s O
+ i n
CM X
m m O
+ CM CM
X CM CM
U
4 x
i n 02
w-•o i n
a\
+ 1 g
<n IS
1/1
S O •
<•-• o
-*• / V
*—* SO X
m X
s O
m o CM +
S O X
CM X
S O CM
O CM +
t / \ X
CM X
i n CM
CM + NO
CM X
s O SO
+ i n
CM X *
i n i n
+ CM
CM X
CM CM
4= N V tfl
s ID 01
OS
u~ •o
m en
*J
+ i t IS
"— o
o
1
>
z
II
% T 3 01 01 IJ
l u
(*H
o CO 01 01
u 0 0 01
T J
0
I M
•a
. in
o> u a 3
m
mea
n
^H
a 3
•u • H 10 01
). 1
g to 01
OS
• (0 01
. -1 J 3
« • H 14
a >
>M O
t . 01
Xi
5 a
n >
to i
• H 4J
erva
n X I
o 14-1
o VJ
01 JO
i c n
z

151
m z o
AT
I
> UJ o
X
— C£
h-• I TL
Z
o k-
< — _ l —
ce o o
z
<n E (A 01
CC
_ — X
o
X
X T J
,— #— o
u
^ " * •
5 O
o — J _ ~ r
o
O ^ o
o
i o
a\ •&•
oo M 3 m CM
O
i n
r~ i
•— —— X
*» i n
-» i
o •— X
* • — *
l / \
• \ o 1
5 O
,— O
o o
o t
o o o
o
o o o « o
1
o o o o
o NJ5
— o o o
- X f M
o o
o
l i ra
I a
i n i n
-» r*» CM
•*" o
j %
— 1
•«~ m—
X
CM •
1
1
o ^ X
*•-» i n • a -
i
i
X a
o o o o
o r—
•— o o
o . - . . ; 1 j . -
o i n
o o
o
r ^ O O O
O
a o o o o
M
m o o
o
IA 10
I o
\ o -a*
<n o i n - 3 -
O
*+ en en i
i v -
•— X
» m CM t
1 ©
— X
,~>. oo . 3 -
1
J o
o o o o
o
cv o o o
o
o~> o o o
o
CM
o o o
o M CM
o o o
o o
o
o
10
i o
n300W WOdSIO M3J.VM 31SVM
t ) 3
tS
> * J
o
X
o> •o V 4-> 10 E
M
i n a)
u-o
m i . O l .
u V •o l -10
•a c •0 * J
m
in •
•4 -
•*<
»— — X
o X
o •»•• o
CM
+ X
X
*~ X o
CM • f
©
x"x • o
o
X C I CM
+_ X
» • -
+ o — CM
X
o **~ o ^ o
+ X CM
^ f o
+ - H | 3 !
\—*•
1 to 4)
^ Of
*4-
» i n
o>
U
a
i I / I
m l •o
•*«
««« •» X
o X
-o
o CM
+ X
3 • o
•-X o
CM
+ o X
X •o
o
X o CM
+_ CM
X
*—
+ o r—
CM X
o • ~
o
o + X
CM • D
I O
+
g 0)
PC
•o i n
a> • *J
+ i n
(0
J m
CM - 3 -
1
•**
^** — X
o X
-o
o CM
+ X
X • a
* X
CM
+ o X
X t>
o
X CM
+ CM
X
»
+ o • CM
X
o ~~ o • ^
u +^ X
CM
' I O
• H | Z
91 01
etf
i n C M
• *J
+ i • n
J v>

152
w m <
H to W
o Pn
CO
z o M P cr w
vn
-a-
O — -T <J\ O <*>-* O ~- •— xO C\ O N - T O O O O O — f\ -3" r"\ O O O 0 0 0 0 0 * N I O O O O O O O O O O O O O O O
O O O O O O O O O O O O
v o o — o*flOtr>\o»~- o o O O — O — O O O CsJ — O O O O O O O O O O O — O O O O O O O O O O O O O O
O O O O O O O O O O O O
O — CO O — — O \0 O — — O O — O ^ ) - - 0 - O ^ r o O O O O — — O O O O O O O O O O O O O O O O O O
Q p O O O O O O O O O O
?«•» O — — f^ IA O CO O *-» — O 0 0 * 0 CM — O <""> O O C» OO O O O O O O O O O O O O O O O O O O O O O O O O O
O O O O O O O O O O O O
\© — — O — — O N ( T i O - T t / \ o (•*** -2" o v o r A o — J- C ( n o o o o o o o o o o o o — o o o o o o o o o o o o o o o o o o o o o o o o
— — -T O - O x O 0>C0 LT» CG s*> — \o en— o o — o o - 3 " 0 0 O O O O O O O O O — O O O O O O O O O O O O
o o o o o o o o o o o o
— j ~ o • — y — — c n o - •*-*>© - 3 - 0 0 — o v O ^ r o o - — o o o o o o o o o o o o o o o o o o o o o o o o
o o o o o o o o o o o o
O — «•**»- <T\ •— — O — — — CM o o o o o o N J - C O vo n ^ -o — o o o o o o o o o — • o o o o o o o o o o o o
o o o o o o o o o o o o
. o *> co — o — o • — r — C M O — 0 0 » * > 0 0 0 * O O C * " * O O O O O O O O O O O O O O O O O O O O O O O O
O O O O O O O O O O O O
_ 0 — — O — — O o-\— . O — — C M O O O O O O - 3 1 — O O O O O O * — O O O O O O O O O O O O O O O O O
O O O O O O O O O O O O
O — O ( M 4 - — - ^ J ' O ' - O O -3" O O O — r o O O O - 3 - O O O O O O O O O O O O O O O O O O O O O O O O O
O O O O O O O O O O O O
O — O ^ — O ^ O - J O O —• O" _g- 0-\ — f s i O O O O O O — O
0 0 — — — o o — o o o o O O O O O O O O O O O O
O O O O O O O O O O O O
J- vDOO - O OO O C H O - - N o c*~> o **•» o o o o o o r«-\ —• O O O O O O O O O — O O O O O O O O O O O O O O O O O O O O O O O O O O
_ _ ^ _ _ — O — — — ~ O -JT O — CM — O O r - ^ v D ^ - T O O O O O O — O O O O O O O O O O O O O O O O O O
O O O O O O O O O O O O
- a - o o o o c n - a - o c o o — J -c"v o — O N O O O O O O O O O O O O O c ^ o O O O f M O O O O O O O O O O O O O O O O O O O O O O O O
0 < ~ i — n o — r*"*-3' — O O - — o o — o — r s i o o o o o — O O O O — O O O o J O O — O O O O O O O O O O O O O O O O O O O O O O O O
O C O O — \£> O — \D O — CO O o o o r n o o o — o r - o o O O O — O O - J O O O O O O O O O O O O O O O O O O O O O O O O O O O O O
Lf\r«^0 v O O — N m ^ O O — o o — o o o o o — <^in r^ O O O O O O O O O O O O O O O O O O O O O O O O O O O O O O O O O O O O
O O O O O O O O O O O O
M3riu OMVS nons
-3" »*•*. \0 O O O — — O •— O CO ^ _ ,_ O O O r ^ r o c n ^ O O O O O O O O O — O O O O O O O O O O O O O O O O
O O O O O O O O O O O O
O — O O O O — C O — O O O CM O CF\ O -— OJ O O O — **\ O O O O O C M — O O O O O O O O O O O O O O O O O
O O O O O O O O O O O O
U - **- H - l» - t/> t/l
<u to t Ti n> it
i.|:il il^IM-SI O O O t_J O O O CJ U U U U
U3J.1IJ ONVS OldVM
n
ai
•o <u
x
5
-H |Z
CI
a:
+ 1 H
E

Q) 3 C
•H 4-1 C O
O I I
vD
De
via
tio
ns
z
E
0) cc
i n
-3"
X
X
3 "O
k/\ i n m m o ^ o c n c r x c n c n c ^ O " *
O O O O O O f*> r*» O •— ~- O l A i n r v m u M A O — <M O N U N P - W O Ol r ^ - 3 O v O O CT\ O O -3"
o o o o o o o o o o o o
_ _ — — *->. y^. -—* *-*. - J - r -3" -3-— — — — CT\ ff\ C \ 0> — — — —
1 1 1 1 1 1 1 1 1 1 » 1
i i i i I I I I i I r i
X X X X X X X X X X X X c c c c c c c c c c c c
o o o o *-% --*. * - * —»«—* —* -—* ^ ^ o o o o c n < n a i f f i m m u M n C M C M C N | r s | C s J C M < M C N - 3 " - T - d - - T 1 1 1 1 1 * 1 1 1 1 1 1 1 1 1 1 1 1 1 • 1 t 1 1 ^ r -3" - r - a * - * - T -3* - x - x -3- - 3 -3*
x x x x x x x x x x x x c c c c c c c c c c c c
o o o o —» ^-* —>. *-* co co co co .— ^ - — — \ 0 v O \ D \ D — — ~- •—
I 1 1 1 1 1 1 1 1 t 1 1
t 1 t 1 1 1 1 1 1 1 I t
X X X X X X X X X X X X c c c c c c c c c c c c
r»-\ r*"\ r^ r^ -3" -J" -3" -T sO ^O vO ^ I I I I + + + + I I I I
1 1 1 1 1 1 1 1 1 1 1 1 J ? 2 5 5 J J J ? J 5 S
o o o o o o o o o o o o c c c c c c c c c c c c
U - M - *« - • * - V tfl i/» t/> Q ID <D TJ rtJ flj *0 fll fl> fl) ro I Q • • — • - • -
l * : f : l !-!:?:$ M-'fcl U U U ( _ > t - ) O t _ > O O U O O
aanu OHVS MOTS
' ' •
CO OO CO 00 QO CO GO CD l A l A L f M A _3" .J- «3" -3- m m t n m . 3 - . 3 - - 3 - .3"
C> o r*t r~* — N O c n o V A - \ 0 S 0 \ I 3 O O O O O O J " - 3 " O O O c v t - I A C O O (T<^) r n - T l A CT\
o o o o o o o o o o o o
>—>. *—>» *—**—% J " -3" -3" - 3 CTX C \ C \ CJX
i i i t - 3 - . 3 - - 3 - - 3 ' r ^ ' r \ c ^ m
w « — < w w | | | 1 | t t •
t A U M A l / l 1 1 ( 1 1 1 1
c c c c x x x x x x x x
^-H—*-~* . .^ . . ^ ^~»--*.--* in i n i n i n U M A l A l A <^l " 1 <n ^ • • • • — — — - - < N N < N ( N v 0 v O ^ " ^ 1 1 1 1 1 1 1 1 1 1 1 1
1 1 1 1 1 1 1 1 1 1 I 1 . T -a- -a--3- - ^ • - 3 • J • - 3 • - 3 • ^ • - ^ • - * •
x x x x x x x x x x x x c c c c c c c c c c c c
1 / M A l A l A ^ - . . — y v ^ - s U M A l A l A
i i i i i I I r i i i i
1 t 1 1 1 1 1 1 1 1 ! 1 r«"\ r^\ r ^ m **% C A rA <*^ f v ^ <*^ f \
x x x x x x x x x x x x c c c c c c c c c c c c
. ^ ^ < — * * - * - - * (S* O i CM CS1 ^ . . — * . ^ . — * l A U-» l A VA — •— — — -3" - 3 " - 3 * - 3 "
1 1 1 1 1 1 1 1 1 1 1 1
1 1 1 t 1 1 1 I 1 t 1 1 3 ? 3 X 3 2 2 2 * * 2 2
o o o o o o o o o o o o c c c c c c c c c c c c
i * . 4 > U - U . V) t ^ i/t • •.*. 10 flj f D ( V
m IQ it is n i <o nj — — — ~—
t_> O O U <_* O CJ C J O C J O C J
X3nu QNVS aidvy

154
25
H
w
o
o
o-
•3" .3- -T -T O O O OCOOOCOOO
. * . ^ ~ * -r i/\ UMA »A n rA <A tn
_r-^<^r^—*— — — <r\ — — *b o o o o -» — or*-r^.—- o JT o — r ^ ~ o o f o •— o — «M * ^ — — <*%-3" tf\ ~ - OJ ~ <M rO
o o o o o o o o o o o o
i / \ u ^ u"\ u ^ - T - ^ - T - T
t r \ i r \ u \ m CM c>4 N M J 1 J " - 3 " J "
C4 N M N CM (N M f ^ J N N N N x x x x x x x x x x x x c c c c c c c c c c c c
I/* z o
rr\ c*% r*\ C*N*^.»-^ ^-«.*—v-^- - r - r -3" v- — ^ - .— C\ tr\ <J\ cr\ »—«—•— ~-
O O O O *»-» *—»• - — *-^ O T » C^ tj\
I I I I I I I I I I I • O O O O O O O O O O O O ( N N OJ CM CM <N CM CM CM CM CM CM < x x x x x x x x x x x c c c c c c c c c c c c
-3- . j - -3" -a- -— —* ~- — s O \ o \ 0 \ 0
<r\ <*•» — r*» <r\ r^- — f*» o ir\ <ys —
o o o o o o o o o — o o ^ > - \ a ^ ^ O — — v 0 - 3 " 0 0 0 — O — ^ - «— CM — — c"\ U"\ -3* c-\ cs| CM
o o o o o o o o o o o o
r^r^r*^r-*\Ov0^jC>vD-3,-3' -3- - J
^ f N . s r v v O v O \ i ) y ) O O O O I I I I I I I I + + + +
N N N (N N CMCM f>i CM (N N N x x x x x x x x x x x x c c c c c c c c c c c e
^ ^ J ^ U M A U M A f M ^ C*\ t*"\
\£) \ 0 \ 0 s O vD v©M3 NO S O M3 N O V O
x x x x x x x x x x c c c c c c c c c c
oo — — cn in - r o vo cn^r o •— O f ^ O O r ^ O O O O - J f ^ O O O — O O O O O O O O O
O O O O O O O O O O O
o o o o o o o o o o o o
O — O — O O 3 r<"» . ~ U \ •— O — c r x o ^ o o r ^ o o — co <" o o o o o o o o o o o o o o o o o o o o o o o o
o o a > o o o o o o o o o
— O — O O •— O 0"i f> I""** **"' C M - 3 - 0 0 0 0 0 0 0 0 0
O O O O O C M O O O O O O
o o o o o o o o o o o o
o o o o o o o o o o o o
X
4 a:
3E
o
UJ a: ec o
O O O O — O ^ M > O v O O O O — O ^ - O O O O — — O O O O O v O — O — O f ^ O O O O O O O O O O O O O O O
o o o o o o o o o o o o
I I I I I I I I I I l <
o o o o o o o o o o o o
x x x x x x x x x x x x
c c c c c c c c c c c c
*~..*—*.—•»*-^.i/\ u*\ LT\ m <r\ c> o^c7^ try r+\ e*^ c \ _ 3 - < r J - - 3 " — —- — •— + + + + I I I I I I I I
vO vO ^ > vD vO s£> vO vO vO **0 vO M3
x x x x x x x x x x c c c c c c c c c c
— — - 3 , c " " v a " \ r - * - 3 - 0 0 — O f i
— o o — O O O C N — r-. — o — est — O O O O O O O O r - * O O O O O O O O O O O O
O O O O O O O O O O O O
o •— — — o — o — o f^*o - -O O ^ O O O C O O O O O - J . — - 3 - C N O O O O O — O O O — O O O O O O O O O O O O O O O O O O O O O O O O
%i> m o • vn -^- o <— >— •.£ o O O O M O — O O O N 0 O I / \ O O O O O — O r * ^ 0 0 - 3 ' 0 O O O O O O O O O O O O O
O O O O O O O O O O O O
— f ^ . c * \ o r - . L r \ O O o c n o •— o o o o o ^ o o r * - — o o o c*% — C M O O O O O O O O CM O O O O O O O O O O O O
O O O O O O O O O O O O
— - - O O — O f ^ t n r o N - T vO O 4 0 \ 0 0 — v O O O O O O O O * — O O C N O ^ O O O O O O O O O O O O O O O O O
O O O O O O O O O O O O
— n o J"\D CMOOO-3 r^-oo^ O O O f M r ^ O O O O C M ~ - 0 O O O O O O O O O O O O O O O O O O O O O O O O O O O O O O O O O O O O
\ f r . U - s * . U - (/> i/> t/1 t/> I*) ft) 1) <TJ I Q t Q l Q H3 13 <TJ < ) 0) •— <•— «— •—
*£1:2I-£3:1 i?:£ O O O O O O O O O O O O
N000V1 NOliVZniQVlS
r ^ O O O CT> O — O \ 0 O s C O ' O O s D O O - J — CM — O — O o o o o o o o o o o c o o o o o o o o o o o c o
o o o o o o o o o o c o
O r-*" — — — cA *•*•* o <r\ o c: — O r ^ \ 0 \ £ > r s i O O O O - * < a > •— O O — O O c g O O O o O O O O O O O O O O O O O O
O O O O O O O O O O O O
CO (0 <D «C
mj\ A j\—ro—TO ni u flj flj f0 — •— — •—
1-2:51 IIU I-£1:2 < _ > U O O ( J k O O O t _ > O O W
NOODVI OBivyav

•v a 3 •H 4-1
a o i i
z
E * a:
I N
X
o CM
X
vT>
X
CM
O fM
O
CM
O
O CM
O
CM
<M
O CM
O CM
MD
t O \ f l \ £ < O N CM CM CM - T - * - ^ - * •
— f s c n o - ( N ^ ^ o o - n - T •— O O — O — - T v O r ^ O O CM O O O O — — O O O f - O — CM — r a - T — O J r ^ r t - - -
O O O O O O O O O O O O
M W N N h - h * N N • - • • 1 1 1 1 1 1 1 1 1 1 1 1
I | t I I i i t i I I I
CM CM CM CM N N N C N N O J N ( N X X X X X X X X X X X X
c c c c c c c c c c c c
i i i i i i t i i i i i
t i i i i i i i i i i i o o o o o o o o o o o o C M f s J C M C N C M C M C M r s i r M C N CM CM
X X X X X X X X X X X X
c c c c c c c c c c c c
1 1 1 1 1 t 1 1 > 1 1 1
1 1 1 1 t J 1 1 1 1 1 1 v D \^5 \£} \ 0 v O \ 0 v O N O V O S ^ V O * 0
X X X X X X X X X X X X
c c c c c c c c c c c c
*— — — co m - co -^ en -a- o r-. r - . c t - T O O - a - o o o - 3 ' O — O O O O O O O O O O O O O O O O O O O O O O O O
O O O O O O O O O O O O
o o -3- — • — 3 - o o o - T f ^ - c o r ^ . O - J - — CO O O — vO «""» O O O O < * > M 0 O O O O O O O O O O O O O O O O O O O O O
O O O O O O O O O O O O
< n - 3 - o o o o * N O O v x > < n r - , * L r \ O O O O — O rM r ^ i - — — — CM O O O — r n t N O O O O O O O O O O O O O O O O O O O O O O O O O O O O O
O CM — N f A C O 0 > - J N f n O o O x o o o o o o o o < n o O O O O O O O O C M C M O O O O O O O O O O O O O O
O O O O O O O O O O O O
— - J I A » -— c*"\ i / \ e n O O • T O O O O CM 0 - 3 " O O f " * O O U " \ r < - * r - " . 0 O — O O O O r^\^r O O O O O O O O O O O O O O O O
O O O O O O O O O O O O
— - a - o — o w — L A C O O — cx> O c \ O O O O — « " * \ 0 0 \ 0 0 — 0 0 * * " » 0 < N O O O O O C M O O O O O O O O O O O O
O O O O O O O O O O O O
IQ 1 1) ID 11 1) t ) <0 *"~ • " • ^*" "*~
$-*$:§£.?: £3 1-1:1:1 (-> « _ > c j « - > < - J O O o e > « - > o « _ >
390ms 03XVAI13V
cvo^o^OLnu^mLrxeocococo
o o r- oo o w o - O N ( n o ^ < n o o r ^ \ o - r o <r* r-- o o> «— — . T — — — i/> -S" m r n i n o o o o o o o o o o o o
~ — «— * — C O a O C O C O ( A U M A I A I i I I I I I I i t I I
1 1 1 1 1 1 1 1 1 1 1 1
CM N N N CM CM CM CM CM CMCM «\ l x x x x x x x x x x x x c c c c c c c c c c c c
r ^ c ^ \ r ^ r o — — — — r-» r*- r-» r»» • + + + I I I 1 I I I I 1 1 1 1 1 1 1 1 1 1 1 1 o o o o o o o o o o o o C M C M C M C M <NJ CM C J CM CM CM CM CM
x x x x x x x x x x x x c c c c c c c c c c c c
ao co co co — — — •— i/\ tr\ u\ m J - - 3 - - f l - - X — — — — \ £ ) v O v O v f l
1 1 1 1 t 1 1 1 1 1 t 1
1 1 1 t 1 1 1 1 1 1 1 f sjy \ o v O N O \ 0 ^ D V O S O V D *>0 V O N O
x x x x x x x x x x x x c c c c c c c c c c c c
o o o ft-a- w r o o o o r -o o o o o o o o — o o o O O O O O O O O O O O —
O O O O O O O O O O O O
n ^ O O O - 3 - — r - ^ O O O O — O — c"\ o o w o -3- o o r ^ < N o — o o o o o o o o o o o o o o o o o o o o o o o o o o o o o o o o o o
- T - 3 - O — — O O J - * A C n J - v i ) — — o ^ - 3 - c n c ^ o o o o — o o o o o o o o o o o o o o o o o o o o o o o o o o o o o o o o o o o o
O — O - X W — •— L / \ CT\ O O t * -O O O O O sO rr\ - T O O O O f ^ - T O O O O O O O O O — O O O O O O O O O O O O
O O O O O O O O O O O O
v C O O O O O - 3 - r ^ — p - C O O O C M O O C M - 3 - O O " - W O O o o c n o o o o o o o o o o o o o o o o o o o o o o o o o o o o o o o o o
— O O O ^ O * — C M - 3 - O — O O O O — C M O r * * - O W O \ O O C J r ^ \ 0 O O O 0 0 O O 0 O O O O O O O O O O O O O O
O O O O O O O O O O O O
u- <+- u~> i t . tn i/t «/i in «TJ <u <0 <0 Q >D <V <D *0 11 f0 u •— — — «
1.5:1:1 l -HlrH- i : 1:1 u u u u u o u u u u u u
naii i j 9Nn«im
Samp
le eq
uati
on for estimating
stan
dard
er
ror of es
tima
ted
expe
cted
va
lue for st
abil
izat
ion
lago
on
. n u-
o CM
X v O
X o CM
»o
• o CM
CM X
o CM
o CM
o + N O
CM X
M 5
+ rH|Z
a e to <u OS
• o
l / \ en
4-1 + 1 g
•4 -rs
J c

156
o ~ C Id
<o a c at •> IK * • » ^
c c a a — w «> «> -H
" & >«- "D O O C ~ v
10 </V a " S c
10 0 Ti 1-Z u * J Q n in >- O
u II U a .
o
i t
— o o o o o
vl> CO CM O f*\ O -3" CM CM — — —
• J CM CM IN — '—
-3- -3- - T 0 0 CM I A r o CT\ O •— r~ LA
— r^ r*w3 I A m
C l CACO < O O M m CM — o
o — — •— o "•> 0O CM GO - 7 CM —
-3" m CM CM CM CM
C c — <0
r « a <o I*- O 4-»
o — c o.
w o n «J — c_>
— ce
<
-a- e n i n I A r^. -a-e n L A o o — r^-\£>
tT\M3 LA I A -X -3"
c o -3- N N t n o I f l l A M O 0 0 f^. e n CM — O O CM CM CM CM CM CM
CO C\CO N J -CM — -3- CO J " m
m — O 0"\ 0A 0"\
en GO t f \ « j - j CO e n CM CM LA e n
m o 0~» co r . r^ CM CM — ~ — •—
CM r-^ LA CM CA CM c o i r \ tj\ — v o v o
— o o e o o r— r- .
\ D O c ^ - 3 - r ^ - 3 -Cn •— CM m CO vo
ON r^.M3 UN -X -a -
>-C «•< C7> — _ — y g in <o i 2 ai o . 2 -
Q trj
U M m A i A L A L A CM CM CM
i r t U M A U M A L A CM CM CM
C o
C « Cn <o
in 3 V a .
O o
o o o o o o o o o o o o o o o o o o
m o LA irv i n o m LA o LA oo
O O O O O CT o o o o o o o o o o o o i n o LA i n LA o
C-\ LA O LOCO
•o — 4) O- in w O. —
*-» t - 3 (0 in O c o — 0 O- i-
<-> E i - 4> — U u
* » « t « - <0 3C 0 3
L A L A L A L A i n i n i n L A L A i n i n L A
c a i i u . - . o .
. 4 ) in >-^ 1 } C q (0 (0 C O w O
3 5 — -E — a 41 CO 10
Q L 9 U
LA LA LA LA LA LA N ^ i f l C O O
n - C in O V vi
E t l 4) «J o a i g o >- 4) L.
r - L. 0 .
3 O LU O z r -- I < _J in m -
o o ui — 2 r-a. < _ i

c >
•J
<
CO
w l-l Q H CO cc;
PH
<
a; w P-
u
< I
: = > o O Z M CO 3
Q S3
CO
M
H S3
OS W H < W H CO
o H CO o c_>
o w H
H CO
w
0)
u
4) J C •-< *
* fl> "
" " J J ^ ^ « UJ U g
o
Estimate of Me
at\
Construction
Cost
in S
rr
-r Capita
INDIA
Nagpur
Study
(a]
< v> — < <;
:r> o
1 INDIA
Nagpur
Study (a
)
> T3
i / l < — Q t / 1 —
< <, 1 —
O
% Cost of
Imported
Wastewater
Disposal
Material
Design
F1ow
in
Design
Population
Type of
Treatment
Process
<v» f N — — •—
O O O O O
- T r*- m — r -U"\ - T f " \ m CM
O O O O O
C n -3" CA m P-*. O CO , N f N —
CNJ .— — — —
r-- — cn — co M co cr\ r^ j -f ^ N — — —
1 1 ( 1 1 1 1 1 1 1
m o o o o — rn un o o o o — m ^ o
o o o o o O O O O O o o o o o
i n O O O O - I A O O
— CM
STABILIZATION
LAGOON
m o r a J - O \ 0 - O - J " J " •3"
o o o o o
OJ »n co CM 'JO CM — cn cnco
- - — o o o
- a - CO O — O m — O CO s£>
CM ( N CM *— —
o c n c n o i A
-T CO CN <M CM
i I i I r i i i i i
m o o o o .— m i n O O
o o — m \ o
o o o o o o o o o o o o o o o
i n o o o o — U"\ O O
— CM
AERATED
LAGOON
• i i i i • i i i i
M f N c n - -c r \ •— o c o \0
C M C M — O O
i i i i i i i i i i
cn o m CN en ( J \ 0 v 0 \ 0 N o en i n - r m
m m i n m LA CN N T J N ( N |
L A O O O O
— c"» i_n a o O O — <*>\0
o o o o o o o o o o o o o o o
i n o o o o — i n o o
— CM
ACTIVATED
SLUDGE
O M A M 3 O -
fo ij~\ ro r— i n
— — o o o
vDf loco en o vo co m CN O
M ( S CN N —
i n -3- i n — C M ^ O l A O O i n CM
ao ao cn m CM
en i n — m r*\ O m i n c n - T
N CT. L A 4 T ^
i n i n i n i n i n CM CM CM CM CM
i n o o o o — on m O O o o •— m v o
o o o o o o o o o o o o o o o
u-\ o o o o — i n o o
- — CM
TRICKLING
FILTER

158
which reflect the total water resources planning in the
developing countries.
(4) There is a need to develop water quality standards for
developing countries.
(5) Cost-effectiveness studies of water supply and waste
water disposal should be carried out, comparing in parti
cular the benefits acquired from treated water and sewerage
facilities to other public work sectors.
(6) Efforts should be made to apply these models in actual
planning situations.
SAMPLE PROBLEMS
Sample Problem 1. The City of Istanbul, Turkey, is proposing
to build either stabilization lagoons for three suburbs or one acti
vated sludge plant. Land is cheap, and due to geographical location
the cost of transporting the wastewater by gravity flow is minimal.
Per capita income in the city is estimated to be 250 U.S.
dollars per year. Twenty percent of the cost of wastewater disposal
materials would have to be imported to construct and operate the
activated sludge plant. The design population is given in Figure IV.2.
A recommendation is sought for the Istanbul Planning Commissioners
in terms of the mean lower cost process (three stabilization lagoons
or one activated sludge plant).
Solution
Using equation (4-94),
Construction Cost of Stabilization Lagoon 1 —

159
£ C = 1.5303 - 0.2152 £ X. , n ww. as n lo
= 1.5303 - 0.2152 £ 100 n
= 1.5303 - 0.9910 = 0.5393
Ant i log of 0.5393 = 1.71 ( $ U . S . / c a p i t a ) .
Operat ion and Maintenance Cost of S t a b i l i z a t i o n Lagoon 1,
us ing equat ion (4-96) —
£ C " = -0.3274 - 0.1846 £ 100 n ww.as n
= -0.3274 - 0.8501
= -1.1775
Antilog -1.1775 = 0.30 ($U.S./capita/year). Fig. IV.2. Sample Problem 1.
Suburb I, Population = 100,000. Suburb II, Population = 25,000. Suburb III, Population = 75,000.
* Location of Stabilization Lagoons.
C Location of Activated Sludge Plant.
-*.— Transportation of Wastewater to Point C.

Construction Cost of Stabilization Lagoon 2 —
I C = 1.5303 - 0.2152 I 25 n ww.as n
= 2.31 ($U.S./capita).
Const ruc t ion Cost of S t a b i l i z a t i o n Lagoon 3 —
I C' = 1.5303 - 0.2152 I 75 n ww.as n
= 1.82 ( $ U . S . / c a p i t a ) .
Operation and Maintenance Cost of Stabilization Lagoon 2 —
I C" = -0.3274 - 0.1846 I 25 n ww.as n
= -0.3274 - 0.5942
= -0.9216
Antilog -0.9216 = 0.40 ($U.S./capita/year).
Operation and Maintenance Cost of Stabilization Lagoon 3 —
I C" = -0.3274 - 0.1846 I 75 n ww.as n
= -1.12
Antilog -1.12 = 0.32 ($U.S./capita/year) .
Using equation (4-118),
Construction Cost of Activated Sludge Plant —
I C' = 2.8597 - 0.2890 £ X,, + 0.0201 I X„. n ww.as n 16 n 21
(where: Xn, is the total population of 3 suburbs and X„. lb • 11
is 20%)
I C = 2.8597 - 0.2890 I (100 + 25 + 75) + 0.0201 I n ww.as n n
= 2.8597 - 1.5312 + 0.0602
= 1.3887
Antilog 1.3887 = 4.01 ($U.S./capita) .
Using equation (4-120),
Operation and Maintenance Cost for the Activated Sludge Plant —

161
\ C"ww.as " 1- 7 5 3 4 " °'4269 £n X
1 6 + 0-0021 ^ X^
= 1.7534 - 2.2618 + 0.0062
= -0.5022
Antilog -0.5022 = 0.60 ($U.S./capita/year).
Total Construction Cost for Three Stabilization Lagoons —
= 1.71 (100,000 + 2.31 (25,000) + 1.82 (75,000)
- 171,000 + 57,750 + 136,500 = 365,250 ($U.S.)
Total 0 & M Cost per Year for Three Stabilization Lagoons —
= 0.30 (100,000) + 0.40 (25,000) + 0.32 (75,000)
= 30,000 + 10,000 + 24,000
= 64,000 ($U.S./year).
Total Construction Cost for Activated Sludge Plant —
= 4.01 (200,000)
= 802,000 ($U.S.)
Total 0 & M Cost per Year for Activated Sludge Plant —
= 0.60 (200,000)
= 120,000 ($U.S./year).
Three stabilization lagoons would be the recommendation to
give? to the Commissioners.
Sample Problem 2. The Governments of Kenya, Mexico, and Taiwan want to
establish small towns in the interior. The projected population for each
town (Kijiji Kipya, Nuevo Pueblo, and Hsin Tsein) is to be 5,000. Both
water and wastewater treatment plants must be built simultaneously. Figures
are needed for the mean costs of slow sand filters and aerated lagoons.
The following historical data exists for each region:
(1) Average annual income for Kenya is 500 dollars;
(2) average annual income for Mexico is 550 dollars;

(3) average annual income for Taiwan is 1100 dollars.
(4) Percentage homes connected to water supply for Mexico is approximately 40;
(5) percentage homes connected to water supply for Taiwan is approximately 65.
(6) Assume the design population is the same as the population of the towns.
(7) Since there are no sewerage systems, X.io and Xji are assumed to be zero.
(8) It is further assumed that 20% of the cost of materials for building and operation will be spent on imported items.
Solution
Using equations (4-55) and (4-57) for water demand, the con
struction and operation and maintenance costs of the slow sand filter
are found for each country.
£ C = 2.6436 + 0.0988 £ D - 0.20651 £ X,. (4-66)
n w.af n w n 14 = 2.6436 + 0.0988 £ (12.72 + 0.0683 X0 + 0.0142 X,)
n 2 6 - 0.20651 £ X..
n 14 = 2.6436 + 0.0988 £ (12.72 + 0.0683 (5) + 0.0142 (500) )
n - 0.20651 £ (5)
n
= 2.6080
Ant i log 2.6080 = 13.57 ( $ U . S . / c a p i t a ) , ( c o n s t r u c t i o n , A f r i c a ) .
£ C " , = 0.4346 + 0.0160 £ D - 0.3628 £ X,, (4-68) n w.af n w n 14
= 0.4346 + 0.0160 £ (1272 + 0.0683 X„ + 0.0142 X-) n 2 6
- 0.3628 £ X, . n 14
= 0.4346 + 0.0160 £ (12.72 + 0.0683 (5) + 0.0142 (500) ) n
- 0.3628 £ (5) n
= 0 . 4 3 4 6 + 0 . 0 4 8 0 - 0.5838
= -0.1012

Antilog -0.1012 = 0.90 ($U.S./capita/year), (0 & M, Africa).
£ C = 2.7436 + 0.0088 £ (6.6817 + 0.0A597 (5) + 0.2204 (65) n w.as n
+ 0.0263 (1100) ) - 0.1065 £ (5) (4-70) n
= 2.7436 + 0.0344 - 0.1711
= 2.6069
Antilog 2.6069 = 13.55 ($U.S./capita), (construction, Asia).
£ C'" = 0.5017 - 0.0751 £ (5) (4-72) n w.as n
= 0.3809
Antilog 0.3809 = 1.46 ($U.S./capita/year), (0 & M, Asia).
£ C' n = 2.5461 + 0.0096 £ (20) - 0.3628 £ (5) (4-74) n w.la n n
= 2.5461 4- 0.02876 - 0.5839
= 1.991
Antilog 1.991 = 7.32 ($U.S./capita), (Construction, Latin America).
£ C'" . = 0.3559 - 0.1511 £ (5) (4-76) n w. la n
=0.1127
Antilog 0.1127 = 1.12 ($U.S./capita/year) , (0 & M, Latin America).
Construction, operation and maintenance costs of aerated lagoons
are found for each country.
£ C' = 1.4768 - 0.1132 £ X.,, (4-102)
n ww.af n 16 = 1.4758 - 0.1132 £ (5)
n
= 1.29462
Antilog 1.29462 = 3.65 ($U.S./capita), (construction, Africa).

164
I C" , = 0.1136 - 0.1435 I X-, (4-104) n ww.af n 16
= 0.1136 - 0.1436 I (5) n
= -Q.1173
Antilog -0.1173 = 0.89 ($U.S./capita/year), (0 & M, Africa).
I C' = 1.6395 - 0.1565 I X^c (4-106) n ww. as n 16
= 1.6395 - 0.1565 I (5) n
= 1.3876
Antilog 1.3876 = 4.01 ($U.S./capita), (construction, Asia).
SL C"* = 0.3561 - 0.0955 £ X., (4-108) n ww. as n 16
= 0.3561 - 0.0955 £ (5) n
= 0.2024
Antilog 0.2024 = 1.22 ($U.S./capita/year), (0 & M, Asia).
£ C , = 1.7581 - 0.1461 I X., - (4-110) n ww.la n 16
= 1.7581 - 0.1461 I (5) n
= 1.523
Antilog 1.523 = 4.59 ($U.S./capita), (construction, Latin America).
I C"* . = 0.21149 - 0.1600 I X,, (4-112) n ww.la n 16
= 0.21149 - 0.1600 I (5) n
= -0.0460
Antilog -0.0460 = 0.96 ($U.S./capita/year), (0 & M, Latin America).
Total Construction Cost for Slow Sand Filter in Kenya = 13.57 (5000)
= 67,850 ($U.S.).
Total Operation and Maintenance Cost for Slow Sand Filter in Kenya =0.90 (5000)
= 4,500 ($U.S./year).

Total Construction Cost for Aerated Lagoon in
Kenya = 3.65 (5000)
= 18,250 ($U.S.).
Total Operation and Maintenance Cost for Aerated Lagoon in Kenya = 0.89 (5000)
= 4,450 ($U.S./year).
Total Construction Cost for Slow Sand Filter in
Taiwan = 13.55 (5000)
= 67,750 ($U.S.).
Total Operation and Maintenance Cost for Slow
Sand Filter in Taiwan = 1.46 (5000)
= 7,300 ($U.S./year).
Total Construction Cost for Aerated Lagoon in
Taiwan = 4.01 (5000)
= 20,050 ($U.S.).
Total Operation and Maintenance Cost for Aerated
Lagoon in Taiwan = 1.22 (5000)
= 6,100 ($U.S./year).
Total Construction Cost for Slow Sand Filter in
Mexico = 7.32 (5000)
= 36,600 ($U.S.).
Total Operation and Maintenance for Slow Sand
Filter in Mexico = 1.12 (5000)
= 5,600 ($U.S./year).
Total Construction Cost for Aerated Lagoon in
Mexico =4.59 (5000)
= 22,950 ($U.S.).
Total Operation and Maintenance Cost for Aerated Lagoon in Mexico =0.96 (5000)
= 4,800 ($U.S./year).

166

CHAPTER V
Methodology for Establishing Priorities among Water
Supply Programs: A Case Study
This chapter presents a methodology for setting priorities for
water supply programs and represents a condensed form of material
which has not been published previously. In this study analysis
was made of the Indonesian Rural Water Supply Program. There were
found to be three major contraints in executing that Program, namely,
money, time, and manpower. The problem was to develop criteria for
selecting which among the proposed projects should be executed first.
Existing priority models were deemed unsuitable for application in
Indonesia at the present time because of the particular program strate
gies and conditions prevailing, and also because of the lack of well-
trained engineering personnel, especially at the levels where the selec
tion of the project localities is made.
In this chapter a delineation is made of' the relevant Indonesian
administrative hierarchy, population characteristics, and the water
167

168
and sanitation situation. In the study, the following ten prioritizing
parameters were established: waterborne diseases, difficulty in ob
taining water, technological alternatives, population, village contri
bution, village potential, public places, excreta disposal, road condi
tions, and power supply. These are discussed in detail in this chapter.
Through the use of forms and questionnaires extensive data was
obtained on particular localities in Indonesia. This data was sub
sequently processed, and some of the results are presented here to
demonstrate utilization of the prioritizing model.

169
V.
A PRIORITY SETTING FOR THE RURAL WATER SUPPLY PROGRAM IN INDONESIA
Soetiman
INTRODUCTION
General. This study deals with a present need of the Indonesian
Rural Water Supply Program, that is, a method of setting the priority
for selecting which villages should receive a water supply system
first. The scope of the Indonesian Rural Water Supply Program is
very broad; it covers more than 100 million Indonesian people who
live in about 56,000 villages. Resources, especially money and man
power, are very limited, and there is a time limit as well. Most
of the villages want to receive their water supply system first, and
it was felt that a priority model was strongly needed to ensure that
the government money is spent more wisely and that the people feel
that the program is being implemented fairly. This study consists
of four parts: an introduction, literature review, examination of
methodology, and a test of the model.
Indonesian Governmental Hierarchy. The basic hierarchy is illus
trated in Figure V.l. The central (federal) government consists of
a president, a vice-president and about twenty-one ministers; there
is no prime minister. The province (state), also called the first-
level of government, is headed by a governor. There are twenty-six
provinces in all of Indonesia. The kabupaten is also called the
second-level of government and is headed by a bupati. There are 234
Ph.D. dissertation, University of Oklahoma, 1977. (224 pp.)

170
CENTRAL GOVERNMENT
T
PROVINCE
i '
KABUPATEN
\ 1
KECAMATAN
i '
DESA
Fig. V.l. A sketch of the Indonesian Governmental Hierarchy.

171
kabupatens in all of Indonesia. Besides the kabupatens, there are
fifty-four municipal areas each of which is headed by a city mayor.
The kecamatan is headed by a camat, and there are 3,138 kecamatans
in all of Indonesia. The desa (village unit) is also called the
lowest-level of government headed by a lurah. Some desas consist of
only one village, but some desas consist of two or more villages.
There are 48,575 desas consisting of about 56,000 villages in all of
Indonesia.
The names of the twenty-six provinces and the number of munici
pal areas, kabupatens, kecamatans and desas, together with urban and
rural populations quoted from the census in 1971 are shown in Table V.l.
This table indicates that the Indonesian population in 1971 was 119.2
million.
Population. At the present time, the figure for the population of
Indonesia which is accepted by the Ministry of Health is approximately
151 million consisting of 122 million who live in rural areas and
29 million who live in urban areas ( 1 ). These figures indicate
that more than 80 percent of the Indonesian population live in rural
areas, which is a common characteristic of less developed countries
in general. The present annual growth rate is 2.3 percent, and it
is expected that by an intensive family planning program which is
currently being implemented in the country, the annual growth rate
will be reduced to 1.2 percent by 2001 (7 ). With respect to age
groups, 44.1 percent of the population is under fifteen years of
age, and only 2.5 percent is over sixty-five years (7 ).

172
o o o
» r H
X
c o
• H 4->
cd i H
3 C o
p-l
r H
to 4-1
o H
i H
to •
u
BZ :
C . to •
Urb
co td 03
<V Q
en 1 C cd to cj 4J 0) 3)
^ E
en i C 3 tu
ja -u to to « tx
.—i
•H « O <U
•H >-l
g< s
0) o c > o u
0 4
ON
o o CM
i H i H
CO
r H
CO
ON r—*
r - l
o vO
ON CN r - i
CO
CSi
x: 0) a <
• M
• o
• f H
CM
CN
vO
vO
CO < T
<r
in
<T r~-
1.1
CO
o CO
*> i n
r^ VO r - i
i - l r H
vO
tra
CO
e 3 CO
.c 4-1
u o
z
CN
CO
CJ\ •r».
CM
CO
r H
CO
CM
o CO
sr
ON i n
m
o CC
co
vb
td V4
4-1
to E 3
to
4-i
to 0)
s
CO
• H
vr vO
r H
CO
CN
<• r H
CO r H
CM
r H CM
r-~
r» vO
i n
r - l
3 <0
•H «
vr
\o o o
l - l
CO
r H
r~
CO ON CM
CO
i-4 ON
r-CO
m
r H
• H
rfa
e CO
r>
m
ON r-t liO
co i n
<r
1-4
VO
i-H
r»
CO
CM
co
r H
3 r H
3 AS 00
c <u
pa
VO
CO
vr • r
CO
CM
•<r
<r «
CM
r H
O O
CM ON
v O • k
r H
m CO
ON
f H
tra
to E 3
CO
•C 4J
3 o
CO
r-»
r~-r» r»
CM
CO
o i n
« CM
< T t~-CM
-* CM
r H
* r H
0 0
m
co
r H
to C 3 D. •e w
r J
co
V 0
r-i n
-tf
I
vO
r-i n
o CM CM
r^ CN
1
m
arta
^ td ->
. M
» « •
Q
CJ\
CM
CO
v O
r H
CM
v O
-a-CTi
» CO r H
vO CO
v O
CM
r-. CM
o \ M
CO
r . CO
CO
c CM
vr
to > to
>-}
4-1
W
OJ
• ^
o t H
r-r» CO
r H CM
r H
CM
i n « t
Ov r H
VO
i n CO
CN
m CO
<r *»
CO
CSI ON
<r
ON CM
VO
CO > CO
•-> r H
CO U 4-1
C CU
CJ
i H
r H
o ON
<r
CM
I
i
vb i n
i n
- 3 -r~.
-*
r H
CO 4J
u CO
AJ tfl > N 60 o •<
CM r H
vO
CM
m
m CM
- * CM
0 0
•> r H CM
CM
o
3,7
i n
vO
CO
•» CO
s T i n
i n
ON CM
CO
to > to —> 4-1
(0 (0
w
CO
r H
o CM
r H
C 4
r H CM
ON
« r H
CO
c CM
o vO
i n
o i n
CO
1
• H
rH CO PQ
-3-r H

173
o o o
t H
X
c o
• H 4-1
m i H
3 a o
o-
r H
to 4J
o H
t H
to M 3 Pi
C tO
Urb
05
« 01
Q)
Q
U)
1 C to n) O 4-1
<u to
w 6
0)
1 C 3 a)
U3 4J
to to
u & r- l
S-2 • H tO u a)
• H U
§<= s
a) o c
• H
> O 1-1
(U
CM
o CM
* CN
CO
t N
C .
t N
ON
r-~ i—i
co i n
m
N O
m
vO
I
ara
60 60 c <u
H
« 05
3 S5
4-1
to CD
s
i n r - l
- 3 -O N
CN
«* CM
m vO
r H M
CN
o\ CN r—i
< T r H
r~»
« >~i
CO ON
CN
t H
1
ara
(10
03 C 0)
H
to to
3 Z
4-1
to tO
Ed
v O
f H
O N
i H
O
** CN
r H
v O
r-» •>
r H
GO i n
CN
-a-0 0
i n
«* CO
NO
o i H
vO
t H
C CO 4J
c to e
• H
i H
to fcrf
4J
to
<u r>
r-t - t
CJ\ ON
vO
ON
0 0 i n
o . - i
r H
CO CO
1-t
•» r H
CN tX)
O N
t-\
tan
c CO
6 •H r H
co * t H
to U 4-1
c CD
u
CO
t H
ON ON \o
«k
r H
v O
s i -CN
» t H
co i n
s *
s t r-. vo
sr o-.
o \
CM
C tO 4-1
c CO
e • H
t H
cd *
x: 4-1
3 O
CO
o \ t H
CO
en r«»
CN t o
sr
7-t
o CO
m r - l ON
ON vO
<r
CN
C CO 4->
c CO
g • H
r H
tO
*: 4-1
CO
CO
W
o CN
CO r H
r-»
* t H
CO
CO CO
-t H
i n CO
CO
CN
sr t H
* r H
t H CO
-a-
CN
• H
W
CJ
3 «
t H
3 c/>
J= 4J
V-i
o S5
r H CN
CO
t H
ON
O V * 0 0
CO
r-
ON
S t t H
* r H
t H
\0
<T
1
• H CO
CJ
3 CO
t H
3 to
r H
CO u 4-1
c 01
o
CN CN
ON
CO
r H A
m
CO
< f CN
• t
<r
t H
<r ON
CO
\0 r H
• t
r H
CJN VO t H
r H CN
CN
• H
CO
cu 3 to
r H
3 CO
J S 4-1
3 O
CO
T
CO
CN
<T r H
r-»
CM
vO
vO
CM i n
<?• ON
CO
CO
< T
<r
1
wesi
to t H
3 CO
4-1
01
tO
w 1
. e 4-1
3 O
co
*T CN
0 0
oo o
M
r H
< T
<r O N
sr S t T~-\
m o NO
m
r H
r H
m
<r
r H
3 ^ 3
t H
CO
S
m CN
CO
CN ON
CN
P »
r^
r H i n
r H
CN ON
CO
i n CO
ON
1
tO
!>N CO
• o
C tO
• H
U
« v O CN
CN CN CN
ON
rH
ON r-. co
V43 ON
CO m to
o CN
in
m
co
00 CO
CO
sr to CN
m
o H

174
Water Situation. Indonesia is a tropical country characterized
by heavy rainfall. The average rainfall for the whole country is
approximately 2,000 mm (about 80 inches) per year. Unfortunately,
the distribution of rainfall throughout the country is uneven; some
areas get a very high rainfall, for instance, Batu Raden, Central
Java, receives about 7,000 mm (about 280 inches) per year, while
Palu, Central Sulawesi, receives only about 700 mm (about 28 inches)
per year. The distribution of rainfall throughout the year is also
uneven. During the wet months, between December and March, some
areas get heavy flooding routinely which destroys property and takes
lives. During the dry months, on the other hand, between July and
September, some areas have no water, not even a drop to drink.
Water supply facilities are still scarce in most parts of
Indonesia, particularly in rural areas. Before the Indonesian Govern
ment ran the First Five-Year Development Plan, April 1, 1969, to
March 31, 1974, fewer than twenty percent of the urban population had
been served by piped water systems from the Municipal Drinking water
Services, and only about one percent of the rural population had
had reasonable access to safe water. By the end of the First Five-
Year Development Plan, approximately twenty-five percent of the urban
population was served by piped water systems, and about 1.6 percent
of the rural population had reasonable access to safe water. Today,
about forty-five percent of the urban population is served by piped
water systems, and about 5.4 percent of the rural population.
The majority of Indonesian people depend on unsafe water from
wells, rivers, irrigation canals, ponds, lakes, unprotected springs
and rainwater collections which are subject to pollution. On certain

175
islands and coastal areas where potable water is not available, water
has to be brought by boats or trucks from nearby producers of safe
water. Villages in the mountainous areas use bamboo pipes to carry
water from natural springs, where the major portion of the water
leaks on the way and only a very small portion reaches the villages
due to the very long distances traveled.
The situation is drastic during the dry season, the period from
July to September, when wells, rivers, irrigation canals and ponds
run dry and the villagers have to travel a few kilometers or even
more than seven kilometers to get a bucket of water from the big
rivers or springs. Women and children are responsible for getting
the water, while men go to work to earn a living. They often spend
all day in this task; therefore, many children do not go to school
and lose their opportunity for the education which is provided by
the government. Also, women lose valuable time that could be devoted
to economic activities and educating their children.
Excreta Disposal. At present, not more than five percent of the
Indonesian rural population have or use facilities for safe disposal
of excreta (10). Most of the rural population dispose of their human
waste throug?i rivers, irrigation canals, ponds, farms or backyards,
which creates the major source of pollution in rural areas. This
condition is, of course, very dangerous to public health and aestheti
cally unpleasant.
In the First Five-Year Development Plan, the Provincial and
Kabupaten Health Offices initiated the introduction of the simplest
method for safe excreta disposal by means of latrines that consist
of just a plain hole covered by a concrete slab with a water seal.

176
Now latrines, as excreta disposal facilities, are one of the most
important items in the INPRES (Presidential Instruction) Program in
Health Improvement and the Rural Water Supply and Sanitation Programs.
Public Health. Public health conditions in Indonesia, especially
in rural areas, are very bad due to a lack of safe water and excreta
disposal facilities as discussed previously. This causes many water-
borne diseases (diseases which are transmitted through water), parti
cularly cholera, which takes many lives. Cholera is said to be endemic
to Indonesia, that is, it is a disease which occurs every year and
spreads from one place to another, especially during the dry season
when water is extremely difficult to find or during the wet season
after heavy flooding. The World Health Organization Regional Office
for South East Asia (13) reported that there were numerous cholera
cases in Indonesia: 6,525 in 1970, 23,555 in 1971, and 43,423 in
1972 with the deaths of 1,379, 3,335 and 6,863 people, respectively;
this indicates a marked increase within a two-year period. Children
under six years of age are prone to cholera and other waterborne
diseases such as gastro-enteric diseases and typhoid.
Other diseases which are also considered waterborne and are often
contracted are trachoma and skin diseases. Malaria is a water-related
disease (a disease where a necessary part of the life cycle of the
infecting agent takes place in aquatic animals). Finally, other diseases
which are related to poor sanitation are hookworm infestation (ancy-
lostomiasis), and infestation of roundworms (trichuriasis and ascariasis).
Indonesian Rural Water Supply Program. The Indonesian Rural
Water Supply Program began in the first year of the First Five-Year
Development Plan, April 1, 1969, but only as a "Pilot Project." At

177
the end of the First Five-Year Development Plan, March 31, 1974,
the Rural Water Supply Program had served only 721,250 people or
about 0.6 percent of the total rural population. On April 1, 19 74,
the beginning of the Second Five-Year Development Plan, this Indo
nesian Rural Water Supply Program was integrated with the INPRES
Program in Rural Development, and was subsequently called the INPRES
Program in Rural Water Supply.
Since the Indonesian Rural Water Supply Program has been financed
by INPRES funds, remarkable progress has been achieved; within three
years, 1974 to 1977, it was serving about 5.7 million people or about
4.7 percent of the total Indonesian rural population. The target of
the INPRES Program in Rural Water Supply is to supply safe water to
ten percent of the Indonesian rural population by the end of the
Second Five-Year Development Plan (March 31, 1979) with a water con
sumption rate of sixty liters per capita per day using public taps
(hydrants) as a distribution system. Comparison can be made between
the designed water consumption rate of the Indonesian Rural Water
Supply Program and the World Health Organization data for average
daily consumption in rural areas, presented in Table V.2.
In implementing the Rural Water Supply Program, the Indonesian
Government is receiving assistance from the World Health Organization
(WHO) in terms of experts in planning and supervision; from United
Nations Children's Fund (UNICEF) in terms of materials and equipment
such as pipes, fittings, water pumps, pre-fabricated steel water
tanks, and survey and drilling tools; and from United Nations Develop
ment Program (UNDP) and United States Agency for International Devel-

178
TABLE V.2
AVERAGE DAILY WATER CONSUMPTION IN RURAL AREAS
Region Liters per Capita per Day
Minimum
15
30
30
40
20
70
Maximum
35
70
95
85
65
190
Africa
Southeast Asia
Western Pacific
Eastern Mediterranean
Europe (Algeria, Morocco, Turkey)
Latin America and the Caribbean
World Average 35 90
SOURCE: World Bank, "Village Water Supply," March 1976, p. 33.

179
opment (USAID) in terms of manpower development such as the upgrading
of health controllers, sanitarians and assistant sanitarians. The
progress of the Indonesian Rural Water Supply Program by funds,
by population served, and by systems are presented in Tables V.3, V.4,
and V.5, respectively.
The administrative steps in initiating and developing Indonesian
Rural Water Supply Project proposals is illustrated in Figure V.2
and described by the following steps:
1. The community complains.
2. The Health Center Officer discusses this complaint with the Camat.
3. The sanitarian from the Health Center explores the complaint.
4. The Health Center Officer reports to the Hygiene and Sanitation (HS) Section at the Kabupaten Level.
5. HS personnel and the Kecamatan sanitarian go to the area of the complaint.
6. The HS Section Officer reports the information collected from the area to the Bupati.
7. The Bupati sends an agreement of need to the HS Section.
8. The HS Section Officer proposes the need for a safe water system to the Sub-Directorate of HS Provincial Level.
9. The HS Section Officer approaches the Bupati for his support in construction and maintenance costs.
10. The Bupati instructs the Camat and Lurah to approach the community for a contribution to construction and maintenance costs.
11. The staff of the HS Sub-Directorate visits the area to review the preliminary proposal.
12. The staff of the HS Sub-Directorate discusses the revised preliminary proposal with the Governor to get a financial contribution from the provincial level.
13. The proposal is sent to the HS Directorate for approval.

TABLE V.3
PROGRESS REPORT BY FUNDS, RURAL WATER SUPPLY PROGRAM
Time P e r i o d Amount ( M i l l i o n $U .S . )
1969 - 1974 1.70
1974 - 19 75 6.35
1975 - 1976 10.79
1976 - 1977 14.88
T o t a l 29.62
SOURCE: Communication with Indonesian Ministry of Health, Directorate General of Communicable Diseases, Directorate of Hygiene and Sanitation, Jakarta, Indonesia.

TABLE V.4
PROGRESS REPORT BY POPULATION SERVED, RURAL WATER SUPPLY PROGRAM
-r- D • J r> i .. • c J Percentage of Total Time Period Population Served _ , „ , . Rural Population
1969 - 1970
1970 - 1971
1971 - 1972
1972 - 1973
1973 - 1974
1974 - 1975
1975 - 1976
1976 - 1977
T o t a l
78,700
28,500
82,850
242,950
287,800
1,452,982
2,130,400
2,107,500
6,411,582
0.077
0.027
0.077
0.219
0.253
1.247
1.785
1.724
5.409
SOURCE: Communication with Indonesian Ministry of Health, Directorate General of Communicable Diseases, Directorate of Hygiene and Sanitation, Jakarta, Indonesia.

182
TABLE V.5-
PROGRESS REPORT BY SYSTEMS RURAL WATER SUPPLY PROGRAM
Time Per iod
1969 - 1970
1970 - 1971
1971 - 1972
1972 - 1973
1973 - 1974
19 74 - 1975
19 75 - 1976
1976 - 1977
To ta l
Piped Systems
3.
5
14
35
51
96
146
150
500
Rain Water C o l l e c t i o n s
0
0
0
0
0
163
445
500
1,108-
Spring P r o t e c
t i o n s
1
1
0
7
15
81
180
150
435
Artes ian Wells
0
0
1
0
16
33
50
25
125
Hand Pumps
0
0
0
0
3
10,127
14,199
14,175
38,504
SOURCE: Communication with Indonesian Ministry of Health, Directorate General of Communicable Diseases, Directorate of Hygiene and Sanitation, Jakarta, Indonesia.

183
Fig. V.2. Administrative procedure for Indonesian Rural Water Supply Project proposals.
DIRECTORATE OF HS, CENTRAL GOVERNMENT
)
13
1
17,19
'
SUB-DIRECTORATE OF HS,
PROVINCIAL LEVEL
;
8 1 11,17,
HS SECTION KABUPATEN LEVEL
i
4 5,11,1
HEALTH CENTER KECAMATAN LEVEL
) i
1 3,5,11
19
7
14 16
BAPPENAS
" 15
1(
BOARD: BAPPENAS, BAPERDA, MINISTRIES OF HEALTH, PUBLIC WORKS, AND HOME AFFAIRS
12
6,9,19
7,20
2
COMMUNITIES
MINISTRY OF HOME AFFAIRS
i
18
'
GOVERNOR
18
BUPATI
10,20
CAMAT
i
10,20
SOURCE: Communication with Indonesian Ministry of Health, Directorate General of Communicable Diseases, Directorate of Hygiene and Sanitation, Jakarta, Indonesia.

14. The HS Directorate formulates a program and refers it to the National Development Planning Board (BAPPENAS).
15. BAPPENAS discusses the program with a board consisting of representatives of BAPPENAS, the Provincial Development Planning Board (BAPERDA), and the Ministries of Health, Public Works, and Home Affairs. This board determines a ceiling budget to be provided for rural water supply projects .
16. BAPPENAS sends the final decision of the ceiling budget to the HS Directorate through the Ministry of Health, and to the Ministry of Home Affairs.
17. Based on the ceiling budget, the HS Directorate makes the final decision about the projects which are found to be urgent and notifies the HS Section at Kabupaten Level through the HS Sub-Directorate.
18. At the same time, the Ministry of Home Affairs notifies the Bupati through the Governor about the final decision on the ceiling budget.
19. The HS Directorate sends standard designs of selected systems to the Bupati through the HS Section.
20. The Bupati, as project manager, forms a tender committee consisting of technical and administrative officials from the Kabupaten Public Works, the HS Section, The HS Sub-Directorate and, for systems using artesian wells, the Directorate of Geology, and the Ministry of Mining. Based on the evaluation of the tender committee, the Bupati assigns a selected contractor and notifies the Camat and Lurah for their support in implementing the projects.
There are two ministries that are responsible for the implementation
of the Indonesian Rural Water Supply Program: the Ministry of Health
through the Directorate of Hygiene and Sanitation, which is responsi
ble for technical problems such as surveys, designs and supervision
of the construction as well as the operation and maintenance; and
the Ministry of Home Affairs through the Bupati, who is responsible
for administrative and financial problems such as the selection of
project localities and collection of funds from INPRES, province,
and local resources.

185
Constraints. There are three major constraints in executing the
Indonesian Rural Water Supply Program, namely, money, time and man
power. It was estimated in 1973 by the Project System Analysis Group
of WHO experts from taking samples in West Java Province, that based
on the water consumption rate of sixty liters per capita per day
with a public tap distribution system, average construction cost
would be U.S.$8 per capita, ranging from U.S.$3 to U.S.$30 depending
on the type of system to be installed. This figure is more realistic
than the U.S.$4 assumed in the Second United Nations Development
Decade (12). Assuming that this figure does not change, the Indone
sian Rural Water Supply Program, which is to serve a projected popula
tion of about 131 million people by 1980, will need at least U.S.$1
billion. This is a substantial amount of money for the Indonesian
Government at present, because many other projects are being imple
mented simultaneously under the Second Five-Year Development Plan.
The Indonesian Rural Water Supply Program consists of short-term
and long-term targets. The short-term target is to supply ten percent
of the Indonesian rural population, or about 13 million people, with
safe water systems by the end of the Second Five-Year Development
Plan, March 31, 1979 (6 )• The long-term target is to supply all of
the Indonesian rural population with safe water systems.
Concerning the short-term target, the Indonesian Government
would have to serve about 5.5 million people within two fiscal years,
1977-1978 and 1978-19 79; this requires a total of about U.S.$44 mil
lion or U.S.$22 million each fiscal year, a difficult undertaking.
With regard to the long-term target, an investment of about U.S.$1
billion is needed. In the fiscal year 1976-1977, the Indonesian

186
Government spent U.S.$14.88 million. Assuming that the Indonesian
Government will spend at least the same amount for each successive
year, it would take about seventy years to supply the projected
rural population of 131 million with safe water systems; but during
this period of time, the population would at least double. There
fore, it is difficult to predict how. much time would be needed to
implement the Indonesian Rural Water Supply Program.
However, since the Indonesian Government is now running a
national development program across the country with emphasis on
rural areas, progress, in the economic growth of rural areas, as well
as in the nation, will enable the investment of a greater amount of
money in rural water supply projects. As village incomes increase
and a better level of education is attained, the villagers will per
ceive the need for a safe water system, and they will contribute a
greater portion of the cost of installation of a safe water system
or even finance such an installation themselves. Nevertheless, the
Indonesian Rural Water Supply Program will take some decades to
complete.
The scope of the Indonesian. Rural Water Supply Program is
broad. It requires a lot of money and a large number of competent
personnel, appropriately organized for planning, design, execution,
supervision, operation, maintenance and the development of the rural
water supply systems.
In 1975 (10)> at the Central Directorate of Hygiene and Sani
tation, there were fifteen health controllers and' thirteen sanita
rians. There is a sanitary engineer in each of the two Departments
of Communicable Diseases in the Central and East Java Provinces.

187
In all, thirty-two health controllers and fifty-four sanitarians
are engaged in rural water supply schemes in the twenty-six Provin
cial Offices. For the 234 Kabupatens there are thirty-three health
controllers and 198 sanitarians in the Health Offices who are engaged
in rural water supply and sanitation programs. A staff of seventeen
health controllers, 169 sanitarians and 368 assistant sanitarians is
engaged in rural water supply and sanitation programs in some of the
3,138 Kecamatans.
These personnel figures are far below the needs of the water
supply program and most of the personnel do not have sufficient
background in engineering. A UNICEF/WHO Group (10) reported that the
absence of trained engineering staff at the national, provincial
and kabupaten levels is a serious drawback to the water supply pro
gram. However, it must be kept in mind that at present, it is very
difficult to find an engineer who is willing to work on rural water
supply projects because the production of engineers by universities
in Indonesia, particularly sanitary engineers, is very low, while
the demand is high, especially from private firms which offer better
conditions and higher salaries.
On the other hand, there is not much interest in construction
of rural water supply projects by large and experienced contracting
firms because the expected profit is not attractive to them and
because some sub-projects are located in very remote areas, especially
projects using spring protections with piped system, and they are
quite difficult to reach. Therefore, only the small and unexperienced
contracting firms are willing to work on rural water supply projects;
consequently, the use of small contracting firms will require more

188
qualified and experienced supervising teams, something which is very
difficult to find at this time.
Probably the best way to deal with this complex situation is
to install the simplest systems first, such as dug wells or tube
wells with handpumps, rainwater collection systems, and simple spring
protections without piped systems which do not require sophisticated
engineering designs, careful supervision or skilled operators; other
wise, the program will never be implemented. This should be accom
panied by an extensive training of engineering staff, supervising
teams, operation and maintenance personnel, as is presently being
conducted and planned by the Ministry of Health with the cooperation
and assistance of some engineering institutions and international
agencies such as WHO, UNICEF, UNDP and USAID.
LITERATURE REVIEW
Village Need, Village Potential and System Costs. A World
Bank Paper ( 12) discussed general criteria for selecting the indivi
dual sub-projects to be executed first, based on village need,
village potential, and system costs, since it is impossible to make
rigorous cost/benefit analysis of the effects of village water
supply programs. Village need is broken down into three components:
village interest; adequacy of existing supply in terms of quantity,
convenience, reliability during drought, and quality; and prevalence
of waterborne diseases. Village Potential includes the growth poten
tial of the community and village institutions. A lack of adequate
water supplies may prevent the development of the village's economic
potential, for example, markets, food or fish processing centers,

189
and local health or education centers. The villages may also be
unable to obtain sufficient water for productive non-domestic use,
for example, agriculture, livestock, vegetable cultivation, prepara
tion of produce for market, or cottage industries such as cloth
dyeing. With respect to village institutions, it was stated that
villages with strong, competent institutions and good educational
levels would be more able to participate in drawing up a program,
to collect water charges, and to find operating and maintenance staffs
from among the villagers than villages where such conditions do not
exist.
The objective of system costs is to ensure the least-cost means
of providing the required service. Factors affecting this objective
are: population distribution, the nature of the water source and
its accessibility. With respect to population distribution, it
was mentioned that other things being equal, the larger, more densely
populated villages will need lower investment costs per capita. One
system for a group of villages that are close together may be lower
in capital cost and more economical to operate and administer than
those for scattered villages. With respect to accessibility, it
was stated that a system for villages without good roads will be
difficult and expensive to construct and maintain.
Economics and Policy. Saunders and Warford (8) described
criteria based on economics and governmental policy which are nor
mally used to determine investment priorities in rural water supplies
in less developed countries. This question was examined under the
following headings: Costs, Economies of Scale, and Service Quality;
Growth Point Strategies; Income Redistribution and "Worst First"

190
Strategies; Financial Viability and Community Enthusiasm; and Maximum
Number Served per Fixed Resources. In practice, of course, political
considerations or response to the most vociferous demands for service
are often major determinants of who will receive water first.
Saunders and Warford assume that generally there are economies
of large-scale production in the provision of water supplies. If
this assumption is valid and if the objective of the rural water supply
program is to serve the most people at the least cost, this criterion
would lead to construction of the water supply systems in the largest
villages first. Eligible villages could simply be ranked by popula
tion size and then be provided with water supplies in turn as resources
become available. Regarding service quality, it was stated that two
of the more important factors are transmission costs and source works.
For example, distribution through public hydrants is more economical
than through house connections, and use of dug wells with handpumps
is more economical than river treatment facilities.
In considering growth point strategies, it was stated by Saunders
and Warford that economic growth and development does not take place
at the same rate in all localities; at any point in time, some areas
are growing rapidly, some areas are stagnant, and some others are
declining. One suggestion for helping the rural population is to
stem the out-flow of people in rural areas so that they can more
effectively compete with the better established urban areas. Once
a potential growth point has been selected, government investment
in educational facilities, roads, market places, and sanitary facili
ties including water supplies is necessary. The objective of the
investment is to create centers which will hold populations and

191
attract and hold economic activities. While a safe water supply may
be necessary for development, it is not sufficient in itself to induce
development. Therefore, if economic development is an objective,
then the limited water supply investment must be directed into
selected high potential areas or region with a relatively concen
trated population, and it should be accompanied by complementary
investment in other public services.
For income redistribution and "worst first" strategies it was
stated by Saunders and Warford that the goal of redistributing
income from higher to lower groups could also be a consideration
when selecting which villages should have a high priority for receiving
a water supply system. Any investment emphasis on rural areas
will on an overall basis result in a high to low income redistri
bution since rural populations are generally poorer than urban popula
tions and since the major portion of national revenue comes from the
higher income urban areas. In Thailand villages are ranked according
to their need for water and those villages with most need are given
the highest priority. At present, the Indonesian Rural Water Supply
Program ( 5) is close to this strategy since the highest priority
is given to "critical areas" where water is extremely difficult to find
and a high cholera incidence is present, although village contribu
tions are expected.
In discussing financial viability and community enthusiasm, it
was stated by Saunders and Warford that a financial viability condi
tion is probably not consistent with a worst-first strategy. On
the other hand, it could be consistent with a growth point or growth
area strategy, and if the national government partially subsidizes

192
the program there would still be a redistribution of income in the
country. It is also frequently noted in rural water supply literature
that the probability of project failure is much greater in cases
where the recipient village is not outwardly enthusiastic about
the project. No matter how badly a village needs a better water
supply system, if the population does not perceive the need for or
value of the system, the usage rate will be low, system maintenance
and local administration will be inadequate, and vandalism could be
a problem.
Finally, it was stated that another strategy for selecting
villages would be to choose villages which can be served most econo
mically. This would essentially be an attempt to serve the maximum
number of either villages or people with a given amount of financial
resources. The Pan American Health Organization (PAHO) formula which
will be discussed later in this chapter, has a selection bias which
fits well under this strategy. Generally, while there is nothing
wrong with a strategy of minimizing costs and maximizing the number
of localities served; many countries, given their objectives, would
probably be better off constraining such a strategy to include some
considerations of financial viability, growth points and/or enthu
siasm.
Criteria Adopted by Countries for Assigning Priorities. Pineo
and Subrahmanyam ( 2) presented seven criteria adopted by countries
for assigning priorities in providing new community water supplies.
Those are shown in Table V.6. Population was the most often mentioned
factor, followed by scarcity, development, health, social reasons,
community demand, and cost, in that order.

193
TABLE V.6
FREQUENCY OF MENTION OF CRITERIA ADOPTED BY COUNTRIES FOR ASSIGNING PRIORITY
IN PROVIDING NEW COMMUNITY WATER SUPPLY
Africa South of the Sahara
Latin America and the Caribbean
West Asia and Northeast Africa
Algeria and Morocco
Southeast Asia
East Asia and Western Pacific
Total
i
Scarcity
J 1
9
2
1
8
2
1
23
Population
Size, Density
10
11
0
4
1
4
30
Health
4
3
0
6
5
3
21
Development
9
6
0
3
2
3
23
Social
Reasons
6
6
0
4
0
2
18
4J CO O u
3
4
0
1
1
0
9
Community
Demand
1
2
8
0
4
3
1
18
SOURCE: Pineo, C. S. and Subrahmanyam, D. V. Community Water Supply and Excreta Disposal Situation in Developing Countries, A Commentary. Offset publication no. 15. Geneva: World Health Organization, 1975.

194
Priority Models. Linear programming (3), the pragmatic approach
(3) , the PAHO formula (8), and the Reid and Biscenza Model (4) will
be discussed as approaches to priority modeling.
The linear programming approach was developed by the PSA Group
of WHO experts ( 3) in 1973 for assigning priority for the rural water
supply program in the West Java Province, Indonesia. In mathematical
terms, this formula is expressed as follows:
Maximi ze Uj.P c.Wms,
subject to:
1. E(B) = p(fi)-FI + p(di)-DI
2. E(T) = 1/n Z p(ta).-CC.
i-1.. X X
3. E(M) = P(mc)-Lc + p(mom)-Lom
4. Wd 4 W±
5. E(P) = n p(p)±-OC i=l,2,3
where: Uj = the fraction of the population covered with drinking water of minimum standard, who utilize the water,
Pc = population coverage,
Wms = water of minimum standard quality for health care (liters/capita/day),
E(B) = expected budget,
p(fi) = the probability of foreign investment,
FI = the level of foreign investment,
p(di) = the probability of domestic investment,
DI = the level of domestic investment,
E(T) = expected technology cost,
p(ta)^ = the probability of the i-th technological alternative based on the hydrological and hydrogeological conditions in the area under consideration,

195
CC. = the construction or capital costs for the i-th i
alternative,
n = number of technological alternatives,
E(M) = expected manpower availability cost,
p(mc) = the probability of manpower or availability of manpower for construction,
p(mom) = the probability of manpower for operation and maintenance,
Lc = labor cost for construction,
LQm = labor cost for operation and maintenance,
W^ = water for drinking purposes,
W. = water for irrigation purposes,
E(P) = expected population, health, and socio-economic development problems cost,
P(p)i = probability of population (i=l), health (i=2) and socio-economic development (i=3) problems as a result of a lack of safe water supply,
OC = the opportunity cost of these problems.
The pragmatic approach was also developed by the PSA Group (3 )
as an alternative model for the linear programming approach which
was described above. The basic characteristic of this method is a
systematic integration of hydrological, hydrogeological, technologi
cal, demographic, health and socio-economic information for the defi
nition of a water supply problem and subsequent setting of objectives
for a water supply action program. The quantification of most of the
above variables follows an iterative process consisting of the follow
ing 12 steps:
1. Determine from a review of the water situation, hydrological and hydrogeological information, and the technology analysis, the technological alternatives for construction of a new system and/or rehabilitation of the existing water supply system per area.

Determine from a review of the manpower constraints, the probability of community contribution for maintenance of the water supply systems per area.
Rank order (as a result of steps 1 and 2) the areas on the basis of highest alternatives for construction and/or rehabilitation and highest probability for maintenance of the water supply systems.
Select relevant demographic dimensions, for instance, projected population and population density, for water supply systems and indicate these demographic factors per area.
Rank order (as a result of step A) the areas on the basis of the highest demographic dimensions.
Select relevant health dimensions (for instance, incidence, prevalence, and case fatality ratio) for selected health problems which relate to water supplies. Indicate per area the level of these health dimensions for the selected health problems.
Rank order (as a result of step 6) the areas on the basis of highest probability of health problems.
Determine from a review of on-going and planned socio-economic development in the country, province or district, the growth potential of selected socio-economic sectors.
Rank order (on the basis of step 8) the areas on the basis of lowest development potential.
On the basis of the rankings provided by steps 3, 5, 7 and 9, the areas can next be rank ordered such that the result shows in descending order: - the areas with lower technological alternatives for construction and probability of maintenance of water supply systems,
- the areas with lower probability of population problems related to water supplies,
- the areas with lower probability of health problems related to water supplies,
- the areas with lower probability of socio-economic development potential.
From a review of the manpower and financial resources, an attempt should be made to indicate the level of existing available resources per area. In addition, a number of alternative financing levels should be generated where each alternative shows the level of foreign and domestic investment for the water supply project.

197
12. This step allows for objective setting within the range of the remaining possibilities. This range has been narrowed by step 1, the technological alternatives, and step 10 which integrated demographic, health and socio-economic information for determination of priority areas. Given the highest ranked priority area in step 10, an objective (in terms of population coverage with water of minimum standard) can be set by selecting among the technological alternatives for this area (step 3) on the basis of maximum utilization of existing manpower and local financial resources and minium requirement for foreign investment (step 11). Next, objectives can be set for the second, third, and the rest of the priority areas. After setting objectives for all areas on the basis of one combination of levels of foreign and domestic investment, the process could be repeated for other alternative combinations of investment levels.
The PAHO formula is called a priority index formula developed
(8 ) in Mexico and which is expressed in mathematical terms as follows:
1 = 10° -rhr r k
an index of project selection priority in which a higher value of (I) indicates a higher priority for early water supply system installation,
the inverse of the cost per capita of the system, excluding the distribution network costs (or cost of public faucets); (C) is the total cost less household connections, if any, and (A) is the counterpart contribution supplied by the community,
an index of the physical availability of water derived as a ratio between the existing water flow at the point of capture and the requirement foreseen in the 20th year of operation of the system,
an index of the concentration of houses in the community to be served, measured as that proportion of the total number located within fifty meters of the proposed main conduit.
The Reid and Discenza model was intended to select the compatible
water and wastewater treatment processes (4); however, this model
is flexible and can be also used with a slight modification in raw
data inputs and data processing, for assigning priority for rural
whe re: I
C - A

198
water supply and urban water supply as well. This model is discussed
in Chapter III.
METHODOLOGY
The priority models presented are not suitable for the Indone
sian Rural Water Supply Program at the present time because of differ
ent strategies, rural conditions and characteristics, and the lack
of well-trained engineering personnel, especially at the Kabupaten
levels where the selection of the project localities is made. The
linear programming model is very sophisticated because every constraint
requires a separate analysis. It also requires that the personnel
involved have a background in economics, mathematical statistics,
demography and engineering. Such personnel, however, are not avail
able at the Kabupat en level at this time. The pragmatic approach
requires the same background for its personnel as does the linear
programming approach, and there is no basic formula for ranking
every variable; it requires practical experience and to some extent
personal judgment. The priority index formula is much simpler and
more realistic than the previous two; every variable is easy to quan
tify. It fits the strategies of Economies of Scale and Financial
Viability introduced by Saunders and Warford. However, this model
does not fit the Indonesian Rural Water Supply Program strategies
which are closer to Income Redistribution and "Worst First'1 Strate
gies. This model implies that the communities with the larger pop
ulation, the higher village contributions, the higher house density
and abundance of water sources receive the safe water system first;
it reflects the "Best First" Strategies because, in general, a larger

199
population indicates better economic development, better educational
levels and better sanitation conditions in the community. In other
words, this type of community does not need very much help. The
Reid and Discenza model is not suitable for the rural water supply
program in Indonesia at this time because some of the inputs of
socio-technological factors and indigenous resources are not yet
available in the rural areas in Indonesia. However, this model
inspired the author to develop a suitable model for a priority setting
of the Indonesian Rural Water Supply Program. Although the model
developed in this study is different from the Reid and Discenza
model, the process of utilization is similar.
Model Development. The objective of this study is to develop
a priority model suitable for the Indonesian Rural Water Supply
Program at this time, taking into consideration the strategy of the
Indonesian Rural Water Supply Program, the Indonesian rural conditions
and characteristics, the qualifications of the personnel at the
Kabupaten Offices who are to use the proposed developed model, and
the practical experience of the author.
Based on the above criteria, the model developed in this study
will be very simple and unique as illustrated in Figure V.3. It
is a matrix system and in mathematical terms is expressed as follows:
10 PI. = Z W.-S..
-J 1 = i
where: PI = Priority Index
W = weight of each parameter
S = score of each parameter in each village
i = a subscript denoting the i-th parameter
j = a subscript denoting the j-th village.

200
en • u 3 P u 3 O
X
u 4-1 CO
s a) M o CJ
CO
1—1
M IX.
r—4
*• o
.—< CO
o r H
12
+ . • •
+__ •s
CM CO
CM 3
+ .—i
*« r H
CO r-H
Ss
CM 1
t - 1
P H 1 c
I - 1
P H
i
CM C • 1 #»
o o r-H r-H
CO o r-H
3
+ . • •
+ CM *> CM
CO CM
3
+ CM r.
«-H
CO i-H
s
CO o • — 1
r 3
+ • • •
+ 3
CM CO
CM 3
+ C #« r-H
CO r-H
3
r
X ) O
A -4-1
a) -J
• H
42 P.
r H
cu Q ^ w
01 VH
01 4-1 CU
fa CO
u CO
P H
c <D H
1 y j
• H O
CU
e o
J 3 CO U CU cu en 4-1 CO
to cu C£
1 a <o •H 3E
;>> oo •u c r H - H 3 C CJ - H
• H CO <4H 4J J-<4H J 3 C • H O 4-Q
r H CO CO QJ O >
•H - H 0 0 4-> O CO
H 3 O M G <U
4 x . 4J ; CJ r H ' 0) <J
H
1 a en
c o c o u o • H - H 4J 0) 4J CO 0 0 3
r H CO , 0 3 r H - H P . - H U O - H 4J
a, >
1 o
P H r H
CU tO 00 -H tO 4-J
•H C r H CU • H 4J
>
en cu CJ CO
r H
PH
a • H r H
r 0 3
P H
| en • H Q
CO 4-J
a) u u X w
X I
o •G 4-> CU 51
r H CO en O P.
en d O
• H > . 4-1 r H •H P. x) p. C 3 O CO
c_> u
X ) CU CO 2 o o Pi CH
I
en 4J 3 P 3
M
1 u o
MH
3 M
r H tO U CU C CU O
3 o
•H 4-1 CO
fci
c o • H 4J CO
r H
3 p. o
P H
1 tn
• H
n (1)
c r H
o - O r H
eu 4-1 CO
s
e/ a Cf CC
a
u cu 4J tO 3
oo c • H 4-> en
•x w
B 0) 4-1 U
en cu >> 4-i
CO CO 3
t^ r H X I p. g P. 3 3 o
CO M O
C o
• H 4J CO 3 4-1 CJ 3
r H kM
en cu o u 3 O
CO
r H
a) 4-1 CO
s
pa
ce u M
• H (U
J 3 H
X I
G tO
>> u • H O
1 >^ G 4J CU • H 4J r H O CO P H
3 'O" 0)
0 0 M CO CU r H 4-1 r H CO - H 13 >
r H CO
• H 4-J
1 ej
••H 4J t-1 CO
P H
eu 00 tfl
r H r H •rH
>
C O
• H 4J n) P.
•H
M 0) P-O P. c 01 2
tn CD CJ to
i H
P H
t ) •H r H £} 3
P H
1 en
• H CI
tn 4-1 CI) u CJ X w
X I
o c 4J CU y, r H CO tn o P.
en 3 o •H 4J
• H X ) 3 o CJ
X ) CO
o Pi
r ^ r H P. P. 3
CO
In CU
r* o P H
CU
x: 4-1
VH
o MH
r H CD
X )
o T,
0 0 CI
• H 4-1 4_>
cu CO
>. 4-1 • H
u 0
• H
u P H
S H
O
B CO U 0 0 tO
• H
a
»> o
r H Pu
<
c-i
>
00 • H P H
• K cO rH
00 o >H
P H
>, r H
P. P. 3
CO
U CU 4-1 CO
t—1
CO rH
3 Pi
c to
• H c/> CU fi o
X )
c M

201
The villages represent matrix rows and the parameters represent
matrix columns. The entries consist of the product of weight times
score of each parameter, that is W.-S...
The parameters consist of the following ten elements: water-
borne diseases, difficulty in obtaining water, technological alter
natives, population, village contribution, village potential, public
places, excreta disposal, road conditions, and power supply. Selec
tion of the ten parameters was based on the strategy of the Indonesian
Rural Water Supply Program, their relevance to the program, suita
bility to the Indonesian rural conditions and characteristics, and
feasibility in applying them to the data available. Six of these
ten parameters are the same as the criteria adopted by countries for
assigning priority in providing new community water supplies presented
in Table IV.6. Following is a discussion of the relevance of each
parameter to the above mentioned criteria.
(Waterborne Diseases.) It was expressed in the INPRES Program
(5 ) that the provision of safe water systems per province was based
on the following considerations:
a. the incidence of cholera and other waterborne diseases such as typhoid, trachoma, and gastroenteric and skin diseases,
b. the areas which have difficulty in obtaining water,
c. the availability of Directorate of Hygiene and Sanitation personnel,
d. the availability of data from presurveys.
Because water plays an important role in transmitting diseases, this
parameter should be given the highest weight.
(Difficulty in Obtaining Water.) This parameter was also men
tioned in the INPRES Program as expressed above. During the dry

202
season, in seme areas water is extremely difficult to obtain; the
villagers have to travel a few kilometers, and in some places more
than seven kilometers, to get a bucket of water. Also, they must
often climb or descend to get to the water source.
(Technological Alternatives.) The type of water technology
to be installed will be based on the availability of water sources
and the capability of the community to operate and maintain the
system. The concern of this parameter is to choose the simplest
and most economical systems, such as dug or tube wells with handpumps,
spring protection without piped systems, free-flowing artesian wells,
and if there is no other water source in the area, rainwater collec
tions .
(Population.) This parameter is associated with the economy
of the project as described by Saunders and Warford who assumed
that there are economies of large production scale in the provision
of water supplies. More important in this respect is whether the
population is nucleated or dispersed. In this model as in Table V.6,
population receives a high.weight.
(Village Contributions.) This parameter reflects village
interest and involvement in the water supply program. The best evi
dence of such interest is village willingness to contribute to con
struction costs and to pay an adequate fee for water use in order
to operate and maintain the system that is to be installed. Village
contributions include money, labor and local materials. This para
meter also reflects the sense of community responsibility for the
system.

203
(Public Places.) Public places include health centers, schools,
markets, Desa institution buildings, and religious centers such as
mosques, churches, and temples. These public places play an impor
tant role in spreading or controlling waterborne diseases, and
health centers and schools in particular play an important role in
teaching people about personal hygiene, grooming and how to appreciate
safe water systems.
The PSA Group (3) reported that men tend to get cholera first
and then transmit it to their families. The reason is that men
often travel to other villages to visit public places to do business,
while most women stay at home preparing meals and taking care of
their children. Therefore, in planning a rural water supply, public
places must be taken into consideration; for instance, public taps
(hydrants) should be located near public places, or preferably on the
grounds of public places.
In the event that there is not sufficient water to supply the
community, public places are served first in Indonesia, since these
places accommodate many people; this reflects the characteristics
of the Indonesian people who are cooperative and willing to work
together.
(Excreta Disposal Method.) To improve the public health
conditions in rural areas, along with the water supply program, the
Indonesian Government is also running a program to provide one latrine
for every house. If many houses in the community have latrines or
other sanitary excreta disposal facilities, it will reduce the number
of latrines to be built in the community, and the budget for latrines

204
could be applied later to the water supply project. This will
increase the number of project localities.
(Road Conditions.) If there is an accessible road to the com
munity, it will be helpful in the transportation of equipment and
materials during construction and later maintenance as well, parti
cularly for systems using artesian wells and surface water treat
ments, where construction requires drilling rigs, concrete mixers,
water pumps, pipes, and prefabricated steel water tanks. An accessi
ble road, therefore, will reduce the construction cost and save time.
(Power Supply.) Some systems such as non-free flowing artesian
wells, surface water treatments and spring protections with low
elevation require motorized pumps; therefore, the availability of
electric power will be very helpful because it will reduce the costs
of operation and maintenance. An electric pump is easier to operate
and maintain than a diesel pump.
Weighting Process. The Delphi method is used in this study as
the weighting process. It has been developed extensively by Olaf
Helmer (1966) and others at the RAND Corporation (11). In this
method, experts form a panel and then deal with a specific question.
Rather than meeting physically to debate the question however, these
experts, the panel members, are kept apart so that their judgment
will not be influenced by social pressure or by other aspects of
small group behavior.
This method is applied in this study to determine the weight of
each of the ten parameters, based on their relevance and importance
in relation to the water supply program. A panel of twenty-eight
distinguished experts was formed; the experts were selected from

205
various countries who are very much involved in rural water supply
programs. A questionnaire listing the ten parameters was sent and
each expert was requested his or her opinion on how to distribute
100 points among the ten parameters. Twenty-three completed ques
tionnaires were received and summarized. A copy of the question
naire distributed in included as Figure V.4. The average weight for
each parameter is summarized in Table V.7. The highest weight is
16.1 for Village Contributions. Three other parameters, Water-
borne Diseases, Difficulty in Obtaining Water and Technological
Alternatives, received high weights, 14.9, 14.4 and 13.9, respectively.
Population received only 11.5, just slightly above the mean value
of 10, and occupied the fifth rank. Village Potential received 9.0,
below the mean value, and occupied the sixth rank, and Public Places
received 6.9 and occupied the seventh rank. The three parameters
which received the lowest weights were Excreta Disposals, Power
Supply and Road Conditions receiving 5.4, 4.4 and 3.5, respectively.
Upon review of the results, no panel member disagreed with the
average weight distribution. Thus, it was concluded that the average
weight for each parameter was a reasonable figure to work with.
Data Collection. The data was obtained from the Directorate of
Hygiene and Sanitation, Directorate General of Communicable Diseases,
Ministry of Health, Jakarta, Indonesia, through the Phase I Survey
which covered about 21,000 villages. Copies of Questionnaires A, B,
and C and of Questionnaire Part I are included in the appendix for
Chapter V. This data was collected using Questionnaire A, instead of
Questionnaire Part I which was used to develop the ten parameters as cri
teria for assigning priority. Due to this change in the questionnaires,
information on some of the parameters was not made available. However,

206
Fig. V.4. QUESTIONNAIRE FOR DETERMINING PARAMETER WEIGHTS
— — * — •
No. Parameter Weight
1. Waterborne Diseases
2. Difficulty in Obtaining Water
3. Technological Alternatives
4. Population
5. Village Contributions
6. Village Potential
7. Public Places
8. Excreta Disposals \
9. Road Conditions
10. Power Supply
Date _
Name
Title
Total 100.00

207
TABLE V.7
AVERAGE WEIGHT DISTRIBUTION OF THE TEN PARAMETERS
No. Parameter Average weight
1. Waterborne Diseases 14.9
2. Difficulty in Obtaining Water 14.4
3. Technological Alternatives 13.9
4. Population 11.5
5. Village Contributions 16.1
6. Village Potential 9.0
7. Public Places 6.9
8. Excreta Disposals 5.4
9. Road Conditions 3.5
10. Power Supply 4.4
Total 100.0

208
discussions with health officials in Jakarta and Bandung concluded
that these ten parameters should be kept.
Data collection was conducted by sanitarians and assistant
sanitarians from the Kabupaten and Kecamatan Levels using Ques
tionnaire A, one per village. The completed A Questionnaires were
gathered at the Kecamatan Office, where the data was then transferred
to B Questionnaires; this is called Tabulation at the Kecamatan
Level. The completed B Questionnaires were then sent to the Kabu
paten Office and were transferred to C Questionnaires. This is called
Tabulation at the Kabupaten Level. Finally, G Questionnaires were
sent to the Directorate of Hygiene and Sanitation (Central Govern
ment) . There only the C Questionnaires from the twenty-two surveyed
provinces were available at the Directorate of Hygiene and Sanita
tion because the original data, A Questionnaires, were kept at the
Kecamatan Office, and B Questionnaires were kept at the Kabupaten
Office. Tabulation at Kabupaten Level, C Questionnaires, do not
contain detailed data for every village, but rather data and infor
mation for the whole Kabupaten area; they cannot be used to establish
a priority based on individual villages. To establish a priority,
completed B Questionnaires should be used. (There were four Kabu-
patens who misunderstood the above procedure for handling data and
sent Questionnaires A, B and C to the Directorate of Hygiene and
Sanitation.)
Finally, to get the most representative data possible based
on the data available at the Directorate of Hygiene and Sanitation,
twenty-two C Questionnaires representing Twenty-two Kabupatens from
twenty-two Provinces were selected, and thirty-five B Questionnaires

209
were also selected and obtained from the following Kabupatens: four
from North Maluku; fourteen from Tasikmalaya; eight from Cirebon;
and nine from Majalengka. For additional information, 134 A Ques
tionnaires from Cirebon and Tasikmalaya Kabupatens were also selected
and obtained. The total data selected and brought back to Norman,
Oklahoma, consisted of 1,468 pages, and from this raw data the final
selection was made to meet the requirement of testing the model.
Scoring Process. The scoring process consisted of the cate
gorization of the data and score assignment of each data category.
As indicated earlier, data for some parameters was not made available
through use of Questionnaires A, B, and C. In this case, categori
zation was based on Questionnaire Part I which was used to develop
the ten parameters. Efforts were made in categorization to quantify
as many of the parameters as possible in order to facilitate appli
cation to the model. The categorization of each parameter follows.
(Waterborne Diseases.) There are five diseases that are consid
ered waterborne diseases in the survey data, namely, cholera, gastro
enteric disease, typhoid, trachoma and skin disease. According to
Questionnaire A, these five diseases are categorized as follows:
a. Five diseases present.
b. Four diseases present.
c. Three diseases present.
d. Two diseases present.
e. One disease present.
f. Cholera present.
g. No disease present.

210
(Difficulty in Obtaining Water.) This parameter is expressed
in the distance the villagers have to travel to a water source and
the distance they climb or descend to get to the water source.
This parameter is categorized as follows:
a. less than 200 meters away without climbing or descending,
b. between 200 and 1,000 meters away without climbing or descending,
c. more than 1,000 meters away without climbing or descending,
d. less than 200 meters away with climbing or descending less than 150 meters,
e. between 200 and 1,000 meters away with climbing or descending less than 150 meters, .
f. between 200 and 1,000 meters away with climbing or descending 150 meters or more,
g. more than 1,000 meters away with climbing or descending less than 150 meters,
h. more than 1,000 meters away with climbing or descending 150 meters or more.
(Technological Alternatives.) This parameter is categorized
as follows:
a. rainwater collections,
b. dug wells or tube wells with handpumps,
c. spring protections without piped systems,
d. spring protections with piped systems by gravity,
e. spring protections with pump and piped systems,
f. free-flowing artesian wells without piped systems,
g. free-flowing artesian wells with piped systems,
h. non-free flowing artesian wells with pump and piped systems,
i. surface water (includes rivers, irrigation canals, lakes and ponds) with piped systems by gravity and chlorination,

211
j. surface water with piped systems, pump and chlorination,
k. surface water with complete treatment and piped systems.
(Population.) The data shows that the population varies
widely, from 100 to more than 36,000 people per village. However,
generally, the number of people in the villages within the same
Kecamatan do not vary very much; this will ensure a fair result in
population scoring because score assignment is made Kecamatan by
Kecamatan. Based on the wide range in population size, this para
meter is categorized into six groups and each group is further
broken down into five sub-groups in accordance with the average
number of people per village within the Kecamatan, as presented in
Table V.8.
(Village Contributions.) This parameter can be quantified if
the village contributions are expressed in terms of the percentage
of the total construction cost and the amount for operation and
maintenance which the villages are willing to pay, whether this be
in the form of money, labor or local materials. However, the data
available gave only the villages willingness to contribute to the
construction and/or maintenance costs without further specification.
Based on this data, this parameter is categorized as follows:
a. willing to contribute to the construction and maintenance costs,
b. willing to contribute to the construction cost only,
c. willing to contribute to the maintenance cost only,
d. not willing to contribute at all.
(Village Potential.) This parameter includes the elements
of economic growth potential and manpower. It is better to express

212
0 0
> U4 r J
w < H
O OS o
1 S-* PQ CO ZD T 3 CO C
CO
a en Z 3 <3 o .&
co W (3 M iH Pd o n o o W -H H *-> < ! CO U r H
3 •> O .
2 O O P H r H v - ' H < £ P H
O P-<
0) 60 CO
• H >
u CO
w
o 4-1
en §• o u o I
•9 CO
T3 C CO
C O •H
3 B. O
m
a i o x; • H 4-1 J-" vH CO £
• H 3 0) D , 6 0 O CO
PM i H i H
0) - H 6 0 > CO U U <U <U > O. <3
C CO 4J CO
Fi cfl O 0)
^ <u
• C u
c • H
3
and
o o r H
a. 3
and
o o CM
§*
and
o o <r
3
and
o o r~~
&
and
o o
i-H
3
and
o o m CM
o o r H
o m o
o o CM
m CM
i H
O O <r
o m CM
o o r-
O m <r
o o m rH
O O
o 1-1
o o m CM
c o o CM
o m o
m CM
m CSl
iH
m
o m CM
o in
o in
o-
o o
o o o i-H
o o
o o o CM
o o
m CM
o
m iH
O
m
o
o m o
o m r H
O O
r H
O O
en
o o CN
o o r-»
o o m
o o m
o o o t - l
m • H
O
0 4J
§•
o m o
o 4-1
ex 3
O
o •-H
O 4-1
§"
o o CM
O 4-1
ex 3
o o m
o 4-1
§•
o o o r H
O 4-1
§"
o in o
o o m
o o
o o §•
o
o 4-1
Ou 3
r H
o i n
o
CN
o o r-{
i n
o o CM
o rH
o o i n
c CO
o o o r H
T3

213
the economic growth potential in terms of income per family, but this
is difficult to assess because incomes are not stable and do not come
from merely one source for most villagers, since the majority of the
villagers are farmers. During fanning season the villagers work on
their farms, but off-season they find other jobs in such areas as
construction, public transportation, trade, handcrafts, and fishing.
Therefore, it is better to express village economic growth potential
in terms of land use, mineral resources, industrial development, and
number of infrastructures and utilities as was done by the PSA Group
(3) in 1973 for the West Java Province Rural Water Supply Program.
The following factors were used:
a. agricultural land used as rice field,
b. agricultural land used as dry farming,
c. agricultural land used as fish ponds,
d. planned industrial development,
e. high growth industry,
f. medium growth industry,
g. mineral resources such as oil, coal, tin, bauxite, manganese, gold, copper, nickel, sulphur, and lime,
h. Central Government and/or Provincial roads,
i. Kecamatan road infrastructures,
j. electricity distribution and/or potential for distribution such as proximity to tension lines,
k. an urban center in the Kecamatan or in its neighborhood.
Manpower is categorized as follows:
a. engineers,
b. bachelor engineers,
c. health controllers,

214
d. technicians,
e. sanitarians,
f. assistant sanitarians.
(Public Places.) This parameter is quantifiable, so categoriza
tion is not necessary because scoring merely follows the number of
public places such as the number of health centers, schools, markets,
mosques, churches and temples that exist in each village.
(Excreta Disposal.) This parameter is expressed in terms of
the percentage of houses in each village using sanitary excreta
disposal methods such as septic tanks, latrines, and fish ponds.
Since this parameter is quantifiable, categorization is not necessary.
(Road Conditions.) This parameter is expressed in terms of
accessibility to carriers and capacities. The categorization is as
follows:
a. accessible to trucks,
b. accessible to light trucks,
c. accessible to carts pulled by horses, cows, and water buffaloes,
d. accessible to two-wheeled vehicles.
(Power Supply.) This parameter is categorized on the capacity
of the power output available expressed in terms of kilowatts,
as follows:
a. up to 1.5 kilowatts,
b. 1.5 to 3 kilowatts,
c. 3 to 5 kilowatts,
d. more than 5 kilowatts.
The following paragraphs discuss the process of score assignment
for each parameter. Scoring (establishment of S.. values) is somewhat

215
arbitrary. The score values will range from 0 to 15 using only
round numbers.
(Waterborne Diseases.) The score for each category is merely
the sum of the scores of the diseases represented in each category
for a particular case. For the five diseases considered as water-
borne, the scoring values are based on how dangerous each disease
is and the role of water in transmitting those diseases. For the
scoring values used for each disease, see Table V.9.
(Difficulty in Obtaining Water.) The scores range from 1 for
the smallest distance without climbing or descending to 10 for the
farthest distance with the greatest amount of climbing or descending,
as presented in Table V.10.
(Technological Alternatives.) The scores range from 1 for the
most complicated to 10 for the simplest systems as shown in Table V.ll.
(Population.) The scores range from 1 for the smallest number
of people to 10 for the largest number of people in each village as
shown in Table V.12.
(Village Contributions.) The scores range from 0 for villages
which are not willing to contribute to the construction or mainte
nance costs to 10 for villages which are willing to contribute to
the construction and maintenance costs. See Table V.13.
(Village Potential.) Categorization was not necessary because
score values were simply assigned for each of the relevant factors
which can exist in a village. The total score is the sum of the score
values for all the factors present in the community. The values
are presented in Table V.14.

216
TABLE V.9
SCORE ASSIGNMENT FOR WATERBORNE DISEASES
Disease Score
Cholera
Gastroenteric disease
Typhoid
Trachoma
Skin disease
No disease
5
4
3
2
1
0
TABLE V.10
SCORE ASSIGNMENT FOR DIFFICULTY IN OBTAINING WATER
Categc
a
b
c
d
ry Score
1
2
4
4
Category
e
f
g
h
Score
6
8
8
10

217
TABLE V.ll
SCORE ASSIGNMENT FOR TECHNOLOGICAL ALTERNATIVES
Category
a
b
c
d
e
Score
10
10
8
7
5
Category
f
g
h
i
k
S core
6
4
3
3
1
0
TABLE V.12
SCORE ASSIGNMENT FOR POPULATION
Category
a
b
c
d
e
f
1
1
2
3
4
5
6 • -
2
2
3
4
5
6
7
Population
3
3
4
5
6
7
8
Sub--Gro up
4
4
5
6
7
8
9
5
5
6
7
8
9
10

TABLE V.13
SCORE ASSIGNMENT FOR VILLAGE CONTRIBUTIONS
Category Score
10
5
5
0
TABLE V.14
SCORE ASSIGNMENT FOR VILLAGE POTENTIAL
Factor
a
b
c
d
e
f
Score
2
1
2
3 i
7
4
Fa ctor
g
h
i
j
k
S core
4
1
1
1
2
219
(Public Places.) The score value given each public place is
based on the quantity and frequency of water use and its role in
transmitting or controlling the waterborne diseases; these values
range from 1 to 5 as shown in Table V.15. The total score is derived
from knowing the total number of public places in a community.
(Excreta Disposals.) The score is based on the percentage
of houses using sanitary excreta disposal methods and ranges from 1
for ten percent to 10 for 100 percent, as is shown in Table V.16.
(Road Conditions.) The scores range from 1 for accessibility
to two-wheeled vehicles to 5 for accessibility to trucks as shown in
Table V.17. In some areas in Kalimantan and Sumatra, transportation
consists of boats, speed boats and canoes. In this case, a boat is
equivalent to a truck, a speed boat to a light truck and a canoe to
a cart.
(Power Supply.) The scores are based on power supply capacity
and range from 1 for the lowest capacity to 4 for the highest capa
city as is shown in Table V.18.
TEST OF THE MODEL
Introduction. The data obtained from the Indonesian Government
was processed to demonstrate the utilization of the model. This will
provide guidelines for the planners who are involved in the Indonesian
Rural Water Supply Program at the kabupaten level by giving them
an example of practical use.
The priority setting chosen was the kabupaten level because
the project manager of the rural water supply projects is the Bupati.
INPRES funds and funds from local communities come to the Bupati

TABLE V.15
SCORE ASSIGNMENT FOR PUBLIC PLACES
Public Places Score
School
Health center
Market
Mosque
Church
Temple
5
4
3
3
2
1
TABLE V.16
SCORE ASSIGNMENT FOR EXCRETA DISPOSAL
Houses Using Sanitary Excreta Disposal
Facilities (Percent)
Up
11
21
31
41
to 10
to 20
to 30
to 40
to 50
Score
1
2
3
4
5
Houses Using Sanitary Excreta Disposal
Facilities (Percent)
51
61
71
81
91
to 60
to 70
to 80
to 90
to 100
Score
6
7
8
9
10

221
TABLE V.17
SCORE ASSIGNMENT FOR ROAD CONDITIONS
Category Score
a 5
b 3
c 2
d 1
TABLE V.18
SCORE ASSIGNMENT FOR POWER SUPPLY
Category Score
a 1
b 2
c 3
d 4

222
account. Additional data and information, if desirable, is easily
obtained at the kabupaten office. The Bupati knows much more about
the rural conditions and characteristics in his area than do the
officials from the Directorate of Hygiene and Sanitation.
To perform the test, selection was made of six B Questionnaires
representing six Kecamatans from four Kabupatens. Additional informa
tion, when necessary, might be obtained from the available A and
C Questionnaires. The six Kecamatan included Ibu and Jailolo Keca
matans from the North Maluku Kabupaten, Maluku Province; Kadipaten
Kecamatan from the Majalengka Kabupaten, West Java Province; South
Cirebon Kecamatan from the Cirebon Kabupaten, West Java Province;
Manonjaya and Tasikmalaya Kecamatans from the Tasikmalaya Kabupaten,
West Java Province.
Score Processing. The example of only one of the six Kecamatans
is presented here. The data from the Ibu Kecamatan will be categorized
and scored for each parameter. The IBU Kecamatan, located in the
North Maluku Kabupaten, Maluku Province, is an area which has the
lowest average population per village in Indonesia, that is, 336
people per village. The actual number of people per village ranges
from 111 to 1,158 people. The total population of the Kecamatan
is 10,070 which is dispersed among thirty villages within the Kecama
tan area. One more interesting point is that no waterborne disease
is present in this Kecamatan.
(Waterborne Diseases.) Data concerning waterborne diseases can
be seen in Table B.8 of Questionnaire B. Since there is no water-
borne disease indicated, all villages in this Kecamatan belong to
category (g) with a score of 0.

223
(Difficulty in Obtaining Water.) Table B.3.2, Questionnaire B,
indicates that the villagers in this Kecamatan take water from wells,
springs, rivers or irrigation canals. Table B.6 indicates that the
villagers have to travel from less than 200 to more than 1,000 meters
to get to the water sources, while Table B.7 indicates that the
villagers from some villages do not have to climb or descend and that
others have to climb or descend from less than 150 to more than 150
meters. Thus the Ibu Kecamatan contains within it villages which fall
into most of the categories of this parameter, as is shown in Table V.19.
(Technological Alternatives.) For this parameter the planner
must consider Tables B.4, B.5, B.6, B.7, B.8 and B.9, Questionnaire B,
to decide the best possible alternatives for each village. For
villages numbered 17 and 19, the best possible alternatives are dug
or tube wells with handpumps (category b), because groundwater is
available all year round in those two villages and it is of a good
quality with a water depth less than fifteen meters and can be drawn
out by deep-handpumps. Spring protections without piped systems
(category c) should be used for villages numbered 1, 5, 13, 15, 16,
27, 28, 29 and 30 because there are located within 200 meters of
these communities springs which never dry. Spring protections with
piped gravity systems (category d) should be used for villages num
bered 2, 3 and 26 because there are springs which never dry located
within a distance from the communities of between 200 to 1,000 meters
or more than 1,000 meters and at an elevation higher than that of
the communities. Surface water with piped systems and chlorination
(category i) should be used for villages numbered A, 6 - 12, 14, 18,
and 20 - 25 because only surface water from rivers or irrigation

224
TABLE V.19
CATEGORY AND SCORE FOR IN THE
DIFFICULTY IN IBU KECAMATAN
OBTAINING WATER
No Village Category Score
1. Podal 2. Tengwango 3. Togowo 4. Duno 5. Tokowoko 6. Goin 7 . Sangaji Nyeku 8. Sangaji Adu 9. Toguis
10. Togoreba Sungi 11. Borona 12. Todake 13. Sirimahu 14. Pasalulu 15. Togoreba 16. Tobaol 17. Tongutette 18. Gam Lamo 19. Gam Ici 20. Tongute Sungu 21. Akesibu 22. Tongute Goin 23. Maritango 24. Kei Ici 25. Naga 26. Tosoa Togower 27. Tababal 28. Baru 29. Aduu 30. Ngawet Nanas Jere
a e e e a a a a f a a b e a f a a a a d h a a h e f a a d d
1 6 6 6 1 1 1 1 8 1 1 2 6 1 8 1 1 1 1 4
10 1 1
10 6 8 1 1 4 4

225
canals is available during the dry season in those sixteen villages
and because the water quality is good that is, it is clear and not
salty. The scores for this parameter are presented in Table V.20.
(Population.) The number of people per village within the Ibu
Kecamatan is obtained from Table B.2, Questionnaire B. The average
number of people per village is 336; therefore, this Kecamatan belongs
to category (a) with the scores ranging from 1 to 5, as presented in
Table V.21.
(Village Contributions.) The data for this parameter is obtained
from Table B.10, Questionnaire B. All villages in the Ibu Kecamatan
are willing to contribute to the construction costs and the villages
numbered 1 to 16 are also willing to contribute to the maintenance
costs. Thus, the sixteen villages numbered 1 to 16 belong to category
(a) with a score of 10, and the fourteen villages numbered 17 to 30
belong to category (b) with a score of 5.
(Village Potential.) There is no data available for this impor
tant parameter due to the questionnaire change.
(Public Places.) There is no data for this parameter.
(Excreta Disposal.) The data for this parameter would ordinarily
be obtained from Table B.16, Questionnaire B, and Table A.13, Ques
tionnaire A. However, these two tables were left blank by the surveyor.
(Road Conditions.) There is no data for this parameter due to
the questionnaire change.
(Power Supply.) There is no data for this last parameter due
to the questionnaire change also.
Priority Computation. The priority indices were then determined
for the villages. The products of W.S was determined and the value

226
TABLE V.20
CATEGORY AND SCORE FOR TECHNOLOGICAL ALTERNATIVES IN THE IBU KECAMATAN
No. Village Category Score
1. 2. 3. 4. 5. 6. 7. 8. 9.
10. 11. 12. 13. 14. 15. 16. 17. 18. 19. 20. 21. 22. 23. 24. 25. 26. 27. 28. 29. 30.
Podal Tengwango Togowo Duno Tckowoko Goin Sangaji Nyeku Sangaji Adu Toguis Togoreba Sungi Borona Todake Sirimahu Pasalulu Togoreba Tobaol Tongutette Gam Lamo Gam Ici Tongute Sungi Akesibu Tongute Goin Maritango Kie Ici Naga Tosoa Togower Tababal Baru Aduu Ngawet Nanas Jere
c d d i c i i i i i i i c i c c b i b i i i i i i d c c c c
8 7 7 3 8 3 3 3 3 3 3 3 8 3 8 8
10 3
10 3 3 3 3 3 3 7 8 8 8 8

227
TABLE V.21
CATEGORY AND SCORE FOR POPULATION IN THE IBU KECAMATAN
No. Village Population Category Score
1. 2. 3. 4. 5. 6. 7. 8. 9.
10. 11. 12. 13. 14. 15. 16. 17. 18. 19. 20. 21. 22. 23. 24. 25. 26. 27. 28. 29, 30.
Podal Tengwango Togowo Duno Tokowoko Goin Sangaj i Nyeku Sangaji Adu Toguis Togoreba Sungi Borona Todake Sirimahu Paslulu Togoreba Tobaol Tongutette Gam Lamo Gam Ici Tongute Sungi Akesibu Tongute Goin Maritango Kie Ici Naga Tosoa Togower Tobabal Baru Aduu Ngawet Nanas Jere
413 184 244 424 139 244 157 111 117 243 170 167 190 523 339 287 749 304 647 503 261 463 267 456 171 241 198
1,158 202 497
a.3 a.2 a.2 a.3 a.l a.2 a.2 a.l a.l a.2 a.2 a.2 a.2 a.3 a. 3 a. 3 a.4 a.3 a.4 a.4 a. 3 a.3 a.3 a. 3 a.2 a.2 a.2 a.5 a. 2 a. 3
3 2 2 3 1 2 2 1 1 2 2 2 2 3 3 3 4 3 4 4 3 3 3 3 2 2 2 5 2 3
Total 10,070

of PI is the summation of W,SJ#. The values of W.S^ and PI for the
Ibu Kecamatan are summarized in Table V.22.
Discussion of Results. The higher the PI value the higher the
priority of the village to receive the safe water system first. Two
of the five parameters used, Waterborne Diseases and Village Contri
butions, did not have much affect on the priority index (PI) values
because most of the villages within the same Kecamatan had the
same scores for these two parameters. ; Since no specifics were given
for the waterborne diseases as to the number of cases or the year
in which the diseases had occurred, this parameter may have introduced
bias into the results, while the willingness of the villages to con
tribute to the costs was difficult to actually determine from the
verbal responses obtained through the survey. The remaining three
parameters were affected less by subjectivity in the responses to the
questionnaires. Village Potential, Public Places, Excreta Disposal,
Road Conditions and Power Supply are also parameters which would not
have been as much affected by subjectivity in the responses, had this
data been available. The PI figures for the Ibu Kecamatan ranged
from 172 to 422. In future surveys data collection should be conducted
by well-trained sanitarians and assistant sanitarians in order to
ensure reliability of the data.

229
TABLE V.22
PI VALUES FOR VILLAGES IN THE IBU KECAMATAN
No.
1. 2. 3. 4. 5. 6. 7. 8. 9.
10. 11. 12. 13. 14. 15. 16. 17. 18. 19. 20. 21. 22. 23. 24. 25. 26. 27. 28. 29. 30.
Village
Podal Tengwango Togowo Duno Tokowoko Goin Sangaj i Nyeku Sangaj i Adu Toguis Togoreba Sungi Borona Todake S irimahu Pasalulu Togo reba Tobaol Tongutette Gan Lamo Gam Ici Tongute Sungi Akes ibu Tongute Goin Maritango Kie Ici Naga Tosoa Togower Tababal Baru Aduu Ngawet Nanas Jere
0)
e U CO o cu ,r> co n « cu cu 4-1 CO m t-i
S o
0 0 0 0 0 0 0 0 0 0 0 0 0 0 0 0 0 0 0 0 0 0 0 0 0 0 0 0 0 0
>% 1 4J C U H Tl 111 3 ct) 4-i cj 4-1 c0
•H J3 3 U-t O u-i to -<-i C C O -H -H
14 86 86 86 14 14 14 14
115 14 14 29 86 14
115 14 14 14 14 58 14 14 14
144 86
115 14 14 58 58
W i -
i
00 U
o cu .H 4-1 O i-H
c < •C O ,-( CU CO H O
111 97 97 42
111 42 42 42 42 42 42 42
111 42
111 111 139 42
139 42 42 42 42 42 42 97
111 111 111 111
Si
CO
cu > •H 4-1 CO
c
j
C o •H 4-1 cd r-l 3 a o PL,
35 23 23 35 12 23 23 12 12 23 23 23 23 35 35 35 4 6 35 46 46 35 35 23 35 23 23 23 58 23 35
i c O 05
CO C
o cu -w 60 4J
(0 3 rH X> r-4. -H •H >-l > 4J
161 161 161 161 161 161 161 161 161 161 161 161 161 161 161 161 81 81 81 81 81 81 81 81 81 81 81 81 81 81
PI
321 367 367 324 298 2 40 240 229 330 240 240 255 381 252 422 321 280 172 280 227 172 172 160 302 232 316 229 264 273 285

230

CHAPTER VI
Implication of Past Developments in Water and
Wastewater Technology
The material in this chapter constitutes a historical study of DC
water and wastewater technologies and their impact upon the societies
that made use of them. First, discussion is presented of material
arranged in the following technology categories: water supply, pumps
and their power source, pipe for supply and drainage, water treatment
and standards, storage in cisterns, distribution and use, sewage removal
and treatment, and the administration and financing of water supply
systems. This chapter is a shortened version of the original publica
tion, and a great deal of selectivity was exercised in this portion.
Next, developmental summaries are given for Britain and the United
States where in each case the various technological categories are
integrated to form the picture of a society as a whole. This permits
greater insight into the impact of particular technological factors,
particularly in the area of public health.

232
Finally, technological levels and life-style levels are discerned
as a chronological concept. The results of this study can assist in
the blending of historically used methods with new ones, where this
is found to be compatible to LDC sites. A retrospective analysis of
technologies and management can be a further aid to planners in
assisting LDC sites to avoid the problems which occurred in DC's
during the process of development in the area of water supply and
sanitation.

233
VI.
HISTORIC B1PLICATION FOR DEVELOPING COUNTRIES OF DEVELOPED COUNTRIES' WATER AND WASTEWATER TECHNOLOGY
Kay Coffey and George W. Reid
This information was compiled for the purpose of providing an exam
ination of the history of the technology of water handling and usage
in areas now developed which could be of benefit in accelerating progress
in improvements in this field in developing areas. Additional information
from less developed regions was included in certain instances where it
was of interest. The general purpose was to find historical evidence of
alternatives for less developed regions.
The material which follows comprises a summary description of
historically used techniques as well as of the chronological development
of water usage and handling, first in Great Britain, particularly London,
and also in the United States, these being the two areas for which the
most complete information was made available to this effort. Finally,
life-style levels and technology levels in developed areas were described
as chronological concepts.
There are comparisons which can be made between present or projected
life-style levels in less developed areas, and the various stages of
past life-style levels of those countries which are now considered as
being the most highly developed as well as leaders in technological
innovations. When linked to technological levels, these comparisons
Norman: University of Oklahoma, Bureau of Water and Environmental Resources Research, December 1976. (187 pp.)

should provide historical evidence of viable alternatives for developing
areas and assist in planning for appropriate and reasonable technologies
of water-wastewater treatment and handling for those regions.
WATER SUPPLY
Wells were perhaps the principal source for urban areas at least
up to 500 A.D. Rock excavating was often accomplished by drilling and
wedging, or by firing and cooling. In ancient Palestine a phenomenon
called a cave-well was often found. This type of well sometimes devel
oped when the water table fell, and digging laterally along a fissure
was done in order to follow the water. A feature of the nineteenth
century was the development of the artesian well, which took its name
from Artois in France, where it is supposed to have originated in 1126.
Early in the nineteenth century, borings were lined with iron tubes,
and since then wells have been taken to increasing depths, reaching
thousands of feet in this century, where necessary.
Irrigation works played an important role in domestic supplies for
early urban areas in Mesopotamia, Egypt, India, and China, as well as in
the Middle East.
Often when cities have initially taken their water supply from loca
surface or ground supplies, and have later found these supplies to be
inadequate, it has subsequently become necessary to transport from more
distant supplies. Kanats originated probably as early as the fourth
millennium B.C. These are subterranean aqueducts used to transport
groundwater from an underground aquifer to the point of use at ground
surface. Structures of this type are still extant in Iran and Syria
where they have been used primarily for irrigation and urban or village
supplies since antiquity. In constructing kanats, a shaft was sunk,

235
perhaps 300 feet, to the water-bearing stratum. A few feet from the
bottom of the shaft, a tunnel was placed to connect horizontally with
other wells, and to carry the water collected from the wells to its
destination, which could be as much as fifty miles away. The wells
were placed at intervals of from thirty to eighty yards. The tunnel
was about four feet high and two feet wide, either unlined or lined
with large oval hoops of baked pottery two inches thick and one foot
wide. In later times pipe was used for this purpose. Openings were
provided at intervals along the route of the conduit to permit cleaning
out of accumulations of settled mud or sand.
Similar channels have been used in Iraq, Yemen, and in North
Africa where they were called "foggaras." Cyprus, too, had a kanat-
like water system. There soil was removed from the excavations by
means of a basket and rope operated by a primitive windlass formed of a
cradle of horizontal wooden bars. If valleys lay in the path of the
conduit, they were spanned by masonry aqueducts.
There are significant problems associated with the use of a
kanat. It is expensive both to construct and maintain. If the
tunnels are unlined, there is a heavy loss of water in the system,
and the tunnels must be cleaned periodically. Frequently a source dries
up or changes take place in the tunnels, necessitating a new kanat.
The Romans made great strides in systems of aqueducts and organized
water supply. Certain early instruments were used in the construction
of Roman aqueducts to maintain uniform gradients and alignment of
tunnel construction. In most cases, a steeper grade than necessary was
used to allow for error. A mortar was used which was made of lime, clay,
and sand. Elevated channels were troughs of brick or stone lined with

Fig. VI.1. Piscana on Roman aqueduct Virgo. Water enters from aqueduct at A, proceeds following the sequence of letters and returns to the aqueduct at I. Sedimental material passes through K to a cloaca.
SOURCE: Rapha Fabretti, De Aquis et Aquaeductibus Veteris Romae. Dissertationes Tres (Rome: I. B. Bufsotti, 1680), presented by M. N. Baker, The Quest for Pure Water: The History of Water Purification from the Earliest Records to the Twentieth Century (New York: American Water Works Association, 1949), p. 291.

237
cement and covered with a coping, usually arched. Most often water
ran directly through the trough, though sometimes it flowed through
pipes of lead or terra-cotta which were laid along the trough. Piscanae
or settling tanks were located along the route of the aqueduct to remove
sediment.
In ancient aqueduct construction, stone masonry was the principal
material. In the Middle Ages, lead, wood or earthenware pipes were
used. In modern times larger capacities required open channel stone or
brick masonry conduits, and high pressure required reinforced concrete
or steel.
In Europe during the Middle Ages the first supplies for towns were
usually wells and rivers which represented localized supplies. When pop
ulation increases brought the need for long-distance supplies, monasteries
were leaders in the effort to provide for this need.
In modern times Great Britain and the United States have played
leading roles in the development of public water supplies, with most
of the development in that area occurring beginning in the nineteenth
century.
PUMPS AND THEIR POWER SOURCE
The history of the raising of water began with irrigation. Early
methods of pumping were often powered by cranks, treadmills, and water
or wind power. In Egypt, as early as the eighteenth dynasty (fourteenth-
sixteenth centuries B.C.) and perhaps earlier, the counterpoise prin
ciple was used in the shaduf, still in use today. A link-chain pump
type was used in China from some three thousand years ago. The saqieh,
noria, or Persian wheel was thought to have been introduced into Egypt
before Roman domination. Its original form is a vertical wheel on the

Fig. VI.2. Paddle wheel for raising water, a type of noria.
SOURCE: Maurice Daumas, ed. , A History of Technology and Invention: Progress Through the Ages, vol. 1: The Origins of Technological Civilization, trans. Eileen B. Hennessy (New York: Crown Publishers, 1969, p. 106.
Fig. VI.3. Form of Fig. VI.4. Chain pump. Archimedes' screw.
SOURCE: Compton's Pictured Encyclopedia and Fact-Index, 1952 ed., s.v. "Water."

239
rim of which water pots are attached to cords. Another smaller vertical
wheel with cogs is fixed on the same axis and engaged with the cogs of
a large horizontal wheel turned by an animal walking in a circle, or
by water power. The endless chain or chain of pots, another form of
noria, was supplied power by a crank or treadmill while pots attached
were used to raise water.
Another method of water raising was and is the "taboot" or
screw. It is essentially the screw of Archimedes (287-212 B.C.).
A windlass, described by ancient Greek mechanicians, consists of supports
and a cylinder rotated by a crank. A rope of light chain winds around
the cylinder and raises a water vessel on the other end of the rope.
The invention of the force pump is attributed to a Greek, Ctesibius,
in the third century B.C. It is thought the pump was operated by hand
only. A description follows of a Roman pump of this type dating from
the first century A.D.
It was made of bronze; it had at the bottom a pair of cylinders set a short distance apart and a "Y"-shaped pipe connected with both, joining them to a vessel between them. In this vessel were flap valves fitting over the upper vents of the tubes to prevent water forced up to the vessel from returning. Over the vessel was an inverted funnel fastened to it by means of a wedge thrust through a staple to prevent it lifting under pressure of water. Valves were inserted in the cylinders beneath the lower vents of the pipes and over the openings which were in the bottoms of the cylinders. Pistons, which were oiled, worked in the cylinders and, as the valves stopped up the openings, forced the water by repeated pressure and expansion through the vents of the pipes into the central vessel, from which it passed up a pipe at the top of the funnel, so supplying water to a fountain head from the reservoir at a lower level.18(p. 73)
Figure VI. 5 illustrates a Roman pump used for domestic water supply
and of a type similar to the one described. It dates from the first
century A.D. This one was found at Silchester, a Romano-British town
in England. It is a double forcing pump which was operated by hand and

240
Fig. VI.5. Roman force pump, Silchester, England.
SOURCE: F. W. Robins, The Story of Water Supply (London: Oxford University Press, 1946), p. 78, copyright of Reading Museum.

241
would only work when submerged. The two barrels were lined with lead tubes,
and the body of the pump was cut out of a block of wood. Certain examples
found have had pistons of about one inch in diameter and a stroke of from
about three to five inches.
In Asia and China, toward the tenth century, windmills came into use
for irrigation or drainage. Arabs probably introduced windmills to the
West where they were initially used only for the grinding of grain.
After the Roman era, there is a lack of evidence of the use of pumps
till the fifteenth century in Europe. The first systems there were of
wood and were operated by hand. From about 1500 to 1850 the waterwheel
was widely used as a source of power. In the 1700's steam was introduced
as a source of power, and metal came to be used throughout pump construc
tion. The principle of the hydraulic ram was discovered in Britain by
Whitehunt in 1772, and by 1865 it had become popular for small water sup
plies. Cheap electrical power has been available in modern times.
PIPE, FOR SUPPLY AND DRAINAGE
According to the Copper Development Association, copper piping
covered with gypsum and dating from about 2750 B.C. was discovered at
Abusir, Egypt. It was made by hand-hammering a thin sheet of copper and
then folding it up.
In Crete terra-cotta pipes with cement joints were found in the
Palace of Minos at Knossos (about 2000 B.C.). These pipes thus ante
date similar earthenware pipes used during Roman and medieval time.
Two types were found in Crete. For one type the sections were tapered,
the smaller end of one section fitting into the large end of an
adjacent section. The smaller end was provided with a stop flange a
few inches from the end. The second type was like the first with one

242
addition. Here the sections were equipped with side loops so that the
separate sections could be fastened together.
In the Roman Empire four materials were usually used for pipes:
earthenware, lead, wood, and stone. Concrete was also used, and bronze
was used infrequently in pipes, for cases where pressures were high.
Wood was high in tensile strength, but deteriorated rapidly. Stone,
concrete, and terra-cotta were durable, but low in tensile strength.
Lead was durable but not resilient; thus it was difficult to make the
joints water-tight. Earthenware pipes were cylindrical and had joints
of the spigot and socket type. Joints were sealed with a mixture of
quicklime and oil.
As the Middle Ages began in Europe, stone channels seem to have
been more usual in long-distance supplies, while piping was more character
istic of the fourteenth and fifteenth centuries.
The mains of the. New River Company of London (1613-1904) were
first of wood. A description of them follows:
Usually they are of elm. They were made from the solid trunk, bored, and laid with the bark left on for external protection. The joints were of the spigot and socket type, the spigot being the smaller tapered end of the log or trunk, which was coated with white lead and driven into the larger end, the latter being reinforced by an iron band driven in. These end bands were of one inch or one and a quarter inch by one and a quarter inch iron, with the inner edges "feathered" to facilitate driving. Y's and T's were at first provided by utilizing the natural forks of the trees. Services were usually of lead. Connexions in case of fire were obtained by the rough and ready method of chopping a hole in the pipe which was afterwards stopped by a plug. As the positions of these plugs were (or should have been) marked to prevent unnecessary additional damage, they became "fireplugs" and gave rise to the term.19(p. 160)
Wooden pipes had to be replaced about every fourteen years. Often sev
eral lengths were laid together to increase the capacity. Oak and cedar
trunks have been used in addition to elm. At Paisley, Scotland, the

243
Fig. VI.6. Boring a wooden pipe by hand, Europe, early sixteenth century.
SOURCE: Maurice Daumas, ed., A History of Technology and Invention: Progress Through the Ages, vol. 2: The First Stages of Mechanization, trans. Eileen B. Hennessy (New York: Crown Publishers, 1969), p. 255, presenting Georgius Agricola, De Re Metallica (1556), trans. Herbert C. Hoover and Lou Henry Hoover (London: n.p., 1912; reprint ed., New York: n.p., 1950).
Fig. VI.7. Machine for boring wooden pipes, Europe, eighteenth century.
SOURCE: Daumas, vol. 2, p. 517.

first known filter for treatment of a city-wide supply, put into use
about 1804, used 200 feet of three inch bore wooden pipe of Scots fir.
Present day use of wood stave pipes has been reported in some parts of
the United States and Canada.
Blast furnaces were first used in Europe in the fourteenth century.
This enabled iron to be melted and then cast into molds. However, since
charcoal was the only fuel, this was difficult and expensive. In the
1700's in England, coke was used and the process became cheap enough
so that pipes could be manufactured and cast in molds with a steel
bar as a core. Thus a new pipe material, cast iron, made its appearance.
In 1825 steel tubes were turned out by the butt welding process.
Difficulty was experienced in protecting this material from corrosion.
In 1862 an inventor of Birmingham, England, Alexander Parkes,
discovered how to make a composition of cellulose nitrate which was
soft when hot, but hard and transparent at room temperature. He called
it Parkesine. in the United States, John Welsey Hyatt improved Parkes'
material and received a patent in 1870 on what he called celluloid.
In 1931 PVC (polyvinyl chloride) pipe was developed by German scientists;
in 1941 thermoplastic pipe was developed in the United States, and in
1948 PE (polyethylene pipes) .
Pitch-fiber pipe was introduced for drainage in 1906 when drains
were installed in Orangeburg, New York. These pipes are made of
pulped newspapers impregnated with bitumen.
Asbestos-cement pipe was developed in Europe prior to World
War I. This type of pipe resists soil corrosion.
WATER TREATMENT AND STANDARDS
In general, there has been a considerable lag between the development
of techniques for treating water and their actual use. In the development

245
of treatment, sedimentation, filtration through porous vessels, and
coagulation probably were among the earliest forms of treatment.
These methods plus filtration, wick siphons, and distillation were
basically the total of methods used till the 1890's. Among the more
recent developments have been pH control, softening, and the addition
of iodides and fluorides.
Great advances in the art of water treatment were made in the
eighteenth century, particularly in the last half. However, for each
new process of treatment, there were some who were opposed to its
introduction.
About 1800 the objective of filtration was removal of turbidity,
and filtration was viewed as a straining process. From about 1850
removal of organic matter became more important, and filtration was
viewed increasingly as a chemical and biological process. By the 1800's
filtration was viewed as a means to remove bacteria and combat cholera,
typhoid, and other diseases. Chlorination has been largely responsible
for the reliance on single-pass rapid filtration in the United States,
whereas in France where chlorination was not widely adopted, multiple
filtration prevailed.
As the debates continued over filtration, and as its use spread,
more was being discovered concerning the spread of certain diseases by
water which was contaminated. In 1874 the Royal Rivers Pollution
Commission in London made a report in which much space was devoted to
the "Propagation of Cholera by Water."2(p. 122) The conclusions were
based on data and facts gathered from the cholera epidemics of 1832,
1849, 1854, and 1866. Data were also presented showing that where slow
sand filtration had been installed, there was relatively light

incidence of cholera. Typhoid also had been traced to contaminated
water. In 1876 in the United States John T. Fanning wrote that water
could be a vehicle for the spread of diarrhea, dysentery and typhoid.
In 1880 the typhoid bacillus was isolated.
In spite of some opposition here and there to rapid filtration,
coagulation, and chlorination, all proved to be invaluable in combatting
death and disease which had previously visited large urban areas in
frequently recurring waves. One example took place in Hamburg and
Altona Germany where a cholera epidemic occurred in 1892. The Hamburg
epidemic was the result of contaminated water from the Elbe River.
In Altona, water from the same stream was used, and even though all
of the sewage from Hamburg was discharged a few miles above Altona,
the epidemic in Altona was much less serious. A second example occurred
in Louisville, Kentucky, where for the years 1906-1910 the typhoid
death rate was 52.7 per 100,000. Rapid filters went into operation
in the summer of 1909, but it was not until 1912 that all elements
of the system were operating together, that is, filtration, sedimentation,
and coagulation, and the typhoid death rate fell to 19.7 for 1911-15.
In 1914-15 prechlorination was begun, and the typhoid death rate fell
to 9.7 for 1916-20. In 1924 postchlorination was added, and the typhoid
death rate fell again to 4.9 for 1921-25 and on down to 0.9 for 1936-40.
Along with other typhoid prevention measures, the improvement in water
treatment contributed to the decline of typhoid in Louisville,
Kentucky.2(p. 241)
Early standards of water quality were based on clarity, taste,
odor and the health of users. Later tests measured the amount of
oxygen, chlorine, nitrites, certain types of bacteria, and radioactive
elements.
247
Early Treatment of Water by Filtration. In 1749 Joseph Amy in
France was granted the first water filter patent issued by any country.
These filters were to be constructed of lead, pewter, or earthenware,
with filtering materials of sponge and sand which would be washed in
place. The sand was to be packed between two perforated plates.
In 1791 in England, James Peacock set forth the reasons for placing coarse
material at the bottom of a filter with regularly decreasing sizes
above it, so that interstitial spaces would increase in geometric
ratio.
The first filtration plant for city-wide supply was installed
at Paisley, Scotland, in about 1804. The plant utilized a prefilter,
sedimentation and double filtration, with lateral flow throughout.
Water passed through a roughing filter to a pumpwell. A steam engine
lifted the water to the settling basin. The settling basin, main
filters, and clear-water basin were arranged concentrically.
Filter-Cisterns. From the founding of Venice in the fifth century
till the eighteenth century, the city depended on water stored in
cisterns. Many of these came to be surrounded by a sand filter. The
cisterns were usually ten to twelve feet deep while the surrounding
filter might be twice that deep. To construct a filter cistern,
a cone-shaped excavation was first made. Then a timber form was
placed against the wall of the pit and on this was placed well-puddled
clay. A flat stone formed the bottom of the cistern and the walls
were made of bricks laid with open joints. The space between the cistern
and the edge of the excavation with the puddle lining, was filled with
sand. At each corner of the filter was a place where water could
be fed to the filter, either collected rainwater from roofs and
interior courtyards or water transported from elsewhere.

248
Fig. VI.8. Cross section of Venetian filter-cistern.
SOURCE: Edouard Imbeaux, L'Alimentation en Eaux (n.p., 1902), presented by M. N. Baker, The Quest for Pure Water: The History of Water Purification from the Earliest Records to the Twentieth Century (New York: American Water Works Association, 1949), p. 15.
Fig. VI.9. First known filter to supply an entire city with water, Paisley, Scotland, 1804.
SOURCE: John Sinclair, The Code of Health and Longevity (Edinburgh: A. Constable & Co., 1807), presented by Baker, p. 78.

249
Filtration Basins and Galleries. A procedure has been noted among
various peoples, whereby water is obtained from hollows scooped out in
the sand along a river or waterhole, even when dry. The water thus
obtained, most of it coming from groundwater, has been filtered
by passage through the sands. This method may be regarded as a
prototype of the infiltration basin. This basin sometimes consists
only of a shallow open basin with an unpaved bottom. Filter galleries
are usually open-jointed conduits of brick, stone, concrete, or pipe,
laid in trenches which have been filled in again.
The successful operation of a natural filter, depends upon proper
studies to determine suitable locations. It is important to ascertain
the probable division of yield between the adjacent body of water and
the underflow, and particularly the liability of clogging of the material
between the body of water and the gallery or basin. Deposit of sediment
will be made on the river bottom, and the extent of scouring should
be considered. Studies should be made of the stratum of permeable
material, depth and slope of the water table, and characteristics of
the surface water and groundwater in the area. If conditions appear
favorable, it might be worthwhile to consider a natural filter.
Slow Sand Filter. Robert Thom of Scotland and James Simpson
of England were outstanding pioneers in the development of filtration.
Thorn's first municipal filter was installed at Greenock in 1827, and
Simpson's at London in 1829. Through experimentation, both men discovered
that the failure of filters due to clogging occurred at or just below
the surface, and each developed a method of cleaning. Simpson's
method consisted in scraping off the top layer, washing and restoring
it, and totally replacing it at suitable intervals. Thorn's method of

cleaning was the reverse-flow wash which had been called for in the
patent for Peacock's filter in 1791- Both men utilized the method of
arranging successively finer filter media from the bottom to the top
of the filter, as had also been called for in the British patent granted
to Peacock.
Simpson's filter had open-jointed branch drains of brick. Settling
reservoirs were operated with their low-water line level with the high-
water line of the filter. Output was usually about three million gallons
per day (U.S.) per acre. Simpson reported that, "the silt, . . . ren
ders the interstices between the particles of sand still more minute,
and the bed generally produces better water when it is pretty well covere
with silt than at any other time. . . . and in cleaning the silt off, it
has never been found necessary to scrape any more of the sand off with
the silt than the first half-inch depth and sometimes only half that
depth was removed."2(pp. 107-108) Materials used in the bed were river
sand, shells and pebbles, and gravel, with the surface arranged in
ridges. The small shells were used to improve the separation of the
sand 'from the gravel and thus, maintain the free percolation in the
lower layers which .would speed up the rate of filtration.
Thorn's filter was enclosed by rectangular masonry walls. The
filter media was supported on a false bottom of flat tiles with per
forations more than 0.1 inch ,in diameter. Bricks supported the
false bottom and formed the underdrains. Media used were gravel,
sand, and charcoal. The charcoal, ground to about 1/16 inch diameter,
was mixed with the upper layer of sand. Cleaning was by reverse-flow
wash aided by stirring with a rake. Output at a filter constructed
by Thorn at Paisley was given as an average rate of nearly six million

251
gallons per day per acre or double the rate of slow sand filters of
that and later dates.
The Simpson type of slow sand filter became the model for slow
sand filters throughout the world. Thorn's design was used to limited
extent, but the elements of reverse-flow wash with the false bottom were
principal features of the rapid filter developed in the United States
during the 1880's.
In January of 1829 Simpson reported that although the bed of
the filter was covered with five inches of ice, it was still working
properly. This is the earliest known report of the effect of ice on
filtration. In certain cases of slow sand filtration, climates have
been reported such that ice cover for long periods has both prevented
cleaning of the bed, and hindered the passage of air and light so as
to cut down on the efficiency of the filters. Slow sand filters may
be found which have been covered to remedy such situations. In 1876
Colonel John T. Fanning, dean of U.S. hydraulic engineers in the last
third of the nineteenth century, wrote a treatise on water works in
which he emphasized the need for roofing filters to protect their
operation against the effects of both low and high temperatures.
At the Lawrence Experiment Station in Massachusetts, established
in 1887, much research was devoted to experiments on the nitrification
of organic matter by intermittent sand filtration. Time was to prove
that intermittent filtration was not a suitable practice for water
treatment. It had been taken over from sewage treatment where a large
amount of organic matter often had to be oxidized.

Rapid Filtration. The Frenchman Henry Darcy patented a filter in
1856 which encompassed all the elements of the future American rapid
filter, save one, coagulation. Most aspects of Darcy's system had been
developed previously, but the particular combination he devised was
new. It was proposed to use increased pressure or negative pressure
and only about one foot of sand and one-third to two-thirds foot of
gravel. Reverse-flow wash was to be used at intervals, as well as
scraping. In addition, there were proposed the new methods of keeping
the filter clean by means of sweeping the surface with a mechanically
driven revolving broom, and discharging to waste suspended matter within
twenty inches of the surface of the sand, without stopping filtration.
(Raw water was introduced horizontally to the filtration tank one meter
above the filter bed.) In the 1880's and early 1890's the rapid filter
was developed in the United States and put on a sound engineering basis.
Principal methods of cleaning used were jets of water directed on or
just below the surface, reverse-flow wash, and agitators which loosened
the media from top to bottom. No coagulant was used in various of the
antecedents of the American rapid filter, or in instances of the later
rapid filters. However, in general, precoagulation and sedimentation
came to be regarded as an important element of most rapid filtration
units.
Drifting-Sand Rapid Filters. The basic principle of this type of
rapid filter is the ejection of sand from the bottom of the filter and it
replacement at the top of the filter to aid in the washing process.
Multiple Filtration. In 1685 Luc Antonio Porzio, an Italian
physician, proposed multiple filtration through sand, preceded by
straining and sedimentation. After 1685 multiple filtration was proposed

253
from time to time and was used in Scotland, England, and other places.
At the close of the nineteenth century the city of Paris adopted multiple
filtration consisting of two or more roughing filters of gravel, a
prefilter, and a final filter of the slow sand type. This system
subsequently became widely used in France, more than in other parts of
the world.
The Paris filters of 1899 were installed by Armand Puech, who
had taken out a British patent on multiple filters in 1898. From
filter to filter in the series, the filtering material decreased
successively in size as did the unit rate of filtration. In these early
days of the Puech filters, there was generally no presedimentation,
coagulation, or disinfection. Later in the development of this system,
the roughing filters and prefilters were converted into what were actually
rapid filters. After installation of the Paris filters, Puech was
joined by H. Chabal and by 1935 the Puech-Chabal system of filtration
was more widely used in France than any other means of water purification.
Non-Submerged Filter. This type of filter was developed in France
beginning in the early 1890's. Water was to be showered upon the filter
at such a rate that it would not stand on or in the sand, and really
involved the same operation as that found in the sewage trickling filter
which was being perfected in the 1890's in England.
Sedimentation and Coagulation. In 1904 Allen Hazen wrote an
important paper on sedimentation. Parts of the introduction and summary
follow:
It has been found in St. Louis that continuous operation, that is to say, a continuous flow of water into, through and out of the basin, gives quite as good results as the intermittent operation. . . . The use of baffles has also been learned, and it has been shown clearly that a well-baffled basin will do as much work as a much larger basin without baffles. . . .

The fundamental propositions [of sedimentation] may be very concisely expressed. They are: first, that the results obtained are dependent upon the area of bottom surface exposed to receive sedimentation, and that they are entirely independent of the depth of the basin; and second, that the best results are obtained when the basins are arranged so that the incoming water containing the maximum quantity of sediment is kept from mixing with water which is partially clarified. In other words . . . practically accomplished by dividing the basing into consecutive apartments by baffling or otherwise. ?-(p. 298)
Coagulation as an aid to sedimentation has been practiced since
ancient times. The list of materials used for this purpose is extensive,
but the most common are aluminum sulfate or alum and lime. An alum
dosing apparatus was patented in 1890 by Professor Henry Carmichael
of Massachusetts. It was a pump with curved tubes attached to a hollow
hub. The pump was driven by a propellor in the raw water main.
Greater velocity and therefore volume of the raw water increased the
speed of the pump. Sometimes around-the-end baffled mixing chambers
have been used for mixing the chemicals introduced for coagulation.
Originally plain sedimentation had for its objective the removal
of turbidity. Later, especially when used with rapid filtration,
coagulation and sedimentation have had as objectives, in addition to the
removal of turbidity, the removal of color and bacteria.
Disinfection. The earliest British patents involving some type of
chlorination date from about 1840. Chlorination with bleaching powder
was used in 1896 to stop a typhoid epidemic at Pola on the Adriatic
Sea (one-time chief naval station of Austria-Hungary). Sodium sulfite
was used to neutralize the excess chlorine. At a Louisville, Kentucky,
testing station in 1896 William M. Jewell applied chlorine gas to the
effluent from a Jewell rapid filter. It was operated about ten days,
and chlorine was applied at the rate of 0.25 ppm. This was probably

Ca**ecr/oM& TO
4 \
/fc»oy
GftAtHUf XQO
Fig. VI.10. Jewell chlorine gas generator, Louisville, 1896.
SOURCE: Reproduction of sketch made by William M. Jewell, presented by M. N. Baker, The Quest for Pure Water: The History of Water Purification from the Earliest Records to the Twentieth Century (New York: American Water Works Association, 1949), p. 333.

the first use of chlorine gas on the effluent from a working-scale
water filter, to reduce the bacterial count. The first permanent
water chlorination plant was installed at Middelkerke, Belgium, in
1902. Before passing through gravity filters, chloride of lime and
perchloride of iron (0.2 and 8 ppm) were introduced through drip cocks.
In 1909 liquid chlorine was first produced commercially in the United
States. In 1912 Dr. George Ornstein developed the process in which
chlorine gas is first dissolved in a stream of water before introduction
into water to be treated. Chlorination has also been used in combatting
algae growths, and improvements in methods of use have aided in combatting
associated odor and taste problems.
Ozonation for water treatment began about the same time as chlori
nation did. It has been used more extensively in France than in perhaps
any other country. As a process ozonation has been more expensive and
complicated than chlorination to install and operate; however, one
advantage of ozonation is that it does not aggravate taste and odor
problems as chlorination sometimes does. In the development of ozona
tion in the United States a small pilot plant was operated at Whiting,
Indiana, in 1938-39, and a 3.5 mgd ozonation plant was installed there
in 1940. The pre-ozonating plant included: an electrostatic air filter,
air dryer, air compressors, ozonators (for production of the ozone),
meters, and two ozonizers (for introduction of the ozone-filled air
through porous tubes into the supply to be treated).
The earliest reported statements of the bactericidal action of
ultraviolet rays was made in 1877 by two English scientists, Downs and
Blunt. In general, this mode of treatment has proved too expensive for

257
municipal installations and has found limited adoption for some ships,
industrial concerns, and swimming pools.
In general, use of heat for large supplies has proved too costly
a method of treatment, though after discovery of the principles and
properties of heat transference, apparatuses were applied in a few
special cases beginning about 1888 by Charles Herscher. After studies
in 1904 by George Thomas Moore and Karl F. Kellerman in the United
States, copper sulfate was accepted as an effective germicide and algae-
cide. It has also been determined that small quantities of silver in
water would destroy some macro- and micro-organisms.
Algae Control. In 1676 the Dutch naturalist Antony van Leeuwenhoek
observed living creatures in rainwater which he called animalcula.
In 1693 Dr. Edward King observed that a small amount of sulfuric acid
introduced into water containing "some hundreds of these animalcula . .
very nimbly frisking about causes them to spread themselves, and tumble
down seemingly dead."2(p. 391) In 1757 Dr. John Rutty of England
reported five drops of hydrochloric acid would destroy the animalcules.
James Peacock who in 1791 was granted the first British patent on
a process and apparatus for water filtration designed a process in which
the raw water vessel discharged into a bag or strainer which collected
"innumerable green filaments" which "coalesce and form a tough mucus"
causing "disagreeable effects."2(p. 73) Peacock stated that this
phenomenon did not occur unless the water was exposed to the sun.
In 1821 Toulouse, France, constructed a filtration basin in which
problems were experienced with "aquatic plants." These "plants, these
animals, died and putrefied in a water lukewarm, making it very
bad."2(pp. 275-277) It was not possible to cover the basin because of

258
its size; thus it was converted into a filtration gallery after which
there were no further problems. Toulouse was the first large-scale
example of difficulty in a public water supply from tastes and odors
and of the solution by excluding light and air.
Another filter basin put into use in Nottingham, England in 1831,
likewise experienced growths of algae. The problem was handled there
by pumping out the water and sweeping the bottom with a broom at three-
week intervals in the summer and six-week intervals in the winter.
To avoid the occurrence of "vegetation" Edwin Chadwick suggested
that where water was gathered from areas underlaid with granite or
like material, the overlying vegetable matter should be stripped. This
anticipated stripping of the sites of large storage reservoirs practiced
in the United States a few decades later.
In 1896 Charles P. Allen, Chief Engineer of the Denver Union Water
Company experimented with different linings of reservoirs, concrete,
asphalt, and earth. The various linings made little difference in algae
growths.
George T. Moore and Karl F. Kellerman reported in 1904-05 on
studies which had begun in 1901, that copper sulfate was an efficient
algicide. Within a few years algae control was effected by application
of copper sulfate from boats by spraying or by filling bags and immersing
them in the water. In 1935 the Los Angeles Bureau of Water Supply
introduced the broadcasting of copper sulfate crystals. By using
crystals of various sizes, the chemical would reach the surface as well
as lower layers.
In 1924 at Huntington, West Virginia, artificially created turbidity
was introduced as a treatment for algae. The turbidity provided a
nucleus for flocculation and sedimentation of the organisms.

259
Prechlorination of water before slow sand filtration was introduced
by Ilion, New York, in 1929, to prevent algae growth on the filters.
Chlorination rates of 20 to 30 pounds per million gallons were used.
Taste and Odor Control. The first attempts at taste and odor
control date from prehistory and involved boiling the water. Hippocrates
suggested boiling to prevent odors, in the fifth century B.C.
Aeration has been used for taste and odor removal or prevention
for millennia, with the first-known apparatus for artificial aeration
appearing in 1755 as described by Hales. Various types of cascade,
jet, and other open-air aerators were developed. Pan aerators with or
without coke fillings were used at Winchester, Kentucky in 1901 or 1902.
Use of charcoal for taste improvement is also lost in prehistory.
In 1790 Johann Tobias Lowitz, a Dutch chemist, announced that powdered
charcoal aided in preventing or removing bad tastes and odors. In
1807 Cavallo, an Italian, proposed adding powdered charcoal to water,
agitating, and then filtering. Since the 1920's activated carbon has
been used.
Algae and other organisms can produce tastes and odors. Methods
for control of algae are discussed in a separate section.
Chlorination for disinfection sometimes produced an odor problem,
particularly when chlorine was added to water supplies containing
phenols as chlorophenols were produced which are highly odorous
compounds. Joseph Race at Ottawa in 1917 applied ammonia with chlorine
to reduce end tastes, and it was later determined that this combination
also prevented end tastes or odors occurring as a result of the presence
of phenolic compounds.

In 1926 Toronto began what was called superchlorinatxon. It was
found that if enough chlorine was added so that practically all of the
residual chlorine was "free" (chlorine, hypochlorous acid, and hypochlorite
ion) instead of "combined" (chloramines) end odors would be destroyed.
In 1928 R.D. Scott reported the phenomenon which is the principle
behind this type of chlorination, and which gave the method the name,
"break-point" chlorination. It was found that as more chlorine was
added, the residual chlorine at first increased, then decreased, and
then once again began to increase. The idea with superchlorination
was to add sufficient chlorine to pass beyond the breakpoint in the
curve, to the side where the residual once again began to increase.
In 1930 and 1932 ozonation was applied to taste and odor control
at Hobart and Long Beach, Indiana, and at Whiting, Indiana, in 1940.
Aeration. The value of aeration as a method of water treatment
has been known, and aeration has been practiced since very ancient
times. James Lind, a British naval surgeon and hygienist, pro
posed in the mid 1700's the removal of hydrosulphuric acid and vola
tile organics by passing water through a perforated plate so that
it would fall through the air in finely divided streams. The ear
liest known cascade aerator working in series was installed in 1848
near Glasgow, Scotland. The water treatment system consisted of
five units, the settling reservoir, three filters, and the clear-
water reservoir, all arranged in stair-step fashion. Between each unit
there was a cascade down to the next unit. The first known aerator on
an American water supply was installed at Elmira, New York in 1860-61.
It was of the fountain jet type.

261
Professor Albert R. Leeds in 1884 was granted U.S. patents on
saturating water with oxygen or ozone by introducing air under pressure
into water under pressure and in motion. The object in using pressure
was to force the oxygen into solution in order to restore oxygen stored
in reservoirs or when covered by ice, as in a stream. The method shown
in the patent was the introduction of the air into the lower end of
a pump line delivering water into a reservoir through a submerged
opening. John W. Hyatt was granted a U.S. patent in 1885 on a device
for sucking air into and mixing it with water in its downward passage
through a group of tubes. Other methods of aeration have included the
use of weirs, pans with or without coke, and multiple spray nozzles
discharging not far above the surface of a reservoir.
As developed in the twentieth century, aeration continued to have
as its objective the removal of odors plus the additional objective
of aiding in iron and manganese removal. A previous objective, the
removal of organic matter, was given up in the case of drinking water
treatment.
Distillation. Ancient writers recorded that the vapors which rose
from bodies of water were purer than the original bodies of water them
selves. Rainwater, regarded as condensed vapors, was thus a preferred
supply. Aristotle (384-322 B.C.) wrote that when sea water was evaporated,
the vapors obtained were purer than their source. Jabir Ibn Hayyan,
an Arabian alchemist of the eighth century A.D. wrote the first treatise
on distillation. He described various apparatus, and defined distillation
as "an elevation of aqueous 'Vapours' in their 'Vessel'," some by
means of fire and some without use of fire. In the late sixteenth
century the British patent office first began to issue patents for
distillation, mainly for salt water aboard ships.

262
In 1767 Dr. William Heberden of England wrote Chat to improve
the taste of distilled water, it could be allowed to stand, or boiled
in an open container, or air could be forced into it, in order to
replenish the oxygen which had been lost in the process of distillation.
During the last half of the nineteenth century the use of distillation
continued to be limited mainly to ships and naval bases.
Softening. Calcium, Ca, and magnesium, Mg, cause by far the greatest
portion of the hardness occurring in natural waters. These cations
can be associated with carbonate, CO3-, and bicarbonate, HCO3 » anions
or with other anions. On a small scale, if not by name, softening has
been practiced through the centuries ever since soap came into use. In
1756 Francis Home, a Scotch physician, published a book on his studies
on water softening. They appear to have been the first scientific
experiments on water softening, and he seems to have been the first
to suggest that water softening be applied to municipal supplies. The
softening agents he proposed were alkaline salts, and his measure of
t*Vjo V i o v ^ n p c c r\f p x.7r> t" ea-v qairtn 1 o T.jac ^ f c CHQT> p i i r H T l ' n o n m ' n f , *- » * %-' 1 11^ J-. u ill. ' 1—/ ^» *. < * »» * ._ %-* vJ u u i p _k^~ *• t± > .A. us H3 w ^» •' v~ u ^ -»i -»_ - 1» *A I' * ••- * » I- *
One of the pioneers in the field of water softening was John Rutty
of England. In 1757 he wrote that one method of softening was to
introduce an alkaline compound such as "the ashes of green ash or
beech burnt to a whiteness."2(p. 418)
In 1830 in Britain Abraham Booth wrote a treatise on softening and
related topics in which he stated that "simple boiling will soften
waters whose hardness consists of the carbonates of lime [Ca] and
magnesia [Mg] . . . for as the carbonic acid is expelled . . . the
earth subsides, . , . [but this] will not remove sulphate of lime [Ca],
and, as this is almost constantly present in water, boiling is but a

263
partial mode of purification. . . ."2(p. 419) (In the past, carbonate
hardness has been called temporary hardness, while non-carbonate hard
ness was formerly called permanent hardness because it cannot be removed
by boiling.)
In 1841, Thomas Clark, Professor of Chemistry in Aberdeen University,
Scotland, announced what was called the Clark lime process and was
granted a British patent. He claimed that his excess lime method
would also work to purify the water. His patent covered the use of
lime, CaO or Ca(OH)2, to precipitate CaCC^, followed by sedimentation
or by sedimentation and filtration.
The first plant for softening of a municipal supply was completed
at Plumstead, England, at the end of 1854. The ratio of slaked lime
to untreated water was one to eight or one to nine. The lime sludge
was sold to bristle manufacturers.
John Henderson Porter, a London civil engineer, took out a British
patent in 1876 which proposed to use the precipitate resulting from
the Clark process as the medium of filtration by retaining it on
filter cloths.
After completion of the Clark process, the treated water still
contains some magnesium hardness, and non-carbonate calcium hardness.
A. Ashby was granted a British patent in 1878 which claimed removal
of these types of hardness from water which had already been subjected
to Clark's Process. The method in the patent proposed to add sodium
carbonate to precipitate the remaining hardness. In 1891 William
Lawrence took out a British patent which included the antecedent of
upward-flow reaction and sedimentation, a notable development when applied
to water softening practice.

In 1897 at the water works of Swadlincote and Ashby softened
water was recarbonated by means of coke to remedy the problems associated
with excess causticity. Later, practically all softening plants
were equipped with recarbonation devices.
In 1903 Robert Gans was granted a German patent for what was
to be called the zeolite process of water softening. This development
included the use of "a form of artificial zeolites" created by fusing
"clays and soda ash [Na2C03] , and hydrating them."2(p. 436) Use of
these zeolites removes the cations causing hardness and replaces them
with sodium cations.
Iron and Manganese Removal. In 1868 B. Salbach in Germany stated
that groundwater could be freed from iron and manganese by aeration
followed by filtration through gravel and sand. Through aeration the
iron and manganese compounds were oxidized to form insoluble compounds
which could then be removed by filtration.
Charlottenburg, Germany, was the first city to build an iron-
removal plant, in 1874. In 1942 a plant in Etobicoke in Canada was
using zeolite for both softening and iron removal. Ion exchange
has been used for manganese removal as well as for iron.
Desalinization. Various forms of distillation have been used, as
well as electrodialysis, freezing, reverse osmosis and ion exchange.
STORAGE IN CISTERNS
Water stored in cisterns benefits from the sedimentation process.
In Palestine and Syria there were numerous cisterns which received
activity from early times in the conservation of water supplies.
Most of the cisterns in Jerusalem were of four types:

265
(a) small cisterns each consisting of a long shaft cut through the rock, with a bottle-shaped excavation to collect the water at the bottom—a type, up to twenty feet or so in depth, attached to houses or groups of houses in Palestine even in Canaanite times, (b) large excavations beneath the surface, roofed with the natural rock, some measuring up to forty feet from floor to ceiling, (c) cisterns of Herodian or later date where the rock has been cut down perpendicularly and an arch, or roof of masonry, built over the excavation, and (d) cisterns of more modern construction dug out of the rubbish and lined with masonry, which are supplied by rain collected on the roofs and terraces of the houses.19(p. 49)
The best known of "Phoenician" waterworks were those of the city
of Carthage, where two groups of cisterns were constructed to catch and
hold rain water. The construction was of rubble lined with cement.
The first group was 139 meters long and 37 meters wide, barrel vaulted
and divided into eighteen compartments, in parallel rows opening on to
a common "corridor." The compartments are each nearly 100 feet long
by 20 feet wide, and 27^ feet high. The other group was larger.
From the fifth century to the eighteenth century Venice depended
on water stored in hundreds of cisterns. Large storage reservoirs such
as those found at Carthage were not possible due to the situation of
the city on islands.
At Byzantium in the sixth century, Justinian had two great under
ground cisterns built. One, the "Hall of a Thousand and One Columns"
was built in 528 A.D. The structure is in two stories, and the domed
roof is supported by sixteen rows of fourteen columns each. The other,
Yeri Batan Serai, was still being used to hold the water supply of
Constantinople in the middle of the twentieth century. Like the other,
it is filled with decorated columns and has the appearance of a cathedral
filled with water, rather than a cistern.

266
DISTRIBUTION AND USE
In many urban areas, distribution of water has been carried out
by means of porters or carts prior to the introduction of piping.
Before Roman times, where public water supply systems were to be found,
water was generally distributed to only a few public fountains. Even
in the Roman Empire, distribution to private homes was quite limited.
In Europe during the Middle Ages water was usually obtained from public
fountains or carriers, and not until the 1600's did piped private
supplies begin to be introduced. Some cities have utilized dual
supply systems, one system providing potable water, and the other system
providing water for street washing, fire-fighting, and similar purposes.
Where piped supplies of drinking water were intermittent, there
were associated problems. In 1849 the first Medical Officer of Health
of the City of London reported:
I consider the system of intermittent water supply to be radically bad; not only because it is a system of stint in what ought to be lavishly bestowed, but also because of the necessity which it creates that large and extensive receptacles should be provided, and because of the liability to contamination incurred by water which has to be retained often during a considerable period. In inspecting the courts and alleys of the City, one constantly sees butts for the reception of water, either public, or in the open yards of the house, or sometimes in their cellars; and these butts, dirty, mouldering and coverless, receiving soot and all other impurities from the air; absorbing stench from the adjacent cesspool; inviting filth from insects, vermin, sparrows cats and children; their contents often augmented through a rain pipe by the washings of thereof, and every hour becoming fustier and more offensive. Nothing can be less like water should be than the fluid obtained under such circumstances.*5(p. 52)
People in villages and cities of ancient times probably did not
use over three to five gallons per day per person. However, Clemens
Herschel estimated that the average quantity of water delivered to
Rome by the aqueducts was in A.D. 97, about thirty-eight million gallons

267
per day or thirty-eight gallons per capita day.13(pp. 240-241) Bath
and shower facilities are dependent on constant pressure water supplies
and sewerage facilities. Public baths and latrines have been useful
in areas such as ancient Rome where many people lived in tenement
like dwellings and charges for the facilities were kept within the
reach of all. In the late 1800's water demands began to increase
where there was increased use of bathtubs, water closets, and public
bathhouses. In the 1900's further increases in demand occurred where
use was made of washing machines, dishwashers, garbage disposals, air
conditioners, and lawn sprinklers.
Where metering has been used, it has encouraged conservation of
water. In 1835 a metering device was being used which consisted of
a hollow drum or wheel divided into sections. As the wheel rotated
each compartment would fill with water and then be subsequently emptied.
The number of revolutions was recorded through a system of gears.
This is much like the modern water meters, except that the wheel
rotated in a vertical rather than horizontal plane.
One type of use of domestic water supplies which involves sig
nificant quantities of water, is represented by latrines or closets,
which have been provided in certain communities since ancient times.
Around 2500 B.C. in the Indus Valley (now Pakistan) at Mohenjo-daro,
one of the largest towns of that time, every house had a latrine.
In Egypt around 1350 B.C. there were latrines which employed earthen
ware jars as receptacles. Many larger Greek towns of the first cen
tury B.C. had public and private lavatories with water flushing faci
lities. This was usually a channel with a continuous flow of water.
In Rome in the fourth century A.D. water flushing of latrines be
came prevalent and much use was made of wastewater from the public
baths. In 315 A.D. Rome is reported to have had 144 public

268
latrines, or about one for every 5,000 persons. A continuous flow of
water in channels was used.
In London during the middle ages, public latrines were built which
were flushed by water courses. Toward the end of the thirteenth century
private latrines became common, constructed along water courses. When
the number increased, the disposal was diverted from open water courses
to privy vaults and cesspools. By 1500 in England, most townhouses
had only a privy in the yard consisting of an open pit under a wooden
seat in a little shack. A type of water closet was first described
in 1596, in a poem published by an Englishman, Sir John Harrington,
though this device had nowhere come into general use until the eighteenth
century, and in the early years of that use, certain of the municipali
ties involved did not permit the use of municipal supplies of water for
the operation of water closets. By 1700 the wealthier class in Britain
made use of a "close-stool" which was kept in the bedroom. This was
a box fitted with a padded seat and enclosing a pot which was emptied
by the servants.
The first types of water closets included the long hopper, and
the pan closet. The latter originated in London in 1852. The plunger
closet received a U.S. patent in 1857. This was the first patent in
the United States for a water closet. In 1775 a watchmaker, Alexander
Cumming, took out a British patent for a valve closet, consisting of
a cast-iron bowl with a valve at the base which could be opened by
a plunger to release the contents through an inverted siphon. The
water for flushing came from a cistern overhead, while the effluent
was discharged into a cesspool under the basement or in the yard of the
house. In 1778 Joseph Bramah took out another patent for a valve closet

269
Fig. VI.11. Pan closet,
Fig. VI.12. Valve closet.
Fig. VI.13. Plunger closet.
SOURCE: Thomas S. Ainge, The Sanitary Sewerage of Buildings (Chicago: Domestic Engineering, 1907), pp. 102, 104, 105.

270
Fig. VI.14. Cumming's valve closet, 1775.
Fig. VI.15. Braraah's valve closet, 1778.
SOURCE: F. L. Small, The Influent and the Effluent: The History of Urban Water Supply and Sanitation (Manitoba, Canada: Underwood McLellan and Associates, Modern Press, 1974), pp. 198, 199.

271
with a different design. By 1815 this was the accepted type. As
late as 1937 the valve closet was recommended by some for situations
in which no flushing cistern was required. Other earlier types of
water closets included the short hopper and the washout closet. In
1782 in London, a trap was devised using a water-seal. In 1852 Josiah G.
Jennings made the first wash-down closet. The siphon closet was devel
oped and perfected in the United States.
SEWAGE REMOVAL AND TREATMENT
Throughout history the urban environment has been in general
quite unsanitary, and progress in correcting the situation has been
very slow. Problems increased with growing populations. In Europe
by the seventeenth century improvements were needed, and by the second
half of the eighteenth century some urbanized areas became decidedly
unhealthful places. In the United States by the middle of the nine
teenth century the major cities were overcrowded and unsanitary,
and there were frequent epidemics of yellow fever, cholera, and
typhoid in the middle years of that century. In some of the developing
countries, the mortality rates from enteric diseases are in the same
range as that which was true in North America in the last period of
the nineteenth century.
The proper removal and treatment of sewage or excreta has pro
vided a principal part of the remedy for this situation in those
parts of the world where it has been adopted. Information on the
following items is included below: methods of removal or treatment
utilizing no water or small amounts of water, removal by water
carriage, and treatment of sewage from systems using water carriage.
In general, it may be said that sewage systems using water work

272
!«^\\\\\\\\\\\\\\\A\\\\\W
Fig. VI.16. Wash out closet. Fig. VI.17. Wash down closet.
mttuuinittitammmiuuMiauuuiButiinuiiiiuMJkMJL.
Fig. VI.18. Siphon closet.
SOURCE: Jean Broadhurst, Home and Community Hygiene: A Textbook of Personal and Public Health, 4th ed. rev. and enl., Lippincott's Home Manuals, ed. Benjamin R. Andrews (Philadelphia: J. B. Lippincott Co., 1929, pp. 240, 241.
Fig. VI.19. Siphon jet closet.
SOURCE: Charles Merrick Gay and Charles De van Fawcett, Mechanical and Electrical Equipment for Buildings (New York: John Wiley & Sons, 1935), p. 84.

273
well in urban areas with high density populations where there is
an abundant and constant supply of cheap water, and where there is
sufficient wealth available to pay the costs of installation and
upkeep. Virtually all the conventional types of sewage treatment,
chemical and biological, used in developed areas today were intro
duced within the last one hundred years.
Solid Waste Collection by Private Contractors. In the 1800's
and earlier throughout the Middle Ages in England and the rest of
Europe, solid waste was heaped up in piles in the streets, paved
or unpaved, and around the homes of city dwellers. Some was sold
for agricultural purposes. In the wealthier parts of towns pri
vate contractors collected the refuse periodically. In the early
fourteenth century London was the first European city to set up
an organized scavenging system.
Composting. Composting is an ancient method, but at least one
modern-day application may be mentioned. In 1957 on the island of
Jersey in the English Channel a composting plant was built con
sisting of a tower of six floors. In this type of plant aeration
occurs as the refuse and sludge fall slowly down through the floors,
and aerobes assist in decomposing the mixture. The finished product
is used as fertilizer.
Cesspools. At the close of the Middle Ages in Britain much of
the human wastes were being directed to privy vaults or cesspools,
and thence percolated into the porous layer contaminating well water.
By 1775 in Britain the effluent from water closets was being discharged
into cesspools under the basements or in the yards of the houses.
Septic Tanks. Septic tanks were first introduced in France about
1869, and in the United States in 1884. In England in 1896 Donald

Cameron, city surveyor of Exeter, announced that sewage could be held
in an airtight tank for a day or so and that this reduced the organic
content. He called this a septic tank.
The process in the septic tank utilized the action of anaerobic
bacteria. Disposal of effluent from this unit is now usually accom
plished by cesspool or soil percolation through open-jointed clay
pipes.
Drains and Sewers. There are really two types of processes
involved, one the transportation of stormwater, and second the transpor
tation of sanitary flow. In Mesopotamia in the fourth millennium
B.C. open ditch and rough stone-lined channels drained stormwater.
At Chandu-daro, Sind (third millennium B.C.) as well as at Mohenjo-
daro and Harappa there were found excellent sanitary systems to which
an adequate water supply would have been essential. The cities of
Babylon and Jerusalem had sewers cut in rock or built of masonry dating
back to the eleventh century B.C. Cylindrical sewer pipes were in
use in the seventh century B.C. at Babylon and Ninevah. The Greek
city of Olynthus, planned in the Macedonian Period (380-130 B.C.),
was provided with a central paved alley five feet wide in each city
block to provide drainage. A channel in the floor was for dry weather
flow. Covered brick masonry drains were in each street. Each house
was connected to the drains wiLh a small sump chamber of brick
masonry to collect sedimental material. Lime-mud mortar was used.
Sewers were common in the time of Rome. The famous sewer of ancient
Rome called the Cloaca Maxima was built about 588 B.C. Only wealthy
people had private sewer connections. No drainage systems rivaled
those of Rome until the nineteenth century.

275
Tn most urban areas of Europe during the Middle Ages the drainage
systems were often clogged because of refuse and lack of water to
provide flushing. By 1800 in cities of Europe and the United States,
it was becoming common to discharge domestic wastes to storm sewers.
This was the "combined" sewer system.
By 1841 in London there was no over-all planning in the construc
tion of sewers, and most were square brick tunnels with flat bottoms
and no fall. One medical officer wrote: "The sewer in Friar Street
has a most curious quality, that of flowing either way equally
well."18(p. 11) Such sewers were really elongated cesspools.
Little water was used; thus the sewers were made quite large so that
cleaners could enter them. Subsequent to the period described here
John Roe designed the egg-shaped sewer.
In the middle of the nineteenth century came the concept of a
separate sewerage system to carry only water-borne human wastes.
This was a major advance in urban sanitation. In Hamburg, Germany,
was introduced the first complete sewer system which was flushed
thoroughly with water every week. The first large modern sewers
were at Hamburg (1844-48) and London (1854-65). In London the pumps
used were steam-driven double-acting beam engines, driving ram or
plunger pumps. The last of these sewage pumps was not replaced
until 1952.
In the United States, street drainage was usually by means of
a ditch along the center of the street. New York had only two public
sewers before 1720. In 1860 there were only ten sewered cities in
the United States.

276
Garchey System—Modified Water Carriage System. A French
Engineer, Louis Antoine Garchey designed a system in which a three-
gallon cast iron container was fitted beneath a sink,
with an eight-inch outlet covered by a removable disc. Refuse dropped down the hole in the sink and mixed with waste water. The container was similar to a valve closet and by pulling a plug the contents could be flushed into a six-inch vertical pipe resembling a soil-pipe.
An eight-inch earthenware drain led to collecting chambers. Finally the refuse was partially dried by rotating it in extractors like large spin-driers. The water passed to the sewer and the solid refuse was incinerated.*°(p. 61)
The system was first installed in a housing development near
Paris. The first British Garchey system was installed in 1935.
Effluent. Standards. In 1912 in Britain the Royal Commission
on Sewage Disposal proposed standards for sewage effluents in its
Ninth Report. When effluents were to be discharged into rivers where
dilution would be less than eight to one, the Commission recommended
that in the effluent, "(1) suspended solids should not exceed thirty
parts per million, and (2) not more than twenty parts per million of
dissolved oxygen should be absorbed in five days at 65 F." (p. 30)
The later restriction refers to the test for "biochemical oxygen
demand" or BOD test.
Sewage Farms and Land Application of Sewage. In ancient Greece,
cities which had drainage systems often spread the effluent over wide
areas of ground for irrigation. Following recommendations of the
Health of Towns Act in 1888, some towns in Britain operated
sewage farms, growing grass, mangolds, cabbage, and willow. The
produce from these farms was generally unpopular in the vegetable
markets. Among the disadvantages associated with land application
is the fact that it may be necessary to store the sewage during

277
cold weather months for spraying on fields later during warmer
weather. The large areas of land required with this method repre
sent another potential disadvantage. The use of a drainage system
can help to prevent the types of problems related to salt build-up
and waterlogging of the soil.
Chlorination and Ozonation of Sewage. Experimental application
of chloride of lime was made to London sewage in 1854 and 1884. On
January 27, 1887, a British patent was issued on an electrolytic method
of purifying sewage. The electrolytic processes which were developed
each operated on the principle of producing a chlorinating or oxidizing
agent which could then be applied to the sewage.
On May 10, 1887, the first United States patent on chlorination
of sewage was granted to J.J. Powers. His apparatus was to generate
gaseous chlorine from manganese dioxide, sodium chloride and sulfuric
acid.
Contact Beds. This type of treatment appeared in the 1880's.
Crushed rock or slag is placed in watertight tanks. The beds are
operated by the fill and draw method and require removal of accumulated
solids. Limitations include the frequency of clogging, the longest
period required, and the relatively Low loading that can be used.
Sewage Trickling Filter. In 1871 in Wales the first intermittent
sand filtration process was placed in operation. William Joseph
Dibdin, a London Chemist, in 1882 gave evidence to the Royal Commission
on Metropolitan Sewage Disposal that bacteria were important in sewage
treatment. He was one of the first to suspect and promote this idea.
In 1887 the State Board of Health of Massachusetts at the Lawrence
Experiment Station experimented with Dibdin's idea. Two years later

278
the board reported that "the mechanical separation of any pa ft of the
sewage by straining through sand is but an incident . . . [while] the
essential conditions are very slow motion of very thin films of liquid
over the surface of particles having spaces between them sufficient
to allow air to be continually in contact."18(p. 28) However, even
the coarsest sand became clogged and useless in a short time.
Dibdin continued experimentation using different media. In
1896 he wrote of his own experiments explaining that a very coarse
medium was needed into which air could pass freely over the slimy
deposits of aerobic bacteria which fed on the organic matter in the
sewage.
Before the date of Dibdin1s publication, about 1893, at Salford,
England, one of the earliest of the trickling filters was installed.
Trickling filters are self-cleaning units from which settleable solids
pass out with the effluent to settling tanks. The first trickling
filter treatment plants in the United States were introduced in 1894.
Activated Sludge Process. In 1912 Dr. Gilbert Fowler and his
assistants in the Manchester Rivers Department discovered what is now
known as the "activated sludge" process. They aerated sewage in bottles
for a period of time, withdrawing at the end a clear liquid and leaving
a brown deposit. When raw sewage was replaced in the bottles with
the deposit, the liquid became clear in a shorter time than before.
This process involved the production of an activated mass of
organisms which were capable of aerobically stabilizing a waste.
Two processes came to be used to provide air for the bacteria, the
diffused air process, which forced air into the bottom of the tank,

279
and surface aeration which introduced air by moving paddles at the
surface.
Refinements of the 1940's included tapered aeration and step
aeration which made better use of oxygen throughout the aeration
period. Other refinements developed are high-rate aeration, bioabsorp-
tion, and extended aeration. Extended aeration lowers the rate of
sludge production.
Sewage Lagoons or Stabilization Ponds. This form of treatment
has been widely adopted in recent years. These lagoons can be anaerobic
or aerobic. Artificial aeration can be utilized, and this type of
unit is closely related to the oxidation ditch. For more complete
coverage of this topic see p. 439 below.
ADMINISTRATION AND FINANCING OF WATER SUPPLY SYSTEMS
The Greek philosopher Plato (427-347 B.C.) suggested that a
city water supply be administered by a group of water commissioners
representing individual districts. He also recommended regulations
governing water use as well as penalties.
Frontinus, as water commissioner of the City of Rome around
97-104 A.D., headed an organization run by the government, and one
which was quite well developed. Of great importance in the growth
and maintenance of these systems and of those found throughout the
Empire, were the funds provided by the Roman governments and Emperors.
During the Middle Ages in Europe, the decline in urban popula
tions decreased tax revenues, and monasteries came to be leaders in
providing water supply, and sanitation facilities. Late in the Middle

Ages cities again began to grow and local municipalities took over
leadership from the monasteries.
In Europe after the Middle Ages and up to the eighteenth century,
with rare exceptions the costs of water supply were borne by the
Church or by burgesses of the municipality. In the eighteenth century
private enterprise began to enter the field of urban water supply.
In modern times Great Britain and the United States have played
a leading role in the development of public water supplies. However,
the pace of development of urban water supply facilities did not
pick up in Europe and the United States until the nineteenth century.
By 1800 London, Paris, and Rome were nearly the extent of water
supply facilities in Europe at that time. By 1810 there were several
private companies serving London. In that year they decided to divide
the areas served between them and to increase the rates, which aroused
complaints of monopolistic practices. Later, complaints and diffi
culties arising from the poor quality of water supplied led to successive
hearings and attempts at certain reforms. Among these were the
Waterworks Clauses Act of 1847, and that of 1863, which introduced
the principle of compulsory supply. In 1867 the water used in London
was supplied by nine companies. It was not until 1902 that the
Metropolitan Water Act authorized the Metropolitan Water Board and
directed that London's water finally come under public control, a
matter which was accomplished in 1904.
In 1800 Boston, Philadelphia, and New York were nearly the
extent of public water supply facilities in the United States at that
time. In the United States at the end of 1830 there were only forty-
four cities with public water supplies. Most of them were small gravity

281
water works, and none included filtration. As public water supplies in
the United States developed, public ownership became the norm.
HISTORICAL DEVELOPMENT IN GREAT BRITAIN (EMPHASIS ON LONDON) AND THE UNITED STATES
Great Britain. Britain, and particularly London, were selected
for a developmental summary because they present the oldest of the
modern systems for which the information available for this research
was most complete.
The early civilizations which developed in Egypt, Crete, Persia,
northern India or Pakistan, and China, each at some point attempted
to provide for water supplies and drainage systems. In Europe after
the decline of the Roman civilization, the principles of town sanitation
were widely ignored. Beginning in the twelfth century, as towns
began to increase in Europe, liquid wastes from the towns were being
drained into ditches and moats, while solid wastes were piled in the
streets and sometimes sold for agricultural purposes.
At the beginning of the sixteenth century a house in a British
town would have had no water pipes and no drainage. In the yard
would have been located a privy consisting of a large pot under a
wooden seat in a little shack. By 1578 London was one of the largest
towns in Europe, with a population of about 100,000. Sources of water
at that time included the river, public conduits supplied by springs,
and water sold by porters. In 1580 Peter Morice, a Dutch engineer,
built two wooden force pumps under London Bridge which were driven
by a water wheel. The river water was pumped through a wooden pipe
which could be tapped by lead pipes to run water to the yards of some
private homes. In 1596 Sir John Harrington, a poet, published a
book containing a poem in which was described something which we would

282 now call a valve water closet. It was presented by him and treated
at that time as something of a joke.
By 1700 in an English townhouse of the upper classes, the owner
and his family no longer made use of a privy in the yard, but rather
a "close-stool" which was kept in the bedroom. This was a box with
a padded seat and a pot inside, the contents of which were emptied
by the servants. In 1775 a watchmaker, Alexander Gumming, invented
a type of valve closet, consisting of a cast-iron bowl with a valve
at the base which could be opened by a plunger to release the contents.
The water for flushing came from a cistern overhead, while the effluent
was discharged ino a cesspool under the basement or in the yard of
the house. In 1778 Joseph Bramah took out another patent for a valve
closet with a different design.
By the last quarter of the eighteenth century there was culminating
a change in life-style in Britain, a movement from the country to the
city, and from the farm to industry. Before that time, most people
in Britain had worked in agriculture. Water power had limited the
size of industries; pack horses had been used to distribute goods;
and since the introduction in Europe of blast furnaces in the fourteenth
century, small amounts of iron had been smelted with the use of
charcoal. In 1711 in Shropshire, coke had begun to be used by Abraham
Darly and his son to smelt iron (from about 1750 cast-iron pipes had
begun to replace wooden pipes for water mains); in 1712, Thomas Newcomen
had pumped water from a coal mine with the use of a steam engine;
in 1759 a canal had been built; and in 1781 James Watt had improved
the steam engine to supply rotative power. Thus, by the last quarter
of the eighteenth century industry and towns began to grow rapidly.
London's population increased from 1.5 million to 2.5 million between
1831 and 1851.

283
Due to the growth of towns and the beginning popularity of
water-closets in the early 1800's, more sewage and other wastes were
being dumped into rivers from which water supplies were subsequently
drawn. Solid waste was still left piled in streets and yards and was
collected in wealthier parts of town by private contractors. Before
1815 in London laws prohibited the discharge of any waste other than
kitchen waste into drains. Not until 1848 in Britain did it become
compulsory to discharge town sewage into drains. Where privy vaults
or cesspools were built or manufactured improperly, they often
created a hazard to health.
Early water mains supplied water only intermittently. In 1800
better homes received piped water which was stored in lead-lined
cisterns before subsequent use. However, in some poorer areas, one
well pump and one privy would serve many houses. The poorer classes
had great difficulty to wait at the public standpipes at the appointed
hours to obtain the water and then to store it, so that they most often
did not have sufficient supply. Sometimes a great number of people
had to provide themselves water from taps which flowed for less than
an hour each day and not at all on some days. In the year 1800 a
bath was not often used in Britain. When it was used by the upper
classes, it consisted of a portable bath set up in the bedroom which
was filled and emptied by the servants.
In 1804 John Gibb, owner of a cotton mill in Paisley, Scotland,
began selling water from a sand filter he had built to clean water
used for bleaching. The water was delivered in carts for a half
penny per gallon. The first town with a piped supply of filtered

water was Glasgow, in 1807. The early filters were never completely
successful because a satisfactory, method of cleaning was not then
known by the operators. In 1827 a Scottish engineer and mill owner,
Robert Thom, built a slow sand filter cleaned by reverse flow wash, and
in 1829 James Simpson deAdsed a slow sand filter which was cleaned
by scraping the surface of the sand with spades. These developments
in filtration were too late to be of use during the first epidemic
of cholera to sweep Britain, but in the three epidemics which followed,
doctors noted that those areas served by filtered water suffered
fewer cases of cholera.
Before 1817 there had been occasional outbreaks of cholera in
India, but in that year it began spreading across the world. In
October 1831 cholera reached Britain and produced the first epidemic
there killing thousands of people. In 1831, no one knew how to prevent
cholera. Now it is known that an essential element in the prevention
of epidemics of that disease is a good water supply. Three later
cholera epidemics were to occur in Britain, in 1848-1849, 1853-1854,
and 1866. Bacterial diseases were another cause of thousands of
deaths every year. In general, living in town was much less healthy
than living in the country. In 1831 more than twenty persons out of
1000 died in Britain each year and this figure rose as high as thirty
or forty per 1000 in some towns.18(p. 3)
Edwin Chadwick, prominent among forerunners in urban hygiene,
reported in 1842: "The great preventives, drainage, street and house
cleaning by means of supplies of water and improved sewerage, and
especially the introduction of cheaper and more efficient modes of
removing all noxious refuse from towns, are operations for which aid

285
must be sought from the science of the civil engineer, not from the
physician." 18(p. 7) Since at that time an "engineer" was a military
man, the word civil was added to the name to made a distinction for
this new profession. Reporting for the Poor Law Commission in 1842,
Chadwick recommended measures which may be summarized in part as
follows:
(1) Every town should have a system of pipe sev/ers with pipe sizes restricted and grades of sufficient slope to give self cleansing velocities. . . . Thus every town and city would have a system of sewers that would afford an efficient means of conveyance, rather than a depository for sanitary sewage.
(2) Every house should be directly connected to the system of sanitary sewers, and every house should be served by a constant pressure public water supply system.
(3) Sanitary sewer systems and public water supply systems should be publicly owned. Such systems should be designed by competent civil engineers and should be operated under the direction of appointed water and sewer commissioners supported by adequate administrative and technical staff.20(pp. 193-194)
Subsequently, John Roe, engineer to the Holborn and Finsbury Commission
of Sewers, designed the egg-shaped sewer to replace the square ones
in use, and Henry Doulton produced glazed earthenware pipes for house
drainage.
In 1835 after the first cholera epidemic in 1831, a committee
appointed by Parliament reported on conditions arising from the fact
that the Thames was used both for the disposal of sewage from the
City of London as well as for the municipal water supply.
The Thames, to this day, receives the excrementitious matter from nearly a million and a half of human beings; the washings of their foul linen; the filth and refuse of many hundred manufactories; the offal and decomposing vegetable substances from the markets; the foul and gory liquid from slaughterhouses, and the purulent abominations from hospitals and dissecting rooms, too disgusting to detail.
Thus that most noble river, which has been given to us by Providence for our health, recreation and beneficial use, is converted into the Common Sewer of London, and the sickening

286
mixture it contains daily pumped up with water as a common beverage for the inhabitants of the most civilized capital in Europe. 18(pp. 21-22)
In 1848 the second epidemic of cholera began in Britain, involving
almost every urban region. In London alone there were 15,000 deaths
and as many more who fell ill but recovered. It was during this epidemic
that Dr. John Snow, a thirty-six year old physician, discovered that
cholera was communicated by the mixture of water contaminated by cholera
victims with supplies of water used for drinking or cooking. His
findings were published in 1849 but were not accepted by the majority
of medical men who still believed in the miasmatic theory of communica
tion of diseases. According to this theory, disease was a fever which
was brought by special disease-producing airs or vapors.
Parliament enacted in 1848 "that water supplies must be pure,
safe, and constant. . . . "18(p. 37) However, there continued to be
intermittent supplies for many years. In 1848 most municipal water
supplies were privately owned and did not operate or improve their
services adequately. Thus, efforts were begun by municipal governments
in Britain to buy up the companies. However, the eight London water
companies had not all come under public control until 1902. A
Metropolitan Water Act of 1852 required that all domestic water from
the Thames be filtered, but the London water companies were often
in violation. The third epidemic of cholera occurred in 1853-54.
In 1858 Louis Pasteur, a French chemist, published his finding
of living microscopic beings which required air, calling them aerobes.
In 1860 he described miscropic beings which lived in the absence of air,
calling them anaerobes. Thus the germ-theory of the origin of disease
was advanced.

287
By the second half of the nineteenth century, some towns in Britain
were operating sewage farms for sewage disposal. Generally, a bacterial
process was not considered in the experiments with treatment of sewage.
Instead, experiments were conducted on filtration of sewage as a purely
mechanical process, and on the use of chemicals to precipitate the
suspended matter in sewage. Manganate of soda was used on London's
sewage in 1885, and chloride of lime in 1887.
The Public Health Act of 1872 required cities of over 25,000 to
appoint a medical health officer and inspectors. As a result many
wells were condemned because of contamination by sewage, and this
significantly reduced urban death rates in England. Beginning in
1875, the number of cases of typhoid fever began to decline, so that
after 1900 few cases were reported.
In 1882, William Joseph Dibdin, a London chemist, was among the
first to indicate that bacteria were important in sewage treatment;
later with some assistance from results of the Lawrence Experiment
Station in Massachusetts, he discovered the principles of operation
of what later came to be known as the trickling filter. One of the
earliest of the trickling filters was installed in 1893 at Salford,
England.
By 1890 most British towns had constant supplies of water.
Cases of typhoid were still common. A vaccine for this disease
was first produced in 1897.
In 1893 pressures and temperatures necessary to manufacture
copper pipe by extrusion were reached and copper pipes were used in
high-quality plumbing.

288
In 1896, Donald Cameron, city surveyor of Exeter, discovered
the principles of operation of what he called the septic tank.
In 1897, at Maidstone in Kent bleaching powder was put in the
water mains to stop an outbreak of typhoid. The first permanent
chlorination of a municipal supply began in Lincoln in 1905 using a
solution of sodium hypochlorite. The use of chlorine for disinfection
of public water supplies was a big step in the hygiene of water.
However, chlorination was slow to find adoption in Britain. In London,
chlorination was not begun until 1916 and then only to avoid the
necessity of undergoing sedimentation before filtration. Bleaching
powder was used first and then liquid chlorine in 1917. Ozonation
was introduced in Britain at about the same time as chlorination, but
never received widespread acceptance there.
Although water carriage of sewage was widely accepted by the
end of the nineteenth century, less than ten percent of the residences
in the principal cities of England had that facility at that time.
In 1912, Dr. Gilbert Fowler and assistants in the Manchester
Rivers Department, discovered what is now known as the "activated sludge"
process for treatment of sewage. In that same year the Royal Commission
on Sewage Disposal proposed standards for sewage effluents. Where
discharge was to be made into rivers where dilution was less than
eight times the volume of effluent, no more than thirty ppm suspended
solids would be allowed in the effluent, and not more than twenty ppm
5-day BOD would be allowed.
In the 1920's compression joints for piping were developed and
in 1934 the capillary joint. Copper piping came into wide use at about
the same time. In 1862 Alexander Parkes of Birmingham had discovered

289
how to make a plastic-like material out of cellulose nitrate. Later
the plastic industry developed and plastic waste pipes were introduced
in 1944 and water pipes in 1953. Problems were encountered with
brittleness in the first attempts.
United States. A brief history of the development of methods of
water supply and wastewater disposal in the United States follows as
well as an indication of the impact' this has had on public health.
Developments in the United States, as in Britain, have represented
a leading force in modern systems of domestic water handling.
In colonial America before steam powered water pumping systems
were developed, municipal water supplies were ordinarily taken from
public wells equipped with hand pumps. As late as 1799, New York
obtained its water supply from a well by means of a horse-powered
pump. The earliest public water supplies in the United States were
to be found in Boston in 1652; Schaefferstown, Pennsylvania, in 1732; and
Bethlehem, Pennsylvania, in 1761. By 1800 there were seventeen utilities,
in 1850 more than one hundred, and in 1885 more than one thousand.
In 1895 there were about 3000, in 1924 more than 9000 and in the 1960's
more than 18,000 systems. In 1890 about one-third of the systems were
privately owned, but by 1960 more than three-quarters of the people
were served by publicly owned systems.22(p. 220)
Some of the early public supplies were originally installed
primarily for the purposes of street washing rather than for domestic
supply. Treatment of the earliest supplies in the United States was
directed primarily toward the removal of turbidity, and the ability to
perform tests for purity predated their use. The greatest advances in
the improvement of quality have been made in the last century. In

the 1870 s the first filtration systems in the United States were
installed when slow sand filters were built at Poughkeepsie and Hudson,
New York. In the late 1880's the earliest rapid sand filtration units
were in operation. Chlorination for bacterial disinfection was introduced
in 1908. In 1945 three communities were supplied with fluoridated
water, and in 1959 the number had grown to over one thousand communities.
One hundred years ago wastewater was often simply poured into
street gutters, and cesspools and privy vaults were in common use.
By 1957 more than 7500 sewage treatment plants were in operation. An
additional 3000 communities had sewerage, but were discharging without
treatment.
The diseases which may be water-related range from typhoid fever,
amebic dysentery, infectious hepatitis, and schistosomiasis, to others
which are too numerous to mention, and all of these diseases were
prevalent in the United States in the not too distant past. In some
developing countries, mortality rates from enteric disease are in the
same range as that which was true in North America in the last period
of the nineteenth century. In the United States water purification is
one of the measures which has brought water-related diseases under
control. In 1900 in the United States, deaths from typhoid fever
were 35.8 per 100,000 population. By 1936 the figure had been lowered
to 2.5, and it was later diminished to practically zero. (p. 225)
LIFE-STYLE LEVELS AND TECHNOLOGY LEVELS AS A CHRONOLOGICAL CONCEPT
In viewing as a whole the material presented above it has been
possible to ascertain chronological developments in technological
levels as well as in life-style levels. With the aid of the organization

291
(T)
c o •H
3 Cu O Ot
O O O
O
o
u
en x i-i
Q
40
35
30
25
20
15 h
10
5 I-
0
1840 1860 1880 1900
Year
1920 1940
18.0
16.5
15.0
13.5
12.0
10.5
9.0
7.5
6.0
4.5
3.0
1.5
0
1960
o o o
CO 0) •H r-H a a
0) u a)
<4-l
O
S-l a> XI
(S)
Fig. VI.20. Simultaneous decline in typhoid fever death rate and rise in number of community
water supplies in the United States.
SOURCE: Abel Wolman and Herbert M. Bosch, "U. S. Water Supply Lessons Applicable to Developing Countries," Water, Health and Society, ed. Gilbert F. White (Bloomington: Indiana University Press, 1969), p. 225.

292
of the historical information into Tables VI.1 and VI. 2, it was possible
to ascertain different levels of technology developing chronologically
in the various geographic areas. Six levels were detected, and the
main aspects of the classification have been included in Table VI.3.
It should be noted with respect to this classification process, that
inventions which are listed in the inventory were not put into use
immediately. There was usually a certain lag-time between the discovery
of a technology and its application. Also, these technology levels are
not closed units, each separate from the others. Rather, as new ways of
handling water or sewage came into practice, the old ways very often
continued to exist along with the new, and the appearance of a new
level of technology was often a gradual process, with first one element
appearing, to be followed later by others of the same level.
In addition to technology levels, life-style levels could be
discerned as a chronological concept. Four levels were defined and
the principal aspects of this classification have been included in
Table VI.4. Technological progress is linked to demographic expansion,
and important as well to the transitions from one life-style stage to
another are the processes of urbanization and industrialization. The
same process of blurring between levels occurs with the life-style
levels as was the case with the technological levels, and interrela
tionships are evident between the two classifications, life-style
and technological.
Subsequent to the previous steps in arriving at life-style
and technology levels, an attempt was made to tie historic technology
levels to the life-style levels. A time scale, Table VI.5, was developed
for three historical regions covered by the inventory. The three regions

293
H 55 W M CJ
f—1
• M
> W l-l PQ
<! H
H ^ co
o W OS J 3 Q W Q M S '— 1 H 1 55
< W H M < CJ Q 55
< 5 T CJ H l-l 55 OS W O 55 H M CO H M 55 3C O
CJ fc m o o
CO > H
OS 55 3 <;
< CJ M o o o 55 O OS X CJ
H 55 W M CJ 55 <
£S5
a -o « £
<u o
s s»
"
n 5
«
liUH llillll
ill*!: 0 o J< * <u c >- • i* u h si -w ra fl (fl O *J C *-t i-»
T3 TJ 9 fl) x - H -* • 1 I J l ^ « C 3 O O 0) 5 «
TJ n - H • • c "D ffl c c k> m •**
^ « H ? »
Sfsl

294
w O *g O •H eu e *-* •-*
IIIIISI! as
filiMiiii! «rt
> * 41 V *J
>» « •H » >-t (Q «*-.
*J C
2
o a 3 <u c C QJ
*H X. U 4-1 4J U q (d
£ 01 B»
to k. a]
05 ft) rH
r-4 qj U I (fl r -4-1 *-* a. a 9. t~*
o u 0)
UJ (A •a . c 3 *J V- 4
-J a i - n u v u j i

295
O <4-t
« «*4 0
e
•o c 3 o fa.
IX
o.
> •H U a
O.T3 3 to M V 4J fO 9
5 •< n x> •H 1 -
00 •H t-t V a r1
!J!i; IJEii
to co a) •» «5 *-» X C 00 TD *J Q . * u « Li eg c -H d ^ o
I C *H 0) -H U CI C 9 ^ 3 1 in C C P *J I* X< i c r r j ! » i - < < 0 3 0 « J > > 0 ro i-i QJ u b v **-i "O
t-i n » ai tt H cu m 4 - i o « o t D . 4 J * j ( o u OJ P x e -* -^ o >
a. x o •-* <-* o 00 4J tO Xt U
i O *o -a i *M c 5
as a c « oo «M
^ a> c c o I) « < H O TJ K H *J 5
O O U -H w O • o o C « 1- 4-1
u a iJ >
<D
°iti™iliili p a. TJ C 5
? S f
o o O *rt <*9 (O

296
o S
it
w •§
B ' O w k<
*•* >>n 3 B tfl w B O B
t-4 H *n U O (Li U q O O U
iiiis - |
111 3 * D < t J &>
<y JJ
- 3 u 3 TO > E C CC • • * . « ^ QO U U D X Hi C w
~ X ?
1 c o o c o X a 0)
TJ
a> u u 3 1* * J
0)
Jl
3
V c
(0
U
0 X
ID U U M 41
* -m*a
ai |2
u a
s A o
m
I S

297
3 ••-< -H p. -H c u- <M i- e
• ^ O 01 " ^ «-» « 0> C > - * J C O ft O 0) O T4 W L. C 1- 00
U. O J c «
tfl CO » t-3 CO 0» >> O
±J 0) ^ *J O I-* K *J *J C U ~
W 3t O u U
c o
lt~< « eg
i - J C W «
• H J< U - C
• •> O <3 > * *-t
- H C ft O M O . * ^ C 3 W --H « 0 . « H
• H •*-» 1-1 L« 4-> Oi o qj *J 0) CD CO CI > •v u
O
u -o i * 0> 01 H - D m X 3 C 3 H H O . CI CJ
c o -ri
to CO
- H
6 B o u
OI
*-» CO
S
cn * J
u 3
•o V 3
cr eg
e 3
<M
•o Of 4J CO k ( Qi
a. o i
u C
s c i J
0 )
> o
>> •O i - l C D . to a
3 4J (0 c QJ 01 B £
E" 01 «*H > o o S O U
tf)
c o o X B o • ac o)
l< >•. o
O C X k<
(ft flj
*
V
•o oi
g o
- 0 C>
»W
CO * J
CJ 3
•o 0> 3
cr CO
01
£ V
0 0 H
UH
3 O
\*-4 T3 V
O *J •W CD - H B X -H 3 *-» p. to
a 0 0 C «-i
• H a i 3 X o u
~H m U H U
1 0) X X
en 3 • O (0 3 C C - H
•H CO 4J 4J
o M l
4 J CO
a
< o o
>% X
>> a a. 3 01
or X 4->
1 3
a o d.
X (0 •a
• CO
u
a CO
o OS
c o
"-» - 1 CO 0 0
1
•a *-» 3
o X
« at H o
cc y - .
o
c o
• H
AJ to
—1
X U
a X )
o r H
X 3 • a. w
*-> 0) C
Sfi a x - H Ifl
X - H •H X C/l C3
cn • 0)
c 0 OC
- t C t-H ^H
•o c CO
0 )
to
E Cu
X * J
* J
« Oi
^ 0 0
c a*
> « r - t
u
1 M
0) «J CO
5
CO X
CO X
u • H
X 3
00 V
c • H
u 4-< CO
^ CJ
• r t r H X
3 Q .
« 1-4
X • H
n a> CU
u o to
•o c D
CU
u 01
> n a>
• H
• H ^ H
G . f H CO 01
M X
c • H
B . X
* C CN
o>
CO 3
i - t
•*-*
u 01
w 0>
X H
a CO
<+*
u r - (
X 3 P.
01 OD M to
r - (
d
« m 3 CO
o V
X
£*
c
1
« c ev * J
•o Ol 4 J
X
« X
c <*H
I -<H
* J
« - 1 3 O .
o o.
a c • H • H ^ H
a i v J<
»< t-t
i
" c a
M
o
« u •H 3 •o
g U
« M o h
A
• X u o u
g • H * J fl)
• H
3
8-a 01 •
x •* 4J 0) r H
..-o
II BS «
63
3S.25
a <
a
a •< o
2

298
Si
13
3 C
C o I I HI
.£
31 cd
X
5 » oo a c o
•rt O -1 U rH X 0) *J » a •o x
o 5 • v 8 « k. -H
• B J S . 3 U J3 C l>
Z * £ "o" I- U, t 3 • - « HI
521
T3 0) u -t •s-s U *4 a a
y— *J
o u U 9 TJ "O « a t> •><
>^ >
o
Q
•si"

299
w •J nq <
SB O
3 0) -H-H *i
*o c <8
4)
as
« » T ) ««H •H o t o
v t
* a) a> O . J= «8 *-»
£ C •H
0) M CO 9 V t * W W -H
a o.
c j * 01 JC
- 1 *-» «-l <-t
o a u v
a c *J -H
£1 u •* a u
a 5 6 w
>*< o
• t > t . a a
- " I S . .
&- > « <U I O •*-• > -r( V a B U ' 01 T3 c-2 B
f i i j i i i fg* CT C C < 5 H i
to O) 00 C 1 "C O. •-H c « i*-» c o . .c m m -H O
C -H
imlnm a u -H o» -H a. bo o x <u
0> I r-( ^ >«1 c o o a a J 3 o c a . • • - 3 u -
C « & I H M
« • * y « « • * » < - » « « o m a } > ( o < H
S 1 w a ft. ai
c (0 1-< 01 U
iNlil Mi
£
23

300
5 n
t-t U
c fl <y a o t-. D
bJ
* J M M
•»-i
7 E
•*•« «n *o <D 00 <D
U « OJ O C M
£ °° > «l C 1)
•C > *-» m t* X X.9
«H 4J
3 5 a
4-* > a q »
» « c T4 U t-t * i 0 O
-H
cn iH
p . (8 > [ i , 3 G Q u * a ) r * i * i
- a <u d n •H 4-1 C o I I
SJ?1 •H o 5
w n c ^ 3 fi
W • J
H
£3
*J at v i
I l l II1I •H <u (y -a
O V £ OJ «U O >> "O
c ocH h u a o n c
e*j £ n o 10 R m t a n 0> t J V) *-> CQ P U 0 1 (3 <U
nj ^H <v o <u c *-» o W 4J - ^ 0 <U « « f-4 * D * J
4J - -H (0 . C « 10 <-H -H -H
*-» O (0 O * 0 O (T
U 0 0 < H ^ * « M < H O t t ) « M J * <
I V V 4J
I « 4 3 3 I *J O • i c v - H a
•H 6 I- 0J » O 00 CO i t ) n a) o i « p. I r-1 -O U U i -H C O 3 I a « «« a.
I l l s e-
ii! su
g 5

301
c - 1 00
- H
** o
>. c
« E 01
o w K V A*
5 »M 0
T ) o
£ u <u E
^H X 91
X
2 O 4-* a 3
are
V BQ
01 u u o
M-i
00 c
>. J3
C <u
> t-a. t ) E 3 O.
1 4 - 1
o
000
•*
U) a
l a
c 0 O
c «l • o o o
» ** a V
M 3
C o
4J U
2 *J n
11
bo VJ <fl
r-<
01 J= JJ
y-i O
01
a
a • « o *-* *a U O 3 3 O - *
Ul O O - c C O - H
•* o fH 10
a ai 0) • O
•••» P . U * i O 3 •H p . O O w (O
•H » r-t 0 0 . f i * 0
3£S n a oo a a c e , •* - H
rf as «
g si •H 3 O u a tM
a n ai •u K O
a.
•a a ci
•H 4-J
c O U I I
CNJ
Hi
ill
If 3 S ~
•H 3 «
5. 0)
> *H w tH
5 * 0 -
o
c o JJ CO
* 4 o .
I M
o
* J oe u c
* - * *> , 0> >N C oo- - t « C C 0 3 O .
^H 3 0 a BO u
-H 4J Q. - r *
O i-H 3 01 *-< M j 5 01 « *^
I- i C <0 TJ I O <J fl > O
C T3 W O tt i-t C (J C ^

302
• °s
3§
c c 3 E E O ( J
01
g c/i
tv . c u
C ro 01
e W at
* J
• H
- < i ai
sg 4-* t t (0 ~<
*-< ^o 0) O 1- U
a .
* ^ W* V 01
» «*-
c o
4 J CD * J
c
« 00
oa
« • H f - l
a a . 3 01
n
« w
« 3
3 a. a a - H a,
3 § as tr 3
H « C .
<3 <B * 0 3 w S 9 « £
. » 0) X k. O 4J
S3?
o en 13 t - t
llliiiliil- m 0) 3 C
•H
c O
CJ I I
§-§
"U 1- O T3 -rt *J
V5 0C *J C a> > * - H • x> t -O H
H 13 (( u at x p .o at w c
at w
« > 4 J fO
>
* 01 K A
4* U
e
» u D.
• H a
T3 ID oi
« J to o o
1 K
« a
« « a > • H U
a
T3
« CD Q O U V c •rt
tt a> u
>
« w
u o
i u
>> • 1 >. a x: o * J 3
X>
a a »
w
B m
X I i< 3
V 30
•S •a 91 01 c
« ? g §

303
•*« (8
3 trt
« 4) 4> v
III? I?!
. « Hiliil a £ - -
ii' ll Hi! ii
m sn
X) 0)
c •T-( 4-1
c o o I I
HS
•g
: . „, U " 5 • o - . - c
o o =
: w " v -o o O. «1 0 O. B " 3 3 "
«J 1 u « I J
S i E S S , - , ' S a i - S S S S e o i - o S 5 t 5 . .
• H U B O « U V
, .SSES-SSS « > 3 U C C 0 • u • ^ „ r - . ^, 3 o u - « d u n
« s « w ~a u *
Coke
fum
fact
pipe
in w
nets
vate
gene
II
w • J
W 9
I- a x
I** in u
:«t
3 5 w
0
r«< »•< «
§ s . i j - i S? •
«4 <*• u o t - w • «l FH * ,
u « M B 4 A
« « • i | b h
> • • «< * i «J
a. • »
i

304
II SPS
. 8 o. •< o>
I I . Jlsi;
i! §
I!
<u c •H 4-1 d o u I I
CM
"8 X
HI *
>
I
I
Hi «M 41 O 06
•H 4J i * - '
SO T9 •
c •*• e c
« s 2 s
« V W U
w £ 0 h ^ C >
HIHH
£ 2 5
I "•t
iSS S < M H O „ «* W
«l •%
w b B
I S 8
& 5 S
S I

305
II 5 5 a**!
at mi i.
g - .
5ar * * w «o
XI <D 3 C
c o o I I
W
3
3 8 i c o o ^ £ u
•H C >» O -H .O
T> +J • »> 41 d C „ B g o 00 U U
5IS.2 C -H U 3 • « 4 J I t
3&.-.S > u a. u a E c .- u o u n P> t. a -< .5 ~-38? * i a § 2 5 8 3 I I u u - i a o *M O W « <u -4 O 6 « w u u S a
Fir
st
stea
a-po
wer
ed
i I
Is O -H . s u u > T> •
-H ^> S ^ £ > « en •g&v i ss " Si i i « ; en w »H
I I S c c o 2 "" "1 •P — -M ^ S 3 C N a -4
° - ~i u S5
*" - ~ "2 2 S £ as Vi -* t 3 U K .
D. • 6 » « «
O. «
l 3

306
S« I £ • 1 SE * o a
r-t t3 U C -H C •H -H U X « *H H PL. X 01 3 01 13 - « a 3 i § S
: •C 01 B
•J
»s a. n «J a . j 4 B •-i a. u w «
5 S ^ ^ ^ b & O U
»" :
III:!! * : « = * § 5
iinii
• - i b i >> a <M x
^ -H -a . * .
£ & SS§&- .25 3 X I . -rf -H a u o » a. w - u n
^-s a-o i °-s s.£ c a a r t • * = »
su^si*: • H O < o n c a < « r t S X >> U 0 1 U 4 C . O C rn « c u -< a v o a. a a >* <-. u e a . v u u B 0 O b
£ g S S . g § 5 &
rt-a-H a n - * 6 x 6 u - H a u v
! ! » « • » u v u 01 41 » •
K U « > O a fc C «<
« u • * w. »•< * a o.
u a - H w x k<
•S'S T3 V a 2 3 a u f-i a u a . o o . r t i> a O - 1 -H O U U
, a , . o a o 9 *J
15 m
« * J «
±; r3 ° • -H fl •<* c C a
T3 <U 3 C
• H •U e o i i
X
8-S u o. S B
J * l * >
o > o u "c >• - H a» I- aj
pi!
w hJ
EH
II •a » M >>
£ -H -H 3
I
O 3 « u a a »
A 00

307
111 u (A n 3 • V
X u «j ec c a c S. u »<
•o i S E 2 5
T3 d)
C •i-l u c o u I
w • J
3
I -3
i1* • * CO
"3JS8
IH
l3 U H
n o u t* ft C.-W » i< w & m e c c o * J •* .
-H 3 -4 *« ^ MtM M W **, C O
a w ti I I o «j E u »H 6 c c m « -*-t T * B a 0 •
1 I M I H W B <-i <-«
11
r1. e *< 1
1
U.J fe *J O O
>M Q.
V V *J a a 3
» O ^H
« •o o m
a
It
« M
x o
« H
ci V u
Ou
• V . e
> <-> • oc a. c
X u
»
t ? . i i S f f . , o • * a •* a: u w > « a .
« ! « « * • « ~ >- n J= u •O <rt - i .H c •-. - . • a <M n <~ t> o. o •
-< B a -H u s - - - " • »
^ . 2 S -H
-C - H «M H *
a <Q - e
§ . a
5 i « r J " ! se ««S!i I I

308
JC a 01 •o W t H •r4 X a.
o *J o. o • U T3 O. 41
T3 *J »-ID O Wi U
«H V VM W
V *J a c •H t-> O
• - t J= o
o. o
00 *
I!
if O v i V
C .O 3
l< 1
QJ a u a; m K 9
T3 c c O «3
*J > 14 t - t o a D. a. OJ 3
• • 0 O TJ JJ
QC
>• * C —• 1 0) i u » » O c M «1
1 « » • 3
— tr-o -o • • I I I com c a. > £ v < i i1. 2 - i *
oj u 3 w CD
41 U 4
a «
to 4) c
3.2 <-* *J O U
v a <o aa u o
T3 0) 3 C
'H
3 i i
Csl
If I V t >
I «H p .
3 U O U
0 <C
SI1-TJ O I C U 1
a a -
•8
z Q> 1 ) g-g hi 3 - <
I d e) >
II
•H 01
•I « • * I* • > a 8 8 3
II

309
> u O 41 C o ~* > n u c to a>
u « « o. U (« U I M
i l ? « *o o a> « r "£ >• - c
. T3 -rt
§ a 01 t * U * i w go W O
z. 5 V u tn a
S
C T3 5
%-su • o n a « « a u l U H r t 3 u O 3 O 3 O « o. eo o . >
•o 3 5 E 53
T3 flj =1 C! 4-J
r! o o 1 1
CNI
M
> w
c 0(
r.
rop
e an
d
3 .H
" 5 V
•O 0>
£
a n
CQ
•-3 • H e
k. a a K
D. tt.
S3
I
3s
!I. 31}
t »
c - 1 J *
s > * o *-> V1 u V
«
« i H M
m .» B) V
-H l< <u <0
c «4
V 11
4-»
c 0J
1 .-H M (9
0 ,
** 2 "J X
•o V u
« H 3 o-
«l a o
o i l
- 1 r-t a. a. 3 a
•o -H c a u
o - c
»*4
a u a e
a - v.
a. a s§ a. u
* a •H • r-4 y-N
i-S O u u a o -< < - i ~ - H CI U a e
<M 3
2 1
S 00
I

310
1 *J c m u 3 t- o
I -* *4 «M
fc* « C O t l t l
w a u 0 CO
c u 41
0- 0 0 3
at CO
«-t u
* a> « 05
»
i-l O *U
T3 -4 .O a> *a L. a> V • * 00 J • CD V W >
, » • ai 3 SO
c H *H O
g — 4J
Is
(D M V
(3 «H «>
I - § C -a •« v a o « 3 u w CD 4J
o tu c B t= 9 0) (0 b CO C e o o 5 -H
II! T3 0) 3 c
•H c o u I I
w fi
"8 z
s*
II • 4)
CD O
US « u
OH IX
s s s ? ~
Il!3 1 3 1
«- O b b 3 t ) « <u o o u x : m a • s a g
• • X
l-t O 9 U « 4) 4J C0
Si a* r
ts
8-g S3

311
u v 6 *-* 3 ii u x O H si fT c o* at
S O
o «* "5
* j a ^ >• o
(0 to '
0 . 3
O. • hi (A 0) Z W C * 0
?- a. <-< c a) *o • a i g x w v i
Z D ^ o to o i > BB S3 • tD
l i » ill! U D - n u - H
§ 0
*n
* J 0)
"•-) 1 01
• - 4
a . • H 4 J
-* 3 0
a u 0 w R) M 01
60 c
t» U .
c <0 * j
c .c o
• " 3
2 > g u 4 J
a
i o>
• J «3 «J
•
U O
« M
01 i - 4 O
*H 43 0>
> a
«
l a 4)
• "O * « H
•o
s £
" 0
o - C
ft *J
fr t> « J
i ~8
III
3 C
J I I
C M
1
k •W T>
«J S < H
g . o
5I| 0 ) * > CO
a> • * n
•SEiJ a o - i C - u »-i
V 00 n 3 u a
1 0 U %4
IM 41
°ss g*s •H • , 0 •
S* °-i 60 CO JS -H 9 U CO *J a o) * 4 4 0 f H *J C t« O <«4 5
; U D o
w M <! H
fl8
1
n s

312
hill H v g> u « i - c u to »
•*-» a
ft: o en * > to u *-» - ^ jc c 3 r-* i t u C t) O T . O. re « * J <y vn
a. a
>s - H O C JC __ **- * H
<u a i i . . M
to O « M U _ <U O -*4 4 J r-4 •*< « U *J 4J 3 *J C D I - C tfl E <B C L. O « > , , * « . ^ . litis
31 M. o a) 5 § H
• a <u 3 C •H
c o o I I
w -J 59 H
I! M
u a
u «i o n
w *a
&s Li h i «
2 s § : « a •* v ' W rH
S S S - S u > > n - 5 H U » K u c -a w « « - 1 - 1
W 8 O 3
8 g 4 i c V U a e.
> 0> CO
o
c
I 4 J
« a> kl
I •4 0
t
• H «0
mlc
01
•s >, A
01 00 a>
to u 01
Ion
•w a 4J a
^ u 01 t< a.
4*
a 8 CD
.£ to o
c •* • W b H •H f S O £ O
-•se (A V i- e > <wi tH -H u. -o _i
•si-
II
as
H

313
o> n « > o •** o> *-» JO u v c
01 *J •
pa oo ( > m * at o i ID U ^
J- L •H a u oi V
B-g (Jj -H
*J 01 « U U
c co <y
t w S c
•5 2 J B
n c *J -H M
0) •o w 01 3 x ,c 10 U •H fl) «H ao J3 0) * .9 *J s;
•o *o 01 C
73 a 3 (0
U 4J
c c •H Oi * J
DO *J 41 W ^ B T) W. 3 V *J «J 00 B
• w *H
i* O 3 ^•^
C o w ffl M 4-» rH
>*-l
JJ <M eo O a.
T ! CO U tn W CD C
3" -H i_
• o U rH u xi 4-» U n 01 C a o
g*s
nil
•S3
>* CO
3
111
IS 9 iH M O *0 T* 3 t l <M
4 a M 4 « a O x - i • O £ B /- f Q. 6 >> o B-* • 8 •• 8 1 E o "3 *J *J OJ * i 4) O « U H b h h
! *
(8 h •*-! 00
i i
CN
Is
cq
H
) (M 9
m

314
3* & 4h3
m ifflwi
•o 01 w «-N | CO
. * - t Q> > . T-« M «W
. u-t O 0 55 «
T I T 1 Jl * C O
>* a c c C 03 O 4) 3 t 4 T )
*° 2 t ;M
•-t O (3 U < - H U C N-* « * * »H
•o o J=
a. >» *J
o © J2 O .
•• a o i to >» * p . •-*. « * j O 3 i-t
o <<H O eo a m « B H GO ©\ «H O ~ * - ~ s
u u a ^ o * **-* • u t n . - o m o d
« a m r^ >-• ^ X - o
D 01 «J U ) 0) 9 9 V* V •-*
C 0) ft) ft I E ^H
H (co ? v a
> N (0 •o 0 . (0 u
M
o 5 x O . U «
- J< ^- » o >> u o o u to 3 -H 3 C * j u O • * c a j - i
« m n it U -H -H
~ a » <u
S i s i s
41
T3 0) 3 C
•H U a o i i
I •8 X
PI! ill!! iiiu
1=!! Illl
5 3 S
III
H 5 8 s
II 28

315
III!
Q 1-Oi
en to 00
• a
2 § « «*J 01
»-l t J 3 -»H to u
V •o
u
c c « o B ^ u *-> 01 flj
a c 4J • -to o M ^
• * £ b o
C 3 ~« *> T * * -
H tfl U *-t O.
• * N . S«S I **
» * T3 • ••H <N
- o m 0) X
3 & 2 T< « Cj
> ^ - 1 n JC 3 3 « j o c 0 dSS
o o o
o o *H
£ 4) <g v p - H as
•rt O JJ i - u o y c
X H u o -a
U 01 T> U -H *J 3 3 a t ) • cri" o u i •H . * J-i • *J «*-• a s
K 0> *•<
w
» o w
a o +* 3
<
U 0) 4J A 0»
.C
—* " ? <*4 > > t > 1
M 0) T> V
to c -o 09
£ n -8 — o c ~ « - 0 u > »J »< a m a u - i
- 1 U Ct D 3 *J *J 00 o -< c a J • * 01 0
w >M 6 u
~ * 1
35£ C « • C 4 I O > OS T5 - H
•O T3 O 01 *H «J 09 O (Q X 0, ftl p . *_ 1- X <C U *J H
o o o
o o •H
• s X 01 fc-01
« a a Ol u o K a.
5 * • w
•n a a e a «H ec
•o a> u c > •H -1 u o o o rf B
X - H u -a
o
** 0 U u o h 0 U C - H Jb
u U o 0 • a s u «a u •5 «i « 0 u u > * « • W 4* 0 »n a a ^ O -H » *J
§g
T3
d c
•H 4-1 c o u I I
CM
? i « 01 0 0 4J
1 frS (i a v t<<u
^ » S I M > w • J PQ <
u

316
>i O 3 1 •H C £. .
f i« si n i N r l C 01 * H - H - o i i a > <rl U CI > O m >o o B H <d r ( U
- H X «l O 3 U 1- X <U o aj o a. *-»
» J b CI > . « v 0 , - a * J k.
o © o o o •"4
•M Q|
fc. « a»
U 3
*< u t* > -H 3 w l M 4J
c u o c
« > tfl 0) B U
iH O, V<
o o
o *a ai a ^ 0) a 3
u e <u O u
£ -<
„ s O 13 t. C oo a)
a n j ca o
<Q n
K 01 H
> ai
% o
O 0) W N u: *J 3
• c c *J ••*.
•H 3 O C U *j u-i O O
3 « 3 U O 4-» «M a;
w o, O.T3 3
P "1 -7 * »-t O *0 T) O
W U R v(
3 u W £ u
Q O. *~- Q.T3
a . 4-* O >> T) O
!k
1*
w • J
E-i
XI (U d c •H •u
c o u !
*-» E V
"8 X 41 «0
&§
II
II
I!
O «M -H
a a

317
TABLE VI.3
CLASSIFICATION OF WATER AND SANITATION TECHNOLOGY LEVELS
Level Water Sewage
I Dug wells, springs, or rivers (all local supplies); transport by water carriers.
Disease as result of improper handling.
II Aqueducts, canals (more distant supplies); village hydrants, fountains.
Disease as result of improper handling.
Ill Pumps, piped water, lead plumbing, fire control.
Typhoid, dysentery, sewage problems.
IV Inside plumbing, slow sand filters, growth of industrial need and need for growing supply.
Cholera, typhoid.
V Rapid filtration, chlorination, ozonation, water-softening, aeration, continued growth of industrial need.
Incidence of typhoid fever and other water-borne diseases decreased.
VI Fluoridation, recarbonation, advanced treatment systems, concepts of water conservation, recycling and multiple use.
Death from typhoid practically zero.
Scavenging system for sewage and solid waste, sometimes for use as fertilizer.
Privy vaults, public latrines with water flushing; drainage systems; sewage farms.
Privy vaults, "close stools," some water closets; cesspools.
Water closets; combined sewers; dilution as disposal method; sewage farms
Separate sewerage systems; trickling filters, activated sludge treatment.
Reuse, sewage farms.

TABLE VI.4
CLASSIFICATION OF LIFE-STYLE LEVELS3
Level Characteristics
I Agricultural civilization, peasant and herdsman the most important members of the community
II Balance between agriculture and hand-craft industry with a close connection to agriculture. (Implements are economically cheap and technically crude, most made of wood; power source is irregular and often water.)
Ill Industrialization. (Implements are cheap and uniform, much use being made of iron; power source is coal and the steam engine.)
IV Industrialization and automation. (Much use is made of alloyed metals; power source is often electricity.)
aFor a more complete description of the four levels of classification developed in the study on Appropriate Methods of Treating Water and Wastewater in Developing Countries, see the "Description of the Social-Technological Levels (STL)," p. 68 above.

319
I 4 3 .
IJ
w • J
.53
< K l OS
o H M ad i i
z o M o w 04 Q W
a. O W > w Q W • J
oi
w s
Q S < -H O
8 i -H
1
O •s
Ion
o o>
§1
m.
1 8-M 9
J3
o 3 — I . o ^
^ It " 8 3i •2 9i
• "s 2 o 8- 8
II
.2 5

chosen were Rome, Europe (medieval and modern) and the United States.
These regions were selected because information concerning them was
more complete, and because these areas had been forerunners in the
economic and technological development of interest here. From Table VI.5
it may be seen that the progression to higher stages of life-style
level or technological level corresponds to periods of population
increases. This phenomenon may be seen from two points of view, first,
that smaller urban areas could solve their problems of water supply
and sanitation with simpler means, but also that larger populations
might provide a larger base for tax or other revenues with which to
pay for improvements. The greater urbanization, in addition, was
accompanied by industrial advances which contributed to progress in
technological development. In connection with this last observation,
it can be seen that life-style level I corresponds to technology level I,
life-style level II to technology levels II and III, life-style
level III to technology levels IV and V, and life-style level IV to
technology level VI. This proved to be the case in all three of the
regions included in the Time Scale display. The United States began
its process of development at a much later date than was the case in
Europe, so that the early life-style and technology levels are telescoped
into a shorter time span.
In conclusion, it was felt that past developments in the tech
nology of water handling and usage in developed areas could be of
benefit in accelerating progress in this field in developing areas
and that this study could provide background information for planning
in these areas. There are implications to be made and comparisons
which are possible between present or projected life-style levels,

321
technological levels, or other aspects of the situation in less developed
areas, and the various historical stages of those countries which are
considered as having been leaders in the field of water supply and
sanitation. In ascertaining the manner in which present conditions of
a particular developing area emulate the historic conditions presented
here, it is in certain instances possible to discern appropriate and
reasonable alternative technologies or methods for water-wastewater
treatment and handling for developing areas. In other instances, it
is possible to discern the problems which were associated with this
historic development of domestic water use and handling so that they
might be overcome or better dealt with as efforts in this field are
furthered in particular developing areas.
Retrospective analysis of technologies and management, together
with an examination of the impacts on the societies involved, can be
a valuable aid to planners. For example, in planning for water supply
and waste disposal in urban areas of less developed countries, it would
be beneficial to review the history of the use in developed countries of
such things as wells, sand filtration, or disinfection. What is generally
required in planning for water and waste management, particularly in
developing areas, is an appropriate blending of the old and proven with
the new and innovative, in processes as well as in equipment. For
example, plastic pipe represents a rather recent development which has
found wide application in various types of systems, some of which date
from a much earlier period. One outstanding and singularly important
fact can be noted in a retrospective analysis of water and wastewater

322
technology and management in developed countries, and that is that tremen
dous health benefits have resulted wherever use was made of appropriate
and adequate means for purification of drinking water and for disposal
or treatment of wastes.

CHAPTER VII
Water Supply and Treatment
In LDC's it is not always possible to provide the population with
drinking water that satisfies DC standards. The first concern may
be to make adequate amounts of water easily available. With regard
to water quality, resources and capabilities must be weighed in order
to derive standards suitable to a particular situation, with patho
genic purity being an important consideration. The determination of
standards for potable water and water treatment relates to economic
feasibility and to in-country ability to provide operational skills
necessary for water analysis. When more sophisticated treatment pro
cesses are used, the need increases for better analytical support.
In general, in an LDC situation, costly and complicated equipment
should be avoided.
As an LDC develops or changes with respect to its industries or
type of life-style, additional measurements (attributes) of the quality
323

324
of drinking water will be required, and the acceptable level for each
attribute will also be subject to change. At least, in DC's the
pattern of change has been toward more restrictive standards, moving
for example, from limits on simple turbidity and coliform bacteria
to the identification of organic chemicals, toxic metals, or viruses.
It is.of interest to note that although in the United States great
reliance has been placed upon chlorine for the removal of pathogens,
the presence of chlorine has been implicated in the production of detri
mental health effects, and dechlorination has been advocated.
In the first section of this chapter, emphasis is placed on
"Water Supplies in Rural Areas of Developing Countries"; however,
application can be made to nearly all but the largest settlements.
Examination is made of some of the possible causes for failures in the
area of potable water supply in LDC's. Information is provided on
water consumption, sources, treatment, and transport and distribution.
To furnish this article complementary material was included from two
original publications which were greatly reduced-and-rewritten—for
adaptation to the iimits of this text.
The second section of this chapter provides a study of a sand
filter in Thailand. Details are given related to its design and opera
tion. The original publication was condensed and rewritten for inclu
sion in this text.
The third section in this chapter is an article which was prepared
especially for publication in this volume. It presents certain advan
tages, disadvantages, and design criteria for small wells, and slow
and rapid sand filtration with particular application to developing
areas. When feasible, recovery of groundwater is suggested as the

325
most desirable source for domestic supplies, since any pathogenic
organisms will generally have had sufficient time to die away, and
the result will be a hygienically safe water. Slow sand filters
present a choice method of treatment in LDC's since they are uncompli
cated in management and maintenance, utilize unskilled labor, and have
a tremendous purifying capacity. Although slow sand filters have great
advantages for developing countries, the advantages of rapid sand fil
ters are that they show greater adaptability to more turbid waters and
have smaller land requirements.

VII.1.
WATER SUPPLIES IN RURAL AREAS OF DEVELOPING COUNTRIES (PART ONE)
L. Huisman
INTRODUCTION
In rural areas of developing countries the efforts involved in
obtaining water for domestic purposes are often tremendous, while in
most cases the water is unreliable and properly speaking should be boiled
before drinking, at the same time exercising the utmost care, to prevent
post-contamination. This is seldom feasible, with the result that the
water supply itself endangers the health of the people concerned.
Many governments, often with outside aid, have taken it upon them
selves to improve this situation, to provide a better source at a shorter
distance from the consumers. In the past these efforts were not always
successful, and it is wise to recognize the underlying causes for failure.
As most important, the following may be mentioned:
a. Particularly in non-market economies the people are extremely
poor, and for a water supply as a self-paying proposition, only
the cheapest methods are available. Even these may prove too
expensive, meaning that in rainy periods the population goes
back to their former, unreliable sources, negating any health
benefit the public supply has brought. Neither is providing
Treatment Methods for Water Supplies in Rural Areas of Developing Countries. Prepared in Delft, The Netherlands, at the University of Technology, for Norman: University of Oklahoma Bureau of Water and Environmental Resources Research, 1975. (52 pp.).

327
the people with water free of charge a solution. It makes them
indifferent and causes high consumption, resulting in a waste
water disposal problem.
Bacteriological pollution of surface water is not recognized.
This can result in a rejection of groundwater which would be
bacteriologically safer, if it has a bitter taste due to small
amounts of iron and does not satisfy more obvious criteria for
consumer acceptance. Any public water supply scheme should there
fore be preceded and accompanied by a campaign to inform the
population. Trained personnel speaking the local language are
indispensible for this but are seldom available in the numbers
required.
Only in (large) cities is it possible to engage the artisans
and technicians necessary for operation and maintenance, and
even here organisational and managerial skills are in short
supply. In rural areas recruitment must be done locally, and
an intensive training programme is now required. After the
contractor has left, the operator is on his own. He can only
do a good job when the installation is simple and its technology
is as much as possible adapted to local skills. For the water
supply itself, lack of adequate operation and maintenance is
the most frequent cause for failures. For example, when a dug
well is equipped with a pump but repairs cannot be effected by
personnel in the Immediate neighbourhood, the well cover will
eventually be removed and the water abstracted with rope and
buckets.

328
d. It should be realized that safe drinking water is not enough
to prevent the spread of water related diseases. Nature has
many other possibilities in store, and people should learn how
to avoid them. This is only possible by providing primary edu
cation to all children of school-going age. Because of the lack
of adequately trained teachers, however, this is a dream that
will not be fulfilled in the present century.
Taking all the above-mentioned factors together, it is clearly
impossible to provide the rural population of developing countries with
drinking water that satisfies western world standards. Here the first
concern of the water engineer should be the quantity of the water, making
adequate amounts easily available. As regards water quality, he should
do the best he can, at the same time avoiding complicated and costly equip
ment and never aiming at perfection. As prevention is better than cure,
he should first of all give his attention to groundwater recovery, when
necessary, spread over various sites or increased in yield by artificial
recharge. Private supplies, one for each family, greatly reduce the pro
pagation of waterborne diseases and should be given high priority, while
for a dispersed population they often form the only possibility. Flowing
rivers are able to carry local pollution over distances of tens of kilo
meters up to a few hundred kilometers, and treatment of such a water is
always necessary. Appropriate technology should now be applied, commen
surate with the skills and materials locally available as well as with
the prevailing social attitudes. Involvement of the local population,
finally, is a pre-requisite for success, and great care should therefore
be given to obtaining and maintaining good communication with the local
political and religious leaders.

329
To provide a region with a public water supply, a raasterplan is
necessary, followed by detailed feasibility studies on technical, finan
cial, organizational, and managerial aspects. Before the water engineer
can start his work, many investigations should have been carried out,
some of which are extremely time consuming and require the help of high-
level (perhaps foreign) experts. In many cases the project cannot
suffer the delay, neither bear the cost, of such data collection, and
the water engineer has to start from scratch, using his ingenuity to
solve the problems as they arise. His capabilities are now the deciding
factor for success or failure, and all pains should be taken to select
the best man available.
As indicated by the title of this paper, the contents will be limited
to rural supplies, unpiped for a dispersed population having only small
nucleated settlements and piped for (larger) villages. Public water
supplies to cities are left out of consideration. Their financial scope
must be made large enough to engage properly trained personnel, allowing
the application of western technology, adapted in one way or another to
local circumstances and avoiding the sophistication that is nowadays
required, to save through the use of unskilled labour.
WATER CONSUMPTION
Water is indispensable for life. To perform its physiological
functions properly, the adult human body needs two to five liters per
day, depending on climate and work-load. Water is also required for
other duties, for cleaning cooking or eating utensils, personal hygiene,
laundry, or housecleaning. Strange as it may seem, the latter amounts
do not vary much with the household size, allowing the calculation of the

33Q
total consumption per family as
Q = q + n q ^ o c
with n as the number of family members. This relationship was first
discovered for the city of the Hague in the Netherlands, giving
Q = 120 + n(50) liters/day
and meaning for a family of four an average per capita consumption of eighty
liters per day. From data provided by White, Bradley, and White (3, p. 123)
about water consumption in Tanzania the following formulas may be derived:
unpiped households Q = 25 + n(5),
households with piped connections Q = 200 + n(80).
This means for a family of five an average per capita consumption of ten
and 120 liters per day, respectively. Already from these figures it
will be clear that consumption increases tremendously when water becomes
more easily available. In the case where consumption has previously been
low, the provision of more water decidedly improves health, either by
reduction of disease through greater use of water for washing or by growing
of food supplies. When consumption has already been high, however, a fur
ther increase in water supply must be considered as a luxury item which
will be used for car washing, watering of the lawn or similar non-essential
purposes. Moreover, it should be realized that a major part of the domes
tic water supply is converted into sewage. As long as the per capita con
sumption is small, less than about twenty to forty liters per day depending
on soil conditions, disposal is easy, using cesspools and soak-away pits.
With higher consumptions a system of sanitary sewers is required, and these
are rather expensive to construct.
Taking the above mentioned factors into account, it is proposed to
base water consumption in rural areas of developing countries on the

331
following formulas. The average per capita consumption for a family of
five is q.
Unpiped supplies —
minimum Q = 10 + n(5) q = 7 liters/day
adequate Q = 30 + n(7) q = 13 liters/day.
Piped supplies with standpipes —
Q = 50 + n(10) q = 20 liters/day.
Households with piped connection —
small village Q = 100 + n(20) q = 40 liters/day
large village Q = 125 + n(25) q = 50 liters/day.
In tropical climates the variation in daily domestic consumption
is less than in temperate ones, while the variation in hourly consumption
is somewhat larger. For piped municipal supplies with standpipes and
for piped household connections, about the same capacity is required
for the distribution system and only a slightly larger clear water storage
is required in tropical compared to temperate climates. With unpiped house
holds on the other hand, the pattern of daily consumption may be schematized
as follows:
30% during one hour at the beginning of the day,
30% during one and one-half hour at the end of the day,
40% more or less evenly divided over the remaining daylight hours.
This means a ratio between maximum and average hourly consumption equal
to a factor of no less than 7.2, while the clear water storage necessary
to flatten out the demand variations rises to one-half of the daily con
sumption. This certainly increases the cost of water supply. Money could
be saved with an alternating supply which would provide each sector of
the community with water during two hours per day only. The serious dis
advantage must be mentioned, however, that during the remaining twenty-two

332
hours, the distribution system is without pressure, thus allowing polluted
groundwater to enter the system through the always present leaks. In
this sense, the water supply becomes a menace to public health.
WATER SOURCES
Hydrological cycle. Water is indispensable for men, plants, and
animals, and in this respect it is very fortunate that enormous amounts
are available on the earth. However, only 0.62% of these amounts are
fresh water, and only 2% of the latter quantity is surface water in rivers
and lakes where it is easily demonstrable and seizable. Luckily, the
water on the earth is not at rest, but in a continuous circulatory move
ment, whether as water vapour in the atmosphere, as surface water in
streams, lakes, seas and oceans or as groundwater in the interstices of
the sub-soil. There is a never-ending transformation from one state to
another, known as the hydrologic cycle (Figure VII.1.1.)• Water from the
atmosphere falls to the ground as rain, hail, sleet and snow. Some water
is exposed to evaporation while some is consumed by vegetation (transpi
ration losses). That which remains either flows over or directly beneath
the ground surface to open water courses, or else moves further downward
through the aerated upper strata of the earth until it reaches the ground
water table and recharges the groundwater supply. This groundwater is
not stagnant, but flows through the soil in the direction of the down
ward slope of the groundwater table. Sooner or later it appears again
at the surface, in the form of springs or as groundwater overflow into
rivers and lakes. The smaller streams combine to form larger rivers which
carry the water to the sea. Here, evaporation returns it to the atmosphere,
and the cycle begins once more. It takes nearly three centuries on the

333
^CONDENSATION
' •. • • '
PRECIPITATION
SNOW'
^>. I % Q •* ^
" ^ P f i / j I % .
SOURCE | OF ENERGY
TRANSPIRATION
t t t EVAPORATION
t i l t OVERFLOW• RIVER
GROUND-WATER FLOW " tXAJ>_
-OCEANri_ INFILTRATION
Fig. VII.1.1. Hydrologic cycle.

334
average for the fresh water stock on the land surfaces of the world to
be replaced by new water coming from the sea.
Water for domestic use may be abstracted from the hydrologic cycle
at various points: as roof drainage before it reaches the ground, as
ground catchment before it runs off or percolates downward, as groundwater,
as springwater at the point of re-emergence to ground surface, and as
surface water from rivers and lakes. To these natural possibilities may
be added man-made ones such as abstracting water vapour from the atmosphere
by condensation and creating or increasing groundwater supplies by induced
or artificial recharge. Not all these possibilities are available every
where or at all times, and each of them has special advantages and dis
advantages. They will be described in more detail in the subsequent
sections.
Rainwater. Assuming an annual rainfall of 0.5 m and a roof catch
ment (Fig. VII.1.2) with an efficiency of 80 to 90%, an amount of 0.425
m3/m2 per year becomes available. For a family of five with minimum require
ments (see "Water Consumption" above) the consumption equals thirty-five
liters per day or 12.8 m /year for which a catchment area of thirty m
is sufficient. In case the rainless period has a duration of one-half year,
theoretically a storage of 6.4 m3 is required. Taking into account evapo
ration losses this amount must be raised to 7.5 m , which may be accommo
dated in a cistern two meters in diameter with a depth of 2.5 meters, for
example. Often storage tanks are covered or filled with rocks or sand
to reduce evaporation. When water requirements are larger, ground catch
ments may be used. For the same rainfall of 0.5 m/year, an efficiency i
of 60-80% and minimum requirements of 65 liters/day, the required area
for catchment rises to 68 m2 and the necessary storage area to 14 m3.

335
F i g . V I I . 1 . 2 . Roof catchment.

336
In general, the size of the catchment area will provide no problems,
but the volume of the cistern is too large an effort for a single family.
For a small village or a limited sector of a larger one, filter cisterns
may be applied (Fig. VII.1.3). Rainwater harvested with the help of ground
catchments will always be polluted by bird droppings, by wind-blown dust,
and when left unprotected, also by the excrements of animals. This is the
reason that cisterns equipped with sand filters are beneficial, able to
produce a clear water which in many cases will also be fairly reliable
hygienically.
Springwater. Groundwater is the best source for domestic supplies.
Since it was born as downward percolating rain or river water, tens to
hundreds of years have elapsed during which all pathogenic organisms have
died away, resulting in a hygienically safe water. Groundwater does have
the disadvantage that it is invisible and therefore unknown and that for
its recovery more or less elaborate works are necessary. These drawbacks,
however, do not hold true for groundwater that returns to the ground sur
face in the form of springs where it is directly recognizable and seizable.
Looking only at the etiology of springs, four different types may
be distinguished, shown together in Fig. VII.1.4. The depression springs
on the left of this figure are rather variable in yield, while in dry
periods and with a lower groundwater table, they may cease to flow alto
gether.
To maintain the hygienic purity of springwater, it must be recovered
in such a way that any possibility of pollution is avoided. This is done
by enclosing the spring with a concrete or masonry structure to protect
the water from such things as pollution or mud. An interesting possibility
is the use of drains or perforated pipes driven more or less horizontally

337
r . . . . ; , •»•>: . ' • ; .<•:. • . • I . P T T M P
'•;.' • • •' • • \ fflmwmFiiSm
»:iX\\\\ \ XWWVivy. • . . . • . . • . - • • ' . . . • • . . • • • • • • % . . • • • • . • . « • » • • • • • •
" " . " . " • ? • . * • • • • * • » • " " . . • •* * . . ' . • • " • " • • • ' • ' • • ' . • . • • . . • • • • . • * • " • • . . • . • • • • • • • • . # • . » . ' • ^ . • . • • • • • « • •
Fig .VII .1 .3 . Cistern.

338
GRAVITY DEPRESSION SPRING GRAVITY CONTACT SPRING
ARTESIAN DEPRESSION SPRING ARTESIAN CONTACT SPRING
Fig.VII.1.4. Springs.

339
into the hill side, whereby protection against pollution from ground
surface is easier to obtain.
Groundwater. As mentioned before, groundwater has the enormous
advantage of being safe in bacteriological respect. To this it must be
added that under suitable conditions it can be recovered at many places,
including the immediate neighbourhood of population clusters, shortening
the distance it must be carried to the various households. Thus, indivi
dual supplies, one for each family, may also be considered, in which case
they will be kept in better condition while the consequences of pollution
are appreciably less.
Dug wells for groundwater abstraction are so simple in construction
that they can be made by local artisans from local materials without
specialized equipment or skills. As a consequence of their method of
construction, dug wells have a diameter large enough for a man to work
in, at least one meter, by means of which they are able to store great
quantities of water, thus allowing periodic abstractions at a larger
rate than that of the groundwater actually flowing into the well. There
are many materials suitable for linings, masonry, brick work, steel and
timber all being used in various parts of the world according to circum
stances; but for widespread use, there are great advantages in utilizing
plain or reinforced concrete. Timber lining rots and requires frequent
renewal, particularly above the water line. It can be rendered more
resistant to decay by means of a waterproof coating or another suitable
preservative.
To prevent pollution of the groundwater abstracted by a dug well,
the curb must be water tight over its upper part, if possible to a depth
of a few meters below the lowest groundwater level during operation. To

340
protect the water inside the well against pollution by wind blown material
or by objects falling into the well opening, a tight cover made of durable
material is a strict requirement. This precludes water abstraction by rope
and bucket, and a (hand) pump must be installed. Due to wear and tear,
this pump is bound to fail after some time of use. Consequently, in the
neighbourhood a reserve pump must be available as well as the skills to
install it. When the upper soil layers are stiff, clay for instance, the
annular space produced around the well during sinking will not be self-
sealing and must be filled with grout to prevent incursion of surface
drainage around the well perimeter. Around the well an artificial mound
is desirable, provided with pavement to let rain and spilled water flow
away from the well as quickly as possible.
When water has to be tapped at greater depths, tube wells must be
used. For depths of a few tens of meters, driven or jetted wells offer
an attractive solution, but they do have the disadvantage that all mate
rials must be imported. For larger depths drilling methods have to be
applied. In western-type countries, reverse hydraulic rotary drilling
is used almost exclusively, but for developing countries percussion meth
ods are better suited. They are certainly slower and more labour inten
sive, but on the other hand they are safer, more reliable, and require
less skilled personnel. Tube wells require little in the field of sani
tary protection. Due to the great depth at which the scrcer. is set, the
groundwater is reliable in bacteriological respect while the small diameter
of the casing makes pollution prevention of the water abstracted quite
easy.
Surface water. For rural supplies in developing countries, surface
water sources show many disadvantages. Rivers are not r.c.ays pet«.T.;Yl2i.

341
By contact with human and animal life the water is polluted and always
needs treatment before domestic use. It is only locally available, and
when it is situated at a distance from the community, at least a pumping
station, pipelines, and standposts are required- Individual supplies
thus are not feasible utilizing surface water sources.
The least objectionable solution is the abstraction of water from
natural or artificial lakes. Here the water is at least clear, and when
it is abstracted at some distance from the shoreline the pollution is
rather small, so that adequate treatment may be effected by slow sand fil
tration alone. In the case of river water, turbulent mixing results
in about the same quality of water over the full cross-sectional area, and
abstraction near the shore will show little disadvantage. In particular
with turbid waters, an extensive treatment will be required, comprising
at least plain sedimentation and slow sand filtration and under more severe
conditions chemical coagulation, flocculation, settling, rapid filtration
and disinfection. In such instances the help of foreign firms is often
required for construction, while for operation imported chemicals, tech
nical expertise and managerial skills roust be available. To prepare for
the failure of the river water in quantitative or qualitative respect
during dry periods, storage reservoirs must be constructed. These reser
voirs offer the added advantage of quality improvement by self-purifica
tion, and in such instances simpler treatment methods may be used than
otherwise would be required.
A protected river intake is shown in Fig. VIII.1.5, a vertically bent
pipe within a stone caisson close to the shore. The caisson protects the
intake against such things as flowing water, floating wood, or shipping.
The stone caisson should extend above the highest water level. With such

342
HIGH WATER LEVEL'
LOW WATER LEVEL >
TO PUMP HOUSE
an n
n
Si in
n
M
u &
•4
I Fig.VII.1.5. Protected river intake (schematic, not to scale)

343
a design it is easy to reach the intake grid for control and cleaning.
A pond or lake intake is shown in Fig. VII.1.6. This floating system
has the advantage that it avoids intake of floating dirt and mud from the
pond or lake bottom. The flexible joint of rubber or plastic can present
difficulties and has to be renewed from time to time (2).
Artificial recharge. Artificial recharge may be defined as the
planned activity of man whereby surface water from streams or lakes is
made to infiltrate the ground to increase the recovery of groundwater.
The methods of artificially increasing groundwater supplies may be classi
fied into two broad groups:
a. indirect methods, in which increased recharge is obtained by
locating the means for groundwater abstraction as close as prac
ticable to areas of rejected recharge or natural discharge;
b. direct methods, in which water from surface sources is conveyed
to points from which it percolates into a body of groundwater.
The indirect methods are better known as induced recharge and are
commonly accomplished by inducing movement of water from a stream or lake
into the ground as a result of groundwater recovery at a short distance
from the shoreline. Schematically this is shown in Fig. VII.1.7. Pro
vided that the distance from the well, line of wells or gallery to the
river is larger than about fifty meters and that the river water takes
at least one month to reach the collectors, the water recovered will be
bacteriologically safe.
The direct methods of artificial recharge are more complicated and
require at least transportation of the water, but here the source of sur
face water and the aquifer to be replenished are separate items so that
for each the best possibility can be chosen. Depending on local

344
^ yTWO GUIDE POLES
PUMP HOUSE
Fig. VII .1 .6 . Protected pond or lake water intake (schematic, not to sca le) .

345
Fig . VI I . 1.7. Induced recha rge .

346
geo-hydrologic conditions, the actual recharge may be. accomplished with
spreading basins, with pits and shafts or by means of injection wells.
Spreading basins are the simplest to construct and operate. The quality
of the recharge water may be improved by a simple pretreatment consisting
of the use of roughing filters both preceded and followed by aeration.
The quality of the groundwater abstract'. 1 in this case can compete with
the best treatment systems available. It is, moreover, a natural treat
ment, less likely to fail with inexpert operation.
WATER TREATMENT
General. The quality of domestic water has to satisfy two require
ments; it must be safe and it should be attractive to use. Both goals
may be realized by a judicious selection of the source or by purification
after recovery. For good health the amounts of water available must also
be adequate. In some cases the amounts available may be limited by the
size of the source while the distance to the source is commonly the lim
iting factor. In the latter case, a piped supply reduces the limitations
on quantities available, but this involves large amounts of local labour
and foreign currency. When transport by gravity is not possible and pumps
must be used, the cost of construction rises further, and operation and
maintenance requires skilled labour, seldom locally available.
Taking the above mentioned factors into account, a list of declining
preferences for sources of supply could be set up as shown below:
a. groundwater, requiring no treatment, recovered at various places
at short distances from the consumers;
b. springwater, requiring no treatment, recovered at some distance
and carried to the consumption area by a gravity system;
c. groundwater, requiring simple treatment, recovered locally;

347
d. individual rainwater supplies;
e. springwater, requiring simple treatment and a gravity supply;
f. lake water, requiring simple treatment, recovered at some dis
tance and carried to the distribution area by a pump-driven
piped supply;
g. water from rivers, requiring extensive treatment and pumping
to the supply area.
Springwater and natural or artificially recharged groundwater sup
plies are hygienically safe, but when they are anaerobic, they may con
tain concentrations of iron and manganese which are too high. Removal
may be accomplished by aeration, sedimentation and mechanical filtration.
Slow sand filters may be applied for the treatment of surface water with
little turbidity or for groundwater or rainwater polluted during or after
the process of collection. For river water with a high concentration of
suspended matter and perhaps a large load of organic and bacteriological
pollutants, a number of unit operations must be set one behind the other,
such as plain sedimentation, chemical coagulation with flocculation and
settling, and rapid filtration with disinfection or slow sand filtration.
When considering treatment systems, it should be realized that one
treatment may be able to perform various functions. For example, slow
sand filtration contributes to clarification, deferrisation and removal
of pathogenic organisms. On the other hand, one purpose can be served
by different treatments, as in the case of the removal of suspended mat
ter which may be accomplished by sedimentation as well as by filtration.
Aeration. Aeration is the process whereby water is brought into
intimate contact with air for the purpose of raising the oxygen content,
lowering the carbon dioxide content and removing obnoxious gases such

348
as methane and hydrogen sulfide. Aeration may be necessary for groundwater,
but when it is required for surface water this indicates such heavy
organic pollution that a better source should be sought.
Methods of aeration may be classified into three broad groups, water
fall aerators, bubble aerators and mechanical aerators. With waterfall
aerators the water falls through the air in fine droplets or thin sheets.
These devices are the simplest to construct, give excellent results and
should therefore be preferred when working under more primitive condi
tions. Waterfall aerators may be constructed as spray aerators with
upward or downward water outflow, as multiple tray aerators or as cas
cade aerators, the latter having the advantage that the loss of carbon
dioxide can be kept small. Spray aeration requires an elaborate pipe
distribution system to deliver the water to the various nozzles, making
its construction rather expensive. Multiple tray aerators offer the
cheapest and simplest construction, requiring little space and performing
an excellent job both with regard to oxygen absorption and removal of
undesired gases. Cascade aerators require more space (loading 20 to
100 m3/hour per meter width) and are more expensive to construct but
must be used when the water recovered is in carbon dioxide-bicarbortate
equilibrium, meaning that a loss of carbon dioxide would result in a
precipitation of calcium carbonate.
During aeration the water must be protected from pollution by con
tact with people, animals or wind-blown material. This may be accom
plished by locating the aerator in a fenced-in pasture and removing all
shrubs and trees to a distance of about thirty meters.
1 When groundwater is anaerobic and needs aeration, it may also con
tain minerals such as iron and manganese in amounts too high for domestic

349
use. During aeration these substances are converted to insoluble ferric
or manganic oxide hydrates, which may subsequently be removed by sedimen
tation or filtration.
Plain Sedimentation. In a flowing river, a classification of undis
solved particles takes place. Those with a mass density less than that
of water accumulate at the surface. Particles much heavier than water,
such as sand, are transported rolling and tumbling over the river bottom,
while particles with a mass density only slightly larger than that of
the surrounding fluid are kept in suspension by turbulence and bottom
scour. River water intakes can be constructed in such a way that the
abstraction of floating matter or bottom transport is avoided. It is
impossible, however, to prevent the carrying along of suspended particles,
meaning that the water taken in may be turbid and thus unacceptable as
drinking water.
Removal of turbidity may be accomplished in different ways, plain
sedimentation being the simplest. The water to be treated flows through
a tank of large cross-sectional area, creating a state of virtual quies
cence. This allows the particles slightly heavier than the fluid to move
downward and accumulate at the bottom of the tank, and the water leaves
the tank in a clarified condition. For particles which do not tend to
coalesce during settling, the overflow rate, that is the ratio between
the amount of water to be treated and the surface area of the tank, is
the deciding design factor. The depth of the tank is of little importance
and may be kept quite small, one meter for instance. For flocculating
mud particles, the purifying effect also depends on the detention time
and requires a greater depth, two meters or more when possible. To
avoid short-circuiting, the ratio of the length to the width of the tank

35Q
should be quite large, from three to six. For the same reason, the
inflow and outflow of water should be divided evenly over the whole
width. This can be accomplished quite easily with straight weirs.
Basins for plain sedimentation can be constructed as simple, dug
basins with an overflow rate of one to ten meters per day. Assuming
common values of two ra/day overflow rate, a village of 1000 inhabitants
and a per capita per day consumption of thirty liters, the pond required
would have the following dimensions: 1.5 meters in depth with side
slopes of 1 to 1.5, a bottom width of two meters and a bottom length of
10.5 meters with 7.5 meters between the inlet and outlet weirs (Fig.
VII.1.8). For cleaning by draining, drying and excavation of the accumu
lated material, two such tanks should be constructed, so that one may
be used while the other is cleaned.
It should be realized that plain sedimentation alone is seldom suffi
cient to produce a water of the desired clarity and that this treatment
is superfluous for water abstracted from lakes or from storage reser
voirs.
Chemical coagulation, flocculation and settling. The efficiency
of plain sedimentation is greatly enhanced and also extended to colloi
dal matter (including colour), when the suspended particles in the raw
water can be made to coalesce, thus forming larger floes with a higher
rate of subsidence. In case these particles carry a (like) electric
charge, this process requires the addition of chemicals. Commonly three-
valent iron or aluminium salts are used for this purpose, which after
dissolution in the water form micro-flocs almost instantaneously. By
stirring (flocculation) these floes combine with the suspended matter
naturally present in the water, producing the desired aggregates of high

351
:•
rn
LL
Fig. VII.1.8. Plain sedimentation with dug basin.

352
settling velocity (25-75 m/day). By means of subsequent sedimentation
these fiocs can easily be removed.
In the description given above, a number of different operations
can be distinguished:
a. acquisition and storage of chemicals;
b. dosing of chemicals in an amount dependent on the quantity
and quality of the water to be treated;
c. mixing of the chemicals with the water;
d. flocculation;
e. settling.
In rural areas of developing countries it is difficult to obtain
chemicals from far away places, while the lack of managerial skills can
endanger the continuity of the,supply. In some areas, however, locally
available materials can be used either as found or after simple modifi
cation. Even in those countries where no bauxite is available, it is
possible to produce alum sulfate locally using simple clay or (kaolin)
as raw material. Some natural organic products like starch, gelatin and
alginates can be used as coagulant aids. In Western Europe, for example,
an extract of potato flour is used for this purpose.
The amount of chemicals needed per unit volume of water varies with
water quality, that is, with the time of the year, and the proper amount
is fairly complicated to assess correctly, in particular when the acidity
of the water needs adjustment. This problem can be made somewhat easier
to solve when coagulating chemicals are used which are able to work within
a wide pH range and which are rather indifferent to the size of the dose.
For the addition of the chemicals many simple devices have been developed
which with proper care are able to work to satisfaction. Mixing of the

353
chemicals with the water is done most efficiently by mechanical means
(flash mixers), but adequate results can also be obtained through hydrau
lic mixing. Hydraulic mixing is most efficient with a hydraulic jump,
but in many cases the turbulence downstream from an overflow weir is
also able to do the job. Modern flocculators are of the mechanical type,
but hydraulic ones using the turbulence created by the flow of water
around baffles can do an adequate job and are simple to construct. Set
tling offers little difficulty. It can be accomplished in the same way
as described for plain sedimentation, with the depth somewhat greater
to accommodate the larger amounts of sludge. The effluent from the set
tling tank always contains some suspended floes, and subsequent treat
ment is therefore necessary to obtain the desired clarity. Chemical
coagulation is a complicated and expensive treatment and should be avoided
as long as possible, preferably by choosing a better source of raw water.
Slow sand filtration. During filtration through a porous substance,
the water quality is improved by removal of suspended and colloidal matter,
by reduction in the number of bacteria and other organisms and by changes
in chemical constituents. In principle the porous substance may be any
stable material, but in the field of domestic water supplies beds of sand
are used in ninety-nine percent of .he cases. Sand is cheap, inert, dur-*-
able, widely available and gives excellent results. As long as sand can be
applied, other materials do not need to be considered.
During the process of filtration impurities accumulate on and between
the grains of the filterbed, reducing the effective pore space, and the
resistance to the flow of water increases. After some time this resistance
becomes so high that cleaning the filter is necessary to maintain its
capacity. With slow filters the bed is composed of ungraded fine sand

354
of an effective size between 0.1 and 0.3 mm. This sand is so fine that
the suspended and colloidal matter from the raw water is retained in the
very top of the filterbed. The clogged material here may be removed and
the filter restored to its original capacity by scraping off this top
layer of dirty sand, to a depth varying from one to a few centimeters.
To increase the length of a filter-run, that is, the interval between
two consecutive scrapings, to workable values of from one to a few months,
the filtration rate must be quite small with values commonly falling
between two and five meters per day. Two units should be provided, so
that one may be used while the other is being cleaned.
Essentially, a slow filter consists of a water tight box provided
with an underdrainage system to support the filtering material. Many
solutions have been found for the construction of the underdrainage sys
tems. Bricks, stones and even bamboo have been suggested for this purpose.
However, bamboo requires frequent renewal because of its putrifying
tendency. The walls of the filter can be sloping walls dug into the earth
and supported or protected by chicken wire reinforcement and sand cement
or sand-bitumen mix. The filterbed commonly has a thickness of 0.8 to
1.3 m, while on top the water to be treated is present to a depth of 1 to
1.5 m. Inlets and outlets should be provided with controllers to keep
the raw water level and the filtration rate constant. Modern slow sand
filters tend to be of complicated design, often covered to prevent algae
growth and provided with mechanical cleaning equipment to save on labour.
Older constructions however, are also able to do a good job, while all
over the world designs have evolved to use locally available materials
and skills to the utmost extent.

355
Slow sand filters have,a tremendous purifying capacity, not to be
surpassed by any other single unit operation. They are able to supply
a water of excellent clarity, free from obnoxious dissolved impurities
and bacteriologically safe. However, the raw water must not be too
polluted, and must have only a low suspended matter content. This means
the treatment of water from lakes and reservoirs and the final treatment
after settling of river water. Slow sand filters can also be used to
advantage for the removal of iron and manganese from groundwater after
aeration.
Rapid filtration. When large amounts of water or very turbid water
must be treated, slow sand filters are at a disadvantage because of their
small silt storage capacity in the top part of the filterbed only. More
rapid filtration and filtration of more turbid waters is made possible
by deep bed filtration, using coarser and in particular more uniform
sand grains (approximately 0.8-1.2 mm). Impurities from the raw water
now penetrate to such great depths in the filterbed that cleaning by
scraping is impossible. Back-washing must be used by reversing the flow
of water. This expands the filterbed and scours the grains, carrying
the dislodged impurities to waste. Such a way of cleaning a filter is
easy and quick, and the length of filter-run may be reduced to one or a
few days. Common filter rates for rapid filters vary from 100 to 250 m/day,
that is, fifty times the rates used with a slow filter. The filterbed
area can thus be reduced.
In developing countries rapid sand filters are used either as pre-
treatment to lighten the load on subsequent slow sand filters or as treat
ment after chemical coagulation, flocculation and settling, to be followed
by disinfection only. It should be realized that rapid filtration plants

356
are quite complicated. Not only the design and construction, but also
the operation and maintenance are a matter for experts. This makes them
unsuited for rural supplies in developing countries. They can be used
where a,large number of small supplies can be integrated into a small
number of big ones. This increases the cost of transportation, but
reduces the number of treatment plants which will require expert super
vision.
Activated carbon filtration. With the preceding treatments, removal
of taste and odour producing substances is only possible to a limited
extent. Removal of taste and odour producing substances can be improved
by absorption on activated carbon for which many sources are often avail
able in developing countries. Activated carbon filtration can be effected
prior to slow sand filtration in separate units, using high filtration
rates and correspondingly smaller filterbed areas, or it can be achieved
by topping the bed of a slow sand filter with a layer of activated car
bon 0.1 or 0.2 meters thick. When the grain size of this material is
two to three times coarser than that of the underlying sand, the length
of filter-run will be greatly extended, to six months for example, com
pensating for the additional labour necessary to remove the carbon layer
prior to cleaning the slow sand filterbed by scraping.
Disinfection. Disinfection serves to kill pathogenic organisms by
chemical action. On an individual basis the hygienic quality of drinking
water can be assured by boiling. This is completely effective, provided
that post-contamination during cooling is avoided. Oxidants are most
often used for disinfection. For proper results the organic content of
the water must be small, and this is best achieved through applying dis
infection as the last step in the purification process. The majority of

357
the most widely used disinfectants cannot be applied in rural areas of
developing countries. Gaseous chlorine is too cumbersome and too expen
sive to transport over great distances, while chlorine dioxide and ozone
must be made locally, and usually the necessary skills are unavailable.
This leaves as possibilities the chlorine compounds NaOCl and CaOCl2,
as well as the halogens bromine and iodine. During storage the chlorine
compounds are partly degraded into NaCl and CaCl2, respectively, decreasing
their disinfective powers. Bromine and iodine may be lost by evaporation,
but what remains will have the same strength as before.
Dosing of disinfectants is in principle the same as for chemical
coagulation. The dosing of disinfectants must be constrained to certain
limits. Below certain levels, the disinfectant is ineffective, and above
this level the water becomes so unacceptable to the consumer that he
returns to the polluted source. Disinfection methods for village supplies
normally fall into one of two categories, pot or drip feeders.
WATER TRANSPORT AND DISTRIBUTION
Manually operated pumps usually must be obtained from outside the
local community. Once they have been installed they need only simple
maintenance, and their length of useful life is long. Internal combustion
engines must be imported and their proper operation and maintenance is
fairly complicated an<l jn many cases cannot be entrusted to the local
population. They also require fuel, creating additional financial and
managerial problems. When possible, locally available energy sources
should therefore be sought. In some instances good results have been
obtained with wind or hydraulic power.
For rural supplies in developing countries small diameter pipes will
suffice, and they are best made of plastic or asbestic cement, depending

358
on local circumstances. For a gravity supply operated twenty-four hours
per day, the distribution capacity need not be larger than the average
consumption per second, provided that an elevated storage tank is installed.
With a distribution supply operated twelve hours per day, the capacity of
the pipeline must be doubled while the clear water storage may be reduced.
To prevent a sewerage problem from arising it is essential to keep
water consumption down, and this can best be achieved by limiting the
number of house connections and serving the majority of people with stand-
pipes. This also allows a simple lay-out of the distribution system with
a minimum number of auxiliaries, thus limiting the. cost of construction
and facilitating maintenance and operation.

359
VII.1. (Continued)
WATER SUPPLIES IN RURAL AREAS OF DEVELOPING COUNTRIES (PART TWO)
Willem van Gorkum and Kees Kempenaar
PLANNING AND DESIGN
Finance is usually a difficult item in the planning and designing
of drinking water projects in developing countries. Many water projects
are started with international bilateral or multilateral aid. A dis
advantage of this finance system is the dependence of the developing
countries on the fund-giving country. For example, it is usually the
practice that developing countries have to buy the materials and equip
ment which they need for the project from the country giving the support.
Another disadvantage can be that some developing countries spend those
funds on expensive and overly-sophisticated supply plants. A good finance
system for village drinking water projects has been applied in South
America. The first village sets up a drinking water project from outside
funding, and after the start of water delivery the village pays back the
funds. Then a second village uses the funds returned by the first village
to start its own drinking water project. As this process is repeated,
the funds needed to start only one programme can be used for a whole
region.
When initiating planning and designing one needs data on the popu
lation, the region and the raw water sources. A knowledge of historical
consumption patterns including peak demands, and average total and per
sonal demand is important. Population inflow and outflow have a great
Rural Water Supply in Developing Countries. Prepared in Delft, The Netherlands, at the University of Technology, for Norman: University of Oklahoma Bureau of Water and Environmental Resources Research, 1975. (210 pp.)

360
influence on the total consumption, just as do agriculture (irrigation)
and industrial development. A new or improved water supply usually will
mean higher consumption patterns. According to White, Bradley and White,
there are at least seven factors affecting the amounts of water withdrawn
by individual households: the size of the family, income level, educa
tion, cultural heritage, character of water supply, cost of obtaining
water as measured by energy or cash expenditure, and climate and terrain
(110). Moreover, some demand occurs as a result of leakages and waste
in the system. Livestock and gardening can also be important factors
in water demand in rural areas.
Because of limited financial resources rural water systems in most
cases serve their consumers predominantly through public standposts and
only selectively through house connections. Generally we can say that
when there is a supply in the house or courtyard, the demand may be five
or more times greater than when water has to be withdrawn from a public
standpost. If water has to be carried a considerable distance, more
than one mile for instance, consumption may fall to as low as five liters
per capita per day, which approaches the minimum necessary to sustain
life. Limiting a piped rural supply may inhibit desirable expansions,
but designing on urban or semi-urban scales will be an unrealistic over
investment. Moreover, piped supplies into rural homes may precipitate
problems of wastewater disposal sooner than they can be solved.
A review of some standards of water use extracted from national
publications or from available project reports shows figures of about
forty to sixty liters per capita per day where public standposts are
used, and a greater range of from about fifty to 200 1/cap/day for house
connections. Figures for traditional sources, including wells and springs,

361
range from five to thirty 1/cap/day (47). The World Health Organization's
Statistical Report gives data on average daily consumption in rural areas.
(See Table VII. 1.1.) Evaluation studies show that the price of water ha.-*
a great influence on the consumption pattern.
The problem of energy supply is an important item for water supply
projects, especially in developing countries. For example, oil energy
is very expensive and can present supply problems. A low cost local
energy source solves these difficulties. In the future, wind, water
power (the hydraulic ram) and sun energy may provide suitable energy
sources.
DATA .COLLECTION
The capacity of raw water sources. A good design of any water
supply starts with the identification of the alternative raw water
sources. Reliability, the ability to deliver sufficient quantities
365 days a year, is the most important factor in the choice of raw
water sources to prevent consumers from being driven to other, unsafe
source 3 in periods of water shortage, thereby counteracting the advan
tages 3f their safe supply during the remainder of the year.
An organized data collecting programme is of the greatest impor
tance in the national and regional programming for water supply in the
developing countries. For precipitation as a source we need to know
the quantities and the spatial and temporal distribution of rain and
snow. When we use surface water from streams, lakes or reservoirs, we
want to have data on evaporation, and on the quantities and distribu
tion oi surface runoff. For groundwater use we need data on the quanti
ties ard distribution of soil moisture and on the location and proper
ties oJ: the different ground layers. The collection of such data could

TABLE VII.1.1
AVERAGE DAILY CONSUMPTION IN RURAL AREAS (Liters per Capita per Day)
Africa
Southeast Asia
Western Pacific
Eastern Mediterranean
Minimum
15
30
30
40
Maximum
I- 35
70
I ' ' J
85
Europe (Algeria, Morocco, Turkey)
Latin America and the Caribbean
World Average
20
70
35
65
190
90
SOURCE: World Health Organization statistical report.

363
be undertaken most economically through the use of integrated measurement
and observation systems. Photogrammetry and remote sensing techniques
are methods which deliver some data in a quick and easy way. Equipment
can be used for test drilling, water analysis, and measuring differences
in ground elevation, distances, and streamflows. Other equipment may
be used for topographic surveys, and pumps may be used for testing the
yield of available water sources. Data on the sites and seasonal delivery
of existing wells, on the seasonal pattern of riverflow, or on the exis
tence of natural springs, ponds and lakes in the neighbourhood of a
community may be obtained from local residents if care is taken in the
interpretation of this information.
The quality of water. Investigation of the raw water sources should
be made in order to determine what treatment it may be necessary to apply.
The designer must retain human health as the most important issue. For
hygienic reliability you start with the investigation of the biological
character of the water. The indicating method of the coliform group
of bacteria is well-known and widely used. The possible temperature
problem in tropical circumstances has been described by J. Kreysler (53).
The chemical character in many cases does not have such direct influence
on health as does the biological character. The physical character is
directly noticed by the consumers and is thus usually of greater impor
tance to him than the biological or chemical characteristics of the water,
although the physical characteristics may not have much influence on the
health of the users.

364
SOURCES ,
Where alternative raw water sources exist, the choice of the
preferred source is likely to depend upon reliability, safety and
economy, in that order. Water, which requires no treatment to meet
bacteriological, physical and chemical requirements and which can be
delivered to the consumer by a gravity system should be given first
consideration. Water which requires no treatment but which must be
pumped to the consumer would be the second choice. Water which requires
simple treatment but which can be delivered to the consumer through a
gravity system should be given third priority consideration. Water
which requires both simple treatment and which must be delivered to the
consumers by pumping would be the next choice (106).
Groundwater. Often one of the first steps in the improvement of
the water supply is the improvement of existing wells, by well protec
tion (surface drainage around the well and covering of the wells) and
addition of pumps. Wells for the extraction of groundwater may be class
ified as shallow or deep wells. We can almost always rely on the bac
teriological safety of the water from deep wells. The water from compar
atively shallow wells can be expected to be safe also, as long as short
circuiting is prevented. The principles of well construction, such as
digging, boring, jetting, and driving with all their variants are well
described in various handbooks(39,106).
The casings of tube wells are now often made of polyvinyl chloride
(PVC) which decreases the problem of corrosion. In some countries, how
ever, there are difficulties in cutting the very fine slots in the PVC
for the screens or strainers. The use of PVC is too expensive for some
communities. Research on the use of locally available materials is

365
going on, an example of which is the bamboo tube well first engineered
by a village farmer in Bangladesh ( 7 ) .
With the increase of tube wells, the hand dug well has become less
popular. However, the interest in dug wells is reviving. Modern mate
rials, tools and equipment, often locally produced, may transform crude
holes in the ground, host for parasitic and bacterial diseases, into
more safe, soundly engineered, hygienic and reliable sources of water.
Dug wells are inexpensive and easily constructed and maintained by fairly
unskilled labour. Moreover, dug wells will always be the best solution
for shallow, low yielding aquifers because the storage within the body
of the well itself allows the water collected during the night to be
available for use during the hours of peak draw-off the next day. They
are the best solution also for inaccessible regions where transportation
of drilling equipment is difficult. Dug wells do have distinct limita
tions, however. They cannot be used to reach groundwater at a depth
larger than twenty to thirty meters. Their capacity is usually low.
Well digging technology is understood and used in most countries, but
the art of lining wells has regressed, and there is an important need
for improved linings. The liner protects against caving and collapse
and prevents polluted surface water from entering the well. The main
problem is in lining the walls below the level of the water table.
Another need is for safer, more rapid, and more efficient digging.
The horizontal well system, an improved spring-development process,
has many possibilities for providing and conserving reliable water in
geologically appropriate areas. A horizontal well is a "cased" spring.
A horizontal boring rig is used to drill a hole and install a steel-
pipe casing into a mountain or hillside to tap a trapped water supply.

366
Drilling time has averaged about thirty-two hours per producing well.
Horizontal wells are drilled at promising sites where springs, seeps,
or traces of water are found. Occurrence of phreatophytes, dried up
springs and favorable geology are all indicators used to select the
drilling site. No pumps are needed. Horizontal wells protect against
contamination by such things as animals, dust, or erosion and mainte
nance costs are insignificant in comparison to those of other systems
for harnessing springs. If the flow is very low, a storage tank can
be added to accumulate water during the night or off-season. With ade-..
quate storage, spring sites that flow only during a few weeks in the
year may be useful. Successful yields have varied from one to 230
liters per minute; most were in the ten to forty liter per minute range.
Horizontal drilling equipment is currently manufactured which is simple,
portable, and dependable. The drilling process involves a rotary, wet
boring horizontal drill stem rig, a carbide-tipped or diamond-core drill
bit, a small recirculating water pump, a cement slurry pressure tank, a
drill water supply, and a few standard plumbing tools and supplies. Hori
zontal well drilling is quite a different technology from vertical drill
ing, and skill, patience, and field experience are required to master it
(69).
Rainwater, catchment, storage, and evaporation control. On a small
scale, such as for individual households and small villages, rainwater
harvesting is particularly suited. In arid areas it would always be a
good policy to supply public buildings such as schools and other community
centres with roof catchments and storage capacity so that the community
would have some water in storage for emergency use. The size of the
catchment area, just as the content of the storage tank, depends on the

367
intensity and the distribution of the natural rainfall and water
consumption. Theoretically, twenty-five mm (one inch) of rainfall
over 9.3 m2 (100 square feet) of horizontal surface will yield 236
litres (sixty-two U.S. gallons) of water. Allowing for losses due
to evaporation, it may be safely estimated that 190 litres (50 U.S.
gallons) will reach the storage tank.
For individual households roof-catchment will be the first solu
tion to consider, although poor roofing may call for some improvement
before being used for this method. This can be done by the inhabitants
themselves, but attention has to be given to the fact that the quality
of this kind of water supply is affected by the nature and the degree
of maintenance of the catchment surfaces and the collection troughs.
Rough surfaces are likely to retain wind-blown dust which is later
collected by the rainwater. Galvanized iron roofing provides excellent,
smooth surfaces for the collection of rainwater.
Methods of ground catchment include alteration. This means simply
clearing the slopes of a hill of rocks and vegetation, sometimes com
pacting the soil surface and making ditches or rock walls along hill
side contours. When erosion is not excessive, this can be a very eco
nomical solution. Another method is soil treatment. This can be the
use of chemicals which fill the pores or make the soil hydrophobic, but
it can also be ground stabilization with lime. This is an old technique,
now scientifically approached, whereby lime is added to the soil and
the soil is compacted. A third method is soil covering (56). The soil
is covered with waterproof membranes or asphalt layers. Sometimes the
membranes have to be covered with gravel to protect them against damage
by radiation, wind or cattle. There are many different synthetic sheet

368
materials which are very well suited for catchment purposes, but most
of these materials are oil derivatives, and their cost could increase
with the price of oil.
The rainwater storage tank consists in its simplest form of an oil
drum and in its most complex form of a reinforced concrete cistern. Some
times small reservoirs are used. To strain out suspended matter, sand
filters may be built at the entrance of storage tanks; however, one
can never rely on the safety of such water, so that disinfection will
always be necessary.
Great losses may be experienced from evaporation during storage,
particularly with the use of small reservoirs. To reduce these losses,
the adaptation of monolayers of aliphatic alcohols and other liquid
chemicals is a possibility. It seems to be very difficult to keep the
alcohol barrier intact because of wind and water action. Furthermore,
the films do not reduce the amount of solar energy which the water
absorbs, and they decrease the amount of heat normally lost, because
inhibiting evaporation also inhibits the cooling effect of evaporation.
Thus, the higher water temperature increases evaporation at any part of
the water surface which the barrier does not cover. A better solution
seems to be wax that softens due to the heat of sunlight and flows over
the water surface to form a flexible, continuous film. The film can
crack during cold weather, but the heat of the sun will reform it again.
Blocks of floating and, if possible, light coloured reflecting materials
have also been used with reasonable success. In the Sudan sand filled
reservoirs have been used. The disadvantage of this system is that the
required tank volume increases considerably. Another method is simply
to cover the tank, but it may be cheaper to build additional catchments

369
to make up for the quantity of water lost by evaporation rather than to
provide a cover. However, there could be several additional reasons
for covering, such as prevention of pollution, algae-growth or mosquito
breeding. For small reservoirs it may be economical to build deeper
reservoirs with a smaller surface area.
Surface water. With surface water sources the following points
can be of importance. Water from natural ponds and lakes would be more
uniform in quality than water from flowing streams. Self-purification
is usually less complete in smaller lakes than in large ones. Deep
lakes may throw up microsopic organisms during seasonal overturns.
Impounding reservoirs may pose algae problems near the surface, while
water near the bottom may be high in turbidity, carbon dioxide, man
ganese and occasionally hydrogen sulfide. In arid lands, due to eva
poration, the salinity of water in lakes and reservoirs can rise con
siderably. Irrigation water sometimes contains pesticides or fungi
cides used for agricultural purposes, and these additions may not be
removed by regular treatment processes.
Salt and brackish water. Several years ago P. Hoffman, Managing
Director of the United Nations Special Fund, reported that "at least
sixty of the underdeveloped countries and territories associated with
the U.N., face forms of water shortage which in time can be met only
from non-traditional sources, that is, from brackish and salt water
sources." (93) There are nearly 1,000 desalination plants in opera
tion in various parts of the world with capacities ranging from 100
m3/day to 30,000 m3/day. Despite the many research activities in the
last fifteen years directed towards improvements in technology, the
cost of water from the various desalting processes remains high. The

370
' - • , '
theoretical energy required to remove salts from a solution is a
fundamental factor given by the laws of thermodynamics so that for
reducing costs, measures are required that will reduce energy losses
and improve efficiencies through economies of scale, multipurpose appli
cation (particularly when linked to power generation), extended plant
life, and lower maintenance requirements. Even for solar stills using
solar energy the costs are high at present due to the need for large
amounts of capital and a large land area for production of even small
amounts of fresh water, Costs of desalination are from five to ten
times those of conventional alternatives, and generally desalination
should only be considered as an alternative to fresh water transported
by pipelines when pipelines longer than 200 kilometers are required.
Desalination processes include the use of evaporation (distilla
tion), membranes (reverse osmosis, electrodialysis), freezing or chemi
cal means. In rural areas of developing countries reverse osmosis and
the solar still are the most appropriate technologies ( 8 ) • Membrane
processes have certain advantages over distillation. Large metallic
components such as heat exchange pipes are not required. High capital
investment equipment such as tube rolling and milling machines are not
needed. Capital and operating costs for the small membrane plants are
about half those of distillation plants. Membrane process equipment
can be manufactured with local materials and manpower. Membrane plants
are simple to construct and operate, and there are no corrosion or scale
problems. Of the membrane processes, reverse osmosis is preferred
because of lower energy consumption, complete removal of bacteria and
viruses, little sensitivity of the process to salinity changes in brack
ish water, low maintenance requirements (except for the high pressure

371
pumps), and no requirement for highly skilled operators for plant
operation.
TREATMENT
Disinfection. Lack of money and knowledge of techniques in rural
areas of developing countries in many cases causes disinfection to be
the only feasible drinking water treatment. This means chlorination in
most cases. The pot or cartridge method of dosing utilizes a pot of
some type which is filled with bleaching powder or another disinfec-
tional substance and is hung in the water to be treated. The only oper
ation necessary is renewal of the disinfectional substance from time to
time (16, 88, 125). Greater storage capacity may be used in developing
countries to avoid transportation problems. However, as chemicals for
disinfection become overaged, the activity of the substance decreases
(17). For in-country manufacturers, small factories dispersed through
out the country would be a better solution than one big factory serving
the needs of the entire country. When distances are short, the supply
of chemicals will be frequent and storage will be less important.
Sedimentation, flocculation and coagulation. There may be some
future for tube settlers made of locally produced plastic pipes (123).
A new trend in the coagulation process is the magnesium carbonate
process (86). It is complicated but has the advantages of recycling
of coagulant, elimination or reduction of sludge disposal, additional
disinfection due to high pH, removal of iron and manganese, production
of a water with adequate hardness and alkalinity to allow corrosion
control by stabilization of the water, and potential savings in treat
ment costs.

372
Filtration. In situations of individual supply or small village
supply, simple filter systems give good results (62,120). The advantage
with these systems is that local materials may be used and the operation
is uncomplicated. The so-called drum filter is a good example. Another
example is a horizontal slow sand filter, which can be a very simple
solution for water of low turbidity, at least when there is sand avail
able in the region (57)•
Slow sand filtration is uncomplicated in management and maintenance,
utilizes unskilled labour and produces clear, hygienically reliable water
(35,46). The biological purification of slow sand filtration is better
under circumstances of higher temperature, an advantage in tropical areas.
In some cases where the raw water supply is limited, intermittent
supply is provided. For filtration plants this practice creates problems
because the bacteriological action can function in an optimal way only
with continuous filter operation. With no food the bacteria become less
in number and bacteriological purification is lessened. Intermittent
slow sand filtration can be used to retard the growth of algae, but gen
erally continuous operation is preferred.
A development in the use of slow sand filters has been operation
with alum-coagulated water ( 1 )• Declining the rate of filtration is
another development which may be an advantage in filter control (25)•
Local filter media may be used in areas with sand selecting problems
or scarcity (37). The problem of the grading of sand can be solved
by upflow during back-washing when a natural selection takes place (79)-
The multi-media filter is another way to lengthen a filter run, the
grading taking place due to the difference in weight of the different
media (84).

373
Demineralization. Demineralization including desalting may be
accomplished in rural sunny areas through a kind of distillation by
a solar still which uses solar energy. Through a transparant cover
water is warmed by sun heat. This causes evaporation and condensation
against the cover, and the condensate is collected. For individual and
for community use many experiments have been conducted in the field of
solar stills (8 ,54).
Defluoridation is a great problem in some areas. The Nalgonda
technique of defluoridation comprises addition in sequence of sodium alum-
inate or lime, bleaching powder and filter alum followed by floccula-
tipn, sedimentation and filtration (70).
WATERLIFTING AND PUMPS
In the face of possible energy shortages there can be revived possi
bilities such as windmills and animals, and in the future solar energy
may be used. One other development is the hydraulic ram. Its operation
requires the presence of different ground levels and sufficient amounts
of water (108). An important single pump engine is the Humphrey pump,
which has the advantage that different kinds of energy can be used so
that the pump can be adapted to several circumstances. A simple handpump
is sometimes a good solution also.
DISTRIBUTION
Storage. There are two different types of storage, namely, raw
water storage and clean water storage. Raw water storage, with plain
sedimentation can provide a simple, effective and self-contained treat
ment under favourable conditions. Large impounding reservoirs, natural
lakes and ponds serve such purposes in many cases. They produce multiple

374
benefits: equilization of a fluctuating flow, sedimentation of silt
and suspended matter, oxidation of unstable organic impurities, reduc
tion of colour, turbidity, and pathogenic organisms and evening out of
quality fluctuations. Sometimes sedimentation basins are provided as
the only treatment before disinfection. In those cases at least from
one to several days of settling have to be provided before the water
is drawn out for use. Long storage, however, particularly with alkaline
water, can give algae problems. Where the storage cannot be limited
to an optimum of two to three weeks, measures must be taken to control
algae, for example, copper sulphate dosing.
The clear water or service storage performs several functions in
the distribution system. As storage to provide for fluctuating demand,
it permits pumps and filter plants to operate at constant rates and
ensures economy in their size and capacity. In the case of an elevated
reservoir, more uniform pumping heads are possible which facilitates
the selection of pumping sets operating at a high efficiency. It ensures
the necessary pressure in the whole or in part of the distribution sys
tem. In emergency cases adequate storage within the system will assure
uninterrupted supply regardless of power failure, plant breakdown, nor
mal maintenance periods and fire-fighting. It allows pumping to take
place during parts of the day only.
Storage tanks, both ground level and elevated, lend themselves
readily to type designing and to the adoption of locally available skills
and materials. The avoidance of complicated pipe work, the use of thin
block or masonry skin walls filled in with mass concrete instead of the
traditional reinforced concrete design, the restriction of the number
of types and sizes to a minimum (even if this involves over-capacity in

375
some instances) are possible ways of economizing on imported materials
and on design and construction staff. Steel tanks have an advantage
in their speed of construction, but they need regular painting and do
not last as long as concrete.
If the topography is suitable, reservoirs are constructed on ele
vated ground; in other cases they are supported on towers. In tradi
tional Islamic countries there is no other tower allowed besides the
minaret, and pumping has to be chosen.
Usually, elevated reservoirs are not designed to "float on the
system." Instead, all water is pumped the full height to the top of
the reservoir and then flows to the village by gravity. This is a waste
ful use of power. However, the custom of pumping all water into the
reservoir is so ingrained that it is difficult to obtain acceptance by
engineers of the concept of direct pumping into the distribution system
with only the excess over demand going to the reservoir.
Pipes. In urban supplies more than half and usually two-thirds
to three-fourths of the total investment in the community water supply
goes into the distribution system. In rural areas the supply is in many
cases operating without any piped distribution system or with a simple
system supplying water to several public standpipes only. A distribu
tion system generally consists of pipes, accessories such as valves and
meters, and servical connections. The pressure and the amounts of water
which have to be delivered are the important parameters for the design
size and material of pipes. Generally, the choice for pipe material will
be steel, cast iron, spuncast iron, prestressed concrete, asbestos cement,
or plastic for medium and large diameters, and asbestos cement, galvanized
iron and steel or plastic for smaller diameters; copper and lead piping

376
have but limited use and for specific purposes only in home plumbing
(104).
The use of bamboo has drawn much attention, and in Indonesia this
material is used for gravity systems in rural areas. Bamboo systems
are easy to construct by unskilled labour, and bamboo is cheap in those
countries where it is available. There are, however, many problems
which have to be solved before bamboo systems can compete with the tradi
tional systems. One of the problems is that bamboo is not suited for
pressure systems since the maximum allowable pressure is about two atmo
spheres. The duration of bamboo is relatively low, from about three
to five years, although a great deal of research is being conducted to
find suitable conservation methods. Another disadvantage is the bad
taste and odour which is present in the system during the first weeks
of use.
Plastic pipe deserves special attention because of the properties
which make it suitable for adoption in developing countries. The main
advantages of plastic pipe are its relatively low cost and its suitabi
lity for local manufacturing due to the availability of raw materials on
international markets and the low cost of equipment required for the
manufacture. As for the mechanical properties of plastic pipe we can
mention the following attributes as advantages: excellent resistance
to corrosive water and corrosive soils, bacteriological inertness, low
thermal conductivity, extreme lightness, flexibility, smooth internal
surface, very low water absorption, availability in greater lengths, good
workability. The main drawbacks are the following: temperature sensi
tivity (decrease in the mechanical strength with an increase of the temp
erature) , relatively high thermal expansion, sensitivity to light

377
(ultraviolet light) and weather (weatherability), sensitivity to notches,
particularly PVC pipes, decrease in impact strength of PVC with decrease
in temperature, diffusion of odorants and other very volatile gasses
through the wall of polyethylene (PE) pipes, sensitivity to organic sol
vents such as ketones, ethers and chlorinated hydrocarbons, detrimental
effects to the water of the plastics or of additives used in manufac
ture.
Pipe appurtenances such as specials, joints, clamps, and valves and
fittings form a sizeable portion of the network system. Their quantity
should be minimized by careful design.
A very important factor in water systems design, especially in
long-range development programmes, is the standardization of materials
and equipment. Easy availability and the ability to interchange pipe
materials throughout a region or country is an asset in efficient mainte
nance.
Service connections. The change from standpipe to houseconnection
seems to be progress because of the increased convenience which results
in savings of time and effort due to the elimination of the necessity
to carry and store water. There are situations, however, where there
is no economic or social replacement for standpipes. Nevertheless,
the public standpipe has some great disadvantages. One is that the
collection of water charges is difficult because of the large number
of people supplied from the same point with different levels of service.
Another disadvantage is that the maintenance of a public standpipe is
difficult because of careless use by many people, none of whom considers
it his property.

378
One often sees in the literature reference to the great amount of
waste in the water supplies of many developing countries, either with
standpipes or with house connections. When supplies have pressure on the
distribution system only a part of the day, it is often the case that in
the beginning of the period of water delivery there is a large queue
at the standpipe and in the houses the storage tanks are being filled.
An hour later there is no one at the still flowing standpipe, and even
the reservoirs in the houses are running over with no one to attend
them. A solution for this type of waste could be the adoption of special
devices like the fordilla faucet, a spring loaded mechanism which closes
automatically after a few seconds and can discharge a fixed amount of
water each time it has been pressed. The disadvantages of this system
are the difficulties in repairing them and their need for substantial
pressure to function adequately. Another solution could be the adoption
of constant flow valves which can reduce the use from twenty-five to
thirty percent. A solution for certain situations would be metering,
where everyone would pay for the water he actually consumes. Meters
are comparatively short-lived and require testing and servicing, including
a trained staff for reading, billing and collecting. All of these ele
ments contribute to the cost of such a method. A simple and economic
solution to water conservation is the use of smaller diameters for
the pipes.
CONCLUSIONS
In large cities in developing countries the plants for treatment
of water supplies are usually fairly complicated as in more developed
countries, but these plants supply a small part of the population in
the developing countries with drinking water. Outside the large cities

379
there are a relatively small number of treatment processes used in
developing countries. Where the people are concerned about a community
water supply they consider treatment as a second stage in development,
the first stage being to find a reliable water source. In some develop
ment programmes for drinking water supplies this policy results because
of economic reasons.
In developing countries there is a shortage of evaluations of
existing plants. There are many assessment reports on countries or
regions, but these are mainly limited to general remarks on such items
as percentages of people supplied with reliable water, percentages of
standpipes or house connections, number of drilled tube wells, depart
ments reponsible for developing programmes, or financial restrictions.
There are seldom reports which give such information as a technical eval
uation of existing plants or current programmes, the technical perfor
mance of plants or parts of it, causes and duration of breakdowns, con
nection between the latest and former breakdowns, or possibilities of
repair. This kind of data seems necessary in dealing with supply of
drinking water in developing countries. Currently for most designing
of community water supplies in developing countries, reliance is placed
on the judgement of a few individuals such as staff members and con
sultants of the World Health Organization and the World Bank, on the
enthusiasm of the army of volunteer workers, or on the conscience of
those undertaking commercial projects. For many projects the planning
and construction take place under the supervision of the World Health
Organization. After the project is finished, further responsibility is
turned over to local authorities. It seldom happens that the initial
project managers obtain operating information on their former projects.

380
Proper evaluations are needed, though there is a problem in obtaining
financing for such efforts, since evaluation projects seem to have only
scientific value and not to contribute directly to the supply of more
water.

381
VII.2.
STUDY OF AN EXISTING WATER TREATMENT PLANT OF SIMPLE DESIGN AND OPERATING SYSTEM FOR SUPPLYING DRINKING WATER TO RURAL COMMUNITIES IN THE LOWER MEKONG BASIN COUNTRIES: STUDY OF A SLOW SAND FILTER
Thailand Ministry of Public Health, Department of Health, Rural Water Supply Division
INTRODUCTION
Sand filtration remains the main concern in water treatment in
Thailand. In rural areas where modern techniques and qualified opera
tors are insufficient, simply constructed and operated systems like the
slow sand filter are recommended.
The purpose of this research was to study problems associated with
the design and operation of an already installed slow sand filter. The
data and information gathered included loading, operational difficulties,
operation cost and income, process efficiency, and the population and
society of the village served. This study began in June 1975. All the
data and information collection was finished in April 1976. The report
was completed in July 1976.
The sand filter under study is located in the Sanitary District
of Nong Ko, Amphoe Kranuan, Changwad Khonkaen. The slow sand filter at
Kranuan was constructed in 1971 under the responsibility of the Rural
Water Supply Division, Department of Health. The plant is located in
the northeastern part of Thailand about 500 kms from Bangkok. The
Prepared in Bangkok, Thailand, for Norman: University of Oklahoma Bureau of Water and Environmental Resources Research, August 1976. (46 pp.)

382
construction cost including the treatment system and main distribution
pipe was about 1,100,000 haht (1 $ = 20 baht) with the government contri
bution equal to 500,000 baht and the local contribution equal to 680,000
baht.
This plant is designed to serve 9,563 people with the capacity of
100 m3 per hour. The plant is composed of two slow sand filter units,
each with'a capacity of 50 m3/hr, and there is also a space reserved
for future expansion.
The water source of the slow sand filter plant at Kranuan is a
reservoir eight kilometers from the plant. Raw water is pumped by
a diesel engine pump from, the reservoir. It can first pass into an
earth sedimentation pond (existing pond) of about 22,000 m3 capacity.
However, at this time the pond was not being used, since the raw water
quality was good with turbidity absent. Raw water was being pumped
to the filter unit directly. The water flows by gravity through the
filter, passes the filter rate control chamber and flows into a clear
well. In the clear well, a chlorine solution is fed by gravity to mix
with the filtered water before being pumped to an elevated tank. After
that, water is distributed to the consumer through main pipes of 8",
6", 4" and 2". The plant operates continuously except once a year when
the storage tank is washed.
For operation of the water supply a fourteen member sanitary dis
trict committee is in charge. The chairman is the Sheriff. There are
two operators, one with a fourth grade education and one with a seventh
grade education. They were trained by the Division of Community Water
Supply. The starting salary was 500 baht} and the present salary is
720 baht. The responsibility of the operators includes engine operation,

383
water fare collection, pipe connection, and maintenance of the system.
For major technical problems the Community Water Supply Center is con
sulted. Water fees are determined by meters (3 baht/m3) and there are
no public taps. (See Figures VII.2.1-4 for views of the filter plant.)
WATER CONSUMPTION AND EXPENDITURES
Design criteria (consumption). For
systems, the Rural Water Supply Division
teria:
plant life -
maximum day demand -
peak hour demand -
maximum pumping day -
population growth
total storage
elevated storage -
per capita consumption
Sanitary District
common village -
pipe material -
distribution system life -
minimum pressure -
Kranuan plant (consumption).
population design -
present population served -
present maximum day demand -
present average day demand -
the construction of water
has the following design cri-
10 years
1.5 x average day demand
(4.0 x average day demand)/(24)
15 hours
3%
70% average day supply
20% average day supply
80 lpcd
50 lpcd
asbestos cement, PVC, galvanized steel
15 years
10 psi at the curb, distribution.
2,000 houses, 9,817 people
271 houses, 1,725 people
144 m3
135 m3

384
o o r—
W
-e-j CO
4-1 C 0) B
u
tos
co 0)
<:
•e-I
u C 0) uia
<_>
tos
to 0)
CO
<
•e-j
4-i C <ll uia
o tos
CO 0) CO
<
•e-
=
<r en
CJ
> cu
0) alv
>
CU o
edu
a!
a cfl u
cu cu H
end
m
c
ountai
• - I o o o CO
Tap
CD U •H PM
0) 4-1 •H CO
4-1 C <fl <-* cu
l-< cu 4-1 r-4. •H PH
X I C cfl
CO
3 o
•H CO
(2 O
P-<
C o
•H 4-1 nJ 4J C 0) B
•H •o QJ
CO
U l n T T
c^o/ 0 L 2 o 0
/ 0 o 2 te°o a L ° o
.<?> Qff
HI 4-1 O U O T (
•H 4J IM U d
O <U CO
-H CU £. <D 4-1 O O >H 4J 1-1 U CU O D . r H d) ^ J i t l H CTJ
£ E « l > i - l l J 0 ) H ) J
o c u c u o o n ) o - H c
H M C O - J i T n O S O O C ^ O H N
C 3

385
•H Pn

386
o o CNI
O
o
z o
wva HiHva.
ifl
- 8 -
HVQ Hiwa
c o
o
03
3 c
•H

387
c
«
-w^-
o o CN
< 4: z o M H U w CO
ir
c o '
>
f J 3
•1
I 1
1
i
a i
jt»-
• « - ? ^ u n
<«>
lis
o o CN C
O
PQ • 1
PQ
3 O M H
en
-a-
CN
II.
>
«> •H fe
Ql

388
present peak hour demand - 10.25 m
present average pumping day - 3.43 hours
present maximum pumping day - 5.50 hours
The maximum day demand for the Kranuan pl^nt is only 1.07 of the
average day demand. Also, the peak hour demand is only equal to (1.82
x average day demand)/(24).
Referring to Figure VII.2.5 figures for per capita consumption
can be obtained. The average per capita consumption of 78.5 lpcd is
very close to the criteria of 80 lpcd set for a sanitary district.
An interesting point is that the mode (the value occurring more often
than any other among a set of observations) shows thirty percent of the
houses have a per capita consumption of 39.2 lpcd which is less than the
criteria of 50 lpcd set for a common village area. The standard devia
tion from the average is + 28.3 lpcd, thus including values lying
between 50 and 107 lpcd. The daily consumption per capita analysis does
not include the consumption by a sawmill which draws about 23~m3/day,
nor does it include consumption by the three schools which use about
5 m3/day each.
Figure VII.2.6 shows two peak hour periods of 9.5 m3/hr at 08.00
in the morning and 10.25 m3/hr at 18.00 in the evening, with the twenty-
four hour average of 5.8 m3/hr and a daytime average (06.00 - 20.00)
of 7.4 m3/hr. The data were collected from January 15 to February 15,
1976.
Expenditures. The monthly expenses can be divided into four cate
gories (see Table VII.2.1).
fuel for the raw water pump 27%
electricity for the filtered water pump 14%

389
10 15 20 25 30 35 40 45 50 55 60
Amount of Water Used (m3/month)
Fig. VII.2.5. Monthly consumption (m3/month/house).

390
06-07 08 20(8.00 P.M.)
Time
Fig. VII.2.6. Water usage pattern..

391
w oq
3
O u z
• ~ N
T*. N - ^
0) >-f
a 4J •H -a c a) & w
r H CO •U O
H
Mai
nte
nan
ce
0 0
Su
rfac
e C
lean
in
0J C
•H r J
O r H
•C U
f^ 4-1
•H O
•H M
Ele
ct
. - i
O
r H 0) 3 fa
& CO
rH cfl
- QJ
e O
Inc
nth
o s
r-~ LO 0 0
CO
1
1
o 1—1
U 1
CN
m m
i n
r~
O CM O
r H
o o r-< r H
i n
r-~ r -0 \
m
4J
a. a) w
m m o
<•
I
'
o 0 0 vO
O 0 0
m
m r
o CN
o i—i
o o r •—i
0 0
r 0 0
o\
i n r
4-1
a o
CN r H
r>» i n
1,05
0 4
23
m i»» 0 0
o\ VO
m
m r
O CN O
r H
O O r r H
ro vO CN
r H r H
m r-
> o
S3
CO CT\ r H
m
1
1
o o oo
A
r H
CN 0 0
m
1—1
o>
o CN
o r H
o o r r H
i n 0 0 C7N
r H r H
m r»»
o 0) a
m 0 0
m CO
i
I
I
r vO i n
0 0
CN
O CM
o r H
O O r-r H
0 0
ro CO
r H r H
VO
r-
C cfl
•-3
m o «* CO
I
I
I
o oo m
m o rH
o CN O
r H
O o r » r H
o CN CO
r H r H
VO
r~.
r Q
0) fa
-sT CO O
>n
i
300
o oo vo
o> VO t ^
i n t -»
o i—i
m r H
o o r . r H
r~. CO VO
VO r H
VO I - .
u CO
s
r m co <T
700
i
o 0 0 vO
CM 0 0 VO
m r-~
O CM
o i—1
o o f^.
r—4
oo a> i n
m r - H
VO
r
u (X <
-d-r H 1 ^ .
< f
1
1
o 0 0 vO
0 0 CN vO
vO
m r H
o m m r-1
o o r-» i—<
i—i
CM
o m •—I
vO r-»
>> CO
53
<r oo vO
CO
1
1
1
o\ 0 0
m
m r
O CM
o r H
O o r-% r H
oo vO VI -
CN •—I
vO
0) rt
3 >->

/o •
salary for two operators 42%
maintenance (chemical and other) 17%.
Expenditures average 4,217 bahts/month for the production of 4,050
m3/month of water. Thus, approximately 1 baht is expended in the produc
tion of each cubic meter of water. Average revenue per month is 10,563
bahts. (See Figure VII.2.7 and Table VII.2.2.)
CHARACTERISTICS OF THE FILTER
Filter design. At the time of this study, the filter was being used
only one unit at a time because the water demand was not up to the capa
city designed for the plant. While one unit was cleaned the other unit
was used. The bottom dimensions of each filter unit are 15 m x 30 m
making a total of 900 m2 for the two filter areas combined. The depth
of the filter beds are:
free board 0.60 m
supernatant water 1.00 m
sand bed (initially) 1.00 m
gravel size 5-10 mm 0.10 m
gravel size 10-25 mm 0.10 m
gravel size 25-75 mm 0.20 m
total depth 3.00 m.
The underdrain system consists of concrete blocks forming the mani
fold (0.30 x 0.36 m in size). These blocks are placed 1.5 cm apart, one
from the other. The laterals are made from 100 mm asbestos cement pipe
in sections 30 cm long. The sections are placed 1.5 cm apart, one from the
other. The filtered water flows to the clear well in 250 mm AC pipe. The
rate of filtration is controlled by a gate valve and a V-shaped weir before

393
•a o
•H u <u
c o e n a 0)
u 3
13
c (0
o a c
M M >
00 •H P4
(^qeq 0 0 0 ' I x ) 3 n T B A ^lerjsuow

394
TABLE VII.2.2
DEMAND AND PAYMENT
Demand P e r Month
(M3)
0 - 5
5 - 1 0
10 - 15
15 - 20
20 - 25
25 - 30
30 - 35
35 - 40
40 - 45
45 - 50
50 - 55
55 - 60
60 - 65
65 - 70
70 - 75
T o t a l
Consumer
Houses
44
81
45
39
14
14
8
7
8
2
1
2
1
1
3
271
%
16
30
16
14
5
5
3
2
3
100
T o t a l Amount
M3
110
608
562
683
375
385
260
262
340
95
53
115
62
68
72
4 , 0 5 0
%
3
15
14
17
9
10
7
7
8
2
1
3
1
1
2
100
Payment/Month ($)
P e r House
7 . 5
2 2 . 5
37 .5
5 2 . 5
6 7 . 5
8 2 . 5
9 7 . 5
1 1 2 . 5
127 .5
1 4 2 . 5
157 .5
1 7 2 . 5
187 .5
2 0 2 . 5
2 1 7 . 5
-
T o t a l
330
1,824
1,686
2 , 0 4 9
1,125
1,155
780
786
1,020
285
159
345
186
204
216
12 ,150

395
the clear well. The weir serves as a flow measurement device and also as
a U-tube to prevent the sand surface from drying.
Sieve analysis. It has been suggested by L. Huisman and W. E. Wood
that a degree of uniformity of less than 3 and an effective diameter in
the range of 0.15 to 0.35 mm are desirable for the sand media of slow
sand filters. In this experiment, sieve analyses were made five times of
samples from various positions in the filter. For the results, see
Tables VII.2.3 and VII.2.4, and Figure VII.2.8. A uniformity of 2.75
and an effective diameter of 0.24 mm were the average results obtained.
The two values are satisfactory within the ranges suggested above.
Rate of filtration. The rate of 100 m3/hr is the design capacity of
this plant. Since there are two units, each should run at the rate of
50 ro3/hr or at about 0.11 trt3/hr/m2 related to the filter bottom area.
The rate of filtration is adjusted by means of the valve between the fil
ter and the clear well.
In this analysis, after cleaning the surface of the sand of the
unit to be analysed the control valve was opened fully. That made the
filtration rate slightly higher than the design rate, or about 60 m3/hr
(0.133 m3/hr/m2) with the water level at 0.90 meters above the sand
surface. The raw water pump was shut down at this level. The raw water
was allowed to pass through the filter bed, and the rates of filtration
were checked again at 0.80 and 0.70 m of water level above the sand sur
face. The filter stopped running at the level of 0.50 m automatically
due to the action of the weir. This process was repeated periodically
and data were collected each time, over a total of 120 hours of filter run.
The rate of filtration corresponding to the length of the filter
run were plotted. The curves did not show clearly any signs of clogging

396
to
>* <
M > w rJ
< fj-H
> w W S M M oo aJ
w P4 PM
O X w H ^ Pd O P4
ri
<u s-s C
iH PK
ned
&-S «H <S •U CJ Prf
rH •H O CO
UH O
4-1 4= 00 •H 0) S
/~\ a 5b N - ^
4J J3 GO •H (U S
/~s S-S •*-•
•—N CO
5
H
> O 0) CO ..-1
CO 13 C rt
0) > <u •H CO
to o •N
o
60 C •iH .-N
c s 0) B O- -' ( D
in 00
oo ON
m rH
rH
m <-\ <~\
oo CO
m st
CO ON
m
m i-{
• o ON in
st
ON 00 i£>
st
m oo 00 00
m iH
rH iH
O
O •—(
r~ oo CM
m r-m m m
m o . r~~
CN in
o i — i
o o CM
CN ON
o 00
00 o ON . — i
co ON
r
m t -CM CN
m St
O CM m
r-» . p~
ON St
NO 1—1
00 NO .H
i-l
CN St
NO r
oo in
CO CN
o in
St
ON
CM i — <
ON
oo rH m
NO o • m
00 t—i
o o rH
NO rH
00 m
St 00
rH St
NO CM
00 rH
St
CM m
m m o CM m
m rH • oo NO St
o CO
ON 00 m o
rH St
rH St
ON
m oo m
m r~ vO r-H
o 00 St
vO
CN st St
NO • St
ON CO
o St
o CN St
O
r-~ m 00 CM
CO St
rH
r
St 00
CM T~i
m oo NO CO
m o CM 00 St
CM . in
st -T
m St
O m CO
o
r^ NO
o CN
ON CO
ON r-~
NO ON
r-
m 00 CN CN
ON
CN NO St
in o • o st st
O m
m ON CM
o
CO st
r-i r-t
r~ m 00 00
00 rH
ON
in CO
NO CM
ON
in ON CO
m m . ON
NO CO
o NO
o m CM
o
o
o o o o rH
CO st . <—t
i-H
00
CM CO
oo ON ON CO
o . • r-vO • CO
Z < P-i
st
CM
.23
II
DIO
.63
.2
3
II
D60
D
IO

39 7
TABLE VII.2.4
REPORT OF SIEVE ANALYSIS (AVERAGE FOR FIVE EXPERIMENTS)
U.S. No. % Finer
4 99.19
10 90.63
16 77.76
18 73.3
30 53.49
40 40.61
45 33.32
50 25.03
60 13.23
T>lQ = .24 mm.
p6Q .66 D 1 0 " .24 " l-n>'

398
<-0 IT) o oo r » vo m ~3-^ H • • • • • •
(mm) Sujuado aA3fs

399
and there were, in general, fluctuations along the lines. After forty
hours of filter run the rate of filtration increased till it again
reached the starting rate. This could have been due to any crack on the
surface of the sand. However, this phenomenon should not have happened
since the sand was never allowed to dry, being always covered with water,
and since the technician checked the filter each day.
The rate curves were plotted relative to three different water
elevations above the sand surface, at 0.90, 0.80 and 0.70 m. At the 0.90 m
water level, the rate of filtration dropped by about 7 m3/hr over the
total run, an 11.6% decrease. But at the 0.80 and 0.70 m water levels
the rates of filtration fluctuated up and down during the 120-hour run,
and the deviations were not large.
It can be seen from the curves in Figure VII.2.9 that a difference
in the elevation of the water level will make the rate of filtration vary
a great deal. A difference of 0.10 m changed the filtration rate by
about 15 m3/hr or 0.033 m3/hr/m2. To operate the filter at the design
rate, the water elevation should be kept at about 0.80 - 0.85 m above
the sand surface. That should maintain a rate of about 0.10 m3/hr/m2.
QUALITY CONTROL AND EFFICIENCY OF THE FILTER
Slow sand filtration systems are used for water sources that are
believed to be of good quality throughout the year. The chemical and
bacteriological characteristics of the water produced at the filtration
plant at Kranuan will give an idea of the capability and the efficiency
of the filter. For this purpose, water was sampled from the inlet and
the outlet of the filter. The samples were subjected to physical, chem
ical and bacteriological determinations. The bacteriological samples

400
oo oo o
vO •£> O
< t <r o
CM CM O
o 1 > J
o o
o o>
o 00
o r
O vO
O 1/1
O <r
o CO
O CM
^ — • *
to V4 3 C
J3
O •H 4-1
n) U u r-H •H
32 6
•H H
<4-(
o
4-1 6C C 01
• J
05
3
vs.
hoi
u
CO
6 V '
w cu e •H 4-1
T3 QJ )-i 0) 4J -H •H
tn 3 O
•H M tO >
tO
a O
• i - (
filt
rat
Rat
e of
2
.9.
00 •H
( j q / g u i ) uoxaBJt^-[T5 3° a^^H

401
were taken using an aseptic technique and a sterile glass bottle. These
experiments were run for one month, January - February 1976. The results
of the analyses are tabulated in Table VII.2.5.
Temperature. The measurement of temperature was done at the water
treatment plant. The temperature of the water usually varies according
to the seasons and the weather conditions. The time of this analysis
was between January and February. These two months are in the late win
ter of Thailand and air temperatures range from 22.8 C to 25.8 C. The
average value of the raw water temperature was 24.5 C and for the fil
trate the temperature was 24.0 C.
Colour. The determination of colour was reported in terms of
apparent colour which is due to suspended matter. The average result
was five units for both raw and filtered waters.
Turbidity. The analysis of turbidity was performed by using a Tur
bidimeter Hach Model 2100A. The turbidity values of the raw water were
between 5.6 and 7.2, which gives an average of 6.5; and the turbidity of
the treated water ranged from 2.6 to 5.6, which provided an average of
4.2.
Value of pH. The pH value is measured by using a pH meter Orion
Model 407A. Values ranged from 7.85 to 8.9 for the raw water and from
7.98 to 8.15 for the filtered water. The average pH value of the former
was 8.13 and of the latter it was 8.05.
Alkalinity. The alkalinity of water is due to the presence of bicar
bonate, carbonate and hydroxide. The phenolphthalein alkalinity in the
processed water was undetectable. The total or methyl orange alkalinity
values for the raw and filtered water were 123.4 and 127.2 ppm (CaC03),
respectively.

402
53
w H
o
CO
>-<
O
H
a
(—1
e e ^ o o
r H - • * .
o z ^
r s j
i—i
<_> 1 ^ f - t ^H to - ^ 3 00 -o g • ^ — '
tn <D os
*- • o£
a e
^ >, " -> c • H <_> C CO
—• 1 re * H
_*." •-* tu < £
;>, 00 .= c 4J tO a ^t
X O
( X
a. c I—< T H
O 0)
5 10
e ?
C 0) O
dnes
1-
Ca
M --^ to tc
X E V *
u:
•o t—fl ^ - \ 0 - i
CO ~~-o i
•H E ra •—
o H
>\ *-> T3 3 •H H
3
p t/: 3 -J O —'
—1 C O ~Z>
a.
5J
5
per
at
E
V
c o
o «
ate
ll
ec
Q O ( J
Cu
OS
PL,
as
CL,
OS
0 .
OS
0 ,
os
a,
PS
a.
OS
PU
oS
&«
os
a.
OS
a.
OS
o * T t N
OC m
f H
• H C
*-* ^ - t
c
r t
CN
CO
o r ^
"'
<T r M T H
f - H
• H
c
<r
CM r-*
CN
m
m o
ON r -
\D
CN
N O
m
m
*n
m
^ 0 0
m N O
CO
CN
. m CN
< J
< t ( N
NO
a
•-» f M — H
I
I
<H • H C
f H
»H
c
e n
CN
>* CO*
O r*. r H
v£> m - H
r H
• B
0 0
C M f v
N O
m
X CO
t n r-.
N O
CN
O
m
m
m
cr» a. r-.
N O
0 0
CO
o CN
CO
CN CM
sD
S •-> t n i - t
I
1
1
1
1
1
CO CM • H
-3-rs t r - t
r H
• H C
o ^ H
^ i n
M? u~i
—t CT>
ON CO
v £
<N
v£)
i n
m
m
m o CO
C M
CO
CO
1
1
<£>
a
»-) r - . «<H
0 0 m
O ** CN
u- i r - 4
• o
<—1
• H
c
vD
m
\ £
•. r^.
vD
m r H
CO CN r H
. H • H C
CM r H
CN
m
S D
m
r-4 r-»
CO
m
o
CN
^O
m
m
m
sr o CO*
*3-r-*.
CO
f - H
• *» CN
m
en <N
NO
a
^ o CN
0 0 e n
o -3 -CN
i n - H
• o
—* i H
C
CN
r-»
CN
• CO
o CN f H
o CN • H
—* i H
c
- d -f—)
CN i n
s O i n
o r^-
i n < ?
N O
CN
NO
i n
i n
i n
N O C7N
r-*.
r ^
CO
u- i
. -* CN
O
u-» Csl
NO
c
•-> CN CN
CO t n
CO m
r H
• H
c
f H
• H
C
f - H
N O
m • CO
*o CM f - H
CM CN f - H
r-<
T H
c
o f H
CN i n
N O
m
CN
o NO
NO
CM
vO
i n
m
i n
m O
CO
CO NO
CO
e n
m CM
CO
m r g
o
G CO
—i
*> CM
CO r-)
O <T CN
-* • o
f H
- H
a
+3
m
<r * r ^
c m f H
CM CN f H
f H
• H
c
NO
CN
m
( N i n
CM i n
CO i n
NO
* CM
N O
i n
i n
m
t H
o 00*
i n N O
CO
N O
i n CM
-3-
m CN
NO
s * • >
CO CM
1
1
I D
t H
• o
<H • H C
<n
m
m • r ~
t M
<r r-H
• J -
•» T-i
^ H • H
c
o ^
CO
<r
-o m
m t r i
r -r o
i O
CN
^ m
m
m
CO
o CO
-» CO
evj
• -» r g
\ C
-* CN
sO
g n o m
m
CN w~i
1
1
— < m
<r •
r^
vC
•» T-4
r» i
>» t H
t H
• H
c
t H
^
f s j
m
CM i n
CO CO
CO t H
vO
m
CN
r**
m
m
o o CO*
i n v d
CO
1
1
vO
J 3
U t
CN
•u to 5=
J3
O
a
cu •u to S
Is to u
ftj
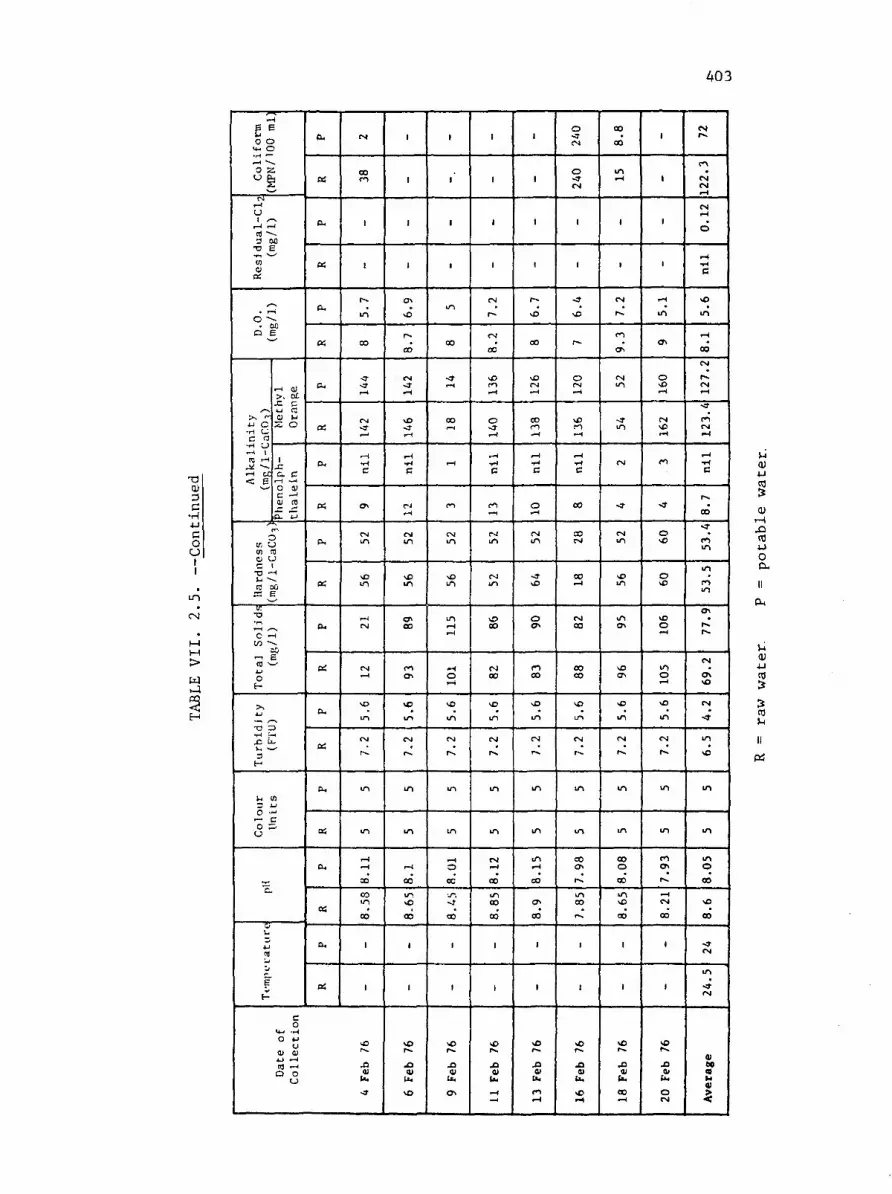
403
Q) 3 C
•H U C o u I I
CM
w r J
• H
Ee o o u- o
^ - 0 JZ.
o £ *- r 4
i-<
u 1 r-v
rH f-(
rt - - -3 00
•n > — (0 <y
<* r ^
o — . 00 a ^e
u O
c o - H 1
•-H CO < 6
r H <D > . 00
4-1 Ci
a u s o
1 x: c C O i)
c -•
A 3
IT, SJ CO !3 CI U
Har
d m
g/1
—' CT " D
C - H t o *-*.
« £ CO w 4-» O
»>.
rbid
it:
(FT
U)
3 i -
l~i (0 3 u O —
— C O ^
c
Zi i -
4-J
? 0
E
H
c o
Vw - H o •-»
01 0) 4J —4 03 r H
Q O O
C*
«
D-,
05
cu
05
c
«
o.
«
P H
ex
0 *
oi
a.
a:
a,
n j
a,
as
a,
a:
C M
GO c o
1
1
(-* m
CO
~3-< J r-*
C M < •
r H
c
c *
CM i n
\ C
m
t-H CM
CN ^ 1
\o
i n
CM
i n
m
r H
—* CO
CO
m CO
1
1
vO
X l 01
U .
-»
I
1
1
1
Os
vO
r~
CO
C M
- 3 ^ H
vO <T r H
t -4
c
C M
CM i n
sC 1/1
a> CO
e n CM
vo i n
CM
m
m
r H
CO
m vO
CO
1
1
v D
X I 01
r M
VO
I
1
1
1
i n
CO
-» r-^
CO t-H
r H
C I
CM m
X>
m
m
^ o
M3
u-i
CM
i n
i n
f~i o cc*
J " . < t
0 0
1
1
< £
X ) 01
U .
O-v
1
1
1
1
CM
r*
CM
CO
vO
m r H
o ^3-t-H
r H
c
CO
CM
m
CM i n
v£> CO
CM 0 0
VO
i n
CM
i n
m
CM r-H
CO
m CO
CO
1
1
vO
ja 01 u. r H
~*
1
1
1
1
r~
• vO
CO
^o CM
-1
CO r o - H
r H
c
o
CM i n
• \D
o ON
en 0 0
vO
i n
CM
m
m
i n ^H
CO
o> CO
1
1
vO
XI V
u.
m r H
O - 3 CM
O
CM
1
1
-» • •£>
r*-
O CM r H
VO CO
• r H
C
CO
CO CM
0 0
^-<
CM CO
CO CO
vO
m
CM
m
i n
CO
a. r ^
m CO
c-»
1
1
•O
XI 0}
u. vC r H
CO
CO
m r H
1
1
CM
• r
c - i
o>
CM
m
-3 -i n
CM
MT
CM
m
vO
m
i n Ov
VO
a\
-c
m
CM
i n
i n
CO
o 0 0
m M3
0 0
I
I
vO
X I
u c*. 0 0 "1
1
1
1
1
r H
• m
a>
o ^ D r H
CM vC r H
CO
Mf
O M3
O vO
>C O r H
m o r H
vO
m
CM
m
m
CO 0 \
r«*
- H CM
CO
1
1
vO
JO
a> u,
o CM
CM r*»
e n
• CM CM
•-< CM <-i
o
r-t • H
c
vO
• i n
t-t
CO
CM
r-. CM 1-t
MT
en CM r H
r H • H
c
r
OS
•3 -
• CO »n
m
CO
m
o\
• r-.
CM
o\ MD
CM
-» m
vO
m
m
m o CO
SO
0 0
-» CM
m
-» CM
a j 6 0
a u
> <
u 0) u r*
r Q
o a. II
PH
u <u 4-1
m rH
II
PS

4Q4
Hardness. Hardness prevents lather formation and produces scale.
The determination of hardness was made by the titration method. It
showed that the hardness value both of the raw water and of the fitrate
was about 53.5 ppm.
Total solids. The solids were determined as total dissolved solids.
This was done by evaporating a volume of sample to dryness and drying
it in an oven at 100 - 105 C. The remaining weight of the sample con
sists of the weight of the solids. The amounts of solids in the raw
and filtered waters were 69.2 and 77.9 mg/1, respectively.
Dissolved oxygen. The Winkler method was applied to determine the
dissolved oxygen. The oxygen dissolved in the raw water kept in the
reservoir was 8.1 mg/1. After filtration the dissolved oxygen content
had dropped to 5.6 mg/1.
Coliform bacteria. An estimation of the coliform number was deter
mined by the Most Probable Number (MPN) method. Coliform bacteria have
the property that they will ferment lactose with the production of
gas. The appearance of gas after incubation for twenty-four hours
at 37 C, is taken as a positive test for the presence of coliform bac
teria. The number of positive tubes are statistically interpreted to
arrive at the Most Probable Number per 100 ml. The average value for the
raw water was 122 and after filtration the figure dropped to 72.
Residual chlorine. Chlorine is used for disinfection of the fil
tered water. A residual chlorine is left in the water and this can be
detected. The residual chlorine ensures that the water will remain safe
for consumption. The average value found was 0.12 ppm. The amount of
high test hypochlorite (60%) used is about fifteen kilogrammes per
month or per 4,050 m3.

405
Discussion. The filter system at Kranuan can produce clear, odourless
and colourless water with a 41% reduction of coliform organisms. Slow
sand filtration, theoretically, can achieve 99% reduction of bacteria. The
analysis showed that the efficiency of filtration was not yet satisfactory
with respect to coliform removal. The degree of hardness shown by the
analysis would cause the water to be classified as soft. This has economic
advantages in terms of soap consumption. As the dissolved oxygen content
of the effluent was above 3 mg/1, it is believed that anaerobic conditions
rarely develop in the filter bed.
The physical and chemical analyses show that the physical and chemical
parameters do not exceed the limits of the WHO standards for drinking water,
1971. If disinfection is strictly controlled, the water is safe for
drinking.


40 b
VII.3.
SMALL WELLS, SLOW SAND FILTRATION, AND RAPID SAND FILTRATION FOR WATER SUPPLIES IN DEVELOPING AREAS
Kung-cheh George Li
SMALL WELLS
Introduction. The small wells discussed here will be limited to
those wells which are relatively low in output, shallow in depth, and
used primarily for rural community water supplies in developing coun
tries. Therefore, the small wells included are large dug wells or
small tube wells.
Use of groundwater, to which water wells serve as a means of ac
cess, provides many advantages. In general, groundwater is a more
reliable and better quality source than surface water. It also costs
less to develop. Small wells have become the major type of installa
tion for small water systems in rural areas of developing countries.
Location of wells. A simple way to determine the appropriate
location for a well is to study all the geological data available,
including geologic maps, cross-sections and aerial photographs, and
to study all available information on existing wells, especially the
well logs. Important sources of water are consolidated rocks and gran
ular, unconsolidated sediments including marine deposits, river valleys,

407
alluvial fans, coastal plains, glacial outwash and sometimes dune sand
(7). So far as public water supplies are concerned, sands and gravels
are the most important aquifers, with sandstones next in importance.
In a region where the groundwater table is high and the underground
strata are pervious, shallow wells may be located at any convenient
place. The surface evidence of groundwater occurrence is demonstrated
in Figure VII.3.1.
Types of small wells. As mentioned before, this examination of
small wells is limited to the consideration of wells which are rela
tively low in output and shallow in depth. They are generally, but
not necessarily, less than from fifteen to thirty meters in depth.
Therefore, they can be shallow wells of large diameter as dug wells.
They can also be shallow wells of small diameter as bored, driven, or
jetted wells. The relationship between small wells, the groundwater
table and ground surface is shown in Figure VII.3.2.
Dug wells. Dug wells are holes or pits dug by hand or machine
tools which extend into the ground to tap the water table. They are
usually greater than one meter in diameter. When such a well is used
to supply water to a small community, it may be five or six meters in
diameter. In this case, they are large in diameter and extend into
shallow strata of sand or gravel. A well of this type surely has the
advantage of furnishing considerable storage and will therefore allow
a heavy draft for a short period. Dug wells are usually constructed
to a depth of from three to twelve meters. Yields considerably less
than 600 cubic meters/day are typical (5).
Dug wells are generally lined with concrete, brick, stone, tile,
wood cribbing or steel rings to prevent the wall from caving in. Brick

408
Fig. VII.3.1. Surface evidence of groundwater occurrence.
Key: 1. Dense vegetation indicating possible shallow water table and proximity to surface stream.
2. River plains, possible sites for wells in water-table aquifer. 3. Flowing spring where groundwater outcrops. Springs may also
be found at the foot of hills and river banks. 4. River beds cut into water-bearing sand formation indicate
possibility of river banks as good well sites.
SOURCE: Water Supply for Rural Areas and Small Communities, WHO Monograph Series, no. 42, 1959, Fig. 4.

Fig. VII.3.2. Relation between small wells, the groundwater table and ground surface.
SOURCE: H. E. Babbitt, J. J. Doland, and J. L. Cleasby, Water Supply Engineering, 6th ed. (New York: McGraw-Hill, 1967).

410
with cement mortar is sometimes used to a depth of three meters below
the ground surface with dry joints used below that level. A typical
dug well is shown in Figure VII.3.3.
Large dug wells, up to a diameter of thirty meters, may be con
structed by sinking a monolithic concrete lining as a caisson as well
as by other methods.
Bored wells. Bored wells are constructed by drilling in uncon
solidated material with hand-operated or power-driven earth augers.
Such bored wells may be constructed up to about one meter in diameter
and have been enlarged up to 1.2 meters in diameter by reaming. A con
crete, tile or metal casing is inserted in the hole and cemented in
place before the strainer is installed (7).
Driven wells. Driven wells which are up to ten centimeters in
diameter and twenty meters deep can be installed only in soft formations
relatively free of cobbles or boulders. A driven well is constructed
by driving a well point on the lower end of a pipe which acts as both
well casing and suction pipe. The driving is done by means of a maul
(heavy hammer) or by dropping a weight. Driven wells are usually pumped
by suction lift. In such cases, the static water level should be within
about 4.5 meters of the surface (12). Because of limitations on size
and depth, driven wells are not ordinarily adapted for large supply pro
jects. However, batteries of driven wells may be connected to a suction
header to supply enough water for small water supply systems.
Jetted wells. Jetted wells are constructed by a high-velocity
stream of water which is directed downward into the earth. By attaching
the well pipe to a self-jetting well point, consisting of a screened
section ending in a nozzle, the well pipe is jetted into place (7).

411
Impervious apron
\
Suction pipe sealed in apron
Watertight sea 3 m from ground
Pot chlorinator
Fig. VII.3.3. Dug well with hand-pump and sanitary protection.
SOURCE: R. Feachem, M. McGarry, and D. Mara, eds. , Water} Wastes, and Health in Hot Climates, (New York: John Wiley & Sons, 1977.)

412
Jetted wells can be constructed quickly when conditions are favorable,
and they can provide an emergency supply of water.
Sanitary protection of small wells. The required measures for
protection of dug wells from contamination should include the following:
1. The sides of the well should be lined with impervious material
to a depth of about three meters to prevent the entry of water
flowing near the ground surface.
2. An impervious apron should be constructed around the well
mouth to prevent the surface water from entering at the top,
to divert spilled water away from the well-mouth to a soak-
away and to provide a comparatively dry floor for well-users.
The ground surface must slope away from the well or the site
must be otherwise drained.
3. An area within a radius of about fifteen meters from the well
should be kept free from pollution. In this area there should
be no dumping of refuse, and any pit latrines, soakaways or
cesspits should be relocated (8).
A dug well with a hand-pump and sanitary protection is shown in
Figure VII.3.3. It will be noted that in this figure a pot chlorinator
is included as an additional safeguard. Protective measures (two) and
(three) should also be applied in shallow tube or screened wells.
Modification of dug wells. If dug wells are difficult to maintain
in a sanitary condition, they usually can be made much safer by driving
well points into the water-bearing formation and thus converting them
into tubular wells. A converted dug well is shown in Figure VII.3.4.

413
Fig. VII.3.4. A dug well with driven well point installation.
SOURCE: U. P. Gibson, and R. D. Singer, Small Wells Manual (Washington, D.C.: USAID, 1969).

414
One additional advantage of this modification is a much higher
rate of yield. This is because the driven well point can penetrate
much deeper into the water-bearing formation.
SLOW SAND FILTRATION
Introduction. Recently there has been a tendency to assume that
slow sand filtration is an old-fashioned method of water treatment
because of the development of rapid sand filtration. This criticism
is definitely incorrect. Under suitable circumstances, slow sand
filtration may be not only the cheapest and simplest but also the
most efficient method of water treatment. So, it is unwise to neglect
consideration of slow sand filters when planning new water works,
especially in the developing countries.
Advantages of slow sand filters. Huisman and Wood claim that "no
other single process can effect such an improvement in the physical,
chemical, and bacteriological quality of normal surface waters." (11)
Slow sand filters have a high degree of efficiency in the removal of
turbidities, tastes and odors. The slower filtration rate also gives
the bed a greater efficiency in the removal of bacteria than is attained
by the rapid filter, considering the filter alone and not the auxiliary
treatment. Furthermore, no chemicals are needed, and the absence of
the use of a coagulant is typical of the slow sand filter. Pickford
claims some additional advantages for the developing countries:
1. The cost of construction is low, especially where manual labor
is used.
2. Simplicity of design and operation means that filters can
be built and used with limited technical supervision. No

415
special pipework, equipment or instrumentation is needed.
3. The labor required for maintenance can be unskilled, as the
major job is cleaning the beds which can be done by hand.
4. Import of material and equipment can be negligible, and no
chemicals are required.
5. Power is not required if a fall is available on site, as
there are no moving parts or requirements for compressed air
or high-pressure water.
6. Variations in raw water quality and temperature can be accommo
dated provided turbidity does not become excessive; and over
loading for short periods does no harm.
7. Water is saved (an important matter in many areas) because
large quantities of washwater are not required.
8. Sludge, which is often a major problem with water treatment
by more sophisticated methods, is less troublesome. There
is less of it, and it is easily dewatered (8).
Application. Slow sand filters are most practical in the treat
ment of water with turbidity below fifty mg/l (expressed as Si02) as
this permits a longer filter run although raw water turbidities of 100-
200 mg/l can be tolerated for two or three days. The best purifica
tion by slow sand filtration occurs when the average turbidity is ten
mg/l or less. When higher turbidities are expected, slow sand filtra
tion should be preceded by some type of pretreatment, such as plain
sedimentation, storage with micro-straining for algae removal, rapid
"roughing" filtration, and sedimentation preceded by chemical coagula
tion (if necessary) and followed by rapid "roughing" filtration (11).
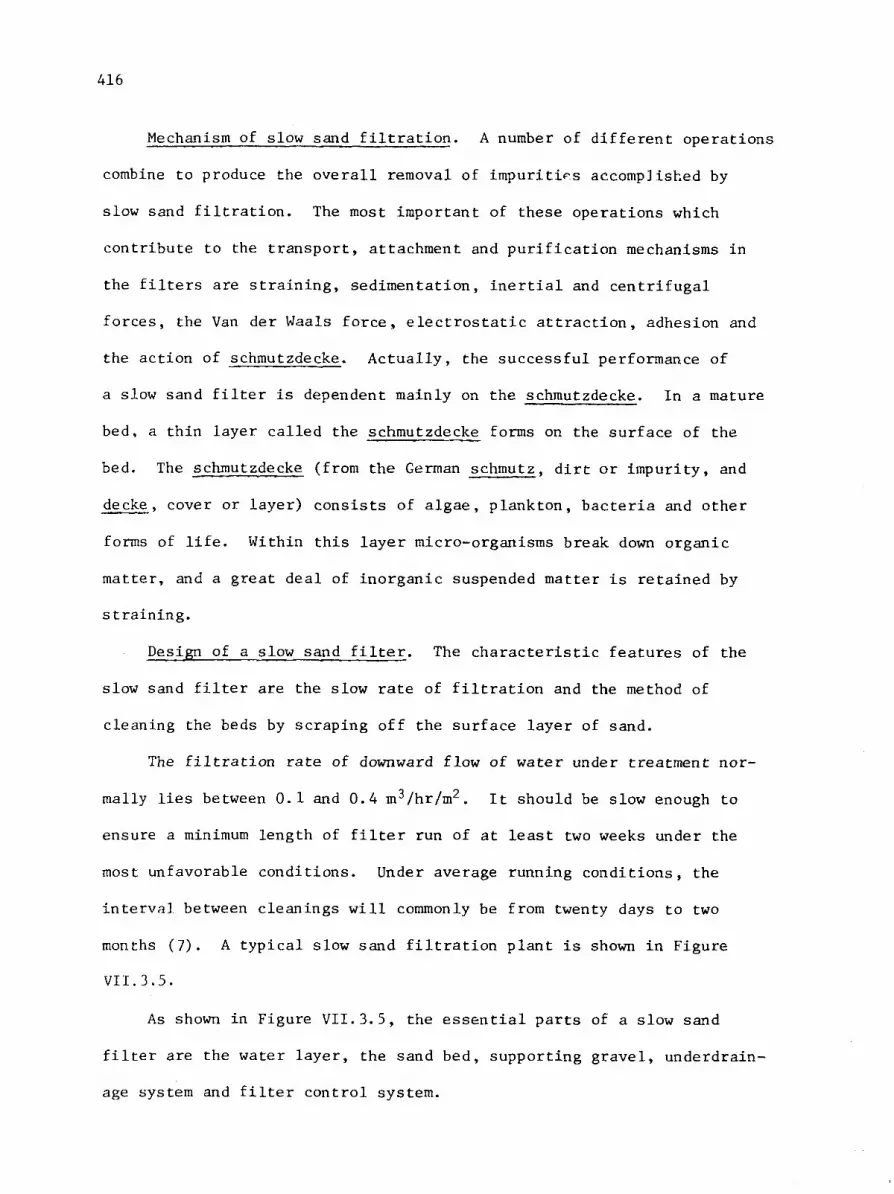
416
Mechanism of slow sand filtration. A number of different operations
combine to produce the overall removal of impuritif-s accompJished by
slow sand filtration. The most important of these operations which
contribute to the transport, attachment and purification mechanisms in
the filters are straining, sedimentation, inertial and centrifugal
forces, the Van der Waals force, electrostatic attraction, adhesion and
the action of schmutzdecke. Actually, the successful performance of
a slow sand filter is dependent mainly on the schmutzdecke. In a mature
bed, a thin layer called the schmutzdecke forms on the surface of the
bed. The schmutzdecke (from the German schmutz, dirt or impurity, and
deeke, cover or layer) consists of algae, plankton, bacteria and other
forms of life. Within this layer micro-organisms break down organic
matter, and a great deal of inorganic suspended matter is retained by
straining.
Design of a slow sand filter. The characteristic features of the
slow sand filter are the slow rate of filtration and the method of
cleaning the beds by scraping off the surface layer of sand.
The filtration rate of downward flow of water under treatment nor
mally lies between 0.1 and 0.4 m3/hr/m2. It should be slow enough to
ensure a minimum length of filter run of at least two weeks under the
most unfavorable conditions. Under average running conditions, the
interval between cleanings will commonly be from twenty days to two
months (7). A typical slow sand filtration plant is shown in Figure
VII.3.5.
As shown in Figure VII.3.5, the essential parts of a slow sand
filter are the water layer, the sand bed, supporting gravel, underdrain-
age system and filter control system.

417
Pi
w H I < 5
M < W H-1
H W
,-) H
» O
• V-l
cu • u i H •H 4-1
T 3
g Cfi
S C)
. - 1 c/>
crj
4-1 O
UIF
U 6 0 CO
• H Q
LO
• o"1
h-1 M
> • 6 0
• H Mn
tio
n
(Gen
eva
CO l-i 4-1
T - I
• r l [^
T3 C cO
CO
3 o
l - l
CO
* •
0
o
• s Td
S *
c cfl e en
• H 3 « • .-1
.. W o J * P O CO
•
-\ < ) •
r~~ c^ i—i
C o
• H 4-1
n) N
• H C CO 6 0 M O
X ! 4-1 r H CO 0J
Wor
ld
H

418
The principal function of the water layer is to maintain a
constant head of water above the sand bed for providing the pressure
that carries the water through the filter. In practice, a depth of
water of between 1.0-1.5 meters is provided.
The sand bed thickness initially varies from 1.2 to 1.4 meters.
The thickness is usually reduced to no less than fifty to eighty centi
meters. Common specifications for the type of sand used are the effec
tive size at 0.15-0.35 mm, and the uniformity coefficient of between
1.5 and 3. A coefficient of less than 2 is preferable. The effective
size is the sieve size in millimeters that permits ten percent of the
sand by weight to pass (d^g)- The uniformity coefficient is the ratio
between the sieve size that will pass sixty percent to the sieve size
that will pass ten percent (effective size) (dG0/d10).
The supporting gravel is placed as graded layers with the finest
size on top. The rules applied to the design of the supporting gravel
bed are:
1. For the gravel in each layer, ten percent and ninety percent
passing diameters should differ by a factor of not more than
Jl . If this is diff icult to attain, then the requirement
may be relaxed to a factor of two, but in this case each
layer should have its djg value restricted to not larger
than three times that of the layer above.
2. The gravel of the bottom layer should have an effective dia
meter of at least twice the size of the opening into the
underdrainage system. Each successive layer should be graded
so that its smaller (d^g) particle diameters are not more

419
than four times smaller than those of the layer immediately
below.
3. The uppermost layer of the gravel must be chosen with a d o
value more than four times greater than the d^ value of the
coarsest filtration sand and less than four times greater
than the ds5 value of the finest filtration sand. The sand
is taken from natural deposits which vary in grain size from
one spot to another.
4. The thickness of each layer of gravel should be at least •
three times the diameter of the largest stones in its grading.
In engineering practice, the minimum thickness of the layers
is usually increased to from five to seven centimeters for
the finer gravel and to from eight to twelve centimeters for
the coarser gravel (11).
An underdrainage system below the gravel layers is required for
three purposes: support for the filter media, collection of the filter
water, and uniform distribution of the filtration rate. The simplest
form of underdrainage system consists of lateral drains spaced less
than four meters apart, and a main drain. Filter bottoms are sometimes
gently sloped downward from the midpoints between the laterals. The
laterals usually consist of porous or perforated unglazed drainage tiles,
glazed pipes laid with open joints, or perforated pipes of asbestos
cement or polyvinylchloride, covered with layers of gravel. The main
drain may be constructed of pipes of made of concrete, and it is fre
quently placed beneath the floor of the filter box to save the bed
depth.
Today there is increasing use of standard bricks to support the
medium and to provide drainage space. One of the simplest of such

420
open-jointed brick arrangements is shown in Figure VII.3.6. If
the dimensions of the bricks are 5 x 11 x 22 cm, then each channel
drains a strip twenty-three cm wide.
Generally, filter control is accomplished by means of a system
of hand-operated valves to regulate the filtration rate and the depth
of water over the filter. A simple filter control system is shown in
Figure VII.3.5. Automatic controllers of the type used with rapid
filters may be employed but are not necessary with the low filtration
rates of the slow filter.
The minimum workable size of a filter unit might be 100-150 m2 and
the maximum size might be 2000-5000 m2. The number of filters (N) may
be obtained by dividing the total filtration area required by the area
of each filter and adding the chosen number of reserve filters. At
least one reserve filter should be provided, but two or more reserve
filters are necessary for large treatment plants. The number of fil
ters (N) can also be approximated by using the following formula:
N = kj§ ,
where N = number of filters (N ^ 2)
Q = hourly quantity of water to be treated (m3/hr) (11).
The shape of filters is usually rectangular. The filters are
always equal in size and laid out side by side in rows. Assuming that
(n) filters of equal size are laid out side by side in a single row,
the ratio of the width (W) to the length (L) of each filter unit can
be estimated by use of the following formula:
W/L = (n + l)/(2n).
For example, W/L = 1/1.3 for n = 2; W/L = 1/1.5 for n = 3; etc.
This equation gives the optimum W/L ratio which will minimize construction

421
STANDARD BRICKS
••V.-^°::o.
MMMZZMMm
Cross-Section Longitudinal section
Fig. VII.3.6. Open-jointed brick filter bottom.
SOURCE: L. Huisman, and W. E. Wood, Slow Sand Filtration. Geneva: World Health Organization, 1974.

422
costs, and the derivation follows.
(1)
(2)
(n)
I '"" A
)'; A
?f
A
A ::
A = W x L = area of each filter unit = a constant.
C = total construction cost of the n filters.
C! = construction cost of unit area of filter floor.
C2 = construction cost of unit length interior wall of filter.
C3 = construction cost of unit length of exterior wall of filter.
Then, C = C:nA + C2(n - 1)L + 2C3(nW + L) = C:nA + C2(n - 1)L +
2C3(n| + L).
Assume C2 = C3.
Then, C = CjnA + C2[(n + 1)L + 2n f] .
Find the first and second derivatives of C with respect to L, and
set each of them equal to zero.
-jj£ = C2[(n + 1) - 2np] = C2[(n + 1) - 2n£] = 0.
I f c , 0 »=(iL±l) (2n)
| § = 4C2n A3 > o.
By inference, then, when C is at a minimum, W/L = (n + l)/(2n).
As with the rapid sand filter, a clear well is needed at the plant,
and this is generally made large enough to equalize filter output and
demand over a day. Furthermore, as a safeguard, the application of
chlorine to the effluent of a slow sand filter (i.e., chlorination) is
also practiced. In general, the dosage is about 0.5 mg/1 and rarely
more than 1.0 mg/1.

423
Operation of slow sand filter. The initial resistance (loss of
head) of the clean filter bed is about six centimeters (7). During
filtration, impurities deposit in and on the surface layer of the sand
bed, and the loss of head begins to increase. When the loss of head
has reached its permissible limit, the filter is thrown out of service
and cleaned. The loss of head before cleaning is seldom allowed to
exceed the depth of water over the surface of the sand (i.e., 1-1.5 m)
(3). As mentioned before, the period between cleaning is twenty to
sixty days. The method of cleaning can be either scraping off the sur
face layer of sand and washing and storing cleaned sand for periodic
resanding of the bed, or washing the surface sand in place with a washer
traveling over the sand bed. Because labor is readily available in
developing countries, the former method is favored. Men with flat, wide
shovels do the scraping and remove from one to two centimeters of top
material. The work of cleaning by hand should be completed in one to
two days. After washing, the sand is stored and replaced on the bed
when, by successive cleanings, the thickness of the sand bed has been
reduced to about fifty to eighty centimeters. About 0.2 to 0.6 per
cent of the water filtered is required for washing purposes (7). When
resanding, a process of "throwing over" is carried out (11). During
this process, an additional depth of old sand is temporarily removed to
one side; then the cleaned sand is added, and the old sand replaced
on top of the cleaned sand. The purpose of the process is to retain
much of the active material and enable the resanded filter to become
operational with a minimum of re--ripening.
After being cleaned, the beds are refilled with filtered water
from below until the sand is completely covered. This prevents

424
entrapment of air in the sand. Furthermore, the filtered water may
be wasted for several days until analysis shows that it meets the
quality standard.
RAPID SAND FILTRATION
Introduction. Although slow sand filters have great advantages
for developing countries, rapid sand filters are also widely used for
treatment of community water supplies due to their greater adaptabi
lity to more turbid waters, and smaller land requirements. Recently
there have been some modifications in rapid sand filtration, but these
have required a degree of operation technique and an investment in
initial and operation costs which are beyond the level of low cost
methods of water treatment in most of the developing countries. The
following discussion is therefore limited to the design of conventional
rapid sand filtration plants.
A rapid sand filtration plant. The term rapid sand filtration
implies a water treatment process which includes coagulation (i.e.,
rapid mixing and flocculation), sedimentation, filtration and disinfec
tion. A flow diagram of a rapid sand filtration plant is shown in
Figure VII.3.7.
As is shown in Figure VII.3.7, coagulation and sedimentation are
necessary in preparation of the water for filtration. Careful prepara
tion of the water by means of good coagulation and sedimentation with
an optimum use of coagulants is essential for economy and for satisfac
tory filter operation. As water flows through the various units, color,
turbidity, tastes and odors, and bacteria are removed from the surface
water supplies. Additional operations may include bar racks and coarse

425
• 4-t
c CO
o. c o • H 4-1 CO »-i 4-1 • H • H M-l
X )
11 CO
T 3
•H p. CO V4
<
• 1—
ro • M
M
> a
oo • H PX4
nts
of
W
ater
an
d W
aste
wat
er
CD
6 (U
rH t i l
„
c 3
^ O
• < • Q
T 3
§ ^
U CD
>, CD
o • u • ^
/*~\ • r - l
0 \
" .. „
u • H CO
P4
• 2
• O
e o u
<4- l
ied
U-l • H
•a c 2
K CJ
£ C cc
CO
C o en <# ^ CU
rH •H 3
c O
•-D
• • M u O
0) S3 v - '
r H CO
Dis
po
s

426
screens if floating debris and fish are a problem; aeration if shown
to be economical and beneficial for treatment of tastes and odors;
plain sedimentation if the water is highly turbid (1); and softening
if the water is high in the degree of hardness.
Coagulation. Coagulation proceeds in two stages, rapid or flash
mixing followed by flocculation or slow mixing. In the rapid mixing
process, a coagulant is rapidly and uniformly dispersed through the
mass of water. In the following flocculation process, a readily
settleable floe is built up, and this may be defined as "floe growth."
Coagulants and feeding methods. By far the most important coagu
lant is aluminum sulfate, usually called alum or filter alum. Most
commercial grades have the formula [AI2(80^)3 • 14 H2O]. Aluminum
sulfate is available in lump, ground or liquid form (1). Other coagu
lants in use are iron salts, such as ferrous sulfate (also known as
copperas and the most often used of the iron salts), ferric sulfate and
ferric chloride. These iron salts can operate over a wider pH range
than alum and are generally more effective in removing color from water,
but they are usually more costly (6).
Optimum floe formation requires that for alum the pH be within
the range of 5.0-7.0. Sufficient alkalinity must be present for reac
tion with the coagulant. If insufficient alkalinity is present in the
water, lime is generally added. While they are not equally effective
in all waters, some polyelectrolytes, when used in conjunction with
the common metal coagulants, yield large dense floe which settles
rapidly. This may improve sedimentation and reduce flocculation time.
A polyelectrolyte is a linear or branched chain of small subunits con
taining ionizable groups. Polyacrylate is an example of an anionic

42 7
polyelectrolyte:
CHo CH CH2 CH CH 2 CH
l . l . I -coo coo coo
The method of feeding chemicals is either in solution or as
solids. In a small plant, chemicals dissolved in water and fed as a
solution can be more accurate and less costly than dry feed. One
of the simple solution feeding devices is arranged as in Figure VII.3.8.
For determining the optimum dosage of coagulant and needed stirring
the jar test is most commonly used. This test is performed in the
laboratory with the aid of a stirring device with a variable speed
motor, and trials are made on small quantities of the water to be
treated.
Rapid mixing devices. Rapid mixing may be accomplished by
injection of the chemicals into a point of high-velocity flow, such
as ahead of the suction of a low-lift pump or hydraulic pump. Injec
tion of chemicals ahead of a low-lift pump has the advantages of the
short period required for mixing, the low cost, and the fact that there
is no additional head loss. When a hydraulic pump mixer is employed,
the flow velocity should be as rapid as three m/sec, and the available
head loss should be at least 0.3 meter. A baffled mixing basin has
the advantage that there is very little short circuiting and it is a
suitable device for small plants. In practice, in a baffled basin
used for rapid mixing the velocity needs to be above 1.5 m/sec and
the head loss must lie between 0.3 and 1.0 m. The rapid-mix chambers
fitted with vertical-shaft rotary mixing devices are also widely used
today. The practice followed in the design of rapid mixing units has
been to provide ten to thirty seconds of detention time.

428
FROM STOCK TANK OR CHEMICAL DISSOLVING TANK
FLOAT VALVE
CONSTANT LEVEL TANK FLOW REGULATING VALVE
Fig. VII.3.8. A simple solution feeder.

429
Flocculation basins. This stage involves slow and gentle stirring
with sufficient time allowed to build up floe. The completeness of
the process is described by a dimensionless term Gt, where G (sec-1) is
the mean velocity gradient in the basin and t (seconds) is the detention
time (3). The magnitude of G is a function of the useful power input
(P) relative to the volume of the fluid (C) and a proportionality
factor (y) which has the same dimensions as the absolute viscosity and
is equal to it in laminar flow.
G =VP/(Cu)
In flocculation practice, Gt may range within the limits 104 to 105.
Detention times range from twenty to sixty minutes, and velocity grad
ients range from five to 100 (1/sec) with optimum values between thirty
and sixty (1/sec) (1,6). Too high a velocity gradient will shear floe
particles, and too low a velocity gradient will fail to provide suffi
cient agitation to enable floe formation. When the floe particles have
grown in size, they become weaker and more subject to being torn apart.
So, tapered flocculation is frequently used.
Baffled flocculation basins of horizontal (around-the-end) or verti
cal (over-and-under) types, formerly widely used, are still most suit
able for small plants in rural areas of developing countries. They
have the advantages of very little short-circuiting and no necessity
for mechanical equipment. The depth of the basins is around three to
five meters. Spacing between the baffles is around sixty centimeters
to facilitate cleaning operations. The flow velocity is designed in
a range of fifteen to fifty cm/sec, and the total head loss will be
around thirty to ninety centimeters. The around-the-end types of
basin is commonly applied to plants with capacities below 76,000

430
cubic meters/day, and the over-and-under type with the advantage of
more continuous turbulence is applied where sufficient water head is
available and land is limited.
Mechanical flocculators are gaining in popularity at present.
They usually employ rotating paddle wheels. The paddle area is commonly
between ten and twenty-five percent of the tank section area.
Sedimentation basins. Design for sedimentation following floccu-
lation depends on the settling characteristics of the floe formed in
the coagulation process. A general range of detention times is two to
four hours. The overflow rates (surface loading) used in floe settling
vary from twenty to forty m3/day/m2 (m/day), and the horizontal velo
city is commonly below thirty centimeters/minute to minimize the distur
bances caused by such things as density currents and eddy currents in
the basins. An eddy current is caused by the inertia of the incoming
fluid. A density current occurs due to the difference in density of
water layers with varying temperatures, and this can cause cold or
heavy water to underrun a basin and warm or light water to flow across
its surface. The length of rectangular basins is practically less than
thirty meters, but basins can be constructed with a maximum length of
up to about 100 meters. The depth of the basin is about two to five
meters, three meters being a preferred value (7). The ratio of length
to width is commonly between 3:1 to 5:1. Inlets must distribute the
flow as uniformly as possible, and this can be achieved by using a dis
persion wall perforated by holes or slots. Control of outflow is gen
erally secured by a weir attached to one or both sides of a single or
multiple outlet trough. Weir loading should be held below 400 m3/day/m
(7).

431
The cleaning of tanks can be carried out either mechanically
(i.e. , a sludge-removal device) or manually. In developing countries
and elsewhere where labor is readily available, the latter method will
be favored. In manually cleaned basins, the time lapse between clean
ings varies from a few weeks to a year or more, and the sludge accumu
lated is sluiced by fire hose after the tank has been cut out of ser
vice and dewatered.
If a circular settling tank is used, the diameter may be as large
as seventy meters, but they are generally held to thirty meters or less
in diameter to reduce wind effects.
Rapid sand filters. The rapid sand gravity filter is commonly
used to remove nonsettleable floe and impurities remaining after coagu
lation and sedimentation of raw water. The filtering mechanism of a
rapid sand filter is very complex, consisting of the actions of straining,
sedimentation and flocculation.
Rapid sand filters are usually laid out side by side in rows along
one side or along both sides of a pipe gallery which contains inlet
and outlet piping, wash-water inlet lines and backwash drains. A typi
cal rapid sand filter with accessory equipment is shown in Figure VII.3.9.
A rapid sand filter of the open gravity type consists of an open
watertight basin containing a layer of sand sixty to eighty centimeters
thick, supported on layers of gravel. The gravel is underlaid by an
underdrainage system which leads to the outlet where a rate controller
is located. The rate of filtration commonly varies from 100 to 150
m3/day/m2.
The size of sand used in a rapid filter is described by the effec
tive size, which is the sieve size in millimeters that permits ten

432
s 5=
I * <3
ire l
ines
i/> w* (y U
;lic
valv
in
g t
ab)
c a P.
•H
cr
o CO CO 0) o o co
13 C (0 CO u 0)
ro
00 •H
g
O o CO CO <!
(0 55
c B 4-1 cd 01 U
H
to
u 0) •u CO t2
u > O o
SB
PH
u
ca u OS
o CO

433
percent of the sand by weight to pass. Uniformity in size is described
by the uniformity coefficient, which is the ratio between the sieve
size that will pass sixty percent to the effective size. Common ranges
in effective size and uniformity coefficient are 0.40-0.55 mm and 1.35-
1.75, respectively (6). During filtration, the depth of water above
the sand surface is from 1.0 to 1.5 m. The total head available for
filtration is equal to the difference between the water surface above
the sand bed and the water level in the clear well, commonly three to
four meters. Under average operating conditions the filter run is com
monly twenty-four hours (ranging from twelve to seventy-two hours)
which corresponds to a measured head loss through the filter bed of
about 2.5-3 m. As the filter run is ended, the filter is cleaned by
backwashing at a rate of about 0.6 m3/min/m2 for a period of five to
ten minutes. The expansion ratio is about twenty to fifty percent (1).
The clear water for backwashing is from either a wash-water tank or
pumps. It flows into the filter under-drainage system, where it is
distributed upward through the sand filter. Dirty wash water is
collected by troughs and flows into a channel connected to the drain.
Usually, rotary surface washers are also installed in the filters
to improve filter cleaning and prevent mud-ball formation and filter
cracking. After backwashing, the initial filtered water is normally
wasted for three to five minutes.
Usually the minimum number of filter units is two. The surface
area of a filter unit is normally below 150 m2 to secure uniform distri
bution of wash water. The ratio of length to width of a filter box
lies between 1.25 and 1.35.

434
The graded layers of gravel furnish proper support for the sand,
and act as a dispersing medium to reduce jet action for the backwash.
The size and depth of the lowest layer of gravel depends on the type
of underdrainage system used, and the size and depth of the top layer
of gravel depends on the size of the bottom layer of fine media above.
The filter gravel bed commonly consists of four or five layers of
gravel sizes ranging from three to sixty millimeters with the finest
size located on top. The total depth of gravel may vary from fifteen
to sixty centimeters, and is usually about forty-five centimeters.
The most important function of the filter underdrain is to provide
uniform distribution of backwash water. A widely used type is the
perforated-pipe system (see Figure VII.3.9), which consists of a mani
fold and laterals. Other systems are the pipe and strainer type, the
vitrified-tile block with orifices, porous plates and precast-concrete
underdrains (6). Manufacturers of filter equipment have devised var
ious types of underdrain systems.
To operate the plant without too frequent a variation of its out
put rate and also to provide storage for filtered water, a clear well
can be located beneath the filter units or in a separate structure.
As a variation on the conventional rapid sand filter, either a
crushed anthracite coal or a dual-media (a sand layer topped with a
bed of anthracite coal media), may be substituted for sand, but they
are more costly than sand media.
Chlorination. Chlorination has been a standard treatment at rapid
sand filter plants for destroying disease bacteria. The chlorine is
generally added in the filter effluent pipe or in the clear well so that
an adequate contact time will be assured.

435
Management of water treatment plant residues. In the past,
settled coagulation wastes and backwash water have been disposed of
without treatment, but these solids discharged may promote buildup of
deposits of "sludge banks" in the backwaters of slowly moving portions
of streams. From an aesthetic standpoint, the discharge of these wastes
is objectionable because it will markedly increase the turbidity and
apparent color of the receiving waters (2). Furthermore, the discharge
also contains polluting concentrations of chemicals used in processing.
Proper procedures for disposal of such wastes from water treatment
plants are recommended for consideration in developing countries accord
ing to the local pollution control requirements and financial resources.
Possible procedures include: direct discharge to a receiving stream
with an adequate flow rate or drainage system, lagoons or sludge drying
beds, hauling away for surface land application, discharge into a munici
pal sewerage system, recirculation and reuse of filter washwaters,
dewatering of sludge, and reclamation of alum or other useful consti
tuents (2,6).

436


CHAPTE R VIII
Wastewater Disposal and Treatment
In this chapter are presented several wastewater treatment or
disposal methods for application to sewered wastewaters. These parti
cular methods were selected for inclusion because of their low cost
and their suitability for developing countries. Stabilization ponds
are among the processes associated with developing countries, and the
first section of this chapter deals with this subject at length before
giving brief descriptions of the use of fish ponds and oxidation
ditches. This material represents a shortened version of the original
publication. Stabilization pond systems are a treatment of choice in
developing countries due to their generally low cost and because many
developing countries are located in tropical areas which provide
optimum climatic conditions for pond operation. Data are given on the
performance and costs of ponds, and some comparisons are made with
aerated lagoons and activated sludge systems.
437

438
In the second section in this chapter, information is given on
the aerated lagoon, including process design considerations and power
requirements for mixing. The cost of an aerated lagoon is generally
more than that of a stabilization pond and less than that of an ox
idation ditch. Among the advantages of aerated lagoons in comparison
with stabilization ponds, are first, their ability to handle higher
loadings with a shorter detention time in a reduced area. In addition,
algae are not necessary to provide oxygen to an aerated lagoon; there
fore, this type of unit can be used without regard to the amount of
available sunlight.
Iri the third section of this chapter, an article on land applica
tion of wastewater presents a practice which was formerly used primarily
for wastewater disposal but which more recently has often been used
for wastewater treatment or reuse. Like the article on aerated lagoons
this article was prepared especially for publication in this volume.
Design criteria are given, and cost and health aspects are discussed,
with this method wastewater is spread over the land. After having
been subjected to filtering and stabilization of the organic matter
by tbpsoils and soil biota, the treated water may be collected by a
drainage system for reuse or allowed to recharge natural aquifers.
The requirements of this process are low in terms of energy and chemi
cals, and the water yielded from a properly maintained system will be
of similar quality to the water provided by advanced tertiary treat
ment processes. A principal problem associated with land application
is the possibility of pollution of groundwater or soils with harmful
substances.

439
VIII.1.
SEWAGE TREATMENT IN DEVELOPING COUNTRIES
L. W. Canter and J. F. Malina
INTRODUCTION
The need for wastewater treatment in developing countries can
be seen in the numerous instances where raw sewage is diverted into
streams or oceans, thus contaminating waters that could be used for
human consumption, industrial needs, land irrigation, fish production,
or recreation. However, only a small percentage of the population
in most developing countries is served by wastewater treatment facili
ties, due to the high costs of certain wastewater treatment processes,
the lack of qualified personnel to operate and maintain sophisticated
treatment processes, and the low priority generally assigned to
wastewater treatment relative to other national needs.
This study was meant to provide a state-of-the-art of sewage
treatment in developing countries. Mention was made of processes
utilized in developing countries from the context of available
treatment system technology. No attempt was made to cover every
process in detail. The paper was oriented to treatment applied for
sewered wastewaters. This paper was developed following a review
of published references on wastewater treatment in developing countries.
In addition, selected non-U.S. and some U.S. references for developed
countries were identified relative to wastewater treatment. The
Norman: The University of Oklahoma Bureau of Water and Environmental Resources Research, December 1976.. (174 pp.)

440
following processes were found to be associated with developed
countries: primary (conventional), sludge (conventional), sludge
(advanced), secondary (standard filter), secondary (high rate filter),
secondary (activated sludge), secondary (extended aeration), disin
fection, agricultural utilization, ground discharge, and tertiary
treatment. Those processes which were found to be associated with
developing countries included primary (stabilization ponds), sludge
(conventional), ocean disposal, and septic tanks. On the basis that
ponds are the most used process in developing countries, the major por
tion of this report is a presentation of the use and costs of ponds and
increases in treatment costs associated with the use of more sophis
ticated wastewater treatment processes. There are two basic reasons
for the popularity of waste stabilization pond systems in developing
countries. One is the low cost, particularly for smaller communities.
Another is the fact that the optimum climatic conditions for ponds
are to be found in tropical areas where many developing countries are
located.
Wastewater Treatment Goals. It is useful to consider the waste
water treatment goals that have been identified for treatment practices
in the United States. Table VIII.1.1 shows the wastewater treatment
goals in the United States from an historical perspective (Barth, 1971).
Wastewater treatment goals for developing countries should be
primarily oriented to protecting public health through the control
of pathogens, and secondarily oriented to the removal of oxygen-
demanding materials and suspended solids. Future wastewater treatment
goals for developing countries, however, are expected to become more

441
TABLE VIII.1.1
UNITED STATES WASTEWATER TREATMENT GOALS
Time Period Goals
1900 - 1920
1920 - 1964
1964 - 1972
Current Trend
Remove: suspended solids oxygen demanding materials.
Transform NHU+ to N03~.
Remove: suspended solids B0D5.
Protect receiving water from toxicants. Control coliforms.
Remove: suspended solids oxygen-demanding materials nitrogen (or transform NHi,+ to NO3-)
phosphorus. Protect receiving water from toxicants. Control coliforms. Positive control of sludges and brines.
Elimination of discharge of all pollutants,
1920, approximate time of introduction of activated sludge process, 1964, initiation of advanced wastewater treatment research pro
gram of the U.S. Public Health Service.

442
similar to those for developed countries, and table VIII. 1.2 indicates
certain treatment processes which would then be appropriate.
STABILIZATION PONDS
History of Pond Usage in Developing Areas. Man-made stabilization
lagoons for sewage treatment, fish production, and land irrigation
have been used in Asia for centuries. In Europe, fish ponds were built
by the Greeks in Agrigantum, Sicily, before modern times (Gloyna, 1971),
and ponds have been used in India for a considerable period of time.
The use of ponds in Marandellas, Southern Rhodesia, was reported in
1960 (Hodgson, 1964). By 1967, ponds were in use in several countries
(Gloyna, 1971), including Argentina, Bolivia, Brazil, Colombia, Costa
Rica, Cuba, Ecuador, Ghana, Guatemala, India, Israel, Kenya, Mauritius,
Mexico, Nicaragua, Nigeria, Pakistan, Peru, Saudi Arabia, South Africa,
Southern Rhodesia, Thailand, Uganda, the United Arab Republic, Venezuela,
and Zambia. This list of countries was extended by Talboys (1971) to
include Chile, El Salvador, Panama, Barbados, Honduras, the Dominican
Republic, and Uruguay. This literature review found references to the
use of ponds in the additional countries of Malaysia, South Vietnam,
and Tanzania.
Biology of Waste Stabilization Ponds. Figure VIII.1.1 shows common
interactions in a waste stabilization pond (Zajic, 1971). Waste
stabilization pond operation depends upon the symbiotic relationship
between bacterial degradation of organic matter and algal photosynthetic
production of oxygen. Aerobic, facultative, and anaerobic bacteria
are found in ponds. Predominant bacteria under aerobic or facultative
conditions include Pseudomonas, Acromobacter, Flavobacterium, and

443
c n) u
• H
X o H
C (V oo o r4 4 J
T- l 5 5
en 3 L i O
. C D . U) O
• C O ,
HI t>o
• o 3
i-H
co
r H
o Li 4J
C O
c_>
r H
o u u
c o o
r H CO
> o B ID
Bi
r-\
o u u c o u
r-H
c - o in n> c > oo ra o y a) <u
CO
-o • H r H
o CO
CO
> o E 01
OS
- I C o o
^ r H CO
c o
• H 4-1
c 111
> c o u *—' r N L l
2 e i H L l
cx,
(pu
o
o. c o
• H u
ra N
• H * H i H
JO CO 4 J CO
*—' >. Li
CO
e • H Li
a,
,«, r H
« c o
• H 4J
c HI
> c o o
•w^
HI 0 0
-o 3
r H CO
/—\ 1 3 HI CJ
C CO
> •a ra -*
HI 0 0
-o 3
i - l CO
<4H M-l
0 X s
• H
-o HI C
• H
-a e o a
s ^
HI CO
T 3 3
r H
CO
L i HI 4-1 i-H • H U -
-o Ll CO
-a c CO 4-1 CO
>* >* Li CO
•a c o o HI
CO
ter)
f - i
•4-1
0) 4 J CO L i
- C 0 0
• H JS N ^
fr CO
•o c 0
o HI
CO
dge)
3 CO
-o H I 4-1 CO
> • H 4-1 U CO
**^ >-. L i
CO
-a c o CJ HI
CO
tio
n)
CO
Li HI CO
•a HI
~o c H> 4J
X HI
>> Li
ra -o e o CJ HI
CO
c o
T-l 4J CJ HI
U-l
C • H CO
• H Q
C
o • H 4-1
CO N
T H
t-t • H 4J 3
r H
ra u 3 4-1 r H 3 CJ
•iH P
oo <
HI 0 0 Ll
ra J 3
CJ
en • H
-a •a c 3 O L i
O
r H CO CO
O a. CO
• H 7 3
C
ra HI
u O
( 0
^ c CO 4 J
o • H 4 J
D . H)
CO
s,
ioi
•H cn ^
1 g CO - r l O 4 J
CO HI 3
cn .o Ll E HI 0 > CJ HI L i -
v - ^ OJ 0 0
>>s ^ j CD
ra JZ •H y 4J * L i « HI
H

444
SUNLIGHT
AEROBIC
FISH
PROTOZOA
—. FUNGI SETTLEABLE SOLIDS-(fiACTERIA) FACULTATIVE
NEW CELLS
t DEAD CELLS
MICROBES ^ MICROBES ORGANIC WASTE *• ^ u n f c *-CH,+C02+NH. ANAEROBIC
Fig. VIII.1.1. Schematic diagram of waste stabilization lagoon operation.

A 45
Alcaligenes (McKinney, 1962; Zajic, 1971; Gann, Collier, and Lawrence,
1968; Oswald, 1968, "Advances"). Under anaerobic conditions the genus
Clostridium predominates, but sulfate-reducing and methane-forming
bacteria can also be present. Four genera of the methane-forming
bacteria have been recognized: Methanobacterium, Methanobacillus,
Methanococcus, and Methanosarcina (Mitchell, 1974). Algae in waste
stabilization lagoons have been grouped as green algae, diatoms, and
blue-green algae by Gloyna (1971) . On the other hand, Palmer (1962)
and Eckley, Canter, and Reid (1974) have grouped them as blue-green
algae, green algae, diatoms, and pigmented flagellates. A representa
tive list of algal genera reported in stabilization ponds in developing
countries is contained in Table VIII.1.3. In this table, the
genera most commonly found are Chlorella, Oscillatoria, Chlamydomonas,
and Euglena.
Protozoa, rotifers, and fungi occur in ponds and are important in
obtaining effluents with minimum turbidity (Calaway, 1968; Ruttner,
1973; Gloyna, 1971; Cubillos, 1970; Canter, 1969; Purushothaman, 1970;
and Amin and Ganapati, 19 72). Rotifers are of special interest because
they feed on small organic particles as well as on bacteria and algae
(Pennak, 1953; Ruttner, 1973; McKinney, 1962). The role of fungi in
waste treatment resides in their capacity to assimilate a wide range
of complex organic materials, and their ability to produce bactericidal
substances (Carpenter, 1969; Vennes, 1970; and Zajic, 1971).
At least two orders of crustaceans have been found in waste
stabilization ponds: Clodocera and Copepoda. The genera Daphnia
belonging to the former, and Cyclops belonging to the latter, have been
identified in many stabilization lagoons (Diaz, 1975). Like rotifers,

446
TABLE VIII.1.3
ALGAL GENERA OBSERVED IN STABILIZATION PONDS IN DEVELOPING COUNTRIES
Country Algal Genera Reference
Brazil
Colombia (Cali)
Chlorella
Chlorella Carteria Euglena Chlamydomonas Lepocinclis Nitzchia Achromobacter Pseudomonas Flavobacterium
Talboys, 1971
Canter, 1969
Jourdan, 1969
Colombia (Palmira)
India (Ahmedabad)
Chlorella Euglena
Arthrosphira Oscillatoria Chlorella
Canter, 1969
Jayangoudar et al. , 1970 Amin and Ganapati, 1972
India (Madras)
Mexico (Durango)
Eudorina Oocystis Pandorina Merismopedia Oscj-xlatorxa Spirulina
Chlorella Scenedesmus Euglena Oscillatoria Phacus
Purushothaman, 1970
Talboys, 1971
Panama (Canal Zone)
Peru (Lima)
Chlorella
Chlamydomonas
Euglena Anacystis Pseudomonas Alcaligenes
Chlorella Euglena
Longley, Young, and Ashmore, 1970
Eckley, Canter, and Reid, 1974
Talboys, 1971

447
TABLE VIII. 1.3—Continued
Country Algal Genera Reference
Rhodesia (Mandarellas) Golenkinia Scenedesmus Closteriopsia Micractinium
Hodgson, 1964
Thailand
Zambia (Lusaka)
Chlore11a
Micractinium Ankistrodesmus Euglena Chlorella
McGarry, 1970
Marais, 1970

448
clodocerans and copepods feed on bacteria and algae, and are important
to the clarification of pond effluents (Vennes, 1970; De Noyelles,
1967; Tschortner, 1968; and Hodgson, 1964).
Snails in waste stabilization ponds can act as vectors in the
transmission of schistosomiasis. Pond detention time is important
in this regard, since Hodgson (1964), while investigating a pond in
Mandarellas, Southern Rhodesia, found that snail vectors were not
capable of survival for more than ten weeks in a pond environment.
Aquatic insects such as mosquitoes can be a problem in ponds
with no routine maintenance program (Kimmerle and Enns, 1968).
Periodic removal of peripheral vegetation is generally required for
achieving positive control (Longley, Young, and Ashmore, 1970; Eckley,
Canter, and Reid, 1974; and Marais, 1966).
Fish in waste stabilization ponds can be used for insect control,
algae control, and production of protein for animal and human consump
tion. Protein production and sewage treatment may have conflicting
purposes, however, since sewage can be treated and passed through
ponds at a rate greater than that at which maximum fish growth takes
place (Mortimer and Hickling, 1954). The use of fish in waste stabili
zation ponds has been reported in Java, Thailand, Burma, Malaya,
Sumatra, the Philippines, Formosa, Ceylon, the British West Indies,
India, Rhodesia, China, Trinidad, Borneo, Pakistan, Puerto Rico, and
Hawaii (Swingle, 1960; Mortimer and Hickling, 1954; Hodgson, 1964;
McGarry, 1970; and Duffer, 1974).
Climatic Factors Affecting Pond Performance. Temperature, solar
radiation, wind speed, evaporation, and rainfall are the principal
climatic factors which affect pond performance. Temperature affects

449
photosynthetic oxygen production, rate of organic degradation, and
chemical and biochemical reactions occurring in the pond. The optimum
temperature for a pond system is from 25 to 32 C (Diaz, 1975).
Thermal stratification can occur in ponds as a result of liquid
temperature differentials. If stratification persists, non-motile
algae below the thermocline cannot enter the photic zone, and thus die
due to lack of light (Marais, 1970). Thermal stratification can also
cause short-circuiting, resulting in reduced effluent quality (Barsom,
1973).
Solar radiation affects the water temperature of ponds, and is
also the energy source for photosynthesis. Probable values for visible
solar energy are given in Table VIII.1.4 (Oswald and Gotaas, 1955).
This table indicates that the predicted minimum and maximum values of
visible solar energy for tropical areas are 120 and 270 Langleys,
respectively. Measured values for ponds in tropical areas often
exceed 270 Langleys (Gloyna, 1971; Marais, 1970; Eckley, Canter, and
Reid, 1974; Canter, 1969; and Hodgson, 1964). According to Marais
(1970), solar radiation in tropical areas does not seem to be a
critical factor for algal growth and oxygen production.
Wind is a prominent factor affecting the performance of waste
stabilization ponds. Wind aids reaeration in the top layer, and induces
mixing in the whole body of water. Mixing is of special interest
because it overcomes stratification, distributes oxygen from the top
layers to the bottom layers, maintains non-mobile algae in suspension,
enhances algae growth, and increases the organic capacity of ponds
(Marais, 1970). Wind can also cause de-aeration under super-saturated
conditions of dissolved oxygen (Canter, 1969), and during periods of

450
TABLE V I I I . 1 . 4
PROBABLE VALUES OF VISIBLE SOLAR ENERGY AS A FUNCTION OF LATITUDE AND MONTH (IN LANGLEYS)3
( L a n g l e y s , c a l / c m 2 / d a y )
Latitude
0
10
20
30
40
50
60
max. min.
max. min.
max. min.
max. min.
max. min.
max. min.
max. min.
Jan.
255 210
223 179
183 134
136 76
80 30
28 10
7 2
Feb.
266 219
244 184
213 140
176 96
130 53
70 19
32 4
Mar.
271 206
264 193
246 168
218 134
181 95
141 58
107 33
Apr.
266 188
271 183
271 170
261 151
181 125
210 97
176 79
May
249 182
270 192
284 194
290 184
286 162
271 144
249 132
June
236 103
262 129
284 148
296 163
298 173
297 176
294 174
July
238 137
265 158
282 172
289 178
288 172
280 155
268 144
Aug.
252 167
266 176
272 177
271 166
258 147
236 125
205 .100
Sep.
269 207
266 196
252 176
231 147
203 112
166 73
126 38
Oct.
265 203
248 181
224 150
192 113
152 72
100 40
43 26
Nov.
256 202
228 176
190 138
148 90
95 42
40 15
10 3
Dec.
253 195
225 162
182 120
126 70
66 24
26 7
5 1
SOURCE: Oswald and Gotaas, 1955.
One Langley equals one cal/cm2 /day. Correction for cloudiness i s : Sc = Sm i n + r (S m a x - S m i n ) , where R = t o t a l hours sunsh ine / to ta l possible hours sunshine. Correction for e levat ion up to 10,000 feet i s S c = S (1 + O.Ole), where e = elevat ion in hundreds of fee t .

451
excessive windspeed settleable solids might become suspended, thus
reducing light penetration and consequently reducing photosynthetic
activity. Excessive windspeed may also cause erosion along the edges
of ponds (Callaway and Wagner, 1966). To avoid short-circuiting
from inlet to outlet and retardation of the normal flow, the pond
layout should be planned in a way to prevent having the prevailing
wind direction along the line of flow (Callaway and Wagner, 1966).
Prevailing wind direction is also an important consideration in the
location of lagoons with respect to housing. A minimum of one-quarter
mile from the housing area to the pond location is suggested (Callaway
and Wagner, 1966) .
Evaporation and rainfall are interrelated, and in various ways
are affected by temperature, solar radiation, and wind speed. In
tropical areas, evaporation might play an important role in determining
the level of water maintained in the lagoon (Callaway and Wagner, 1966).
Evaporation loss should be considered in lagoon design, or supplemental
water should be provided to compensate for the evaporation loss
(Barsom, 1973). Oswald (1968) reported that algae converting light
into heat accelerate the rate of evaporation in ponds. Evaporation
in algae cultures is at least ten percent greater than in plain
water. Rainfall is important due to hydraulic design considerations
for ponds. A heavy rain can increase reaeration, induce mixing,
contribute water with large concentrations of dissolved oxygen, and
in some cases, break down stratification in ponds.
Design Practice for Ponds. The majority of waste stabilization
ponds are designed on the basis of organic loading, depth, and deten
tion time (Zajic, 1971). Other factors influencing the design of

452
ponds are temperature, light, volumetric loading, bottom sediment
accumulation, toxicity of waste, size and shape of pond facilities,
hydraulic principles, and mode of operation (Gloyna, 1965). As
Canter (1969) proposed, two approaches to designing waste stabilization
ponds are: (1) use of design criteria based on usage and (2) use
of empirical design equations based on experimentation.
Design criteria based on usage should be given preference
depending on availability of satisfactory operating experiences and
existence of similar climatic conditions prevailing in the area.
While in the United States organic loadings for facultative ponds of
fifty pounds BOD5/acre/day or less are most often used (Canter,
Englande, and Mauldin, 1969), tropical areas can receive three to
seven times this loading with successful results (Diaz, 1975).
Table VIII.1.5 presented by Gloyna (1971) shows organic loadings for
facultative ponds that have been used in various geographical loca
tions with good results. Table VIII.1.6 summarizes some design loadings
used on pond systems in Latin America, Asia, and Africa.
Empirical design relationships have been developed by several
investigators. These will be presented for anaerobic ponds (Vincent),
facultative ponds (Marais and Shaw, Herman and Gloyna, McGarry and
Pescod, Siddiqi and Handa), and aerobic ponds (Oswald, and Zajic).
McGarry and Pescod (1970) presented an empirical formulation
recommended by Vincent for anaerobic ponds in tropical areas. Com
plete mixing and a pH range between 6.8 and 7.2 must be assumed.
This empirical formulation is presented in Equation 1, as follows:

453
TABLE V I I I . 1 . 5
BOD LOADINGS PER UNIT AREA PER DAY UNDER VARIOUS CLIMATIC CONDITIONS
Surface Loading (Lb. BOD5/Acre/Day)
a
Less than 9
9-45
45 - 134
134 - 313
Population Per Acreb
Less than 80
80 - 405
405 - 1,215
1,215 - 2,834
Detention Time (Days)c
More than 200
200 - 100
100 - 33
33 - 17
Environmental Conditions
Frigid zone with seasonal ice cover, uniformly low water temperature and variable cloud cover.
Cold seasonal climate with seasonal ice cover and temperate summer temperatures for short periods.
Temperate to semi-tropical zone with occasional ice cover and no prolonged cloud cover.
Tropical zone with uniformly distributed sunshine and temperature and no seasonal cloud cover.
SOURCE: Gloyna, 1971.
aBased on the assumption that the effluent volume i s equal to the influent volume, i . e . , that the sum of the evaporative and seepage losses i s not greater than r a i n f a l l .
^Assuming a contr ibution of 0.11 l b . BOD5 per person per day.
cBased on an influent volume of 260 gallons of waste per person per day.

OJ o u 3 o w
en X 1-1 CO
a Q>
OJ
en n-i a o o
o • 0 0
O CO Z H J
Si ' " -4-1 4J a a> 0) QJ O Pn
1 /* K
>~. CO Q
0) 6 0 J-l C <J
•H <J T J - ~ . cO m o a •
' i J O M
- Q H J N—-'
c o • H 4J cO
a o
_ 1
cfl
o • H M CU
1 c 1-1
Lat
H CS N
'
i-H 0J
> H en i H CD CO >rl J-l U CO 0) Cu .05
r* #\
OJ (U QJ
> > > • H i H - H 4-1 4-1 4J CO ct) CO 4-> 4J 4J i - t H i-H 3 3 3 O 0 O CO cfl CO
fe Pv Pn
CM H i H CN
O CO
m -3- m I I
CN
ve,
• H 4-1 CO 4-1
i H 3 CJ cfl
4-1
| U • H
s^ o (-1 QJ cfl C -2
cfl 4-1 Cfl
- 3
O
a
• <* 1
co co m co • CM
CO < ] - ^
H m ^ CN CM CM
Rica
CO u Cfl 3 3 O U U
O 0) 0) P M Pw
Cfl •• -cfl cfl CO
a e a cfl >H - H
U J J
m »—i
CM VO O i H
ico
X QJ S
* • H i-H Cfl CJ
• H X 0)
s
CO 0)
•H )-i OJ CO
CM
ve,
• H 4-1 CO 4-1 i - l 3 o cfl
4H 1 CJ
1-1 Si O U Q) CO C <:
CM
Si
• CO 1
cfl m vD
X I O 0 0
1 cfl v C CO
m
zil
Cfl U
M
r,
CD • H • H • H CO Cfl J-l
M
CO CD
• H J-l QJ CO
CO
OJ
> • H 4J CO 4->
i-H 3 CJ cfl
<4-4
1 o
• H . O O J-t (1) CO
-§
CO
, 0 o-
1 Cfl
^o
o m i—i
anama
PM
* OJ c o
M
i H CO C CO
C_)
Cfl
OJ •H J-l 1) CO
<r
Cfl OJ
•H J-i QJ CO
#1
QJ > • H
AJ Cfl 4-1 i - l 3 CJ cfl
Pn
CO
m I
CO
o m .—I
mbia
o i-H
o c_>
* CO J-i
H i - (
cfl P M
i-H QJ
i-H r - l CO )-l CO
P.
•3 C CO
,
i n
ve,
• H 4-1 Cfl 4-1 r - l
3 CJ cfl
14-1
1 CJ
1-1 Si O J-i QJ cfl C <
m
x i i n
I cfl
m
2.7
o 0 0 i - l
CO • H X I C
M
*. CO CO J-i
•n cfl
Asi CO
s
en QJ H J-< QJ CO
i D N r~- N CO ON O 1—1
QJ CO Cfl t-H i-H CO QJ QJ i-H QJ QJ
• H i H Cfl i H - H J-l h h r H J-l QJ QJ Cfl Cfl Q) CO CO O. J-l CO
CO ** •% ». Cu *>
QJ QJ QJ Q) Q)
> > > > - > • H - H i - l - H CJ OJ i - ( 4-> 4-1 4-1 4-> - H -4-1 4-> Cfl Cfl Cfl CO ,jQ CO Cfl 4-1 4-1 4-1 4J O J-l 4J H H H H J i i - l
3 3 3 3 QJ X 2 O o u o cfl 0 0 CJ cfl cfl CO cfl C - H cfl
h f l l fc [ U < J [ K
cfl 4-1 CO
CM i—1 CN CM T J -3" CM CN
O z
co ,Q m cfl • j - m •> H 4J 1 <r • co i cfl
co co in co oo TJ
o z
Si
o <t o m cr, o CN co co <r i m m i o I O
O CM 0 0 Cfl O O CN O c o i H r ^ o O CM CN i - l i n CM
•*
dia
dia
land
land
Nam
C C cfl cfl - H - H M M i - l - H CO CO 4-1
X ) X ) J 3 J 3 0) « « C C H H - H
X I X ) M M > cfl cfl ^ •»
Si Si •> « M J4 -to cfl J-i J J O O 0 0
X3 X ) 3 3 JK! ^ C QJ QJ Cu CX 0 0 0 0 cfl E 6 00 00 3 C C
- C , C cfl cfl cfl cfl cO
< < : z z « « o

455
Source
Remarks
No. of
Lagoons
Depth
(Feet)
Loadings
(Lb. BOD5/Acre/Day)
Location
i-H CN
Facultative, series
Facultative, series
vO CN
X Xl
CO TO 1 r-»
TO KJ- m
X>
TO m 0 0 I v o TO •H i n
.-1 as
Africa
Mandarellas,
Southern Rhodesia
Nairobi, Kenya
/% vO vO (Ti i-l S- /
c •H TO
•-> T1
TO
Q)
> TO Q
s—\ O
197
> w ^
T3 0 0 CO CI)
0-.
-o e TO
& VJ TO
O O
s
CT. VO CX> i-l
X ! 00 u 3
CO
^-N -a O (3 r-~ TO a\ ri H s ^ aj
1-1
M QJ H S TO U
O -U O 3 S O
-\ <J-vO C^ .-1 s-^
§ CO 01
-o 0
«
ya (1973
c QJ
0
4J C QJ
u E QJ
> O O
T3 C TO
O |Tj
r» 00 CTV o •-H CN
• m r . 0\ •H
** N TO
•H Q
«> QJ iH X I TO •U /-N
o> IH VO 0 cr>
•H C ^ O
•H N •u C TO QJ
.H TO 3 OT
e PL, ^H
• • CO
w 0 C*
;=> 0 CO
•0-r a\ i-H • w
"0 •H CU
« •a c TO
Vt
^ ^ r-l Q) .-N l*» -U CTi a\ c vo r-H TO CTl v - ' U H
v ^ CO « >> >-. u O QJ QJ
X I r-t -M
TO u TO H W U
N CO ~J
O r a\ rH
•~\ v—' O
O l rH i-l TO v»^
•M £ QJ
2 6 M TO TO
X5 13 •u 3 O O
x i 00 eg C 3 TO U >> 3 TO
PH <-)
m vo
• CO
c 0 a.
>> u TO
e •H »-i
0-t TO
• CO T ) c 0
( >. ^ TO
•o C O a cu
CO X I

456
P (Equation 1)
6(f )"- 8* +l 0
where P = Pond and effluent, 20°C BOD5 (mg/1)
P = Influent, 20°C BOD5 (mg/1) o
R = Retention time for completely mixed separate pond system
(days).
Marais and Shaw developed an equation for facultative ponds in
southern and central Africa (Gloyna, 1971). Complete mixing and
reduction of BOD according to a first-order reaction were assumed.
The equation is as follows:
L = 600 (Equation 2) P (0.18d + 8)
where: L = Effluent BODc (mg/1) P D a
d = Depth (m.)
and if the initial BOD and detention time are known:
L = Lo F 0.17 IL + 1 (Equation 3)
where: L = Influent B0D5 (mg/1)
R = Detention time at temperature T.
Herman and Gloyna also proposed an equation particularly useful
for temperate and warmer areas (Gloyna, 1971). This relationship,
shown by Equation 4, emphasizes the influence of temperature on
detention time.
V = (3.5 x 10"5) Nq L e(35_Tin) (Equation 4) 3.

457
where: V = Pond volume (m3)
N = Number of people contributing waste
q = Per capita waste contribution (liters/day)
8 = Temperature reaction coefficient = 0.085
Tin = Average water temperature of coldest month
L = Influent ultimate BOD (mg/1).
McGarry and Pescod (1970) developed an equation describing the
relationship between possible areal BOD loading and ambient monthly
mean temperature. The applicable temperature range is 20 - 90 F, and
the equation is as follows:
L = 10 (1.054)T (Equation 5) o
where: L = Areal BOD loading (pounds/acre/day) o
T = Ambient mean monthly temperature, F.
McGarry and Pescod (1970) also developed a design relationship
for primary facultative ponds in tropical areas. Equation 6 was
formulated after a study of ponds operating under 143 different
conditions:
L = 9.23 + 0.725 L (Equation 6)
r o
where: L = Areal BOD removal (pounds/acre/day)
L = Influent B0D5 (mg/1).
Siddiqi and Handa (1971) proposed a design equation after
studying ponds in seven different cities in India. The relationship
is as follows: E = 100 (Equation 7)
1 + 0.188 Lf°*48

458
where: E = BOD performance efficiency (%)
Lf = Loading factor (ratio of BOD load to oxygen production
by algae. The range of Lf must be between 0.44 and 8.0)
Oswald (1968, "Quality") proposed the following design equation
for aerobic ponds:
d 0.66 FS D L
a (Equation 8)
where: F = Oxygenation factor or ratio of oxygen produced to the
oxygen required (usually between 1.2 and 1.8)
S = Solar radiation (calories/cm2/day)
d = Depth (m)
D = Detention time (days)
L = Influent first-stage BOD (mg/1). 3.
Zajic (1971) presented a design equation developed by Oswald
and Gotaas. This relationship has also been applied to the design
of aerobic ponds:
A = HJT - (Equation 9)
where: A = Surface area of pond (cm2)
h = Unit heat of combustion (cal/gm)
W = Net weight of oxygen produced (g/day)
E = Efficiency of solar energy conversion to usable photo-
synthetic energy, usually 2 to 4%
For F and S, see equation 8.
Aerated ponds or lagoons represent an intermediate treatment
system between natural treatment (waste stabilization ponds) and
mechanical treatment (activated sludge plants). Aerated lagoons are

459
basically ponds with provisions for oxygenation through the use of
surface aeration devices. Brazilian design criteria for facul
tative ponds and aerated lagoons are summarized in Table VIII. 1.7.
Pathogen Removals in Ponds. Pond removal efficiencies for coliform
and pathogenic bacteria are usually high, and values of up to 99% are
often observed. Many theories about the destruction of pathogens in
ponds have been suggested. Parhad and Rao (1974) suggested that the
rapid die-off of coliforms may be attributed to the high pH found in
ponds. They found that E_j_ coli could not grow in wastewater with a
pH greater than 9.2. Gann, Collier, and Lawrence (1968), conducting
a study with model ponds in Oklahoma, concluded tha£ reduction of
coliforms in ponds is closely related to BOD removals, thus indicating
that coliforms are removed because of their inability to compete
successfully for nutrients. McKinney (1962) also proposed competition
for food as a principal reason for coliform removal in ponds. He
suggested that predatory protozoan populations can also be responsible.
Caldwell (1956), Davidson (1961), and Merz, Zehnpfennig, and Klima
(1962) suggested that toxic substances produced by algae reduce the
number of bacteria including coliform bacteria. Chlorellin, a substance
liberated by Chlorella, was reported to have a marked antibacterial
activity. Oswald and Gotaas (1955) stated that in a study they conducted
in laboratory and pilot plants, no anticoliform activity could be
credited to algae. They proposed that besides the normal die-off of
coliforms, the bactericidal effect of solar radiation should be taken
into consideration. Smallhorst, Walton, and Meyers (1953) suggested
that detention time and settling are also important factors in the
removal of bacteria from stabilization lagoons. Other environmental

460
TABLE VIII.1.7
DESIGN CRITERIA FOR PONDS AND AERATED LAGOONS IN BRAZIL
Facultative Pond Aerated Lagoon
Efficiency (%)
Depth (meters)
Detention time (days)
BOD5 (gm/capita-day)
Flow (1/cap-day)
Temperature ( C)
BOD /B0Ds u °
Maximum area per pond (hectares)
Constant Kj (per day)
Kg 0? added/Kg BOD removed
Kg 02 added/h.p./hr
Hp/1000 m3
90
2
—
54
170
17°C -
1.
8
21°C
46
90
3
6
54
170
20°C
1.4
8
0.35
0.7
1.2
2.68
SOURCE: Correspondence with E. Jordao, Rio de Janeiro, Brazil.

461
factors responsible for a decrease in bacterial concentrations include:
(a) dilution and mixing, (b) aggregation, (c) presence of toxic sub
stances, and (d) temperature (Gloyna, 1971).
Several equations have been developed to describe bacterial removals
in ponds. A modification of Chick's Law that describes the rate of
bacterial disappearance is as follows (Gloyna, 1971):
(N» - N' ) N' ~~ = -—• = (1 + ck'iR) (Equation 10) N' N'
o o
where: N' = Bacterial population at detention time R (days)
N' = Initial bacterial population o
N' = N' - N1 R o t
c = Non-uniformity coefficient
k'j = Rate constant, log (bacterial disappearance/day)
R = Detention time (days).
When removal occurs at a uniform rate, c = 0.
Marais (1966) proposed equations to relate the reduction of faecal
bacteria in a single pond and in a series of ponds. These equations
are, for a single pond:
N' % 100 N' (2R + 1) o
and for a series of ponds:
(N' )% _ 100 . 100 N' (2Ri + 1) (2R2 + 1)
(Equation 11)
(Equation 12)
o
where: N' = Faecal bacteria in pond effluent (per ml)
N1 = Faecal bacteria in pond influent (per ml)
R, Rj, R2 = Retention time for completely mixed separate
pond system (days).

462
Canter (1969) presented an equation for predicting pathogen
removals developed by Mauldin.
P.R. = (100) (K) R0,04 .„ . ...
0.3060.0033 (Equation 13) Li U
K = 0.0089 (L) + 2.55
where: P.R. = Percentage removal
K = Proportionality constant
L, = Organic loading rate (lb. B0D5/acre/day)
D = Depth (feet)
R = Detention time (days)
Considering the removal of viruses, stabilization ponds seem to
have higher percentage removals than conventional wastewater treatment
plants if the pond is loaded to its design capacity (Stander et al.,
1973). Shuval (1973), in studying the effectiveness of an Imhoff
tank, biological, filtration plant, and stabilization ponds for removal
of enteroviruses, concluded that ponds, although not very efficient
in virus removal (67% removal), were still more effective than the
two other wastewater treatment units. Slanetz et al. (1970), suggested
that virus removal depends on exposure to solar radiation, absorption
due to static forces, or detention beyond the normal survival time
of the virus. Virus removal seems to be independent of the biological
processes occurring in ponds.
Pond System Performance. Table VIII.1.8 contains a summary of
BOD and bacterial removals observed for ponds in developing countries.
The data reveals that the majority of the pond systems have BOD
removals of 80% or more. Values obtained for coliform removal are
much higher than for BOD removal. The data also suggests that higher

463
QJ CJ U 3 O
CO
CO M u co e QJ
P i
* H C o o
c • oo
o co Z K J
—\ &>?
e -, u O i-H
i4H cfl • H > r H O o g
U 0) OS
•-*%
5 S * w *
Q - H O cfl CQ >
o 6 01
BS
/—\ • > 1
X> CO >-H Q N - ^ ~~—
0) oo i-i C o
• H < T J - - , CO u"> O Q
• J O P3
C o
• H 4-1 CO u O
- J
CO o
• H M QJ
e < c
• H 4-1 CO
H J
< — 1
r-t 0)
. H •-H CO 1-1 CO P .
* CU
> • H 4J CO • u i H =1 o CO
P4
CM
r— O N
en o \
co r - i CM
CO CJ
• H BS
cfl 4-1 CO o
c_>
r.
CO CO C CO
C_>
CM
OJ
> • H 4-1 CO 4-1 i H 3 CJ CO
rU
•-H
. o •
z
o r-
<!• " 1 ON
3 >-i (U
P J
cO B
• H K J
CN O l csl
i-H OJ
i—l CD i-H Q) CO - H t-l H CO 0) a , co
CO 6 - -cu cu a)
r-t > > X> - H - H O 4-1 4J >-< cfl co a , 4-i 4-i
r H r H H 3 3 o a cj
• O CO CO
O fc Pu
• - i CN CN
/—N
+ —' • • Q Q CT\
• • o\
Z 2 1 CO
• i n O N
CN
„ a) >
• H 4J CO 4J • H
3 CJ CO
C4-I 1 CJ
• H X I o U 0J CO C <!
CN
CJ O ON
O CN U 0 0 0 0 0 0 vO 1 1
ON c o vo r-~
o -* • • i n Q Q
1 • •
vO 0 0
X> O OO 1
O Z Z CO ON
~*
-—, o ^ c u e O - H O O X O
vO CO i n
1-1 •1-t N CO u
oo ai oo pq cfl 2 co
r H r H
#\ CI) O QJ S oo B CO C CO
C O CO C O W ^ V - ^
3 Q
# 1
CO •H i - l •iH CO CO U
CO
CO
„ OJ
> • H 4-1 CO 4-1 r H
3 CJ CO
<4H 1 CJ
1-1 CO X CD O
i - f »-i )-l CU ai co CO C
<
CO
s~*^
+ *^s
ON ON
m r-»
CO
-o-•—1
i am
a
3 CO
P H
n (U c o
CN]
• H CO C CO
U
-*
CO 0)
• H M CU CO
•* CU
> • H 4J
Cfl CO <U 4J
• H r H U 3 <U CJ
CO CO
r*<
CO
J O N
ON
CO ON
co 0 0 CM f—l
CO • H
X> e 3
• H O
U
#, CO M
• H B
r H CO
CU
i—1
QJ r H r H CO U CO p .
m
^ 0)
> • H 4J CO 4-1 r H
3 CJ CO
C4H 1 CJ
• H X I O U OJ CO C <:
i n
ON o\ I
CO ON
r^. 0 0 1
r--vO
O r^ r H
CO • H T J C
r H
»• CO CO
CO • H W
<:
vi X ) CO
a
vo r~-
Cfl CU
• H u QJ CO
* i
QJ CU
> > • H -H 4J 4-1
Cfl CO CO QJ 4J 4-1
• H r H r H
^ 3 3 QJ U O Cfl CO CO
tn f n
CN - - I
Q O
Z Z
O CO oo r»
\o m <r CM C M C O
co co • H -iH TJ T 3 c c
M M
«• *. T3 T J CO CO
X J 2 CO CO
TJ T J CU CU
6 B X ! X !
< <
r^
CO cu
• H >-l QJ CO
•v
QJ
> •iH 4J cO 4J i-H 3 CJ Cfl
tu
CN
Q
Z
0 0 CO
i n 0 0 • H
CO • H T J C
M
n
u 3 D. 00 CO
Z
r^ r-
r H QJ
r-i r H CO u CO o .
** CU QJ
> > •iH - H 4J 4-1 CO co 4-1 4-> r H r H 3 3 CJ CJ CO co
f n f n
CM ^-4
Q Q
z z
ON r- vo
1 0 0 -<f r~
n -* ON • CO Q
1 CO Z r^ r H o-
CO CO
• H -H T J T J
c c M M
*% #> M >H 3 CO Q . r H 0 0 - H CO X !
Z CQ
0 0 ON
s O r H r H QJ r-t
r-t CO r H X CO CO
u CO 1 G ,
QJ
- > QJ i H 4J 4J CO CO U 4J
r H X 3 0 0 CJ
• H CO X P M
• <!• Q CM •
z
Q O
Z Z
i n ON CM
1 vO CO 0 0
o o <r o
1 O O vO o CN
s T J CO
c z CO r H 4J • H QJ CO - H X > H
* •* CO
JJ«! O O 3 J
J«J 0 0 C C CU CO -iH
CO 0 3

464
X) CU 3 3
•H 4-> c o u
I I
oo
w • J
H
Source
Remarks
No. of
Lagoons
1 Coliform
Removal (%)
BOD
Removal (%)
Loading (lb.
BOD /Acre/Day
Location
o i — <
Facultative, series
^ D
a
74-88
cfl CN CO CM
Africa
Mandarellas,
Southern Rhodesia
/~\ o r--c !-< W
• l - l CO
4-1 (U
1-1 CO
T5 3 O 00 3 CO ?s CO
>-)
\D O O N , - 1
c •H cO
n X> 3 CO
CD
> CO
o
^ - N
o r~~ ( i—1 ^—s
£ H CO C5 a 2
vO CT> • — 1 v^>
X oo l-l 3
M
-a 3 Cfl
u CI)
l - l • H
CU
13 4-) 4-1 3 o
^~. <r v£> ON i-H N '
c o cn t !
-a o
K
o r-- oo cr> O
ir> t^-C7» i—1
N Cfl
• H Q
* 3 O ^ .
• H O^ 4J vO CO CT\
JH 7-t
3 ^ E N O C
C M CU
CO <u <n
r-H X I
E-H r H
C/2 W U oi £3 O CO
(1974)
x i •rn CU
erf 1 3 3 CO
^ ^-s Vj .—I CU 1 ^ 4J cy> 3 .H CO w U
cn .-^ !>. o <U
X iH -H ^2 CO O
H W
CN ro
^^ 0> vO CTi . H ^—f
U CU 4J 3 CO
C_>
-d -
^ O r .-n _ c CO
6 cfl 4-1
o X cn 3 H 3
Cn
LO
. cn X I
C o P.
V-i cfl
e • H
^ PM cfl
• cn X I
3 0 D.
ary
X )
3 o CJ
cu to
-Q
• 6 m 4-1
sys
CD >-i
• H 4-1
3 W U

465
removals of coliform bacteria are obtained in ponds working in
series.
Eckley, Canter, and Reid (1974) presented performance equations
for a pond system that had been working in the Canal Zone, Panama,
for five years. The data collected during that period of time was
subjected to multiple regression analyses. The following performance
equations were derived for a three-pond system (anaerobic-facultative-
polishing) :
% BOD removal = 14.469 + 27.244 (P-E) + 73.942 (I-E) + 0.071 BOD -
P I L
0.160 N - 0.149 P. + 0.927 COD J_i L* \-i
7° JLi. coll removal = -85.264 + 122.170 (P-E) + 194.613 (I-E) + 0.969 N P I L
- 0 .586 PT - 0 . 069 COD
% N removal = 11 .466 + 87 .464 ( I - E ) + 0 .272 P - 26 .979 (P-E) + 0 .036 COD I L P L
% P removal = - 2 9 3 . 3 9 6 + 4 . 9 2 1 PT + 326 .894 ( I - E ) - 2 .962 NT + 0 .229 COD L j L L
where: BOD = Biochemical Oxygen Demand Loading (lb. /acre/day)
COD = Chemical Oxygen Demand Loading (lb./acre/day)
N = Organic Nitrogen and Ammonia Loading (lb./acre/day) Li
P = Orthophosphates Loading (lb./acre/day) J_i
Ij-E = (Influent Flow - Effluent Flow)/Influent Flow I
P-E = (Precipitation - Evaporation)/Precipitation P
N = Organic Nitrogen and Ammonia
P = Orthophosphates.

466
Sludge Accumulation in Ponds. During the first years of operation
of a facultative pond, deposition of sludge occurs at a faster rate
than it is removed by fermentation. With time (two to twenty years),
an equilibrium is reached where the rate of deposition equals the rate
of fermentation (Marais, 1970). After equilibrium is reached, sludge
accumulation in ponds treating primary and secondary effluents of
domestic wastes is practically negligible (Stander et al., 1973).
However, in tropical areas where high BOD surface loadings are utilized
and water consumption per capita is low, sludge accumulation may
become significant if lagoons are not properly designed (Gloyna, 1971).
Eckley, Canter, and Reid (1974) reported four inches of sludge
accumulation in a pond loaded with 200 lb. BOD/acre/day after two
years of operation in the Canal Zone, Panama. In the same location,
another study was made with a small experimental pond with loadings
between 5,000 and 11,000 lb. BOD/acre/day. After six months of operation,
sludge build-up was only twelve inches. The relatively small accumu
lation of sludge was probably the result of high temperatures in the
area and the consequent high rates of fermentation and methane production.
Cubillos (1970) reported 6.6 inches of sludge accumulation after two
years of operation in a pond with loadings ranging from 70 to 407
lb. BOD/acre/day in Palmira, Colombia. Hodgson (1964) reported 4.4
inches of sludge accumulation in a pond at Mandarellas, Southern
Rhodesia, after fourteen months of operation with loadings ranging
between 12 7 and 182 lb. BOD/acre/day. According to Callaway and
Wagner (1966), in properly designed lagoons the high rates of fermentation
and methane production in tropical areas made de-sludging of lagoons
unnecessary until after eight to sixteen years of operation.

467
Costs of Wastewater Treatment in Developing Countries (Ponds,
Aerated Lagoons, and Activated Sludge Systems). The cost of construction
and operation of waste stabilization ponds is lower than for any
mechanical wastewater treatment plants, provided that land costs are
not prohibitive (Gloyna, 1971). Stabilization ponds are especially
economical for small communities in rural areas (Callaway and Wagner,
1966). Table VIII.1.9 summarizes a comparison of capital costs and
operation and maintenance costs for stabilization ponds in the United
States, India, and Brazil (Reid, 1974). India's costs can be considered
applicable to other Asian as well as African developing countries,
and Brazilian costs can be extrapolated to other Latin American
countries.
A wastewater treatment system including an aerated lagoon with
a six-day detention time followed by a second lagoon with a two-day
detention time to remove excess suspended solids also was considered.
The per capita costs of construction are shown in Table VIII. 1.9.
These costs range from $6 per capita for a system serving 50,000
people up to $7.40 per capita in a system serving 5,000 people.
These costs are based on construction costs similar to those for waste
stabilization ponds including the excavation, landscape, parshall
flume, inlet and outlet structure, etc. as well as a cost of approxi
mately $400 per installed horsepower of aeration equipment. Fixed
mounted surface aerators are included in the aerated lagoon design.
The per capita capital costs of the aerated lagoon systems are
approximately half those for stabilization ponds to serve populations
of 5,000 to 10,000, and approximately 2/3 the cost per capita for
ponds serving a population between 25,000 and 50,000 people; however,

468
3
O N
r - (
• M M M
> W r-l
TAB
CO PQ H CO Q O Z U <
Z <T O W
* § Z M o h-l EH CO < W N H f-H < J H M CO
3« H W CO H
i—i
w z H [3 CO
<: w 3 as H
Pi O Pn
r o
i—l • H N
fl Ui
ca
CNl CO
• ~l TJ
.—1
CO L I
•r-i Ul
01 E
< »4-t
o
0) 01
4 - 1
CO u l
CO
•a 01
•u *rn
c 3
-—, in co • - I u i CO - H u i a
• H 03 C (_)
c j </>
intenance
apita)
C3 (_) S t
on &
/Yea
• H </> U I CO Ui
01 C O
J -c o —>
• H O U I U I ' J - H
Ui CO
Const
($/C
enance
ta)
u i « H
C C •r-l (0 CO C J
*•— " Ui - O O
01
c >• o -^-
• H < /> U l *—' CO Ui 01 a. o
- ?
c o - ^
—I CO u i u i O —<
3 C u, ca
Const
($/c
ion
U I
CO
3
c o
a.
*£>
s~\
o < •
• r^
*> o U~l
CM CO
O
ON O
CM
O m
• o
v D i n
o o o i n
r—\
o v O
VD
— O
m
CM
"i.. CM
O
• J 0 0
r H
o en
•
o
O N
0 0
o r H
o o c
o
*r*^
o - 3 -
• vO N - "
o m
o r H
< 1
1
1
1
o o o i n CM
/ ~ N
o o
•
vO v—* o o O N
r--. f~i
O
CON CM
r H
o CM
O
H r H
^r
o o o
o m
I
< j -H
o
i n CM
,-i
<r r H
O
O r~
eg
O O O
o o
1
CM r H
o
r^
^ . H
r H
^ • o
0 0
r^ r H
o o o
o o CM
X I
m
r —i
u 01
CO
3 01
CO
3
o
U I
r. 0.) F
01 Ui
r* X I
CO
* 01
3
u i 0)
c r H
X
CO 01 01 01
OS
0C
c • H Ui 0) 01 C
• H
oc
J C u i
CC
a.
C 01
CJ o CO
XI Ui
o
u C.i
• H
c
1 —
j
• H
F
OS
r i
c/)
>> 73
,. ~ -< s
• — •_ *~ — 4-J
Ui 3 D . OL
z *< ••
u i C 01
E CO 01 Ui
U I
OJ XJ
0) CO
! i
U I
« O U
3 o
- I < M
6 o Ui
( U I
(0
c * H
• - H
CO
s: 1 ; c U I
01 O C 01
T >
c o D . 01
or re
u
c CO
0 1 o < j
01 XJ 3
r H O
c
CJ o
•c
» T J 01
T J 3
f-^
U X 0)
01 Ui CO
0) u i 0)
o o
T J C CO
J
>-U I
V.
w 0
4 -™
c X I
r -
c: U i
r.i r—
C ' H
r.i c 3
t—•
u-
^ to
JZ. X
u CC
c r
r r.
T -
4 J
r
> c; c, X
o
'/ c, •c 3
i —
L
r
~~ u i
o c CJ
in U I en 0 u
r H CO U I • H O . CO
o
n 0
o oo CO
r H
T J 01 u i CO Ui 01 CO
u l C 01 01 01
u a 01 Ui
0) 01 01 0)
r" U l
C 01 Ui CO D .
c • H
0) Ui 01
.n E 3
Z

469
the operating costs would be considerably higher. This increased
cost results from the electrical requirements to operate the surface
aerators. If a relatively low cost of electricity is available, for
example, hydroelectric power, these operating costs could be minimal.
In fact, in Brazil where most of the electrical energy is generated
by hydroelectric power plants, aerated lagoons do offer a reasonable
alternative to waste stabilization ponds. The mechanical surface
aerators can also be replaced by static aeration devices which require
compressed air. This type of aeration system would minimize mainte
nance. A direct-drive blower could be used to provide the compressed
air, and the need for electricity would be minimized.
The cost of land as well as the availability of land would also
affect the type of waste treatment facility that should be installed
in developing countries. The data presented in Table VIII.1.10
indicate that the land requirements for waste stabilization ponds,
aerated lagoons, and activated sludge systems are not markedly different
for a plant with a capacity of one million gallons/day (MGD) which
is equivalent to a plant serving 10,000 people. The land requirements
range, from ten to eighteen acres for a one MGD facility. However,
as the capacity of the treatment facility approaches ten MGD (serving
approximately 100,000 people), the land requirements for waste
stabilization ponds are approximately four times the requirements
for an aerated lagoon system, and nine times the land requirements
for an activated sludge plant.
The land requirements for treating wastewater in stabilization
ponds increase rapidly as the capacity of the plant increases, so
that the requirements to treat 100 MGD of wastewater (serving

470
TABLE VIII.1.10
LAND REQUIREMENTS OF WASTEWATER TREATMENT FACILITIES
Capacity . Acres Acres Acres (MGD) Population (Pondsa) (Aerated Lagoons
b) (Activated Sludgec)
1-1
10
25
50
100
10,000
100,000
250,000
500,000
1,000,000
18
180
450
900
1,800
15
50
90
125
250
10
20
35
45
70
aBased on V = (3.5 x 10~5)NqLa9(35
°Based on 6-day detention time. CEPA estimates.
T™) and depth = 2 meters.

471
approximately 1,000,000 people) is 1800 acres for waste stabilization
ponds compared to only 70 acres for an activated sludge system. In
some of the large urban-industrial metropolitan areas in developing
countries, land may not be available at a sufficiently reasonable
cost to rely on waste stabilization ponds as a means of providing
adequate treatment of municipal wastewaters. Therefore, it may be
necessary to install a waste treatment facility which includes
screening, grit removal, primary sedimentation, an activated sludge
system, and anaerobic digestion of the sludge. In such a system,
the sludges can be handled by the anaerobic digestion, and the
methane gas produced can be recovered and used to provide some of
the energy required to operate the plant.
The capital and operating costs for wastewater treatment using
activated sludge for biological treatment and anaerobic digestion
and energy recovery is presented in Table VIII.1.11. By adding
energy recovery by anaerobic digestion the cost is approximately
doubled. However, as the size of the plant increases, the capital
costs of the activated sludge system become more competitive with
waste stabilization ponds, especially in areas where the cost of
land is high. Therefore, the various alternatives should be evaluated
in terms of land availability, costs of land, and ease of expansion
of the system to meet future population requirements.
Energy requirements for wastewater treatment represent another
decision factor for treatment process selection. Some energy can
be obtained from digester gas in an activated sludge plant. For
example, a schematic diagram of an anaerobic digestion system with
power and heat recovery using dual fuel engines is shown in Figure VIII.1.2.

472
.
r-H
r-H
• r-H
• M H M
> W l - l CO
< H
Pi O P-
H CO
o c_>
o 3 M H
3 W Pu O
o 2
< h J
<! H i—i PH
u
p i
o fe w o Q
^ hJ CO
O W H
<: > M H U
< O 2 M to P H 2
<: r J PH
H
TME
< s H
PS W H
< W H CO
< S
OVERY
u w P i
> H
o Pi w 2
w Q
gi Z o M H CO W -—v O co
S3 r J
CJ H J M O PQ Q O Pi m HJ h ~ <; CT\ 2 T—• *5 *^
o gj H S3
TME
<C w Pi H J
<; o
OLOGI
PQ
• u '
en O
CJ
oc c •H AJ cfl M CU a o
•u en o u rH CO 4-> •H a CO
**
dling
ical
r)
c ^ >> s u a
a) co a) I-I u oo W ^ D X ) v_r-
rH C CO CO
• - CJ ^ <n u u
r-t CU > , CO - ^ .
a - a.
Chem
Labo
($/c
ion and
overy
a)
4-1 CJ 4-> cn cu -H a) P<1 a
e Dig
ergy
($/Ca
00 C T3 W 3
r—t
CO
1
Wast
e tm
ent
a)
CO 4-1 r H CU - H CO t-i CX O H CO
Biologi
water
($/c
c o
•H TJ 4-1 CU CO >
rH l-l
ity
Popu
D)
Se
cj c j CO £ CI. ^ CO
CJ
CN m rH t o
rn m
ro CTi
00
•co
co r^
<r> co
co o o
o r H
r H
CN CO
o
\0 c^
c
ON r-» O t—t
co -<t-
rH CNl
o o o
o o 1—1
o 1—t
r» CNJ
O
O r—
O
O ro t~~
00 i n
r-~ t H
o o o
o m CM
un CN
-cfr CN
o
vO i n
o
00 m vD
00 r^ i n r H
O O o
o o i n
o m
CN|
CNl
o
vD <r
o
CO rH
vO
CNl
CN
<r i -H
o o o
o o o
o o rH

473
< Id X LU
IU3SNVH0X3 1V3H H-
A A A A A A A 1/ V V V V V V \l
03 0) c
•H 00
c 0)
0) 3
14-1
I rH cO 3
13
•H
e o
CO U <D c aj oo <-i co
. c
X I C
CO
OJ
o a.
tt or Ul o z < X o X Ul 1-4
CO 6 OJ
x: o
C/3
. CN
t H
•
oo •H

474
The gas produced during anaerobic digestion contains approximately
600-700 BTU per cubic foot. However, to use the gas in a dual fuel
engine, the hydrogen sulfide must be removed. Hydrogen sulfide is
generally removed using iron oxide mixed with wood shavings. The
dual fuel engine uses the methane gas with some auxiliary diesel oil,
and the mechanical energy generated can be used to drive the blowers
required to aerate the activated sludge system. The cooling water
from the engine is used in a heat exchanger to heat the sludge entering
the digestion system. Any excess gas beyond that required to drive
the blowers is converted to electrical energy by means of a dual
fuel engine and an electrical generating set. This electrical energy
is used throughout the treatment plant to operate pumps and meet
other electrical needs.
The energy requirements to treat municipal wastewater at acti
vated sludge plants with capacities ranging from one MGD up to 100
MGD are shown in Table VIII.1.12. Energy balances for municipal waste
treatment plants with energy recovery and utilization are shown in
Table VIII.1.13 for plant capacities of 1, 10, 25, 50, and '100 MGD.
The total energy requirements are separated into energy required by
the diffused air system and other energy requirements in the plant.
The energy available from the digested gas also is tabulated along
with the requirements for pilot oil which is essential to the opera
tion of the dual fuel engine. The conversion factors for reducing
all the energy requirements to BTU's per day are also included in the
table. The energy balance indicates that the amount of gas produced
at the plant treating one MGD of wastewater (serving 10,000 people)
is not sufficient to meet all the energy requirements for the

475
TABLE VIII.1.12
ELECTRICAL ENERGY REQUIREMENTS FOR UNIT PROCESSES AND OPERATIONS IN AN
ACTIVATED SLUDGE PLANT (KILOWATT-HOURS/DAY)
Treatment Unit
Preliminary Treatment Bar Screens Comminutors Grit Removal
Influent Pumping (30 Feet Total Head)
Primary Sedimentation (800 gpd/ft2)
Activated Sludge Process Diffused Air Recirculation Pumping
(50%, 17.5 ft.)
Final Sedimentation (800 gpd/ft2)
Chlorination
Lights & Miscellaneous Power
Sludge Treatment Sludge Pumping Gravity Thickeners Anaerobic Digesters
Mixing Heating Compressors
(Gas Storage)
Total
1
2 16 2
153
31
553 45
31
1
57
2 11
84 23
17
1,008
10
2 61 4
1,451
122
5,324 423
122
1
210
21 21
212 68
168
8,210
Plant Size
25
3 92 9
3,233
224
13,310 943
224
67
450
51 21
334 119
420
19,500
(MGD)
50
6 142 17
6,467
347
26,620 1,886
347
134
950
102 21
448 180
841
38,508
100
11 204 34
12,933
734
53,240 3,772
734
267
2,400
204 41
673 324
1,683
77,254

476
w
<
i s co
to
u -v o oi
H p •H 'H PL, 3
cr
CO '
CO Q
3 J> i-l .—I O •H D. ^ U ^
•H 3 X u - c/3 0) 3
O H 03
0J (0 i-l to
CO :=>
00 O 03
X ) CO
i H • H CO
> <
C3
l-i CI) J-l CD CD
Xl > \ CO CO
c ~~-OJ L D
I- E O CJ a> —•
X. U 4-1 -H X O 3
4) H a: as
e 01 core >•> 9s K CO
c/1 u Q C ^s .
u OJ ^o TH E O < o> — i
•a -H x oj 3 en cr o 3 ai H
*4-< OS 03
c o
•rt -O * J at CO >
r - l l-l 3 01 D. W. O a.
c —i a CO U O
H u Z
CO
u
o
i—I CO »—* - H + -H r o vc
— + + +
O •J- c
X
ON
CO oo CO
CO ON
o o o o —*
o o o o o —'
o o o o m CN
o o o o o i n
r> c o ~ o o
~-» C i n —< CN
o o
o i n
m ^ D
II
-*~N 1 *
3 O
T k->
0) 3 o a CJ CO 1-1
o x; - C CO
• H i J
• rJ U
a w
^ X i c X 0 3
CU C
o
• CO l-l CU 3 o
- H X i
cu > • H l-l
T 3
J-l O CU
u • H
a CO
» H pa
o o CN C ^
II
l-i 3
o X. 1
i J XJ
<0 3 o
1—1 • H ^C
< — ' l-l
X 1 3 U 0)
c o
c c
• H
rat
OJ
c 01
oo 1—i CO
o • H
u u V 01
f—1 01
!-< 01
x: XJ
o X>
Co H 0 3
c o o * o
- 3 -r-*
II
c 0
*-* — c: to
G
c o
—J —-4
c
—' Cv 'X 0
• * J
• 3
0 3 u
U
"J X
E ~ 2 ;
u

477
wastewater treatment plant. However, even at this plant size,
sufficient digester gas is generated to drive the blowers required
for aeration of the activated sludge system and to generate a consi
derable portion of the other electrical energy requirements. The
amount of energy available in the digester gas produced at a treat
ment plant with a capacity of ten MGD or greater is sufficient to
meet all the energy requirements of the municipal wastewater treat
ment plant. In fact, the amount of gas produced contains more energy
than is required to drive the diffused air blowers and meet other
electrical requirements. The amount of excess energy increases as
the plant capacity increases. However, it should be pointed out that
the energy available in the gas produced by anaerobic digestion of
municipal wastewaters would provide only a small fraction of the
energy used by most major metropolitan areas. However, this energy
may be made available to the population in the immediate vicinity of
the plant either in the form of heat for space heating or as elec
tricity during hours of peak usage.
Therefore, although waste stabilization ponds provide a relatively
low cost treatment alternative for pollution abatement in developing
countries, the availability of land and the cost of land may increase
the capital cost of waste stabilization ponds to such a level that
other wastewater treatment systems are in fact more economical. In
large urban areas, the activated sludge system will provide high
efficiency treatment of the wastewater, and the sludges generated
during treatment can be stabilized by anaerobic digestion and the
gases produced can be recovered and utilized to meet the energy
demands of the treatment plant.

478
ALTERNATIVE DISPOSAL METHODS
The paragraphs which follow contain brief descriptions of two
additional wastewater disposal methods which would be of interest
in developing countries.
Fish Production. Interest in the United States in the use of
fish as collecting devices in tertiary lagoons was primarily due to
the federal effluent requirements of 30 mg/1 suspended solids set by
the Environmental Protection Agency (EPA). This requirement made
obsolete many of the single pass lagoons used in small cities and
towns, and aquaculture provided one possible solution to this problem.
The primary impetus in developing countries for using fish in sewage
lagoons is food production, and the rules of fish culture where produc
tion of the greatest amounts of fish is the goal, are not the same
as the rules for removal of the greatest amount of contaminants.
Unfortunately, one cannot optimize simultaneously both fish production
and nutrient removal.
Prof. Hoser at the University of Munich observed the following
difficulties in the use of fish in sewage ponds: (1) maintenance of
a sufficiently high oxygen concentration by keeping the sewage fresh,
and avoiding sludge deposits, and destroying surface growths (to main
tain 3 ppm dissolved oxygen, sprays and narrow sluices have been used
at various installations); (2) elimination of toxic substances and con
ditions, such as ammonia, sulfides, improper pH or water temperatures;
and (3) the maintenance of a biological balance that would yield ade
quate quantities of fish food.

479
As practiced in central Europe, the dilutions of two to five
volumes of clean water were employed for settled sewage and the ponds
were from 1 to 2h feet deep with a loading of 800 to 1,000 people
per surface acre of pond (Imhoff had suggested 800 people/acre).
Ducks kept the ponds clear of undesirable weeds, and one acre of
pond was said to produce from 400 to 500 pounds of fish and from 200
to 250 pounds of duck meat. The ponds were drained and cleaned during
the winter when ice conditions and retarded aquatic life interfered
with fish raising, and this necessitated disposal by other means at
this time. In some instances, special hibernating basins were provided
for the animal and plant pond life, and the ponds were filled again
in the spring.
Carpenter, Coleman, and Jarman at the Oklahoma State Health Depart
ment and Spear at the University of Oklahoma conducted research on fish
production in sewage lagoons (5,7,15). Data associated with this re
search shows that Oklahoma City had cultured successfully such species
as carp, goldfish, fathead minnow, golden shiner, black bullhead, chan
nel catfish, mosquito fish, bluegill, green sunfish, largemouth bass, and
Tilapia nilotrica. The Quail Creek sewage plant located in the Oklahoma
City metropolitan area consisted of a six-cell series lagoon with a Hinde
Air-Aqua spray in the first two cells. Each cell was six acres in
area with a depth of five feet. Catfish were placed in the third and
fourth cells, golden shiners in the fifth and sixth cells, and fathead
minnow and Tilapia in the third cell. The mean value of weekly
analyses from June to October showed a BOD5 removal of 95%. There

480
was 94% removal of suspended solids with an effluent concentration
of twelve mg/1. The nitrogen to phosphorous ratio was reduced from
2/1 in the influent to about 1/1 in the effluent. The fecal coliform
bacteria was reduced from 3 x 10⁶ to twenty (Most Probable Number/100 ml),
and in the first cell the ammonia concentration was reduced from
twelve mg/1 to one mg/1. Spear was not so successful using buffalo
fish under wintertime conditions (15).
Studies on the use of Tilapia in sewage ponds in Oklahoma reported
an increase of from 1,500 to 4,300 pounds/acre in 191 days. Similarly,
catfish increased by 600 to 4,400 pounds/acre and shiners from 85 to
536 pounds/acre, in a four month period (7,15). These appear to be repre
sentative numbers when waste disposal is the primary objective. By
contrast, in intensive fish production, Tilapia will increase by four
to five times as much when fed grain in the amount of three percent
of body weight/day as when fed on algae, and by twenty to forty times
as much in the same time period, as when fed on sewage effluent.
However, if fish production is the goal, one still has an effluent
to be dispersed (13). Productivity also depends on what is grown.
Selection must be made of the best species and combinations of fish
and other waterlife such as bass/Tilapia. salmon/amphid, or Tilapia/
bass/crayfish; of whether to breed or fatten using fish or fingerlings.
Vascular aquatic plants including water hyacinth are also candi
dates for mineral nutrient removal (1,3). Rush ponds are used some
places in Holland instead of activated sludge units. The production
of plants can be used as ruminant feed or for methane production,
whereas fish production can be. used for animal feed and fertilizer.

481
It was estimated in Oklahoma that the net income from fish was about
2 %c/l,000 gallons of sewage treated (7).
There are potential health problems associated with fish grown
in wastewaters and it has been recommended in Europe that such fish
be removed to fresh water two to three weeks prior to sale. Sal
monella, polioviruses, Coxsackie viruses, shigella, cholera vibrios,
and enteropathogenic viral hepatitis, have all been implicated in fish
and shell fish (4,6).
Oxidation ditch. The device called the oxidation ditch or dutch
ditch utilizes a brush type aerator for extended aeration. The water
circulates in a ditch or tank in circular fashion. See Figure VIII.1.3.
This system may find application in the case of large, extended aeration,
activated sludge plants. The unit is well adapted to small communities
particularly where a shallow depth is desired. However, the aerator
unit which is manufactured in Europe or in the United States is
expensive, costing from three to four times as much as the floating
conventional pumping aerators, whereas Thailand has manufactured
aerator-rotors costing approximately one-tenth as much as the European
or American units. This is an excellent example of the transfer of
an appropriate technology to a developing country. In order to avoid
the expense associated with the brush aerator Pasveer in the Nether
lands developed the modification called the carousel in which a deeper
sump is incorporated at one place in the ditch and a conventional mechani
cal floating aerator is used instead of a brush aerator. Another
type of aeration unit called the INKA has been reported in use with
the oxidation ditch. With this unit, large volumes of air are
released at low submergence heads, and the location of the unit has
little effect on the oxygen transfer characteristics.

482
330 ft.
(Top View)
52.5 ft.
b a r r i e r
1 2€t25 I 2625 I
b a r r i e r
(Cross -Sec t iona l Side View)
water level
Fig. VIII.1.3. Basic oxidation ditch design.

483
VIII.2.
AERATED LAGOONS
Kung-cheh George Li
INTRODUCTION
An a e r a t e d l agoon i s a b a s i n of s i g n i f i c a n t d e p t h ( e i g h t t o t w e l v e
f e e t ) i n which w a s t e w a t e r i s t r e a t e d on a f l o w - t h r o u g h b a s i s . Oxygen
i s u s u a l l y s u p p l i e d e i t h e r by means of s u r f a c e a e r a t o r s o r a i r d i f f u s e r
u n i t s t o m a i n t a i n a minimum d i s s o l v e d oxygen c o n t e n t of one mg/1 i n
t h e b a s i n . Because a e r a t e d l a g o o n s a r e c h e a p e r i n t e rms of c a p i t a l
and m a i n t e n a n c e c o s t s i n c o m p a r i s o n t o most c o n v e n t i o n a l b i o l o g i c a l
w a s t e t r e a t m e n t m e t h o d s , t h e y can be c l a s s i f i e d as one of t h e lower
c o s t w a s t e t r e a t m e n t methods s u i t a b l e f o r c o n s i d e r a t i o n i n d e v e l o p i n g
c o u n t r i e s .
ADVANTAGES OF AERATED LAGOONS IN DEVELOPING COUNTRIES
1. When compared with s t a b i l i z a t i o n ponds , ae ra ted lagoons have
the a b i l i t y to handle h igher load ings with a s h o r t e r de t en t ion time in
a reduced a rea and with g r e a t e r lagoon depth. The land a rea r equ i r ed
for an ae ra ted lagoon i s commonly one- ten th to one-e ighth of t h a t r equ i r ed
for a s t a b i l i z a t i o n pond.
2. Unlike s t a b i l i z a t i o n ponds , ae ra t ed lagoons do not depend on
algae for t h e i r oxygen s o u r c e ; t h e r e f o r e , they can cont inue to funct ion

484
without regard to the amount of available sunlight. In temperate
climates it has been found that during winter the algae in waste
stabilization ponds do not produce enough oxygen to satisfy the bac
terial demand for it.
3. Generally, primary settling, sludge settling, sludge recir
culation or sludge drying are not necessary for aerated lagoons.
4. The maintenance required for aerated lagoons is not complex.
They do not need the type of biological operation control which is
necessary for a conventional biological waste treatment process.
5. The surface aerators which are most commonly used as aeration
equipment in aerated lagoons can be easily manufactured locally.
6. The aerated lagoon can be constructed easily using earthwork,
and the surface aerators used can be readily obtained by ordering the
correct size and number of aerator units to suit the design of the
lagoon on a "do-it-yourself" basis. This factor makes it a treatment
process which is quite suitable for most developing country situations.
7. With regard to annual cost, the aerated lagoon lies somewhere
between the waste stabilization pond on one hand and the oxidation
ditch and conventional treatment methods on the other. Because of
this the aerated lagoon is believed to represent one of the best com
promise treatment methods for developing countries (1,6).
BASIC CONSIDERATIONS
Two types of aerated lagoons can be considered: the aerobic
lagoon and the aerobic—anaerobic lagoon (4).
In an aerobic lagoon, all the solids are in suspension so that
the concentration of effluent suspended solids will be equal to the

485
concentration of solids in the basin. Generally, separate sludge
settling and disposal facilities are required. The system will be
similar to the activated sludge process, and the BOD removal efficiency
can be as high as seventy to ninety percent.
In an aerobic - anaerobic lagoon, the turbulence level maintained
insures uniform distribution of oxygen throughout the basin but is
usually insufficient to maintain all the solids in suspension. As
a result, a certain amount of solids deposit on the bottom and undergo
anaerobic decomposition. Because the deposited solids undergo anaero
bic decomposition, the net sludge accumulation is not too much. The
sludge needs to be moved out only periodically. Generally a BOD removal
efficiency of seventy to ninety percent can again be attained, but the
effluent may contain relatively high concentrations of suspended solids
which make the effluent have a slightly turbid appearance. The lagoon
can be followed by a settling basin or a shallow pond if desired, and
this will assist further in the removal of solids and BOD. A typical
aerated lagoon is shown in Figure VIII.2.1.
PROCESS DESIGN CONSIDERATIONS
The main considerations in the design of aerated lagoons include
(1) detention time, (2) lagoon temperature and its effects (3) oxygen
demand and supply, (4) oxygen transfer and aerator performance, and
(5) energy requirements for mixing.
1. Detention time. Assuming the aerated lagoon system to be
completely mixed, at steady-state, and the biological reaction to be
a first-order reaction, the common relationship in the lagoon is
described by the following equation:

486
-iNLET CHAMBER AERATOR
-8
SECTIONAL
8»<
.a t " > e Ftti
ELEVATION
/
INLET CHAMBE
AERATOR
® ® 0
PLAN
k-.Z OUTUT
HAM8ER
Fig. VIII.2.1. Aerated lagoon.
SOURCE: S. J. Arceivala, S. R. Alagarsamy, and J. S. S. Laksh-minarayanaj "Design and Construction of Aerated Lagoons in India," Proceedings of a Symposium on Low Cost Waste Treatment (Nagpur, India: CPHERI, 1969).

487
where Le = effluent BOD concentration (mg/1),
Lo = influent BOD concentration (mg/1),
K = overall first-order BOD removal rate (day-1), and
t = detention time (days) (2).
From equation (8-2-1) the detention time and thereby the volume
of the lagoon can be determined. The value of K may be determined
from pilot tests or estimated from available data. Reported values
of K have ranged from 0.3 to over 1.0 (2). The detention time commonly
ranges from three to five days or more depending upon the characteristics
of the wastes (1).
2. Lagoon temperature and its effects. Temperatures in a lagoon
may vary considerably between winter and summer conditions, and the
temperature variations will exert a profound effect on the rate of
BOD removal due to the low solids level maintained in the lagoon (7).
The lagoon temperature can be estimated from the general air or ambient
temperature, since the lagoon temperature generally follows the air
temperature in most areas. The value of the removal rate K at a temp
erature other than 20 C can be determined by using the following equa
tion:
*T = K20°C e ( T " 2° } ' (8-2-2)
where K = removal rate at temperature T C,
K _or = removal rate at temperature 20 C,
T = lagoon temperature ( C), and
9 = temperature coefficient.
The value of the temperature coefficient 8 is a function of the

488
biodegradability of the wastes and commonly lies in a range between
1.035 to 1.075, with 1.035 being the most common value (2).
3. Oxygen demand and supply. Oxygen requirements in an aerated
lagoon occur as a result of both assimilative and endogenous respira
tion. However, since the concentration of microbial suspended solids
is generally at a low level (80-200 mg/1 VSS, volatile suspended solids),
the oxygen requirement can be directly related to the BOD removal as
follows:
lbs of oxygen required/day = a • lbs of BOD5 removed/day.
(8-2-3)
The value of the constant (a) depends on the nature of the waste, the
mixing level, and the temperature. It can be determined by laboratory
or field testing of the wastewater to be treated, or it can be esti
mated from data on similar wastes elsewhere. Common values range from
1.0 to 1.4 (7).
Oxygen is supplied to the aerated lagoon partly by surface aera
tion resulting from surface turbulence and wave action and partly by
aeration induced with diffuse or surface aerators. It is reasonable
to assume that the surface aeration component has been used to compen
sate for the additional oxygen demand from the benthal oxidation of
anaerobic decomposition products (6). Therefore, the total oxygen
requirements of the lagoon are considered to be supplied solely by
the induced aeration system, and the surface aeration will be neglected.
Diffuser aeration systems which are high in both initial and
maintenance costs are not preferred for aerated lagoons. Most systems
use surface aerators.

489
4. Oxygen transfer and aerator performance. The oxygen
transferred by the surface aeration units can be computed with the
following equation (1):
C - C N = N o [^L- L (1#02)T - 20 m a]> (8-2-4)
s
where N = lbs of oxygen/hp-hr transferred under field conditions,
No = lbs of oxygen/hp-hr transferred in water at 20 C and
zero dissolved oxygen (i.e., under standard conditions) ,
C = oxygen saturation concentration in lagoon at T C (rag/1) sw
(usually 0.90 to 0.98 times the saturation concentra
tion in fresh water at T C),
C = dissolved oxygen concentration in the lagoon at T C
(mg/1) (for most practical cases, 2 mg/1 or greater
(7)),
C = oxygen saturation concentration in fresh water at
20°C (mg/1) (generally using 9.17 mg/1),
T = temperature of lagoon liquid ( C),
a = oxygen-transfer correction factor (usually 0.8 to 0.9).
POWER REQUIREMENT FOR MIXING
Although it is not necessary to keep all of the solids in suspen
sion in an aerated lagoon, it is imperative to provide sufficient power
to ensure a complete mixing of the liquid and to maintain a uniform dist
ribution of oxygen through the basin. Normally, six to ten horsepower
per million gallons will accomplish this goal (5). For an aerated
lagoon it is extremely important that the mixing power requirement be
checked, because in most instances the power needed for mixing will

490
determine the aerator design selected. If the solids are to be
maintained in suspension, a power level of approximately 60 to 100
horsepower per million gallons is required.
CONSTRUCTION AND MAINTENANCE
1. Screening or comminuting devices should be provided to prevent
the aerator propeller from being fouled by such things as rags and
debris. A grit chamber is also recommended, but a primary clarifer is
not required.
2. Aerated lagoons are generally built eight to twelve feet deep
with earth side slopes appropriate for soil conditions. An embankment
slope of 1 in 2 is commonly used. A rectangular shape with a maximum .
ratio of length to width of 3:1 is also preferred (6).
3. The aerators induce a very high degree of turbulence in the
lagoon, so it is necessary to protect the embankment and lagoon bottom
from erosion and scouring. This may be achieved by providing a lining
of butyl rubber (or similar material), masonry (set with cement or laid
as rip-rap) or mass concrete (3). Masonry and concrete are generally
avoided due to the large volume involved.
4. Aerated lagoons should be located in relatively impervious
soil to prevent percolation and pollution of groundwater.
5. Where fixed surface aerators are used, the water level in the
lagoon must be kept constant to ensure the required degree of submer
gence of the aerators. Recently, floating surface aerators have been
favored because fluctuations in water level do not impair their effi
ciency.
6. Although surface aerators are usually quite reliable in opera
tion, periodic lubrication may be necessary.

491
VIII.3.
LAND APPLICATION OF WASTEWATER
Sue Lin Lewis
INTRODUCTION
Land application of wastewater is an old practice. Historically,
it has been used predominantly as a convenient and economical approach
to wastewater disposal, whereas the current trend is primarily towards
wastewater treatment and/or reuse. Land application may be viewed as
a recycling system in which the wastewater is spread over the land.
The natural topsoils and soil biota provide filtering and stabilization
of the organic matter. Nutrients are used by the plants, precipitated
out, or adsorbed on the soils. The renovated water, after passing
through the soil filter or so-called "living filter," may be collected
by a drainage system or used to recharge the natural aquifers, at which
point it becomes available for reuse. In regions with limited water
resources land application can be operated to boost growth of grass,
crops, or forests as well as for wastewater treatment.
There are three basic types of land application systems: irriga
tion, infiltration-percolation, and overland-flow. The major concerns
in the management of land application of wastewater should be based on
the following factors: land availability, site location, the climate,

492
soil and subsurface conditions, hydraulic acceptance, the wastewater
characteristics, the capacity and utilization of the plant-soil complex
to produce a specific water quality, the intended use or reuse of the
wastewater, and the ultimate use of the land. With adequate controls
and regulations, land application systems will play a significant role
in future wastewater management plans. They offer more than waste
treatment, permitting the efficient use of a widely available resource.
METHODS OF APPLYING WASTEWATER TO LAND
There are three basic types of land treatment systems as illustrated
in Figure VIII.3.1.
(a) low rate system (irrigation),
(b) surface runoff system (overland flow),
(c) high rate system (infiltration-percolation).
Selection of the type of system at a given site is essentially governed
by the soil and subsurface conditions, the climate, the drainability
of the soil, the availability of land, the geological and topographical
conditions of the land, and the intended use or reuse of the wastewater.
Comparison of the three types is made in Table VIII.3.1.
For each type of land treatment system, the wastewater may be
applied with sprinklers or with surface irrigation techniques (graded
or level, borders or furrows). Surface techniques require less energy
and complete gravity flow is often possible. Also, surface techniques
produce few or no airborne pathogens because of little or no spray in
the operations. They require relatively flat land, or at least smooth
topographies so that contour techniques can be used where the land is
sloping. Sprinkler or spray-type systems are used where the topography

493
EVAPORATION
SPRAY OR SURFACE
- SLOPE VARIA8LE
DEEP PERCOLATION
( a ) IRRIGATION
EVAPORATION
SPRAY APPLICATION
SLOPE 2 - 6 « RUNOFF COLLECTION
( b ) OVERLAND FLOW
SPREADING BASIN
/£ SURFACE APPLICATION
IKfl lTftATIOK' . ? - . , . . I T . . . j r .
22209 ZOHE &P AE8ATI8R
A M TREATMENT
•PERCOLATION THROUGH UNSATURATE!! ZONE
RICHAKBC «8»»- . ' v^r!liJil:JiiJ!il:::ii^. > NEf 1ATM TABLC -Sk-*** . ^#*Ta a m_^ a^rt» • «A * ! • • • « • • • • • • • • afe • • *^V« a * * * * * V * * « B ( .
^ ^ ^ ^ _ rfMMf* • I I * * • • • a a^^^tJa a a a a •£* a l a a a a a a a a a a a a f a •«* a a a a « V M » « • • * • • a ^ ^ ^ p » » ^ ^ ^ _ _ _ _li——*aa- -••'•Xr Ta • • * • • • * • • • • »?^* ** * • • • • * • • •*!•••*••••••••«• *^w • * • » • • *v* «j a • • • • • • • • • • • • TvK #a»«a aM
^ _ « * * * " * * * * » • I • a • a a a a a a a a a a a a a a a a %^^^%9 a a a a a a a a a aa • • • •% • • afc • • • • • • • • 4 * * • • » • a a a a a a a a ^ ^ ^ ^ ^ a a a a a a a a a a a a a a a a a a ^ *a«v*J • a™ a a a a a a a t a a a a a a a a a a a a a a a a^^^a^ a a a a a a a a a a a a a a * ft*^" a a a * a * a a j a * a a a f a a a * a a a •*», a a a a a a a a a a a a va a^a^^_*_* a a a a a a a a a a a
» • • • • * • • • * * * • * • • • • * • • • t U M * * 1 7 a • • • • • • a a a * » * a a * a^ava mm* t i a • a afc a J a l a l a a * * • 9 * * * * * > • a a a a a a a a a a > a » a * a • • a a a a a a a a a * t a » a a a m»mmmm9**»**»mm»mmm aa r i a a a a a •*• * a a a * a J a l a J a a * a \ a a a a • • ^ J a a a a a a a i a a
v*J%a>*aB* » * » t T T . • • • • • • a * * * * a * a * a a a * * a a a a a a a aj^^Ta a a a a a a a l a a a a ah a | a l * J * a a a a%» a a » a a aaa^a a a a a a a a
—'»i i i i i i ; ; ; ; ; ; ; ; ; ; ; i ; i i ;» i>; ; ; i i i iMiwrni i ; ; ; i i i . ; ; ; i i : ; ; i i i ; ; ; ; ) ; i i ; ; ; i in<r ; ; i i ;u ; r .n;»»; ; ;nnM»»ff>i i ; ; ; i»; ; ; ; i i : ; ; ; i i ; ; ; ; ) ; i i ; ; ; i i i»r ; ; i i ; i i i i i i i i ; ; : ; ; ; : ; ; : ; ; ; ; i i i i i ;»n a a a a a ait a • • • a a l a a l a l a J a a a a a a a a a * ^ * a a a a a a J a a A a l a a|a a a a a
a agft a a a a a a a * a f a A a l a a L a a a a a a a * * t ^ a a
:r:::::::::r:J::t:if:::::::::rfc:
MfK.
OLD WATER TAB i.-J ( c ) INFILTRATION-PERCOLATION
Fig . V I I I . 3 . 1 . Three types of land t rea tment sys tems.
SOURCE: Charles E. Pound, Ronald W. C r i t e s , Douglas A. G r i f f e s , Costs of Wastewater Treatment by Land A p p l i c a t i o n , EPA-430/9-75-003. Washington, D.C. : USEPA, June 1975.

494
TABLE VIII.3.1
COMPARATIVE CHARACTERISTICS OF LAND-APPLICATION APPROACHES
Factor
Liquid-loading rate
Annual appl icat ion
Land required for 1-MGD flow
Application techniques
Soi ls
Probabi l i ty of i n f l u encing groundwater qua l i ty
Needed depth to groundwater
Wastewater losses
Conveyance distance, mi les a
Storage per iod, weeks3
Land p r i c e , $/acre a
Crop revenue, $/acre a
I r r iga t ion
0.5 to 4 ln/wk
2 to 8 f t /y r
62 to 560 acres plus buffer zones
Spray or surface
Moderately per meable so i l s with good productivi ty when i r r i ga t ed
Moderate
About 5 f t
Predominantly evaporation or deep percolat ion
1-10
1-20
1000-4000
150-400
Type of Approach
Overland Flow
2 to 5.5 in/wk
8 to 24 f t / y r
46 to 140 acres plus buffer zones
Usually spray
Slowly permeable s o i l s such as clay loams and clay
Sl ight
Undetermined
Predominantly surface discharge but some evaporat ion and percola t ion
5
5
2,000
100
I n f i l t r a t i o n -Percolation
0.3 to 1.0 ft/wk
18 to 500 f t / y r
2 to 62 acres plus buffer zones
Usually spray
Rapidly permeable s o i l s such as sands, loamy sands, and sandy loams
Certain
About 15 ft
Percolation to groundwater
5
1
2,000
~

4 9 5
TABLE V I I I . 3 . 1 — C o n t i n u e d
Factor
Use as a treatment process wi th a r e covery of t reated water
Use for treatment beyond secondary:
1. For BOD and suspended s o l i d s r e moval
2 . For n i trogen removal
3. For phosphorus removal
Use to grow crops for sa l e
Use as d i r e c t r e cyc le to the land
Use to recharge groundwater
Use in cold c l imates
' — — ^ — — — ^ , — — - w — . — — — — • I - • • • •
Type of Approach
T i - J r. i J ^i I n f i l t r a t i o n -I r r i g a t i o n Overland Flow „ , . Perco la t ion
Generally 50 to 60% Up to 90% impract ica l recovery recovery
90-99% 90-99% 90-99%
85-90% 70-90% 0-80%
80-99% 50-60% 70-95%
Exce l l ent Fair Poor
Complete P a r t i a l Complete
0-30% 0-10% Up to 90%
Fairb —c E x c e l l e n t
SOURCE: Land Treatment of Municipal Wastewater Ef f luent s (EPA, Jan. 1946). Alternate Waste Management Technology for Best P r a c t i c a b l e Waste T r e a t m e n t , EPA-430/9-75-013, October 19 75.
W a s t e w a t e r Treatment and Reuse by Land A p p l i c a t i o n . Vol . 1: Summary. E n v i ronmental P r o t e c t i o n Technology S e r i e s (EPA-660/2-73-006 a ) . Washington, D .C . : USEPA, August 1973.
' 'Confl ict ing data—woods i r r i g a t i o n a c c e p t a b l e , cropland i r r i g a t i o n marginal. c I n s u f f i c i e n t data.

496
is too irregular for surface irrigation, or where the wastewater
should be applied at rates that are less than the infiltration rate
of the soil when flooded. Sprinkler systems have higher energy
requirements because the water is applied under pressure. They also
cause more spray and airborne pathogens which can travel hundreds of
meters. For this reason, buffer zones about 50 to 200 feet wide are
usually required around spray-type systems.
Low-rate systems. Most land treatment systems are of the low-rate
or irrigation type, applying 0.5-4 inches of wastewater every week.
About 70 to 140 acres of land are required per 10,000 people. The
soil profile and type of cover crop are primary factors controlling
nutrient removal and infiltration. Crops generally respond well to
irrigation with the treated sewage and similar wastewater, which is
essentially a nutrient solution to agriculture. However, caution in
the selection of crops for a specific given case to enable long-season
or year-around operation of the system is necessary. Most of the nitro
gen entering the soil with the treated wastewater can be taken up by
the plants. Phosphorus, metals and other elements are also taken up
by plants as well as fixed or otherwise immobilized in the soil.
In heavy industrialized areas, certain undesired materials can be
prevented from entering the sewage system through a suitable indus
trial source control program. Heavy metals, boron concentrations,
and sodium adsorption ratios (SAR) should be closely watched. Excessive
boron levels can be reduced by source control, or crops can be selected
that are relatively tolerant to high boron levels. (Also, high boron
levels will have less effect on crops in clay soils than in sandy soils.)

497
High SAR can damage the structure of clay soils, but the problem can
be corrected by lime applications. Sandy soils are less affected by
high SAR than clay soils.
The soil of low-rate land treatment systems should be at least
one meter deep and must be sufficiently permeable to accept the waste
water at the desired rate. Land with shallow coarse-textured soil
underlaid by fractured or cavernous rock is not suitable because the
danger of groundwater pollution in the rock is high. Ideally, the
surface soil should be of a silt loam texture with adequate permeabi
lity and a minimum depth of three to five feet to groundwater.
Water distribution is by fixed or moving sprinkling systems, or
surface spreading. Fixed nozzles are attached to risers from either
surface or buried pipe networks. The most popular moving sprinkling
system is a center-pivot spray boom. On flat land surface irrigation
may be applied by the ridge-and-furrow method or the border-strip
method of irrigation. There are several types of irrigation:
1. spray irrigation—water from nozzles wets the land like rain.
Usually this method is employed for industrial wastes.
2. surface irrigation—on sloping land wastewater flows over the
soil from ditches or pipes with site outlets.
3. flood irrigation—areas surrounded by earthen embankments
are flooded to a depth of a foot or two with wastewater which
seeps into the soil. The purified wastewater is collected
beneath the surface.
The portion of the water not used by the plants seeps down through
the root zone and eventually into the underlying groundwater. For
humid regions, this deep percolation water can be expected to be of

498
relatively good quality due to low evapotranspiration rates and dilution
with rainwater, and adds to the useful groundwater supply. In arid
regions, however, the deep percolation water will often have too high
a salt content (3,000 mg/liter or more) to permit profitable reuse
of this water. Whether such a condition will prevail in any given case
depends upon many factors, including:
(a) the dissolved solids concentration of the applied irrigation
water;
(b) the amount of irrigation water applied relative to the evapo
transpiration;
(c) the leachability of salts previously accumulated in the soils
of the area to be irrigated;
(d) the amount of infiltrating precipitation for diluting the
dissolved solids concentration;
(e) the particular type of reuse of the percolated water which
is contemplated.
Therefore, any deep percolation from irrigated fields in dry climates,
should be removed by drains or wells and disposed of in drainage ways,
salt lakes, evaporation basins, or other surface water if the quality
is not acceptable for reuse.
In cold climates, storage of the winter flow may be required to
avoid spraying on frozen ground and/or when crops are dormant and nutri
ent uptake is minimal. Low-rate systems should not receive more waste
water than their designed rate, mainly because of the danger of nitrate
pollution of the underlying groundwater. Thus, soils and crops for
low-rate systems must be carefully selected in order to avoid disappoint
ment. If higher application rates are desired, the system should be

499
designed and managed to promote removal of nitrogen by denitrification
rather than by crop uptake.
High-rate systems. High-rate systems are used where the function
of the land treatment system is primary that of a tertiary treatment
plant, producing reclaimed or renovated water for reuse. They are also
used where land is not available for low-rate systems. Application
rates in this process are of the order of 10 to 120 inches per week,
depending on the soil, the climate, and the wastewater characteristics.
The land requirements for high-rate systems are only a small fraction
of those for low-rate systems (At an application rate of 6.6 feet per
week, for example, about 3.5 acres are required per 10,000 people).
However, high-rate systems require deep, rapidly permeable soils,
such as sands and sandy loams, and a water table that does not rise to
field surface during application of wastewater and drains rapidly to
a depth of at least three feet during drying or resting periods.
The typical year-round operating cycle in high-rate systems is
two weeks of flooding followed by ten days drying in summer and twenty
days drying in winter. Drying or resting periods are necessary to
bring oxygen into the soil and to restore infiltration rates. Drying
cycles also interrupt the life cycles of some small flying insects
(Chironomidae midges) that breed in ponded water, thereby preventing
a nuisance in the surrounding community.
The majority of water renovation occurs by physical, chemical,
and biological mechanisms in the soil matrix, with vegetation playing
a relatively minor role. Crops are usually not grown in high-rate
infiltration basins. While a grass cover helps to remove suspended

500
solids and organic matter, only small portions of nutrient salts are
photosynthesized. Multivalent ions appear to be extracted rather
easily, while monovalent species tend to be flushed down through the
soil mantle. For arid regions, high-rate systems are the only type
of land treatment that can yield renovated water with a salt content
that is not much higher than that of the original wastewater. At high
loading rates, the soil filtration process still yields complete
removal of biochemical oxygen demand, suspended solids, and pathogenic
bacteria, as with low-rate systems. However, there is a significant
risk of carrying pathogenic viruses to underground water. The removal
of nitrogen and phosphorus requires special attention because of the
high-hydraulic loading rates. Much more nitrogen, phosphorus, metals
and other materials enter the soil than is the case in a low-rate sys
tem and there are usually no crops with this method which would other
wise remove some of those elements.
Nitrogen removal is accomplished by stimulating denitrification
in the soil. This is an anaerobic, microbiological process in which
denitrifying bacteria use the oxygen of nitrates as a hydrogen acceptor
in their metabolism, thereby producing nitrogen gas which returns to
the atmosphere, and oxides. For secondary sewage effluent, most of the
nitrogen usually is in the ammonium form. Ammonium ions in the perco
late are absorbed through a cation-exchange process in the soil until
saturation. Then further amounts of ammonia are carried into the
groundwater. During the drying period, complexed ammonium ions are
converted to nitrate under aerobic soil conditions. Anaerobiosis,
from ireflooding with water, results in a portion of the nitrate's

501
being converted to nitrogen gas. When sewage effluent application
is resumed, low infiltration rates should be maintained for the first
two or three days to prevent rapid leaching of the remaining nitrate.
This will promote additional denitrification and can result in fifty
to eighty percent removal of nitrogen.
Soils differ as to their ability to immobilize and store phos
phorus. Soils with a high pH can effectively remove apatites from
wastewater in a high-rate system. The same is true for soils with a
low pH that contain relatively large amounts of iron and aluminum
oxides. In clean sand with a low pH, phosphates are relatively mobile
and may show up in the deep percolation water. If this is objection
able, phosphates should be precipitated prior to infiltration or after
the water is withdrawn for some specific use. Drains or wells may have
to be used to prevent high water table interference, to collect the
renovated water for reuse, and to protect native groundwater supplies.
Overland-flow systems. Where soils are so fine and impermeable
that infiltration rates are too slow even for low rate systems, over
land-flow systems can be used. This method results in surface drainage
that must be collected for reuse or discharged to a surface watercourse.
Waste is applied by sprinklers to the upper end of terraces that are
200-300 feet in length and on grades of about two to six percent. The
wastewater then flows in a shallow sheet over the vegetated surface
(usually grass) and runs off the lower end of the plot. The plots are
designed to be steep enough to produce a relatively shallow sheet of
water, and flat enough to avoid erosion and resulting channeling and
short circuiting. Water should be applied at rates of two to five inches

502
per week. Renovation i s achieved by f i l t r a t i o n and bac te r i a l
decomposition as the water moves slowly through the grass cover.
Effluent BOD and suspended sol ids are less than twenty mg/1 a l l year
round. Phosphorus removal i s about f i f ty to s ix ty percent , while
the nitrogen removal efficiency of ninety percent during the summer
drops subs tant ia l ly in the winter. Detention times are too short for
complete removal of bacter ia and v i ruses . This surface flow process
i s very dependent on weather, and only in mild climates can the runoff
at the end of these p lo ts meet present effluent standards for the en t i re
year.
Two major r e s t r i c t i ons to the overland runoff system are di f f icul ty
in maintaining consistent qual i ty in the renovated water and s i t e -p rep
aration costs . Even in sui table regions i t i s d i f f i cu l t to predict
the degree of renovation possible by a spray-runoff system without
conducting p i lo t -p l an t s tudies .
Combination systems. In some cases , cer tain combinations of low-
r a t e , h igh- ra te , and overland-flow systems may give the best solut ion.
In cold cl imates, for example, high-rate systems might be used during
winter months to avoid expensive storage rese rvo i r s , while low-rate
systems might then be used in the summer to maximize i r r iga t ion and
f e r t i l i z e r benefi ts from the wastewater. Where suspended sol ids are
high and effluent qual i ty i s poor in general , an overland-flow system
might be used as a pretreatment for a high-rate system. Also, i t might
be possible in areas with high water tables to renovate water with
low-rate or high-rate systems, col lect renovated water with horizontal
dra ins , and then use i t for groundwater recharge of deep aquifers with
injection wells .

503
GENERAL CONSIDERATIONS AND DESIGN CRITERIA
Land disposal is a potential technique for wastewater treatment
and/or reuse where an available site has suitable soil conditions and
groundwater hydrology and the climate is favorable. The general design
considerations are included in Table VIII.3.2, and site selection fac
tors and criteria for effluent irrigation are given in Table VIII.3.3
Liquid loading rates for various soil types are given in Figure VIII.3.2.
If wastewater is properly applied to land, the soil actually removes
pollutants and renders the water cleaner. High quality water is thus
generated from wastewater. However, poor design and mismanagement,
particularly overloading of wastewater, can result in health risks,
nuisance vactors, underground water contamination, and the potential
toxicity of metals buildup in the soils and changes in soil structure.
The success or failure of the process is primarily determined by various
loading rates such as the hydraulic, organic, salt, and nutrient load,
plus soil conditions, site location, crop selection, and the overall
system management. Appropriate loading rates vary according to the
soil, climate, crop, and depth to the groundwater table. The design
loading rates cannot exceed the vertical permeability or percolation
rate of the soils, and should not create excessive build-up of ground
water mounds under the application fields.
Hydraulic loading. This refers to the quantity of water that is
actually applied to the land. Tremendous differences exist in the capa
city of soils to absorb water. Over-loading should not be allowed
to occur for two reasons. First, the soil needs to drain and re-aerate
between applications to prevent the suffocation of plants and the

504
o. a »-00 0 a o H
01 ex o
. H CO
>M o
01 *J O . CJ O oi »H a . oo 03
<
o C/>
60 O
i H O 01
o
u Q> u n » 41 4J
s »
4-1 0)
i - l U 01 4-1 O a) M (4
cd O f l T3 O TH CJ 01 i-l O 3 i-l 4J to <0 jc oi cr -H (0 o< k< * J p . « a h ft"© o) >, a S
« c
g 8?
2 B
u
• a g co
•H N CO CO O JS >-i w
hi 01
> o o 4-1
§ rH a,
G «j o 3 -H O 00 C 0) 01 U 00
•H 0 •O 4J c
l-l
1 4J B 01 •w l-l 4J 3
Z
S* 4-1 •H
i H r-( 18 iH > J3
o ™ 8 a 01 ctj l-l CJ
01 01
to s >, to t i f 9 4J i-l l i 0) M •H 01 3 01 O > 4 J T ) H
i-l 01 I S O X rH i-t 3 4J O 0 H 33
to 4J 01
•a 10 £
CM
m vC IJ 01 01 c 0( c
Cd
10 •o (0
S -H 0 i- l
u ja co «
a E i-l 0> U-4 O. c
u-i
o
T3 -H B 4J a B >%
CO CO 01 3 —I
o ero
01 00
o X 01 I c o
10 iH CO 3 U r l h a u
e 01
to 6 -•H to
O l-i £• O a. to U) T3 o to
JC
oi a. B S >< CO CO CO 0 1
a.
Vi
00 hi o
l l f S a l o « ero. o
9 oi
u U u o p. a. T> H Q
J3 a
£
0)
e oi a 4J 10
2
01 4J
« E •H .H U
g i - l 4J CO 4J i-l CL
1-1 CJ 01 u cu
1 Ul C
S i-i l-l 4J 4-1 n) O 14 a - H CO O.
> I d
01 l-l 3 4J CO u 01 o. £ OI
H
00 c
1-t 3 o l-l o
c o 10 to 0> 0]
O 3 0
JS. Wi 01 4J bO u o. B 01 B oi -a oi U N W T J O 3 B K CJ CO UJ o o
a; 00 cfl l-l o 4-1 C/5
to 4J B
1 0) la
I H 3 53" 01 IJ
g SKTH 4J 4J •H CJ o cu O 1-
i- l i H 01 "O
> T3
B § •H 3
4J CO S CO O
5 g^
to B
sz o
I d
s o t o

505
TABLE VIII.3.3
SITE SELECTION FACTORS AND CRITERIA FOR EFFLUENT IRRIGATION
Factor Criterion
Soil type
Soil drainability
Soil depth
Depth to groundwater
Groundwater control
Groundwater movement
Slopes
Underground formations
Isolation
Distance from source of wastewater
Loamy soils preferable but most soils from sands to clays are acceptable.
Well drained soil is preferable; consult experienced agricultural advisors.
Uniformly five to six feet or more throughout sites is preferred.
Minimum of five feet is preferred. Drainage to obtain this minimum may be required.
May be necessary to ensure renovation if water table is less than ten feet from surface.
Velocity and direction must be determined.
Up to fifteen percent are acceptable with or without terracing.
Should be mapped and analyzed with respect to interference with groundwater or percolating water movement.
Moderate isolation from public preferable, degree dependent on wastewater characteristics, method of application, and crop.
A matter of economics.
SOURCE: Wastewater Treatment and Reuse by Land Application, Vol. 1: Summary. Environmental Protection Technology Series (EPA-660/2-73-006a). Washington, D.C.: USEPA, Office of Research and Development, August 1973.

506
0)
u
<3 a
•H -a TO o
3 a*
a)
n)
a)
3
100 CLAY CLAY LOAN S I L T LOAM LOAM SANDY LOAM LOAMY SANO SANO
Soil Type
Fig. VIII.3.2. Soil type versus liquid loading rates for different land application approaches.
SOURCE: Waatevater Treatment and Reuse by Land Application, Vol. 1: Summary. Environmental Protection Technology Series (EPA-660/2-73-006a). Washington, D.C.: USEPA, Office of Research and Development, August 1973.

507
destruction of vegetation. Second, surface runoff will result in a
serious pollution problem if overloading occurs.
Organic loading. This is an important factor because each soil
has a limited capacity to decompose the organic carbon which is used
as the indicator of organic loading. Soil conditions determine the
actual rate of decomposition of organic matter. For example, a coarsely
textured, well-aerated soil will absorb and decompose much more organic
matter than will a fine textured or wet soil.
Salt loading. This is the concentration of various salts in the
wastewater. An imbalance of salt in the applied wastewater may change
the structure of the soil. Salt concentrations as low as 100 ppm,
measured in terms of sodium ions, may render the soil incapable of
transmitting water. Therefore, suitable soil amendments must be applied
to insure that the soil maintains its hydraulic conductivity.
Nutrient loading. This is another important loading factor in
land application. Various nutrient requirements exist for different
plants and crops. The principal ones are nitrogen, phosphates, as well
as other elements. The removal of nitrogen and phosphates depends on
the type of soil, crop, sequence of wetting and drying periods, and
wastewater loading rates. Excessive nitrite and phosphorus concentra
tions may build up in groundwater if nutrient loading is not properly
controlled.
Soil condition. This is one of the important parameters that can
not be overlooked in land application. It determines the permeability,
drainage capacity, evapotranspiration rate, cation-exchange capacity,
heavy metal absorption potential, and water table slope and boundary

5Q8
condition of the land. For example, rapidly permeable, well drained
sandy soils can be applied with larger wastewater loading rates than
slowly permeable, poorly drained clay.
Site selection. The criteria for site selection include soil
types, soil drainage, soil depth, depth to groundwater, wastewater
characteristics, groundwater movement, ground slope, degree of isola
tion of site, underground formations, and distance from the groundwater
source. An ideal site is one that is well isolated, has deep loam or
sandy loam soils, is well drained, has a deep groundwater table, and
is located where the groundwater moving away from the site is not
likely to change the quality of the regional aquifer.
Crop selection. Each crop has the capacity to absorb a specific
amount of nutrients from the soil. In addition, the crop roots encour
age denitrification in the root zone by supplying the necessary carbon
for the denitrifying bacteria. The selection for a vegetative cover
or crop depends on factors such as water tolerance, nutrient require
ments and tolerances, season of growth, nutrient removal efficiency,
type of soil, and market for the product. However, it has been found
that most crops can tolerate the application of as much as fifty per
cent more than their actual need for nitrogen without suffering any
damage and without the result of excessive water pollution (12).
Overall system management. Effective management and monitoring
are fundamental requirements. System monitoring (such as pilot testing,
wastewater analysis, and effluent sampling and testing) is required
to ensure conformance to the predicted performance of a land applica
tion system and for the successful operation of such systems.

509
Good land application systems do not happen; they are carefully
designed and then carefully managed. Sometimes, local experimentation
is needed before the best design can be formulated. This is because
the performance depends so much on the local conditions of soils,
hydrogeology, and climate. One way to achieve this is to start on
a small scale and expand the system on the basis of experiences
obtained.
Generally, secondary treatment of wastewater is considered essen
tial before disposal on land. The application of raw wastewater is
not recommended. Also, land application is usually not practiced from
December to April in climates where this will cause cold weather
operating problems. The oxidation ponds for winter storage need to
be properly designed to prevent nuisance and pollution vectors. The
storage of wastewater can encourage the prolific growth of algae, and
aquatic animals in the ponds. As a consequence, a significant portion
of the nitrogen and phosphorus is taken up in the storage period. In
addition to all the factors discussed above, the political, legal,
environmental and economical impacts, as well as public involvement
should be taken into consideration.
COST ASPECTS
The costs for land application include the capital costs, and
the operation and maintenance costs. The capital costs, including
those related to land, treatment, storage, transmission, and distribu
tion, vary with geographical area, topography of the site, type of
treatment, and land application system used. The operation and mainte
nance costs depend on the type of treatment, type and size of the

e f f l u e n t d i s t r i b u t i o n system and s t o r a g e ponds, the n a t u r e of the
v e g e t a t i o n cover or c rop , and the geograph ica l cond i t ion of the
system.
A c o s t - e f f e c t i v e comparison of the d i f f e r e n t methods of land
a p p l i c a t i o n and o the r methods of wastewater t rea tment are p resen ted
in Tables V I I I . 3 . 4 - 6 and Figure V I I I . 3 . 3 . In g e n e r a l , from Figure
V I I I . 3 . 3 i t may be seen t h a t land a p p l i c a t i o n systems e x h i b i t l e s s
economy of s c a l e , e s p e c i a l l y a t lower flow c a p a c i t i e s , than advanced
wastewater t rea tment (AWT) systems. I n f i l t r a t i o n - p e r c o l a t i o n i s the
lowest cos t land a p p l i c a t i o n system. While the over land and i r r i g a
t ion types a re nea r ly equa l to each o the r in t o t a l c o s t . A l l t h ree
land a p p l i c a t i o n systems are s i g n i f i c a n t l y more cos t e f f e c t i v e than
AWT-3 or AWT-4, a l though the e f f l u e n t q u a l i t i e s a re approximately
s i m i l a r . There fore , land a p p l i c a t i o n system are considered to be
economical ly v i a b l e .
HEALTH ASPECTS
In the use of land a p p l i c a t i o n systems n i t r a t e s , r e f r a c t o r y
o r g a n i c s , and pa thogenic organisms a re of most concern from a p u b l i c
h e a l t h s t a n d p o i n t . With we l l -des igned and well-managed land a p p l i c a
t i on sys tems , n i t r a t e n i t r o g e n should be reduced to below the maximum
l i m i t of ten m g / l i t e r for d r ink ing w a t e r . S l i g h t l y h ighe r n i t r a t e
l e v e l s may occur wi th h i g h - r a t e sys tems. However, these l e v e l s can be
reduced by d i l u t i o n wi th n a t i v e groundwater or by blending with o the r
water .
BOD and suspended s o l i d s a re e f f e c t i v e l y removed (90-99% pe rcen t )
when wastewater moves through s o i l and aqu i f e r s whi le minute

511
TABLE VIII.3.A
COMPARISON OF CAPITAL AND OPERATING COSTS COSTS FOR ONE-MGD SPRAY IRRIGATION, OVERLAND FLOW,
AND INFILTRATION-PERCOLATION SYSTEMS3
Cost Item Spray Overland Infiltration-
Irrigation Flow Percolation
Liquid loading rate, inc./wk 2.5 4.0 60.0
Land used, acres 103 64
Land required, acres" 124 77 5
Capital costs
Land @ $500/acre
Earthwork
Pumping station
Transmission
Distribution
Collection
Total capital costs
Capital cost per purchased acre
Amortized cost0
Capital cost, c/1,000 g al.
Operating costs
Labor
Maintenance
Power
$ 62,000
10,300
50,000
132,000
144,000
—
$398,300
$ 3,200
$37,000
10.1
$ 38,500
64,000
50,000
132,000
64,000
6,000
$354,500
$ 4,600
$ 34,700
9.5
$ 2,500
10,000
—
132,000
5,000
30,000
$179,500
$ 35,800
$ 19,500
5 .3
Tota l ope ra t ing cos t s
$ 10,000
19,400
5,800
$ 35,200
$
$
10,000
12,000
5,800
2 7,800
$ 7,500
3,500
1,800
$ 12,800

512
TABLE VIII.3.4—Continued
Cost Item Spray Overland I n f i l t r a t i o n -
I r r i g a t i o n Flow P e r c o l a t i o n
Opera t ing c o s t , c /1 ,000 g a l . 9.6 7.6 3.5
To ta l c o s t , c /1 ,000 g a l . 19.7 17.1 8.8
SOURCE: Walter D. A t k i n s , Design Guide l ines for Land Appl ica t ion of Municipal Wastewater (Oklahoma S t a t e Department of Hea l th , August 1976.
a Est imated for 19 73 d o l l a r s , Engineer ing News-Record cons t ruc t ion cos t (ENRCC) index 1860 and sewage t r ea tmen t p l a n t cons t ruc t i on cost (STPCC) index 192.
20 pe r cen t a d d i t i o n a l land purchased for buf fe r zones and add i t i o n a l c a p a c i t y .
c 15-yea r l i f e fo r c a p i t a l i t em, exc luding land ; i n t e r e s t r a t e 7 nercen t-

513
TABLE VIII.3.5
AWT SYSTEMS
System Constituents Removed Processes Used
AWT-1 NH3-N
AWT-2 Total-N
AWT-3 Phosphorus and SS
AWT-4 Total N, P, and SS
Biological nitrification
Biological nitrification-denitrification
Tertiary, two-stage lime coagulation, and filtration
Tertiary, two-stage lime coagulation, filtration, and selective ion exchange
SOURCE: Wastewater Treatment and Reuse by Land Application, Vol. 1: Summary, Environmental Protection Technology Series (EPA-660/ 2-43-006a) (Washington, D.C.: USEPA, August 1973).
TABLE VIII.3.6
EFFLUENT QUALITY COMPARISON FOR LAND TREATMENT AND AWT SYSTEMS
System
A e r a t e d l agoon
A c t i v a t e d s l u d g e
I r r i g a t i o n
Ove r l and f low
I n f i l t r a t i o n -p e r c o l a t i o n
AWT-1
AWT-2
AWT-3
AWT-4
BOD
35
20
1
5
5
12
15
5
5
E f f l u e n t
SS
40
25
1
5
1
15
16
5
5
Q u a l i t y
NH3-N
10
20
0 . 5
0 . 5
—
1
—
20
—
P a r a m e t e r
NO3-N
20
10
2 . 5
2 . 5
10
29
—
10
—
(mg/D
T o t a l N
30
30
3
3
10
30
3
30
3
P
8
8
0 . 1
5
2
8
8
0 . 5
0 . 5
SOURCE: Wastewater Treatment and Reuse by Land Application, Vol. 1: Summary, Environmental Protection Technology Series (EPA-660/ 2-43-006a) (Washington, D.C: USEPA, August 1973).

514
— 9 •
1
8
S
4
J
2
n
8 7
A
5
4
3
2
->
k / ^ * i
" S
* "*s-
\
-—
V V
.
!
\
5?
"v.
^ - I R R I G A T I O N (CONDITIOM 2 ^ i i •_ • • ~
1 1 1 ~ > - L OVERLAND FLOW
INFILTRATIO PERCOLATION
J * 5 3
N-
; j 3
- ^ "
~~ — - -
ACTIVA1 ED
"*"- —-
SLUDGE —
AERATED L A G O O N — • - "
2 3 i 1
AW1 -4
H-+-AWT-3
AIT-2
AW
)
r-i
}
„
r-
1 5 9 10 too
Flow Capacity—MGD
Fig . V I I I . 3 . 3 . Cost of land a p p l i c a t i o n s sys tems, advanced wastewater t r ea tmen t (AWT), and o ther t r e a t ment systems.
SOURCE: Wastewater Treatment and Reuse by Land App l i ca t i on , Vol. 1: Summary, Environmental P r o t e c t i o n Technology Se r i e s (EPA-660/ 2-43-006a) (Washington, D.C. : USEPA, August 1973).
a Condi t ion 2 r e p r e s e n t s a c l imate wi th moderately cold w i n t e r s , moderately w e l l - d r a i n e d s o i l unde r l a in by poor ly dra ined s u b s o i l . Appl ica t ion i s by cen te r p i v o t s p r i n k l i n g .

515
concentrations of organic carbon may still remain. Little work has
been done in this field, but it is likely that these carbon residuals
do resist biodegradation and may be associated with humic-type acids.
There has been speculation that these organic constituents may be
toxic, teratogenic, or carcinogenic. However, the true health signi
ficance of these materials will not be established until the specific
constituents are identified, their concentrations determined, and
their potential health impact evaluated.
Fecal coliform tests are usually negative for renovated water
after it has traveled from 3 to 330 feet. Bacterial pathogens can
be considered effectively removed in this processing. Theoretically,
viruses can travel greater distances than bacteria. However, viruses
can be immobilized by clay and organic matter in the soil. Better virus
detention can be expected in arid areas with the higher pH, higher ionic
concentrations, and higher cation-exchange capacity of the soils. Chlori-
nation of water pumped from wells affected by renovated water should
effectively remove the remaining viruses. These remarks apply to both low-
rate and high-rate infiltration systems. The effluent from an overloaded
system may still contain considerable amounts of bacteria and viruses. If
the quality of the renovated water from land application systems is con
sidered inferior to that of native groundwater, the renovated water can be
taken out of aquifers with horizontal drains or pumped wells and
collected for the use of unrestricted irrigation, some industrial
purposes, recreational lakes, or it can be discharged into a stream
or other surface water. Compared to the discharging of treated waste
waters to surface streams and lakes that serve as the raw water supply

516
for many public water systems, it is preferable that the renovated
wastewaters be allowed to pass from the natural aerobic soil filtra
tion systems into groundwater and from there be used for domestic
purposes.
SUMMARY AND CONCLUSIONS
Estimates of water use indicate that the need for water will
continue to increase in the future. The renovated water from land
application systems can help meet the demands and also benefit farmers
with a water supply and nutrient supply for crops.
The advantages of land treatments include the following:
1. It is a method of water treatment as well as method of
resource recovery.
2. The use of nitrogen, phosphorus and other elements for irri
gation of crops can reduce the demands for artificial ferti
lizers and minimize the contribution of these nutrients to
the eutrophicatibn of streams and lakes.
3. The reclaimed water having undergone sufficient treatment
for reuse, can economically supplement groundwater supplies,
particularly in the case of high rate systems.
4. The requirements of the land treatment process are low in
terms of energy and chemicals.
5. Land treated wastewaters are kept out of surface waters used
for drinking purposes.
6. Well-designed and well-managed land treatment systems are
fail-safe.
7. Money invested in land is never lost.

517
8. In general, land application systems can be considerably
less expensive, and more cost-effective than tertiary treat
ment facilities yielding water of similar quality.
9. Land application can be operated with a minimum of environ
mental and health hazards.
The disadvantages of land treatment include: operational prob
lems due to cold weather, problems related to the requirement and
availability of land, a large dependence on local conditions, and
the potential for pollution and induced toxicity of groundwater. The
concentrations of harmful trace elements and toxic substances which
are not likely to be removed in the renovation process must be con
trolled in irrigation water or reduced in advance of land disposal.
Extensive soil-water and groundwater pollution is more difficult to
correct than surface water pollution, and once present, such pollut
ants can persist for generations within the subsurface. One of the
biggest potential problems with land application can be the pollution
of surface waters by runoff from excessively loaded systems. However,
excessive runoff can be controlled by careful design and management
of the total system.
Land application has its supporters as well as its opponents.
The proper approach is a rational assessment of the various alterna
tives so that the system that gives economically and environmentally
the best solution can be selected.

518

CHAPTE R I X
On-Site Disposal and Treatment
For disposal and collection systems in nucleated areas, the sani
tary pit privy with its variants, and sewered systems including sewage
treatment are not the only answers. The intermediate approach of the
sewerless toilet or on-site treatment is a viable alternative. In
many LDC cities there exist few if any sewers, let alone sanitary sewer
age systems. Consideration should be given to the problems and costs
associated with sewer system construction for such large populations,
as well as to the problems and costs associated with the treatment
which would be required. The material in this chapter is concerned
with the sewerless toilet or on-site treatment as a viable alternative,
and is a shortened and revised version of the original publication
which it represents.
519

520
There are three general classifications used for the sewerless
units, hydraulic, biological, and chemical/thermal. To date in DC's
the use of thermal toilets has been mostly limited to boats, offshore
drilling sites, and recreation areas, so that their current production
costs are not representative of high production levels. Studies of
costs at high production levels and with in-country production indi
cate that a non-structural system of on-site units is quite competi
tive with other methods.
There is a need for the testing of numerous management schemes
for the manufacture and distribution of systems of these on-site
units: (1) in-country manufacture and placement as a social service;
(2) private enterprise (LDC and DC combinations), starting an entirely
new industry; (3) a combination of the in-country social service ap
proach, with or without at least an initial governmental subsidy.
The use of such on-site alternatives for sewage could aid in
breaking the water-related disease cycle. Separate handling would
be required for grey water; however, a piped water distribution sys
tem with all its attendant problems and costs, would not be required.

521
IX.
COST-EFFECTIVENESS OF THE SOCIO-CULTURAL AND HEALTH BENEFITS OF SEWERLESS ALTERNATIVES FOR DOMESTIC WASTE DISPOSAL IN DEVELOPING COUNTRIES
Gayle Townley
INTRODUCTION
Background. The need to remove or dispose of human waste is an
integral part of every culture. The manner in which it is done has had
widespread health effects and has influenced man's progress throughout
recorded history. It has only been in the last two hundred years that
a waterborne piped collection network has been utilized to remove waste
water from households in populated areas. These waterborne sewage sys
tems have served admirably in cities or urbanized areas with high density
populations, enabling a large number of persons to be free of the asso
ciated diseases, especially enteric and helminthic diseases, that accom
pany unsanitary conditions.
Where and when abundant water is cheaply available and the level
of wealth can support the high capital costs required, centralized col
lection and treatment systems have been very successful in influencing
the improvement of health conditions. Usually such systems have become
possible only with the advent of a centrally piped water supply system.
Available processes for sewage treatment and/or disposal encom
pass both the waterborne sewage systems and the newer waterless or
Washington, D.C.: U.S. Agency for International Development, Office of Health, Technical Assistance Bureau; and Norman: University of Oklahoma Bureau of Water and Environmental Resources Research, 1977. (184 pp.)

522
water-restricted sewage systems. The waterborne systems are referred
to in this report as conventional treatment due to their widespread
acceptance. The waterless or water-restricted systems are referred to
as sewerless treatment though some devices are initially included which
connect to sewage lines.
Cost has often been the sole determining factor in the selection
of alternative sewage disposal/treatment systems. Availability, adapta
bility, and the latest technology in methods and equipment have also
had some influence. None of these are particularly "bad" reasons for
selecting a system, but by themselves they have not proven to be adequate
in the light of failures, system breakdowns and partial treatment.
Because centralized treatment facilities are generally one of a kind,
and because collection systems vary as to topography and settlement
patterns, responsibility for failures has been difficult to establish.
In less developed countries (LDC's) engineering expertise for design
and installation as well as equipment requirements for such facilities
have been almost entirely transferred from the more industrialized
nations. Thus, particularly in LDC's, there have been problems related
to adaptation, application of system designs, higher than unexpected
costs, unanticipated construction delays, an earlier than expected need
for equipment replacement, and early system failures.
Need for study on wastewater. The need for treatment of wastewater
is no less than the need for safe water supplies. Basic sanitation ser
vices are needed for the prevention and control of communicable diseases
and for the promotion of physical, mental, and social well-being through
out the world. Some studies have indicated that there is a greater than

523
70% reduction in water-related communicable diseases with water treatment
and an additional 25% or greater reduction with the introduction of sewage
treatment.
Actually, the overall picture of sewage disposal gained through
research involving ninety selected LDC's, is not as good as that of water
supply. This is due somewhat to the earlier emphasis on safe drinking
water prior to concern for a treated effluent. On the basis of currently
available information from the World Health Organization, estimates in
LDC's are that fifty percent of urban residents are served with public
sewerage systems and forty-five percent more with individual household
systems. In rural areas ninety-one percent of the population is estimated
to have inadequate excreta disposal facilities. This means that in LDC's
greater then one billion people are following primitive excreta disposal
practices, burial and stream, which lead to unnecessary illness, disabi
lity, and death.
Among these one billion or more people there are those who cannot
be reached by conventional treatment systems and who could potentially
benefit from sewerless alternatives. Target areas should be those areas
which have been shown to public health officials to have the highest risk
for waterbome diseases.
Cost-effectiveness. Cost-effectiveness analysis as applied here,
is defined as an analytical study designed to assist a decision-maker in
identifying a preferred choice among possible alternatives and involves
two steps of evaluation. The first step is cost evaluation which entails
the delineation of all major system components and the development of
capital and operating costs for each. The second step is the effective
ness evaluation in which one attempts to generate a single basic measure

524
or indicator of effectiveness using multiple considerations. The
essence of cost-effectiveness analysis then compares the trade-off of
cost with effectiveness to identify the most cost-effective alternative.
The traditional economic analysis of engineering systems was depen
dent on cost consideration alone. Decision-makers initially used the
least cost solutions that met required constraints. In this case, sys
tems were measured by minimizing the cost without referring to the bene
fits. Following this approach, evaluations emphasized net cost or net
savings, with this representing the difference between total cost incurred
and any resultant benefits which could be expressed in monetary units.
However, it has been well demonstrated that combining costs and benefits
into a single measure will not necessarily indicate the most economically
efficient alternative. Thus, cost-benefits analysis which centered on
the cost/benefits ratio as the indicator of economic efficiency was
introduced.
Cost-benefits analysis, however, is not satisfactory in evaluating
wastewater treatment and disposal systems for any public application
because the overall utility of any alternative system depends upon mul
tiple criteria or measures of effectiveness (reliability, operational
simplicity, automation, public acceptability, and others) which cannot
be expressed directly in monetary units without losing the true signi
ficance of cost and/or benefit.
Thus, selection of one wastewater system from among a group of
alternatives, with respect to multiple criteria, asserts a complex problem
in decision-making for local administrators and consulting engineers as
well as for federal agencies and international loan institutions. Use
of decision-weighting models has become a necessity. The ability to

525
measure formerly non-quantitative values for comparison with quantitative
ones enhances the use of such modeling techniques for decision-making.
In this report, will be found a representation of the possible con
ventional treatment systems which have been or could be used in developing
areas, as well as their advantages or disadvantages. During the evalua
tion, they served as the fundamental knowledge that must be referred to
when evaluating those system criteria which can only be judged from the
knowledge of current practices. A comprehensive survey of sewerless or
water reduction disposal devices and hardware manufacturers is also
included. This study is then directed toward identifying the most cost-
effective systems for use in developing countries.
HISTORIC DEVELOPMENT OF WASTEWATER DEVICES AND TREATMENT
General. Early methods of waste removal or avoidance have included
migration, cremation, burial, use of earth closets, bodies of water, and
midden heaps. Ditches or trenches have sometimes been dug to receive
large quantities, and great pits roofed over with beams and earth have
been used to receive large quantities of water from washing and cooking
as well as sewage. Excavations such as these have been found which
have been lined with brick, arched over, and connected with the houses
by brick or flagstone drains. The pits have not usually been cemented
because this would have meant more frequent emptying, as well as
provision for venting of the sewer gases. Where running water came into
use in the 1800's and waterclosets after 1870, cesspools became completely
inadequate. Up until that time, where sewers were used they had been
considered receptacles of surface water runoff only, while disposal of
collected sewage was accomplished primarily through use of sewage farming

526
or dumping into streams. The increased volume of'water used by
householders encouraged sewerage development, and disposal by dilution
with sewers emptying into rivers, streams, and lakes. When cities
began to dump their sewage into water courses from which drinking water
was also drawn, incredibly high typhoid fever death rates often resulted.
Filtration of water supplies rather than sewage treatment first evolved
as the answer because sanitary engineers of that period argued that
given the level of benefits the costs of sewage treatment were too high
when compared to the costs of water filtration. Later, sewage treat
ment was introduced in some areas where water treatment alone proved
inadequate for the maintenance of a sanitary water supply.
Septic systems. Septic tank systems began to replace cesspools
and privy vaults after the 1890's as the public became aware of sanita
tion problems and accepted the necessity for new methods. (See Figure
IX.1.) Septic systems were first patented in England by John Louis
Mouras and Abbe Morgno in 1881. Their first application in the United
States was in Boston in 1883.
Initially, septic tanks were constructed by rule-of-thumb estimates
and later according to the construction guides published by various
state and federal authorities. These early systems consisted of the
septic tank itself with a soil leaching or absorption field which received
the overflow of anaerobically decomposed wastewater. After introduction
in the United State several modifications in the basic design and princi
ples of operation took place. No major modifications have taken place
in the last thirty-five years. Sludge removal from septic tanks is
necessary every two to four years or when the system fails.

527
vnn INSPECTION
PORTS
7/n
/ / / / / / / / / / / / / / " / /
Fig. IX.1. Typical septic tank design.

528
Today, the number of septic tanks in the United States is unknown
with estimates ranging from thirteen to twenty-five million individual
disposal units. This estimate would also include aerobic systems which
have had some acceptance with an estimated 20,000 to 30,000 in use in
1970.
Public health effects are critical when septic systems are built
close to private wells. Outbreaks of typhoid fever, dysentery, gastro
intestinal infection, infectious hepatitis and infant methemoglobinemia
have been traced to malfunctioning septic tank systems, often improperly
designed systems located too close to water wells. Lack of known alter
natives, especially lower cost or more effective available treatment
methods, has led to the continued installation of septic tank/soil
absorption systems (ST/SAS).
Alternative technological advances. In developed countries man
uses forty percent of the treated drinking water produced to flush away
waste from water closets to treatment plants. This is the most expensive
system ever devised by man, though the flush system accompanied by treat
ment is undoubtedly responsible for maintaining the health.of the devel
oped world.
Reportedly, seventy percent of the world's population does not even
have piped water, so that they are automatically excluded from use of
the flush toilet system. An estimated 5.8 million people in the United
States do not have sewage or water systems, and the World Health Organi
zation has estimated that only eight percent of the urban families in
lesser developed countries have a sanitary sewage system.
Alternative technology for disposal/treatment of excrement has been
developed in the past thirty years which are waterless or water conserving

529
devices. These new devices, comprising approximately thirty patents,
may be classified into five groupings:
1. Incinerating toilets burn body waste to a sterile ash and thus
consume energy, about $2.00/month.
2. Composting toilets consist of a large fiberglass container
eight feet long with a slanting bottom, located in the base
ment with the result being a dried compost after two years.
3. Biological toilets are based on biological principles of waste
digestion where body wastes and toilet tissues are in effect
turned into water by enzymes and bacteria by the weekly addition
of a bio-package, and are disposed of in a small drain field
outside the house.
4. Vacuum systems uses the vacuum principle to transport body wastes
from the toilet bowl through sewer lines for disposal (expen
sive for an individual system).
5. Aerobic tanks use a small pump to mix air into a tank, similar
to a septic tank, so that digestion is speeded up, and addition
of dissolved oxygen also helps to prevent clogging of drain
fields.
Primarily, the difficulties with utilization of these systems have been
cost due to limited production, availability to site at construction
time, and the additional requirement of a previously known need for
a nonconventional system.
CONVENTIONAL TREATMENT SYSTEMS
Conventional cost data. Preliminary results of conversations with
the World Bank show that total system costs are not available for

530
countries outside the United States. Facility costs are available in
some cases, but the investment requirements for the entire system,
that is, sewerage, house connections, household plumbing and equipment
costs have not been established for the population to be served by the
facility. The reasons for this are complex. Financing is done by
various methods and sources with the United Nations providing some of the
investment capital in addition to that of the country and financial lend
ing institutions. Construction of water and wastewater projects is often
linked with each one servicing a varying population. Financing and con
struction is done in steps or stages for urban areas with cost estimates
sometimes based on a larger population than that which will be initially
served. Each additional step or extension is then divided by the same
or a portion of the same population already included in the previous
estimate. Such estimates have been necessary to obtain approval for
projects which would have been economically unacceptable otherwise.
These reasons for the lack of comprehensive data, of course, are
not limited to economic development projects in other countries. Cost
estimating projects of all forms of public works construction in the
United States have utilized various projection techniques to improve
the feasibility and to secure the acceptance of projects which would
have otherwise been fiscally impossible for cities in the United States
to undertake. Because of the widespread use of such techniques and
the multiple forms of financing possible, public works projects in the
United States have hidden costs which have not been explored to this date.
Cost studies have primarily centered on the treatment and sewerage por
tions, thus not revealing the total encumberance of the public for such
projects. Several excellent documents which supercede previous efforts

531
at analysis of conventional treatment costs have been produced. The
first one, A Guide to the Selection of Cost-Effective Wastewater Treat
ment Systems, provides by diagram the alternative wastewater treatment
systems which are capable of achieving the same effluent quality (3).
This guide's main use is to make rough "comparative" analysis during the
facilities planning phase. Reference can then be made to the unit process
cost curves which give cost/1000 gallons according to plant capacity, for
operation and maintenance and capital costs. Prices are based on the
February 1973 National Average Wastewater Treatment Plant Cost Index,
the Wholesale Price Index for Industrial Commodities, and Labor Costs
from the United States Environmental Protection Agency (EPA) and the
Department of Labor Statistics Office. A summary of treatment plant
construction cost estimates was developed for unit processes (Table
IX.3) with the explanation of the treatment codes given in Tables
IX. 1 and IX.2. Since construction and operation and maintenance
(0 & M) costs are constantly changing, an appendix was provided in the
Guide where cost equations have been developed with a flexibility that
permits changing various economic parameters, such as cost indices and
labor rates. Such flexibility in the analysis of conventional treatment
alternatives has been unavailable in other costing sources.
The following paragraph contains common terms and some costs given
in the Guide. Total cost for each unit process comprises the sum of
the capital, operating and maintenance costs. Capital costs include
construction amortized over twenty years at 5 5/8 percent, structures,
equipment, pumps and integral piping, appurtenances described or implied
by the unit process, land requirements at $2000/acre, engineering,

532
TABLE IX.1
CODE—INFLUENT AND CONVENTIONAL WASTEWATER TREATMENT UNIT PROCESSES
AA. Preliminary Treatment Influent: Raw wastewater
AB. Raw Wastewater Pumping Influent: Effluent from AA
Filtration Influent: Effluent from A-2,B-2,B-3,C-2
C-3,C-4,C-5,F-1 or F-2,G-l,G-2,C-3,G-4, H,J,K
A. Primary Sedimentation Influent: Effluent from AA or AB A-l Conventional A-2 Two-Stage Lime Addition A-3 Single Stage Lime Addition A-4 Alum Addition A-5 FeCl3 Addition
B. Trickling F i l t e r B-l Influent: Effluent from A-l B-2 Influent: Effluent from A-3 B-3 Influent: Effluent from A-4 or A-5
E. Activated Carbon Influent: Effluent from D
F. Two-Stage Tertiary Lime Treatment F-l Influent: Effluent from B-l F-2 Influent: Effluent from C-l
G. Biological Nutrification G-l Influent: G-2 Influent: G-3 Influent: G-4 Influent:
Effluent from C-6 Effluent from 3-1 Effluent from A-3,A-4 or A-5 Effluent from A-2,C'-7 or C-8
Activated Sludge C-l Conventional
Influent: Effluent from A-l C-2 Conventional
Influent: Effluent from A-3 C-3 Conventional
Influent: Effluent from A-4 or A-5 C-4 Alum Addition
Influent: Effluent from A-l C-5 FeCl3 Addition
Influent: Effluent from A-l C-6 High Rate
Influent: Effluent from A-l C-7 High Rate and Alum Addition
Influent: Effluent from A-l C-8 High Rate and FeCl3 Addition
Influent: Effluent from A-l
Biological Denitrificatlon Influent: Effluent from G-l,G-2,G-3 or G-4
Ion Exchanges Associated with A-
C-2,B-2,B-3,C-2,C-J,C-5,F-l, or F-2
J. Breakpoint Chlorination Influent: Effluent from A-2,B-l,B-2,B-3,C-l,
C-2,C-3,C-4,C-5,F-l or F-2
K. Ammonia Str ipping Inf luent : Effluent from F- l or F-2
R. Dis infect ion Inf luent : Effluent from any treatment pro
cess
SOURCE: A Guide to the Selection of Cost-Effectlve Wastewater Treatment Systems, EPA 430/9-75-002, March 1975.

533
TABLE IX.2
CODE—INFLUENT AND SLUDGE HANDLING UNIT PROCESSES
Anaerobic Digestion L-l Sludge Inf luen t : Generated from A-l+B-1, C-l or C-6 L-2 Sludge Inf luent : Generated from A-l+C-4, or C-5, or C-7, or C-8,
A-4+B-3 or C-3, A-5+B-3 or C-3
M. Heat Treatment M-l Sludge Influent: M-2 Sludge Influent:
Generated from A-l+B-1, C-l or C-6 Generated from A-l+C-4 or C-5, or C-7, or C-8,
A-4+B-3 or C-3, A-5+B-3 or C-3
N. Air Drying N-l Sludge Influent: N-2 Sludge Influent:
Q.
Dewatering 0-1 Sludge 0-2 Sludge
0-3 0-4 0-5 0-6 0-7 0-8 0-9
Sludge Sludge Sludge Sludge Sludge Sludge Sludge
Influent: Influent:
Influent: Influent: Influent: Influent: Influent: Influent: Influent:
Incineration P-l Influent Sludge: P-2 Influent Sludge: P-3 Influent Sludge: P-4 Influent Sludge: P-5 Influent Sludge: P-6 Influent Sludge: P-7 Influent Sludge:
Effluent Sludge from L-l Effluent Sludge from L-2
Generated from A-l+B-1, C-l or C-6 Generated from A-l+C-4 or C-5, or C-7,
A-4+B-3 or C-3, Generated from A-2 Generated from A-3+B-3or C-2 Effluent Sludge from L-l Effluent Sludge from L-2 Generated from F-l or F-2 Effluent Sludge from M-l Effluent Sludge from M-2
Effluent Sludge from 0-1 Effluent Sludge from 0-2 Effluent Sludge from 0-3 Effluent Sludge from 0-4 Effluent Sludge from 0-7+0-Effluent Sludge from 0-8 Effluent Sludge from 0-9
or C-8, A-5+B-3 or C-3
Recalcination (includes chemical storage and feeding) Q-l Sludge Inf luent : Effluent Sludge from 0-3 Q-2 Sludge Inf luent : Effluent Sludge from 0-4 Q-3 Sludge Inf luent : Effluent Sludge from 0-7
SOURCE: A Guide to the Selection of Cost-Effective Wastewater Treatment Systems, EPA 430/9-75-002, March 1975.

534
TABLE IX. 3
SUMMARY OF TREATMENT PLANT CONSTRUCTION COST ESTIMATES
Treatment Category
Primary — Conventional (PSl)
Primary --Stabilization Pond (PS2)
Sludge --Conventional (PS 3)
•Sludge --Advanced (PS4)
Sludge — Combined Imhoff (PS5)
Secondary — Standard Filter (PS6)
Alternative Number
1 2 3 4 5 6 7 8 9
1 2 3
1
1
1
1
Unit Processes by Alternative
AA, AB, A-l, C-l, R, 0-5, L-l AA, AB, A-l, C-l, R, P-6, 0-8, M-l AA, AB, A-l, C-l, R, 0-1, P-l AA, AB, A-l, C-l, R, 0-1, P-5 AA, AB, A-l, B-l, R, L-l, N-l AA, AB, A-l, B-l, R, L-l, 0-5 AA, AB, A-l, B-l, R, 0-8, P-6 AA, AB, A-l, B-l, R, 0-1, P-l AA, AB, A-l, B-l, R, 0-1, P-5
Mean Cost (Alternatives above)
AA, AB, A-3, R, C-2, 0-4, P-4 AA, AB, A-3, R, B-2, Q-2, 0-4 AA, AB, A-3, R, B-2, 0-4, P-4
AA, AB, A-l, C-l, F-2, R, 0-5, L-l
AA, AB, A-2, G-4, R, 0-3, P-3
AA, AB, A-2, G-4, H, R, 0-3, P-3
AA, AB, A-2, G-4, H, 0, R, 0-3, P-3
Estimated Cost ($ Million) at Design Flow Rate (MGD)a
1
2.06 2.67 2.53 2.36 1.63 1.84 2.42 2.30 2.14
2.22
2.70 2.36 2.50
2.70
3.22
3.56
3.97
5
3.73 5.13 4.97 4.58' 3.54 3.50 4.90 4.74 4.35
4.38
5.32 4.63 5.10.
4.61
5.29
5.90'
7.09
20
9.05 11.7 11.5 10.7 9.79 8.81 11.4 11.3 10.4
10.5
12.3 10.7 12.0
10.8
12.1
13.7
16.7
100
34.4 38.7 38.7 36.7 40.2 34.1 38.4 38.4 36.4
37.3
35.8 36.0 35.0
41.0
41.3
48.2
56.8
aEstimated using cost equations from Table B-l of A Guide to the Selection of Cost-Effec-tlve Wastewater Treatment Systems, EPA 430/9-75-002, March 19 75, an STP Index of 263, and a 20% surcharge for s i t e work and bui ld ings . STP Index i s the na t iona l average wastewater treatment plant cost index.

535
contingencies, and interest during construction at twenty-seven percent.
Operation and maintenance costs include the annual average equivalent
of 0 & M costs at 100 percent utilization throughout the life of the
plant, and all material costs, including chemicals, power, fuel, and
other materials. Capital costs are trended at the National Average
Wastewater Treatment Plant Cost Index of 177.5 for February 1973, and
materials at the Wholesale Price Index for Industrial Commodities of
120.0 for February 1973. Labor cost including allowance for fringe
benefits, was taken at five dollars per hour.
An Analysis of Construction Cost Experience for Wastewater Treat
ment Plants is based on the grant eligible cost data for more than 150
treatment plants constructed during a period of four years (42). Costs
in the Analysis were adjusted to include 20% for site work and were up
dated from 1973. The comparison established that bid costs are 1 to 2.5
times higher than cost predicted. Thus less economy of scale is shown
by the bid data than has been previously assumed because of the construc
tion cost escalation (Table IX. W).
The market place is found to limit accurate quantification of costs
for the types of unit processes or the required effluent quality. Pre
vious cost data publications had failed to address this problem. Table
IX. 5 gives costs and energy requirements for collection systems of
various sizes and population densities in 1976. Figure IX.2 contains
cost curves which are a best fit of extremely variable data points and
which might require adjustment for a specific project.
Small Community Costs. A summary of the results of an EPA survey
of conventional systems of towns under 50,000 population in the summer of
1976 indicated the following:

536
TABLE IX .4
CONSTRUCTION COST ESCALATION FROM TREATMENT CATEGORY ONE TO SPECIFIED TREATMENT CATEGORY3
Treatment Category
Primary — Conventional (PS1)
Primary — Stabilization Pond (PS2)
Sludge — Conventional (PS 3)
Sludge — Advanced (PS4)
Sludge — Combined Imhoff (PS5)
Secondary — Standard Filter (PS6)
Selected Alternative
(From Table IX.3)
1
1
1
1
1
1
Design Flow
1
1.00
1.31
1.31
1.56
1.73
1.92
5
1.00
1.43
1.24
1.42
1.58
1.90
Rate (MGD)
20
1.00
1.36
1.20
1.34
1.52
1.85
100
1.00
1.04
1.19
1.20
1.40
1.65
Average
1.00
1.28
1.23
1.38
1.56
1.83
Factor Used
1.00
1.20
1.23
1.38
1.56
1.83
SOURCE: USEPA, An Analysis of Construction Cost Experience for Wastewater Treatment P lan ts . February, 1976.
aRatio of estimated construction for specif ied treatment category to that for Treatment Category 1, at each flow r a t e .

537
a w
3
CO
Pi .—, r r l v£>
> £ >J •—' H w
H CO CO
Z H
o o u
I ^ z g M < <; Q >-> 5 o to Fin H
I Z i H w
H H CO t" CO
Z O M H U W W Z • J . J O o
W
n l-i
IS 0) i H
O O TH
•H O S
4J 0] U >M C 4) T 4 O
E *J
z o u tn
S B H 0) 0 j j to o X H U M
3 B 01 •H ft,
B , J B « >
B o
• H u h ( (0 0) H 3 X a o ft.
oi u o> ai •H C 01
O <a •rt 01 i i -H (0 W-c U • J O C 3 01 a oo o <
ft.
ON co o oo CM CM o O —• VO
vO o o
. O IS
o B
J3 IS
o B
o ON o
m CM r» vO —• O N m •-* ON
co - *
.O
a
o B
m u-i oo
CM CM CM
0 0 sr
in r^ 00 O N t-t CM
ON vO -3-
-» -3--3-CM
VJ-
r-vO O p^ CO .H
in •» 00 O •* i-i u -a-
CM
U">
•* CI
f.
oo CM
•-t 00 CM
•H
m CM CO
-a-CM !/"> m CM
ON CO CM
in 00 CO
ON PNI
00 CM .H
CO in r-i
r CO CO
o VO CO
.-I
.H CM
o o vO
o lO -a
m u"> CO
o> o CM O O
4J VO
o m o o oo o O VO o
o o o o CM
o o o o o o
o o o o o
© vO ~* CO
co •a-
•3-oo
ON oo
ON
R co r-» oo in CO u->
00 CM
vO o o © 4-1 O
VO CM • - f O —•
m o r-. 4J m
ON 0 0 CO O CO CM 4-1 U">
o o o o o -a-
© *J oo
oi co 00 01 B <M 3 B O H
OS «

P l a n t Sxze _plovjrate
Fig- IX.2<
t s according to waste-on i t a costb a t ^
Annual per c ^ s i z e . water t rea tment P

539
Two hundred fifty-eight facility plans for forty-nine states were analyzed. The results indicate that operation and maintenance plus debt retirement of the local share for recommended new facilities will cost in excess of $100 per household in 40% of the communities and $200 per household in 10%. Costs exceeded $300 per household per year in several cases. Communities under 10,000 population experienced much higher costs on the average than larger communities. (43)
This meant to the householder in a small town that the sewage portion
alone of his monthly bill from the city could run in the neighborhood
of from twelve to twenty dollars. Fault for the high cost was attri
buted to the failure to analyze the alternatives of non-sewered systems
in the facility plans even in cases where they were potentially cost-
effective (10).
In a review for the National Conference 0 & M costs for small muni
cipal wastewater treatment facilities were presented which had been
derived from 1300 inspections and adjusted to 1976 dollar levels (43).
(See Table IX.6.) Similarly, the present worth 0 & M and capital costs
were compared for activated sludge facilities (Table IX.7). It is
apparent that mechanical activated sludge facilities have significantly
higher 0 & M costs than the other types of facilities listed in Table IX.6.
Alternate disposal techniques. Various means are being explored
as alternatives for disposal of sewage once it has been collected. Two
alternatives presently under study by EPA are:
1. aquaculture — the use of sewage as a fish food,
2. land application (spray irrigation, overland flow, and rapid
infiltration) — the deposit of sewage on land to increase
fertility of crops. The crops involved have usually been lower
in the food chain than those intended for human consumption.
Some difficulties are being experienced with both methods. In
aquaculture metals appear to aggregate in the higher predatory fish

540
TABLE IX.6
OPERATION AND MAINTENANCE COSTS FOR SMALL MUNICIPAL WASTEWATER TREATMENT FACILITIES
(1976 Dollar Levels)
Wastewater Treatment Process
Annual O&M Cost ($ 1000's)
0.1 MGD 1.0 MGD
Primary 11.6 58.5
Trickling Filter
Extended Aeration
12.5
18.0
• 1.5
66.7
Activated Sludge 18.6 87.0
Stabilization Ponds 11.2 38.1
TABLE IX.7
PRESENT WORTH COMPARISON OF O&M COSTS WITH CAPITAL COSTS FOR ACTIVATED SLUDGE FACILITIES
Design Flow Rate (MGD)
Present Worth of Capital Cost ($ Million)
Present Worth of O&M Cost ($ Million)
323 .406
1.226 1.193
1.0 2.140 1.899
SOURCE: USEPA, O & M Considerations for Small Municipal Wastewater Treatment Facilities (Washington, D.C., 1977).

541
thus eliminating them as a potential human food source and reducing
the cost-effectiveness of this method. Conservationists are in oppo
sition to the various land application techniques because of problems
of land availability and because of the metals and minerals present in
the wastewater due to the industrial contribution in central collection
systems and to the inability to control access to sewerage systems.
Environmental assessment procedures will also slow this land disposal
effort reducing its effectiveness in the next few years.
Land application treatment costs have been developed in a series
of three documents in which five of the best known case histories of
land application of municipal wastewater are presented (24).
Low pressure sewer systems are an alternative which could also
offer significant cost advantages for collection systems under certain
circumstances. However, this would not be an overall solution to sew
erage problems since treatment would still be needed.
The JPL system is a new cost-saving sewage treatment process
derived from National Aeronautics and Space Administration (NASA)
research. A pyrolytic reactor converts solid sewage material to acti
vated carbon which in turn treats incoming wastewater. It is expected
to exceed the EPA standards for ocean discharge and to reduce capital
costs by twenty-five percent as compared with conventional processing
systems.
The wet transfer system utilizes a grinder to mix household refuse
with sewage. A recent study suggests that the wet transport of such
a combination would be technologically feasible and convenient but more
expensive than the conventional method of collecting and transporting
refuse (11). A cost analysis of the two systems suggests that the wet
transport system is uneconomical for present wide-scale application so long

542
as less skilled manpower is available and transportation costs are
not excessive (see Tables IX.8 and 9).
STATE OF THE ART — SEWERLESS TREATMENT SYSTEMS AND WATER REDUCTION DEVICES
Septic tank. At the present time on-site sewage treatment tech
nology primarily utilizes septic tank (or anaerobic) treatment of house
hold wastewater. Because of the availability of septic systems, their
proven acceptance, and the financing of such systems by lending insti
tutions, this type of treatment is widespread. Introduction of septic
tanks by public health educators and sanitarians is common whenever
public water supplies are extended especially in areas where central
collection is impractical or infeasible.
Intermediate technology. Another level of technology in waste
water disposal has been developing (or accumulating) in the past few
years which cannot be ignored in any state-of-the-art documentation.
The technology itself is not new but the techniques are. Composting,
aqua privies, and water basin discharge for flushing are some of the
many disposal methods included in the intermediate category. These
disposal methods utilize local materials in on-site construction (16).
Local materials used in both Tanzania and Botswana included such things
as elephant grass, ferrocement, and thin and narrow concrete bricks.
One successful unit which has been reported, the Roec Latrine, has an
inclined shaft extending into a trench with a vertical vent. Prelimi
nary results have indicated that the vertical vent is the key to fly
control. Another successful unit adapted to Moslem culture allows the
use of water for cleansing. It is called the Utafiti and has an open

543
TABLE IX.8
COMPARATIVE ANNUAL COSTS PER HOUSEHOLD FOR CONVENTIONAL AND WET TRANSPORT SYSTEMS,
BY SIZE OF POPULATION AND REFUSE GENERATION RATE
Total System Cost Range Item
Conventional System^ Wet System
Population sizeb
50,000 $57-115 $132-196
100,000 52-110 126-184
500,000 43-101 113-160
Refuse genera t ion r a t e s c
1.02 kg 43-101 113-160
1.53 kg 45-103 126-172
2.04 kg 47-105 134-181
SOURCE: Curran A s s o c i a t e s , "A Pre l iminary Assessment of Wet Systems for R e s i d e n t i a l Refuse C o l l e c t i o n , " EPA Contract No. 68-03-0183, March 1974, p . 152.
a I n c l u d e s the usua l cos t s fo r sewage c o l l e c t i o n and s ludge handl ing and assumes i n c i n e r a t i o n of r e f u s e .
^A genera t ion r a t e of 1.02 k i lograms per c a p i t a per day i s assumed. cKilograms per c a p i t a per day a re for a popu la t ion of 500,000.

544
TABLE IX.9
COMPARATIVE ANNUAL COSTS PER HOUSEHOLD FOR CONVENTIONAL AND WET TRANSPORT SYSTEMS, SPRINGFIELD
SMSA (STANDARD METROPOLITAN STATISTICAL AREA)
• - . ' •
Item
Refuse collection
Bulky refuse collection
Dispos alb
Sewer maintenance
Grinding
Treatment
Sludge handling
Sludge disposal
Annual Total
Conventional System
$17.50
1.00
3.50
2.00
->-
9.00
5.50
0.75
39.25
Cost
Wet Transport System
$2.50a
2.00
1.00
6.00-9.00c
80.00-105.00
12.50
8.50
2.00
114.50-142.50d
SOURCE: Curran Associates, "An Assessment of Wet Systems for Residential Refuse Collection: Summary Report," EPA Contract No. 68-03-0183, March 1974, p. 80. Data are 1973 price estimates for Springfield, Massachusetts.
aCollection of nongrindables only. "Assumes landfill of refuse. cAssumes one flushing per year. If four flushings are required, the
cost would rise to $24 to $36. Excluding the grinder system costs, total costs would be $34.50 to
$37.50.

545
bottom which allows drainage of excess moisture, which would limit appli
cations to dry areas.
One of the major advantages with this intermediate technology is cost.
Typically, each unit has averaged $30-50 without labor in Tanzania appli
cations. Data collected in Taiwan, Korea, and Japan on a vacuum truck, and
vault system show it operating at one-tenth the cost of sewerage systems
(21).
Alternatives to the typical subsurface disposal system. In the area
of sewcrless devices which receive wastes from individual units for treat
ment/disposal, "soils information and percolation tests indicate the prob
ability of success or failure of a subsurface tile system. . . . Alterna
tives to be discussed include: utilization of two subsurface disposal
fields [Figure IX.3], individual lagoons [Figure IX.4], above-ground mounds
[Figure IX.5], recirculating sand filters [Figure IX.6], aerobic digester
units, holding tanks, recirculating toilets, composters, and incinerating
units." (39)
Comparison of advanced devices and systems. In Table IX.10 comparison
may be made of the six types of devices to be considered. Because of the
numerous devices available within each type a narrative comparison would
have been lengthy and ineffective. Instead an evaluation of each of the
six categories is presented with some of the more successful units being
referenced.
Other commercially available devices which could be classified
as collection or non-treatment devices, such as freeze toilets, chemical
toilets, pit latrines, aqua privies, and water-borne network devices were
eliminated from consideration in this report. Vacuum, oil base, and
biological waste processing methods were included even though their
waste product requires further treatment and/or disposal because the

1
Typical installation of alternate disposal fields using gravity flow of effluent -level lots.
r
SEPTIC TANK
- DISTRIBUTION BOX WITH Div iK^ICN CATE TO OIVEHT C f f L J f K " ' 0 ALTERNATE SU8VJHE-CE D ' S P Q S A L SrS'^M
ALTERNATE SUBSURFACE
1 01SPOSAL AREA
-HOUSE SEWER
•SEPTIC TANK
OUTLET SEWER
RETENTION BOX
DISTRIBUTION BOX
SUMP WITH SUMP PUMP
AND CHECK VALVE
Typical installation for pumping effluent to alternate disposal field—level lots.
Fig. IX.3. Alternate subsurface disposal fields,
SOURCE: W. F. Taggart et al., Considerations for Designing and Improving Individual Sewage Disposal Systems, Oklahoma State Health Department, 19 77.

547
c o o 6 0 CO
i-H
0) 00 CO 3 <D en
•-{ to 3
T 3 • H
> • H T 3 C
M
. <r « X
M
, 6 0 •i-t fe
1 e/:
•H
OJ Oil
Individual Sewa
u
Improvin
T3
C CO
6 t C
•H
s •el 03 OJ
Q
l-J
o <4-I
en n o • H 4-1 CO U OJ
•o • H
en c o u
. r- r- o\ f—t
* 4-1
c a) a 4-1 )-l CO
a. a j
Q
.c •> 4-1 . t H
• H CO tO 0)
X u <U OJ
4-1 4J CO U 4J CO LO 6 0 6 0 CO CO 6
H O £
• CO f n rH
.M • o s
* •
en •• 6
w QJ U 4J P i W :=> f ^ O t / l C/}
i—1 CO en o ex

548
STRAW OR HARSH HAY
MEDIUM SAND FILL
1" PERFORATED PVC PIPE
CLAY FILL OR TOPSOIL
6" TOPSOIL
CROSS SECTION A - A
x - n r n n - . , , , . . ^ DUMPING CHAMBER
T_
l»s" PVC PIPE FROM PUMPING CHAMBER
1" PERFORATED PVC PIPE
SEEPAGE TRENCH 5/8"-I" STONE -v
WW •.iViV-l
Bit
m
m m m m m
l„>i' :l
L'-ku
w
thai
f m m
KzxZ
J
/ / , /jXUJ PLAN VIEW
Fig. IX. 5. Mound system for a three or four bedroom home.
SOURCE: W. F. Taggart et al., Considerations for Designing and Improving Individual Sewage Disposal Systems, Oklahoma State Health Department, 19 77.

549
z <
_l 3 (J cr o UJ cr
• o c CO OT O) c • ro 3 CJ k -
o 0) V -
y § 2? >> « _ </> O w — c => <u
layo
at
m
o 2 E o> CD CO
-c $ o 5 CO in
u cu 4J r - l • H U-4
*o c (0 CO
6 0 C
• H 4-J CO
r H
3 CJ M
• H U 0) >-l
r H CO CJ
•r-l
a. >, • u
U-l
o 4-> 3 O >> CO
r H
a • r l 4J CO
B cu .e CJ
to
• VD
>< r-l
• 6 0 • H Pn
• e <D 4-1 CO P CO
4-1
C cu e 4-1 CO CU S-i 4-1
CU 6 0 CO
s cu CO
Ind
ivid
ua
6 0 C
• H
> O
a S
M
X I
c CO
6 0 C
• H C 6 0
• H CO CU
Q
u o
<4-l
CO
c o
• H 4-1 CO r-l 0)
T 3 • H CO C o
CJ
• r-r- & i—i
•* 4-J
C CU B 4-J r- l
CO O . CU Q
r C 4-1 r - l to cu ac cu 4-1 CO 4-1
• CO
• r-H CO c0 E
o 4-> r C CU CO
r H 4-> AS rJ O CO 6 0 -6 0 CO CO S
H CU 4-1
• CO U-> >•
CO
.
SOU
RC
E:
W
ewag
e D
isp
osa
l
en

co
w H CO >-> CO
CO w o M > w Q
O
S3 O CO
O
1
^ to
•a t -cr 0) 01 6 P3
4-1
CO
o
4-1 •H
p
U O T 5 B O T T d d V
Aa BU1TJJ
u u s n i j i a
S"[BO -puiaqo
J9AO<J
J 9 3 B M
( S U O S J 3 ^ 1 \ A ^ x o B d B n
S 3 s o o
8 u r q B j ; 3 d o
0001$
0001$
005$
J 9 A ( )
-005$
-001$
001$-0
& 4J
c 3 o c_>
CU
CO
•z
1 3 O
.e 4-1
s
gj o>
e e o o 33 33
1 3 1 3
C C CM CM
<fl <3
* -K
vO i H \ D 1 1
3
O- 3 LO 1 O
en vo
* *
c o>
1 3 < ; Q> u"j 3 P CO
4-1 0)
i H
•H O M 4J 4-1 4-) to oi 0) CJ Q W
Incinerating
OI OI E 6 o o
33 33
1 3 1 3 C C
CM CM
< <
* *
vO 1
3 3
O Cli n <fr
*
*
G C 0) OI
1 3 1 3 0) 01
* > CO CO
1 3 u to
1 3
§ 4-1 CO
0) O 4-1 U 4-1 44 0)
u a CU O
r H i H
w w
&s 4-1 O to 33 3
1 3 1 3
a c M CM
< <J
* *
CM i—1 1
3 3
i n oo
*
*
a 01
1 3 <j a> C/j |s p CO
4-1 OI
r-\ 4J O 4-1
C 0) •rl l i o nj c o
i - l H
1 P . r H O CO
>-l 4-J 0> C3 > 0) oi E Q
<3
*
O (N 1
<r
*
<J CO P
M O 4-> tO 0 0
u 3 C}< tx3
CU g o 33
CO
o <r l
< f
•K
c OI
T ) 0) S
CO
6 3 u 4-1 • H 3 S CO 3 > •H
i-H O
Composting
OI
s o 33
S 6 XI O C 33 <N
CO CO
*
o <r -d-1 1
<r co
•K
•fc
>> ^ CO
< & CO U •—' O
8 to
53 (0
CU O B H 10 1
CO i H v—' r H
3 s
OI E o
33
1 3 C
CM
CO CO
* *
<J-1
to XI
o
CM
* *
c , ~s OI <3 13 CO 0) P S w to
^ ^ 4-1
<u -KJ E 1 VJ 3 0)
• H 4-1 PQ -H W §
CO
OI E o 33
I D C
CM
CO
*
O 1
<r
*
< C / j
p
OI c o u A H 1 tO
o H
r H tO >-l
3 PS
CO
^D
| < ) •
*
< C/ j
p
•l-l (-1
P M
to OI
c o
• H r H CO V4 to
P H
CO
^o 1
<r
*
tO
E C CU Q
Oi OI E E O O 33 33
1 3 1 3 C C
CN CM
CO CO CO CO
* * *
vo <r o-I I i
4
/day
2
/day
2
o 0-
•K
* 4t
p CO 0) / - ^ T 3
I D < (0
<s oi co c P CO "-" U
•H
CM
4J to O ^ , f X 4J E 01 O ^ H U CJ C O CO
to 0 e
0) 3 3 ^ S 33

551
1 0) U CO
• H -U 3 C C T CD
cu B
4J CO
O
•H c S3
U O T 3 B O
XJ
TTd(ty B U I T J ^
3 u a n T g j 3
S f B O TU13U.3
J 3 M O J
a a 3 B f i
( s u o s j ; 9 ^ )
X 3 T o e d B n
S 3 s o 3
3 u i 3 B a a d o
000T$
000T$
005$
a 3 A 0
-oog$
-001$
001$-0
t! 4J
S o u
1 cfl 53
Method
CO
-K
>N cfl
CO
*
*
^ CO
CO
*
*
> cd
CO
*
*
>> CO
e a a a o z
o • H . O B o :*J
Composting
o S5
o
*~> cO O
H 1
i - ( i—i
3 2
(continued)
o
sett
N
o i-H M o
•>-5 i-H •H S
CO
a
O 25
O • H CO. O S-i H
B o 33
T J
c CNI
, -J h J
•X *
*
*
CN •—I 1
f—<
CO
•a
*
< < CO CO
» &
4J CU
<-\ o 1 - H 01 Pn
r H 1 CJ O > ^ - H
U PQ
Biological
j
0> CO r H <U •o C CO - H 4J t - l
U U O -H
hJ h J
* *
* *
3 3 "-*. ---, O O o o t—4 r—1
* *
< ^ CO
5 3
.c o CO T H 3 4-1
i-H. CO
Pn B o
•w C 0) O
•-> s
0) r H
r Q CU CO C
U U O «
• - I . j
* *
*
3 3 ~-> \ O O in o
CM
*
*
CO T J cfl C < CO C O
O P
4-1
cu • H
• H - H P O M H 3 o w D . <*H 4-> cfl o >-<
P* O
cu C
•H Ui CO
2
nJ
*
+ -3 -
-K
< CO
&
X CO 3
• H t i l 1 3 O CO
>
Vacuum
j
acuum
> x 3
r H O P 4J O CD
r-H
W
4-1 • •
« g g 11 cu 3 P e V-l E g -H O E R l-i 0) O O CO
r J . J r J h J
* * * He
LO
+ 1 <J- CO
*
*
c CU
<u <; <i < 3 co co co
e 0) 4J CD
co 3 O cO
CU co co 0 0 > \ cfl O O cfl S cfl U U <D > - H 4J
CO U > U • H C CU
<; W J
r J HJ r J r J
*
* * * * * * * -X
*
< : < ; < ; < CO CO CO CO u
System
U
ilet
U U
o cu o •H E H U 4-1 O CU cfl 3 3 CO E B CO cfl O O cu. H 4-1 - H i-H CO X >-l CU CU O 01 4-1
oo u & co • H CU CU CO
Q < CO 5
Aerobic

552
ued
.t
in
c o
o i i
o .—1
>4 M
W i J
^ H
--
M cn
• ^ cr d) 0) S erf
4-> cn o
4-> •H
!=>
u o x ^ B o x x d d y AaB iuxa j ;
5 u a n T i j g
s x B o x u i a u n
aaMo , j
J 33 Eft
( s u o s x a j )
A a i O B d B O
s a s o o
§ u j 3 B j a d o
0 0 0 1 $ -3 3A0
0001$-005$
ooe$-ooi$ 001$-0
& 4J
o u
9J 6 cd •z
X> o j s 4-» 0)
Ind
us
.
Ind
us.
Ol QJ CD CD e s e s o o o o re re re re
j i J ^ h i j
* * * * *
* * * * *
o i n o CN i n 1 VO 1' CO
<r m
* * *
*
CO CO X) X) CO cd
< < < 3 C co co co co rd D S P U U
CO CO O CO 3 O M
M v-i cn x> X to ,3 M O O co H O U U S 1 cfl a o o o 3 M l-l M M CT 2 o h n < ;
nu
ed)
M O 4J •H C
ero
b
(Co
<!
ome
at.
Rec
.
re cu ^-> U 0) XJ a g
C a) o CN o i re
hJ l-l H
* * *
+ + VO <f O- 1
-3-
* *
< £ ! < : < rat/1!/) S> M M
XJ CO 3 03
fXH E3 co X
o cO •H co G 60 3 £ co cr co S •< c/>
cu cn co
PQ
M • H O
XI •H 3 a *
rri M
II
M
soli
d;
II
00 • »v
.3 CO CO
II
<
use
.
n
3

553
final product is in a concentrated form which is contained and therefore
more easily disposable.
The newer methane plants were not included because the technical
considerations of air emissions and the size of operation required for
profitable development would not be conducive for their consideration
in unsewered low density areas. The initial investment in such plants
is large, but continuing operation expenses are small so that methane
plants are more suitable for larger permanent sites.
Units with greater capacity on the average cost more than those
which are for only three or four persons, though the per person cost
was less. Many units were limited to only three or four persons by the
design. The more complete waste treatment devices were more expensive
with the incinerating and aerobic devices lying in the higher cost
range.
All the waste processing methods require some form of energy with
the exception of a few composting devices. The amount of energy is
dependent upon the method with the incinerating and aerobic methods
being the highest consumers. Efficiency of the individual unit pro
duced some variation but to a lesser degree. Comparable treatment
processes were found to be competitive.
The most successful devices would have to be termed the most relia
ble with the exception of developmental ones. Since the treatment of
the waste is on-site, failures have resulted in immediate sales losses
in the respective marketing areas. U.S. manufacturers have purchased
patents as they became available from other devices resulting in pro
ducts with greater reliability.

554
The devices examined have aimed at two primary markets, namely,
the vacation home or recreation market and the industrial market, where
conditions have warranted a waste processing method for on-site treat
ment. Both markets have been willing to pay the slightly higher price
required in the developmental stage. Recent developments indicate a
broader application is foreseeable with a substantial cost reduction
implied by mass production methods.
The user has accepted these various methods of treatment on-the-job
or vacationing as circumstances have required. There are at least an
estimated total of 200,000 units in present day use.
Advanced systems. Advanced methods of sewerless treatment have
been classified into five categories: Incinerating toilets, composting
toilets, biological toilets, vacuum systems, and aerobic tanks. A sixth
category, oil-flush toilets, are. finding increased application in remote
areas. An ever-expanding list of manufacturers are supplying and pro
moting units in these categories.
A major concern which has been expressed about sewerless treatment
is the energy requirement. Units within any of the six categories have
varying energy requirements depending on the climate and their capacity
and specific treatment process. The composting variety can be operated
without electricity in some instances.
The -major advantage with these systems, with the exception of the
aerobic tanks, is the decrease in water consumption. By U.S. standards
this would equal approximately thirty to forty percent of domestic use.
Some other advantages are that composting toilets produce a humus pro
duct suitable for fertilizer while incinerating toilets destroy the
waste material leaving an inert ash residue. Most of the toilets can

555
be installed in existing dwellings, although two of the composting
toilets do require two story structures or raised dwellings.
Many of these systems require a gray water disposal system. Gray
water is the discharge water from the bath, kitchen, and laundry which
usually contains soaps, fats, and viruses from the skin and clothes.
Incineration of waste represents a waterless, sanitary method which
produces an inert ash that is easily disposed of with no detrimental
environmental effect. Over 15,000 units are now in operation in the
United States.
Composting as a method for decomposition of animal and human waste
to provide fertilizer has been in practice for centuries. A container
is used to catch the waste together with additions of garbage. Air
is circulated through the mass, and in some circumstances manual stirring
is required and heat is added in order to maintain a normal temperature
range or to speed up processing. Some difficulty has been experienced
with improperly placed heating and wiring systems required for operation
in cold climates. The waste is eventually reduced to about ten percent
of the original volume and can be removed by a door in the lower portion
of the container. Difficulty with this method is experienced when the
system is overtaxed or the bio-organisms die off. The fertilizer is
high in nitrogen and suitable for use in a varying time frame dependent
on the particular device. The largest and most successful marketed com
posting device is the Clivus Multrum from which the waste product is
usually ready for removal in about two years.
Biological processing consists of the addition of chemicals to
liquify the solid waste, inhibit biological decomposition, and colorize

556
• • > ' .
the liquid. This type of toilet is currently used in commercial
passenger1 planes. The system uses very little water, and wastes
must ultimately be disposed of. Electric ppwer is also required.
Vacuum systems have the advantage of requiring very little water
for- unit operation, about one quart. This system was developed in
1957 in Sweden and overcomes gravity flow problems. Sewage could be
transported up to 640 feet away horizontally and sixteen feet verti
cally tp a collection tank if desirable. Both vacuum and pressure
collection systems have been suggested for the central areas of small
towns.
The aerobic systems combine the traditional flush toilet with aero
bic decomposition rather than with anaerobic or septic tank treatment.
These systems may or may not be recirculating ones, but the principle is
to aerate the liquid to aid in decomposition before injection into a tile
field. In a recirculating system odors develop when the system is over
used or not used for a few days. These aerobic devices have been very
successful in the replacement of septic systems which have failed because
of soil conditions.
In oil base type methods a non-water soluble fluid is substituted
in a water-tight tank and recirculates in one or more toilets after a
separation process. Eventual breakdown of the liquid occurs after one
year or sooner depending upon use. Some color problems have been exper
ienced in the otherwise odorless colorless fluid. This type of toilet
has been used at several national parks in the United States.
(Incinqlet Figure IX.7) (33) This uses heat alone to reduce human
waste, both solids and urine, to inorganic, odorless and bacterial-
free ash. All models are equipped with a blower which is always on

557
ww///w/////W///>//////////////ft//s/wm.
JL.
w//h/wt////////W/////////.
1. Bolt unit to floor. 2. Install ventline. 3. Connect unit to electric power. 4. Put up Bowl-liner Holder with bowl liners inside.
FLg. IX.7. Incinolet installation.
SOURCE: Research Products/Blankenship, 2639 Andjon, Dallas, Texas 75220.

558
when the heater is on. After the heater cuts off, the blower stays
on until the incinerator chamber cools to room temperature. Moisture
and other vapors driven off during incineration are vented to the atmo
sphere by the blower and vent line. Residual ash is accumulated in an
ashpan located at the bottom of the unit and is emptied once or twice
monthly. The user drops a wax-vapor liner into the bowl prior to use.
The liner prevents the waste from contacting the bowl surfaces.. After
use the Incinolet is flushed by stepping on a foot pedal, and the Incin
eration cycle is actuated by the flushing action.
A catalytic odor control device is associated with the heater. The
catalyst, when heated, causes the odor molecules to degenerate into
other types of molecules.
(RSC Xpurgator, Figure IX.8.) (34) Cost: $2,000. The unit is a
screening and incineration unit. It involves the moving of the sewage
to a filtration area. Solids are removed by deposit on a moving porous
medium through which the aqueous medium passes to a filtered liquid accu
mulator. The porous medium carries the deposited solids through a ther
mal chamber where the deposited materials are destroyed. All fluids
are chemically disinfected and deodorized.
The Xpurgator system filters, sanitizes and recirculates flushing
water, separates solids and destroys them thermally without odors or
fumes. Fluid amounts are automatically controlled with excess fluids
being thermally vaporized.
The Xpurgator II system is built to provide maintenance-free opera
tion. The only service required is infrequent removal of ash from the
ash receptacle conveniently located at the side of the unit.

559
SEPARATION * 1ANK
FROM ' HEAD ,
TO HEAD
VAPOR
MASTER CONTROL
EXCESS
SEPARATION TANK >
SUMP TANK
o LOGIC CONTROL
IOC. ASH
I -J
Fig. IX.8. Expurgator II,
SOURCE: RSC Industries, Inc., 245 West 74th Place, Hialeah, Florida 33014.

(Destroilet, Figure IX.9.) (18) The Destroilet is an incinerator
enclosed in a functional housing. It disposes of wastes by way of a
gas flame that operates automatically only after the lid has been closed
It has the capacity to accommodate the toilet facility needs of twelve
people for up to approximately sixty individual uses per day. Opera
tion of the Destroilet is automatic. Raising the seat winds the timer,
lifts the heat shield and actuates a forced draft system which draws
air through the lid. Then* the timer begins its cycle, the heat shield
is lowered, the burner is started. The burn cycle is followed by a
cool down cycle.
Destroilets operate on either natural or LP (liquified petroleum)
gas. Installation amounts to simply connecting the gas supply pipe,
attaching an outside standing vent, and connecting a source of elec
tricity. Residential models require either 115 or 220-240 volt AC
household electricity, and mobile models require 12 volt DC battery
electricity.
(Clivus Multrum, Figure IX.10 and Tables IX.11-12.) (8) Cost:
approximately $1500/installation. This composting device can function
without an external supply of energy or maintenance. It is an organic
waste treatment system. Developed by Rikard Lindstrom some thirty years
ago in Sweden for his house on one of the fingers of the Baltic, this
system employs the principles of gravity, natural draft, and unaided
microbial decomposition processes. The container is nine feet long,
four feet wide, and five feet high, large enough to hold all the organic
wastes of a family for several years while the waste decomposes. It
can be located either in a basement directly below the toilet and gar
bage inlet, with gravity-feed by means of vertical pipes, or it can go

561
Cover with Heavy V>" mesh screen or Hardware Cloth
T minimum — Height over
Rain cap. Stianty Cap or Wind directional top /
= ' Root Flashing
INSIDE VENT Provide V*" drain hole in tee cap
Fig. IX.9. Destroilet, venting schematic.
SOURCE: La Mere Industries, Walworth, Wisconsin 53184.

562
Container consists of a top and a bottom section end, **hcre a grt^ter capacityJcqutrcd, alto a middle tccnonft). Container in functioning position: height - 220 cm or 250 cm or 280 cm, length - 295 cm max. width - 120 cm.
For ud equate draft, exhaust outlet high and insulated agotnit cold.
grass, leaves, etc. 2 * ^ 3 " flarden soil about 5 cm
I i^V^VsF" f ^ t mould about 10—12 cm
.Mm;-.....
Fig . IX.10. Clivus Multrum.
SOURCE: Cl ivus Multrum USA, Organic Waste Treatment System, 14A E l i o t S t r e e t , Cambridge, Mass. 02138.

563
x
w m <
2 w H C/J
e/j
§ H
> M i-J
< H W O H
o
en en 4-1 O (D en o B O r o O
U X
> 4-1 • H ^ d S u B 3 A o 6 w as o u
4-1 0) - H u c
•H P t-i <D
fc 0) H i-H CO
u M M en c
• H - H J CO
o o c o o o o o o o o o O O CNI O CN 0
c c SJ
o o o
o o o
o o o o o o
O O <r
r. #\ *> * ». ~ #s * n r v * . * o < N < r CT I > J o i CT\ •—1
C O - 3 - O S t C O -0" i-H CO i-4 C^ CO
i n i n ^ O CO I s -r-» i— N vo - ^ c ON
s. g <D 4-> en > N
en
B eu
• i H en
•2 >^ B en > > CU
i H en c 4J ^ 01 O en i-H B nJ T H p . to i-i cu «J m is ctj en a> n) u
B en M H eu en co co v4 4-i oo x> u o c CO - 4-1 VJ C O Ct
Xi £& CD CO CU M M-S-i G r-H CO > cO co C )4 ^ 0 0 4J - H t-i »-i O C
O O 4J 4-x ) e cu >4-4 <4-i co ce c; 3 oo i-H i -cO u co en en - H t-
U ^ (U 91 4J 4. o H v< p. a . c c cu 3 co -H -H ai a
• H s a PM ex, > > •H o
H
M
oc CN
vC
0 0 C CN CN <J-
<N
o vO
o o CNI
o a o r~ c r-4 1 —
a 4-e/ C e.
4-
c a E C
" r
J C < a
4 1 -
) n J 4-J C < t-4
> i
» 0 ) C
•r-) 1 -
> c : ce i X
t c
J ct
r ) 4-
X 4 0 J - r ' Q
) >-< pt
CO
0
4.
C ) C : i -) 4.
ce J r -: i -0 ce 4 4-) er 4 C 4 1 -
in m < r - - I
o c o c r o 1-4
-cr
CNI
0 0 o-o 1—1
O O CNI O O v o < f CN
omes
:
JZ CO
a. 14-1 O en
B . 14-1 CU
i-H 4-1 cO en
I en cu C U o o
>! M CU O >
' "4-1 C ! O ) 6 O C 4 CU C ) U H T
I en co 4-! ^ 4 J (t
! 10 C r
I.
Con
veyo
r H
ori
zo
M
i - H
CN
i - H
CO 4-J O 4-J
1 r Q
: 3 en
j
4 i
J

564
cu 3 c
•r4 4-1
o u I I
X M w rJ
CO •M O CO O O C I
o
r ^ 4-J • H , C
S"S i w o
C_)
4-1 01 * r l
o c • H 3 r 4
P H 0) i-H
4-1 0 0 CO C
• H - H • J CO
CO
<u a o
w
3! e o nc
a) t-H CD
CO
o c c o o c o o c
#. * ro in u~ C M . - < i —
o o c m o c i—1 i—1 f-^
o o c o m "~ CO r-< I—
of homes)
JC
e cu 4-1
CO
4-1
C g • • 4-1 p 4-1 CO CU U CD 4-1 01 U r H C 4-J - H C C
II.
Greywater pre-
Trickling f
Pipes to co
M
o o o
«s * t
ro m
o m en
o o vO
• ^
tment system
*
tre
u cu 4-1
CO
• 1 CU
u 0 0 » —
. - 1 CO
J 4->
Sub-to
o o ^r
* r-O
ro
0 0
c CO .-H
CN VO
r-~ CN
4J
cos
x> cu
r H r H
CO 4->
CO
c •H r H CO 4-1
o H
< t CNl
o •V
r H
• — s
e (installed
S o
t - l
CU
ex 4J CO
o o CU 0 0 CO r 4
01
> <
CO CO CO S
CU 0 0
XI •H M
• i CO
O
cu CU M 4J CO
w <
a CU 4-1 CO
C O
C CU
6 4J CO cu U
H
CO CO
u
•H
00
u o C/l
a 3 M
3
s CO 3 >
U
o C O

565
w • J cq < H
CO H CO
o c_>
w o
CO
2 H W • U CO
o a H
COCO - ^ to > rJ O
o z o CO
o
, tn tn
co r E
r H r H OJ U 0) CX 01
(X,
• tn
en co X
•a c CO
r H 01
> o ^ o
cu u CO
.c CO
i—i CO
o o
r J
r H CO 4-1 O
H
Q) M CO
JC CO
r H CO CJ
o r J
r H CO 4J
o H
to 4-1 tn o u
tn 4J
en o u
en 4J en o u
CO 4J CO
o
o o C I
o o CO
O
o i n
o o m
T 3 0)
> cu CO
to
B o
JZ
<4- l
o
u 0)
4 3
3 z
o o o o o o O vD O
* rv rv
0 0 O CO « * 0 0 CO CM r H
rv
r H
o o o o o o o o o rv A rt O v D CO 0 0 O CO < T 0 0 r H
•* #v
CN r H
o o o o o o o -<r o r~ o m r H t r . o r H CM CT\
rv
r H
o o o o o o o o o * * * o si- m
r->. o O r H OV 0 >
rv — rv
r H CM r H
to co cu u c cu -H
Cfl 4J | 3 r H 4J c OJ CO CO to U O r H QJ CJ D . r-l 3
o cu C 4J 4J en
o c ex • H QJ 0) r H 4-1 B U tO U U U U 3 CO OJ CU U 0) 4J 4J 4-> r-l C Cfl CO H M h J
c o o
o o v D
•v
r H VD < f
* r H
o o o
• V
CJN
4,41
o o <r
rv
CM r-^
CO r-
CN
o o o « a\
5,97
tion costs
o 3 u 4J CO
c o o
r H CO 4->
o H
P -VD 0 0
#v
<r
m r H t ^
rv
< ! •
r H
<r CM VD
rv
- J -
0 0
m c
rv
r H r H
CU
> VJ
CU to
CU
B o
r C
OJ
ex 4-1 to
o o
< t CN
o *> r H
vus
• H r - v
U
i n O
B 4-J QJ CO 4-> O CD
<-> > - . CO
Q) r H B r D 3 10 r-l rJ 4J CO r H
££ o c_>
B^ Ov
r
vus Multrum
• H r H
1 1 0 0
c • H
> CO
en OJ 0 0 co 4-1
cu a u QJ
cu
CO
en to
S
OJ 00
T 3 • H
r-l
"I CO
u QJ OJ U
B QJ 4-1 CO
CO
c Q)
B 4J cfl QJ U
H
CO
tO
CO
0 0 V-i
o
< c/l
3 £ CO
3 >
• H
W u PS
o

566
in the ground outside the house and be fed by a horizontal spiral
conveyor powered by a small motor.
Because of the inclination of the floor of the container and
the air flow through the mass, no turning of the wastes is necessary.
As the bacteria doing the decomposing are naturally predacious on most
organisms harmful to people, the humus produced is safe to use in vege
table gardens.
There are never any odors in the bathroom or kitchen because of
the draft caused by negative pressure in the tank which carries them
away through a vent. The kitchen garbage, which is mostly carbon,
contains the energy which the microorganisms (occurring naturally in
the wastes) use to do the work of conversion.
(Toa-Throne, Figure IX.11.) (14) Cost: $1190.00, complete unit.
The Toa-throne is a composting device which has the capacity to accept
both body waste and organic garbage for a family of from four to six
people. At less than 45 F the decay process stops and it may be neces
sary to insulate the unit and to heat the incoming air in certain cli
mates. If the device is used only occasionally during cold weather, a
heat source is not required. The micro-organisms will become active
again as soon as the temperature rises.
For the technique of the process, see Figure IX.11.
1. Body wastes and garbage enter the container through the toilet stool.
2. An electric blower draws in air to carry evaporated liquid from the container. Where no electricity is available, invection created by heat from the process is used for ventilation. Cases and evaporated liquids are then conveyed to the outlet above the roof by a ventilation tube. Therefore, no odor from the container penetrates into the room.
3. Longitudinal distribution conduits loosen up and prevent the waste material from packing together. This insures thorough aeration of the entire mass.

567
Width: 990 m m (39 in.)
IB«»D (68 in.)
I'ig. IX.II. Toa-Throne decay container diagram.
SOURCE: Enviroscope, Inc., Introducing Toa-Throne Aerobic Decay Toilet: A Natural Method of Waste Disposal. P. 0. Box 752, Corona del Mar, California 92625, 1975.

568
4. An "air staircase" allows the air to penetrate the decay bed from below. The stairs are inclined downwards and cannot be obstructed. Thus, fresh air is continuously circulating through the refuse mass. After it passes through the decaying matter, it is drawn off with the gases and evaporated liquid, exiting through the roof vent. (Patent applied for on air staircase.)
5. The waste ends up on an initial bed of peat moss and compost soil or bark humus. This bed is prepared only once. The micro-organisms are continuously propagating, therefore, there-is a new bed constantly forming as the first one decays.
6. As the micro-organisms decompose the waste, it is transformed into what is called humus at the bottom of the container.
7. The humus is removed through the access door from one to three times per year, depending upon the size of the household. It should be placed on a compost heap for six months prior to use in gardening as a precautionary measure.
8. Inspection opening. (14)
The first removal of decayed matter takes place after one and one-
half to two years from the initial installation. There will be approxi
mately sixty pounds of humus per person per year.
(Ecolet, Figure IX.12.) (29) The Ecolet is a composting device
which is made of polystyrene plastic. Additional heat is provided by
heating coils located inside the unit. Oxygen is forced through the
pile by an electric fan that draws air from an intake located at the
bottom of the Ecolet and exhausts it through a wall or ceiling vent.
Moisture is added to the waste pile through urine, and mixing human
waste with paper and small amounts of kitchen scraps occurs naturally
as the Ecolet is used. At the time the Ecolet is installed, a layer
of peat moss—approximately twenty pounds furnished with the unit-—is
spread evenly over the heating coils.
At the beginning, waste builds up rapidly, but decomposition begins
at once. Within a short time the waste level diminishes and remains
constant. The bottom layer of the waste deposit should be periodically
scraped down through the heating coil into the collecting tray. The
emptying of the tray should be done when the unit has not been in use
for some time. After a year of normal use, an odorless, powder-dry

569
a ventilating (an and exhaust system to evaporate liquid waste and remove o d o r s
twenty pounds of peat moss which is spread over the heating coils to provide soil bacteria to interact with waste bacteria
a molded, hijjh-gloss. laminated and impact-resistant polystyrene housing and seat
a transfori and switcl'
a collection tray in which decomposed (powder dry) wastes are <idihcred for removal
a healing coil with thermostat to insure that a temperature ideal for decomposition is maintained
Fig. IX.12. Eco le t .
SOURCE: Recrea t ion Ecology Conservat ion of the United S t a t e s , I n c . , 9800 West Bluemound Road, Milwaukee, Wisconsin 53226.

570
residue is removed from the collecting tray at the bottom of the unit
and may be used as a fertilizer. If the unit is unused for a period
of two weeks or more, it may be necessary to add one or two quarts of
water to the waste material. In winter the pile of waste freezes, and
the process of decomposition goes into a state of suspension. After
thawing, the process begins again.
The Ecolet is thirty-two inches high, weighs less than 100 pounds
and requires a floor space of twenty-four inches by forty-two inches. It
should be installed in as warm a place as possible. For year-round, con
tinuous use, the Ecolet is best suited for a family of five or six.
(Vacu-Flush, Figure IX.13.) (20) Cost: $1400-2000. The automatic
Vacu-Flush system operates on the vacuum principle. It is odor free
and can flush on less than one pint of water. The Vacu-Flush also has
"self pump-out" capabilities at septic tank facilities. The system is
designed to meet any present or future pollution control law. In dual
head installations, each head has its own accumulator tank thus making
it possible to flush both at the same time.
(Lectra/San, Figure IX.14.) (30) Cost: $200-400. Lectra/San is
a compact, flow-through waste treatment system which may be used on
ships and which efficiently reduces solids, destroys bacteria, elimi
nates odors, and lowers the biochemical oxygen demand. No chemicals
are necessary since the disinfecting agent is produced as needed by
the electrolysis of the seawater used.in flushing the toilet. When
operating on fresh or brackish water, a small amount of table salt is
used as the source of the disinfecting agent. Lectra/San is completely
automatic and operates on standard marine batteries.

571
Indicator Cable
bi8 Vacuum Hose » ^
I ! . " Vacuum Hose /
Fig. IX.13. Vacu-Flush.
SOURCE: Mansfield S a n i t a r y , I n c . , 150 F i r s t S t r e e t , D e r r y s v i l l e , Ohio, 44864.
•SOLIOS HfOUCTION
MOTOR
Fig. IX.14. Lectra/San.
SOURCE: Raritan Engineering Co., 1025 North High Street, Millville, N. J. 08332.

572 i
The Lectra/San system consists of a two-chambered treatment unit
equipped with motors and electrode pack, a control unit with treatment
indicator, a logic unit containing relays and the solid state timing
circuit, and the salt feed unit. The treatment unit is located between
the toilet and the discharge line. It has a total volume of approxi
mately three gallons and is 15" x 8 3/4" x 8 1/2". Overall height,
including motors, is }3 inches. The treatment unit is made of tough,
chemically-resistant polyvinyl chloride (BVC).
(Magic/Flush Toilet, Figure IX.15.) (26) Cost: 1975--S3,000;
1976 projected—:$2,QQ0. This sewerless system looks and works like a
home toilet, but it uses no water. Instead, a clear, odorless, mineral-
derived liquid flushes the bowl.- The non reactive fluid looks like
water, but unlike water, can be used over and over again. Repeated use
of the fluid is made possible by a simple purifier that is part of the
underground folding tank. Gravity parries wastes from the toilet to
the tank where it stays until a truck hauls it away. At certain
Magic/Flush installations a small, 3^ horsepower gas generator is used
to periodically charge the 12-volt batteries that operate the system.
(Chrysler Aqua-Sans, Figure IX.16.) (2) Cost: $4000. The
Chrysler Aqua-Sans systems are designed t,p use oil as the flushing med
ium. The density of the oil is some seventeen percent less than that of
human waste permitting gravity separation. It is immiscible with the
waste and chemically stable under the operating conditions and in the pre
sence of human waste. Four models are available for capacities at
600 gpd, 1500 gpd, 5000 gpd, and 10,000 gpd.
Waste is transferred by the flush liquid from the commodes to the
separation tank where the solids are separated and settled in the sump

573
urinil
Wjiie pympout port
I iUx*cf tank
Fig. IX.15. Magic/Flush.
SOURCE: Monogram Industries, Carson, California 90745.
Inc., 1165 East 230th Street,

574
e n) to I nj P cr
< <D
.—I tfl
U SI
X
00 •H
U J < c/>>
—
(
£ c
\1
itor
mcm
erc
CO
NT
RO
L V
ALV
E
FLO
W
SE
LE
CT
ER
B
LOC
K
VA
LVE
A
IR
WA
ST
E
OIL
2
(EC
TK
Q
FLO
o
u u Qi
yi (0
PQ
o o
u o u
£> n)
CO
w a pd :=> o to

575
while the flush fluid rises to the top due to the differences in density
of the oil and the waste. The flush fluid rises, passing through a
coalescer which removes entrained urine, and then flows over a weir
through a bag filter into the second stage tank.
Flush fluid is recirculated to the commode by a pressure pump
which is activated by a pressure switch. A bladder type accumulator
is provided to prevent surges and to meet peak flow conditions. Cir
culating the flush fluid through a pre-filter, an activated carbon col
umn, and a clay filter, removes fine particles and dissolved contami
nants. Bacteria and odor are controlled by the periodic addition of
chlorine compounds to the flush fluid.
When sufficient waste accumulates in the sump, it is detected by
a waste sensor. This activates the macerator pump which transports
the waste to the waste holding tank. The dump switch actuates when
the waste holding tank is half full and initiates the incinerator
warm-up. Waste transfer start, stop, and incinerator shut down are
controlled automatically.
(Sarmax 500 R Series, Figure IX.17.) (23) This system uses an
oil-base crystal-clear flushing fluid which is purified and reused over
and over again. There is no discharge. The waterlike fluid flushes
the waste to a special tank where it separates from the waste. At
the same time, a fresh charge of clear fluid is returned to the flush
tank passing through the purification unit, emerging crystal-clear
and ready for service again. The special tank stores the waste from
7500 uses, or the equivalent of about one year of use in a normal
household, before needing to be pumped out. The stored wastes are

5 76
^mm^ Fi8< IX.17
SOURcE:
Sarma? 3K 50°Z Se r i e s , J£al^ e " a h o m e >
INCH ?"»?, supper AIR
s o u K c E ; Mi, M i c r o p h o r . Box 4on ...
: ' C a l i f o r n i , 95490.

577
quiescent and odorless, without the addition of chemicals and conse
quently, the pumped-out wastes can be delivered to treatment plants
for final disposal while the fluid remains behind for continued use.
Purification units are checked at the time of pumpout and the filter
canisters exchanged, if necessary.
The system was designed to minimize maintenance and maximize fail
safe operation. Each fixture is independent of all other fixtures with
individual motors, pumps, controls, and purification units. Infrequent
maintenance could be accomplished without tools.
(Microphor, Figure IX.18.) (25) The system requires 60-100
pounds per square inch of compressed air and a small amount of water
(about lh quarts) from gravity flow. The flush button activates a
flow of water into the bowl and opens a valve in the toilet. A charge
of air ejects waste material into the discharge line, and the valve
automatically closes. All Microphor minimum water toilets can be used
with any type of sewage treatment system.
COST-EFFECTIVENESS ANALYSIS METHODOLOGY
Evaluation criteria for treatment system alternatives. Effective
ness is reflected in the process methods in such terms as reliability,
operational simplicity, public acceptability, and adaptability or
adoptability. Within the criteria functional to the dynamics of any
wastewater system, there are five which are commonly used and should
not be ignored. These are: costs, facility requirements, manpower

578
demands, resource requirements, and time demand. Criteria for selection
or evaluation of a potentially successful wastewater treatment system
may include such things as the achievement of economic, sociological,
cultural, or health-oriented benefits.
(Costs.) Costs, particularly those for typical treatment plants,
are available in various forms. Costs beyond the boundaries of cen
tralized facilities are often more difficult to obtain or even estimate
due to the complexity of financing and budgeting and the number of var
ious governmental entities included. Recent rises in cost-of-living
prices have also affected the values of previous estimates and the
financing of matching funds by local governments. Maintenance costs
and extensions of services, due to the higher manpower requirements,
would by nature show a higher rate of increase. If recent U.S. consumer
complaints are an indication, then both construction and maintenance
projects are being greatly affected by these rising costs.
Health and socio-economic costs have always been hard to isolate
and quantify. Reports of contaminated supplies and consequential ill
nesses have depended upon awareness, communication, and reporting sys
tems. Remedial or curative treatment have been the significant factors
in estimating costs on the reported incidences. Costs which have accrued
as direct costs to the individuals and indirect costs to the community
and nation have not been as visible as curative treatment costs. These
individual and community costs are also cumulative and especially diffi-

579
cult to obtain for developing countries. Therefore, only an estimate
of total costs in terms of health benefits may be obtained in developing
countries through use of isolated incidences.
(Facility requirements.) The effluent quality, system size and
performance, and the population to be served are very greatly influenced
by the previous costs. In addition, the level of acceptable treatment,
required dependability, and the number of households which will be
reached initially with a wastewater treatment system, will also be
dependent upon perceived needs.
(Manpower demands.) Lesser skilled jobs show the most immediate
return in terms of manpower/labor dollars while the middle management
positions supply the most stability. Management level positions must
be obtained through experience and made viable by training, for the eco
nomic stability of treatment systems. The differences in manpower struc
tures for developing and developed countries are demonstrated in Figure
IX.19.
Water and wastewater should be tied to any available public service
(such as electricity) in a developing community until such time as a
separate water and wastewater service would be self-sufficient. This is
particularly appropriate since some of the same skills are common among
utility services. Manpower which can be self-sustaining and/or self-
employed must be encouraged. This would include the trades in parti
cular. Training, of course, must be provided for individuals showing
initiative in order to establish a self-sustaining service. Self-sus
taining manpower is more likely to be found in industrial positions

580
ager
a c0 a
CO U 3 CU t H 60 Cu CO £ 7 C 3 cfl to
s L \ . " O
T3 (1)
•H
en
u 0) en en 0)
. J
• o CU a o
i H
2 cu o
en 0J
•H u u g o u
u CU 60 CO
a
CU
U <U en en cu
60
c •H P. o
rH 0) £» 0)
U) CU
•H S-i 4-1
c 3 o
Q c_>
CO cu u 3 4J CJ 3
u
cu
o ex c cd 2
C ^ r-l
M CU 60 cfl fi CO
a
13 OJ
rH .H •H AJ Cfi
!-( cu CO CO CU
r J
CO cu
CU -H •H H J3 -U CO CO •U 3 w -a
c M
60 •H

581
where duties include more than one plant. This is true for two reasons:
(1) operation of an industrial treatment facility, waste disposal acti
vity, or related maintenance duties are not full time; and (2) retention
of manpower, full utilization, and low turnover are industrial require
ments for profit making. Manpower in public service occupations has
typically received less pay, been utilized on a part-time basis, required
more training dollars because of higher turnover, and had less opportu
nity for economic advancement within the public service arena. These
factors have led to the utilization by industry of public service occu
pations as a training ground for future employees, thus encouraging the
cycle of greater public employment turnover and training needs.
(Resource requirements.) The question of local resources and avail
able materials is of major importance. The fact that local resources
are available influences the longevity of any system. The ease of
obtaining materials and supplies for replacement or system expansion
is not just a problem of lesser developed countries but also of devel
oped ones, especially in small communities and rural areas.
(Time demands.) During a health crisis, it is relatively easy to
justify a sanitary water supply or waste treatment program on the basis
of an existing or clear and present danger to the public health from
a hepatitis outbreak. On the other hand, justification, on the basis
of improving general health, residential satisfaction and community
pride, of the provision of water plus wastewater facilities has limited
political appeal, especially because such things are long range.
Most governments will pay much more attention to economically
active environments, such as industrial communities, recreational facili
ties, eating eatablishments, and transportation services. Environments

582
•!'•
which do not show a direct relationship to the economic well-being of
the community, that is, long-term efforts which are not self-sustaining,
will always be second or extras. Therefore, any effort to undertake
long-term efforts must be tied to immediate returns in a step-wise
projection of economic benefits in order to facilitate its acceptance.
In the aggregate, resources can be freed up readily for much
needed environmental programs in wastewater, as they can be for indivi
dual health care problems, but rather in the manner of dealing with a
heavily traveled road. Resources can be found to patch the road but
not to overhaul the transportation system. To proceed beyond curative
or patchwork efforts in establishing adequate wastewater treatments
systems requires organization, planning, and allocation of resources
within the context of a time frame.
(Health implications.) For those wastewater systems which reduce
or eliminate water usage in treatment systems the health implications
can only be viewed as beneficial. The role of water as a vehicle for
the transmission of bacterial and viral diseases is well established
in numerous health publications. Control of water as a vehicle or
intermediary transfer agent is necessary for health benefits in whatever
system is adopted. Several different patterns of water-related disease
transmission are recognized. Table IX.13 demonstrates some of these.
Many studies have shown the health benefits of sanitary facilities
vs. no facilities. Two such studies were conducted in rural populations.
In the first study, a United States Public Health Service program eval
uated the health effects of the installation of basic sanitation facili
ties in American Indian homes (44). Analyses showed that the morbidity
rates of the members of homes equipped with sanitary facilities were

583
CO A! U CO E 01 «
X
5
33 H
< w
Q
<c Pi w
CD CO cO 0) CO
CD u CO
14-1
O
Q Pi
cu CO cO OJ CD
i H
~o
a) C u Q
X 1 u OJ 4J CO 3
4 H O
OJ i - i
Q-e cO * OJ
O • H CO cn cO
• - I c_>
emias;
X o 4-)
X )
c CO
CO
c o
• H 4-1 CJ CD
4 H
C • H
>> CO
e y-4
o
o • H 4-1 CO
e o 4-1
& E > cn
cj • H <4H • H
o OJ p. CO 1 c o f3
c CD 4-) 4-1
o
lea) ;
4 H
I H
CD 4J CO
£ CO
a o
i - i
o 5*
U
X J CD 4-1 O
CD •4-1
C • H
4H O
C o
• H 4-J CO OJ 0 0 C
M
CO OJ CO CO
a CD
> • H 4-1
O
CO
O
o o
#. o o o
» o m
AS CO OJ l-<
4J 3 O
• H
x: i - i CD P
i n iT l ON i—t
c • H
CO CD CO CO
o
o o o
»•
o o r H
cted
CD •4-1
a • H
•4-4
O
CD
c • H >H 3
4 H
O
a o
• H 4-1
CO
CD 0 0 C
• H
• r. CO
• H CO
o c o o N
<
• H CO
e • H C CO
X ) •iH 0
x P .
>. • u
a CO
x 4-1
n CD
-a i—i • H
S
host
CD 4J CO
• H T 3 CD
CD 4-1 C
• H
CO CO
• - I • H CO C CD
CJ • H 4J CO 3 CT CO
CO CD U
• H 3 CT CD Pi
ration
4J CD
c CD
a c
• H A! CO
X ! 4-1
• H
s * 4-J
CJ TO 4-J
c O
o I-I CD 4J CO
s X I C CO
r inges-
• H OJ
X 4-1
* c CD 4J
4 H
O
CO CO OJ
i H
#> M O
„ CD CO
• H r l CO CJ 1H
OJ CJ
>> X I
CO CD CO CO CJ
CD
> • H 4-1 CJ <0
O O O
* o o o
#< o i—4
In OJ
> o • *. c o
• H 4-1
OJ CO cfl CD CO
• H
x>
• CO
• p
& 3 4-1
c CD CJ
1 X 4-J
as r—1
U O
•I-1 CO
IS
!>% 4-1 • H O
•H E CD
X ) C CD
CD X ) • H
3 1
x i r H In
o 2
CO G o
• H 4->
u CD
g o o 1 CO CO
o u o
o 4-1
CD 3
X )
CO AS CO CD >H
x> 4-1 3 O
>. C CO
£
CO
u CD
i-H O
X u
CO • H 4-J • H U CD 4-1 C CD
X I C CO
CO CD X l-i
u CO
• H X )
CO • H CO CO
• H 4-1
c o CJ CO I-i
T 3
CD CO CO OJ CO
• H X )
B o S CO CD C
• H 3
oo ^^
CO 3 O
i H 4-> CJ CD
4H
(3 • r l
•-CO •rH 4J • H 4J cO a. OJ
X !
disease
CO
~ • H • H CD 3
CO • H CO O M
• H CU CO
o 4-1
a CD
i—i
u CD
> CD
U-i
X J • H O
x: P-> 4-1 CO
n CO
a.
arziasis
X H • H X s ^
CO • H CO cfl
• H
E o CO
o 4-1 CO
• H X CJ CO
u CD P» OJ
x) •H o X p.
CD
O •r4 X OJ
> l-l
o •I-> CO S
u o
14-1
issio:
e C O C cO l-i
H
4-1 CJ CD 1-4
• • - 1
o
CO CO
CO >, •^ u
CO O rH
•H rH X -H / - s (D CJ CO E CO -H cfl X CO
O »• •« i—i
CD CD W) 4J 4J -H
c e x CD CD W CO CO ^-^
>^ >, XI XI
i—1 <D cfl i-H
e o O -H
•H X. CO CD
cfl > CJ CJ
O
CD r H X • H CO Cfl O
P-i
OJ i-H CJ
• H X OJ
>
CD 0 0 CO
& OJ CD
[3 • H
X I
£j o
CM
CO • H
CO 3 l-i
•iH
>
CO 3 l-i
• H
> OJ
• H Ai O CO CD X o
c_>
•» l - l cfl 4-> cfl
4-1 1 c o 2
contac
4->
a OJ
u • H X )
> • H r H CO 3 CD 3
• r>
CO • H CO
o 3 o o N
<
CO •H 4J Cfl •H -H rH C CO OJ > , - H >,XI E E O CD o u u
• r l 3 CO rH CD rH O i-H 3 P . CU 4J

584
1 3 CU 3 c a o
CJ I I
ro
XI
CO
r4 cO 6 CU
cfl cu CO
• H
o
cu u
CO
14-1
o
o B5
2 c cu > co u ex
co cu
X C O
03 CU a cu
oo o
T 3
X I
cu 4-> CO
c
I
g
cu C cu
• H oo >>
X !
O X I
I u cu 4-> CO 5:
cO 4J C o CJ
C
en u CU X l 0 0 C T 3
• H C CO
1 3 • H O >
CO c o CO
cu a .
C co cu cu
• H CO OO CO
>, cu X ! CO
• H r H 1 3 CO
O CO co oo u c cu 3
•a x cu 6 U CO
• H i - t CO
§••3 • H X )
x ra 4-> - H • H O
CO
e
. 0 0 >. o X O
CO O c o o o CO ' u o cu m
PL, r H
c • H V-i
-a i d C CO
1 3 O O
4H
1 3 CU • u <o c
• H
E CO
C o
cO 4->
• H C (0 CO
r4 o o a
oo c
• H 1 3
c? U O
CO CO
• H E O CO
o
X CJ
e x co CU CO
4 - 1
c o a cfl u
X 1 3 CO
1 3
"-1 S r H CO
O
O E O C
X O
•s § co o CO M
• H v ^ E O co *-> - H CO CO O CO
H - H O n X CO O O C CO CO CO
CO •H CO O
T 3 ^ • H CO 4-> E CO M
1 3 O
>-. ? X C *-* ft
CX CO ^
• H CO CO O - H u co CJ CO O - H CJ X O O
CU > CU
CO •<H CO cfl
a o s o
cu cu
oo c
Cfl - H CO CD CO CU CO (X - H X X O CO X CJ CJ O r H CO CO - H
B M W 4-1 4-1
)-l
CU
CO 3
X a.
u cu 4J CO
3=
cu 4-1 CO co
14—<
o
,* O <0
r J
CO
H O
C 92 E a o u •H > (3 W
C cfl CU
r H
CJ
X co
• H U-i
1 3 CU N
• H CO CO
u cO
14-1
o
X CO
• H
1 3 CU N
CO CO U CO IX
m O
CU CO
• H u CO o VJ
cu CJ
oo c
CO 4 - 1
CO 4 - 1 3 C 4J CD
cu X a u cu
CO p. o CD
t X CJ
6 3
• H r H nui
• H 0 0
X CO
• H 4-f
CO U CJ
1 3 C CO
CO X cfl U CJ
1 3 CU N
• H 4-> • H CO cO M CO
>> O
(3 C i4-i u-i r j O O O O O O O O •H 4-1 vH 4-1 CJ 4-> CJ - H 4-> 4-1 4-1 - H 4-1 - H - H - H - H 4J - H - H C 0 3 C O 3 4 J 3 4 J C 0 3 3
c u c r ' c u o ' c u c r c o c r c o c u c j ' a ' O O C O O O C O O O C 0 3 C 0 3 0 0 C O C O
c o c o c r o c r c o o H E - H B CO E CO - H S E
c o o
CO
c o •H E
CO CO
• H X o u O c o
CO CO
u X • H O 4-1
CO • H
CO CO
X - H O r H o
r H CO r H CU r H X O 3 >•> Q , >H 0 0 X CU CJ c a. o co CU - H C CO
1 3 1 3 CU <4-l
CO • H CO CO CO - H
• H CO V-i CO CO - H
r H CO • H O 4 - 1 r H
• H CJ
cfl CU
M cu >
CO CO CU • H - H 4 - 1 CO CO >-i CO CO p*, CU
B • H C o oo
CU
CO X co 4J r H O r4 4H
P^ VI >,
l-i X O CO
cu >
u • H
c o Vl X CJ
1 3 C cfl
0) 4-1 3 CJ cfl
.* CO
u CU 4J cfl s
1 3
cu 4-1 3
r H •H o o.
1 3 C cfl
r H cfl r J
3 4-1 Cfl
z
01
> • H 4-1 cfl
r H 3 E 3 c_>
o o cu 3 CO
o
g-<u c o 4 - 1 CO
S -H CU 1 3 X
CJ
cu • H
V-i u cfl
o

585
significantly lower than the morbidity rates of members of homes without
such facilities for the two years during and after construction. There
had been no significant difference between the two types of homes before
the installation of the facilities.
A second study involved an extensive investigation among sixty-two
rural communities (including eleven coal mining camps in eastern Ken
tucky) for the purposes of developing specific environmental control
measures against diarrheal diseases (35). It was found that the lowest
rates of prevalence of Shigella and Ascaris occurred among families
served by complete facilities (Table IX.14). A marked variation was
demonstrated by the accessibility of the facilities.
In a recent study about the separation of grey water from black
water the following figure (Figure IX.20) was developed to demonstrate
the average daily household water use in the United States (36). Results
of the study showed that grey water has potentially a much lower patho
genic and virus contamination than black water. Black waters were also
shown to contain the majority of nitrogen and suspended solids in addi
tion to significant quantities of B0D5 and phosphorous, as well as the
majority of pathogenic organisms.
(Cultural Implications.) Acceptance of change in human habits
regarding sanitation practices has always been a slow and difficult
process. Various methods have been used by decision makers to stimulate
such acceptance when change has been deemed important for human health.
Stimulants have typically been in the form of education, training,
examples and/or sample experiences. These methods have consistently
required a long-term commitment of manpower and/or financial resources.

586
o w H U W r J
w en >< PQ
r H O p i
o w o
o §
o <
o In M rJ <
W H <
PQ
<c r J rJ W o M 5C C O
erf z o M pn
oo CO W W h-i H H
3 C_> <C
PH
O CN to m
•H I 00 ON VJ < f O ON CU rH
o
^ c O
•H n e? O CN
<4H 1/1 • H ON rH rH CO
a
CO
A! m o i
m ON
> • H
B-S 4J • H CO O
P H
CO C M CU o i-i
3 • 4-1
O rH Z 3
U
0)
> • H CO o
fX,
o z
e-«
cu >
•H 4J • H CO
o PH
CO <4-l 0 ) O rJ
3 O
z
>. rJ CO 4J • H
C CO
t o
CO
cu • H 4J • H r H • H U CO
P H
o
00 CO ON
\o
m oo ON
.—i o in
CN
CN
CU CN ON
in
o CO
oo 00
CN
m ON
00
o
in
m
oo
in
oo CO
ON
m
d
oo
m
vO 0 0 i n
r H ON
r~-
i n
r~ ON
00
m o
<r ON ON
0 0 CO ON
vD o o
• H 0
H 0 0
.C C W - H 3 r H
r H i H
tu cu T3 (5 c CO 0)
•a U - H CU CO 4-> C CO - H
3
• r ( r H r H
cu 3 P
cu X I •H 10
c •iH
u CU 4-1 CO
13
CU X I • H CO 4-1
3 O
£ • H U
P H
^ • H U
O-i
X I
c CO
S-i
cu 4-> CO
3
0 0
d. • H r H r H
<u
£ cu
X> •iH CO 4-1
3 O
CO CU CO
• H
e cu n
P H
c o M CU 4-1
n) 2
CO CU CO
• H
E (1) (H
P i
<4-l
CM O
U CU 4-1 cO
•2-
O
cu o c cu p
u 3 o a o CU
X. 4J
O y -v 4-1 CO
m CO ON U r H O ^ " 4-1 o < r co i n
P H
r H O
co c 4-J
c * cu co B J= a ex O CO >H r4
• H OO
> o c S w o
2 CH O CO
K C P H O CO
• H ^D 4J
co : • H •>
cu >^ P i A5 : O
3 - 4-1
• c i - t <u cfl UL
4J f ! CU H
CU 4-1
§ s 6 t d CO co 4H
cu O • H r H CO
.n co o cu
CO VH
< •
• - ) C • H
• n cu en CO
. . cu w co O - H
pi a » , o o CO - H
CU 4J
c w
• a CU
u T J I - l • H £1 O
r H O O
Xi a CO CU SH
a. B o VH
m CO CU VH
3 4-1 i—1 3
o CO
• u a) 0 0 d 3 O
>> T 3
C CO
CO iH CO
cu >, C cu 4-1
c CU
u T 3 r H • H r C
o
B o >H
UH
CO CU
u 3 4-1
r H
3 O
rO
• CO CU oo CO
X I
cu • H C4H •r t O CU
a. CO
c 3
CM
o
c cu M
X ) r H • H J 2 o
6 o M
CM
CO CU u 3 4J
r H
3 U CJ
• 0 0
c • H r H r H CU
3 -a CU
X J • H CO
c • H
r4 <U
3 u
X ! CO
M O
• ~ ^ .
X I
C CO
4-1 CU
r H •iH O 4-1
r C CO
3 r H I M
X3
c cfl
)H
cu 4-1 CO
3 X )
• 0 0
c • H r H r H
CU
3 X I
CU u
• H CO
C •TH
r^ r H
3 O
M
cu 4-1 cO
3 C M
O
CU CJ U
3 O CO
CU r H 0 0
C • H CO CU

587
15 -i
Time of Day
Fig. IX.20. Daily household water use.
SOURCE: Siegrist, Robert. Segregation and Separate Treatment of Black and Grey Household Waters to Facilitate On-site Surface Disposal Madison: University of Wisconsin, November 19 76.

588
The ease with which reorientation to a new treatment may be made
should be of influence in its selection.
(Social Concepts.) One of the greatest problems in assessing
social concepts is the assignment of a numerical and/or quantitative
value to qualitative measures of human perceptions and attitudes. This
type of analysis is performed by taking a population whose choices are
ranked from high to low, best to worst, or as positive and negative
impacts for the purpose of demonstrating the relative differences of
such rankings or ratings among the population. Common applications of
this form of rating are frequently printed in such indices as the Gallup
Poll. From such an analysis values can be assigned which will portray
a multi-dimensional scaling so that the relative values of social change
can be measured for a proposed project- Limitations to the amount of
variance, interactions among the social levels, and problems in the
selection of the most appropriate parameters can reduce the benefits of
this sort of analysis.
Rating of disposal methods according to weighted criteria. In
Table IX.15 comparison is made of wastewater disposal methods for
rest areas using selected criteria. For each criterion, the eight
disposal methods are ranked most advantageous to least advantageous,
from eight to one or ten to three depending on the weight given that
criterion. The total score is summed for each process, and the process
with the largest sum receives first place in the overall ratings.
COST-EFFECTIVENESS GUIDE
This guide has been prepared as a reference or aid for use in
selecting appropriate wastewater treatment systems in developing

SuXtlBH
s S u - p e y
BXiatJXJO UOt3BUIUinS
A ^ x x x q x s s O i j
u o T r j n j x o d x B : j o T
s a x o u a S y A a o 3 B x n ^ 9 H 0 3 A r j x x i q ^ c l a o o v
SpjBZBH
iu isx^epuBA J u o j s o a a o o
SB9^V 3S3H 3SOW UX a s n J O j X ^ x x x q B ^ x n s
s S u x p B o q auiajr jxg
arjBpounuooov
s u o x i B n c j o n x j pBoq
33BpOUIUIODDV
s a u i a J i x g . iaq^Baft
}0 3 D 3 J J 3
a o x a o B a j ux ' s a x r j x i B n f r o x r j a q ^ s a y
aox33Ba<£ ux ' s s a u a A x ^ o a i x g
"[BSOdSXQ JO 3U3UI4B3JX
p a a x n b a t f TBSodsxr j puB 3U3UiaE3Ji a a x 3 u g sapxAoa<i
A i j x o x i d w x s
•v o
JC u 0)
<0 to o o. to
cO co
v o < r r ^ r ^ u - i o c N c v " i
vjor^~3-mooro>-icN
v £ > r - . o o a \ 0 < r m r o
N I / l t O N v O C l - J H
r~oo^j-u-iv£>cvjro-—i
H N - J U 1 C O M i O N
^ N l T l C O v O f O ' H M
< f i n k D o o r v N n r - (
inoc r^ -^ -voc- ) .—I<N
t - i c \ i r o L O 0 0 r ~ v D < 3 -
c o v o - J C T v o m t ^ M
i n - j o O N i o n N r - 1
N 0 0 \ O i A v f M r O H
4-1 CD
• H • H O 4J
T-\
n) o
• H
e tl) J =
u
, — v
>, u T 3
- ^ c CO 4J
0 0
c • H T 3 • - I O
re
6 0) 4-1 to
>> to
.* C cO 4J
a • H 4J
ex a)
CO
• - ^
a; > • H 4-1 CO M O
tank
oo c
• H
-a I - I
o .e
a. -a CO
> CD ^-s
to -a c o
PH
c TO
(D r H CJ
>, o CD
PC!
reatment
4-1
<-< CO
o • H
6 CD
.e u i
!-< CO O
• H to >s
-C PH
t (package
c 0)
e 4-1 CO OJ
u 4J
t-H CO O
• H 0 0 O
. - 1 O
•rH PQ
CO
0 1
to en OJ CJ
o M
ex
^ u CO 4-1 CD
• H H
a o y>
P i

590
countries. It is not intended to supplant the need for engineering
or health consultants in the actual selection of appropriate facilities.
Its particular value should be found in waste problem areas of unserved
population not amenable to sewerage. It is intended to encourage
environmentally sound policy planning in developing countries.
Sewerless treatment systems occupy part of the waste disposal
facilities market in several countries. Extensions of conventional
systems into communities with a population of less than 10,000 has
sometimes required 100 percent financing. These extremely high-cost
projects are functioning with government support while less costly
replacement alternatives continue to be sought. Changes have taken
place in the last five to seven years which have led international
engineers and health officials to seek alternative technology because
the rate of sewerage construction has fallen behind world population
growth.
Over 200,000 sewerless units have been sold in the last ten years
in the United States, thus demonstrating their effectiveness, appro
priateness, and acceptability. (It would be arbitrary to limit the sys
tems in their effectiveness evaluation because of state and federal
regulations or a lack of recognition on the part of users.) Reluctance
among federal officials to accept new technology in on-site units will
fade as their public acceptance increases. That reluctance has obviously
lingered in part because of the difficulty in administering to individual
households federal funds granted on a regional basis. Growing state
responsibilities in the functional application of federal program grants
and surveillance activities should also increase the potential for on-
site facilities funding. Heretofore the sewerless systems were merchan-

591
dised for vacation homes, isolated residential areas* industries, and
public transportation carriers (such as railroads and airplanes), and
these are markets which are usually financed by private lending institu
tions or other agencies than those that traditionally finance conventional
wastewater treatment type activities.
With reference to developing countries the following assumptions
can be made:
1. Sewered and centralized sewage treatment may not be the solu
tion to all needs in every city or community.
2. This is particularly true of the needs in large cities which
are as yet unsewered.
3. An alternative to the sewerage system and central plant con
cept is the on-site treatment plant. This may vary from hydrau
lic and biological systems to those requiring energy.
4. The selected alternative may not be constrained by lack of
energy since various programs have sought to provide electricity
in these areas.
5. Nonstructural solutions should include at least three manage
ment approaches:
a. private enterprise,
b. private enterprise for unit construction and public
for installation and management,
c. public management and process manufacturing.
6. Both on-site as well as aggregate systems may be used.
Manufacturing cost analysis. A representative group of manufacturers
were approached to obtain specific information about their products.

592
Detailed cost figures were subsequently developed for Destroilet and
Toa-Throne units. From the information supplied by the manufacturer
as well as other sources, it appeared that under production levels at
low volume, the manufacture of Destroilet units resembles the vacuum
cleaner manufacturing industry (Table IX.16). The Destroilet plant
manager described their assembly operation as labor intensive. For
the Destroilet, projections of high production levels were estimated
to be similar to those for electric housewares and fans manufacture.
Thus through comparison with the figures for the stated industries
which are given in Table IX.16, the estimated cost figures were
derived for the Destroilet and are given in Table IX.17.
The evaluation of the Toa-Throne's low and high production volume
was much more difficult to formulate based upon the information provided.
It was assumed that high volume production would produce a cost struc
ture similar to that for miscellaneous plastic products (Table IX.16),
and allowance was made for a thirty percent profit level. The Toa-
Throne was provided with the estimated high volume production costs
shown in Table IX.18. Working backwards from the high production
estimate the volume wholesale and low production volume prices provided
by the manufacturer were used as final unit costs allowing for: a
suitable profit margin, an increase for materials costs due to reduced
price quantity breaks, and an increase in fixed costs for the overhead
allowance. This resulted in the low and moderate volume production
figures as shown in Table IX.18. The manufacturing costs for low
and volume wholesale production has a percentage distribution somewhere
between electric housewares and fans manufacture and household laundry

593
x
w
3
>-. 4-1 X I CO
cu cu t t C t o 01 CO O U CU 4-1 - H CO - H C 4J H J C 0) O (0
.° .3 >•> & cu o u—i o
PL, H T-l O Pw f n
CO CO 4J G CU
e a. • H r-;
C/l
^ O
CU 3
r H CO
>
4-1
cO M-i cu o /~N x: ^ *« cu > -a
cO
r H CO
• H • - N
^ s-s CU w
CO
s
O ^ -v X I 8-« CO - —
r J
o o *—t
<* CO
1 — ,
i n
vO r H
4J
c CU
• H 3 cr cu
£ •a c 3 cO
r H
T J r H
o XI cu CD 3 O
X i
CN
n
-* ro
o <r
CN CN
CO C to
4H
T 3 C (0
CO CU u CO
S cu CO 3 o x; o
•rH )H 4J O CU
r H CU
O O .—1
CO
<r
0 0 en
r^ CN
CO
U 0) c CO
cu r H
u B 3 3 o CO
> •o r H
o XI cu CO 3 o X
U~l
f—1
ro
i n
<*
m CN
cts
3 •o o P-
CJ • r l 4J CO cO
r H PX
9 o cu a cO
r H r H CU
o CO
t
00
c •H TJ 3 U X CU
-o c CO
CO cu o c cfl
•a c CO
C 3 O o CO
r-l CU 4-J 4H
CO
• CM
r cr> i—i
CO
cu u 3 4-1
a cO
UH 3 C cO
£ UH
o CO 3 CO C cu O
• • w o
g o c/ l
es,
FOB
3 r H CO
> 0 0
c • H r H r H CU CO
4-1 CU
c II
w 4J
c CD E
• CO CU X CO 4J
CU CO
• H
o X 0)
D , T ) • H XI CO
UH O
<U 3
r H CO
> cfl
c CO
CO 0) 0 0 r <
CO X CJ
4J
fre
igh

594
ce<
TABLE IX.17
ESTIMATED COST - DESTROILET
Cost ($/l!tlit)
Cost Cost
(Including Profit)
Low Production Volume (Price, $599)
Materials Labor Fixed Costs
@ 30% profit
148 108
_ii 145
_m 449
43 31 26 100
33 24
all other _43 (+) 100 (+)
Wholesale Volume (Price, $449)
Materials Labor Fixed Costs
@ 30% profit
137 76 74
277 83
360
49 27 27
100
38 21
all other 41 (+) 100 (+)
High Production Volume (Price, $360)
Materials Labor Fixed Costs
@ 25% p r o f i t
119 59 38
216 54
2 70
55 27 18 100
all other
44 22
34 100

595
TABLE IX. 18
ESTIMATED COSTS—TOA-THRONE
Low Production Volume (Price, $1045)
Materials Labor Fixed Costs
@ 30% profit
Wholesale Volume (Price, $952)
Materials Labor Fixed Costs
@ 30% profit
High Production Volume (Price, $806)
Materials Labor Fixed Costs
@ 35% profit
or @ 30% profit
Cost ($/unit)
406 160 114 680 204 884
337 146 80 563 169 732
307 144 65 516 181 697
516 155 671
Cost (%)
60 24 17 100
60 26 14 100
59 28 13 100
(In
all
all
all
Cost eluding Profit)
(%)
other
other
other
46 18
36 100
46 20
34 100
43 21
35 100

596
equipment manufacture. An estimated price table as opposed to cost
was developed as Table IX.19. Figures IX.21-25 show the reductions
which occur with high volume production, in terms of the total cost,
material cost, labor costs, fixed costs, and total price.
Costs of low and high level production related to developing coun
tries. Utilizing the manufacturing cost data developed for two sewer-
less systems, the Destroilet and the Toa-Throne, the potential savings
in developing country application were sought. A comparison is made in
Table IX.20, between relevant labor costs in developing countries
and those same costs in the United States.
With in-country, LDC manufacture and/or assembly of the Destroilet
and the Toa-Throne, certain savings could be expected from the lower
labor costs. Figures for U.S. low production volume labor costs of
$108 (Destroilet) and $160 (Toa Throne) were used. The ratios of
(LDC Labor Cost)/(U.S. Labor Cost) contained in Table IX.20 were
used to compute in-country LDC labor costs for low-volume production
of the Destroilet and the Toa-Throne. The results are given in Table
IX.21.
Therefore, production in Korea of the Destroilet would result in
a sixteen percent savings in labor alone, when compared to the retail
price of $599. The production of the Toa-Throne in Korea would result
in a thirteen percent savings when compared to the list price of $104 5.
Using the LDC labor costs from Table IX.21, the retail prices for
low-volume production would be reduced from $599 for the Destroilet,
and $1045 for the Toa-Throne, to those values given in Table IX.22.
High production volumes would show a greater reduction in price in

597
TABLE IX. 19
ESTIMATED PRICE TABLE OF SEWERLESS MANUFACTURE WITH VOLUME PROJECTIONS ($U.S.)b
List Price
Wholesale Price
Estimated Unit Price—High Production (1000-5000
Uni ts /Order)
I n c i n e r a t i n g
D e s t r o i ] e t
Xpurgator
CjOT^osjtrng
Clivus
Community Production
Toa-Throne
Ecolet
Mull-Toa
Bio Loo
Biological
Mod A
Mod 75
Bio--Flo #512
599
2,000a
1,685
1,045
736a
795a
795a
980
1400-17003
402
449
605
952
360
200
806
aIt is felt that large-scale production should provide a figure of from thirty to forty percent less for these systems. This level had not yet been attempted.
Depending on the marketing strategy selected, profits could vary widely, thereby altering these figures.

598
1000
900
800
700
600 c
w 500 o ro ^ 400
CO 4-)
H 300
200
100-
0
Toa-Throne
D e s t r o i l e t
100 200 300 400 500 600 700 800 900
Uni t Volume
IX.21. Reduction in total costs with volume production.
1000
100 200 300 400 500 600 700 800 900 1000
Unit Volume
Fig. IX.22. Reduction in material costs with volume production.

599
1000
900
800-
£ 700
•H 600 c :=> ^ 500 o u u 4 0 ° o ^ 300
200
100
0
Toa-Throne
Destroilet • •
Fig
1000-
900
800
2 700
•g 600
S 500 o o
100 200 300 400 500 600 700 800 900 1000
Unit Volume
TX.23. Reduction in labor costs with volume production.
400-
300-
200-
10
0
Fig.
Destroilet
J£ Toa-Throne
100 200 300 400 500 600 700 800 900 1000
Unit Volume
IX.24. Reduction in fixed costs with volume production.

600
Toa-Throne
Destroilet
100 200 :00 400 500 600 700 800 900 1000
Unit Volume
Fig. IX.25. Reduction in total >price with volume production.

601
TABLE IX. 20
COMPARISON OF SELECTED LABOR COSTS IN DEVELOPING COUNTRIES AND IN THE UNITED STATES
• • • • • • — . . — — • — . . . . . . .
Malawi
Puerto Ricoa
Bolivia3
United States
Korea3
Syria3
Electrical
(U.S.$/Month/ Individual)
73.9
487.0
64.5
793.8
78.3
94.3
Machinery
LDC Cost U.S. Cost
.099
.614
.081
1.00
.098
.119
(u
Plastic
S.$/Month/ Individual)
443.6
753.9
95.9
74.6
Products
LDC Cost U.S. Cost
.588
1.00
.127
.099
SOURCE: Reference Yearbook of Labour Statistics (Geneva: International Labour Office, 1976). (Figures are for 1975.)
"Census of Manufacturers (1972). These are sources for the cost figures. The ratios were
derived by dividing the country cost by the U.S. costs given in this table.

6Q2
TABLE IX.21
SAMPLE LDC LABOR COSTS FOR LOW-VOLUME PRODUCTION OF THE DESTROILET AND
TOA-THRONE (U.S. DOLLARS)
Destroilet (Using Electric Machines Ratio)
Toa-Throne (Using Plastic
Production Ratio)
Malawi
Puerto Rico
Bolivia
Korea
Syria
10.69
66.31
8.75
10.58
12.85
not available
94.08
not available
20.32
15.84
TABLE IX.22
SAMPLE LDC RETAIL PRICES FOR LOW-VOLUME PRODUCTION OF THE
DESTROILET AND TOA-THRONE—ADJUSTED FOR LOWER LDC LABOR COSTS
(U.S. DOLLARS)
Destroilet Toa-Throne
Malawi
Puerto Rico
Bolivia
Korea
Syria
501.69
557.31
499.75
501.58
503.85
not available
979.08
not available
905.32
900.84

603
developing countries due to the rise in labor costs per unit when the
volume of production is increased.
Alternative costs and effectiveness. Presently in the United States
conventional and sewerless systems would be considered concurrently for
application in the case of smaller towns, more difficult (costly) pro
jects, or in lower density population areas such as urban/suburban fringe
areas. According to the experiences of manufacturers, health officials,
and federal funding agencies such as the U.S. Environmental Protection
Agency (EPA) and Farmers Home Administration (FHA), such communities
would be appropriate for consideration of the alternatives of conven
tional as well as sewerless systems.
In 1976 in a survey of communities with less than 50,000 people, 258
wastewater facility plans in forty-nine states were analyzed by EPA (43).
Results for the cost per household, shown in Table IX.23, showed that
only about five percent of the new facilities cost less than $100 per
year. This compared to about fifty percent for the 258 facilities. The
survey showed that for communities with a population of less than 10,000,
the costs were much higher than for the larger communities surveyed.
Figures for the user charges per month gathered in the survey are shown
in Table IX.24. Over 1.5 percent of the U.S. family's median annual
income of $13,000, or approximately $195/year/household could be required
for payback. This would be equivalent to $16.25/month in user charges.
Following this survey, EPA guidelines were promulgated and published
calling for the cost-effectiveness analysis of conventional versus
sewerless treatment systems. Cost estimates for on-site and water-
saving alternatives are given in Tables IX.25 and 26. Costs for
the water-saving alternatives under mass production could be reduced.

604
TABLE IX.23
COST PER HOUSEHOLD PER YEAR FOR WASTEWATER SERVICES IN COMMUNITIES WITH POPULATION
OF LESS THAN FIFTY THOUSAND
Cost/Household/ 258 Facilities 83 New Facilities Year ($U.S.)
100-200 40 75
200-300 10 20
more than 300 >0 >0
less than 100 50
SOURCE: USEPA, 0 & M Cost Considerations for Small Municipal Wastewater Treatment Facilities (Washington, D.C., 1977).
TABLE IX.24
USER CHARGES PER MONTH FOR WASTEWATER SERVICES IN COMMUNITIES WITH A POPULATION
OF LESS THAN FIFTY THOUSAND
User Charge/Month „ .,_,,. ,£.. „ v Community Size
less than 12 all other communities
12 - 20 10,000 or smaller
20 - 30 some communities
SOURCE: USEPA, 0 & M Cost Considerations for Small Municipal Wastewater Treatment Facilities (Washington, D.C., 1977).

605
a) 4-J o
H
U CO 0 1
P •00-
in o\ <f c o o w
CO i n ON H ffl 00 • * co c i H H N
i n o
i—4 CM - 3 -
vO •—1 vD N m N co co co
CN ON <3-
-tf r . co
s CO
c o • H 4-1 CO r l 0) a. o
P
o o o m m m C O CO CO
o o o m CO
o T-H
o m •—i
CM CM CNI CM <N CN i-H r H f—1
r^ O CM
r^ <* i—i
CO u tJ n •H CO • a o P u ^
m oo o r co o Ov M VO
r»» I-H <r rH < T VO co vo cy>
o o o o CM m r - co o\ H N N
O O m CO
o o o
i n
CO
r— .—i <j-< t N O i ( O V O O i CM CM CM
m CO CO
m so CM
o C/J
•O U U X> U U O -H O O -rl O O CO O O CO O U h b O ta PH
•o t< n O -rl O 1 O CO O 1 O Pn PH
•o n P 1 O -rl O 1 1 1 O CO O 1 1
U h PM
CD > 4-> (0 3 u 0) 4J
C! O
•H 4-1 O-(-1 O CO
o CO
CO C/5
c «: O CO
•rl ^ 4-1 C B 0) Q) > 4J C to o ^ o to I i c CO
H cj
•rl 4J O-01
CO
c O
3
•H rl
S3 Tl CD N
• H l-l 3 CO CO CD
u PM
1 1
u • r l 4-1
a. a> CO
C/J 1 1
• - N
0 0 C
• H CO
o p. *•—'
CO X I (D
PQ
00 C
• H 4J CO
s U CD
I I
3 CO
H
a •H 4-1
tx CD
CO
R CD
4-1 to > W
T ) 3 3 O
i I
^ 3 cO H
O • H 4-1
a. a)
CO
y * \
H W \^r
3 O
• H 4-J CO U •rl a CO 3 CO r l 4-1 1
o o. CO
> w I 1
^ 3 CO H
a • r l 4J
a. CD
CO
3 o
• H 4-1 CJ CD
U-l 3
•rl CO
• r l P
1 U
<u 4J t H • H Pn
•a 3 cfl
CO 1 1
^ 3 cO
H
O • H 4J
o. <D
CO
C o • H 4J
3 . O • H r ( 4-1 CO
• r l P
X I CD N
•H ^-v r l 00 3 3 CO - H CO CO CD O U P
PL. w 1 1
4-1 • H
3 P
o • r l - O
o r l
?! <
o • H 4J O <D
<4-l 3
• H CO
• r l P 1 r l 0) 4-1 r - l •H Pu
X I 3 CO
CO 1 1
4J • H 3 P
a • r l r O
o r l CD
<
3 o
• r l 4-1 O CD
<*-! 3 • H CO
• r l P
1 1
4J • H 3 P
o • H J 3
o r l
CD
<

6Q6
CM
M
w rJ
3
r-l CO o>
T3 to c o /-» cfl O U
co 01 0) c
o •H
a > H
4-1 CO CO C W u ai • cu -u » a. C </>-
O TH ^
tO • u
•H a tfl
u
• JJ en W) • o S
O </> v * /
o o a\ CNI
o o CM CO
O
o m co
O o ON !-H
o o CM CM
O O m CM
o u-i v O r-1
o LO Ov t—i
o U"> CM CM
O o -<r t—(
O o r^ i—i
O o o CM
o C/2
• v t f f l H -<r vo os CN CM CM
r- o co 00 vQ 00 CM CM CM
00 i-i < t O oo i n co co en
O < f r~-
CM CM CM
O O O CM CM CN
O O O CJ\ O <3\
o o o oo oo oo
vO vO ^O o \ cj\ a \
•O h J< O TH O O CO O
O h P4
O TH O O tO O
•a u u O -H O o <o o
U f n PM
• a M ^ O -H O O CO O o tu a,
01
> r ) 4-> CO
c V-i 01 4-1 r-l
<
eptic Tank (ST
(SAS)
c/j S 0)
+ 4J W
w J^ 0) CO
r H •H C O O
4-1
>H a cfl V* o o •H W 60 J3 o <
t H O rH
•H -H « O
to OJ 6 0 ) - i
CO h J
T-SAS
c/>
+ 4-) 01
r H •H O H r H cfl o •H 60 O
t H O
• H PQ
r H r H CO
6 W
C/3
w 1
H oo
+ 4J 0)
r H • H O H H o 4-1 (0 V4 0)
c •r-l o c H
c/> < tn I
H C/>
+ 4J 0)
r H •H O H
r C co 3
r H Fn 1 S o
• J
\

607
Essential manpower and resources required for waste treatment
processes are given in Table IX.27. The conventional processes are
listed as PS I through PS 12. The individual treatment methods are
listed as PS13 and PS14. In Table IX.28, the two categories of
PS 13 and PS 14 are expanded, modified and shown in more detail as PSS1
through PSS7.
In Table IX.29, information is presented on waste treatment pro'-'
cesses concerning available loan sources, community types appropriate
for use of each process, and the life expectancy of each process, assuming
proper operation and maintenance. There could be variations within this
dependent upon a variety of factors such as siting, engineering design,
and community acceptance.
There are many measurements of effectiveness which can be used to
determine the most appropriate waste disposal treatment system for any
size community. Usually in the past this determination has been made
on the basis of economic measurements alone, or on the basis of the most
units for the least cost. Unfortunately, an economic system will not
necessarily provide the most acceptable solution. The economic approach
does not take into consideration other factors which affect the eventual
success of a project. Such other factors (often socio-cultural in value)
are not always compatible to the assignment of consistent monetary val
ues that are repeatable or comparable.
Another measurement of effectiveness has been the regulatory require
ments of effluent standards and the cost of meeting those standards with
various systems. Criticism of this measurement may be based both on the
determination of the standards and the process of provision for alter
native systems. That is, standards often need to be arbitrary

608
TABLE IX. 27
PROCESS CONSTRAINTS—WASTE TREATMENT PROCESSES WITH ESSENTIAL MANPOWER
AND RESOURCES REQUIRED
^v. Process ^ ^ Requirements
Treatment ^s. Methods ^ N .
Primary—Conventional
Primary—Stabilization Pond
Sludge—Conventional
Sludge—Advanced
Sludge—Combined (Imhoff)
03
$ Secondary—Standard Filter
g Secondary—High Rate Filter >->
d, Secondary—Activated Sludge 4-1 03
4£ Secondary—Extended Aeration
Disinfection
Aqua Culture
Dilution
Individual
Individual (Advanced)
Process
Number
PS1
PS2
PS3
PS4
PS5
PS6
PS7
PS8
PS9
PS10
PS11
PS12
PS13
PS14
Manpower
Unskilled
Skilled
Professional
x
X
X X
X X
X
X X
X X X
X X X
X X
X
X
X
X
X
Resources Required
Operation
Equipment
Process Materials
Maintenance
Supplies
Chemical Supplies
Water Source
(Groundwater
Availability)
X X X
X X X X
X X
X X
X X X X
X X X
X X
X X
X
X X X
SOURCE: George W. Reid and Richard Discenza, Prediction Methodology for Suitable Water and Wastewater Processes (Norman: University of Oklahoma Office of Research Administration, 1975), p. 21.

609
TABLE IX .28
PROCESS CONSTRAINTS—WASTE TREATMENT PROCESSES WITH ESSENTIAL MANPOWER AND RESOURCES REQUIRED (DETAILS
OF INDIVIDUAL PROCESSES, PS13 AND PS14)
\ . Process \ . Requirements
Treatment ^ \ Methods \ .
Sept ic Tank (PS13) to
gj I n c i n e r a t i n g T o i l e t (PS14)
w Bio log ica l T o i l e t (PS14)
w Composting T o i l e t (PS 14) in 0)
^ Vacuum System (PS 14)
2 $ Oil Base T o i l e t (PS14)
Aerobic Tank (PS 14)
Process
Number
PSS1
PSS2
PSS3
PSS4
PSS5
PSS6
PSS7
Manpower
Unskilled
Skilled
Professional
x * *
x * *
X X *
X * *
X * X
X * *
X * *
Resources Required
Operation
Equipment
Process Materials
Maintenance
Supplies
Chemical Supplies
Water Source
(Groundwater
Availability)
X X X
X X X
X X X X
X X
X X X
X X X X
X X X
*Consultation basis or part-time.

Ulu
TABLE IX.29
WASTE TREATMENT PROCESSES WITH AVAILABLE LENDING SOURCES, APPROPRIATE COMMUNITY TYPES, AND LIFE EXPECTANCY OF PROCESS
Treatment Methods
cn cn u 41 0) CJ X>
o e U 3
Primary—Conventional PS1
Primary—Stabilization Pond PS2
Sludge—Conventional PS3
Sludge—Advanced PS4
Sludge—Combination (Imhoff) PS5
Secondary—Standard Filter PS6
Secondary—High Rate Filter PS7
Secondary—Activated Sludge PS8
Secondary—Extended Aeration PS9
Disinfection PS10
Aqua Culture PS11
Dilution PS 12
Individual PS13
Individual (Advanced)- PS 14
Septic Tank (PS 13) PSS1
Incinerating Toilet (PS 14) PSS2
Biological Toilet (PS14) PSS3
Composting Toilet (PS14) PSS4
Vacuum/Preasure System (PS 14) PSS5
Oil Base Toilet (PS14) PSS6
Aerobic Tank (PS14) PSS7
Loan Source
State Funds
In-Country
Funds
International
Loans
X
X
X
X
X
X
X
X
X
X X
X
X
X X
X X
X X
X X
X X
X X
X
X
X X
Community Type
Village
Unsewered
Community
Sewered
Community
Suburban
Urban
X X X
X X X
X X
X X
X
X
X
X
X
X X
X X
X X
x x x
X X X X
X X X X
X X X X
X X X
X X X X X
X X
X X
X X X
Life Expectancy of Method
Temporary
Short-Term
Long-Term
X
X
X
X
X
X
X
X
X
X X
X
X
X X
X
X X
X X
X X
X X
X
X
X X

611
because of their diverse application. The development of alternative
systems has often been inhibited by limitation in field data, engineering
design, and equipment availability.
Various other schemes have been proposed to measure effectiveness.
The acceptance of these has varied depending upon their particular
application and dissemination. Table IX.30 presents an example of
a rating system for alternative toilet systems which uses low to high
values. Human waste disposal in developing countries has often been
handled with the same reasoning that was used in Great Britain and
northern Europe until the 1800's, namely, that dilution is the answer
to pollution. Removal of wastewater from the human environment has
been the effectiveness criterion.
The higher costs of conventional sewerage and treatment has limited
the applicability of present-day, developed-country conventional waste
water systems. In certain cases, the new sewerless technology with
reduced water-use and sewerage requirements does show advantages in
greater cost-effectiveness over the conventional systems, creating new
cost-effectiveness over the conventional systems, creating new cost-
effective alternatives. This comparison could then be favorable to
U.S. purchase as described. The residual question relates to LDC com
parisons.
A cost comparison for sewerless systems is given in Table IX.31.
Table IX.32 contains conventional conveyance and treatment cost fig
ures. Table IX.33 contains a summary of the estimated total annual costs
per capita for conventional systems as well as an incinerating toilet,
biological toilet, and composting toilet. All three sewerless units
appear to be competitive with conventional systems in each population

612
to CO a M H co M
3
o CO
X M
W r-l
<1 H
s H CO > H CO
H W i - l I-H O H
01
•o o OJ B
rH tfl 3 C
•O 0) 01 4J x: e CJ -H cog
Final Product
Disposal
Approximate Resource
Requirements
Similarity
to
Conventional System
i-H > •r l O
EH C
Pumping
Fuel
Power
Water
Use
Appearance
i -J 10
o
periodic residue
removal
periodic residue
removal
soil amendment
soil amendment
none
none
none
none
low
moderate
none
none
3 3 o o r-l t-i
3 3 o o
i-H rH
Composting
Separated
Non-Separated
weekly ash removal and
periodic unit cleaning
refuse
none
low—
high
low—
high
none
moderate
moderate
Incinerating
annual servicing and
accumulated solids
pumping
treatment plant
or land disposal
yes
none
low
none
moderate—
high
moderate—
high
Recycle
semi-annual tank
pumping
treatment plant
or land disposal
yes
none
low
two quarts
per use
high
high
Low Flush/
Holding Tank
o X OJ to 3 o •x. >> OJ
to 00 0J I-l od o oi I tn
to |VH
- CO 4-1 3 CO ' - '
iH 1-1 00 OJ i-H
-rl 10 CO 01
o 4-i a IH CO OJ v-l xi a o ai aj
o to
• • >4H U M CJ 3
B o
•iH
0J 3 V
a to
-a B to
to 3
•a
T3
c OJ
X
00 a
OJ
•o
x i to i-i o>
-o • H CO c o
I-l to >
CO
E
o X to
u OJ 4J o to I-l to
x: u
OJ x H

613
x
w • J m <
4J ill o o r-1 to 3 C c
<c
TS d HI
c o
• r l 4J 1» V OJ e-o
u (0 OJ
r -
\ to 4J • r l
o. ro
U
*— •
tO
3
</> • w *
4-1 Ul o o 0) u c to c a) i-i
c
Mai
c 3
CO c o to u <u a.
VO
oj E 3 01 01
<
/—s
OJ > 1
\ • t/3
• s </> ^
10 3 . - I O
rt u a) U - H O •rl CO S C CJ 4 J ^
r-l T-l • a. t/2
<3 3
01 01 O O >->
P.
Vi <u
-O
um
•z.
c 01 e i j
ra 0) 1-1
T3 O
XL 4-1 01
£
T3 01 o oo —< r-l
T3 00
1 OJ -rj > u •H 0 to o c o CD t o 4 J
c u> • H OJ
T - l <U r< 4J tO •H > to ^
e c •H O CO 1-4 U 4J U CO OJ r-l 4-1 3 , -v
D . ,»> O O 4-> 4J O. 1-1
tfl oo -o e C C OJ
• H U f l
0) o 1A
T3 O
to o —-*
o o CO
ptic
SAS
0J -0 tfl C
CO
with
:ank
u o Ov
ptic
SAS
OJ T3 «) C
to
Vith
ank
I -H
o ac/i l-l 4J 0) < o oi to
OJ 3 4J C l i i—I -r-l CO 3 i4-i 3 M I . *
• ^ S 4 i C
n o « «
81 —I U
s
to u-1 r^ C \
X> o o m
let—
le)
•H CO O tfl u ai 4-1 —4 Ul O
OJ x:
S 3
X l o oo CT>
1 1
< -o o
32
,— -H •H CO 4J
OJ l-l
X o o oo
one--
ume)
1- -H -C O H >
1 to j r . O 03
nsive
ccord-
01 to 4J C 10
•H OJ •H
OJ r-l 4-1 CO H >
errain
lation
4 - 1 3 . — . CX r*>
O O 4-1 4-1 D. -H
01
oo-o c •SS-S
U-i
O O O CM
r - i
t o t o P i
CM C/l tO P i
en co tO Oi
-» en tO P i
i n tO to P i
C/J C/l P i
l - l • H O 01
X 4 J 1-1
^
.* c CO 4J
CJ •H 4-1 a. OJ
CO
t o
< t o
* e tu 4-1
01
>> 01
c o
T - l 4-1
o. l i
o 01
X I CO
4-1 OJ
• - I •H O
4-1
oo c
T-4 4-1 CO Vi OJ c
• H t j
c M
OJ
o
00
o o
T-l 03
00
c
01 o a E o
B <u 4J 01
>. 0 1
3 0 1 0 1 OJ I-.
a ~£3
3 3 O CO >
4J a)
a) 0) cO
CO CM CM
CO o "4-1 CI CN
to to Oi
•a OJ N
•r-l U 3 01 tfl OJ u o. ^~s
^ c CO 4-1
CJ T- l X I o l-l OJ
<
^ 00 c
T-< 01 o -a u o c o
•H 4-1 3
X I •H 11 4J 01
Ti •T3
01 a o
•rl •a c o o
o 01
•o o o 00
01 6 3 Ul CO CO
0 1 0 1 l - l 3 oo
T 4
X I o r l 01 CO
T3 c CO
.* c CO 4-1
CJ •H 4J a. OJ 01
01 X H
• i n CM
r- t
• X I - I
til r-l X i CO
S i
B o r l
U,
• O
~* r l
• X M
OJ r-l X I CO
H
B o u
U4
• vO CM
—1
• X h-l
OJ r-l X i CO
H
e o l i
u.
• 01 4-1 •H
§ rH CO CJ
•H 0 0 o
r-l O
T- l
X l
r l O
U-4
01 14-4
T-l r-l
u CO OJ
>. 4J c CD 3 4-1
01 OJ
um
01 01
<
• Ul 4J T (
c 3
r-l
« CJ •H C CO
SL\ CJ OJ a u o
14-4
OJ «4- l
•r l rH
r l CO OJ
>. c 01 4J
01 01 B 3 0] OJ
<
o c IS
T-l
<v V4 3 00
T-l 14-4
tfl f l rC 4J
<4-l 0
c •rl 60 i-l U 0
41 X H
• • w H O •z. t o
T
PS
8 M a I d
CO X I CJ T J OJ 141

614
CM CO
X
CO o u H Z w
•>-i Q to Z <U <! >< W cfl
• O 4-1
•S p . CO a
: > • - - -
z </> o ^ u
o H z w
• o
o H
X> 0) y c to >
•QJ
> 'C o
-a to c <u to o
c
to c )-l -H a> cs
. P. 2 o
tO • C
o .3 • M ,4-1 tn c o o
•a o
•H 4-1 .0) tO N
. H -H 3 oo p.
,o PL,
I
o
oo CO
1
CN
1
'tS. to
CM
i
CO
CM CO
00
CN CO
1
0 0
1—1
tN
1
CM CO
CM
1
.CM CO
o CM
CM t30
as CM i n
o O O
O O CO
O O O O in o
o o o b
o o
• o o o o m O
o o o o o
o o o o
u QJ 4J
•tO D£ QJ
rH X I CO 4-1 •H 3
CO
W O '"H
>. 6£ O
r-t O
X I o
£ 4-1
.0) X
'e :o •H 4J
a •H •a co SH
0 4
'* 'CO N
c a> o tn
•H
o •x) M tO £. o
•H D3
"*T3
a tO
x i •H 'QJ P i
• . •
s '.<u
o£ •U
. o 0)
.o tO
• • w u Pi
•» o CO
1 o P 4-1
•H E tO 4-1 4J tO C QJ tu ^ E H C o t-i >-i QJ
•H 4J > -to
ti l J 4J
• in co ca • s £> . 'rH
. - H tn to
. C B
.' O CO
m 4-i u r> to o CT\ (-1 4H r- i '(1) . - a u • •> o a; CO 4-1 E tn .tn
o e c X I CO to to t-i u
^ i O O M > ,
Pw 00 U-l o O M i - l
a) o >• ^ a 4J tO , g • H 3 y tn QJ M U-l H 0) O
> c •H Q) O c o ! 3 -rH M
. 4-1 nj ^ C
•• O -H .'C ' 6
CO •> a)
E x : co '14 4J •'-O W tO Z to w .0) u • o b tn
' .<u to tn d) u o J-I
Pvi
. 0) '4-1
to s 0) 4-1 tn
and Wa
**-* is 4-i
u X ! O ^ P . •H QJ tU t-i
^
. 'O
c 0) . 00
•<! a
tectio
• .
o\ r—i
">> r-4. 3
<-> •s
ver
.c
.QJ Q
»v
• tn
System;
» QJ
.E •i-t 4-J QJ
U-l ^H
.tn In S CO O QJ r H > , H 1 O > , I H
4-1
c tn QJ CO
4J >, 4-1
CO -rH tn
x: c '4-1 QJ • H X I
s c tn o tn -H QJ 4J
o to O . - 1
u 3 a. a,
o ai a. oo
X I C 3 O
i - f tn x i
.0) ,x i .tn QJ :C0
•4-1 X I ' t o .
> en
•4-1 O 4.J to . tn
o ^n a to
• C Q)
tio
aric
• c >^ ,<U 0)
> > c c o o o u
tO X i
0) ^4
a tO
• ^ ^
tn C o tn VJ QJ ex
**s r-4
• 1 Q)
o 00
II
,VJ tO QJ
^ * - to 4-1
.•H P.
: to o
** </>
^4 tO 0)
• > !
to •4J •I-t p . CO
.'tj '— </>
QJ
u o CO
-- :tn 3 : 0
. CO
u 0) a
bo • i n
-'>> •4-1 •H tn c QJ
X3
S o
rH
CM CO
> 4-1 •H tn C 0)
X I
QJ 4-1 Cu J-4
•QJ X ) O E
*t—t
CM
'>> 4-1 ' H tn
,c _0) • ^
XJ oo
•H x:

615
TABLE IX.33
ESTIMATED TOTAL ANNUAL COST PER CAPITA FOR REPRESENTATIVE SEWERLESS AND CONVENTIONAL
WASTE TREATMENT/DISPOSAL METHODS ($U.S.)
Treatment Method
Incinerating toilet
Biological toilet
Composting toilet
Conventional system
Process Number
PSS2
PSS3
PSS4
500 - 2,500
38
23
8
70 - 44
Populat
2,500 - 15,000
38
23
8
63 - 37
ion Size
15,000 - 50,000
38
23
8
35 - 25
50,000 - 100,000
38
23
8
33 - 25

616
category, with a decrease in corapetetiveness occurring with an increase
in the size of the population group to be served.
CONCLUSIONS
With only a small percentage of the population in LDC's being
serviced by sewage treatment facilities and the majority of the people
being without piped water, the necessity for consideration of alterna
tives to centralized treatment practices is evident. A review of inter
national documents on wastewater practices together with a comparison
of waterborne, cartage, and on-site systems supports the consideration
of on-site alternatives. See Table IX.34.
Conclusions reached during the course of this study are as follows:
1. Developing and/or less-developed countries have one thing in
common, namely, the lack of, or minimal level of organized
sewage collection and disposal of waste, in particular, domes
tic sewage.
2. To transfer developed country (DC) technology in the form of
conventional sewerage and sewage disposal systems is fiscally
prohibitive, and alternatives must be explored.
3. On-site systems for individual households or small groupings
of homes and community centers are technically available and
are to be found in several variations. They are characterized
as hydraulic, biological, and chem/thermal, and are in use in
sufficient numbers to warrant further applications and demon
strations.
4. Some on-site units have been manufactured on a production level,

617
TABLE IX.34
ASSESSMENT OF IMPORTANT ATTRIBUTES RELATED TO SYSTEMS OF WASTE DISPOSAL/TREATMENT
Capital Cost
Operating Cost
Offshore Cost Component3
Water Consumption
Optimal Density
Adaptability to Incremental Implementation
Adaptability to Self-Help
Waterborne
High
Low
High
High
High Density (High Rise)
Nil
Nil
.1
System Type
Cartage
High/Low
High
High/Low
Low/Nil
High Density (Low Rise)
High
Low
On-Site
Low
Low
Nil
Low/Nil
High and Low Density (Low Rise)
High
High
SOURCE: Witold Rybczynski; Chongrak, Polprasert; and Michael McGarry, Stop the Faecal Peril: A Technology Review (Ottawa: IDRC, July 19 77).
aOffshore cost component refers to materials not available locally.

but substantial site data is not available, particularly for
chem/thermal units in IDC's.
Evidence in the United States indicates the acceptance of the
biological units for small rural communities or dispersed
housing areas.
Lacking hard data, in-country (IDC) application of chem/thermal
methods appears feasible from synthesized costs for units, as
compared to conventional systems (Table IX.33).
Consumer acceptance is not always a matter of cost (as demon
strated by DC acceptance) but can rest on health factors and
socio-cultural factors.
What is needed is an IDC demonstration-level study to validate
the findings of this study, that is, a comparative study of
conventional solutions versus on-site ones, including considera
tions of site feasibility and an in-place practice demonstration.
Such a study would consider cost, capital as well as operation
and maintenance. It would look at various units or combinations
of them for several LDC sites including large, medium, and
small urban areas. The primary goal would be nuisance and
health control. Various waste considerations such as laundry
wastewater may require separate handling.
For chem/thermal units electricity can be assumed to be
available since it will probably be provided to a community
at a reasonable price as a social good.
Several management schemes should be explored: private enter
prise; private manufacture, public installation and control;
and public manufacturing and installation.

619
12. All schemes should have a built-in, public incentive or incen
tive concept.
13. Performance, for example, effluent quality should be in
accordance with local standards.
14. Consumer acceptance should also be considered during the in-
place studies.
Because of their low domestic water requirements, absence of
waste disposal standards, and only small amounts of industrial and
trade wastes, it is clear that LDC's have a unique opportunity to
explore an alternative solution to waste disposal and avoid certain
of the pitfalls that have been encountered during the process of devel
opment in the DC's. In DC's present use of water reaches more than
2000 gallons per capita per day for all purposes, 160 gallons per capita
per day being municipal water, and a large percent of it ends up as
waste, whereas with on-site systems the savings achieved in reducing water
consumption can be significant. Regional systems or large metropolitan
systems, even at greater than ninety percent efficient treatment levels,
still discharge unacceptable waste loads. Thus, the correct focus is a
reversal of the trend and a move towards segregated and manageable units
utilizing sequential use and re-use and in-place control. On-site treatment
should be encouraged as LDC's develop economically as this will be bene
ficial to their future development.

620

CHAPTER y V
Expedient Technologies
George W. Reid
Several types of technology related to methods of water and waste
treatment are presented in this chapter as well as information con
cerning related areas. These represent technologies which either were
not included in the more formal classifications of previous chapters
or which it seemed beneficial to introduce here from the particular
point of view of application in village or individual dwelling situa
tions, where maintenance is often accomplished on an individual or
purely voluntary basis. Though this material can be useful for wider
application, a nucleated population of about 300 persons would probably
be the upper limit in size for volunteer operation to be feasible.
Rather than attempting to include detailed designs or descriptions of
technologies, the objective was to facilitate access to a part of
the enormous amount of material that is already available. Each
621

re fe rence abounds xn i d e a s , most of them s p e c i f i c a l l y app l i cab l e to
LDC's, and most a re a v a i l a b l e t h r o u g h - i n t e r n a t i o n a l sources .
The r u r a l g loba l popu la t ion no t ye t having reasonable access to
a safe water supply number 1000 m i l l i o n , and the number i s twice
t h a t in the case of sewage d i s p o s a l or t r ea tmen t . S u b s t a n t i a l m a t e r i a l
i s a v a i l a b l e on the gene ra l dimensions of the problem- One p a r t i c u l a r
a rea which i s impor tant in a g loba l sense i s d e l i n e a t e d and involves
h e a l t h a s p e c t s , t h a t i s , i n f e c t i o n s through w a t e r , ques t ions of per^
sonal hyg iene , and w a t e r - r e l a t e d v e c t o r s . Economic, s o c i a l , and
environmental concerns a re a l s o i l l u m i n a t e d . In t h i s group of works
the main emphasis i s no t on technology al though they do contain num
erous examples of technology a p p r o p r i a t e to LDC's.
1. Feachem, Richard ; McGarry, Michael ; Mara, Duncan, e d s . Water, Wastes , and Heal th in Hot Cl imates . London: John Wiley & Sons, 1977.
2. I n t e rmed ia t e Technology Group. Water for the Thousand M i l l i o n s . Oxford, Great B r i t a i n : Pergamon P r e s s , 1977.
3. M i l l e r , Arthur P. Water and Man's Hea l th . Washington, D.C. : U.S. Department of S t a t e , Agency for I n t e r n a t i o n a l Development (AID), Office of Hea l th , 1967.
4. Report of the United Nat ions Water Conference, Mar de l P l a t a , Argen t ina , 14-25 March 1977. P a r t 1: Decis ions of the Confe r ence . Sa les no. E .77 .11 .A.12 .
5. Saunders , Robert T . , and Warford, Jeremy J . V i l l age Water Supply: Economics and Pol icy in the Developing World. Johns Hopkins Un ive r s i t y P r e s s , 1976.
Address: World Bank 1818 H S t r e e t , N.W. Washington, D.C. 20433 U.S.A.
6. Stein, Jane. Water: Life or Death. Report for the United Nations Water Conference, Mar del Plata, Argentina, March 1977. International Institute for Environment and Development. (Library of Congress Catalog Card #77-73172.)

623
7. White, Anne U., and Seviour, Chris. Rural Water Supply and Sanitation in Less-Developed Countries: Selected Annotated Bibliography. Ottawa, Canada: International Development Research Centre, 1974.
Address: International Development Research Centre 60 Queen Street Ottawa, Canada K1G3H9
8. White, Gilbert F.; Bradley, David J.; White, Anne U. Drawers of Water: Domestic Water Use in East Africa. Illinois: University of Chicago Press, 1972.
9. World Health Statistics Report." Water and Sanitation 29, no. 10 (19 76) Geneva: WHO.
In a small village or nucleated settlement, water supply (not
treatment) is frequently all that is needed, though often there is
no separation made in the literature between consideration of water
supply and that of waste disposal and treatment. In the case of water
supply, wells, surface supplies, simple impoundments and storage,
pipelines, pumps, small storage/filter combinations, water quality
criteria, and water analysis are all of importance. As part of the
OU/USAID contract, three works were made available. One consisted
of the results of a mail survey of unpublished literature on LDC
technologies. Another, in two parts, comprised a discussion of rural
water supply and related technologies in developing countries. The
third was a compendium of technologies relating to individual units.
10. Contributions to a Mail Survey on Practical Solutions in Drinking Water Supply and Waste Disposal for Developing Countries. Okla. (AID/CM/ta-C-73-13 Res.) (PN-AAD-287.) The Hague: WHO International Reference Center for Community Water Supply, 19 77.
11. Gorkum, Willem van, and Kempenaar, Kees. Rural Water Supply in Developing Countries. Okla. (AID/CM/ta-c-73-13 Res.) (PN-AAD-2 85.) 1975.
12. Huisman, L. Treatment Methods for Water Supplies in Rural Areas of Developing Countries. Okla. (AID/CM/ta-C-73-13 Res.) (PN-AAD-2 84.) 19 75. (Part 2 is PN-AAD-285.)

624
i3. Reid, George W. A Catalog of Water Supply and Waste Disposal Methods for Individual Units. Okla. (AID/CM/TA/C-73-13 Res.) (PN-AAD-283.) 19 75.
Wells were discussed previously in Chapter VII, and there are
numerous publications available on wells, well construction, and the
sanitary protection of wells.
14. Baldwin, Helene L., and McGuinness, C. L. A Primer on Groundwater. U.S. Government Printing Office, 1963.
15. Gibson, Ulric P., and Singer, Rexford D. Small Wells Manual. Washington, D.C.: U.S. Department of State, Agency for International Development, January 1969. (156 pages.)
16. • _. Water Well Manual. Premier Press, 19 71.
17. Manual of Individual Water Supply Systems. (EPA 430/9-74-007.) U.S. Environmental Protection Agency, Office of Water Programs, Water Supply Division, 19 75.
18. Manual of Individual Water Supply Systems. Pub. no. 24. Washington, D.C.: U.S. Department of Health, Education, and Welfare, Public Health Service, 1963.
Larger well supplies warrant more detailed studies of groundwater
and well hydraulics. Ample material in this area is available in
the literature, but there is seldom sufficient LDC data.
19. Campbell and Lehr. Well'Water Technology. McGraw-Hill, 1973.
20. Groundwater and Wells. 1st ed. Saint Paul, Minn.: Edward E. Johnson, 1966.
21. Groundwater Studies. Paris: UNESCO Press, 1975.
Surface water supplies generally are developed for much larger
groups of users, but there are unique, LDC/rural applications to be
found.
22. Community Water Supply and Sewage Disposal Programs in Latin America and Caribbean Countries. Document no. ES.5. Geneva: World Health Organization, 1969.

625
23. Darrow, Ken, and Pam, Rick. Appropriate Technology Sourcebook. 2nd ed. Stanford, Calif.: Volunteers in Asia, November 19 76. (304 pages.)
Address: Appropriate Technology Project Volunteers in Asia Box 4543 Stanford, California 94305 U.S.A.
24. Falkenmark, Malin, and Lindh, Gunnar. Water for a Starving World. Westview Press, 1976.
25. Guidelines and Criteria for Community Water Supplies in the Developing Countries. Washington, D.C.: U.S. Department of State, Agency for International Development, Office of Health, 1969.
26. Mann, H. T., and Williamson, D. Water Treatment and Sanitation; A Handbook of Simple Methods for Rural Areas in Developing Countries. London: Intermediate Technology Development Group, 1973.
27. Village Water Supply. A World Bank paper. Washington, D.C., March 19 76. (94 pages.)
Address: World Bank 1818 H S t r e e t , N.W. Washington, D.C. 20433 U.S.A.
28. Volunteers in Technical Ass i s t ance (VITA). V i l l a g e Technology Handbook. Mt. R a i n i e r , Maryland, 1977. (387 pages . )
Address: Volunteers in Technica l Ass i s t ance 3706 Rhode I s l a n d Avenue Mt. R a i n i e r , Maryland 20822 U.S.A.
29. Wright, F o r r e s t B. Rural Water Supply and S a n i t a t i o n . 2nd ed. New York: John Wiley & Sons*, London: Chapman & H a l l , 1956. (Library of Congress Catalog Card #56-7166.)
F requen t ly , the pumps and p ipes for water development in LDC's
are e n t i r e l y imported. Some a t t e n t i o n has been given to p ipe mate
r i a l s , p a r t i c u l a r l y p l a s t i c p i p e . A g r e a t dea l of a t t e n t i o n has been
focused on the i n - coun t ry development of hand pumps.
The Moyno ( t r a d e name) p r o g r e s s i n g cav i ty pump i s composed of
a s i n g l e - t h r e a d e d s c r e w - l i k e r o t o r t h a t tu rns wi th a minimum of

clearance in a double-threaded helix. It can handle abrasive sand,
and has no valves, gaskets, or leathers.
With the hydraulic ram pump, a pipe carries water by gravity from
the source to the valve box of the pump where a waste valve opens
downward and a delivery valve opens upward. Water pours through the
waste valve till it is shut suddenly. Then water hammer pressure
forces some water through the delivery valve and up the delivery pipe.
When the wave of negative pressure returns from the reservoir, the
delivery valve is pulled shut and the waste valve open, and the cycle
will be repeated. The ratio of wasted water to pumped water will
vary from 6:1 to 2:1, and a considerable amount of noise is produced.
30. Billings, C. H. ; Conner, Samuel H., Kircher, James R., eds. Public Works Manual and Catalog File, 19 77. Ridgewood, N.J.: Public Works Journal Corporation.
Address: Public Works Journal Corporation 200 S. Broad Street Ridgewood, N.J. 07451 U.S.A.
31. Buyer ' s Guide. Jou rna l of the American Water Works Assoc ia t ion 68 , no. 11 (November 19 76). (Pa r t 2 , 19 77.)
32. Hand Pumps. Technica l Paper , no . 10. The Hague: WHO I n t e r n a t i o n a l Reference Centre for Community Water Supply/United Nat ions Environmental Programme, Ju ly 19 77.
Address: I n t e r n a t i o n a l Reference Center for Community Water Supply P. 0. Box 140 Leidschendam The Nether lands
33. L i n s l e y , Ray K. , and F r a n z i n i , Joseph B. Water-Resources Engineer ing . New York: McGraw-Hill Book Co. , 1964.
34. McJunkin, F rede r i ck E. , and P ineo , Charles S. Role of P l a s t i c Pipe in Community Water Suppl ies in Developing Coun t r i e s . Washington, D.C. : U.S. Department of S t a t e , AID, Office of Hea l th , 1971.
35. Robbins & Myers. Moyno Hand Pumps for Rural Water Systems. B u l l e t i n 277. 1895 Je f fe r son S t r e e t , S p r i n g f i e l d , Ohio 45501, 1977.

627
36. Utilization/Evaluation of the AID/Battelle Hand Operated Water Pump. Washington, D.C.: U.S. Dept. of State, Agency for International Development, Office of Health, 19 78.
37. Watt, S. B. A Manual on the Hydraulic Ram for Pumping Water. London: Intermediate Technology Publications, 1975.
Operational water quality criteria can and should vary from site
to site, both in the attributes controlled and in the levels allowed.
Several documents address this question. Economists frequently sub
scribe to the acceptance of higher concentration levels in the case
of LDC's.
38. Drinking Water Standards. Pub. no. 956. Washington, D.C.: U.S. Department of Health, Education, and Welfare, Public Health Service, 1962.
39. European Standards for Drinking Water. Geneva: World Health Organization, 1970.
40. Evaluation of Water Laboratories. Pub. no. 999-EE-l. Washington, D.C.: U.S. Department of Health, Education, and Welfare, Public Health Service, 1966.
41. International Standards for Drinking Water. Geneva: World Health Organization, 1971.
42. Manual for Evaluating Public Drinking Water Supplies. Cincinnati, Ohio: U.S. Department of Health, Education, and Welfare, Public Health Service, Environmental Control Administration, Bureau of Water Hygiene, 1969.
In the analysis of water and wastewater, several approaches are
possible, among them, in-country supportable technology and operator
training programs.
43. Okun, D.A. Manpower Development and Training in Water Sector: Responsibilities of the World Bank. Public Utilities Notes. International Bank for Reconstruction and Development, International Development Association, Energy Water and Telecommunications Department, June 1977.
44. Reid, George W., and Yang, Weigun W. Water Test Kit I: User's Manual and Water Test Kit II: User's Manual. (English, Chinese, Spanish, French, Persian and Arabic.) University of Oklahoma, 1975.

628
For larger community systems, the American Water Works Association,
the American Public Health Association, associations of manufacturers,
and specific catalogues of manufacturers provide valuable source
material. The OU/USAID project has also developed a catalogue of
of processes and equipment.
45. Reid, George W.; Unsell, C. W.; and White, Thomas E. Catalog of Water and Wastewater Treatment Processes, Equipment and Manufacturers. Norman: University of Oklahoma Bureau of Water and Environmental Resources Research, 1978. (Currently under contract.)
Some very useful and unique techniques are to be found through
the use of two quite diverse sources. One describes methods appro
priate for use in emergency situations. The other source consists
of LDC research centers and contacts. In this literature, in parti
cular, considerations of water are rarely separated from those of
sewage.
46. Assar, M. Guide to Sanitation in Natural Disasters. Geneva: WHO, 1971.
47. Environmental Health Practice in Recreational Areas. Pub. No. 1195. Washington, D.C.: U.S. Department of Health, Education, and Welfare, Public Health Service.
48. Manual for Village Health Workers. Washington, D.C.: U.S. Agency for International Development, Office of Health, 1970. (74 pages.)
49. Philippines National Pollution Control Commission. A Water Sterilization Study in the Philippines. (AID/CM/ta-C-73-13 Res.) (PN-AAD-282.) 1976.
50. Rajagopalan, S., and Shiftman, M. A. Guide to Simple Sanitary Measures for the Control of Enteric Diseases. Geneva: World Health Organization, 19 74.
51. Thailand Ministry of Public Health. Study of an Existing Water Treatment Plant of Simple Design and Operating System for Supplying Drinking Water to Rural Communities in the Lower Mekong Basin Countries. Okla. (AID/CM/ta-C-73-13 Res.) (PN-AAD-280.) 1976.

629
52. Werner, David. Where There is No Doctor: A Village Health Care Handbook. 1st English ed., rev. from Spanish. Hesperian Foundation, 1977.
For on-site waste disposal technology three categories are
usually considered: Hydraulic, biological, and thermal/chemical.
These devices were discussed above in Chapter IX. Off-site waste
disposal and treatment was discussed previously in Chapter VIII.
53. Bendixen, T. W., et al. Development of Practical Design Criteria for Seepage Pits as a Method for Disposal of Septic Tank Effluent. Cincinnati, Ohio: Robert A. Taft Sanitary Engineering Center, 1963.
54. Canter, L. W., and Malina, J. F. Sewage Treatment in Developing Countries. Okla. (AID/CM/ta-C-73-13 Res.) (PN-AAD-286.) 1976.
55. Central Public Health Engineering Research Institute. Proceedings of a Symposium on Low Cost Waste Treatment. Nagpur, India, 1972.
56. . Water Supply and Waste Disposal for Greater Bombay. Part 2: Waste Disposal. Nagpur, India, 1971.
57. Considerations for Designing and Improving Individual Sewage Disposal Systems. U.S. Department of Agriculture, Oklahoma State Department of Health, and the Oklahoma State University Cooperative Extension Service.
58. Gloyna, Earnest F. Waste Stabilization Ponds. Monograph Series no. 60. Geneva: World Health Organization, 1971.
59. Gotaas, H. B. Composting: Sanitary Disposal and Reclamation of Organic Wastes. WHO Monograph Series, no. 131. Geneva: 1956.
60. Howard, J. C. Oxfam Sanitation Unit in Bangladesh. England: University of Loughborough, 1976.
61. Mohanrao, G. Wastewater Treatment and Disposal. Nagpur, India: Central Public Health Engineering Research Institute, 1973.
62. Okun, D. A., and Ponghis. Community Wastewater Collection and Disposal. Geneva: World Health Organization, 1975.
63. Pescod, M. B. Investigation of Rational Effluent and Stream Standards for Tropical Countries. Bangkok, Thailand: Asian Institute of Technology, 1974.

630
64. Pick-ford, J. Indexed Bibliography of Publications on Water and Waste Engineering for Developing Countries. United Kingdom: Loughborough University, 1977.
65. Rybczynski, Witold; Polprasert, Chongrak; and McGairry, Michael. Stop the Faecal Peril; A Technology Review. IDRC Preliminary Report. Ottawa: International Development Research Centre, July 1977.
66. Sewage Treatment in Small Towns and Rural Areas. Office of Regional Programs at Dartmouth College, 1971.
67. Siddiqi, R. H. Characteristics of Domestic and Municipal Sewage in India. Nagpur, India: Central Public Health Engineering Research institute.
68. U.S., Department of Health, Education, and Welfare. Manual of Septic Tank Practice. Washington, D.C., U.SiA.
69. Wagner, E. G., and Lanoix, Ji N. Excreta Disposal For Rural Areas and Small Communities. Geneva: World Health Organization, 1958.
70. World Health Organization. Reuse of Effluents: Methods of Wastewater Treatment and Health Safeguards. Technical Report SerieSj no. 517. Geneva, 1973.
In summary, an attempt has been made to indicate numerous materials
that adequately handle areas on the periphery of the central theme
of this text. Those authors, institutions, and works indicated will
in turn lead to other worthwhile sources.

APPENDIXES
631

632
APPENDIX (CHAPTER III).
The following tables were developed for use in the predictive
model to select suitable water and wastewater processes, presented in
Chapter III.
Tables of per capita cost and operation and maintenance manpower
requirements:
III.1.5-14 water processes PW1 - PW10 III.1.15-24 wastewater processes PS1 - PS10.

633
w PQ <
Pn
3
H Z W
W erf H O 2
oo w u o Pi
Manpower Required
(Number of workers)
Social-Technological Levels
Professional
Skilled
Unskilled
>
III
M M
M
Type of
Cost
Population
Scale
6.00
5.50
6.45
8.65
Construction
r-4.
i H
2.00
1.02
0.90
0.50
Operation and
Maintenance
(500
- 2,499)
1.50
1.48
1.61
2.16
Construction
CN)
CNl
1.25
0.64
0.56
0.31
Operation and
Maintenance
(2,500
- 14,999)
0.75
0.66
0.80
1.08
Construction
CO
<r
0.50
0.31
0.25
0.12
Operation and
Maintenance
(15,000
- 49,999)
0.50
0.51
0.53
0.72
Construction
o-
oo
0.25
0.16
0.13
0.06
Operation and
Maintenance
(50,000
- 100,000)

634
w rJ
3 p..
H Q
^
ft! W
O
W
O
CN
a.
H
OS
w Pi 0<
CO CO
G
Manpower Required
(Number of workers)
Social-Technological Levels
Professional
Skilled
Unskilled
>
III
M M
M
Type of
Cost
Population
Scale
14.59
12.51
10.76
8.87
Construction
rW
rH
r-l
4.00
2.19
2.95
3.27
Operation and
Maintenance
(50.0
- 2,499)
12.00
10.56
8.85
7.29
Construction
CN
•-H
f—l
2.00
1.10
1.35
1.63
Operation and
Maintenance
(2,500
- 14,999)
•
8.00
7.59
6.96
4.86
Construction
ro
»—i
CN
o
1.00
0.62
0.73
0.82
Operation and
Maintenance
(15,000
- 49,999)
:
2.00
2.03
1.49
1.22
Construction
•sT
H
<r
m
0.50
0.31
0.37
0.41
Operation and
Maintenance
(50,000
- 100,000)

635
5 p-.
c_>
CO
PH
Pi w E H
CO
O • J to
CZ> to w o Pi PH
Manpower Required
(Number of workers)
Social-Technological Levels
Professional
Skilled
Unskilled
>
III
M 1-4
M
Type of
Cost
Population
Scale
20.00
16.00
16.50
12.65
Construction
i - i
r—1
5.00
2.33
2.00
1.33
Operation and
Maintenance
(500
- 2,499)
14.28
11.85
11.72
9.03
Construction
CN
CN
2.25
1.05
0.90
0.60
Operation and
Maintenance
(2,500
- 14,999)
10.01
7.68
7.18
6.33
Construction
CO
m
1.25
0.73
0.58
0.33
Operation and
Maintenance
(15,000
- 49,999)
6.25
5.21
6.98
3.95
Construction
<r
00
0.75
0.44
0.35
0.20
Operation and
Maintenance
(50,000
- 100,000)

636
00
• J pa <: H
OH
Z O
Z
Z o c_> I I
Pi td H • J
C/3
CO to W U O OS
Manpower Required
(Number of workers)
Social-Technological Levels
Professional
Skilled
Unskilled
>
III
tH M
M
Type of
Cost
Population
Scale
11.20
14.56
9.24
9.51
Gonstruction
tH
tH
rH
4.00
2.17
2.20
1.80
Operation and
Maintenance
(500
- 2,499)
8.80
11.51
7.26
7.47
.
... . .
Construction
CM
rH
rH
rH
2.00
1.08
1.10
0.90
Operation and
Maintenance
(2,500
- 14,999)
5.00
5.25
5.58
4.24
Construction
CO
f—1
CM
00
1.75
1.12
1.05
0.79
Operation and
Maintenance
(15,000
- 49,999)
2.65
2.83
2.96
2.25
Construction
•j-
-
CO
O rH
1.50
0.89
0.90
0.67
Operation and
Maintenance
(50,000
- 100,000)

637
PH
PM
co
a
Manpower Required
(Number of workers)
'-' -
Social-Technological Levels
Professional
Skilled
Unskilled
>
III
rH M
rH
Type of
Cost
Population
Scale
209.50
272.35
280.21
323.61
Construction
rH
rH
rH
rH
17.77
14.19
15.77
19.77
Operation and
Maintenance
(500
- 2,499)
47.10
61.61
63.00
72.75
Construction
CN
f-4
rH
t — 1
12.02
9.60
10.67
13.37
Operation and
Maintenance
(2,500
- 14,999)
21.00
22.04
26.59
32.44
Construction
en
CM
CM
vD
8.90
7.11
7.86
9.90
Operation and
Maintenance
(15,000
- 49,999)
10.10
10.77
12.84
15.60
Construction
< •
CN
m
o rH
4.45
3.55
3.93
4.95
Operation and
Maintenance
(50,000
- 100,000)

638
w
§3
oi Cd PH
Z
o
w PH O
"S PH
O Z M
z w H O CO CO w u o Cxi PH
Manpower Required
(Number of workers)
Social-Technological
Levels
Professional
Skilled
Unskilled
>
III
I-I HI
M
Type of
Cost
Population
Scale
165.70
215.41
221.62
2.55.95
Construction
i-f
i—i
r—<
r - H
13.42
10.72
11.91
14.93
Operation and
Maintenance
(500
- 2,499)
111.80
146.23
149.53
172.69
Construction
CN
f—l
»—*
r - H
7.94
6.37
7.05
8.83
Operation and
Maintenance
(2,500
- 14,999)
82.80
86.91
104.82
127.90
Construction
ro
CN
CM
^D
5.88
4.70
5.19
6.54
Operation and
Maintenance
(15,000
- 49,999)
41.40
44.16
52.41
63.95
Construction
<•
CN
m
o r-H
2.94
2.35
2.60
3.27
Operation and
Maintenance
(50,000
- 100,000)

639
3
PL.
Z O M H CJ W
CO w c_> o pi
Manpower Required
(Number of workers)
Social-Technological Levels
Professional
Skilled
Unskilled
5
III
H-l l - l
M
lype of
Cost
Population
Scale
4.00
5.43
5.30
5.26
Construction
i - i
i—i
5.00
5.01
6.37
9.29
Operation and
Maintenance
(500
- 2,499)
0.80
1.09
1.06
3.05
Construction
CNJ
f—\
i—t
2.30
2.30
2.93
4.27
Operation and
Maintenance
(2,500
- 14,999)
1.50
1.49
2.04
1.97
Construction
en
r H
i—1
CM
1.75
1.69
2.16
3.25
Operation and
Maintenance
(15,000
- 49,999)
1.20
1.21
1.63
1.58
Construction
-»
i—i
«—4
Vf
1.50
1.45
1.85
2.79
Operation and
Maintenance
(50,000
- 100,000)

640
53
00 s PH
c a
o Q O
W H
to w c_> o OS P H
uired
rkers)
1 cr o a) a
OS <4H
u o 3 u O OJ C E CO 3
a z Social-Technological Levels
Professional
Skilled
Unskilled
HI
M. •W,
M
Type of
Cost
Population
Scale
129.90
168.87
173.74
200.65
Construction
r - l
t - H
f - H
r—f
21.04
16.80
12.61
23.41
Operation and
Maintenance
(500
- 2,499)
87.70
114.71
117. 30
135.47
Construction
CM
f - H
r-H
f -H
14.21
11.35
12.61
15.81
Operation and
Maintenance
(2,500
- 14,999)
32.30
33.90
40.89
49.89
5 —i 4-1
'J 3 u _ i V)
5
< - i
Csl
C M
N O
10.52
8.40
9.29
11.70
Operation and
Maintenance
(15,000
- 49,999)
61.10
65.17
77.35
94.38
Construction
«sT
Csl
m
o f-H
5.26
4.20
4.64
5.85
Operation and
Maintenance
(50,000
- 100,000)

641
« H
r H
rJ
CO
z M H < w Q
CO CO w u o erf PH
.^ •o en 01 VJ
(H 01 • H J d 3 >H
CT O 01 S
erf U-l
VJ O 01
3 U O OJ
a, .n C E CO 3
I S SS
w 1—1 O)
> 0)
r H CO u
• H 6 0 O
r H o
echn
H 1
« H
CO • r l
U
o t /3
ion
al
to 0)
o> >*-i
o u
P H
T J 0)
r H r H •rH
^ c/>
• o o>
i-H r H • r l
05
c 3
> M
r-H r- l r-H
r-H M
HH
M—l
O 4J
oi w Q . O > , U
H
C Q
• H 0) 4J r H CO CO
r - l U 3 C/J D . O
P H
o v D
• i-H r H CN
0 0 O
• m r-~ CN
f—i
o en 0 0 CM
m co •
CN CO
C o
• H 4J U 3 U
u en c o
CJ
t H
i - H
i—1
O
<r • r~-
r H
o> • m
r m v D
en CN
* co
T 3
n co o>
u c a O cfl
•H C •U 01 (0 4J
>- c a -n D . CO
o s
* ~ N
er. CT.
-* o -O CN U 1 ^ 1
O CN
• t—1 i n r H
r-~ r^ • r«.
a\ *—*
en CN
CN O CN
u-l
m • m
CO CN
d o
• H 4-J C! 3
>-. 4-> en C o u
CN
r H
r H
r H
O CT\
• vjD
r H
m • m
CN • H
VJO
CO v D
•
r—
•a c co a;
o c c O CO
• H C i_> 0) CO 4-1 r4 C 01 - H a . CO
O S
• ~ N
o\ C >
O C7> O -
m <r •> i-H
CN > - ' 1
o o-• oo
o <-H
oo r~ • en
r H
1~-i
CO CN
r~ en r~*
<T
<r •
• - H
n o
• H 4-1 O 3 U 4-1
cn c o u
CO
CN
CN
^O
o vO
• ST
r--vD
• en
vO O
<r
CN •—i
• m
-o C cfl 0)
o c c O CO
• r l C U 0) CO 4J P C 0) - H
a. co o z:
< r ^
a\ O C3A
o as o •
•> o\ i n >3-
— < v- ' 1
o o • cn
m
a> -*
• r m
<r CN
0 0
\o
\D CN
•
cn 0 0
c o
• H 4-1
o 3 U 4-1 M C
o u
•<»•
CN
i n
o •—i
o cn • <N
<r 0 0
• •-t
cn o CN
vO
m • CN
•a c CO CD
O
c c O cfl
•H C 4-1 0) CO 4J r- C 01 t H
<§-5
^*s
o o
o o o » o o
« o O - i
m > • " i

642
w • J
S3
H Q
% U Z
o Qi M W H
w CM O
CM
as M
u
Z M H
C/5 W Q
C/5 w u o pi PH
Manpower Required
(Number of workers)
Social-Technological Levels
Professional
Skilled
Unskilled
> M
III
M M
M
Type of
Cost
Population
Scale
153.40
199.42
205.17
236.95
Construction
H
i -H
f - H
i—1
14.08
11.25
12.50
15.66
Operation and
Maintenance
(500
- 2,499)
103.60
135.51
138.56
160.03
Construction
<N
f - H
f - H
f - H
10.55
8.43
9.36
11.74
Operation and
Maintenance
(2,500
- 14,999)
76.70
80.51
97.10
118.48
Construction
CO
CM
CM
\0
7.03
5.61
6.21
7.82
Operation and
Maintenance
(15,000
- 49,999)
38.40
40.96
48.61
59.32
Construction
vr
CM
i n
o t—i
3.57
2.85
3.15
3.97
Operation and
Maintenance
(50,000
- 100,000)

643
2 & j
CJ
CO PH
l-J < Z O l-H H Z W
O
CO t/1 w o o P-l
Manpower Required
(Number of workers)
Social-Technological Levels
Professional
Skilled
Unskilled
> M
III
M M
M
Type of
Cost
Population
Scale
88.00
88.00
80.30
70.34
Construction
^H
r-i
2.56
1.17
0.99
1.65
Operation and
Maintenance
(500
- 2,499)
24.00
24.41
21.90
19.18
Construction
CN
. — »
1.94
0.89
0.75
1.25
Operation and
Maintenance
(2,500
- 14,999)
•
19.50
16.91
16.05
15.59
Construction
CO
i—i
CN
1.71
0.77
0.78
1.10
Operation and
Maintenance
(15,000
- 49,999)
15.50
13.17
14.35
12.39
Construction
-3-
CN
<r
1.51
0.67
0.69
0.98
Operation and
Maintenance
(50,000
- 100,000)

644
o
w -4
<
10 H Z W
a;
ex.
CM CO P-,
Manpower Required
(Number of workers)
Social-Technological Levels
Professional
Skilled
Unskilled
> M
III
• H M
IH
Type of
Cost
Population
Scale
67.00
55.27
43.55
28.46
Construction
r-i
.—1
1.70
0.60
0.45
0.16
Operation arid
Maintenance
(500
- 2,499)
6.00
5.05
3.90
2.55
Construction
CM
CM
1.34
0.47
0.35
0.13
Operation and
Maintenance
(2,500
- 14,999)
4.00
3.17
2.73
1.70
Construction
en
•<r
1.26
0.44
0.44
0.12
Operation and
Maintenance
(15,000
- 49,999)
2.70
3.59
1.82
1.64
Construction
<r
VO
0.65
0.45
0.35
0.10
Operation and
Maintenance
(50,000
- 100,000)

645
w r-J
53
CO CO P H
O M H Z w
o c_>
w o o
3 to
to CO W c_> O oi CH
Manpower Required
(Number of workers)
Social-Technological Levels
Professional
Skilled
Unskilled
>
III
M M
M
Type of
Cost
Population
Scale
103.72
99.40
136.13
162.49
Construction
rH
t—t
r H
12.45
6.83
6.69
8.04
Operation and
Maintenance
(500
- 2,499)
61.15
61.54
80.26
95.80
Construction
CM
r H
t—A
7.34
4.03
3.95
4.74
Operation and
Maintenance
(2,500
- 14,999)
45.28
49.76
62.50
70.94
Construction
CO
r H
CM
5.43
2.84
3.21
3.51
Operation and
Maintenance
(15,000
- 49,999)
35.98
32.38
49.66
56.37
Construction
-3-
i^t
CM
<r
4.31
2.15
2.55 .
2.78
Operation and
Maintenance
(50,000
- 100,000)

646
oo
w
<
C_>
C/i
Q W O
w Q
C/3 C/3 W c_> o P-c
Manpower Required
(Number of workers)
Social-Technological
Levels
Professional
Skilled
Unskilled
>
III
M M
M
Type of
Cost
Population
Scale
128.77
123.40
.
... ..
169.01
201.74
Construction
r-i
i—<
-H
25.45
18.48
18.30
16.43
Operation and
Maintenance
(500
- 2,49?)
66.30
66.72
87.02
103.87
Construction
CN
t—i
»—t
7.96
4.37
4.28
5.14
Operation and
Maintenance
(2,500
- 14,999)
47.50
38.30
65.57
74.42
Construction
o
i—1
CN
5.70
2.98
3.37
3.68
Operation and
Maintenance
(15,000
- 49,999)
36.94
33.25
50.99
57.87
Construction
- j
-
CM
<r
4.43
•
2.21
2.62
2.86
Operation and
Maintenance
(50,000
- 100,000)

647
w rJ
3
i n
f>H
o
Q W
o o
w o Q
• J CO
CO 00
w o PH
Manpower Required
(Number of workers)
Social-Technological Levels
Professional
Skilled
Unskilled
> M
III
t-H M
M
Type of
Cost
Population
Scale
136.76
151.58
138.47
197.16
Construction
t - i
r H
i-H
16.41
9.00
8.82
10.60
Operation and
Maintenance
(500
- 2,499)
77.85
88.15
78.82
112.23
Construction
CN
^
i—t
9.34
5.12
5.02
6.03
Operation and
Maintenance
(2,500
- 14,999)
48.96
41.98
51.72
70.58
Construction
en
r -H
CN
3.87
3.07
3.47
3.79
Operation and
Maintenance
(15,000
- 49,999)
34.56
31.10
36.51
49.82
Construction
<•
r-A
<f
4.14
2.06
2.45
2.67
Operation and
Maintenance
(50,000
- 100,000)

648
o CM
w rJ PQ < Q
S3 O
u 00
OO oo w o o Pi
Manpower Required,
(Number of workers),
Social-Technological
Levels
Professional
Skilled
Unskilled
> H
III
M M
M
Type of
Cost
Population
Scale
137.00
141.57
121.59
112.89
Construction
r-l
—1
3.92
2.06
1,81
1.40
;Operation and
Maintenance
(500
- 2,499)
40.50
43.23
! 35.94
33.37
Construction
CN
^ •H
• — J
• 2.27
1,19
: 1.05
0.81-
Operation and
Maintenance
(2,500
- 14,999)
33.00
31.22
30.83
27.19
Construction
CO
t—i
~H
•<r
1.79
0.91
0.94
0.64
Operation and
Maintenance
(15,000
- 49,999)
26.50
23.85
24.76
21.84
Construction
-3-
t—i
CM
vO
1.42
0.70
0.75
•
0.51
Operation and
Maintenance
(50,000
- 100,000)

649
w • J
u
c/>
w H rJ rH PH
W H
O
5C
O O w CO
en w u
Manpower Required
(Number of workers)
Social-Technological Levels
Professional
Skilled
Unskilled
>
III
M M
hH
Type of
Cost
Population
Scale
225.00
238.46
291.31
336.79
Construction
rH
.—i
42.15
40.33
40.31
35.48
Operation and
Maintenance
(500
- 2,499)
179.79
151.08
177.54
205.26
Construction
CN
t—\
CM
10.35
5.34
5.30
4.70
Operation and
Maintenance
(2,500
- 14,999)
129.71
133.13
135.98
148.09
Construction
CO
.—t
r H
< f
3.10
1.52
1.73
1.41
Operation and
Maintenance
(15,000
- 49,999)
43.25
44.60
45.34
49.38
Construction
>T
f~t
i—t
NO
0.98
0.63
0.52
0.42
Operation and
Maintenance
(50,000
- 100,000)

650
CM CM
w rJ CQ
<
00 00 PH
W O Q
h4 00
o w H <: > M H U <;
Q z o u w 00
00 00
w o PH
Manpower Required
(Number of workers)
Social-Technological Levels
Professional.
Skilled
Unskilled
>
III
rH-M
M
Type of
Cost
Population
Scale
134.00
186.48
162.47
197.05
Construction
rH
i—1
i—1
5.20
3.34
3.12
2.86
Operation and
Maintenance
(500
- 2,499)
40.00
54.67
48.74
58.82
Construction
CM
r -H
CM
3.52
2.26
2.11
1.94
Operation and
Maintenance
(2,500
- 14,999)
32.00
31.74
38.94
47.06
Construction
CO
r H
i—1
-a-
2.98
1.81
1.94
1.64
Operation and
Maintenance
(15,000
- 49,999)
26.00
25.33
31.64
38.23
Construction
<•
CM
CM
00
2.52
1.45
1.64
1.39
Operation and
Maintenance
(50,000
- 100,000)

651
en CM
w • J PQ
H
Q
c/> PH
z o
< a w Q 2 H X w
Q 2 O U w CO
to C/l w a o PH
Manpower Required
(Number of workers)
_ _
Social-Technological
Levels
Professional
Skilled
Unskilled
>
III
M M
M
Type of
Cost
Population
Scale
165.00
255.37
158.81
154.00
Construction
«H
rH
rH
73.14
38.86
52.82
33.21
Operation and
Maintenance
(500
- 2,499)
110.12
106.34
105.99
102.78
Construction
CM
i-H
CM
7.45
3.96
5.31
3.38
Operation and
Maintenance
(2,500
- 14,999)
95.00
81.45
93.26
88.67
Construction
m
r-H
i-H
<r
2.78
1.55
2.08
1.26
Operation and
Maintenance
en o en o en o * - en
r—1
25.00
21.25
24.54
23.33
Construction
»»
i-H
CM
v£>
0.52
0.28
0.39
0.24
Operation and
Maintenance
(50,000
- 100,000)

652
CM
5
H Q
U
Pi w P-i
z o
w P-. o
00 p-c
z o h-l H U W Pn 25 M 01
00 CO
o o a!
Manpower
Required
(Num
ber of workers)
Social-Technological
Levels
Professional
Skil
led
Unskilled
> M
III
M I-l
M
•
Type of
Cost
Population
Scale
24.32
54.13
48.72
32.01
Construction
H
-
7.50
4.23
4.20
2.12
Operation and
Maintenance
(500
- 2,499)
17.42
35.60
36.41
42.93
Construction
CN
CM
1.50
2.73
2.71
2.42
Operation and
Maintenance
(2,500
- 14,999)
15.61
27.25
27.86
20.55
Construction
CO
i—(
t—*
-3-
0.75
2.17
2.46
1.21
Operation and
Maintenance
(15,000
- 49,999)
10.71
19.07
20.18
14.10
_ Construction
•<r
»-H
i—1
MD
0.36
1.49
1.79
0.58
Operation and
Maintenance
(50,000
- 100,000)

653
APPENDIX (CHAPTER IV).
The following four-page "Questionnaire for Water and Waste Studies
for Developing Countries" was employed to gather field data which was
used in deriving predictive equations for the water/wastewater demand-
cost model of Chapter IV.
For selected socio-economic and technological conditions of
developing countries, the following tables contain results obtained using
the prediction methodology presented in Chapter IV.
Tables of estimates of demand:
IV.10 mean water demand (gpcd) IV.11 wastewater disposal (gpcd).
Tables of estimates of water treatment costs ($1000 U.S., MGD):
IV.12 slow sand filters IV.13 rapid sand filters IV.14 stabilization lagoons IV.15 aerated lagoons IV.16 activated sludge systems IV.17 trickling filters.

654
QUESTIONNAIRE FOR
WATER AND WASTE STUDIES
FOR DEVELOPING COUNTRIES
BUREAU OF WATER RESOURCES AND ENVIRONMENTAL SCIENCES RESEARCH
UNIVERSITY OF OKLAHOMA
NORMAN, OKLAHOMA 73069
U.S.A.
April 1974
1. Please supply flowing data as shown in the tables for water treat
ment processes. Indicate if the flow is in metric system or
English (MGD), and if the cost is in local currency or in U.S.
equivalent dollars.
2. Have you ever had any problem with operation and maintenance of
your plants? Yes „„_. „ N o
If yes, which one and how did you overcome it?
3. What is the estimated daily water demand in gallons per capita per
day (gpcd) in litres per day .
4. What is the estimated wastewater demand (discharge)* (gpcd)
or litres
5. What is the average annual local temperature* in F or C .
6. What is the average annual precipitation in inches* .
7. Estimated price of treated water per 1000 gallons* •
8. Estimated national average of persons in each household .
9. Estimate percent of household systems (septic tank, privy, etc.)*

655
10. Estimate percent connected to public sewerage system* .
11. Estimate percent cost of imported materials for sewage treat
ment to the total cost* .
12. Estimate percent cost of imported materials for water treat
ment to the total cost* .
13. Average annual income in local currency or U.S.
dollars .
14. Estimate percent of national literacy .
15. Estimate percent of public stand post* .
16. Estimate percent number of homes connected to water supply*
Please do not hesitate to send any information on water and waste
treatment in your country which you feel might be of help in our
studies.
Would you like to have a final report of the study? yes no.
Name and Title of individual completing questionnaire
Address
Date
If local data are not available, give national data.

656
WATER TREATMENT PROCESSES
(AID - UNIVERSITY OF OKLAHOMA LDG PROJECT)
Name of the Country | __
Name of City or Town
Population
Year Construction Completed
Type of Treatment Plant (e.g. slow sand filter or rapid sand filter)
Population Served***
Design Capacity Million Gallons per Day (MGD)*
Construction Cost (in local currency or U.S. dollars)**
Operation & Maintenance Cost/Year (in local currency or U.S. dollars)**
-
* If design capacity is in metric system please indicate
** Please indicate currency
***Is population served (population of the city) same as design population? Yes No If no, what is the number

657
WASTEWATER TREATMENT PROCESSES
(AID - UNIVERSITY OF OKLAHOMA LDC PROJECT)
Name of the Country
Name of City of Town
Population
Year Construction Completed
Type of Treatment Plant (e.g. Lagoon Activated Sludge, etc.)
Population Served***
Flow into Treatment Plant
5-Day BOD of Influent
5-Day BOD of Effluent
Construction Cost (in local currency or U.S. Dollars)**
Operation & Maintenance Cost per Year (in local currency or U.S. dollars)**

658
TABLE IV.10
ESTIMATED MEAN WATER DEMAND IN GALLONS PER CAPITA PER DAY FOR SELECTED CONDITIONS
x„ 2
5 5 5 5 5 5 5 5 5 5 5 5 5 5 5 5 5 5 5 5 5 5 5 •5 5 5 5 5 5 5 5 5 5 5 5 5 5 5 5 5 5 5 5 5 5 5 5 5 5 5 5 5 5 5 5 5 5 5 •5
5 5 5 5
X ' 5
5 5 5 5 5 5 5 5 5 5 5 5 5 5 5 5 25 25 25 25 25 25 25 25 25 25 25 25 25 25 25 25 45 45 45 i»5 45 U5 45 45 <t5 45 <t5 45 45 45 45 US 65 65 65 65 65 65 65 65 65 65 65 65 65 65 65
x. 6
75 325 575 825
1075 1325 1575 1825 2075 2325 2575 2825 3075 3325 3575 3825 75 325 575 825
1075 1325 1575 1825 2075 2325 2575 2825 3075 3325 3575 3825 75 325 575 825
1075 1325 1575 1825 2075 2325 2575 28 25 3075 3325 3575 3825 75 325 575 8 25 1075 1325 1575 1825 2075 2325 2575 2825 3075 3325 3575
D w.af
21 25 28 32 35 39 42 1*6 50 53 57 60 64 67 71 7l» 21 25 28 32 35 39 42 46 50 53 57 60 64 67 71 74 21 25 28 32 35 39 42 46 50 53 57 60 64 67 71 74 21 25 28 32 35 39 42 "•6 50 53 57 60 64 67 71
D w.as
10 17 23 30 36 43 49 56 63 .69 76 82 89 95 102 109 14 21 28 34 41 47 54 60 67 74 80 87 93 100 106 113 19 25 32 39 45 52 58 65 71 78 85. 91 98 104 111 117 23 30 36 43 50 56 63 69 76 82 89 96 102 109 115
D , w. la
17 25 33 42 50 58 66 75 83 91 99 108 116 124 132 141 18 27 35 45 51 60 68 76 84 93 101 109 117 12G 134 14 2 20 28 36 44 53 61 69 77 86 94 102 110 119 127 135 143 21 29 37 46 54 62 71 79 87 95 104 112 120 128 137

659
TABLE IV. 10—Continued
x„ 2 5 5 5 5 5 5 5 5 5 5 5 5 5 5 5 5 5
UO l»0 UO uo UO UO UO UO itO ItO UO UO UO UO UO UO UO UO UO UO UO UO UO UO UO UO UO UO UO UO UO UO UO UO UO UO UO UO UO UO UO UO UO UO UO UO UO UO UO
X,: 5
65 85 85 85 85 85 85 85 85 85 85 85 85 85 85 85 85 5 5 5 5 5 5 5 5 5 5 5 5 5 5 5 5 25 25 25 25 25 25 25 25 25 25 25 25 25 25 25 25 U5 U5 U5 U5 US U5 U5 US US U5 US U5 US US U5 U5 65
x. 6
3825 75 325 575 825 1075 1325 1575 1825 2075 2325 2575 2825 3075 3325 3575 3825 75 325 575 825 1075 1325 1575 1825 2075 2325 2575 2825 3075 3325 3575 3825 75 325 575 825 1075 1325 1575 1825 2075 2325 2575 2825 3075 3325 3575 3825 75
325 575 825 1075 1325 1575 1825 2075 2325 2575 2825 3075 3325 3575 38 25 75
D w.af
7U 21 25 28 32 35 39 U2 U6 50 53 57 60 6U 67 71 7U 2U 27 31 3U 38 Ul U5 U8 52 55 59 63 66 70 73 77 2U 27 31 3U 38 Ul US U8 52 55 59 63 66 70 73 77 2U 27 31 3U 38 Ul U5 U8 52 55 59 63 66 70 73 77 2U
D w.as
122 28 3U Ul U7 5U 60 67 7U 80 87 93 100 107 113 120 126 12 18 25 31 38 UU 51 58 6U 71 77 8U 90 97 10U 110 16 23 29 36 U2 U9 55 62 69 75 82 88 95 101 108 115 20 27 3U UO U7 53 60 66 73 80 86 93 99 106 112 119 25
D , w.la
1U5 22 31 39 U7 55 6U 72 80 88 97 105 113 121 130 138 1U6 19 27 36 UU 52 60 69 77 85 93 102 110 118 126 135 1U3 21 29 37 US 5U 62 70 78 87 95 103 111 120 128 136 1UU 22 30 38 U7 55 63 71 80 88 96 10U 113 121 129 137 1U6 23

.660
TABLE IV. 10—Cont inued
x0 2 UO UO UO d0 UO UO UO l»0 UO UO UO UO 1*0 UO UO 1*0 l»0 UO UO UO UO UO UO UO UO UO UO UO UO UO UO 75 75 75 75 75 75 75 75 75 75 75 75 75 75 75 75 75 75 75 75 75 75 75 75 75 75 75 75 75 75 75 75 75 75
xc 5 65 65 65 65 65 65 65 65 65 65 65 6.5 65 65 65 85 85 85 85 85 85 85 85 85 85 85 85 85 85 85 85 5 5 5 5 c 5 5 5 5 5 5 5 5 5 5 5 25 25 25 25 25 25 25 25 25 25 25 25 25 25 25 25 U5 US
X* 6
325 575 825
1075 1325 1575 1825 2075 2325 2575 2825 3075 3325 3575 3825 75
325 575 825
1075 1325 1575 1825 2075 2325 2575 2825 3075 3325 3575 3825 75 325 575 825
1075 1325 1575 1825 2075 2325 2575 28.25 3075 3325 3575 3825 75 325 575 825
1075 1325 1575 1825 2075 2325 2575 2825 3075 3325 3575 3825 75
325
D w.af 27 31 3U 38 Ul U5 U8 52 55 59 63 66 70 73 77 2U 27 31 3U 38 Ul U5 U8 52 55 . 59 63 66 70 73 77 26 29 33 37 UO uu U7 51 5U 58 61 65 69 72 76 79 26 29 33 37 UO UU U7 51 5U 58 61 65 69 72 76 79 26 29
D w.as
31 38 U5 51 58 6U 71 77 8U 91 97 10U 110 117 123 29 36 U2 U9 56 62 69 75 82 88 95 102 108 115 121 128 13 20 26 33 UO U6 53 59 66 72 79 86 92 99 105 112 18 2U 31 37 UU 50 57 6U 70 77 83 90 97 103 110 116 22 29
D , v.la
31 UO U8 56 65 73 81 89 98 106 11U 122 131 139 1U7 25 33 Ul U9 58 66 7U 82 91 99 107 115 12U 132 1U0 1U8 21 30 38 U6 SU 63 71 79 87 96 10U 112 120 129 137 1U5 23 31 39 U8 56 6U 72 81 89 97 105 11U 122 130 138 1.U7 2U 32

661
TABLE I V . 1 0 — C o n t i n u e d
x„ 2 75 75 75 75 75 75 75 75 75 75 75 75 75 75 75 75 75 75 75 75 75 75 75 75 75 75 75 75 75 75 75 75 75 75 75 75 75 75 75 75 75 75 75 75 75 75 110 110 110 110 110 110 110 110 110 110 110 110 110 110 110 110 110 110 110 110
X, 5 U5 45 45 45 U5 45 45 1*5 45 45 45 45 1(5 1»5 65 65 65 65 65 65 65 65 65 65 65 65 65 65 65 65 85 85 85 85 85 85 85 85 85 85 85 85 85 85 85 85 5 5 5 5 5 5 5 5 5 5 5 5 5 5 5 5 25 25 25 25
x. 6 575 825
1075 1325 1575 1825 2075 2325 2575 2825 3075 3325 3575 3825 75
325 575 825
1075 1325 1575 1825 2075 2325 2575 2825 3075 3325 3575 3825 75 325 575 825
1075 1325 1575 1825 2075 2325 2575 2825 3075 3325 3575 3825 75 325 575 825
1075 1325 1575 1825 2075 2325 2575 2825 3075 3325 3575 3825 75
325 575 825
D w.af
33 37 40 44 47 51 54 58 61 65 69 72 76 79 26 29 33 37 40 44 47 51 54 58 61 65 69 72 76 79 26 29 33 37 40 44 47 51 54 58 61 65 69 72 76 79 28 32 35 39 42 46 50 53 57 60 64 67 71 74 78 82 28 32 35 39
D w.as 35 42 48 55 61 68 75 81 88 94 101 107 114 121 26 33 40 46 53 59 66 72 79 86 92 99 105 112 118 125 31 37 44 51 57 64 70 77 83 90 97 103 110 116 123 129 15 21 28 35 41 48 54 61 67 74 81 87 94 100 107 113 19 26 32 39
D , w.la 41 49 57 65 74 82 90 98 107 115 123 131 140 148 25 34 42 50 59 67 75 83 92 100 108 116 125 133 141 149 27 35 43 52 60 68 76 85 93 101 109 118 12 6 134 142 151 24 32 40 48 57 65 73 81 90 98 106 114 123 131 139 148 25 33 42 50

662
TABLE IV. 10—Cont inued
x. 2
110 110 110 110 110 110 110 110 110 110 110 110 lio 110 110 110 110 110 110 110 110 110 110 110 110 110 110 110 110 110 110 110 110 110 lio 110 110 110 110 110 110 110 110 110 110 110 110 110 110 110 110 110 110 110 110 110 110 110 110 110 11*5 145 ll»5 145 us 1U5
Xc 5
25 25 25 25 25 25 25 25 25 25 25 25 45 4 5 45 1*5 45 l»5 45 45 45 45 45 45 45 45 45 45 65 65 6 5 65 65 65 65 65 65 65 65 65 65 65 63 65 85 85 85 85 85 85 8 5 85 85 85 85 85 85 85 85 85 5 5 5 5 5 5
X<: 6
1075 1325 1575 1825 2075 2325 2575 2825 3075 3325 3575 3825 75
325 575 825
1075 1325 1575 1825 2075 2325 2575 2825 3075 3325 3575 3825 75
325 575 825
1075 13 25 1575 1825 2075 2325 2575 2825 3075 3325 3575 3825 75
325 575 825
1075 1325 1575 1825 2075 2325 2575 2825 3075 3325 3575 3825 75
325 575 825
1075 1325
D f w.af
42 46 50 53 57 60 64 67 71 74 78 82 28 32 35 39 42 46 50 53 57 60 64 6 7 71 74 78 82 28 32 35 39 42 46 50 5 3 57 60 64 67 71 74 78 8 2 28 32 35 39 42 46 50 53 57 60 64 67 71 74 78 8 2 31 34 38 41 45 48
D w.as
46 52 59 65 72 78 85 92 98 105 111 118 24 30 37 43 50 57 63 70 76 83 89 96 103 109 116 12 2 28 35 41 48 54 61 67 74 81 87 94
-100 JO 7 •114 120 127 32 39 46 52 59 65 72 78 85 92 98 105 111 118 124 131 16 23 30 36 43 49
D , w. la
58 66 75 83 91 99 108 116 124 132 141 149 26 3 5 43 51 59 68 76 84 9 2 101 109 117 125 134 142 150 28 36 44 53 61 69 77 8 6 94
10 2 110 119 127 135 143 152 29 37 46 54 62 70 79 87 95 103 112 120 128 136 145 153 26 34 42 51 59 67

663
TABLE IV. 10—Cont inued
X„ 2
145 145 11*5 145 145 145 1U5 145 145 145 145 145 145 145 1U5 li»5 145 145 145 145 145 145 1U5 145 145 145 145 145 145 145 145 14 5 1U5 145 1U5 1U5 145 145 1I»S 145 145 145 145 145 145 145 145 145 14 5 145 145 145 145 145 145 145 145 145 145 145 145 145 14 5 145 145
xc 5 5 5 5 5 5 5 5 5 5 5 25 25 25 25 25 25 25 25 25 25 25 25 25 25 25 25 45 45 45 45 45 45 45 45 45 45 45 45 45 45 45 45 65 65 65 65 65 65 65 65 65 65 65 65 65 65 65 65 85 85 85 85 85 85 85
X, 6
1575 1825 2075 2325 2575 2825 3075 3325 3575 3825 75
325 575 825
1075 1325 1575 1825 2075 2325 2575 2825 3075 3325 3575 3825 75
325 575 825
1075 1325 1575 1825 2075 2325 2575 2825 3075 3325 3575 3825 75 325 575 825
1075 1325 1575 1825 2075 2325 2575 2825 3075 3325 3575 3825 75
325 575 825
1075 1325 1575
D _ v.af 52 56 59 63 66 70 73 77 80 84 31 34 38 41 45 48 52 56 59 63 66 70 73 77 80 84 31 34 38 41 45 48 52 56 59 63 66 70 73 77 80 84 31 34 38 41 45 48 52 56 59 63 66 70 73 77 80 84 31 34 38 41 45 48 52
D w.as
56 62 69 76 82 89 95 102 108 115 21 27 34 41 47 54 60 67 73 80 87 93 100 106 113 119 25 32 38 45 52 58 65 71 78 84 91 98 104 111 117 124 30 36 43 49 56 63 69 76 82 89 95 102 109 115 122 128 34 41 47 54 60 67 74
D , W.l«
75 84 92 100 108 117 125 133 142 150 27 36 44 52 60 69 77 85 93 102 110 118 12 6 135 143 151 29 37 45 53 62 70 78 86 95 103 111 119 128 136 144 153 30 38 47 55 63 71 80 88 96 104 113 121 129 137 146 154 31 40 48 56 64 73 81

664
TABLE IV. 10—Continued
x. 2 1*5 lit 5 1U5 1«*5 1U5 1U5 1U5 1U5 1US
Xi 5
• 5 85 85 85 85 85 85 85 85
X, 6
1825 2075 2325 2575 2825 3075 3325 3575 3825
D , w.af
56 59 63 66 70 73 77 80 8«»
D W.88
80 87 93
100 106 113 120 126 133
D , w . l a
89 97
106 111* 122 130 139 11*7 155

TABLE IV.11
665
ESTIMATED WASTEWATER DISPOSAL IN GALLONS PER CAPITA PER DAY FOR SELECTED CONDITIONS
Dw *10 x l l 2 * 6 8 10 12 1*
2 k 6 8 10 12 It 2 * 6 8 10 12 Id 2 d 6 8 10 12 Id 2 d 6 8 10 12 lb 2 d 6 8 10 12 Id 2 d 6 8 10 12 Ik 2 k 6 8 10 12 Id 2 k 6 8 10 12 Id 2
®VW.i !>
I 5 5 5 5 5 5 5 $ 5 S 5 5 5 5 5 5 5 5 5 5 5 S 5 5 5 6 5 5 5 5 5 5 6 6 5 5 5 5 5 12 12 12 11 11 11 11 12 12 12 12 11 11 11 12 12 12 12 12 12 11 12
^ww. as Dwwg3a 10 10 10 10 10 10 10 10 10 10 10 10 10 10 10 10 10 10 10 10 10 10 10 10 10 10 10 10 10 10 10 10 10 10 10 10 10 10 10 10 10 10 25 25 25 25 25 25 25 25 25 25 25 25 25 25 25 25 25 25 25 25 25 25
S 5 5 S 5 5 5 20 20 20 20 20 20 20 35 35 35 35 35 35 35 50 50 50 50 50 50 50 65 65 65 65 65 65 65 80 80 80 80 80 80 80 5 5 5 5 5 5 5 20 20 20 20 20 20 20 35 35 35 35 35 35 3S 50
6 6 6 6 6 6 6 6 6 6 6 6 6 6 6 6 6 6 6 6 6 6 6 6 6 6 6 6 6 6 6 6 6 6 6 6 6 6 6
6 6 6 6 6 6 6 6 6 6 6 6 6 6 6 6 6 6 6 6 6 6 6 6 6 6 6 6 6 6 6 6 6 6 6 6 6 6 6 6 6 16 15 15 15 15 15 15 16 15 15 15 15 15 15 16 IS 15 15 15 15 15 16

666
TABLE I V . 1 1 — C o n t i n u e d
>w 25 25 25 25 25 25 25 25 25 25 25 25 25 25 25 25 25 25 25 25 itO UO UO UO 1*0 UO UO UO UO UO UO UO UO UO UO UO UO 1. A
HU UO UO UO UO UO UO UO UO UO UO UO UO UO UO UO UO UO UO UO UO UO UO UO UO 55 55 55 55
X10
.50 50 50 SO 50 50 65 65 65 .65 65 65 65 80 80 80 80 80 80 80 5 5 5 5 5 5 5 20 20 20 20 20 20 20 35 35 35
35 35 35 50 50 50 50 50 50 50 65 65 65 65 65 65 65 80 80 80 80 80 80 80 5 5 5 5
*11 \ 6 8 10 12 IU 2 U 6 8 10 12 iu 2 U 6 8 10 12 IU 2 U .6 8 10 12 IU 2 U 6 8 10 12 IU 2 U 6 8 10 12 IU 2 U 6 8 10 12 IU 2 U 6 8 10 12 IU 2 k 6 8 10 12 iu 2 U 6 8
Pwv.af ""12" ""-12 12 12 .12 12 12 12 12 12 12 12 12 12 12 12 12 12 12 12 18 18 18 18 18 18 18 18 18 18 18 18 18 18 19 18 18 IS 18 18 18 19 19 18 18 18 18 18 19 19 19 19 18 18 18 19 19 19 19 19 19 18 25 25 25 25
Pww.as •" 13'" '"
13 13 13 13 13 13 13 13 13 13 13 13 13 13 13 13 13 13 13 19 .19 19 19 19 19 19 20 20 20 20 20 20 20 20 20 20 20 20 20 20 •20 20 20 20 20 20 20 20 20 20 20 20 20 20 20 20 20 20 20 20 20 26 26 26 26
D w w . 1 ;
"is 15 15 15 15 15 16 15 15 15 15 15 15 16 15 15 15 15 15 15 25 25 25 25 2U 2U 2U 25 25 25 25 2U '2U 2U 25 25 25 25 2U 2U 2U 25 25 25 25 2U 2U 2U 25 25 25 25 2U 2U 2U 25 25 25 25 2U 2U 2U 3.U 3U 3U 3U

TABLE IV. 1 1 — C o n t i n u e d
667
Dw
55 55 55 55 55 55 55 55 55 55 55 55 55 55 55 55 55 55 55 55 55 55 55 55 55 55 55 55 55 55 55 55 55 55 55 55 55 55 70 70 70 70 70 70 70 70 70 70 70 70 70 70 70 70 70 70 70 70 70 70 70 70 70 70 70
*10
5 5 5 20 20 20 20 20 20 20 35 35 35 35 35 35 35 50 50 50 50 50 50 50 65 65 65 65 65 65 65 80 80 80 80 80 80 80 5 5 5 5 5 5 5 20 20 20 20 20 20 20 35 35 35 35 35 35 35 50 50 50 50 50 50
Xll 10 12 Id 2 4 6 8 10 12 lit 2 k 6 8 10 12 Id 2 d 6 8 10 12 Id 2 d 6 8 10 12 14 2 d 6 8 10 12 Id 2 It 6 8 10 12 Id 2 k 6 8 10 12 Id 2 d 6 8 10 12 Id 2 d 6 8 10 12
Dww.af
25 25 2d 25 25 25 25 25 25 25 25 25 25 25 25 25 25 25 25 25 25 25 25 25 25 25 25 25 25 25 25 25 25 25 25 25 25 25 32 31 31 31 31 31 31 32 32 31 31 31 31 31 32 32 32 32 31 31 31 32 32 32 32 32 32
Dww.as 26 26 26 26 26 26 26 26 26 26 27 27 27 27 27 27 27 27 27 27 27 27 27 27 27 27 27 27 27 27 27 27 27 27 27 27 27 27 33 35 33 33 33 33 33 33 33 33 33 33 33 33 33 33 33 33 33 33 33 3d 3d 3d 3d 3d 3d
Dwv.1 a 3d 3d 3d 3d 3d 3d 3d 3d 3d 3d 3d 3d 3d 3d 3d 3d 3d 3d 3d 3d 3d 3d 3d 3d 3d 3d 3d 3d 3d 3d 3d 3d 3d 3d 3d 3d 3d 3d d3 d3 d3 d3 d3 d3 d3 d3 d3 d3 d3 d3 d3 d3 d3 d3 d3 d3 d3 d3 d3 d3 1*3 d3 d3 d3 d3

668
°w X 1 0 70 70 70 70 70 70 70 70 70 70 70 70 70 70 70 85 85 85 8 5 85 85 85 85 85 85 85 85 85 85 85 85 85 85 85 85 85 85 85 85 85 85 85 85 85 85 85 85 85 85 85 85 85 85 85 85 85 85 100 100 100 100 100 100 100 100 100
50 65 65 65 65 65 65 65 80 80 80 80 80 80 80 5 5 5 5 5 5 5 20 20 20 20 20 20 20 35 35 35 35 35 35 35 50 50 50 50 50 50 50 65 65 65 65 65 65 65 80 80 80 80 80 80 80 5 5 5 5 5 5 5 20 20
TABLE IV. 1 1 — C o n t i n u e d
x l l ik 2 4 6 8 10 12 Ik 2 l» 6 8 10 12 1U 2 k 6 8 10 12 Ik 2 i» 6 8 10 12 Ik 2 l» 6 8 10 12 Ik 2 k 6 8 10 12 Ik 2 !» 6 8 10 12 Ik 2 k 6 8 10 12 Ik
2 k 6 8 10 12 lit 2 k
Oww.af 31 32 32 32 32 32 32 32 32 32 32 32 32 32 32 38 38 38 38 38 38 38 38 38 38 38 38 38 38 38 38 38 38 38 38 38 38 58 38 38 38 38 38 39 39 38 38 38 38 38 39 39 39 39 38 38 38 kS 45 kS kS kk kk kk kS US
Dww.as •3«* 3U 3U 3U •31* 3U 3k 5k 3k 3k 3 k 3k 3k 3k 3M UO UO 1*0 i»0 UO 1*0 UO UO 1*0 kO UO UO UO UO kO UO kO UO UO UO UO UO UO UO UO UO UO UO Ul Ul Ul Ul Ul Ul Ul Ul Ul Ul Ul Ul Ul Ul U7 U7 U7 U7 U7 U7 U7 U7 U7
»UW^lfl U3 U3 U3 U3 U3 U3 U3 U3 U3 U3 U3 U3 U3 U3 U3 53 52 52 52 52 52 52 53 52 52 52 52 52 52 53 52 52 52 52 52 52 53 r o
52 52 52 52 52 53 52 52 52 52 52 52 53 52 52 52 52 52 52 62 62 62 6 2 61 61 61 62 62

TABLE I V . 1 1 — C o n t i n u e d
Dw
100 100 100 100 100 100 100 100 100 100 100 100 100 100 100 100 100 100 100 100 100 100 100 100 100 100 100 100 100 100 100 100 100
x 10
20 20 20 20 20 35 35 35 35 35 35 35 50 50 50 50 50 50 50 65 65 65 65 65 65 65 80 80 80 80 80 80 80
*11 6 8
10 12 14
2 * 6 8
10 12 14
2 k 6 8
10 12 Ik
2 k 6 8
10 12 Ik
2 4 6 8
10 12 lit
Dwv.af kS 45 k5 45 44 45 45 45 45 45 45 45 45 45 45 45 45 45 45 45 45 45 45 45 45 45 45 45 45 45 45 45 45
Dww.as
48 48 48 48 48 48 48
DtfW.lfl 62 62 61 61 61 62 62 62 62 61 61 61 62 62 62 62 61 61 61 62 62 62 62 61 61 61 62 62 62 62 61 61 61

670
TABLE IV.12
ESTIMATED COST OF WATER TREATMENT PER MGD FOR SELECTED CONDITIONS (SLOW SAND FILTER) IN 1000 U.S. DOLLARS
V13 '14 v15 C" w.af C"w af CH
*».ar w.as
C" w.as w.la
C"" w.la
S 5 5 5 5 5 S 5 S 5 5 5 5 5 5 5 5 5 5 5 5 5 5 5 5 5 5 5 5 5 5 5 5 5 5 5 5 1 5 1 5 1 5 1 5 1 5 1 5 1 5 1 5 1 5 1 5 1 5 1 5 1 5 1 5 1 5 1 5 1 5 1
25 25 25 25 25 25 25 25
3 3 3 5 3 5 3 5 3 5 3 5 3 35 3 35 3 35 3 35 3 35 3 35 3 65 3 65 3 65 3 65 3 65 3 65 7 5 7 5 7 5 7 5 7 5 7 5 7 35 7 35 7 35 7 35 7 35 7 35 7 65 7 65 7 65 7 65 7 65 7 65 1 5 1 5 1 5 1 5 1 5 1 5 1 35 1 35 1 35 1 35 1 35 1 35 1 65 1 65 1 65 1 65 1 65 1 65 3 5 3 5 3 5 3 5 3 5 3 5 3 35 3 35
0 . 2 5 2 . 5 0 U.75 7 . 0 0 9 . 2 5
1 1 . 5 0 0 . 2 5 2 . 5 0 I t .75 7 . 0 0 9 . 2 5
1 1 . 5 0 0 . 2 5 2 . 5 0 It. 75 7 . 0 0 9 . 2 5
1 1 . 5 0 0 . 2 5 2 . 5 0 I t .75 7 . 0 0 9 . 2 5
1 1 . 5 0 0 . 2 5 2 . 5 0 i».75 7 . 0 0 9 . 2 5
1 1 . 5 0 0 . 2 5 2 . 5 0 l».75 7 . 0 0 9 . 2 5
1 1 . 5 0 0 . 2 5 2 . 5 0 k.JS 7 . 0 0 9 . 2 5
1 1 , 5 0 0 , 2 5 2 . 5 0 U.75 7 . 0 0 9 . 2 5
1 1 . 5 0 0 . 2 5 2 . 5 0 U.75 7 . 0 0 9 . 2 5
1 1 . 5 0 0 . 2 5 2 . 5 0 I t .75 7 . 0 0 9 . 2 5
1 1 . 5 0 0 . 2 5 2 . 5 0
26 26 26 26 26 26 20 20 20 20 20 20 18 18 18 18 18 18 26 26 26 26 26 26 20 20 20 20 20 20 18 18 18 18 18 18 26 26 26 26 26 26 20 20 20 20 20 20 18 18 18 18 18 18 26 26 26 26 26 26 20 20
12 3 2 2 1 1
12 3 2 2 1 1
12 3 2 2 1 1
12 3 2 2 1 1
12 3 2 2 1 1
12 3 2 2 1 1
12 3 2 2 1 1
12 3 2 2 1 1
12 3 2 2 1 1
12 3 2 2 1 1
12 3
V3 31* 31 30 29 29 U3 3k 31 30 29 29 U3 31* 31 30 29 29 U3 3U 32 30 30 29 i»3 3k 32 30 30 29 1*3 3U 32 30 30 29 l » l * 3i» 32 31 30 29 1*1* 3l» 32 31 30 29 l»<* 3i» 32 31 30 29 U3 3«» 31 30 29 29 1*3 3d
15 5 it 3 3 2
13 k 3 2 2 2
12 1* 3 2 2 2
15 5 U 3 3 2
13 It 3 2 2 2
12 it 3 2 2 2
15 5 it 3 3 2
13 it 3 2 2 2
12 It 3 2 2 2
15 5 it 3 3 2
13 It
39 39 39 39 39 39 31* 3U 31* 31* 31* 3U 32 32 32 32 32 32 39 39 39 39 39 39 3U 3U 3U 3U 31* 31* 32 32 32 32 32 32 39 39 39 39 39 39 3U 3k 34 31* 3lt 3<t 32 32 32 32 32 32 39 39 39 39 39 39 3U 3k
13 3 2 2 1 1
13 3 2 2 1 1
13 3 2 2 1 1
13 3 2 2 1 1
13 3 2 2 1 1
13 3 2 2 1 1
13 3 2 2 1 1
13 3 2 2 1 1
13 3 2 2 1 1
13 3 2 2 1 1
13 3

671
TABLE I V . 1 2 — C o n t i n u e d
*13 V1A v15 C" w.af C"" , C" w.af ** w .as
c n i i C " . w.as w.La
c,„, w.la
1
3 7
35 35 35 35 65 65 65 65 65 65 5 5 5 5 5 5 35 35 35 35 35 35 65 65 65 65 65 65 5 5 5 5 5 5 35 35 35 35 35 35 65 65 65 65 65 65 5 5 5 5 5 5
35 35 35 35 35 35 65 65 65 65 65 65 5
4.75 7.00 9.25 11.50 0.25 2.50 U.75 7.00 9.25
11.50 0.25 2.50 4.75 7.00 9.25 11.50 0.25 2.50 4.75 7.00 9.25 11.50 0.25 2.50 J».75 7.00 9.25 11.50 0.25 2.50 4.75 7.00 9.25 11.50 0.25 2.50 4.75 7.00 9.25 11.50 0.25 2.50 4.75 7.00 9.25
11.50 0.25 2.50 4.75 7.00 9.25 11.50 0.25 2.50 U.75 7.00 9.25 11.50 0.25 2.50 U.75 7.00 9.25 11.50 0.25
20 20 20 20 19 19 19 19 19 19 26 26 26 26 26 26 20 20 20 20 20 20 19 19 19 19 19 IS 26 26 26 26 26 26 20 20 20 20 20 20 19 19 19 19 19 19 26 26 26 26 26 26 20 20 20 20 20 20 19 19 19 19 19 19 26
2 2 1 1
12 3 2 2 1 1 12 3 2 2 1 1 12 3 2 2 1 1 12 3 2 2 1 1
12 3 2 2 1 1 12 3 2 2 1 1
12 3 2 2 1 1 12 3 2 2 1 1 12 3 2 2 1 1 12 3 2 2 1 1 12
31 30 29 29 l»3 34 31 30 29 29 43 34 32 30 30 29 43 34 32 30 30 29 43 34 32 30 30 29 44 3<) 32 31 30 29 44 34 32 31 30 29 44 3I» 32 31 30 29 43 3i» 31 30 29 29 43 34 31 30 29 29 43 34 31 30 29 29 43
3 2 2 2 12 4 3 2 2 2 15 5 4 3 3 2
13 4 3 2 2 2 12 4 3 2 2 2
15 5 4 3 3 2 13 4 3 2 2 2 12 4 3 2 2 2 15 5 4 3 3 2
13 4 3 2 2 2 12 4 3 2 2 2
15
34 34 34 34 32 32 32 32 32 32 39 39 39 39 39 39 34 34 34 34 34 34 32 32 32 32 32 32 39 39 39 39 39 39 34 34 34 34 34 34 32 32 32 32 32 32 39 39 39 39 39 39 34 34 34 34 34 34 32 32 32 32 32 32 39
2 2 1 1
13 3 2 2 1 1 13 3 2 2 1 1 13 3 2 2 1 1 13 3 2 2 1 1 13 3 2 2 1 1 13 3 2 2 1 1
13 3 2 2 1 1 13 3 2 2 1 1 13 3 2 2 1 1 13 3 2 2 1 1 13

672
TABLE IV .12
D w
45 45 45 45 45 45 45 45 45 45 45 45 l»5 45 1*5 U5 l»5 45 U5 45 45 45 45 US U5 45 45 45 45 45 1*5 US 45 US 45 65 65 65 65 65 65 65 65 65 65 65 65 65 65 65 65 65 65 65 65 65 65 65 65 65 65 65 65 65
X13 X14
i: l i l i l i l i l i l i l i n l i n l i l i n n l i n l i
' 5 ' 5 ' 5 ' 5 ' 5 t 35 ' 35 ' 35 ' 35
35 35
' 65 65 65 65 65 65
5 5
L 5 5 5 5
35 35 35 35 35 35 65 65 65 65 65 65
5 5 5 5 5 5
35 35 35 35 35 35 65 65 65 65 65 65
5 5 5 5 5 5
35 35 35 35 35
X15
2 . 5 0 4 . 7 5 7 . 0 0 9 . 2 5
1 1 . 5 0 0 . 2 5 2 .50 4 . 7 5 7 . 0 0 9 . 2 5
1 1 . 5 0 0 . 2 5 2 . 5 0 4 . 7 5 7 . 0 0 9 . 2 5
1 1 . 5 0 0 . 2 5 2 . 5 0 4 . 7 5 7 . 0 0 9 . 2 5
1 1 . 5 0 0 . 2 5 2 . 5 0 4 . 7 5 7 . 0 0 9 . 2 5
1 1 . 5 0 0 . 2 5 2 . 5 0 I t .75 7 . 0 0 9 . 2 5
1 1 . 5 0 0 . 2 5 2 . 5 0 4 . 7 5 7 . 0 0 9 . 2 5
1 1 . 5 0 0 . 2 5 2 . 5 0 4 . 7 5 7 . 0 0 9 . 2 5
1 1 . 5 0 0 . 2 5 2 . 5 0 U.75 7 . 0 0 9 . 2 5
1 1 . 5 0 0 . 2 5 2 . 5 0 1 .75 7 . 0 0 9 . 2 5
1 1 . 5 0 0 . 2 5 2 . 5 0 4 . 7 5 7 . 0 0 9 . 2 5
w.af
26 26 26 26 26 20 20 20 20 20 20 19 19 19 19 19 19 26 26 26 26 26 26 20 20 20 20 20 20 19 19 19 19 19 19 27 27 27 27 27 27 21 21 21 21 21 21 19 19 19 19 19 19 27 27 27 27 27 27 21 21 21 21 21
—Continued
C"" , r" cM" C" C"" w.al
3 2 2 1 1
12 3 2 2 1 1
12 3 2 2 1 1
12 3 2 2 1 1
12 3 2 2
1 12
3 2 2 1 1
12 3 2 2 1 1
12 3 2 2 1 1
12 3 2 2 1 1
12 3 2 2 1 1
12 3 2 2 1
w.as 34 32 30 30 29 43 34 32 30 30 29 43 34 32 30 30 29 44 34 32 31 30 29 44 34 32 31 30 29 44 34 32 31 30 29 43 34 31 30 29 29 43 34 31 30 29 29 43 34 31 30 29 29 43 34 32 30 30 29 43 34 32 30 30
w .as 5 4 3 5 2
13 4 3 2 2 2
12 4 3 2 2 2
15 5 4 3 3 2
13 4 3 2 2 2
12 4 3 2 2 2
15 5 4 3 3 2
13 4 3 2 2 2
12 4 3 2 2 2
15 5 4 3 3 2
13 4 3 2 2
w. 1;
39 39 39 39 39 3U 34 34 31* 34 34 32 32 32 32 32 32 39 39 39 39 39 39 34 34 34 34 3U 34 32 32 32 32 32 32 39 39 39 39 39 39 34 3U 34 34 34 34 32 32 32 32 32 32 39 39 39 39 39 39 34 34 34 34 34
l
3 2 2 1 1
13 3 2 2 1 1
13 3 2 2 1 1
13 3 2 2 1 1
13 3 2 2 1 1
13 3 2 2 1 1
15 3 2 2 1 1
13 3 2 2 1 1
13 3 2 2 1 1
13 3 2 2 1 1
13 3 2
1

673
TABLE I V . 1 2 — C o n t i n u e d
D V
15 65 65
ii 65 65 65 65 65 65 65 65 65 65 65 65 65 65 65 65 65 65
X13 7 7 7 7 7
11 11 11 11 11 11 11 11 11 11 11 11 11 11 11 11 11 11
xu 65 65 65 65 65
5 5 5 5 5 5
35 35 35 35 35 35 65 65 65 65 65 65
X15 2.50 U.75 7 . 0 0 9 . 2 5
1 1 . 5 0 0 . 2 5 2 . 5 0 *».75 7 . 0 0 9 . 2 5
1 1 . 5 0 0 . 2 5 2 . 5 0 I . .75 7 . 0 0 9 . 2 5
1 1 . 5 0 0 . 2 5 2 .50 U.75 7 . 0 0 9 . 2 5
1 1 . 5 0
f"
I f 19 19 19 19 27 27 27 27 27 27 21 21 21 21 21 21 19 19 19 19 19 19
C . M .
v.af 3
12
12
12
c" w.as > l 32 30 30 29 kU 3* 32 31 30 29 Uk 3i* 32 31 30 29 kk 3l» 32 31 30 29
Cu" w.as
H 3 2 2 2
15 5 I* 3 3 2
13 k 3 2 2 2
12 l» 3 2 2 2
C" , w.la
32 32 32 32 32 39 39 39 39 39 39 3U 3U 31* 31* 3U 3«» 32 32 32 32 32 32
c . . . . w.la
3 2 2 1 1
13 3 2 2 1 1
13 3 2 2 1 1
13 3 2 2 1 1

674
TABLE IV.13
ESTIMATED MEAN COST OF WATER TREATMENT PER MGD FOR SELECTED CONDITIONS (RAPID SAND FILTER) IN 1000 U.S. DOLLARS
D w
S 5 5 5 5 5 5 5 5 5 5 5 5 5 5 5 5 5 5 5 5 5 5 5 5 5 5 5 5 5 5 5 5 5 5 5 5 5 5 5 5 '5 5 5 5 5 5 5
U5 U5 U5 l»5 l»5 1*5 l»5 U5 U5 US U5 U5 1*5 US US
X13
U U
u u u u u • u u u u u 2U
2U 2U 2U 2U 2U 2U 2U 2U 2U 2U 2U UU UU UU UU UU UU UU UU UU UU UU UU 6U
eu 6U 6U 6U 6U 6U 6U 6U 6U 6U 6U
U
u u u u u u u u u u u 2U
2U 2U
X14
5 5 5 5
U5 U5 U5 U5 85 85 85 85
5 5 5 5
U5 U5 U5 U5 85 85 85 85
5 5 5 5
U5 U5 U5 U5 85 85 85 85
5 5 5 5
U5 U5 U5 U5 85 85 85 85
5 5 5 5
U5 U5 U5 US 85 85 85 85
5 5 5
X15
0 . 2 5 U.00 7 . 7 5
1 1 . 5 0 0 . 2 5 U.00 7 . 7 5
1 1 . 5 0 0 . 2 5 U.00 7 . 7 5
1 1 . 5 0 0 . 2 5 U.00 7 . 7 5
1 1 . 5 0 0 . 2 5 U.00 7 . 7 5
1 1 . 5 0 0 . 2 5 U.00 7 . 7 5
1 1 . 5 0 0 . 2 5 U.00 7 . 7 5
1 1 . 5 0 0 . 2 5 U.00 7 . 7 5
1 1 . 5 0 0 . 2 5 U.00 7 . 7 5
1 1 . 5 0 0 . 2 5 U.00 7 . 7 5
1 1 . 5 0 0 . 2 5 U.00 7 . 7 5
1 1 . 5 0 0 . 2 5 U.00 7 . 7 5
1 1 . 5 0 0 . 2 5 U.00 7 . 7 5
1 1 . 5 0 0 . 2 5 U.00 7 . 7 5
1 1 . 5 0 0 . 2 5 U.00 7 . 7 5
1 1 . 5 0 0 . 2 5 U.00 7 . 7 5
C" , w.af 357 357 357 357 3U1 3U1 3U1 3U1 336 336 336 336 363 363 363 363 3U7 3U7 3U7 3U7 3U2 3U2 3U2 3U2 365 365 36 5 3C5 3U9 3U9 3U9 3U9 3UU 3UU 3UU 3UU 367 36 7 367 367 350 350 350 350 3U5 3U5 3U5 3U5 357 357 357 357 3U1 3U1 3U1 3U1 336 336 336 336 363 363 363
w.af
12 7 11U 112 110 127 11U 112 110 127 11U 112 110 132 119 116 115 132 119 11C 115 132 119 116 115 13U 121 118 116 13U 121 118 116 13U 121 118 116 135 122 119 117 135 122 119 117 135 122 119 117 127 11U 112 110 127 11U 112 110 127 11U 112 110 132 119 116
C" w.as 56U 56U 56U 56U 518 518 518 518 506 506 506 506 570 570 570 570 52U 52U 52U 52U 512 512 517. 512 572 572 572 572 527 527 527 527 51U 51U 51U 51U 57U 57U 5 7U 57U 528 528 528 528 515 515 515 515 56U 56U 56U 56U 518 518 518 518 506 506 506 506 570 570 570
p l l t t
w.as
183 157 151 1U8 183 157 151 1U8 183 157 151 1U8 191 16U
' 158 155 191 16U 158 155 191 16 U 158 155 19U 16 7 161 157 19U 167 161 157 19 U 167 161 157 196 168 16 2 1S9 196 168 162 159 196 168 162 1S9 183 157 151 1U8 183 157 151 1U8 183 157 151 1U8 191 16U 158
C" . w . l a .
U78 UU8 UU1 U37 U78 UU8 UU1 U37 U78 UU8 UU1 U37 U80 U50 UU3 U39 U80 U50 UU3 U39 U80 U50 UU3 U39 U81 U50 UU3 U39 U81 U50 UU3 U39 U81 U50 UU3 U39 U81 U51 UUU UUO U81 U51 UUU UUO U81 U51 UUU UUO U78 UU8 UU1 U37 U78 UU8 UU1 U37 U78 UU8 UU1' U37 U80 U50 UU3
C"" , w . l a
13 7 118 11U 112 137 118 11U 112 137 118 11U 112 1U8 128 12U 121 1U8 128 12U 121 1U8 128 12U 121 152 131 12 7 12 U 152 131 127 12U 152 131 127 12U 155 13U 129 126 155 13U 129 126 155 13U 129 126 137 118 11U 112 137 118 11U 112 137 118 11U 112 1U8 128 12U

675
TABLE I V . 1 3 — C o n t i n u e d
D w
U5 1*5 US US U5 U5 kS U5 US U5 U5 U5 U5 US U5 U5 U5 U5 U5 US U5 U5 U5 U5 U5 U5 U5 US U5 U5 US U5 U5 85 85 85 85 85 85 85 85 85 85 85 85 85 85 85 85 85 85 85 85 85 85 81 85 85 85 85 85 85 85 85 85 85 85
X13 2U 2U 2U 2U 2U 2U 2U 21» 2k UU UU UU UU UU UU UU UU UU UU UU UU 6U 6U 6U 6U 6U 6U 6U 6U 6U 6U 6U 6U
U U U U U U U U U U U U
2U 2U 2U 2U 2U 2U 2U 2U 2U 2k 2k 2k UU UU UU UU UU UU UU UU UU UU
*14 5
U5 U5 U5 U5 85 85 85 85
5 5 5 5
U5 U5 U5 U5 85 85 85 85
5 5 5 5
U5 U5 US U5 85 85 85 85
5 5 5 5
U5 U5 US US 85 85 85 85
5 5 5 5
U5 U5 U5 US 85 85 85 85
5 5 5 5
US U5 US US 85 85
X!5 1 1 . 5 0
0 . 2 5 U.OO 7 . 7 5
1 1 . 5 0 0 . 2 5 U.OO 7 . 7 5
1 1 . 5 0 0 . 2 5 U.OO 7 . 7 5
1 1 . 5 0 0 . 2 5 U.OO 7 . 7 5
1 1 . 5 0 0 . 2 5 U.OO 7 . 7 5
1 1 . 5 0 0 . 2 5 U.OO 7 . 7 5
1 1 . 5 0 0 . 2 5 U.OO 7 . 7 5
11.SO 0 . 2 5 U.OO 7 . 7 5
1 1 . 5 0 0 .25 U.OO 7 . 7 5
1 1 . 5 0 0 . 2 5 U.OO 7 . 7 5
1 1 . 5 0 0 . 2 5 U.OO 7 . 7 5
1 1 . 5 0 0 . 2 5 U.OO 7 . 7 5
1 1 . 5 0 0 . 2 5 U.OO 7 . 7 5
1 1 . 5 0 0 . 2 5 U.OO 7 . 7 5
1 1 . 5 0 0 , 2 5 U.OO 7 . 7 5
1 1 . 5 0 0 . 2 5 U.OO 7 . 7 5
1 1 . 5 0 0 . 2 5 U.OO
C" , w . a f
363 3U7 3U7 3U7 3U7 3U2 3U2 3U2 3U2 365 365 365 365 3U9 3U9 3U9 3U9 3UU 3UU 3UU 3UU 367 367 367 3£7 350 350 350 350 3U5 3U5 3U5 3U5 357 357 357 357 3U1 3U1 3U1 3U1 336 336 336 336 363 363 363 363 3U7 3U7 3U7 3U7 3U2 3U2 3U2 3U2 365 365 365 365 3U9 3U9 3U9 3U9 3UU 3UU
C"" . w . a f
115 132 119 116 115 132 119 116 115 13U 121 118 116 13U 121 118 116 13U 121 118 116 135 122 119 117 135 122 119 117 135 122 119 117 127 11U 112 110 127 11U 112 110 127 11U 112 110 132 119 116 115 132 119 116 115 132 119 116 115 13U 121 118 116 13U 121 118 116 13U 121
C" w . a s
570 52U 52U 52U 52U 512 512 512 512 572 572 572 572 527 «i27 527 S27 S1U 51U 51U 51U 57U 57U 57U 57U 528 528 528 528 515 515 515 515 56U S6U 56U 56U 518 518 518 518 506 506 506 506 570 570 570 570 52U 52U 52U 52U 512 512 512 512 572 572 572 572 527 527 527 527 51U 51U
c , m
w . a s 155 191 16U 158 155 191 16U 158 155 19U 167 161 157 19U 167 161 157 19U 167 161 157 196 168 162 159 196 168 162 159 196 168 162 159 183 157 151 1U8 183 157 151 1U8 183 157 151 1U8 191 16 U 158 155 191 16 U 158 155 191 16U 158 155 19U 167 161 157 19U 167 161 157 19U 167
C" . w . l a
U39 U80 U50 UU3 U39 U80 U50 UU3 U39 U81 U50 UU3 U39 U81 U50 UU3 U39 U81 U50 UU3 U39 U81 U51 UUU UUO U81 U51 UUU UUO U81 U51 UUU UUO U78 UU8 UU1 U37 U78 UU8 UU1 U37 U78 UU8 UU1 U37 U80 U50 UU3 U39 U80 U50 UU3 U39 U80 U50 UU3 U39 U81 U50 UU3 U39 U81 U50 UU3 U39 U81 U50
C"" w.
121 1U8 128 12U 121 1U8 128 12U 121 152 131 127 12U 152 131 177 12U 152 131 127 12U 155 13U 129 126 155 13U 129 126 155 13U 129 126 137 118 11U 112 137 118 11U 112 137 118 11U 112 1U8 128 12U 121 1U8 128 12U 121 1U8 128 12U 121 152 131 127 12U 152 131 127 12U 152 131

676
TABLE IV. 13—Cont inued
D V
85
as 85 85 85 85 85 85 85 85 85 85 85 85
125 125 125 125 125 125 125 125 125 125 125 125 12 5 125 12 S
25 125 12 5 125 125 125 125 i?«; 125 125 125 125 125 125 125 12 5 12 5 125 125 125 125 125 125 125 125 125 125 125 125 12 5 125 125 12 5 165 165 165
X13 44 44 64 64 6U 64 64 64 64 6k 6k 6k 6k 6k
k k k k k k k k k k k k
2k 2k 2k 2k 2k 2k 2k 2k 2k 2k 2U 2k kk kk >« It ltd kk kk •t it it U it it kk kk it It 6 It 6 It 6 U 6 it 6 it 6«* 6 U 6 U 6 It 6 it 6 it 6 It
it it It
X1A 85 85
5 5 5 5
45 It 5 It 5 It 5 85 85 85 85
5 5 5 5
45 It 5 k5 45 85 85 85 85
5 5 5 5
It 5 kS It 5 It 5 85 85 85 85
5 5 5 5
It 5 45 45 45 85 85 85 85
5 5 5 5
45 45 45 45 85 85 85 85
5 5 5
X15 7 . 7 5
1 1 . 5 0 0 . 2 5 4 . 0 0 7 . 7 5
1 1 . 5 0 0 . 2 5 4 . 0 0 7 . 7 5
1 1 . 5 0 0 . 2 5 4 . 0 0 7 . 7 5
1 1 . 5 0 0 . 2 5 4 . 0 0 7 . 7 5
1 1 . 5 0 0 . 2 5 4 . 0 0 7 . 7 5
1 1 . 5 0 0 . 2 5 4 . 0 0 7 . 7 5
1 1 . 5 0 0 . 2 5 4 . 0 0 7 . 7 5
1 1 . 5 0 0 . 2 5 4 . 0 0 7 . 7 5
1 1 . 5 0 0 . 2 5 4 . 0 0 7 , 7 5
1 1 . 5 0 0 . 2 5 4 . 0 0 7 . 7 5
1 1 . 5 0 0 . 2 5 4 . 0 0 7 . 7 5
1 1 . 5 0 0 . 2 5 4 . 0 0 7 . 7 5
1 1 . 5 0 0 . 2 5 4 . 0 0 7 . 7 5
1 1 . 5 0 0 . 2 5 4 . 0 0 7 . 7 5
1 1 . 5 0 0 . 2 5 4 . 0 0 7 . 7 5
1 1 . 5 0 0 . 2 5 4 . 0 0 7 . 7 5
w.af 344 544 367 367 367 367 350 350 350 350 345 345 345 345 357 357 357 357 341 341 341 341 336 336 336 336 363 363 363 363 347 347 347 347 342 342 3U2 342 365 365 365 365 349 349 349 349 344 344 344 344 367 367 367 367 350 350 350 350 345 345 345 34 5 357 357 357
C"" , w.af 118 116 135 122 119 117 135 122 119 117 135 •122 119 117 127 114 112 110 127 114 112 110 127 114 112 110 132 119 116 115 132 119 116 115 132 119 116 115 134 121 118 116 134 121 118 116 134 121 118 116 135 122 119 117 135 122 119 117 135 122 119 117 127 114 112
C" w.aa 514 514 574 574 574 574 528 528 528 528 515 515 515 515 564 564 564 564 518 518 518 518 506 506 506 506 570 570 570 570 524 524 524 524 512 512 512 S12 572 572 572 572 527 527 527 527 514 514 514 514 574 574 574 574 528 528 528 528 515 515 515 515 564 564 5 6 4
C"" w. as
161 157 196 168 162 159 196 168 162 159 196 168 16 2 159 183 157 151 148 183 157 151 148 183 157 151 148 191 164 158 155 191 164 158 155 191 164 158 155 194 167 161 157 194 167 161 157 194 167 161 157 196 168 162 159 196 168 162 159 196 168 162 159 183 157 151
w. la 443 439 481 451 444 440 481 451 444 440 481 451 444 440 478 448 441 437 478 448 441 437 478 448 441 437 480 450 443 439 480 450 443 439 48 0 450 443 439 481 450 443 439 481 450 443 439 4 8 1 450 443 439 481 451 444 440 481 451 444 440 481 451 444 440 478 448 441
C"" , w.la
127 124 155 134 129 126 155 134 129 126 155 134 129 126 137 118 114 112 137 118 114 112 137 118 114 112 148 128 124 121 1U8 128 12 4 121 148 128 174 121 152 131 12 7 124 152 131 127 124 152 131 127 12 4 155 134 129 126 155 134 129 126 155 134 129 126 137 118 114

677
TABLE IV. 13—Cont inued
D w
165 165 165 165 165 165 165 165 165 165 165 165 165 165 165 165 165 165 165 16S 165 165 165 165 165 165 165 165 16 5 165 165 165 165 165 165 165 165 165 165 165 165 165 165 165 165
X13
* 4 4 4 k k k 4 it
24 21. 24 24 24 24 24 2k 2k 2t> 24 2k kk kk kk i» I* kk kk kk kk kk kk kk kk 6k 6lt 6l» 64 6li 6k 64 6U 61* 64 64 6k
X H
5 45 kS kS k5 85 85 85 85
5 5 5 5
1.5 45 kS kS 85 85 85 85
5 5 5 5
1.5 1*5 1.5 kS 85 85 85 85
5 5 5 5
U5 1*5 1.5 U5 85 85 85 85
X15
1 1 . 5 0 0 . 2 5 4 . 0 0 7 . 7 5
1 1 . 5 0 0 . 2 5 4 . 0 0 7 . 7 5
1 1 . 5 0 0 , 2 5 4 . 0 0 7 . 7 5
1 1 . 5 0 0 . 2 5 4 . 0 0 7 . 7 5
1 1 . 5 0 0 . 2 5 4 . 0 0 7 . 7 5
1 1 . 5 0 0 . 2 5 4 . 0 0 7 . 7 5
1 1 . 5 0 0 , 2 5 4 . 0 0 7 . 7 5
1 1 . 5 0 0 . 2 5 4 . 0 0 7 . 7 5
1 1 . 5 0 0 . 2 5 4 . 0 0 7 . 7 5
1 1 . 5 0 0 . 2 5 4 . 0 0 7 . 7 5
1 1 . 5 0 0 . 2 5 4 . 0 0 7 . 7 5
1 1 . 5 0
w.af
357 341 341 3 4 1 3 4 1 336 336 336 336 363 363 363 363 347 347 347 347 342 342 342 342 365 365 365 36 5 349 349 349 349 344 344 344 344 367 367 367 367 350 350 350 350 345 34 5 345 345
C"M r
w . a f
110 127 114 112 110 127 114 112 110 132 119 116 115 132 119 116 115 132 119 116 115 134 121 118 116 134 121 U S 116 134 121 118 116 135 122 119 117 135 12 2 119 117 135 122 119 117
C" w.as 564 518 518 518 518 506 506 506 506 570 570 570 570 524 524 524 524 512 512 512 512 572 572 572 572 527 527 527 527 514 514 514 514 574 574 5 74 574 528 528 528 528 515 515 515 515
C"" w . a s
148 183 157 151 148 183 157 151 148 191 164 158 155 191 164 158 155 191 164 158 155 194 167 161 157 194 167 161 157 194 167 161 157 196 168 162 159 196 168 162 159 196 168 162 159
C" . w . l a
437 478 448 441 437 478 448 441 437 480 450 443 439 480 450 443 439 480 450 443 439 481 450 443 439 481 l»50 443 439 481 450 443 439 481 451 444 440 481 451 444 44 0 481 451 444 440
C"" . w . l a
112 137 118 114 112 137 118 114 112 148 128 124 121 148 128 12 4 121 148 128 124 121 152 131 127 124 152 131 12 7 124 152 131 12 7 124 155 134 129 126 155 134 129 126 155 134 129 126

678
TABLE IV.14
ESTIMATED MEAN COST OF WASTEWATER TREATMENT PER MGD FOR SELECTED CONDITIONS (STABILIZATION LAGOON) IN 1000 U.S. DOLLARS
XX6
5 5 5 5 '
20 20 20 20 35 35 35 35 50 50 50 50 65 65 65 65 80 80 80 80 95 95 95 95
HO H O 110 110 125 125 125 125 H O 11*0 140 HO 155 155 155 155 170 170 170 170 185 185 185 185
X 2 0
0 . 2 5 3 . 5 0 6 . 7 5
1 0 . 0 0 0 . 2 5 3 . 5 0 6 . 7 5
1 0 . 0 0 0 . 2 5 3 . 5 0 6 . 7 5
1 0 . 0 0 0 . 2 5 3 . 5 0 6 . 7 5
1 0 . 0 0 0 . 2 5 3 . 5 0 6 . 7 5
1 0 . 0 0 0 . 2 5 3 . 5 0 6 . 7 5
1 0 . 0 0 0 . 2 5 3 . 5 0 6 . 7 5
1 0 . 0 0 0 . 2 5 3 . 5 0 6 . 7 5
1 0 . 0 0 0 . 2 5 3 . 5 0 6 . 7 5
1 0 . 0 0 0 . 2 5 3 . 5 0 6 . 7 5
1 0 . 0 0 0 . 2 5 3 . 5 0 6 . 7 5
1 0 . 0 0 0 . 2 5 3 . 5 0 6 . 7 5
1 0 . 0 0 0 . 2 5 3 . 5 0 6 . 7 5
1 0 . 0 0
C" , ww.af
55 55 55 55 52 52 52 52 50 50 SO 50 50 50 50 50 1*9 1*9 l»9 1*9 1*9 1*9 1*9 1*9 1*8 1*8 1*8 1*8 U8 1*8 1*8 1*8 1*8 1*8 1*8 1*8 1*7 47 47 47 U7 47 47 U7 47 1*7 47 1*7 U7 47 47 47
C"" B ww.af
6 5 5 5 4 3 3 3 3 3 3 3 3 3 3 3 3 3 2 2 3 2 2 2 3 2 2 2 2 2 2 2 2 2 2 2 2 2 2 2 2 2 2 2 2 2 2 2 2 2 2 2
C" ww. as
96 96 96 96 67 67 67 67 58 58 58 58 53 53 53 53 50 50 50 50 47 47 47 47 45 45 45 45 43 43 43 43 42 42 42 42 41 41 41 41 40 40 40 40 39 39 39 39 38 38 38 38
C"" ww. as
9 9 9 9 9 9 9 9 9 9 9 9 9 9 9 9 9 9 9 9 9 9 9 9 9 9 9 9 9 9 9 9 9 9 9 9 9 9 9 9 9 9 9 9 9 9 9 9 9 9 9 9
C" , ww.la
105 103 10 3 103 103 102 10 2 102 103 102 102 101 103 102 101 101 103 101 101 101 102 101 101 101 102 101 101 101 102 101 101 100 102 101 101 100 102 101 100 100 102 101 100 100 102 101 100 100 102 101 100 100
C " " , ww. la
9 9 9 9 7 7 7 7 6 6 6 6 6 6 6 6 5 5 5 5 5 5 5 5 5 5 5 5 5 5 5 5 5 5 5 5 5 4 4 4 4 4 4 4 4 4 4 4 4 4 4 4

679
TABLE IV. 14—Continued
,* x.ft c" . c M" . c" c M M c" , c"" . 16 20 ww.af vw.at ww.as ww.as ww.la ww.la 200 200 200 200 215 215 215 215 230 230 230 230 245 245 2lt5 2l»5
0 . 2 5 3 . 5 0 6 . 7 5
1 0 . 0 0 0 . 2 5 3 . 5 0 6 . 7 5
1 0 . 0 0 0 . 2 5 3 . 5 0 6 . 7 5
1 0 . 0 0 0 . 2 5 3 . 5 0 6 . 7 5
1 0 . 0 0
l»7 1*7 1*7 47 47 47 «»7 U7 >»6 1*6 46 46 1*6 46 1*6 l«6
2 2 2 2 2 2 2 2 2 2 2 2 2 2 2 2
37 37 37 37 36 36 36 36 36 36 36 36 35 35 35 35
9 9 9 9 9 9 9 9 9 9 9 9 9 9 9 9
102 100 100 100 102 100 100 100 102 100 100 100 101 100 100 100
4
u I*
u l» 1* 4 1* 4 It
u 4
u k
u 1*

680
TABLE IV.15
ESTIMATED MEAN COST OF WASTEWATER TREATMENT PER MGD FOR SELECTED CONDITIONS (AERATED LAGOON)' IN 1000 U.S. DOLLARS
X16
5 5 5 5 5 5 5 5 5 5 5 5 5 5 5 5 5 5 5 5
20 20 20 20 20 20 20 20 20 20 20 20 20 20 20 20 20 20 20 20 35 35 35 35 35 35 35 35 35 35 35 35 35 35 35 35 35 35
X20
0 . 2 5 0 . 2 5 0 . 2 5 0 . 2 5 0 . 2 5 3 . 5 0 3 . 5 0 3 . 5 0 3 . 5 0 3 . 5 0 6 . 7 5 6 . 7 5 6 . 7 5 6 . 7 5 6 . 7 5
1 0 . 0 0 1 0 . 0 0 1 0 . 0 0 1 0 . 0 0 1 0 . 0 0
0 . 2 5 0 . 2 5 0 . 2 5 0 . 2 5 0 . 2 5 3 . 5 0 3 . 5 0 3 . 5 0 3 . 5 0 3 . 5 0 6 . 7 5 6 . 7 5 6 . 7 5 6 . 7 5 6 . 7 5
1 0 . 0 0 1 0 . 0 0 1 0 . 0 0 1 0 . 0 0 1 0 . 0 0
0 . 2 5 0 . 2 5 0 . 2 5 0 . 2 5 0 . 2 5 3 . 5 0 3 . 5 0 3 . 5 0 3 . 5 0 3 . 5 0 6 . 7 5 6 . 7 5 6 . 7 5 6 . 7 5 6 . 7 5
1 0 . 0 0 1 0 . 0 0 1 0 . 0 0
X21
3 5 7 9
11 3 5 7 9
11 3 5 7 9
11 3 5 7 9
11 3 5 7 9
11 3 5 7 9
11 3 5 7 9
11 3 5 7 9
11 3 5 7 9
11 3 5 7 9
11 3 5 7 9
11 3 5 7
C" _ ww.af
155 155 155 155 155 112 112 112 112 112 104 104 104 104 104
99 99 99 99 99
154 154 154 154 154 112 112 112 112 112 103 103 103 103 103 98 98 98 98 98
154 154 154 154 154 112 112 112 112 112 103 103 103 103 103 98 98 98
C"" ww.af 65 65 65 65 65 31 31 31 31 31 25 25 25 25 25 23 23 23 23 23 65 65 65 65 65 31 31 31 31 31 25 25 25 25 25 23 23 23 23 23 65 65 65 65 65 31 31 31 31 31 25 25 25 25 25 23 23 23
C" ww. as
195 195 195 195 195 112 112 112 112 112
98 98 98 98 98 90 90 90 90 90
183 183 183 183 183 105 105 105 105 105
91 91 91 91 91 84 84 84 84 84
178 178 178 178 178 102 102 102 102 102
89 89 89 89 89 82 82 82
c"" ww. as
70 71 71 71 71 40 40 40 40 40 34 35 35 35 35 32 32 32 32 32 70 71 71 71 71 40 40 40 40 40 34 35 35 35 35 32 32 32 32 32 70 71 71 71 71 40 40 40 40 40 34 35 35 35 35 32 32 32
C" ww.la
284 284 284 284 284 184 184 184 184 184 165 165 165 165 165 155 155 155 155 155 284 284 284 284 284 184 184 184 184 184 16 5 165 165 165 165 155 155 155 155 155 284 284 284 284 284 184 184 184 184 184 165 165 165 16 5 165 155 155 155
pirn ww. la
93 93 93 93 93 35 35 35 35 35 28 28 28 28 28 24 24 24 24 24 93 93 93 93 93 35 35 35 35 35 28 28 28 28 28 24 24 24 24 24 93 93 93 93 93 35 35 35 35 35 28 28 28 28 28 24 24 24

681
TABLE IV.15—Continued
16 35 35 50 50 50 50 50 50 50 50 50 50 50 50 50 50 50 50 50 50 SO 50 65 65 65 65 65 65 65 65 65 65 65 65 65 65 65 65 65 65 65 65 80 80 80 80 80 80 80 80 80 80 80 80 80 80 80 80 80 80 80 80 95 95 95
20
1 0 . 0 0 1 0 . 0 0
0 . 2 5 0 , 2 5 0 , 2 5 0 . 2 5 0 . 2 5 3 . 5 0 3 . 5 0 3 . 5 0 3 . 5 0 3 . 5 0 6 .75 6 . 7 5 6 . 7 5 6 . 7 5 6 . 7 5
1 0 . 0 0 1 0 . 0 0 1 0 . 0 0 1 0 . 0 0 1 0 . 0 0
0 . 2 5 0 . 2 5 0 . 2 5 0 . 2 5 0 . 2 5 3 . 5 0 3 . 5 0 3 . 5 0 3 . 5 0 3 . 5 0 6 .75 6 . 7 5 6 . 7 5 6 . 7 5 6 . 7 5
1 0 . 0 0 1 0 . 0 0 1 0 . 0 0 1 0 . 0 0 1 0 . 0 0
0 . 2 5 0 . 2 5 0 . 2 5 0 . 2 5 0 . 2 5 3 . 5 0 3 . 5 0 3 . 5 0 3 . 5 0 3 . 5 0 6 . 7 5 6 . 7 5 6 . 7 5 6 . 7 5 6 . 7 5
1 0 . 0 0 1 0 . 0 0 1 0 . 0 0 1 0 . 0 0 1 0 . 0 0
0 . 2 5 0 . 2 5 0 . 2 5
hi 9
11 3 5 7 9
11 3 5 7 9
11 3 5 7 9
11 3 5 7 9
11 3 5 7 9
11 3 5 7 9
11 3 5 7 9
11 3 5 7 9
11 3 5 7 9
11 3 5 7 9
11 3 5 7 9
11 3 5 7 9
11 3 5 7
C" . ww. at
98 98
151* 151* 15U 15U 15U 112 112 112 112 112 103 103 103 103 103
98 98 98 98 98
15U 15U 15U 15b 15U 111 111 111 111 111 103 103 103 103 103
98 98 98 98 98
151* 15<t 1SU 151* 15U 111 111 111 111 111 103 103 103 103 103
98 98 98 98 98
153 153 153
ww. at
23 23 65 65 65 65 65 31 31 31 31 31 25 25 25 25 25 23 23 23 23 23 65 65 65 65 65 31 31 31 31 31 25 25 25 25 25 23 23 23 23 23 65 65 65 65 65 31 31 31 31 31 25 25 25 25 25 23 23 23 23 23 65 65 65
C" ww.as
82 82
175 175 175 175 175 100 100 100 100 100
88 88 88 88 88 81 81 81 81 81
173 173 173 173 173
99 99 99 99 99 86 86 86 86 86 80 80 80 80 80
171 171 171 171 171
98 98 98 98 98 86 86 86 86 86 79 79 79 79 79
170 170 170
C M H
ww.as
32 32 70 71 71 71 71 l»0 UO l»0 1*0 UO 3 * 35 35 35 35 32 32 32 32 32 70 71 71 71 71 UO UO UO UO UO 3U 35 35 35 35 32 32 32 32 32 70 71 71 71 71 UO UO UO UO UO 3U 35 35 35 35 32 32 32 32 32 70 71 71
ww. l a
155 155 28U 28U 28U 28 U 28U 18U 18U 18U 18U 18U 165 165 165 16 5 165 155 155 155 155 155 28 U 28U 28U 28U 28U 18 U 18U 18U 18U 18U 165 165 165 165 165 155 155 155 155 155 28U 28 U 28U 28U 28 U 18U 18U 18U 18U 18U 165 165 165 165 165 155 155 155 155 155 28U 28 U 28 U
ww. l a
2U 2U 93 93 93 93 93 35 35 35 35 35 28 28 28 28 28 2U 2U 2U 2U 2U 93 93 93 93 93 35 35 35 35 35 28 28 28 28 28 2U 2U 2U 2U 2U 93 93 93 93 93 35 35 35 35 35 28 28 28 28 28 2U 2U 2U 2U 2U 93 93 93

682
TABLE IV. 1 5 — C o n t i n u e d
X , 16
95 95 95 95 95 95 95 95 95 95 95 95 95 95 95 95 95
110 110 110 110 110 110 110 110 110 110 110 110 110 110 110 110 110 110 110 110
x„„ 20
0 . 2 5 0 . 2 5 3 . 5 0 3 . 5 0 3 . 5 0 3 . 5 0 3 . 5 0 6 . 7 5 6 . 7 5 6 . 7 5 6 . 7 5 6 . 7 5
1 0 . 0 0 1 0 . 0 0 1 0 . 0 0 1 0 . 0 0 1 0 . 0 0
0 . 2 5 0 . 2 5 0 . 2 5 0 . 2 5 0 . 2 5 3 . 5 0 3 . 5 0 3 . 5 0 3 . 5 0 3 .50 6 . 7 5 6 . 7 5 6 . 7 5 6 . 7 5 6 . 7 5
1 0 . 0 0 1 0 . 0 0 1 0 . 0 0 1 0 . 0 0 1 0 . 0 0
x,. 21
9 11
11
11
11
11
11
11
9 11
c" c ww.af
153 153 111 111 111 111 111 103 103 103 103 103 98 98 98 98 98
153 153 153 153 153 111 H I 111 111 111 103 103 103 103 103
98 98 98 98 98
C"" c ww.af
65 65 31 31 31 31 31 25 25 25 25 25 23 23 23 23 23 65 65 65 65 65 31 31 31 31 31 25 25 25 25 25 23 23 23 25 23
C" ww. as
170 170
97 97 97 97 97 85 85 85 85 85 78 78 78 78 78
169 169 169 169 169
97 97 97 97 97 84 81* 8U 8U 8U 78 78 73 78 78
c"" ww. as
71 71 1*0 UO U0 UO UO 3U 35 35 35 35 32 32 32 32 32 70 71 71 71 71 UO UO UO UO UO 3U 35 35 35 35 32 32 32 52 32
C" , ww. l a
28 U 28 U 18 U 18 U 18U 18U 18 U 16 5 165 16 5 16 5 165 155 155 155 155 155 28U 28U 28U 28U 28U 18U 18U 18U 18U 18U 16 5 165 16 5 165 165 155 155 155 155 155
C M " , ww. la
93 93 35 35 35 35 35 28 28 28 28 28 2U 2U 2U 2U 2U 93 93 93 93 93 35 35 35 35 35 28 28 28 28 28 2U 2U 2U 2k 2k

683
TABLE IV.16
ESTIMATED MEAN COST OF WASTEWATER TREATMENT PER MGD FOR SELECTED CONDITIONS (ACTIVATED SLUDGE) IN 1000 U.S. DOLLARS
16 20 21 ww.at ww.af ww.as ww.aa ww.la ww.la
5 5 5 5 5 5 5 5 5 5 5 5 5 5 5 5 5 5 5 5 20 20 20 20 20 20 20 20 20 20 20 20 20 20 20 20 20 20 20 20 35 35 35 35 35 35 35 35 35 35 35 35 35 35 35 35 35 35 35 35 50
0.25 0.25 0.25 0.25 0.25 3.50 3.50 3.50 3.50 3.50 6.75 6.75 6.75 6.75 6.75
10.00 10.00 10.00 10.00 10.00 0.25 0.25 0.25 0.25 0.25 3.50 3.50 3.50 3.50 3.50 6.75 6.75 6.75 6.75 6.75
10.00 10.00 10.00 10.00 10.00 0.25 0.25 0.25 0.25 0.25 3.50 3.50 3.50 3.50 3.50 6.75 6.75 6.75 6.75 6.75
10.00 10.00 10.00 10.00 10.00 0.25
3 5 7 9 11 3 5 7 9 11 3 5 7 9 11 3 5 7 9 11 3 5 7 9 11 3 5 7 9 11 3 5 7 9 11 3 5 7 9 11 3 5 7 9 11 3 5 7 9 11 3 5 7 9 11 3 5 7 9 11 3
1110 1111 1111 1112 1113 500 501 501 501 501 l»10 (til fell fell •ill 36fe 365 365 365 365
1110 1111 1111 1112 1113 500 501 501 501 501 U10 Ull fell fell fell 36fe 365 365 365 365
1110 1111 1111 1112 1113 500 501 501 501 501 felO fell fell fell fell 36fe 365 365 365 365
1110
268 26 8 268 268 268 110 110 110 110 110 89 89 89 89 89 78 78 78 78 78 268 268 268 268 268 110 110 110 110 110 89 89 89 89 89 78 78 78 78 78 268 268 268 268 268 110 110 110 110 110 89 89 89 89 89 78 78 78 78 78
268
277 317 3fe7 370 391 277 317 3fe7 370 391 277 317 3fe7 370 391 277 317 3fe7 370 391 192 220 2fe0 257 271 192 220 2fe0 257 271 19 2 220 2fe0 257 271 192 220 2fe0 257 271 166 190 207 221 233 166 190 207 221 233 166 190 207 221 233 166 190 207 221 233 151
88 88 89 89 89 88 88 89 89 89 88 88 89 89 89 88 88 89 89 89 60 60 60 60 60 60 60 60 60 60 60 60 60 60 60 60 60 60 60 60 52 52 52 52 52 52 52 52 52 52 52 52 52 52 52 52 52 52 52 52 fe7
2358 2358 2358 2358 2358 918 918 918 918 918 726 726 726 726 726 631 631 631 631 631
23fe6 23fe6 23fe6 23fe6 23fe6 913 913 913 913 913 722 722 722 722 722 627 627 627 627 627
23fe2 23fe2 23fe2 23fe2 23fe2 912 912 912 912 912 721 721 721 721 721 626 626 626 6 26 626
2339
fe63 fe63 fe63 fe63 fe63 165 16 5 165 16 5 16 5 128 128 128 128 128 110 110 110 110 110 U58 U58 U58 1(58 1*58 163 163 163 163 163 127 127 127 127 12 7 109 109 109 109 109 1*56 1*56 fe56 fe56 1*56 163 163 163 163 163 12 6 126 126 126 126 108 108 108 108 108 fe55

684
TABLE I V . 1 6 — C o n t i n u e d
X16
50 50 50 50 50 50 50 50 50 50 50 50 50 50 50 50 50 50 50 65 65 65 65 65 65 65 65 65 65 65 65 65 65 65 65 65 65 65 65 80 80 80 80 80 80 80 80 80 80 80 80 80 80 80 80 80 80 80 80 95 95 95 95 95 95 95
X20
0 . 2 5 0 . 2 5 0 . 2 5 0 . 2 5 3 . 5 0 3 . 5 0 3 . 5 0 3 . 5 0 3 . 5 0 6 . 7 5 6 , 7 5 , 6 . 7 5 6 . 7 5 6 . 7 5
1 0 . 0 0 1 0 . 0 0 1 0 . 0 0 1 0 . 0 0 1 0 . 0 0
0 . 2 5 0 . 2 5 0 . 2 5 0 . 2 5 0 . 2 5 3 . 5 0 3 . 5 0 3 . 5 0 3 . 5 0 3 . 5 0 6 . 7 5 6 . 7 5 6 . 7 5 6 . 7 5 6 . 7 5
1 0 . 0 0 1 0 . 0 0 1 0 . 0 0 1 0 . 0 0 1 0 . 0 0
0 . 2 5 0 . 2 5 0 . 2 5 0 . 2 5 0 . 2 5 3 . 5 0 3 . 5 0 3 . 5 0 3 . 5 0 3 . 5 0 6 . 7 5 6 . 7 5 6 . 7 5 6 . 7 5 6 . 7 5
1 0 . 0 0 1 0 . 0 0 1 0 . 0 0 1 0 . 0 0 1 0 . 0 0
0 . 2 5 0 . 2 5 0 . 2 5 0 . 2 5 0 . 2 5 3 . 5 0 3 . 5 0
X21
5 7 9
11 3 5 7 9
11 3 5 7 9
11 3 5 7 9
11 3 5 7 9
11 3 5 7 9
11 3 5 7 9
11 3 5 7 9
11 3 5 7 9
11 3 5 7 9
11 3 5 7 9
11 3 5 7 9
11 3 5 7 9
11 3 5
C" , ww.af
1111 1111 1112 1113
500 501 501 501 501 1*10 M l <tll U l l M l 364 365 365 365 365
1110 1111 1111 1112 1113
500 501 501 501 501 410 !»11 411 411 Ul l 364 365 365 365 365
1110 1111 1111 1112 1113
500 501 501 501 501 1*10 411 411 411 411 364 365 365 365 365
1110 1111 1111 1112 1113 500 501
ww.af
268 268 268 268 110 110 110 110 110
89 89 89 89 89 78 78 78 78 78
268 268 268 268 268 110 110 110 110 110
89 89 89 89 89 78 78 78 78 78
268 268 268 268 268 110 110 110 110 110
89 89 89 89 89 78 78 78 78 78
268 268 268 268 268 110 110
c" ww.as 172 189 201 212 151 172 189 201 212 151 172 189 201 212 151 172 189 201 212 141 161 176 188 198 141 161 176 188 198 141 161 176 188 198 141 161 176 188 198 133 152 166 178 188 133 152 166 178 188 133 152 166 178 188 133 152 166 178 188 127 146 159 170 179 127 146
C I I N
ww.as
47 47 47 47 47 47 47 47 47 47 47 47 47 47 47 47 47 47 47 44 44 44 44 44 44 44 44 44 44 44 44 44 44 44 44 44 44 44 44 41 41 41 41 41 41 41 41 41 41 41 41 41 41 41 41 41 41 41 41 39 39 39 39 39 39 39
C" . ww. la
2339 2339 2339 2339
910 910 910 910 910 720 720 720 720 720 625 625 625 625 625
2336 2336 2336 2336 2336
910 910 910 910 910 719 719 719 719 719 625 625 625 625 625
2335 2335 2335 2335 2335
909 909 909 909 909 719 719 719 719 719 6 24 624 624 624 624
2333 2333 2333 2333 2333
908 908
c,„, ww. la 455 455 455 455 162 162 162 162 162 126 126 126 126 126 108 108 108 108 108 454 454 454 454 454 16 2 16 2 162 16 2 16 2 125 125 125 125 125 108 108 1GS 108 108 453 453 453 453 453 162 162 162 162 16 2 125 12 5 125 125 125 107 107 107 107 107 453 453 453 453 453 162 162

685
TABLE IV. 1 6 — C o n t i n u e d
X16
95 95 95 95 95 95 95 95 95 95 95 95 95
110 110 110 110 110 110 110 110 110 110 110 110 110 110 110 110 110 110 110 110
20
3.50 3.50 3.50 6.75 6.75 6.75 6.75 6.75
10,00 10.00 10.00 10.00 10.00
0,25 0.25 0.25 0.25 0.25 3.50 3.50 3.50 3.50 3.50 6.75 6.75 6.75 6.75 6.75
10.00 10.00 10.00 10.00 10.00
X 21
11
11
11
11
11
11
9 11
C" . ww.af
501 501 501 ItlO U l l U l l U l l U l l 36U 365 365 365 365
1110 1111 1111 1112 1113
500 501 501 501 501 U10 U l l U l l U l l U l l 36U 365 365 365 365
c„„ ww.af
110 110 110
89 89 89 89 89 78 78 78 78 78
268 268 268 268 268 110 110 110 110 110
89 89 89 89 89 78 78 78 78 78
C" WW.88
159 170 179 127 1U6 159 170 179 127 1U6 159 170 179 122 1U0 153 16U 172 122 1U0 153 16U 172 12 2 1U0 153 16 U 172 122 1U0 153 16 U 172
c , ,n
ww. a s 39 39 39 39 39 39 39 39 39 39 39 39 39 38 38 38 38 38 38 38 38 38 38 38 38 38 38 38 38 38 38 38 38
w w . l a
908 908 908 718 718 718 718 718 62U 62U 62U 62U 62U
2332 2332 2332 2332 2332
908 908 908 908 908 718 718 718 718 718 62U 62U 62U 62U 62U
C , ,M . ww. l a
162 162 162 125 125 125 125 125 107 107 107 107 107 U52 U52 U52 U52 U52 161 161 101 161 161 125 125 125 125 125 107 107 107 107 107

TABLE IV.17
ESTIMATED MEAN COST OF WASTEWATER TREATMENT PER MGD FOR SELECTED CONDITIONS (TRICKLING FILTER) IN 1000 U.S. DOLLARS
X16
5 5 5 5 5 5 5 5 5 5 5 5 5 5 5 5 5 5 5 5
20 20 20 20 20 20 20 20 20 20 20 20 20 20 20 20 20 20 20 20 35 35 35 35 35 35 35 35 35 35 35 35 35 35 35 35 35 35 35
X20
0.25 0.25 0.25 0.25 0.25 3.50 3.50 3.50 3.50 3.50 6.75 6.75 6.75 6.75 6.75 10.00 10.00 10.00 10.00 10.00 0.25 0.25 0.25 0.25 0.25 3.50 3.50 3.50 3.50 3.50 6.75 6.75 6.75 6.75 6.75
10.00 10.00 10.00 10.00 10,00 0.25 0.25 0.25 0.25 0.25 3.50 3.50 3.50 3.50 3.50 6.75 6.75 6.75 6.75 6.75 10.00 10.00 10.00 10.00
X21
3 5 7 9 11 3 5 7 9 11 3 5 7 9 11 3 5 7 9 11 3 5 7 9 11 3 5 7 9 11 3 5 7 9 11 3 5 7 9 11 3 5 7 9 11 3 5 7 9 11 3 5 7 9 11 3 5 7 9
C" . ww.af
299 S 2990 2990 2990 2990 700 700 700 700 700 1*87 1*87 U87 U87 U87 393 393 393 393 393
2990 2990 2990 2990 2990 700 700 700 700 700 1*87 1*87 487 l»87 i»87 393 393 393 393 393
2990 2990 2990 2990 2990 700 700 700 700 700 U87 U87 1*87 U87 487 393 393 393 393
c.t„ ww.af
268 269 269 269 269 111 111 111 111 111 89 89 89 89 89 78 78 78 78 78 268 269 269 269 269
89 89 89 89 89 78 78 78 78 78 268 269 269 269 269 111 111 111 111 111 89 89 89 89 89 78 78 78 78
C" ww. as
2532 2532 2532 2532 2532 561 561 561 561 561 386 386 386 386 386 308 308 308 308 308
2532 2532 2532 2532 2532 561 561 561 561 561 386 386 386 386 386 308 308 308 308 308
2532 2532 2532 2532 2532 561 561 561 561 561 386 386 386 386 386 308 308 308 308
c , , M
ww. as 128 130 131 131 132 128 130 131 131 132 128 130 131 131 132 128 130 131 131 132 89 90 90 91 91 89 90 90 91 91 89 90 90 91 91 89 90 90 91 91 76 77 78 78 79 76 77 78 78 79 76 77 78 78 79 76 77 78 78
C" , ww.la 1706 1706 1706 1706 1706 715 715 715 715 715 576 576 576 576 576 506 506 506 506 506
1706 1706 1706 1706 1706 715 715 715 715 715 576 576 576 576 576 506 506 506 506 506
1706 1706 1706 1706 1706 715 715 715 715 715 576 576 576 576 5 76 506 506 506 506
C.M.
ww.la 593 59 3 593 59 3 593 272 272 272 272 272 221* 22U 22U 221* 221* 199 199 199 199 199 59 3 593 59 3 593 593 272 272 272 272 272 22<» 221* 221* 221* 221* 199 199 199 199 199 593 593 593 59 3 593 272 272 272 272 272 22U 22U 221* 224 221* 199 199 199 199

687
TABLE IV. 1 7 — C o n t i n u e d
X16
35 50 50 SO 50 50 50 50 50 50 50 50 50 50 50 50 50 50 50 50 50 65 65 65 65 65 65 65 65 65 65 65 65 65 65 65 65 65 65 65 65 80 80 80 80 80 80 80 80 80 80 80 80 80 80 80 80 80 80 80 60 95 95 95 95
X20
1 0 . 0 0 0 . 2 5 0 . 2 5 0 . 2 5 0 . 2 5 0 . 2 5 3 . 5 0 3 . 5 0 3 . 5 0 3 . 5 0 3 . 5 0 6 . 7 5 6 . 7 5 6 . 7 5 6 . 7 5 6 . 7 5
1 0 . 0 0 1 0 . 0 0 1 0 . 0 0 1 0 . 0 0 1 0 . 0 0
0 . 2 5 0 . 2 5 0 . 2 5 0 . 2 5 0 . 2 5 3 . 5 0 3 . 5 0 3 . 5 0 3 . 5 0 3 . 5 0 6 . 7 5 6 . 7 5 6 . 7 5 6 . 7 5 6 . 7 5
1 0 . 0 0 1 0 . 0 0 1 0 . 0 0 1 0 . 0 0 1 0 . 0 0
0 . 2 5 0 . 2 5 0 . 2 5 0 . 2 5 0 . 2 5 3 . 5 0 3 . 5 0 3 . 5 0 3 . 5 0 3 . 5 0 6 . 7 5 6 . 7 5 6 . 7 5 6 . 7 5 6 . 7 5
1 0 . 0 0 1 0 . 0 0 1 0 . 0 0 1 0 . 0 0 1 0 . 0 0
0 . 2 5 0 . 2 5 0 . 2 5 0 . 2 5
hi 11
3 5 7 9
11 3 5 7 9
11 3 5 7 9
11 3 5 7 9
11 3 5 7 9
11 3 5 7 9
11 3 5 7 9
11 3 5 7 9
11 3 5 7 9
11 3 5 7 9
11 3 5 7 9
11 3 5 7 9
11 3 5 7 9
vw.af
393 2990 2990 2990 2990 2990
700 700 700 700 700 l»87 l»87 l»87 487 487 393 393 393 393 393
2990 2990 2990 2990 2990
700 700 700 700 700 487 487 487 487 U87 393 393 393 393 393
2990 2990 2990 2990 2990
700 700 700 700 700 487 487 1*87 487 1*8 7 393 393 393 393 393
2990 2990 2990 2990
WW.
78 268 269 269 269 269 111 111 111 111 111
89 89 89 89 89 78 78 78 78 78
268 269 269 269 269 111 111 111 111 111
89 89 *9 89 89 78 78 78 78 78
268 269 269 269 269 111 111 111 111 111
89 89 89 89 89 78 78 78 78 78
268 269 269 269
- CM
af ww.as
308 2532 2532 2532 2532 2532
561 561 561 561 561 386 386 386 386 386 308 308 308 308 308
2532 2532 2532 2532 2532
561 561 561 561 561 386 386 386 386 386 308 308 308 308 308
2532 2532 2532 2532 2532
561 561 561 561 561 386 386 386 386 386 308 308 308 308 308
2532 2532 2532 2532
c"" WW.
79 70 70 71 71 72 70 70 71 71 72 70 70 71 71 72 70 70 71 71 72 65 66 66 66 67 65 66 66 66 67 65 66 66 66 67 65 66 66 66 67 61 62 63 63 63 61 62 63 63 63 61 62 63 63 63 61 62 63 63 63 59 59 60 60
C" . as ww.la
506 1706 1706 1706 1706 1706
715 715 715 715 715 576 576 576 576 576 506 506 506 506 506
1706 1706 1706 1706 1706
715 715 715 715 715 576 576 576 576 576 506 506 506 506 506
1706 1706 1706 1706 1706
715 715 715 715 715 576 576 576 576 576 506 506 506 506 506
1706 1706 1706 1706
ww. la
199 593 593 593 593 593 272 272 272 272 272 224 22l» 224 224 224 199 199 199 199 199 593 593 593 593 593 272 272 272 272 272 22<t 224 224 224 224 199 199 199 199 199 593 593 593 593 593 272 272 272 272 27 2 224 224 224 22l» 224 199 199 199 199 199 593 593 593 593

688
TABLE IV. 17—Cont inued
V 95 95 95 95 95 95 95 95 95 95 95 95 95 95 95 95
110 110 110 110 110 110 110 110 110 110 110 110 110 110 110 110 110 110 110 11C
X20
0 . 2 5 3 . 5 0 3 . 5 0 3.50 3.50 3.50 6.75 6.75 6.75 6.75 6.75
10.00 10.00 10.00 10.00 10.00
0.25 0.25 0.25 0.25 0.25 3.50 3.50 3.50 3.50 3.50 6.75 6.75 6.75 6.75 6.75
10.00 10.00 10.00 10.00 1 U « U U
V. 11
3 5 7 9
11 3 5 7 9
11 3 5 7 9
11 3 5 7 9
11 3 5 7 9
11 3 5 7 9
11 3 5 7 9
11
C" . . ww. a t
2990 700 700 700 700 700 l»87 l»8 7 l»8 7 l»87 487 393 393 393 393 393
2990 2990 2990 2990 299 0
700 700 700 700 700 1*8 7 487 1*87 1*87 1*87 393 393 393 393 3S3
c"" ww.af
269
89 89 89 89 89 78 78 78 78 78
268 269 269 269 269 111 111 111 111 111
89 89 89 89 89 78 78 78 78 78
C" ww. as
2532 561 561 561 561 561 386 386 386 386 386 308 308 308 308 308
2532 2532 2532 2532 2532
5 6 1 561 561 561 5 6 1 386 386 386 386 386 308 308 308 308 308
C I I H
ww.as
60 59 59 60 60 60 59 59 60 60 60 59 59 60 60 60 56 57 57 58 58 56 57 57 58 58 56 57 57 58 58 56 57 57 58 58
C" . ww. l a
1706 715 715 715 715 715 576 576 576 576 576 506 506 506 506 506
1706 1706 1706 1706 1706
715 715 715 715 715 576 576 576 576 576 506 506 506 506 506
ww. l a
593 272 272 272 272 272 " 22U 22i» 221* 221* 22U 199 199 199 199 199 593 593 593 593 593 272 272 272 272 272 221* 221* 22U 22U 22IJ 199 199 199 199 199

APPENDIX (CHAPTER V).
The four questionnaires presented in the following pages were
used in obtaining data for the development and testing of the model for
establishing priorities among water supply programs.
(A) Village Water Supply Project Planning Data Sheet,
(B) Tabulation at Kecamatan Level of Village Water Supply and Sanitation Projects; Data Collection for Planning,
(C) Tabulation at Kabupaten Level of Village Water Supply and Sanitation Projects; Data Collection for Planning,
(Part I) Rural Water Supply and Sanitation Data Sheet.

690
QUESTIONNAIRE A
VILLAGE WATER SUPPLY PROJECT PLANNING DATA SHEET
Note .
- This form is to be completed by sanitarians at the Ke-camatan Level or Health Center personnel.
- Check the appropriate blank.
- To be filled out through direct observation of the clusters within the village.
A. 1. Provihc e
Kabupaten
Kecamatan
A. 2. Name of Village,
Number of houses
Number of people
A. 3. How do the villagers get water?
Note.
- Unprotected water sources with piped systems; the use of bamboo is an unprotected piped system.
- Evaluation is based oh general conditions.
- A map which indicates the number of water sources and their locations is usually available at the Health

691
Center. If there is no map, the locations of water sources should be estimated by general investigation of the village and consultation with the community leaders.
A. 3.1. With piped system.
1. Unprotected:
Sources
Springs
Rivers
Others
Systems
Gravity
Pumping
Population served by unprotected system
2. Protected:
Source
Springs
Artesian wells
Sys tem
Gravity
Pumping
Rivers with treatment
Others
Pipes
G.lt
2 PVC
Asbes tos
Bamboo
Pipe
G.I
2 PVC
Asbestos
Population served by protected system
A. 3.2. Without piped system,
1. Unprotected:
Sources
Wells
Springs
Number of Population sources served
1 2 Galvanized Iron; Polyvinyl Chloride.

692
Sources Number of Population sources served
Rivers/Irriga-
tion canals
Lakes
Rain water
collections
Total population served
2. Protected:
Sources Number of Population sources served
Shallow hand-
pumps
Deep handpumps
Spring pro tec-tions Free-flowing artesian wells
Rain water collections
Total population served
A. 3.3. Summary of all systems
Unprotected Protected Total
Population served by piped systems
Population served by other systems
Total population served by all systems
A. A. Are the existing sources becoming dry?
Yes No
Wells/Ground water

693
Yes No
Springs
Rivers/Surface water
How are the physical and chemical characteristics of water currently used?
Ground Springs Surface water water
Good: Clear
Poor: Salty
Contains iron
Hard
Turbid
Distances between water source and communities.
Less than 200 meters.
Between 200 and 1,000 meters.
More than 1,000 meters.
Villagers must climb or descend to get to water source.
No.
Less than 150 meters.
More than 150 meters.
The depth of ground water to ground level.
Less than 7 meters.
Between 7 to 15 meters.
More than 15 meters.

694
A. 9. General topographical conditions.
Mountainous.
Rocky.
Flat.
A. 10. Does the community need an improved water supply system?
No.
Yes, because:
The water quality is poor.
The water source is too far.
A.11.
Villagers must climb/descend to get to the water source.
The capacity of the water source is not sufficient.
The villagers are aware that the water source is polluted and have required an improved water system for their health.
If the water supply is to be installed, the communities
Yes No
Are willing to contribute to the construction cost.
Are willing to contribute to the operation and maintenance costs.
A.12. Suggested water supply system to improve the existing
system.
Note.
- In making suggestions the opinions of the community and its leader should be taken into account.
- A suggested system is determined in the field.

695
- The water supply system is divided into four groups. Group I is considered to be more economical, practical and simple, in other words, Group I is of a higher priority than Groups II, III and IV, and Group II is higher priority than Groups III and IV, and so on.
- Choose the best alternative for every cluster of the village according to their priority ranking.
- The suggested system should be discussed with the Health Center Officer and the Kabupaten Public Works.
A.12.1. The suggested water supply system for this village is:
Number of Population projects served
Group I. Gravitational Piped system.
Spring protection. The capacity of the spring must be at least 1 liter/second per 1,000 people, a good water quality, and an elevation higher than the community.
Group III. Piped system with pump.
Spring protection. The capacity of the spring must be at least 1 liter/second per 700 people, a good water quality, and an elevation lower than the community.
Artesian wells. Where artesian wells exis t.
Surface water treatment. There is a river or an irrigation canal which never dries.

696
Number of Pop. projects served
Group II. Source protection without piped system.
Spring protection. . There is a spring close to the community.
Free-flowing well. . There is at least one free-flowing well in use in this area and it is possible to build some artesian wells. One well is designed for 400 to 500 people.
Wells with shallow hand-pumps. The ground water table is not more than 7 meters below ground level, a good water quality, and one well for every IOC people.
Wells with deep handpumps. The ground water table is more than 7 meters below ground level, but not more than 15 meters all year round, a good water quality, and one well for every 100 people.
Group IV.
Rain water collection. The only water source a-vailable in this area and presently the community is using it. One collection basin for every 100 people.
Total
* Tota\ designed population from Groups I, II, III and IV.

A.12.2. Summary of Population.
- Population to be served with safe water.
- Population can not be designed because a more detailed survey is required.
- Population does not need water because it has a protected system.
Total
A.13. Do the villagers use household latrines?
Estimate the percentage of houses using individual latrines (with or without water seals).
Number of houses in the village.
Number of houses using latrines.
Number of people using latrines (based on average number of residents per family).
Number of people not using household latrines .
Name of Surveyor:
Date of survey :

QUESTIONNAIRE B
VILLAGE WATER SUPPLY AND SANITATION PROJECTS DATA COLLECTION FOR PLANNING TABULATION AT KECAMATAN LEVEL
Note: Write the names of villages in the same order.
1. Province
Kabupaten
Kecama tan
2. Number of villages in Kecamatan
Number of families in Kecamatan
Number of people in Kecamatan
TABLE B. 2.
NUMBER OF FAMILIES AND PEOPLE IN EACH SURVEYED VILLAGE
Village
Total
Number of Families Number of People

699
• i H
• n
« « W •J PQ
< H
s-^
t-i
• en
• < < 4 - l
O
>. u CO 6 e 3 en ^ » •
ANK
•J PQ
W H < M pi P-< O Pi a. P-. < w ac H
CHECK
Unprotected
Protected
3 U T S Q
Pipes
Sys ter
ns
Water
sources
u o p B - [ n d o , j
s o } s a q s y
• O ' A ' d
• 1 * 0
s d m n j
/LljA-eio
s j a q ^ o
; u 9 D H B 3 a j l a a B f t J9ATH
S I I 3 M u o f s a u y
s 8 u i j d s
8uTSfl u o j ^ B x n d o j
Pipes
Systems
Water
sources
ooquiBg
s o ^ s a q s y
• O ' A ' d
'I'D
sdmn,j
X a i A B j g
s j a q a o
SJ3ATtf
s 8 u x j d s
Village
Total

700
CM
• CO
• m
w .J « < H
/~N
• CM •
CO
• «*
e o u Pn N-^
PROPRIATE BLANK
P* <;
W EC H
» M
« w m
THE NUM
1-3 M
Protected
Systems
Unprotected Systems
Population
Using
Number
of Sources SUOX }03X~[O0
aa^BAUTBy
-AOXJ-33Ii
s u o p o a ?
-old 8uxids
sdiun dpuBq
q3x« sxx^M
Population
Using
Number of Sources suoT3oaxx° 3
aaaBwuxBy
sa^Bi
SJBUBO uoT5B2ja
s8uxjds
sxxatt
Village
Total

701
n • • co
co . CO
< W
« o <: u
<:
w H <: M Pt5 PL, o OS PM Pu
< W SB H
Pi W PQ
w W H
•J
• 3 <U 4J
u 4-1
o l-l
PH
c o
3 P. o
P-)
< 4 - l
o
e e 3
CO
cu 4-1
o cu 4J
o u p. c
s r aa^sXs 3H5 j o I I B 8 u x s n u o p
suta^ sXs aaq t jo S u x s n
sma;sXs padjd Suf sn u o p e p d o , !
sma 3sKs 3M5 jo XTB 3uTsn u o p
-Bxndod XB:*ox
sma^sAs 191130 SuTSn a o T 3 B x n d o ,j
stna^SiCs p a d x d S u x s n
u o ^ ; B ' [ n d o l j
01 00 u
o H

702
TABLE B. 4 (From A. 4.)
CHECK THE APPROPRIATE BLANK
Villages
Total
Water Sources which are running dry
Dry Not Dry
01
3
c l-l a.
to
•H to U C U CO
M O
0) C M O 0) - H > -W
i-l to »i to
0) 60 C
•H
a t o
•H « H C M «)
M O
ai C M O 0) -H > J->
•H a) pi oo

703
pq <
W • J 8 pa u < o H ^
55 < pa
w < M Pk
o
< w H
w 33 O
Ss 4-1 TH
CO 3
u 4J CO
ater
<u o
«H
/Sur
vers
•H PS
CO 00
c •H
c/>
t-i
wate
C
Groi
3 ^
9 1
3 5
lllage
>
p i q ^ n i
pjtBH
S U I B J U O Q
^ T ^ S
a e a x o
PTq^n i
paBH
S U T B 3 U O Q
^ T ^ S
a e a x o
p j q ^ n x
p j B f l
s u x e ^ u o o
^ T * S
J B 3 I D
Total

704
CHECK THE APPROPRIATE BLANK
TABLE B. 6. (From A. 6.) B. 7. (From A. 7.)
Village
Distances
to c u 03 CD
JS *J 4-t 0)
e to <o o (U O
. J <M
o o r-i
c ~o a> c <u to 5 •u o Q) O
« CM
(0
u CD 4J 0)
e
c co x: * J
(U
u o
co J* <u 4J
<u e o o o
M
Climbing/Descending
CD c o z
c CO
X 4-1
CO tfl ID
J
CO
U <u 4-1
CD
a o i n i-H
CO
c ^ CO 01
. e 4J 4J O
e u o o tn
T o t a l

705
CHECK THE APPROPRIATE BLANK
TABLE B. 8 (From Health Center or Kabu- B. paten Health Service)
9 (From A.8.)
Village
Waterborne disease incidence
at u <u
l - t o
J= u
I a) <u 4-1 03 c m <u <u I 03 O T H
u *a 03 O (0 -H
T o t a l
o x\ H
CO
e o
J= a a» u H
a) C 03
•H tfl ^ 0) C/3 0)
G r o u n d w a t e r
c m
CO 1 )
co E
•J r-
in C .H 0) <D X)
3 C 4-1 CO CD
c CO
X-4-1
CD 1 4
o m

706
a o u
C*
rt
Funds provided by
the communities
33SOD 3DUBU
S3SOO UOT5
•
55 < •J rt /-N
o W iH H «$ M <i Ui PL.
o P=! P-. OH
w OS
w
o
«
Community needs
sm3xqoa<j q3XeaH 05 a n a - s a x
8 u i p u 9 3 s a p / 3 u x q n i x x a
03 a n a - s a x
J33BA 8ux: j : j a3 ux ^ X n a J J i I P
on a n a - s a x
ArjxxBnb j a ^ B f t l o o d
o i a n a - s a x
°N
o\
e o u
o t-t
w • J «
Geographical
conditions 3*1.1
X ^ D O H
s n o u x e r j u n o w
Village
Total

707
oo
pa
e o u fa
o z M
n Pi o u u < w *o o w pa <; • J O e i J Z O M •< >J > fa
O ^ <: w -
fa J3
o ^
•< cd «n • 4 ^
pa
w en
< w M . J PS pa Pi O o a PS P-. fa PH en •< H
M w 33 O H H
hJ . J
PQ
e o
fa
pa
6 o M fa
W
pa
H
(d) Classification
One or more
diseases present
(c)
Classification
Difficulty in get
ting
water; the
source is more
than 1,000 m or
climbing/descend
ing more than 150m
(b)
Classification
Water quality is
poor, salty, hard
or turbid
(a) Classification
Ground water run
ning dry
Village
Total

708
•vj- •
r-i <
m c w .-) • pq co < -H H
6 o
z o M H <
CO CO < u w <
o CO
w H CO
>> CO
>< •J p-l en
CO
w H <
fa O
H 23 W
w > o Pi (X,
s M
Pi o fa CO Z O M CO
w u CO
p a A a a s u f i uo p ^ B x n d o d I P 3 0 X
P 3 M 3 S u o p e p d o a T B 3 0 X
CO
6 a) 4J
CO
>> CO
> r-H
a p. 3 CO
M a) 4-1
to S
o
4-1
c 6 0)
> o (-1
a e
• H
1-1 Q
4-1
CO
c o • H 4J
CO
Q)
60 00 3
CO
CO
s 4-1
CO
>> GO
T 3
1)
pu
1 M M 4J
4) CU CO 4J
> 4 J 0J C
• H CO )-i 0 ) ni J * J e
1 CO
4 1 O H
K -H m < w 5
M
0 0
c •w 1-1
p. CO
1 1 CO CO i H C
5 o o O i - l
C 4 J • H M O
CO 0 ) 0) K U H
OC
C 1 - H CO HI 3 H
<1> O >- l V4 i H (U
fa U-l U
| oc a r j rtl rg
• H 4-> C u o o p. U -H
CO P . 4-1
x: 4-1 CO • H P .
S 6 3
CO P .
r H T 3
<U CO
& J =
co P. CX « e a) 3 Q a
> o
t - H CO
r-l a CO 6 XI 3 co a.
P. o
o z
a. o P-.
o z
p .
o fa
o z
CU
o fa
o z
( X
o fa
o z p. o
(X.
o z P. o fa
o z
P. o fa
o z
<u 00 a
i - i r - l
• H
>
UO T 3 B O T J T S S B X 0 3 3 B X I B T A
r H
CO 4 J
O H
CO
e V
4J (fl
>s CO
«W
o
u <u
XV
e 3 z
CO
e at 4-1
CO
> • »
CO
<u x\ 4J
oo c
• H
in 3
c o
• H
4J
n> r - l
3 a. o p->
p. o> o z (!<
0)'
o Z

709
S~\
• • CM
m iH •
CM • f-l
PQ
• W •<
•J « 6 < o H P
Cx, v-/
5C O !=> o Pi SB t-
• CM
• 03
CK
O
>H
Pi -< X X C3
co
Total popu
lation
in
villages
Population
using
pro
tected
sys
tems
Population
using
unpro
tected
sys
tems
Number
of
uncovered
population
Number
of
designed
population
Village
Total
710
TABLE B. 16 (From A. 13)
^FAMILIES AND PEOPLE USING HOUSEHOLD LATRINES
Village •Number of families using la-'trines
Number 'of people 1 a t r i n e s

711
QUESTIONNAIRE C
VILLAGE WATER SUPPLY AND SANITATION PROJECTS DATA COLLECTION FOR PLANNING TABULATION AT KABUPATEN LEVEL
(Note: Write down all names of Kecamatans in the same order)
C.l. Province :
Kabupaten :
C.2. At Kabupaten Level
Surveyed Kecamatans Number of villages Population
C.3. Piped systems
Protected Unprotected
C.3.1. Population using piped systems
Villages using piped systems
Breakdown:
Villages using sources:
Springs Artesian wells Others

712
Protected Unprotected
systems:
Gravity
Pumping
pipes:
G.I.
PVC
Asbestos
Bamboo
C.3.2. Other systems
Population using unprotect- .
ed sources
Number of wells
Number of springs
Number of rivers
Number of collection basins
Population using protected s o u r c e s Number of wells with hand-
pumps
Number of protected springs
Number of free-flowing wells
Number of rain water col-lection basins
C.3.3. All systems
Population using piped sys- . terns
Population using other sys-tems
Villages using
Villages using

713
Protected Unprotected
Total populations using all systems
Percentage of population using all systems (from total populations surveyed)
C.4. Number of villages whose sources dry
Wells
Springs
Rivers
C.5. Number of villages with clear ground water
Number of villages with poor ground water (salty, contains iron, hard or turbid)
C.6. Number of villages having distances from the sources:
Less than 200 meters
Between 200 tO 1,000 meters
More than 1,000 meters
C.7. Number of villages to get water have to climb/descend:
No
Up to 150 meters
More than 150 meters
C.8. Number of villages where waterborne diseases present:
* Five diseases present
* Four diseases present

714
* Three disease present
* Two diseases present
* One disease present
* Cholera is present
C. 9. Number of villages having ground water table:
* Less than 7 meters
* Between 7 to 15 meters
* More than 15 meters
C I O . Number of villages with topographical conditions:
* Mountainous
* Rocky
* Flat
C.ll. Number of villages do not need improved water supply systems.
Number of villages needing water due to difficulty in obtaining water, the existing source is not sufficient, does not meet the minimum standard, need improved water for basic health care.
Based on 4 reasons
Based on 3 reasons
Based on 2 reasons
Based on 1 reason
C.12. Villages willing to contribute funds
For construction and operation costs
For construction only

715
For operation only
C.13. Villages are classified as below:
a. Having source but dry during the dry season.
b. Poor quality (salty, contains iron, hard or turbid).
c. Difficult to get water (villagers have to travel 1,000 meters or more or to climb/descend 150 meters or more).
d. There are waterborne diseases (Cholera, Gastroenteric, typhoid, trachoma and skin diseases).
TABLE C.13.1
VILLAGE CLASSIFICATION ASSOCIATED TO THE NEED OF SAFE WATER
Classification Number of villages Number of people
a b e d a b c a b d a c d b e d a b a c a d b c b d c d a b c d
Number of villages belong to one class, included combination with other classes:
a. b. c. d.

716
w cq <
OT X W H OT > • <
OT
HJ (X IX,
OT
PS Cd
H > O (*;
O f->
OT 55 o M EH OT W cj u OT
<n
era
0)
Ss OT
y-i
o
u <u xi 6 3 55
(3
Designed
Populatlo
ems
CO
iped Sji
a.
S3U3QI
-3B3JX aa^pfl
aoBjjns
/ S 1 3 A H
siiaw UBXS
-a:UV
sSuiids
uofaoaiioo J3}Btt UTB^
STI3M UBJS95IY 8ufW0"[d[
u o p o a a o j i
8ufads
sdtand -puBH daaQ
sdmndpuBK AOXXBHS
I
u <u S*S
ames of
a t an s
z B
iH cd 4J
o H

717
Number of families
Number of families using household latrines
Number of people using household latrines
Number of people in the Kabupaten
Percentage of people using household latrines
Number of manpower at the Kabupaten Health Service
Education Numbers Sanitation Staffs
Health Controller
Sanitarian
Assistant Sanitarian
Number of manpower at the Kabupaten Public Works.
Engineer
Bachelor Engineer
Senior Technical School
Junior Technical School
Manpower at the Kabupaten Offices or other Department who can be involved in implementing the rural water supply program at Kabupaten Offices.
Name of the Department Educational Back- Number of ground of employees Employees

718
QUESTIONNAIRE - PART I
RURAL WATER SUPPLY AND SANITATION DATA SHEET
Note 1. To be completed by the SANITATION DIVISION of the Kabupaten/Kecamatan.
2. The survey data should be shown in this completed Questionnaire and a Drawing prepared to Guide 4.
3. All survey data (Questionnaire and Drawing) should be sent as follows:
- three (3) copies of the Questionnaires and one original drawing to the Provincial Health Office.
- one (1) copy of the Questionnaire and one drawing (copy) kept at the Kabupaten Health Office.
1. AREA LOCATION
1. 1. Area in which the community has been surveyed, data collected and the drawing prepared.
Province
Kabupaten
Kecamatan
1. 2. Desas that have been surveyed.
Name of Desa Total Population Population Surveyed

719
Institutions and Public Places in the survey area.
Hospital with beds
Health Center with beds
Polyclinic
MCH Center
Number of Markets
Number of religious places
Others - give details:
Distances from Survey Area:
Distances Road Conditions
to Kecamatan Town
to Kabupaten Town
2. EXISTING CONDITIONS
Diseases in the survey area associated with use of unsafe water.
Disease Year Year Year Incidence Fatality Inc. Fat. Inc. Fat
Sources of water now used by the community in survey a-rea.
2. 2. 1. Without piped system:
Unprotected Water condition
sources Clear Turbid Salty Odor
Dug well No. of sources Pop. using

720
Unprotected
sources
Spring at sources
No. of sources Pop. using
Spring river
No. of sources Pop. using
River No. of sources Pop. using
Canal No. of sources Pop. using
Pond No. of sources Pop. using
No. of sources Pop. using
Protected sources
Well with handpump
No. of sources Pop. using
Protected spring
No. of sources Pop. using
Deep artesian well
No. of sources Pop. using
Water condition
Clear Turbid Salty Odor
No. of sources Pop. Using
2. 2. 2. With piped systems
Source Pop. using Water condition Clear Turbid Salty Odor

Details of systems
721
Description Structure Good Broken
Source: Type Capacity
Reservoir: Capacity cu.m
Reservoir stand: Height m
Pump house: Size
Pumps: Diesel ea Electric ea
Filter bed: area sq.m
Pipes G.I.: Total length m AC. : Total length m Bamboo: Tct. " m
Public reservoir No.
Capaci ty cu. m
Public taps No.
3. How far away are the present sources of water.
The sources are in the community area.
The sources are about km. from the community area.
4. Existing method of excreta disposal.
Number Number Pop. Exis ting used us ing
Water seal bowl with septic tank
Water seal bowl with pit
Open hole pit latrine
Latrine overhanging ponds
and rivers
Other methods:

722
3. FIELD INVESTIGATION
3. 1. Sources of water which have been measured for yield.
Location Yield How measured Desa t/sec
Spring, at source ,_
Spring river .
River
Existing deep artesian well with positive head
Location Desa
Diameter m
Depth m
Positive head above ground level m
Discharge L/ sec
Existing well artesian negative
shallow well
Location Desa .
Diameter m
Depth from ground level to well botto m m
Depth from ground level to water level in dry season m
Depth from ground level to water level in rainy season m
Dates of Pumping Pump dis- Depth from ground pumping hours charge L/sec to static water
when pumping

723
There is no suitable source to measure the yield.
The rainfall in the area is
Month Average monthly rainfall(mm)
Figures for Kecamatan For Kabupaten
What is the depth of ground water from ground level.
in dry season m
in rainy season m
What is the Electric Power Supply available in survey area :
No supply
A supply of Volts.
The supply is
Continuously from hrs. to hrs
by P.L.N. (Government Electric Company).
by Local Generator.
4. STAFF & COMMUNITY ORGANIZATION
What is the existing sanitation staff.
Names
Health Con- Sanitarian Assistant troller Sanitarian
Full time
-At the Desa
-At the Kecamatan
-At the Kabupaten

724
Names Health Con- Sanitarian Assistant troller Sanitarian
Part time
-At the Desa
-At the Kecamatan
-At the Kabupaten
4. 2. What is the number of existing staff at the Kabupaten Public Works.
Engineer
Bachelor
Technician (High School)
Technician (Junior School)
4. 3. Give names of Kabupaten Public Works or other officials who will assist the Projects.
Name Title
Survey
Preliminary Design
Detailed Design for construction
Construction
Operation & Maintenance
4. 4. Is there an active community organization in the area.
Yes. Give a list of some works done by the organization during the past six months:
No.

725
4. 5. Give the name of a member of the community (not an official) who could be trained to operate and maintain the water supply systems.
Name Address
4. 6. Give the names of officers doing the following work.
Item Dates Names and Title of officers work done Doing the work Assisting
Data collection
Filling out ques tionnaire
Preparing the drawing
4. 7. Attach a letter signed by Desa Chief:
-requesting a Project.
-agreeing to assist in construction, operation and maintenance .
Date
Name, Title and Signature of Responsible
Officer.

726

SELECTED BIBLIOGRAPHY
PUBLICATIONS PRODUCED DURING THE UNIVERSITY OF OKLAHOMA STUDY ON APPROPRIATE LDC WATER/WASTEWATER TREATMENT METHODS
The following titles were produced under the sponsorship of the
U.S. Agency for International Development under the contract number
(AID/CM/ta-C-73-13 Res.) The issuing office was the Bureau of Water
and Environmental Resources Research, the University of Oklahoma,
Norman, Oklahoma 73069. A publication number for each title is given
and indicated by the letters PN.
1. Canter, L. W., and Malina, J. F. Sewage Treatment in Developing Countries. PN-AAD-286. 1976.
2. Coffey, Kay, and Reid, G. W. Historic Implication for Developing Countries of Developed Countries Water and Wastewater Tech-nology. PN-AAD-288. 1976.
3. Gorkum, Willem van, and Kempenaar, Kees. Rural Water Supply in Developing Countries. Part 2. PN-AAD-285. 1975.
4. Huisman, L. Treatment Methods for Water Supplies in Rural Areas of Developing Countries. Part 1. PN-AAD-284. 1975.
727

728
5. Muga, Erasto. Socio-Economic Conditions Which Pertain to Cost of Construction and Operation of Water and Sewage Treatment Facilities and Quantity of Water Consumption in Kenya. PN-AAD-290. 1976.
6. Pan American Center for Sanitary Engineering and Environmental Sciences, Lima. Evaluation of Lower Cost Methods of Water Treatment in Latin America. PN-AAD-289. 1976.
7. Philippines, National Pollution Control Commission. A Water Sterilization Study in the Philippines. PN-AAD-282. 1976.
8. Reid, G. W. A Catalog of Water Supply and Waste Disposal Methods for Individual Units. PN-AAD-283. 1975.
9. . Appropriate Methods of Treating Water and Wastewater in Developing Countries: Data Requirements. PN-AAD-295. 1975.
10. . Low Cost Methods of Treating Water and Sewage in Developing Countries: Summary Report. PN-AAD-219. 1974.
11. Reid, G. W., and Discenza, Richard. Prediction Methodology for Suitable Water and Wastewater Processes. PN-AAB-419, English; PN-AAD-291, Spanish. 1975.
12. . Prediction Methodology for Suitable Water and Wastewater Processes. Supplement 1: Manual Computation Method. PN-AAD-292. 1975.
13. . Prediction Methodology for Suitable Water and Wastewater Processes. Supplement 2: Computer Program. PN-AAD-293. 1975.
14. Reid, G. W., and Muiga, M. I. A Mathematical Model for Predicting Water Demand, Wastewater Disposal, and Cost of Water and Wastewater Treatment Systems in Developing Countries. PN-AAD-294. 1976.
15. Taiwan, Institute of Environmental Sanitation. The Study of Microbial Treatment of Nightsoil. PN-AAD-281. 1976.
16. Thailand, Ministry of Public Health, Rural Water Supply Division. Study of an Existing Water Treatment Plant of Simple Design and Operating System for Supplying Drinking Water to Rural Communities in the Lower Mekong Basin Countries. PN-AAD-280. 1976.
17. World Health Organization International Reference Centre for Community Water Supply, The Hague. Contributions to a Mail Survey on Practical Solutions in Drinking Water Supply and Waste Disposal for Developing Countries. PN-AAD-287. 1977.

729
The following two titles were published in the Netherlands by the
World Health Organization International Reference Centre for Community
Water Supply.
18. Reid, G. W. , and Discenza, Richard. Prediction Methodology for Suitable Water and Wastewater Processes. Technical Paper Series, no. 8. The Hague, The Netherlands: WHO International Reference Centre for Community Water Supply, September 1976.
19. World Health Organization, International Reference Centre for Community Water Supply. A Report on the Global Workshop on Appropriate Water and Wastewater Treatment Technology for Developing Countries, Voorburg, The Netherlands, 17-22 November 1975. Bulletin Series, no. 7. Voorburg (The Hague), April 1977.
CHAPTER I. INTRODUCTION: INTERFACE FOR DECISION
1. Abelishvilli, G. Soviet Scientists Waterproof Ponds. Moscow: Novosti Press Agency.
2. Agency for International Development. Technology and Economics in International Development. Springfield, Virginia: National Technical Information Service (NTIS), 1972.
3. Biological Filters, Community Water Supply Research and Development, WHO/CWS/RD/70.1.
4. Campbell, Michael D., and Lehr, Jay H. Rural Water Systems Planning and Engineering Guide. Washington, D.C.: Commission on Rural Water, 19 73.
5. Cleary, Edward J., et al. International Program in Sanitary Engineering Design Evaluation and Recommendations. Washington, D.C.: Agency for International Development, 1971.
6. Community Water Supply Unit. The Village Tank as a Source of Drinking Water. RD/69.1. Geneva: World Health Organization, 1969.
7. Cost of Water Treatment in Illinois. Technical Letter 11. Urbana, Illinois: Illinois State Water Survey, 1968.
8. Cox, C. R. Operation and Control of Water Treatment Processes. Monograph Series no. 49. World Health Organization, 1969.
9. Cunningham, J. H. "Potable Water for Nigeria." Water and Wastes Engineering (July 19 73).

Dawes, J. H., and Wathne, M., Cost of Reservoirs in Illinois. Circular 96. Urbana, Illinois: Illinois State Water Survey, 1968.
Dennis, J. M. "Infectious Hepatitis Epidemic in Delhi, India." Journal of the American Water Works Association (October 1959).
Donaldson, David. Progress in the Rural Water Programs of Latin America (1961-1971). Washington, D.C. : Pan American Health Organization, 1973.
Extended Aeration System in India. Nagpur, India: Central Public Health Engineering Research Institute, 19 72.
Fair, G. M., Geyer, J. C., and Okun, D. A. Water and Wastewater Engineering. New York: John Wiley & Sons, 196 8.
Finch, J. The Planning and Organization of Industrial Waste Programs. WHO/WD/70.6.
Fourth Annual Report. The Hague, The Netherlands: World Health Organization International Reference Center for Community Water Supply, 1972.
Gloyna, E. F. Waste Stabilization Ponds. WHO Monograph no. 60. Geneva: WHO, 1971.
Green, Paul E., and Tull, Donald S. Research for Marketing Decisions. 2nd ed. Englewood Cliffs, N. J.: Prentice-Hall, 1970.
Guidelines and Criteria for Community Water Supplies in the Developing Countries. Rockville, Maryland: Consumer Protection and Environmental Health Service, 1969.
Herfindahl, Orris C. Natural Resource Information for Economic Development. Baltimore, Maryland: The Johns Hopkins Press, 1969.
Intermediate Technology Development Group, Water Panel. Water for the Thousand Millions. Edited by Arnold Pacey. Oxford: Pergamon Press, 1977.
Koenig, L. "Cost of Water Treatment by Coagulation, Sedimentation, and Rapid Sand Filtration." Journal of the American Water Works Association 59, no. 3 (1967).
Lauria, Donald. Report on Water Demand Study. Chapel Hill, N.C.: International Program in Sanitary Engineering Design, University of North Carolina, 1969.

731
24. McGarry, M. G. Photosynthetic Yields and By-Product Recovery from Sewage Oxidation Ponds. Bangkok, Thailand: Asian Institute of Technology.
25. McGarry, M. G. Water and Protein Reclamation from Sewage. Bangkok, Thailand: Asian Institute of Technology.
26. McJunkin, Frederick E. Community Water Supply in Developing Countries: A Quarter-Century of United States Assistance. Washington, D.C.: Agency for International Development, 1969.
27. "Mzima Pipeline: The World's Largest Gravity Flow." Water and Wastes Engineering 7 (19 70).
28. Paul, Benjamin D., and Miller, Walter B. Health Culture and Community: Case Studies of Public Reactions to Health Programs. New York: Russell Sage Foundation, 1955.
29. Pavanello, R., and Vouk, V. B. Health Aspects of Water Pollution. EP/70.4. Geneva: World Health Organization, 19 70.
30. Reid, George W. Lower Cost Methods of Water and Waste Treatment in Less Developed Countries. Norman, Oklahoma: The University of Oklahoma Research Institute, 19 73.
31. Reuse of Effluents: Methods of Wastewater Treatment and Health Safeguards. Technical Report no. 517. Geneva: WHO.
32. Robbins, Michael C., and Kilbride, Philip L. "Microtechnology in Rural Buganda." In Technology and Social Change, pp. 202-225. Edited by H. Russell Bernard and Pertti Pelto. New York: The Macmillan Company, 1972.
33. Shaner, Willis W. "Some Problems Associated with the Use of Expatriate Advisors in Developing Countries." In Transfer of Water Resources Knowledge, pp. 315-317. Edited by Evan Vlachos. Proceedings of the First International Conference on Transfer of Water Resources Knowledge, September 1972, Fort Collins, Colorado, U.S.A. Fort Collins: Water Resources Publications, 1973.
34. Standardized Procedure for Estimating Costs of Conventional Water Supplied Kansas City, Moi. : Black and Veatch Consulting Engineers, 1963.
35. "Survey of Water Treatment Plants." Technical Digest no. 13. Nagpur, India: Central Public Health Engineering Research Institute, January 19 71.
36. Taylor, Charles Lewis, and Hudson, Michael C. World Handbook of Political and Social Indicators. 2nd ed. New Haven: Yale University Press, 19 72.

732
37. Tjiook, T. K. An Integrated Program of Development and Promotion of Appropriate Technology in Community Water Supply. Bilt-hoven, The Netherlands: WHO International Reference Center for Community Water Supply, April 1973.
38. U.S., Agency for International Development. Economic Data Book. Washington, D.C.: U.S. Department of State, Statistics and Reports Division, 1973.
39. U.S., Department of Labor. Demographic Techniques for Manpower Planning in Developing Countries. Washington, D.C.: The Agency for International Development, 1968.
40. Village Technology Handbook. Rev. ed. Schenectady, N.Y. : Volunteers for International Technical Assistance (VITA), 1970.
41. von der Mehden, Fred R . Politics of the Developing Nations. 2nd ed. Englewood Cliffs, N.J.: Prentice-Hall, 1969.
42. Wagner, E. G., and Lanoix, J. N. Excreta Disposal for Rural Areas and Small Communities. Geneva: World Health Organization, 1958.
43. • Water Supply for Rural Areas and Small Communities. Monograph Series no. 42. Geneva: World Health Organization, 1959.
44. Water and Wastewater Problems in Rural America. Washington, D.C.: Commission on Rural Water, 1973.
45. Water Pollution Control in Developing Countries. Technical Report no. 404. Geneva: WHO.
46. Water Supply and Sewerage. Sector Working Paper. World Bank, October 1971.
47. White, G. F., et al. Drawers of Water: Domestic Water Use in East Africa. Chicago: The University of Chicago Press, 19 72.
48. World Health Organization, Division of Environmental Health, Community Water Supply and Sanitation. Research Needs in WHO Member States. Background Document 1. Bilthoven, The Netherlands: WHO International Reference Center for Community Water Supply, April 19 73.
49. WHO Expert Committee. Community Water Supply. Technical Report Series no. 420. Geneva: World Health Organization, 1969.
50. . Solid Wastes Disposal and Control. Technical Report Series no. 484. Geneva: World Health Organization, 1971.

733
51. . Reuse of Effluents: Methods of Wastewater Treatment and Health Safeguards. Technical Report Series no. 517. Geneva: World Health Organization, 19 73.
52. . Water Pollution Control in Developing Countries. Technical Report Series no. 404. Geneva: World Health Organization, 1968.
53. World Health Organization, International Reference Centre for Community Water Supply. A Report on the Global Workshop on Appropriate Water and Wastewater Treatment Technology for Developing Countries, Voorburg, The Netherlands, 17-22 November, 1975. Bulletin Series, no. 7. Voorburg (The Hague), April 1977.
54. . "Rural Water Supply in Nigeria." The Newsletter no. 20 (1972).
55. . Sewage Lagoons for Developing Countries. Ideas and Methods, no. 62. Washington, D.C.: U.S., Agency for International Development, Jan. 1966.
56. • Problems in Community Waste Management. Public Health Papers no. 30. Geneva: WHO, 1969.
57. WHO Programme in Basic Sanitary Services, Community Water Supply and Wastes Disposal: The Advancement and Transfer of Knowledge and Methods. Geneva: World Health Organization, 19 73.
58. WHO Scientific Group. Treatment and Disposal of Wastes. Technical Report Series no. 36 7. Geneva: World Health Organization, 196 7.
59. Zimmerman, Stanley, and Cobb, Edwin L. Guide for the Development of Local Water Projects. Washington, D.C.: Commission on Rural Water, 1973.
CHAPTER II. TECHNOLOGY TRANSFER, ADAPTATION, AND UTILIZATION
1. Allen, Thomas J. "The International Technological Gatekeeper." Technology Review (March 19 71):36-43.
2. Balasubramanyam, V. N. International Transfer of Technology to India. New York: Praeger Publishers, 1973.
3. Barb, Charles E., Jr. "The Evolution of GBF-Dime Technology in the United States." University of Oklahoma, 1977.

C a r r u t h e r s , I . D. Impact and Economics of Community Water Supply: A Study of Rural Water Investment in Kenya. Ashford, Kent, England: School of Rural Economics and Related S t u d i e s , Wye Col lege , 1973.
Churchman, C. West. The Systems Approach. New York: De l l Publ i s h e r s , 1968.
Darrow, Ken and Rick, Pam. Appropr ia te Technology Sourcebook. S tanford : Volunteers in A s i a , 1976.
David, Paul A. Technical Choice Innovat ion and Economic Growth: Essays on American and B r i t i s h Experience in the Nine teen th Century. London: Cambridge U n i v e r s i t y P r e s s , 19 75.
Dorf, Richard C. Energy, Resources , and P o l i c y . London: Addi-son-Wesley Pub l i sh ing Company, 19 78.
Exxon Company. U . S . A . ' s Energy Outlook 19 77-1990. January 1977.
Falkenmark, Malin , and Lindh, Gunnar. Water for a S ta rv ing World. T rans l a t ed by Roger G. Tanner. Boulder , Colorado: Westview P r e s s , 1976.
F lack , J . E r n e s t , ed. Proceedings of the Conference on I n t e r d i s c i p l i n a r y Analys is of Water Resource Systems, June 19-22, 19 73, Un ive r s i t y of Colorado, Boulder , Colorado. New York: American Soc ie ty of C i v i l Eng inee r s , 19 75.
Florman, Samuel C. "In P r a i s e of Technology." Ha rpe r ' s (November 19 75): 5 3.
Gee, Sherman. "The Role of Technology Transfe r in I nnova t i on . " Research Management (November 19 74) :32 .
Glennan, T. Ke i th . Technology and Foreign A f f a i r s . Washington, D.C. : United S t a t e s Department of S t a t e , 1976.
Goule t , Denis . "The Paradox of Technology T rans f e r : The Third World 's Ladder to Development Can Also Be the Avenue to Colon ia l i sm." B u l l e t i n of the*Atomic S c i e n t i s t s (June 19 75) : 39.
Jones , Graham. The Role of Science and Technology in Developing Coun t r i e s . London: Oxford U n i v e r s i t y P r e s s , 19 71.
Kuznets , Simon. Economic Growth of N a t i o n s : T o t a l Output and Product ion S t r u c t u r e . London: The Belknap Press of Harvard Un ive r s i t y P r e s s , 19 71.
Lembaga Ilrau Pengetahuan Indones ia and N a t i o n a l Academy of Sciences of the United S t a t e s . Workshop on I n d u s t r i a l and Technological Research. Vol. 1: Overa l l Findings and Recommendations. D jaka r t a , I ndones i a , January 1971.

735
19. Mason, R. Hal. The Transfer of Technology and the Factor Proportions Problem: The Philippines and Mexico. New York: United Nations Institute for Training and Research, 19 71.
20. McNown, John S., ed. Technical Education in Africa. Nairobi, Kenya: East African Publishing House, 1970.
21. Meadows, Done11a H. et al. The Limits to Growth. New York: Universe Books, 1972.
22. Meguid, A. R. Abdel. "Economics and Technology of Development." In Views of Science Technology and Development. Oxford, 1975.
23. Meyer, K. Rudy. The Transfer of Technology to Developing Countries: The Pulp and Paper Industry. New York: United Nations Institute for Training and Research, 1974.
24. National Academy of Sciences. Meeting the Challenge of Industrialization: A Feasibility Study for an International Industrialization Institute. Report of a Special International Panel of the Board on Science and Technology for International Development Office of the Foreign Secretary. Washington, D.C.: U.S. Government Printing Office, 1973.
25. . Research Management and Technical Entrepreneurship: A U.S. Role in Improving Skills in Developing Countries. Report of an Ad Hoc Advisory Panel of the Board on Science and Technology for International Development. Washington, D.C.: U.S. Government Printing Office, 1973.
26. . Scientific and Technical Information for Developing Countries. Washington, D.C.: U.S. Government Printing Office, April 1972.
27. . Technology: Processes of Assessment and Choice. Washington, D.C.: U.S. Government Printing Office, July 1969.
28. National Institute of Sciences of India and National Academy of Sciences of the United States. Report of the Indo-U.S. Workshop on the Management and Organization of Industrial Research. Baroda, India, March 2-6 1970.
29. National Science Foundation. The Effects of International Technology Transfers on U.S. Economy. Papers and proceedings of a colloquium held in Washington, D.C., November 17, 1973. Washington, D.C.: U.S. Government Printing Office, July 1974.
30. Oldham, C. D. G.; Freeman, C.; and Turkcan, E. Transfer of Technology to Developing Countries. Study of the Science Policy Research Unit of the University of Sussex, for the U.N. Conference on Trade and Development, Second Session. TD/28/Supp. 1. November 10, 1967.

31. Perrin, J. Choice and Adaptation of Technology in Developing Countries. Paris, 19 74.
32. Renis, Gustav. "Some Observations on the Economic Framework for Optimum LDC Utilization of Technology." Economic Growth Center paper no. 152. Yale University, August 19 72.
33. Rosenberg, Nathan. Perspectives on Technology. Cambridge: Cambridge University Press, 19 76.
34. Rubenstein, Albert H. et al. Research Priorities on Technology Transfer to Developing Countries. Report of Two NU/NSF Workshops Held at Northwestern University, May 1973 and Washington, D.C., September 1973. Washington, D.C.: U.S. Government Printing Office, January 1974.
35. Schumacher, E. F. "Intermediate Technology." The Center Magazine. The Center for the Study of Democratic Institutions.
36. . Small is Beautiful: Economics as if People Mattered. New York: Harper & Row, 19 73.
37. Steele, R. D. Multinational Corporations, Technology Transfer, and the Developing Countries: An Introductory Bibliography. Council of Planning Librarians, Exchange Bibliography #745. MonticellOj Illinois, 19 75.
38. Stobaugh, Robert B. The International Transfer of Technology in the Establishment of the Petrochemical Industry in Developing Countries. United Nations Institute for Training and Research. New York, 19 71.
39. Torto, F. G. "Some Problems of Development in African Countries: Foreign Assistance in Development Research Capability." In Views of Science Technology and Development. Oxford, 19 75.
40. United Nations Conference on Trade and Development. The Reverse Transfer of Technology: Economic Effects of the Outflow of Trained Personnel from Developing Countries (Brain-Drain) . Trade and Development Board, Intergovernmental Group on Transfer of Technology, Third Session. Geneva, 15 July 19 74.
41. . The Role of the Patent System in the Transfer of Technology to Developing Countries. Trade and Development Board, Intergovernmental Group on Transfer of Technology, Third Session. Geneva, 15 July 1974.
42. U.S., House of Representatives, Committee on Science and Astronautics. Government, Science, and International Policy. Washington, D.C: U.S. Government Printing Office, 1967.

737
43. U.S., House of Representatives, Committee on Science and Technology. Review of Technology Transfer to the Organization of Petroleum Exporting Countries. Washington, D.C.: U.S. Government Printing Office, 19 76.
44. . Technology Transfer to the Middle East O.P.E.C. Nations and Egypt, 1970-1975. Washington, D.C.: U.S, Government Printing Office, 1976.
45. Vemuri, V. "Multiple Objective Optimization." ASCE Annual and National Environmental Engineering Meeting, October 16-22, 19 72, Meeting Preprint 1837.
46. Wexler, Alvin, ed. Large Engineering Systems. Proceedings of the International Symposium Held at the University of Manitoba, Winnipeg, Canada, August, 1976. Oxford: Pergamon Press, 1977.
CHAPTER III. PREDICTION METHODOLOGY FOR SELECTION OF SUITABLE WATER AND WASTEWATER PROCESSES
1. Donaldson, David. "Progress in the Rural Water Programs of Latin America." Bulletin of the Pan-American Health Organization 8,1(1974):41-42.
2. Reid, George W. , and Discenza, Richard. Prediction Methodology for Suitable Water and Wastewater Processes. Norman: University of Oklahoma Bureau of Water and Environmental Resource Research, October 1975.
3. Reid, George W., and Discenza, Richard. Prediction Methodology for Suitable Water and Wastewater Processes. Technical Paper Series, no. 8. The Hague: WHO International Reference Centre for Community Water Supply, September 1976.
4. Reid, George W., and Discenza, Richard. Prediction Methodology for Suitable Water and Wastewater Processes. Supplement II: Computer Program. Norman: The University of Oklahoma Bureau of Water and Environmental Resources Research, May 1975.
CHAPTER IV. METHODOLOGY FOR PREDICTION OF WATER AND WASTEWATER VOLUMES AND TREATMENT COSTS
1. Ackerman. Journal of American Water Works Association (1968).
2. Black and Veatch (engineering firm). Manual for Calculation of Conventional Water Treatment Costs. Office of Saline Water Research and Development Report 917. U.S. Department of Interior, March 1972.

Butts, T. A., and Evans, R. L. Cost of Municipal Sewage Treatment Plants in Illinois. Urbana: State Water Survey, 1970.
Capen, Charles H., Jr. "How Much Water Do We Consume? How Much Do We Pay?" Journal of American Water Works Association 29 (1937):202-212.
Chenery. Journal of American Water Association (1952).
"Cost of Rural and Village Sanitation in Southeast Asian Region." World Health Organization Chronicle 21 (1967).
Diachishin, A. M. "New Guide to Sewage Plants Costs." Engineering News Record 159, No. 15 (October 1957):316.
Dieterich, B. H., and Henderson, J. M. Urban Water Supply Conditions and Needs in Seventy-Five Developing Countries. Geneva: World Health Organization Public Health, Paper 23, 1967.
Dixon, Wilfrid J. and Massey, Frank J. Introduction to Statistical Analysis. New York: McGraw-Hill Book Co., 1969.
Draper, N. R., and Smith H. Applied Regression Analysis. New York: John Wiley & Sons, 1960.
Durfor, Charles N., and Becker, Edith. Public Water Supplies of the 100 Largest Cities in the United States. U.S. Geological Survey, 1964.
Eckenfelder, W. W., Jr. Effluent Quality and Treatment Economics for Industrial Wastewater. U.S. Department of Interior, Federal Water Pollution Control Administration, 1967.
Fourt, Louis. "Forecasting the Urban Residential Demand for Water." Agriculture Economic Seminar, Department of Agricultural Economics, University of Chicago, February 1958.
Goldberger, Arthur S. Econometric Theory. New York: John Wiley & Sons, 1964.
Hanke, Steve H. "Deuiand for Water under Dynamic Conditions." Water Resources Research 6, No. 5 (October, 1970).
Henderson, John M. Report on Global Urban Water Supply Costs in Developing Nations, 1961-1975. Washington, D.C.: International Cooperation Administration, 1961.
Howe, Charles W., and Linaweaver, F. P., Jr. "The Impact of Price on Residential Demand and its Relation to System Design and Price Structure." Water Resources Research 3, No. 1 (1967).

739
Howe et al. "Future Water Demands: The Impact of Technological Change, Public Policies, and Changing Market Conditions on the Water Use Patterns of Selected Sectors of the United States Economy: 1970-1990." A Study for the National Water Commission by Resources for the Future, Inc., June 1970.
Howell, D. H., and Bubois, D. P. "Design Practices and Costs for Small Secondary Sewage Treatment Plants in the Upper Midwest." Sewage and Industrial Wastes 30, No. 1 (1958).
International Financial Statistics. International Monetary Fund, August 1974.
Koenig, Louis. "Cost of Water Treatment by Coagulation, Sedimentation, and Rapid Sand Filtration." Journal of American Water Works Association 59, No. 3 (March 1967).
Lauria, Donald T. Planning Small Water Supplies in Developing Countries. U.S. Agency for International Development, Office of Health, 1972.
Lee, Terence R. Residential Water Demand and Economic Development. University of Toronto, Department of Geography, Research Publication No. 2. University of Toronto Press, 1969.
Logan, J. A. et al. "Analysis of the Economics of Wastewater Treatment." Journal of Water Pollution Control Federation 34, No. 9 (September 1962).
Low Cost Waste Treatment. Nagpur, India: Central Public Health Engineering Research Institute, 1972.
Merrill, William C. and Fox, Karl A. Introduction to Economic Statistics. New York: John Wiley & Sons, 1970.
Meyer, John M., Jr., and Mangan, George F. "System Pinpoints Urban Water Needs." Environmental Science and Technology 3, No. 10 (October 1969).
Park, W. "Make Quick Sewage Plant Construction Estimates." Engineering News Record 1968, No. 12 (March 1962).
Parzen, E. Modern Probability Theory and Its Application. New York: John Wiley & Sons, 1960.
Reid, George W. "Multi-structured Municipal Water Demand." Water Resources Bulletin (Journal of the American Water Resource! Association) 7, No. 6 (December 1971).
. Water Requirements for Pollution Abatement Committee. p7int No. 29. Water Resources Activities in United States for the U.S. Senate Committee on National Water Resources, July 1960.

740
32. Reid, George W. , and Muiga, Michael I. "Aggregate Modeling of Water Demands for Developing Countries Utilizing Socio-Economic Growth Pattern." UNDP/UN Interregional Seminar on River Basin and Interbasin Development, Budapest, Hungary, September 1975.
33. Sasaki, K., and Sasaki, S. The Methods of Water Requirements Forecasting in Japan. United Nations, ESA, ±y l l . '
34. Shah, Kanti L., and Reid, George W. "Techniques for Estimating Construction Costs of Wastewater Treatment Plants." Journal of Water Pollution Control Federation (May 1970).
35. Smith and Eiler, Cost to Consumer for Collection of Wastewater. United States Environmental Protection Agency, July 19 70.
36. Tahol Water Planning, Ltd., and Engineering Science, Inc. Master Plan for Water Supply and Sewerage, Government of Ghana. Vol. 1: Engineering Report for Accra-Tema Metropolitan Area. October 1965.
37. Thoman, R. V., and Jenkins, K. H. "How to Estimate Sewage Plants Quickly." Engineering News Record 161, No. 26 (December 1958).
38. United Nations Conference on Human Environment. Stockholm,
Sweden, 1972.
39. United Nations Statistics Data. 1971, 1972, 1973.
40. United Nations, Urban and Rural. ESA/P/WP, 33/Rev./New York.
41. U.S. Department of Health Education and Welfare. Modern Sewage Treatment Plants — How Much Do They Cost? Washington, D.C.
42. Velz, C. J. "How Much Should Sewage Treatment Cost?" Engineering News Record 141, No. 6.
43. White, G. F.; Bradley, David J.; and White, Anne U. Drawers of Water. Chicago: University of Chicago Press, 1972.
44. Wolman, A. Forecasts of Water Use and Water Quality: A Model for the United States. April 1970.
45. Wolman, Abel. "Assessing Water Uses and Minimal Requirements." Ad Hoc Group of Experts in Water Requirements Forecasting, Budapest, 10-17 May 1972. United Nations, ESA/RT/AC.3/14.
46. Wollman, N. Cost of Treatment. New Mexico: University of New Mexico, 1963.
47. Wong, S. T. et al. Multivariate Statistical Analysis of Metropolitan Area Water Supplies. Chicago: Northeastern Illinois Metropolitan Area Planning Commission, May 1963.

741
48. Wood, W. E. "National Rural Water Supply Programmes." Paper presented by the World Health Organization at the Economic Commission for Africa Working Group of Experts in Water Resources Planning, Addis Ababa, 19-25 June 19 70.
49. World Health Organization EH/712.
50. World Health Organization, International Reference Centre for Community Water Supply. "Water Dispensing Devices Aid Methods for Public Water Supply in Developing Countries." Interim Report. The Hague, Netherlands.
51. Yamane, Taro. Elementary Sampling Theory. Englewood Cliffs, N. J.: Prentice-Hall, 1967.
CHAPTER V. METHODOLOGY FOR ESTABLISHING PRIORITIES AMONG WATER SUPPLY PROGRAMS: A CASE STUDY
1. Indonesian Ministry of Health, Directorate General of Communicable Diseases, Directorate of Hygiene and Sanitation. Jakarta, Indonesia. Personal Communication.
2« Pineo, C. S., and Subrahmanyam, D. V. Community Water Supply and Excreta Disposal Situation in Developing Countries, A Commentary. Offset Publication no. 15. Geneva: World Health Organization, 1975.
3. Project System Analysis Group, World Health Organization. .A Priority Setting for Rural Water Supply Program in the West Java Province, Indonesia. January 3 - March 3, 1973.
4. Reid, George W., and Discenza, Richard. Prediction Methodology for Suitable Water and Wastewater Treatment Processes. Norman: University of Oklahoma, Office of Research Administration, 1975.
5. Republic of Indonesia. Guidelines of INPRES Program in Rural Water Supply and Sanitation. April 1974.
6. Republic of Indonesia. "Guidelines of the Improvement in Health Care." Second Five-Year Development Plan, 1974 - 1979.
7. Republic of Indonesia, National Committee for the World Population Year 1974. Population and Development in Indonesia. Report for the World Population Conference, Bucharest, Romania, 19 - 30 August 1974.
8. Saunders, R. J., and Warford, J. J. "Village Water Supply and Sanitation in Less Developed Countries: Economics and Policy." Draft, January 1975.

742
9. United Nations Children's Fund. "Assignment Children." Water and Community Development 34 (April - June 1976).
10. United Nations Children's Fund and World Health Organization. Report on Rural Water Supply in Indonesia. EH/SEARO/75.1. April 1975.
11. Wheelwright, Steven C., and Makridakis, Spyros. Forecasting Methods for Management. New York: John Wiley & Sons, 1973.
12. World Bank. "Village Water Supply." March 1976.
13. World Health Organization, Regional Office for Southeast Asia. Annual Report of the Regional Director. 1972 - 1973.
CHAPTER VI. IMPLICATION OF PAST DEVELOPMENTS IN WATER AND WASTEWATER TECHNOLOGY
1. Ainge, Thomas S. The Sanitary Sewerage of Buildings. Chicago: Domestic Engineering, 1907.
2. Baker, M. N. The Quest for Pure Water: The History of Water Purification from the Earliest Records to the Twentieth Century. New York: American Water Works Association, 1949.
3. Broadhurst, Jean. Home and Community Hygiene: A Textbook of Personal and Public Health. 4th ed. rev. Lippincott's Home Manuals, edited by Benjamin R. Andrews. Philadelphia: J= B= Lippincott Co.. 1929.
4. Chadwick, Edwin. Report on the Sanitary Condition of the Labouring Population of Great Britain, 1842. Edited by M. W. Flinn. Edinburgh: Edinburgh University Press, 1965.
5. Compton's Pictured Encyclopedia and Fact-Index, 1952 ed. S. V. "Water."
6. Council of the Citizens' Association. Report of the Council of Hygiene and Public Health of the Citizens' Association of New York, Upon the Sanitary Condition of the City. 2nd ed. New York: D. Appleton & Co., 1866; reprint ed., New York: Arno Press and New York Times, 1970.
7. Daumas, Maurice, ed. A History of Technology and Invention: Progress Through the Ages. Vol. 1: The Origins of Technological Civilization. Translated by Eileen B. Hennessy. New York: Crown Publishers, 1969.
8. _. A History of Technology and Invention: Progress Through the Ages. Vol. 2: The First Stages of Mechanization. Translated by Eileen B. Hennessy. New York: Crown Publishers, 1969.

743
Don, Graham. London School of Hygiene and Tropical Medicine.
DraffIn, Jasper Owen. The Story of Man's Quest for Water. Champaign, 111.: Garrard Press, 1939.
Duffy, John. A History of Public Health in New York City, 1625-1866. New York: Russell Sage Foundation, 1968.
Ehlers, Victor Marcus, and Steel, Ernest W. Municipal and Rural Sanitation. 6th ed. New York: McGraw-Hill Book Co., 1965.
Frontinus, Sextus Julius. The Two Books on the Water Supply of the City of Rome of Sextus Julius Frontinus, Water Commissioner of the City of Rome, A.D. 97. Translation and explanatory chapters by Clemens Herschel. Boston: Dana Estes & Co., 1899.
Gay, Charles Merrick, and De van Fawcett, Charles. Mechanical and Electrical Equipment for Buildings. New York: John Wiley & Sons, 1935.
Jephson, Henry. The Sanitary Evolution of London. London: T. Fisher Unwin, 1907.
Mumford, Lewis. Technics and Civilization. New York: Harcourt, Brace & Co., 1934.
Pritchard, James B. The Water System of Gibeon. Museum Monographs. Philadelphia: University Museum, University of Pennsylvania, 1961.
Read, Brian. Healthy Cities: A Study of Urban Hygiene. Topics in Modern History Series. Gen. ed. Ivor D. Astley. Glasgow: Blackie, 1970.
Robins, F. W. The Story of Water Supply. London: Oxford University Press, 1946.
Small, F. L. The Influent and the Effluent: The History of Urban Water Supply and Sanitation. Manitoba, Canada: Underwood McLellan and Associates, Modern Press, 1974.
Weber, H., and Wasmer, H. R. Swiss Federal Institute for Water Resources and Water Pollution Control (EAWAG). WHO International Reference Centre for Water Disposal. " A Study on Historical Methods of Water and Sewage Treatment." EAWAG Project, number 4498. Diibendorf, Switzerland, May 31, 1975.
Wolman, Abel, and Bosch, Herbert M. "U.S. Water Supply Lessons Applicable to Developing Countries," Water, Health and Society. Edited by Gilbert F. White. Bloomington: Indiana University Press, 1969; reprinted from Journal American Water Works Association 55 (August 1963).

CHAPTER VII. WATER SUPPLY AND TREATMENT
VII. 1. PART ONE. WATER SUPPLIES IN RURAL AREAS OF DEVELOPING COUNTRIES (PART ONE)
1. Miller, Arthur P. Water and Man's Health. Community Water Supply Technical Series, no. 5. Washington, D.C.: U.S. Agency for International Development, 1962. .
2. "The Village Tank as Source of Drinking Water." WHO/CWS/RD/69.1.
3. White, Gilbert F.; Bradley, David J.; and White, Anne U. Drawers of Water; Domestic Water Use in East Africa. Chicago: University of Chicago Press, 1972.
VII. 1. PART TWO. WATER SUPPLIES IN RURAL AREAS OF DEVELOPING COUNTRIES (PART TWO)
1. Agarwal, I. C , and Agrawal, G. D. "Operating Slow Sand Filters with Alum Coagulated Water." Proceedings of a Symposium on Environmental Pollution. Nagpur, India: Central Public Health Engineering Research Institute, 1973.
2. Agromisa. "Techniek" (Technique). Vraagbaak second file, no. 3 (September 1974):30-58.
3. Arboleda, J. "Expansion of Cucuta, Colombia, Water Treatment Plant Using Dual Media Filtration." Paper presented at the Aidis Congress. Caracas, August 1970.
4. Assaduzaman, M., and Khan, 0. K. "Bamboo Tube Well." The Bangladesh Observer, 12 July 1974.
5. Australian Water Resources Council. Evaporation from Water Storages. Hydrological Series, no. 4. Canberra, 1970.
6. Batemann, G. H. A Bibliography of Low Cost Water Technologies. London: Intermediate Technology Development Group, October 1974.
7. Borjesson, E. K. G., and Bobeda, C. M. "New Concept in Water Service for Developing Countries." Journal of the American Water Works Association 56 ( 1964):853-862.
8. Brace Research Institute. How to Make a Solar Still Plastic Covered. Do It Yourself Leaflet, no. L-l. Quebec, Canada, February 1975.
9. Brett-Young, A. "Saael Drought: Voluntary Agencies' Crucial Role." Overseas Development 48 (Sept. 1974).

745
Briggs, G. F., and Mogg, J. L. "Modern Wells Produce Quality Water Economically." Proceedings of a Water Supply and Sanitation Seminar, Bangkok, Thailand, 19-23 Jan. 1970. Asian Institute of Technology.
Bryant, E. A. "Forecasting Urban Water Demands in Developing Countries." Water for Peace. Vol. 7: Planning and Developing Water Programs. 1967.
Bureau Central d'Etudes pour les Equipements d'Outre Mer. Techniques rurales en Afrique. Numero 7: Hydraulic pastorale. 1969.
Burton, I. E., Idelovitch, E., and Maystre, J. Technology Assessment and Research Priorities for Water Supply and Sanitation in Developing Countries (with special reference to rural populations and small communities). Ottawa, Canada: International Development Research Centre, 22 Nov. 1973.
Caponera, D. A. Water Laws in Moslem Countries. United Nations Food and Agriculture Organization Development Paper, no. 42. March 1954.
Central Public Health Engineering Research Institute. Defluoridation. Nagpur, India: Nehru Marg, December 1973.
Central Public Health Engineering Research Institute. Disinfection for Small Community Water Supplies. Nagpur, India.
. Disinfection Techniques for Small Community Water Supplies. Nagpur, India, 1969.
. Indian Literature in Environmental Engineering: Annual Bibliography. 1971.
. Iron and Manganese Removal in Rural Water Supplies. Technical Digest, no. 9 Nagpur, India, Sept. 1970.
. Membrane Filter. Technical Digest, no. 14. Nagpur, India, Feb. 1971.
. Survey of Water Treatment P lan t s . Technical Digest, no. 13. Nagpur, India, Jan. 1971.
. "Water Supply and Waste Disposal for Greater Bombay." Part I : "Water Supply." 1970-1971.
Channabasappa, K. "Reverse Osmosis Desalination Process as a Village Water Supply System." Proceedings of a Water Supply and Sanitat ion Seminar Held in Bangkok, Thailand, 19-23 Jan. 1970. Edited by Pescod and Okun. Asian I n s t i t u t e of Technology.
Chatterjee, A. K., Srivastava, G. C. " S t e r i l i s a t i o n of Water under Field Conditions." Proceedings of a Symposium on Environment a l Pol lu t ion . Nagpur: Central Public Health Engineering Research I n s t i t u t e , 1973.

Cleasby, J. C. "New Ideas in Filter Control Systems." Proceedings of a Symposium on New Methods of Water Treatment, Asuncion, Paraguay, 14-18 Aug. 1972.
Cox, C. R. Operation and Control of Water Treatment Processes. Monograph Series, no. 49. Geneva: WHO, 1969.
Diamant, B. Z. A Portable Unit for the Supply of Drinking Water in Emergencies. Community Water Supply Research and Development Programme, WHO/C.S.W./72.3.5.
Dieterich, B. H., and Henderson, J. H. Urban Water Supply Conditions and Needs in Seventy-Five Developing Countries. Public Health Paper, no. 23. Geneva: WHO, 1963.
Dixey, F. A Practical Handbook of Water Supply. London: Thomas Murby and Co., 1950.
Duin, J. F. "Energievoorziening, Pompen en Motoren" (Energy Supply, Pumps and Engines). Delft University of Technology, Department of Civil Engineering, 1974.
Dunn, P. D. "The Humphrey Pump." Appropriate Technology 2, no. 1 (May 1975): 20-21.
Eubanks, B. M. "A Pictorial History of the Handpump." Water Well Journal (July 1972).
Fair, G. M., Geyer, J. C., and Okun, D. A. Water and Wastewater Engineering. 2 vols. 1966, 1968.
Feachem, R. Domestic Water Use in the New Guinea Highlands: The Case of the Raiapu Enga. Report, no. 132. Australia: Water Research Laboratory, University of New South Wales, 1973.
Filtres a sable lents et aeration intermittante a Bujumbura. Burundi, 1975.
Frankel, R. J. Evaluation of Effectiveness of Community Water Supply In Northeast Thailand. Bangkok: Asian Institute of Technology, 1973.
. Evaluation of Low Cost Water Filters in Rural Communities of the Lower Mekong Basin. Bangkok: Asian Institute of Technology, 1974.
Frink, D. W., and Fannon, Jr., R. D. "The Development of a Water Pump for Underdeveloped Countries." Final report to Agency for International Development. Batelle Memorial Institute, Columbus Laboratories, 505 King Avenue, Columbus, Ohio 43201: Sept. 29, 1967.

747
Gibson, U. P., and Singer, R. D. Small Wells Manual. Washington, D.C.: U.S. Department of State, Agency for International Development.
Grover, B. Harvesting Precipitation for Community Water Supplies. International Bank for Reconstruction and Development, 1971.
Hackett, 0. M., and Davis, G. H. "Water Data for Progress." Proceedings of a Water Supply and Sanitation Seminar Held in Bangkok, Thailand, 19-23 Jan. 1970. Asian Institute of Technology.
Hintz, D. M. "Packaged Water Treatment Plants for Small Communities, Industries, Institutions and Camps." Proceedings of a Water Supply and Sanitation Seminar Held in Bangkok, Thailand, 19-23 Jan. 1970. Edited by Pescod and Okun. Asian Institute of Technology.
Huisman, L. "Artificial Groundwater Recharge." Delft University of Technology, Department of Civil Engineering, Division of Sanitary Engineering, 1975.
. "Sedimentation and Flotation, Mechanical Filtration." Delft University of Technology, Department of Civil Engineering, Division of Sanitary Engineering, 1973.
Huisman, L. "Rapid Filtration." Delft University of Technology, Department of Civil Engineering, Division of Sanitary Engineering, 1974.
Huisman, L., and Wood, W. E. Slow Sand Filtration. Geneva: World Health Organization, 1974.
Idelovitch, E. "The Technological Frontier: A State-of-the-Art Review." Lausanne Seminar, working paper, no. 6. May 1973.
International Bank for Reconstruction and Development. Public Utilities Department Documents Series: Index. Feb. 1975.
Ionides, M. "Water in Dry Places." Engineering 27 (October 1967): 662-666.
Jahn, S. A. A. Sudanese Native Methods for the Purification of Nile Water during the Flood Season with Clay Soil and Plant Material. Sudan, University of Khartoum.
Jain, J. S., Shaikj, S. G., and Dhabadgaonkar, S. M. "Studies on Solar Still for Production of Water for Small Communities in Arid Zones." Proceedings of a Symposium on Community Water Supply and Waste Disposal, Dec. 19-21, 1966. Nagpur, India: Central Public Health Engineering Research Institute, pp. 146-154.
Jaksirinont, N. Development of a Series Filtration Water Treatment Method for Small Communities of Asia. Thesis no. 509. Bangkok, Thailand, Asian Institute of Technology.

53. Kreysler, J. "Total Coli Counts: A Method to Determine Biological Contamination of Rural Water Supplies: The Ismani Example." Workshop, Dar es Salaam, 17-19 Dec. 1969.
54. Lawand, T. A., and Alward, R. "An Analysis of Cost and Production Factors in Operating Solar Stills." Brace Research Institute Report, no. R.55. Proceedings of the Third National Symposium on Fresh Water from the Sea, Dubrovnik, Yugoslavia, 13-17 Sept. 1970. Vol. I.
55. Lloyd, R. D. C. "Some Practical Problems with Water Treatment in a Technical Age." Proceedings of a Water Supply and Sanitation Seminar Held in Bangkok, Thailand, 19-23 Jan. 1970. Asian Institute of Technology.
56. Maddocks, D. Methods of Creating Low Cost Waterproof Membranes for Use in the Construction of Rainwater Catchment and Storage. Intermediate Technology Development Group, Feb. 19 75.
57. Mann, H. T., and Williamson, D. Water Treatment and Sanitation: A Handbook of Simple Methods for Rural Areas in Developing Countries. Intermediate Technology Development Group, June 1973.
58. Marais, G. V. R., and McJunkin, F. E. "A Proportional Chemical Feeder for Small Water Purification Plants." Water Supply and Sanitation in Developing Countries. Aid-UNC/IPSED Series, no. 5. University of North Carolina, Oct. 1966.
59. . "Bottle Hypochlorite Solution Feeder." Water Supply and Sanitation in Developing Countries. Aid-UNC/IPSED Series, item 10. University of North Carolina, Oct. 1966.
60. . "Floating Platform Hypochlorite Solution Feeder," "V-Notch Constant Head Solution Feeder," "Floating Bowl Hypochlorite Solution Feeder." Water Supply and Sanitation in Developing Countries. Aid-UNC/IPSED Series, nos. 7, 8, and 9. University of North Carolina, Oct. 1966.
61. . "Float Valve Hypochlorite Solution Feeder." Water Supply and Sanitation in Developing Countries. Aid-UNC/IPSED Series, no. 4. University of North Carolina, Oct. 1966.
62. . "Individual Household Disinfection and Filter Unit for Turbid Waters." Water Supply and Sanitation in Developing Countries. Aid-UNC/IPSED Series, item no. 6. University of North Carolina, Oct. 1966.
63. . "Water Supply Using Bamboo Pipes." Water Supply and Sanitation in Developing Countries. Aid-UNC/IPSED Series, item no. 3. University of North Carolina, Oct. 1966.
64. McJunkin, F. E., and Pineo, C. S. Role of Plastic Pipe in Community Water Supplies in Developing Countries. Contract Aid/csd—888. 1969.

749
Miller, D. G. "Solid Contact Reactors." Proceedings of a Symposium on New Methods of Treatment of Water, Asuncion, Paraguay, 14-18 Aug. 1972.
Monkhouse, R. A. The Use and Design of Sand Screens and Filter Packs for Abstraction Wells. Water Services, May 1974.
Morfitt, R. P., et al. "A Non-Conventional Mass Approach to Rural Village Water Projects." A report to the Pan-American Health Organization, Corvallis, Oregon, 1969.
Mostertman, L. J. "Water Quality." United Nations Environmental Program paper.
National Academy of Sciences. More Water for Arid Lands. Washington, D.C., 1974.
National Environmental Engineering Research Institute, Nagpur, India. "Defluoridation of Water by Nalgonda Technique." Technical Digest 46 (October, 1974).
National Institute of Agricultural Engineering. Simple Waterpump. Tropical Agricultural Engineering Information Bulletin no. 1. Silsoe Bedfordshire, England: Overseas Liaison Department.
Nyerges, N. V., and Ganrales, E. R. Planta movil experimental de tratamiento de agua (Experimental Mobil Water Treatment Plant). Caracas, Venezuela, 1966.
O'Meara, J. W. "Feasibility of Desalination for Water Supply." Proceedings of a Water Supply and Sanitation Seminar Held in Bangkok, Thailand, 19-23 Jan. 1970. Edited by Pescod and Okun. Asian Institute of Technology.
Ontario Water Resources Commission, Training and Licensing Branch. Basic Gas Chlorination Workshop Manual.
0rganizaci6n Panamericana de la Salud. Manual de operacion y mantenimiento de instalaciones y equipos de un acueduncto (Manual on Operation and Maintenance of Installations and Equipment of a Water Supply). Serie Tecnica del Departa-mento de Ingenieria y Ciencias del Ambiente, ES.7. 1970.
. Manual de referenda, medidores de agua domiciliar (Reference Book on Domestic Water Meters). Lima: Inter-American Development Bank, 1972.
Oza, P. P., Srizamulu, N., and Chandhury, M. "Preliminary Investigations on the Use of Coal for Removing Viruses from Water." Proceedings of a Symposium on Environmental Pollution. Nagpur: Central Public Health Engineering Research Institute, 1973.

750
78. Paichayon, Shonvanavirakul. Demand for Potable Water in Small Communities of Thailand. Thesis no. 341. Bangkok: Asian Institute of Technology.
79. Paramasivam, R., Gadkari, S. K., Deshpande, A. K., and Joshi, N. S. Some Performance Observations on an Upflow Filter. India, National Environmental Engineering Research Institute.
80. Raghu, V. "Cement Joint for Cast-iron Water Pipe." Proceedings of a Symposium on Community Water Supply and Waste Disposal, Dec. 19-21, 1966. Nagpur, India: Central Public Health Engineering Research Institute, pp. 177-184.
81. Rama Mohano Rao, N. V. and Subba Rao, K. U. "Endemic Fluorosis in Andhra Pradesh." Proceedings of a Symposium on Community Water Supply and Waste Disposal, Dec. 19-21, 1966. Nagpur, India: Central Public Health Engineering Research Institute.
82. Ramaswamy, J. N. "Screen Wells Improve the Yield of Community Water Supplies." Proceedings of a Symposium on Community Water Supply and Waste Disposal, Dec. 19-21, 1966. Nagpur, India: Central Public Health Engineering Research Institute, pp. 58-64.
83. Riel, J. van. L'eau en milieu rural Centre-Africain. 1964.
84. Robeck, G. G. "Modern Concepts in Water Filtration." Proceedings of a Symposium on New Methods of Treatment of Water, Asuncion, Paraguay, 14-18 Aug. 1972.
85. Sevilla, A. S. A Study of Filtration Methods for Providing Inexpensive Potable Water to Small Communities in Asia. Thesis no. 442. Bangkok, Asian Institute of Technology.
86. Singley, J. E. "Experiences with the Magnesium Carbonate Coagulation Process in North America." Proceedings of a Symposium on New Methods of Treatment of Water, Asuncion, Paraguay, 14-18 Aug. 1972.
87. . "State of the Art of Coagulation." Proceedings of a Symposium on New Methods of Water Treatment, Asuncion, Paraguay, 14-18 Aug. 1972.
88. Talib, et al. The Pahang Continuous Chlorinator (Coconut Type). Dicetak dan diterbitkan oleh kementarian kesihatan malaysia kk pu/104/10/72.
89. Taylor, F. B. Hygienic and Technical Guidelines for Water Supply and Wastewater Systems in Buildings. WHO Technical Report. 1975.
90. Tschannerl, G. Water Supply: Proceedings of the Conference on Rural Water Supply in East Africa, 5-18 April 1971. Bralup Research Paper, 10. University of Dar es Salaam.

751
91. Turple, R. M. "Laying Small Diameter PVC Pipes." Paper to the Institute of Civil Engineers, 1972.
92. Unakul, S. "Thailand's Rural Community Water Supply Program." Proceedings of a Water Supply and Sanitation Seminar Held in Bangkok, Thailand, 19-23 Jan. 1970. Asian Institute of Technology.
93. United Nations. Water Desalination in Developing Countries. 1964.
9A. . Water Legislation, in Asia and the Far East. Water Resources Series, no. 31. 1967.
95. . Water Legislation in Asia and the Far East. Water Resources Series, no. 35. 1968.
96. United Nations Children's Fund. Rural Water Supply and Sanitation in the Developing Countries'. UNICEF Guidelist OLGA, OSU 6400, May 19 75.
97. . The Persson Pump: A New Construction. WS/217/75, 5.1.3.1.1.1.4. 29 July 1975.
98. United Nations, Department of Economic and Social Affairs. Solar Distillation as a Means of Meeting Small-Scale Water Demands. ST/ECA/121. New York, 1970.
99. United States and Canada. Annotated Bibliography on Hydrology and Sedimentation, 1963-1965. Joint Hydrology-Sedimentation Bulletin, no. 9. June 1969.
100. . Annotated Bibliography on Hydrology and Sedimentation, 1966-1968. Joint Hydrology-Sedimentation Bulletin, no. 10. July 1970.
101. U.S., Department of Agriculture, and the National Science Foundation. Sedimentation: Annotated Bibliography of Foreign Literature, 1968-1969. Survey no. 6. Washington D.C.: Israel Program for Scientific Translations.
102. U.S., Environmental Protection Agency. Water Quality Criteria. Washington, D.C., 1972.
103. U.S.S.R., Ministry of Health. Maximum Permissible Concentrations of Harmful Substances in the Water of Water Sources Used for Hygienic and Domestic Purposes. WHO, 1971.
104. Vaillant, J. R., and Loussouarn, J. L. Le choix des materiaux pour les conduites d'adduction et de distribution d'eau (The Choice of Materials for Conduits for Supply and Distribution of Water). Secretariat d'Etat aux Affaires Etrangeres, 1970.
105. Volunteers for International Technical Assistance (VITA). Village Technology Handbook.

106. Wagner, E. G., and Lanoix, J. N. Water Supply for Rural Areas and Small Communities. Monograph Series, no. 42. Geneva: WHO, 1959.
107. Water Research Association. World Health Organization-Assisted CPHERI Course on Preventive Maintenance of Water Distribution Systems. WHO Project no. India 017603. Medmenham, Marlow, Buckinghamshire, England and Bombay, Sept. 1972.
108. Watt, S. B. A Manual on the Hydraulic Ram for Pumping Water. Silsoe, Bedford, U.K.: Intermediate Technology Development Group, Water Development Unit, National College of Agricultural Engineering.
109. White, A. U., and Seviour C. Rural Water Supply and Sanitation in Less Developed Countries. Ottawa, Canada: International Development Research Centre, 1974.
110. White, G. F., Bradley, D. J., and White, A. U. Drawers of Water: Domestic Water Use in East Africa. Chicago: University of "Chicago Press, 1972.
111. Wignot, R. E. A Report on the Condition of UNICEF-Assisted Demonstration Rural Water Supplies in Kenya. Nairobi, Kenya: UNICEF Regional Office, Dec. 1974.
112. World Health Organization. "Biological or Slow Sand Filters." Background paper of community water supply research and development programme, WHO/CWS/RD/70.1.
113. . "Ground Water Resources in Kenya." Sectorial study and national programming for community and rural water supply, sewerage and water pollution control, report no. 7. Brazzaville, 1973.
114. . International Standards for Drinking Water. 3rd ed. Geneva, 1971.
115. . Techniques for the Collection and Reporting of Data on Community Water Supply. Technical Report Series, 490.
116. . The Village Tank as a Source of Drinking Water: An Outline for a Coordinated Research and Development Project. WHO/CWS/RD/69.1.
117. . World Health Organization Publications: Catalogue 1947-1973.
118. World Health Organization, International Reference Centre for Community Water Supply. Health Aspects Relating to the Use of PVC Pipes for Community Water Supply. Technical Paper, no. 4. The Hague, July 1973.

753
119. . Plastic Pipe in Drinking Water Distribution Practice. Technical Paper, no. 1. The Hague, June 1971.
120. • The Purification of Water on a Small Scale. Technical Paper, no. 3. The Hague, March 1973.
121. World Health Organization, Regional Office for Southeast Asia. Report on Rural Water Supply Nepal. EH/SEARO/74.8. 26 July 1974.
122. Wulff, H. E. "The Qanats of Iran." Scientific American 218, no. 4 (April 1968):94-105.
123. Yao, K. M. "High Rate Settlers." Proceedings of a Symposium on New Methods of Water Treatment, Asuncion, Paraguay, 14-18 Aug. 1972.
124. Yung, D. G. Rural Water Supply in Taiwan. Taiwan Institute of Environmental Sanitation, P.H.A., 20 Dec. 1957.
125. Zdravkov, M. New Method of Chlorinating Drinking Water. WHO/Env. San/124, 25 Nov. 1959.
126. Zoeteman, B. C. J. The Suitability of Iodine and Iodine Compounds as Disinfectants for Small Water Supplies. WHO International Reference Centre For Community Water Supply, Technical Paper, no. 2. The Hague, July 1972.
VII. 3. SMALL WELLS, SLOW SAND FILTRATION, AND RAPID SAND FILTRATION FOR WATER SUPPLIES IN DEVELOPING AREAS
1. American Society of Civil Engineers, American Water Works Association, and Conference of State Sanitary Engineers. Water Treatment Plant Design. 1969.
2. American Water Works Association. Water Quality and Treatment. 3rd ed. New York, 1967.
3. Babbitt, H. E.; Doland, J. J.; and Cleasby, J. L. Water Supply Engineering. 6th ed. New York: McGraw-Hill, 1967.
4. Camp, T. R. "Flocculation and Flocculation Basins." Transactions of the American Society of Civil Engineers 120(1955).
5. Chow, V. T., ed. Handbook of Applied Hydrology. McGraw-Hill, 1964.
6. Clark, J. W.; Viessman, W., Jr.; and Hammer, M. J. Water Supply and Pollution Control. New York: IEP—A Dun-Donnelley Publisher, 1977.
7. Fair, G. M.; Geyer, J. C.; and Okun, D. A. Elements of Water Supply and Wastewater Disposal. New York: John Wiley & Sons, 19 71.

754
8. Feachem, R.; McGarry, M.; and Mara, D., eds. Water, Wastes and Health in Hot Climates. New York: John Wiley & Sons, 19 77.
9. Gibson, V. P., and Singer, R. D. Small Wells Manual. Washington, D.C.: U.S. Agency for International Development, 1969.
10. Hoover, C. P. Water Supply and Treatment. National Lime Association.
11. Huisman, L., and Wood, W. E. Slow Sand Filtration. Geneva: World Health Organization, 1974.
12. Johnson Division, Universal Oil Products Co. Groundwater and Wells. Saint Paul, Minnesota, 19 72.
13. Water Supply for Rural Areas and Small Communities. WHO Monograph Series, no. 42. 1959.
CHAPTER VIII. WASTEWATER DISPOSAL AND TREATMENT
VIII. 1. SEWAGE TREATMENT IN DEVELOPING COUNTRIES, "Stabilization Ponds"
1. Amin, P. M., and Ganapati, S. V. "Biochemical Changes in Oxidation Ponds," Journal Water Pollution Control Federation 44 (February 19 72):183-200.
2. Barsom, George. Lagoon Performance and the State of Lagoon Technology. Washington, D.C.: Report No. EPA-R2-73-144, U.S. Environmental Protection Agency, 1973.
3. Barth, Edwin F. "Measurement and Forms of Nitrogen and Phosphorus." Advanced Waste Treatment and Water Reuse Symposium, Dallas, Texas, January 12-14, 1971.
4. Blattler, Paul X. Haile Selassie I University Sewage Treatment Plant. Report to the Agency for International Development, United States Mission in Ethiopia, April 15, 1964. Washington, D.C.: Associated Engineers, Inc., 1964.
5. Calaway, W. T. "The Metazoa of the Waste Treatment Processes— Rotifers." Journal Water Pollution Control Federation, Research Supplement, 40 (November 1968):R412-R422.
6. Caldwell, D. H. "Sewage Oxidation Ponds Performance, Operation and Design." Sewage Works Journal 18 (May 1956):433.
7. Callaway, T., and Wagner, B. Sewage Lagoons for Developing Countries. Ideas and Methods Exchange No. 62. Washington D.C. Department of Housing and Urban Development, 1966.

755
Canter, Larry W. "Waste Stabilization Pond Performance and Effectiveness in the Removal of Pathogenic Organisms." Final Report to the International Center for Medical Research and Training, Tulane University, New Orleans, November 1969.
Canter, L.; Englande, A.; and Mauldin, A. "Loading Rates on Waste Stabilization Ponds." Paper presented at the ASCE National Meeting on Water Resources Engineering, New Orleans, Louisiana, February 3-7, 1969.
Carpenter, Philip L. Microbiologia. Trad, por J. Benglio. Mexico: Editorial Interamericana, 1969.
Childers, Williams, and Bennett, George. "Experimental Vegetation Control by Large Mouth Bass-Tilapia Combinations." Journal of Wildlife Management 31 (July 1967):401-407.
Cubillos, Armando. "Lagunas de Establizacion, Su Eficiencia en la Remocion de Materia Organica y Microorganismos en las Con-diciones del Tropico." Informe Final, Universidad del Valle, Cali, Colombia, Julio 1970.
Dave, J. M., and Jain, J. S. "Status of Stabilization Ponds in Sewage Treatment." Environmental Health 8 (March 1963): 228-249.
Davidson, F. F. "Antibacterial Activity of Oscillatoria Formosa Body Extract." Water and Sewage Works (November 1961).
DeNoyelles, Frank. "Factors Affecting Phytoplankton Distribution in a Double-Cell Sewage Lagoon." Journal of Phycology 3 (1967):174-181.
Diaz, Juan H. "A Study of the Design, Operation, and Performance of Waste Stabilization Ponds in Tropical Environments." Master thesis, University of Oklahoma, 1975.
Duffer, William R. "Lagoon Effluent Solids Control by Biological Harvesting." Symposium on Upgrading Wastewater Stabilization Ponds to Meet New Discharge Standards. Logan, Utah, August 21-23, 1974.
Duttweiler, D., and Burgh, J. "Lagoons for Military Sewage Treatment in South Vietnam." Civil Engineering-ASCE^ (May 1969):47-49.
Eckley, Louis E.; Canter, Larry; and Reid, George. Operation of Stabilization Ponds in a Tropical Area. Final Report, U.S. Army Medical Research and Development Command. Washington, D.C.: October 1974.

20. Fisher, C. P.; Drynan, W.; and Van Fleet, G. "Waste Stabilization Pond Practices in Canada." In Advances in Water Quality Improvement. Edited by E. Gloyna and W. Eckenfelder. Austin: University of Texas Press, 1968.
21. Fitzgeraldi George, and Rohlich, Gerald. "An Evaluation of Stabilization Pond Literature." Sewage and Industrial Wastes 30 (October 1958):1213-1224.
22. Gahn, J. D.; Collier, R. E.; and Lawrence, C. H. "Aerobic Bacteriology of Waste Stabilization Ponds." Journal Water Pollution Control Federation 40 (February 1968):185-191.
23. Gloyna, Earnest F. "Basis of Waste Stabilization Pond Designs." I Advances in Water Quality Improvement. Edited by E. Gloyna and W. Eckenfelder. Austin: University of Texas Press, 1968.
24. Gloyna, E. F. Waste Stabilization Pond Concepts and Experiences. WHO/Wastes Disposal/1.65. Geneva, Switzerland: World Health Organization, 1965.
25. Gloyna, Earnest F. Waste Stabilization Ponds. World Health Organization Monograph Series No. 60. Geneva, Switzerland, 1971.
26. Hodgson, H. T. "Stabilization Ponds for a Small African Urban Area." Journal Water Pollution Control Federation 36 (January 1964):51-67.
27. Jayangoudar, I.; Kothandaraman, V.; Thergaonkar, V.; and Shaik, S. "Rational Process Design Standards for Aerobic Oxidation Ponds in Ahmedabad, India." Journal Water Pollution Control Federation 42 (August 1970):1501-1514.
28. Jordao, E. Letter to J. F. Malina from Rio de Janeiro, Brazil.
29. Jourdan, R. P. "Bacteriology of Waste Stabilization Ponds." Unpublished Master's Thesis, Tulane University, 1969.
30. Kimmerle, Richard, and Enns, W. R. "Aquatic Insects Associated with Midwestern Waste Stabilization Lagoons." Journal Water Pollution Control Federation, Research Supplement 40 (February 1968):R31-R41.
31. Longley, Karl E.; Young, Martin; and Ashmore, Lee. Operation of Stabilization Ponds in a Tropical Area. Annual Report, U.S. Army Medical Research and Development Command. Washington, D.C., August 1970.
32. Low Cost Waste Treatment. N'agpur, India: Central Public Health Engineering Research Institute, 1972.

757
33. Mackenthum, K. M. "Biology of Waste Stabilization Ponds." Bio-Oxidation of Industrial Waste Course Manual. Cincinnati, Ohio: Public Health Service, 1964.
34. Marais, G. v. R. "New Factors in the Design, Operation and Performance of Waste-Stabilization Ponds." Bulletin of the World Health Organization 34 (1966):737-763.
35. Marais, G. v. R. "Dynamic Behavior of Oxidation Ponds." Second International Symposium for Waste Treatment Lagoons. Kansas City, Missouri: n-p., 1970-
36. McGarry, M. G. The Treatment of Sewage and Production of Protein through the Mass Culture of Algae. Report No. 1. Bangkok: Asian Institute of Technology, 1970.
37. McGarry, M. G., and Pescod, M. B. "Stabilization Pond Design Criteria for Tropical Asia." Second International Symposium for Waste Treatment Lagoons. Kansas City, Missouri: n.p., 1970.
38. McKinney, Ross E. Microbiology for Sanitary Engineers. New York: McGraw-Hill, 1962.
39. Merz, R. C.; Zehnpfennig, R. G.; and Klima, J. R. "Chromatographic Assay of Extracellular Products of Algal Metabolism." Journal Water Pollution Control Federation 34 (February 1962):103-115.
40. Mills, D. A. "Depth and Loading Rates of Oxidation Ponds." Water and Sewage Works (September 1962):R283-R286.
41. Mitchell, Ralph. Introduction to Environmental Microbiology. New Jersey: Prentice-Hall, 1974.
42. Mortimer, C. H. and Hickling C. F. "Fertilizers in Fish Ponds." Fishery Publications 5 (1954):1-155.
43. Oswald, W. J. "Advances in Anaerobic Pond Systems Design." In Advances in Water Quality Improvement. Edited by E. F. Gloyna and W. W. Eckenfelder, Jr. Austin: Univ. of Texas Press, 1968.
44. Oswald, W. J. "Quality Management by Engineered Ponds." In Engineering Management of Water Quality. By P. H. McGauhey. New York: McGraw-Hill, 1968.
45. Oswald, W. J., and Gotaas, H. B. "Photosynthesis in Sewage Treatment." ASCE Proceedings 81 (May 1955).
46. Palmer, C. M. Algae in Water Supplies. Publication No. 657. Washington, D.C.: Government Printing Office, U.S. Public Health Services, 1962.

758
47. Parhad, N. M., and Rao, N. U. "Effect of pH on Survival of Escherichia Coli." Journal Water Pollution Control Federation 46 (May 1974):980-986.
48. Pavanello, R., and Mohanrao, G. "Considerations on Water Pollution Problems in Developing Countries." In Water Quality: Management and Pollution Control Problems. 6th Conference of the International Association on Water Pollution Research held in Jerusalem, June 1973. Edited by S. H. Jenkins. New York: Pergamon Press, 1973.
49. Pennak, Robert W. Fresh-Water Invertebrates of the United States. New York: The Ronald Press Company, 1953.
50. Purushothaman, Krishnier. "Field Studies on Stabilization Ponds in South India." Second International Symposium for Waste Treatment Lagoons. Kansas City, Missouri: n.p., 1970.
51. Reid, George W. "Lower Cost Methods of Water and Waste Treatment in Less Developed Countries." Norman, Oklahoma: The University of Oklahoma. First Annual Report to the Office of Health, Agency for International Development, May 31, 1974.
52. Ruttner, Franz. Limnology. 3rd ed. Toronto: University of Toronto Press, 1973.
53. Saenz, Rodolfo. "Leccion No. 5, Experiencias Efectuadas en Varlos Paises: Normas Existentes." Diseno de Lagunas de Estabilizacion: Manual del Curso. Panama: Universidad de Panama, 1969.
54. Shuval, Hillel I. "Detection and Control of Enteroviruses in the Water Environment." In Development in Water Quality Research. Edited by H. I. Shuval. Michigan: Ann Arbor Science Publishers Inc., 1973.
55. Siddiqi, R. H., and Handa, B. K. "Evaluation of Some Stabilization Ponds in India." ASCE Proceedings (February 1971): 91-99.
56. Slanetz, L. W.; Bartley, Clara H.; Metcalf, T. G.; and Nesman, R. "Survival of Enteric Bacteria and Viruses in Municipal Sewage Lagoons." Second International Symposium for Waste Treatment Lagoons. Kansas City, Missouri: n.p., 1970.
57. Smallhorst, D. F.; Walton, B. N.; and Meyers, J. "Design and Application of Oxidation Ponds." Public Works (December 1953):89-90, 111-114.
58. Smallhorst, David. "History of Oxidation Ponds in the Southwest." Proceedings of a Symposium at Kansas City, Missouri. August 1-5, 1960.

759
59. Smith and Eiler. Cost to Consumer for Collection and Treatment of Waste Water. United States Environmental Protection Agency, July 1970.
60. Stander, G; Meiring, P.; Drews, R.; and Van Eck, H. "A Guide to Pond Systems for Wastewater Purification." In Developments in Water Quality Research. Edited by H. I. Shuval. Michigan: Ann Arbor Science Publishers Inc., 1973.
61. Svore, Jer ome H. "Waste Stabilization Pond Practices in the United States." In Advances in Water Quality Improvement. Edited by E. Gloyna and W. Eckenfelder. Austin: University of Texas Press, 1968.
62. Swingle, H. S. "Comparative Evaluation of Two Tilapias as Pond Fishes in Alabama." Trans-American Fish Society 89 (1960): 142-148.
63. Talboys, Albert P. Lagunas de Estabilizacion en America Latina. Lima, Peru: CEPIS, 1971.
64. Thirumurthi, D., and Nashashibi, 0. I. "A New Approach for Designing Waste Stabilization Ponds." Water and Sewage Works (November 1967):R208-R218.
65. Tschortner, U. S. "Biological Parameters for the Operation and Control of Oxidation Ponds-II." Water Research 2 (1967): 327-346.
66. Vennes, John W. "State of the Art—Oxidation Ponds." Second International Symposium for Waste Treatment Lagoons. Kansas City, Missouri: n.p., 1970.
67. Wilson, J. N. "Performance of a Sewage Stabilization Pond in a Maritime Climate." Proceeding, Fifteenth Purdue Industrial Waste Conference. 1960.
68. World Health Organization, and Government of Kenya. Selection and Design Criteria for Sewerage Projects. Report No. 9. Brazzaville: World Health Organization, May 1973.
69. Zajic, J. E. Water Pollution Disposal and Reuse. Vol. 1. New York: Marcel Dekker, Inc., 1971.
VIII. 1. SEWAGE TREATMENT IN DEVELOPING COUNTRIES, "Fish Production"
1. Bagnall, L. 0.; Furman, T. DeS.; Hentges, J. F.; Nolan, W. J.; and Shirley, R. L. "Food and Fiber from Effluent: Grown Water Hyacinth." In Waste Water Use in the Production of Food and Fiber. Proceedings EPA 660/2-74-041, June 1974.
2. Bardock; Rither; McLamey. Aqua-Culture. John Wiley and Sons.

Boyd, Claude E. "Vascular Aquatic Plants for Mineral Nutrient Removal from Polluted Waters." Economic Botany 23 (January-March 1970).
Bryan, Frank L. "Diseases Transmitted by Foods Contaminated by Waste Water." In Waste Water Use in the Production of Food and Fiber. Proceedings EPA 660/2-74-041, June 1974.
Carpenter, R. LeRoy; Coleman, Mark S.; and Jarman, Ron. "Aqua-culture as an Alternative Waste Water Treatment System." In Biological Control of Water Pollution. International Conference on Biological Water Quality Improvement Alternatives. Philadelphia: University of Pennsylvania, 1976, pp. 215-224.
Carpenter, R. LeRoy; Malone, Harold K. ; Roy, Ara F.; Mitchum, Aaron L.; Beauchamp, Herbert E.; and Coleman, Mark. "The Evaluation of Microbial Pathogens in Sewage and Sewage-Grown Fish." In Waste Water Use in the Production of Food and Fiber. Proceedings EPA 660/2-74-041, June 1974.
Carpenter, R. LeRoy; Coleman, Mark S.; Henderson, James P.; and Chichester, H. G. "Aquaculture as a Means to Achieve Effluent Standards." In Waste Water Use in the Production of Food and Fiber. Proceedings EPA 660/2-74-041, June 1974.
Dinges, Ray. "The Availability of Daphnia for Water Quality Improvement and as an Animal Food Source." In Waste Water Use in the Production of Food and Fiber. Proceedings EPA 660/2-74-041, June 1974.
Donaszy, Erno. "Principles of Sewage Treatment Through Utilization in Fish Ponds." In Waste Water Use in the Production of Food and Fiber. Proceedings EPA 660/2-74-041, June 1974.
Golombek, J. M., and Schurr, Karl. "Calculated Yield of Sewage Lagoon Biomass: A Plan for Production, and Some of the Problems Inherent in Using Biomass or Lagoon Water for Production of Food and Fiber." In Waste Water in the Production of Food and Fiber. Proceedings EPA 660/2-74-041, June 1974.
Hepher, B. and Schroeder, G. L. "Wastewater Utilization in Integrated Aquaculture and Agriculture Systems." In Waste Water Use in the Production of Food and Fiber. Proceedings EPA 660/2-74-041, June 1974.
Hickling, C. F. Fish Culture. Foter and Faber, 1962.
Hileman, L. H. "Mineral Quality of Fish Pond Effluent Related to Soil Properties and Crop Production." In Waste Water Use in the Production of Food and Fiber. Proceedings EPA 660/2-74-041, June 1974.

761
14. Odum, H. T. Environment, Power and Society. John Wiley and Sons, 1971.
15. Spear, Michael R. "Algae Removal in Oxidation Ponds Utilizing Black Bigmouth Buffalo Fish under Wintertime Conditions." Class paper, University of Oklahoma, Norman, Oklahoma, May 1974.
16. Walker, William R. and Cox, William E. "Legal Constraints on the Use of Wastewater for Food and Fiber." In Waste Water in the Production of Food and Fiber. Proceedings EPA 660/ 2-74-041, June 1974.
VIII. 2. AERATED LAGOONS
1. Arceivala, S. J.; Alagarsamy, S. R.; and Lakshminarayana, J. S. S. "Design and Construction of Aerated Lagoons in India." Proceedings of a Sympo9ium on Low Cost Waste Treatment. Nagpur, India: Central Public Health Engineering Research Institute, October 1969.
2. Clark, John W.; Viessman, Jr., Warren; and Hammer, Mark J. Water Supply and Pollution Control. New York: IEP—A Dun-Donnelley Publisher, 19 77.
3. Feachem, R.; McGarry, M.; and Mara, D., eds. Water, Wastes and Health in Hot Climates. New York: John Wiley & Sons, 1977.
4. Metcalf & Eddy. Wastewater Engineering: Collection, Treatment, Disposal. New York: McGraw-Hill, 19 72.
5. Parker, H. W. Wastewater Systems Engineering. New Jersey: Prentice-Hall, 19 75.
6. Subba Rao, S. "Design and Construction of Mechanically Aerated Lagoons." Proceedings of a Symposium on Low Cost Waste Treatment. Nagpur, India: Central Public Health Engineering Research Institute, October 1969.
7. Thackston, E. L., and Eckenfelder Jr., W. W., eds. Process Design in Water Quality Engineering. New York: Jenkins Publishing, 19 72.
VIII. 3. LAND APPLICATION OF WASTEWATER
1. Alternate Waste Management Technology for Best Practicable Waste Treatment. EPA-430/9-75-013. October 19 75.
2. Atkins, Water D. Design Guidelines for Land Application of Municipal Wastewater. Oklahoma State Department of Health, April 1976.

3. C la rk , John W.; Viessman, Warren J r . ; and Hammer Mark J . Water Supply and P o l l u t i o n Con t ro l . 3rd ed. New York: IEP— A Dun-Donnelley P u b l i s h e r , 19 77.
4. de Haan, S. "Land Appl ica t ion of Liquid Municipal Wastewater S ludges . " Jou rna l of the Water P o l l u t i o n Control Federa t ion (Nov. 19 75) : 47.
5. Eva lua t ion of Land Appl ica t ion Systems. Technica l B u l l e t i n (EPA-430/9-75-001). Washington, D.C. : U.S. Environmental P r o t e c t i o n Agency, Office of Water Program Ope ra t i ons , March 1975.
6. Godfrey, K. A. , J r . "Land Treatment of Municipal Sewage." C i v i l Engineer ing (September 1973):103-109.
7. Bouwer, Herman; Bauer , W. J . ; and Dryden, F rank l in D. "Land Treatment of Wastewater in Today's S o c i e t y . " C i v i l Engineer ing (January 1978): 78-81.
8. Johnson, R. D. "Land Treatment of Wastewater ." The M i l i t a r y Engineer 6 5 , no . 428(1973):375.
9. Land Treatment of Municipal Wastewater Effluents. U.S. Environmental Protection Agency, January 19 46.
10. Malhotra, S. K., and Meyers, E. A. "Design, Operation and Monitoring of Municipal Irrigation Systems." Journal of the Water Pollution Control Federation (Nov. 19 75):2627-2639.
11. Pound, Charles E.; Crites, Ronald W.; Griffes, Douglas A. Costs of Wastewater Treatment by Land Application. EPA-430/9-75-003. Washington, D.C.: U.S. Environmental Protection Agency, Office of Water Program Operations, June 1975.
12. Texas A & M University, Office of Educational Information Services. "Land Application Studied." Water Research in Action, 2, no. 8 (December 1977).
13. Wastewater Treatment and Reuse by Land Application. Vol. 1: Summary. Environmental Protection Technology Series (EPA-660/2-73-006a). Washington, D.C.: U.S. Environmental Protection Agency, Office of Research and Development, August 1973.
CHAPTER IX. ON-SITE DISPOSAL AND TREATMENT
1. Abney, Jack L. "Technical Considerations and Recommended Design Approaches." In On-Site Sewage Disposal Systems. Appalachian Environmental Demonstration Project, Dept. for National Resources and Environmental Protection. Corbin, Kentucky, June 1973.

763
Babcock. and Wilcox. Barberton, Ohio.
Bechtel Incorporated. A Guide to the Selection of Cost-Effective Wastewater Treatment Systems. Technical Report, EPA-430/9-75-002. Washington, D.C.: U.S. Government Printing Office, 1975-680-844/238.
Berg, Hugo J. van den. "Sanitation for Developing Countries." World Health Organization, International Reference Center for Community Water Supply Project. November 1975.
Brady, Goodman, Kerri, and Reed. "Performance Indicators for Wastewater Collection Systems." Report to the Fiftieth Annual Conference, Water Pollution Control Federation, Philadelphia, Pennsylvania, October 2-7, 1977.
Briscoe, John. Public Health in Rural India: The Case of Excreta Disposal. Research Paper, no. 12. Ph.D. dissertation. Center for Population Studies, Harvard University, February 1976.
Census of Manufactures, 1972.
Clivus Multrum USA. Organic Waste Treatment System, 14A Eliot Street, Cambridge, Mass. 02138.
Committee on Technology and Social Change in Foreign Cultures. Technology and Social Change in Foreign Cultures. Ames: Iowa State University, 1973.
Costle, Douglas. "Encouraging Less Costly Wastewater Facilities for Small Communities." Address to National Conference on Less Costly Wastewater Treatment Systems for Small Communities, Reston, Va., April 1977.
Curran Associates. "A Preliminary Assessment of Wet Systems for Residential Refuse Collection: Summary Report." EPA Contract, no. 68-03-0183. March 1974.
Dearth, Keith H. Office of Water Programs Operations, U.S. Environmental Protection Agency. Report for a Seminar on Technology Transfers for Small Wastewater Treatment Systems, July 1977.
Development Centre of the Organisation for Economic Cooperation and Development. Choice and Adaptation of Technology in Developing Countries. Paris, 19 74.
Enviroscope, Inc. Introducing Toa-Throne Aerobic Decay Toilet: A Natural Method of Waste Disposal. P. 0. Box 752, Corona del Mar, Calif. 92625, 1975.

764
15. Global Workshop on Appropriate Water and Wastewater Treatment Technology for Developing Countries, Voorburg, the Netherlands, 17-22 November 1975. Bulletin Series, no. 7. The Hague: WHO International Reference Centre for Community Water Supply, April 1977.
16. Intermediate Technology Group, London, United Kingdom.
17. Kreissel, Jim, U.S. Environmental Protection Agency.
18. La Mere Industries. Walworth, Wisconsin 53184.
1.9. Leich, Harold H. Address to the American Society of Agricultural Engineers. Chicago, December 1974.
20. Mansfield Sanitary, Inc. 150 First Street Perrysville, Ohio 44864.
2.1. McGarry, Michael; Rybczynski, Witold; Polprasert, C&ongrak.. Stpp the Faecal Peril: A Technology Review. IRDC Preliminary Report. Ottawa: International Development Research Centre, July 1977.
22. McJunkin, F. E. Water, Engineers, Development, and Disease in the Tropics. U.S. Agency for International Development, 1975.
23. Mechanical Engineering February 1976.
24. Metcalf and Eddy, Engineers. Land Treatment of Municipal Wastewater Effluents. 3 vols. Vol. 1: Design Factors I. Vol. 2: Design Factors II. Vol. 3: Case Histories. Technology Transfer Seminar Publication. U.S. Environmental Protection Agency, 1976.
25. Microphor. P. 0. Box 490, Willits, Calif. 95490.
26. Monogram Industries, Inc. 1165 East 230th Street, Carson, Calif. 90745.
27. National Association of Public Health Enterprises and Industries. Regulations and Information Concerning Sanitation for Single Family Homes and Small Communities. 3rd ed. 1969.
28. On-site Disposal of Small Wastewater Flows. Small Scale Waste Management Project. Madison: University of Wisconsin, January 1976.
29. Recreation Ecology Conservation of the United States, Inc. 9800
West Bluemound Road, Milwaukee, Wise. 53226.
30. Raritan Engineering Co. 1025 North High Street, Millville, N.J. 08332.
31. Reference Yearbook of Labour Statistics, 1975. Geneva: International Labour Office, 1976.

765
32. Reid, George W., and Discenza, Richard. Prediction Methodology for Suitable Water and Wastewater Processes. Norman: University of Oklahoma, 1975.
33. Research Products/Blankenship. 2639 Andjon, Dallas, Tex. 75220.
34. RSC Industries, Inc. 245 West 74th Place, Hialeah, Florida 33014.
35. Schliessmann, D. j. f et al. "Relation of Environmental Factors to the Occurrence of Enteric Disease in Areas of Eastern Kentucky." U.S. Public Health Service Monographs, no. 54. 1958.
36. Siegrist, Robert. Segregation and Separate Treatment of Black and Grey Household Wastewaters to Facilitate On-site Surface Disposal. Madison: University of Wisconsin, November 1976.
37. Stewart, David E. Alternative Methods of Regulating On-Site Domestic Sewerage Systems. Madison, Wisconsin: National Sanitation Foundation, 1976.
» 38. Sylvester et al. Rest Area Wastewater Disposal Study.
39. Taggart, W. F.; Armstrong, John H.; et al. "Considerations for Designing and Improving Individual Sewage Disposal Systems." United States Department of Agriculture/Oklahoma State Department of Health Ad Hoc Committee. Oklahoma City, 1977.
40. Train, Russell, U.S. Environmental Protection Agency Administrator, to Regional Administrators.
41. U.S., Environmental Protection Agency. Technology Transfer: Choosing Optimum Management Strategies. EPA-625-77-008. May 1977.
42. U.S., Environmental Protection Agency, Construction Grants Program Information. An Analysis of Construction Cost Experience for Wastewater Treatment Plants. MCD-22, EPA-430/9-76-002. February 1976.
43. U.S., Environmental Protection Agency, Municipal Operations Branch. 0 & M Cost Considerations for Small Municipal Wastewater Treatment Facilities. Washington, D.C.: USEPA Office of Water Programs Operations, 1977.
44. U.S., Public Health Service, Division of Indian Health, Health Program Systems Center. Health Program Evaluation: Impact Study of the Indian Sanitation Facilities Construction Act. Tucson, Arizona, July 1968.
45. Winneberger, John H. Timothy. Manual of Grey Water Treatment Practice. Ann Arbor, Michigan: Ann Arbor Science, 1974.